using rubrics to assess information literacy: an …meganoakleaf.info/oakleafjasist2009.pdfstudents...
TRANSCRIPT
Using Rubrics to Assess Information Literacy: AnExamination of Methodology and Interrater Reliability
Megan Oakleaf326 Hinds Hall, Syracuse, NY 13244. E-mail: [email protected]
Academic librarians seeking to assess information lit-eracy skills often focus on testing as a primary meansof evaluation. Educators have long recognized the lim-itations of tests, and these limitations cause manyeducators to prefer rubric assessment to test-basedapproaches to evaluation. In contrast, many academiclibrarians are unfamiliar with the benefits of rubrics.Those librarians who have explored the use of informa-tion literacy rubrics have not taken a rigorous approach tomethodology and interrater reliability. This article seeksto remedy these omissions by describing the benefits ofa rubric-based approach to information literacy assess-ment, identifying a methodology for using rubrics toassess information literacy skills, and analyzing the inter-rater reliability of information literacy rubrics in the handsof university librarians, faculty, and students. Studyresults demonstrate that Cohen’s κ can be effectivelyemployed to check interrater reliability. The study alsoindicates that rubric training sessions improve interraterreliability among librarians, faculty, and students.
Introduction
Academic librarians seeking to assess information literacyskills often focus on testing as a primary means of evaluation.Educators have long recognized the limitations of traditionaltests that include fixed-choice question types (e.g., multi-ple choice, matching, and true/false). In fact, test limitationscause many K–16 educators to prefer rubric assessment tofixed-choice testing; however, most academic librarians havenot adopted a rubric-based approach to information literacyassessment and therefore are unable to take advantage of theinstructional benefits offered by rubric assessments. This arti-cle seeks to rectify this missed opportunity by describing thebenefits of a rubric-based approach to information literacyassessment, identifying a methodology for using rubrics toassess information literacy skills, and analyzing the inter-rater reliability of information literacy rubrics in the hands ofuniversity librarians, faculty, and students.
Received January 30, 2008; revised November 28, 2008; accepted November28, 2008
© 2009 ASIS&T • Published online 4 February 2009 in Wiley InterScience(www.interscience.wiley.com). DOI: 10.1002/asi.21030
Rubrics Defined
Based on assessment for learning (Oakleaf, 2009), moti-vation, and constructivist educational theory (Oakleaf, 2008,p. 244), rubrics are “descriptive scoring schemes” created byeducators to guide analysis of student work (Moskal, 2000).Rubrics describe the parts and levels of performance of aparticular task, product, or service (Hafner, 2003, p. 1509).Rubrics are often employed to judge quality (Popham, 2003,p. 95), and they can be used across a broad range of sub-jects (Moskal, 2000). Full-model rubrics, like the one usedin this study, are formatted on a grid or table. They includecriteria or target indicators down the left-hand side of thegrid and list levels of performance across the top (Callison,2000, p. 34). Criteria are the essential tasks or hallmarks thatcomprise a successful performance (Wiggins, 1996, p.V-6:2).Performance-level descriptors “spell out what is needed, withrespect to each evaluative criterion . . . [for] a high ratingversus a low rating” (Popham, 2003, p. 96).
Rubrics can be described as holistic or analytic. Holisticrubrics provide one score for a whole product or perfor-mance based on an overall impression. Analytic rubrics, likethe one employed in this study, “divide . . . a product or perfor-mance into essential traits or dimensions so that they can bejudged separately—one analyzes a product or performancefor essential traits. A separate score is provided for each trait”(Arter & McTighe, 2000, p. 18). To obtain a holistic scorefrom an analytic rubric, individual scores can be summed toform a total score (Nitko, 2004, p. 226).
Benefits of Rubric Assessment
Rubric assessment of information literacy skills resultsin a number of benefits to students, librarians, and faculty(Oakleaf, 2008, p. 245). For students, “a properly fashionedrubric can . . . help students learn much more effectively”(Popham, 2003, p. 95). Rubrics allow students to understandthe expectations of their instructors. By making instructor-expectations clear, rubrics make rankings, ratings, and gradesmore meaningful (Bresciani, Zelna, & Anderson, 2004,p. 31). They provide direct feedback to students about whatthey have learned and what they have yet to learn. Second,
JOURNAL OF THE AMERICAN SOCIETY FOR INFORMATION SCIENCE AND TECHNOLOGY, 60(5):969–983, 2009
students can use rubrics for self-evaluation. Finally, rubricsemphasize “understanding rather than memorization, ‘deep’learning rather than ‘surface’ learning” (Pausch & Popp,1997).
University librarians and faculty also can benefit fromrubric assessment in two important ways (Oakleaf, 2009).First, the rubric creation process provides an opportunity todiscuss and determine agreed-upon values of student learn-ing. Callison (2000) wrote that “Rubrics are texts that arevisible signs of agreed upon values. They cannot contain allthe nuances of the evaluation community’s values, but theydo contain the central expressions of those values” (p. 36).Stevens and Levi (2005) listed the facilitation of communica-tion with students, educators, and other stakeholders as a keyreason to use rubrics (p. 23). Bresciani et al. (2004) confirmedthat rubrics “make public key criteria that students can usein developing, revising, and judging their own work” (p. 30).They also noted that once rubrics are developed, they can beused to norm educators’ expectations and bring them in linewith the vision for student learning (p. 31).
Second, rubric assessment offers university librarians andfaculty assessment data full of rich description. Rubrics pro-vide “detailed descriptions of what is being learned andwhat is not” (Bresciani et al., 2004, p. 30). This descriptivedata can be used to document how to improve instruction(Bernier, 2004, p. 25). Furthermore, rubric assessment dataare so detailed and well-defined that they “combat accusa-tions that evaluators do not know what they are looking forin learning and development” (Bresciani et al., 2004, p. 30).Because rubrics are easy to use and to explain, they gen-erate data that are easy to understand, defend, and convey(Andrade, 2000, p. 14). Finally, the level of detail found inrubrics helps prevent inaccurate (Popham, 2003, p. 95) orbiased assessment data (Bresciani et al., 2004, p. 31). Becauserubrics clarify schemes for assessment ahead of time, theyreduce subjectivity in grading (Moskal, 2000). According toCallison, rubric assessment “is more likely to be reasonablyobjective and consistent from lesson to lesson and from stu-dent to student, especially useful in team teaching situationsthat involve collaboration among library media specialistsand other teachers” (2000, p. 35).
Limitations of Rubric Assessment
Like other assessment tools, there are limitations associ-ated with rubric assessment (Oakleaf, 2008, p. 247). Manylimitations of a rubric approach to assessment are rootedin poor rubric construction. Not all rubrics are well-written(Popham, 2003, p. 95), and crafting a good rubric requirestime, practice, and revision (Callison, 2000, p. 35). Tierneyand Simon (2004) cautioned that unfortunately, “the mostaccessible rubrics, particularly those available on the Internet,contain design flaws that not only affect their instructionalusefulness, but also the validity of their results.”
Another limitation of rubric assessment is time. While cre-ating rubrics is inexpensive monetarily, some assessors findthe process time-consuming (Tierney & Simon, 2004). Part of
that perception might be due to a lack of familiarity or exper-tise (Bernier, 2004, p. 25); librarians do not always knowhow to make a rubric and thus believe the process will taketoo much time. Prus and Johnson (1994) acknowledged thepotential cost of time required to create a rubric, but felt thatthe advantages outweigh the costs. They wrote: “As in virtu-ally all other domains of human assessment, there is a consis-tently inverse correlation between the quality of measurementmethods and their expediency; the best methods usually takelonger and cost more faculty time, student effort, and money”(p. 25). Stevens and Levi (2005) argued that rubrics actuallymake grading easier and faster by “establishing performanceanchors, providing detailed, formative feedback, . . . sup-porting individualized, flexible, formative feedback, . . . andconveying summative feedback” (p. 73).
Reliability
There is “nearly universal” agreement that reliability isan important property in educational measurement (Colton,1997, p. 3). Reliability is a measure of consistency (Moskal,2000); however, in performance assessment, reliability ismore than getting the same score twice. For performanceassessors, two forms of reliability are considered significant.The first form is interrater reliability, which refers to the con-sistency of scores assigned by multiple raters (Moskal, 2000).The second is intrarater reliability, which refers to the con-sistency of scores assigned by one rater at different points oftime (Moskal, 2000). Because this study investigates the useof rubrics by multiple rater groups, interrater reliability is ofmore concern than is intrarater reliability.
Interrater Reliability
Many assessment methods require raters to judge or quan-tify some aspect of student behavior. For example, raters areoften used to “empirically test the viability of a new scoringrubric” (Stemler, 2004). In such cases, interrater reliabilityis a very useful measure. Interrater reliability refers to “thelevel of agreement between a particular set of judges on aparticular instrument at a particular time” and “provide[s]a statistical estimate of the extent to which two or morejudges are applying their ratings in a manner that is pre-dictable and reliable” (Stemler, 2004). Raters, or judges, areused when student products or performances cannot be scoredobjectively as right or wrong but require a rating of degree(Stemler, 2004). This use of raters results in the subjectivitythat comes hand in hand with a rater’s interpretation of theproduct or performance (Stemler, 2004). To combat potentialsubjectivity and unfairness, many assessors develop rubricsto improve the interrater reliability of constructed-responseand performance assessments. Moskal and Leydens (2000)stated that rubrics respond to concerns of subjectivity andunfairness by formalizing the criteria for scoring a studentproduct or performance. They wrote that “The descrip-tions of the score levels are used to guide the evaluationprocess. Although scoring rubrics do not completely
970 JOURNAL OF THE AMERICAN SOCIETY FOR INFORMATION SCIENCE AND TECHNOLOGY—May 2009DOI: 10.1002/asi
eliminate variations between raters, a well-designed scoringrubric can reduce the occurrence of these discrepancies.”
There are three general categories of interrater reliability:consensus estimates, consistency estimates, and measure-ment estimates. Consensus estimates are based on the beliefthat “reasonable observers should be able to come to exactagreement about how to apply the various levels of a scoringrubric to the observed behaviors” (Stemler, 2004). In contrast,consistency estimates are based on the assumption that “it isnot really necessary for two judges to share a common mean-ing of the rating scale, so long as each judge is consistent inclassifying the phenomenon according to his or her own def-inition of the scale” (Stemler, 2004). Finally, measurementestimates are based on the belief that “one should use all of theinformation available from all judges (including discrepantratings) when attempting to create a summary score for eachrespondent” (Stemler, 2004). For the focus of this study,consensus estimates are the most relevant form of interraterreliability.
Consensus Estimates
Consensus estimates of interrater reliability assume thatindependent raters should be able to agree on how to use arubric to score student products or performances. If two raterscan agree exactly on a rubric score to assign to a student’swork, then the two raters “may be said to share a commoninterpretation of the construct” (Stemler, 2004). This type ofestimate is most useful when data are “nominal in nature anddifferent levels of the rating scale represent qualitatively dif-ferent ideas” (Stemler, 2004). Consensus estimates also areuseful when “different levels of the rating scale are assumedto represent a linear continuum of the construct, but are ordi-nal in nature (e.g., a Likert scale). In that case, the judges mustcome to exact agreement about the quantitative levels of theconstruct under investigation, rather than attempting to eval-uate qualitative differences in scoring categories” (Stemler,2004).
There are three main ways of calculating consensus esti-mates of interrater reliability. The most popular method isthe simple percent-agreement figure. This figure is calcu-lated by “adding up the number of cases that received thesame rating by both judges and dividing that number by thetotal number of cases rated by the two judges” (Stemler,2004). Three advantages of the simple percent-agreementstatistic are that it has “strong intuitive appeal,” it is a sim-ple calculation process, and it is easy to explain (Stemler,2004). There also are two disadvantages to this statistic.First, this calculation is used to compare two raters, andthe present study includes 25 raters plus the researcher.Second, the percent-agreement statistic does not correct forchance. In other words, the statistic does not consider therandom probability of a rater assigning a particular score.In rubric assessment, the limited amount of criteria and lev-els of performance description increase the probability of arater assigning a particular score by chance rather than inten-tion. As a result, the percent-agreement statistic is likely to be
artificially inflated. To correct for chance, there is a procedureto modify the percent-agreement statistic. The modificationinvolves requiring not only exact agreement but also adja-cent scoring categories on the rating scale. This relaxes theneed for exact agreement among raters, but it has one dis-advantage. If the rating scale has only a limited number ofcategories (e.g., a 1–4 scale), the estimate may be inflated(Stemler, 2004). As Stemler (2004) noted,
If the rating scale has a limited number of points, then nearlyall points will be adjacent, and it would be surprising to findagreement lower than 90%. The technique of using adjacentcategories results in a situation where the percent agreementat the extreme ends of the rating scale is almost always lowerthan the middle.
Because the rubric used in this study had only three levels ofperformance description, this method was not used to analyzeinterrater reliability.
A second method of calculating a consensus estimate ofinterrater reliability is Kendall’s coefficient of concordance.Kendall’s coefficient is used to estimate agreement amongmultiple raters, corrects for chance, and is appropriate forordinal responses that are numerically coded (SAS, 2006).Because the rubric used in this study yields responses thatare both ordinal and numerically coded, Kendall’s coefficientseems a good match for this study. However, one major dis-advantage of this statistic is that it offers no agreed-uponindex for interpreting results. That is, there are no cutoffsfor levels of acceptable or unacceptable reliability estimates.As a result, this statistic was not used to estimate interraterreliability.
The third method of calculating a consensus estimate ofinterrater reliability, and the method used in this study, isCohen’s κ statistic. This statistic estimates the degree ofconsensus among multiple raters on nominal data after cor-recting for the “amount of agreement that could be expectedby chance alone based on the values of the marginal dis-tributions” (Stemler, 2004). Therefore, Cohen’s κ indicateswhether the agreement among raters is better than chancewould predict. Stemler (2004) explained:
The interpretation of the kappa statistic is slightly differentthan the interpretation of the percent-agreement figure. Avalue of zero on kappa does not indicate that the two judgesdid not agree at all; rather, it indicates that the two judges didnot agree with each other any more than would be predictedby chance alone. Consequently, it is possible to have negativevalues of kappa if judges agree less often than chance wouldpredict.
Furthermore, this statistic offers the advantage of an indexthat allows researchers to easily interpret results. Landisand Koch (1977, p. 65) assigned labels (see Figure 5) tocorresponding ranges of Cohen’s κ. Statistical support doc-umentation points to this as the definitive index for κ (SAS,2006). As a final advantage, “kappa is a highly useful statisticwhen one is concerned that the percent-agreement statis-tic may be artificially inflated due to the fact that mostobservations fall into a single category” (Stemler, 2004).
JOURNAL OF THE AMERICAN SOCIETY FOR INFORMATION SCIENCE AND TECHNOLOGY—May 2009 971DOI: 10.1002/asi
There are two limitations of Cohen’s κ statistic. First,“kappa values for different items or from different studiescannot be meaningfully compared unless the base rates areidentical” (Stemler, 2004). Therefore, it is difficult to com-pareκ statistics over different assessment situations; however,this is not a disadvantage that is significant in this study. Sec-ond, κ requires a greater number of observances to achievean acceptable standard error. This requirement is not signifi-cant for this study because it includes a sufficient number ofstudent responses.
There are several advantages to using consensus esti-mates. For instance, consensus estimates are well suited toworking with “nominal variables whose levels on the ratingscale represent qualitatively different categories” (Stemler,2004). Consensus estimates also can help determine howjudges might misinterpret how to apply a rubric. Stemler(2004) stated that “A visual analysis of the output allowsthe researcher to go back to the data and clarify the discrep-ancy or retain the judges.” Another advantage of consensusestimates is that they identify raters who have been trainedenough to agree on how to interpret a rating scale. Whenthat occurs, two raters may be treated as equivalent, and bothraters need not score all student products or performances.Stemler (2004) confirmed that:
When judges exhibit a high level of consensus, it implies thatboth judges are essentially providing the same information.One implication of a high consensus estimate of interraterreliability is that both judges need not score all remainingitems . . . because the two judges have empirically demon-strated that they share a similar meaning for the scoring rubric.In practice, however, it is usually a good idea to build in a 30%overlap between judges even after they have been trained inorder to provide evidence that the judges are not drifting fromtheir consensus as they read more items.
When raters are trained to a level of agreement, summaryscores can be figured by taking the score of one rater or aver-aging the scores given by all raters (Stemler, 2004). Althoughthis advantage is not explored in this study, it has practicalimplications for future applications of rubrics.
Purpose of the Study
Because rubrics offer numerous potential benefits to librar-ians and faculty seeking to assess information literacy skills,a number of information literacy rubrics have appeared inthe library and information science literature. The follow-ing authors recorded the use of rubrics to assess informationliteracy in higher education: D’Angelo (2001), Merz andMark (2002), Rockman (2002), Emmons and Martin (2002),Buchanan (2003), Choinski, Mark, and Murphey (2003),Franks (2003), Gauss and Kinkema (2003), Hutchins (2003),Kivel (2003), Kobritz (2003), Warmkessel (2003), Smalley(2003), and Knight (2006). While these authors reportedthe use of information literacy rubrics, none have ade-quately examined the methods for training raters nor exploredinterrater reliability. As a result, an investigation of the useof rubrics by university librarians, faculty, and students is
merited. This study investigates the viability of a rubricapproach to information literacy assessment and details amethodology for both using rubrics and analyzing inter-rater reliability. It addresses the following research question:To what degree can different groups of raters (librari-ans, English faculty, students) provide consistent scoring ofartifacts of student learning using a rubric? This centralresearch question can be divided into two smaller areas ofinvestigation:
• Can raters provide scores that are consistent with others intheir rater group?
• Can raters provide scores that are consistent across groups?
Background
At North Carolina State University (NCSU), first-yearstudents complete an online information literacy tuto-rial called “Library Online Basic Orientation” (LOBO;www.lib.ncsu.edu/lobo2) during English 101, a requiredwriting course.As students progress through the tutorial, theyare prompted to answer open-ended questions that reinforceor extend concepts taught in the tutorial. In the web evaluationsection of the tutorial, students type the URL of a web site theyhave chosen as a possible resource for their research paperassignment. In subsequent screens, they respond to questionsabout the web site. Figure 1 depicts the prompt that focuseson web site authority. Student responses to the prompt arecollected in a secure database within LOBO and offer a richdataset for assessing the achievement of learning outcomes.
NCSU Libraries
This study focuses on student answers to the web siteauthority prompt. During the study period, more than800 students responded to this open-ended question.To assessstudent responses, the researcher (also the NCSU instruc-tion librarian and author) designed a full-model, analyticrubric (see Figure 2) based on the Association of College andResearch Libraries (ACRL) standards to assess student abilityto evaluate web sites for authority. The rubric included fourcriteria and three levels of performance. The criteria listedin the rubric were “Articulates Criteria,” “Cites Indicatorsof Criteria,” “Links Indicators to Examples from Source,”and “Judges Whether or Not to Use Source.” The rubric alsodescribed student behavior at three levels: Beginning, Devel-oping, and Exemplary. The instruction librarian and 25 otherraters used this rubric to score the 75 student responses to thestudy question.
Methodology
This study employed a survey design methodology. Thedata for the study came from student responses to open-ended questions embedded in the LOBO online tutorial.These textual data were translated into quantitative termsthrough the use of a rubric. Using a rubric, raters coded stu-dent answers into preset categories, and these categories wereassigned point values. The point values assigned to student
972 JOURNAL OF THE AMERICAN SOCIETY FOR INFORMATION SCIENCE AND TECHNOLOGY—May 2009DOI: 10.1002/asi
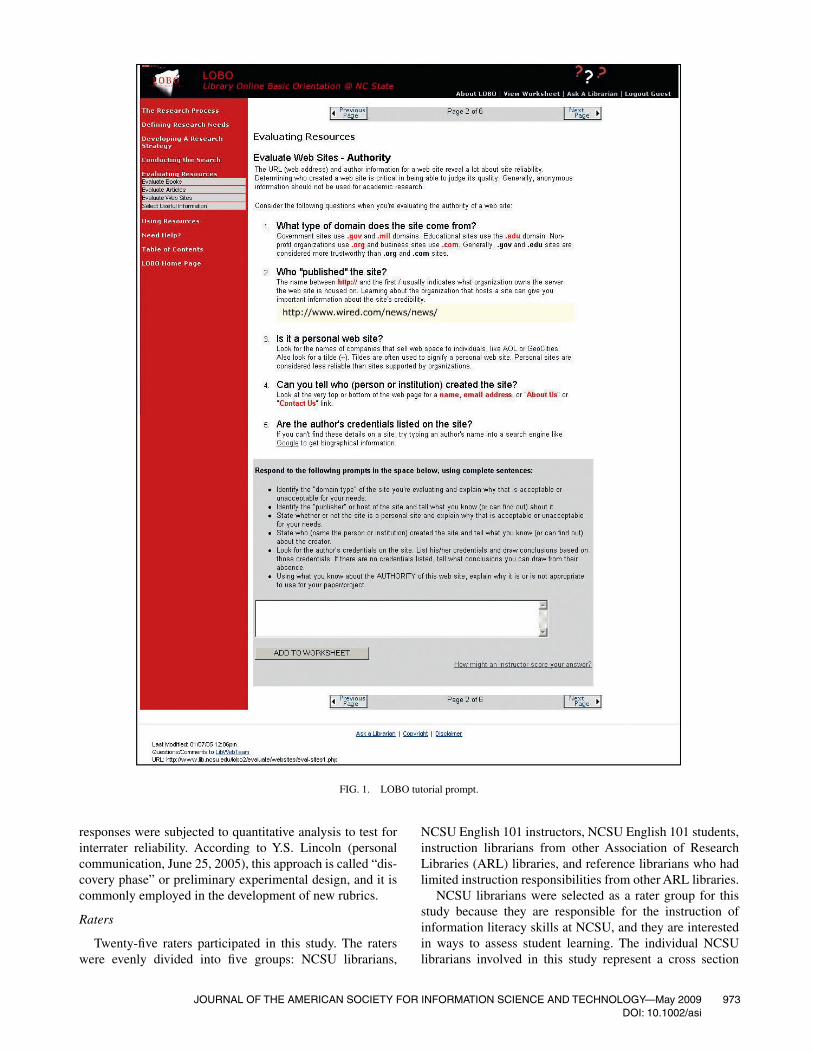
FIG. 1. LOBO tutorial prompt.
responses were subjected to quantitative analysis to test forinterrater reliability. According to Y.S. Lincoln (personalcommunication, June 25, 2005), this approach is called “dis-covery phase” or preliminary experimental design, and it iscommonly employed in the development of new rubrics.
Raters
Twenty-five raters participated in this study. The raterswere evenly divided into five groups: NCSU librarians,
NCSU English 101 instructors, NCSU English 101 students,instruction librarians from other Association of ResearchLibraries (ARL) libraries, and reference librarians who hadlimited instruction responsibilities from other ARL libraries.
NCSU librarians were selected as a rater group for thisstudy because they are responsible for the instruction ofinformation literacy skills at NCSU, and they are interestedin ways to assess student learning. The individual NCSUlibrarians involved in this study represent a cross section
JOURNAL OF THE AMERICAN SOCIETY FOR INFORMATION SCIENCE AND TECHNOLOGY—May 2009 973DOI: 10.1002/asi
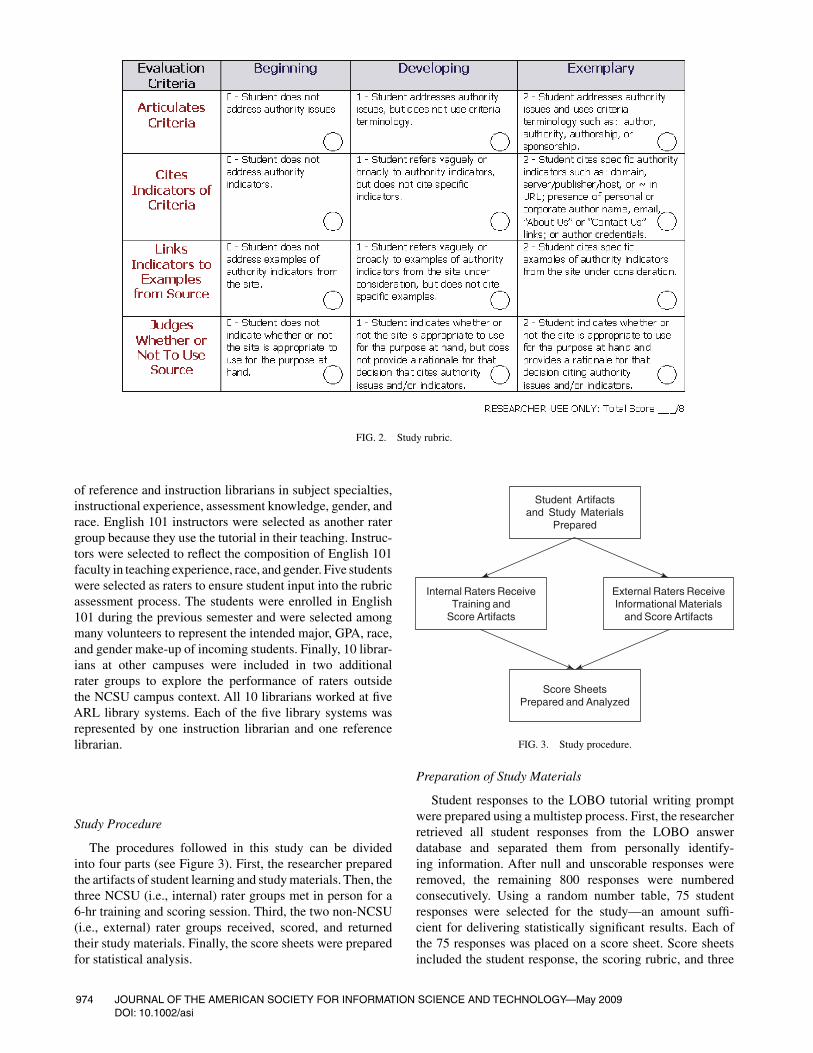
FIG. 2. Study rubric.
of reference and instruction librarians in subject specialties,instructional experience, assessment knowledge, gender, andrace. English 101 instructors were selected as another ratergroup because they use the tutorial in their teaching. Instruc-tors were selected to reflect the composition of English 101faculty in teaching experience, race, and gender. Five studentswere selected as raters to ensure student input into the rubricassessment process. The students were enrolled in English101 during the previous semester and were selected amongmany volunteers to represent the intended major, GPA, race,and gender make-up of incoming students. Finally, 10 librar-ians at other campuses were included in two additionalrater groups to explore the performance of raters outsidethe NCSU campus context. All 10 librarians worked at fiveARL library systems. Each of the five library systems wasrepresented by one instruction librarian and one referencelibrarian.
Study Procedure
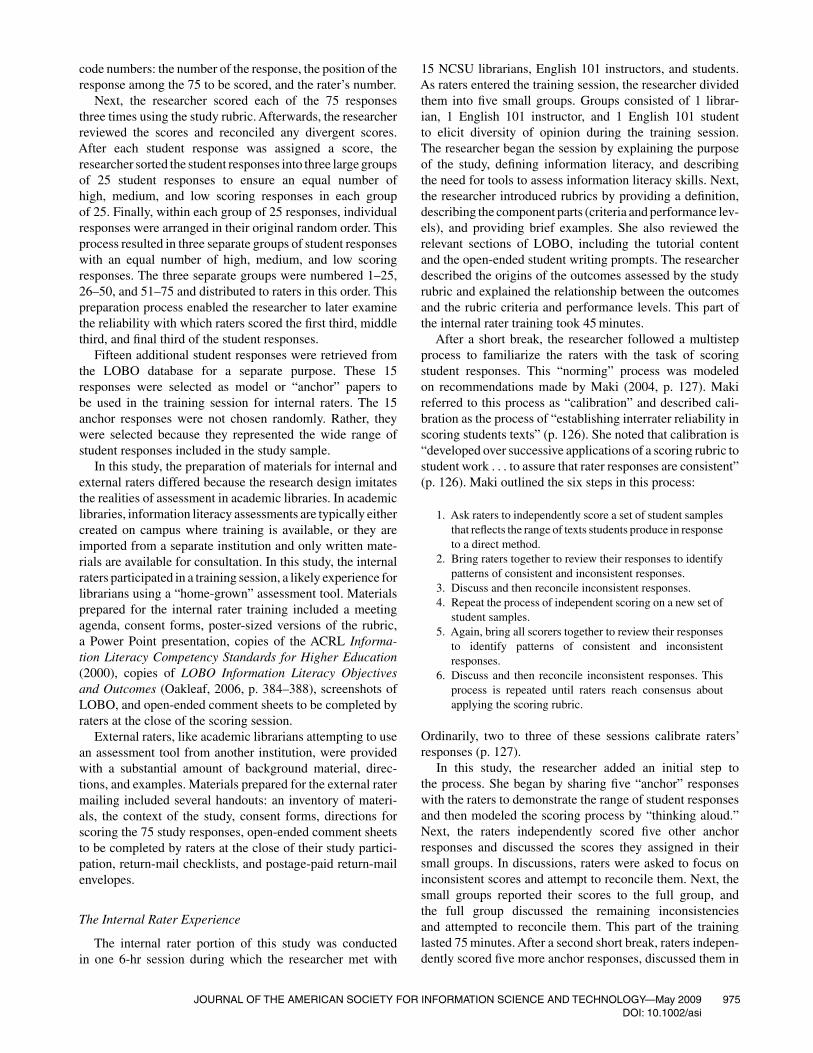
The procedures followed in this study can be dividedinto four parts (see Figure 3). First, the researcher preparedthe artifacts of student learning and study materials. Then, thethree NCSU (i.e., internal) rater groups met in person for a6-hr training and scoring session. Third, the two non-NCSU(i.e., external) rater groups received, scored, and returnedtheir study materials. Finally, the score sheets were preparedfor statistical analysis.
Internal Raters ReceiveTraining and
Score Artifacts
External Raters ReceiveInformational Materials
and Score Artifacts
Student Artifactsand Study Materials
Prepared
Score SheetsPrepared and Analyzed
FIG. 3. Study procedure.
Preparation of Study Materials
Student responses to the LOBO tutorial writing promptwere prepared using a multistep process. First, the researcherretrieved all student responses from the LOBO answerdatabase and separated them from personally identify-ing information. After null and unscorable responses wereremoved, the remaining 800 responses were numberedconsecutively. Using a random number table, 75 studentresponses were selected for the study—an amount suffi-cient for delivering statistically significant results. Each ofthe 75 responses was placed on a score sheet. Score sheetsincluded the student response, the scoring rubric, and three
974 JOURNAL OF THE AMERICAN SOCIETY FOR INFORMATION SCIENCE AND TECHNOLOGY—May 2009DOI: 10.1002/asi
code numbers: the number of the response, the position of theresponse among the 75 to be scored, and the rater’s number.
Next, the researcher scored each of the 75 responsesthree times using the study rubric. Afterwards, the researcherreviewed the scores and reconciled any divergent scores.After each student response was assigned a score, theresearcher sorted the student responses into three large groupsof 25 student responses to ensure an equal number ofhigh, medium, and low scoring responses in each groupof 25. Finally, within each group of 25 responses, individualresponses were arranged in their original random order. Thisprocess resulted in three separate groups of student responseswith an equal number of high, medium, and low scoringresponses. The three separate groups were numbered 1–25,26–50, and 51–75 and distributed to raters in this order. Thispreparation process enabled the researcher to later examinethe reliability with which raters scored the first third, middlethird, and final third of the student responses.
Fifteen additional student responses were retrieved fromthe LOBO database for a separate purpose. These 15responses were selected as model or “anchor” papers tobe used in the training session for internal raters. The 15anchor responses were not chosen randomly. Rather, theywere selected because they represented the wide range ofstudent responses included in the study sample.
In this study, the preparation of materials for internal andexternal raters differed because the research design imitatesthe realities of assessment in academic libraries. In academiclibraries, information literacy assessments are typically eithercreated on campus where training is available, or they areimported from a separate institution and only written mate-rials are available for consultation. In this study, the internalraters participated in a training session, a likely experience forlibrarians using a “home-grown” assessment tool. Materialsprepared for the internal rater training included a meetingagenda, consent forms, poster-sized versions of the rubric,a Power Point presentation, copies of the ACRL Informa-tion Literacy Competency Standards for Higher Education(2000), copies of LOBO Information Literacy Objectivesand Outcomes (Oakleaf, 2006, p. 384–388), screenshots ofLOBO, and open-ended comment sheets to be completed byraters at the close of the scoring session.
External raters, like academic librarians attempting to usean assessment tool from another institution, were providedwith a substantial amount of background material, direc-tions, and examples. Materials prepared for the external ratermailing included several handouts: an inventory of materi-als, the context of the study, consent forms, directions forscoring the 75 study responses, open-ended comment sheetsto be completed by raters at the close of their study partici-pation, return-mail checklists, and postage-paid return-mailenvelopes.
The Internal Rater Experience
The internal rater portion of this study was conductedin one 6-hr session during which the researcher met with
15 NCSU librarians, English 101 instructors, and students.As raters entered the training session, the researcher dividedthem into five small groups. Groups consisted of 1 librar-ian, 1 English 101 instructor, and 1 English 101 studentto elicit diversity of opinion during the training session.The researcher began the session by explaining the purposeof the study, defining information literacy, and describingthe need for tools to assess information literacy skills. Next,the researcher introduced rubrics by providing a definition,describing the component parts (criteria and performance lev-els), and providing brief examples. She also reviewed therelevant sections of LOBO, including the tutorial contentand the open-ended student writing prompts. The researcherdescribed the origins of the outcomes assessed by the studyrubric and explained the relationship between the outcomesand the rubric criteria and performance levels. This part ofthe internal rater training took 45 minutes.
After a short break, the researcher followed a multistepprocess to familiarize the raters with the task of scoringstudent responses. This “norming” process was modeledon recommendations made by Maki (2004, p. 127). Makireferred to this process as “calibration” and described cali-bration as the process of “establishing interrater reliability inscoring students texts” (p. 126). She noted that calibration is“developed over successive applications of a scoring rubric tostudent work . . . to assure that rater responses are consistent”(p. 126). Maki outlined the six steps in this process:
1. Ask raters to independently score a set of student samplesthat reflects the range of texts students produce in responseto a direct method.
2. Bring raters together to review their responses to identifypatterns of consistent and inconsistent responses.
3. Discuss and then reconcile inconsistent responses.4. Repeat the process of independent scoring on a new set of
student samples.5. Again, bring all scorers together to review their responses
to identify patterns of consistent and inconsistentresponses.
6. Discuss and then reconcile inconsistent responses. Thisprocess is repeated until raters reach consensus aboutapplying the scoring rubric.
Ordinarily, two to three of these sessions calibrate raters’responses (p. 127).
In this study, the researcher added an initial step tothe process. She began by sharing five “anchor” responseswith the raters to demonstrate the range of student responsesand then modeled the scoring process by “thinking aloud.”Next, the raters independently scored five other anchorresponses and discussed the scores they assigned in theirsmall groups. In discussions, raters were asked to focus oninconsistent scores and attempt to reconcile them. Next, thesmall groups reported their scores to the full group, andthe full group discussed the remaining inconsistenciesand attempted to reconcile them. This part of the traininglasted 75 minutes. After a second short break, raters indepen-dently scored five more anchor responses, discussed them in
JOURNAL OF THE AMERICAN SOCIETY FOR INFORMATION SCIENCE AND TECHNOLOGY—May 2009 975DOI: 10.1002/asi
small groups, and finally worked as a full group to eliminateinconsistencies in scoring. This time, the process took about60 minutes.
Raters felt at this point that they were ready to score stu-dent responses on their own, and they began to score the75 study responses. They received three packets of 25 stu-dent responses; as they turned in each packet, they received anew one for scoring. Most raters required 45 to 75 minutes toscore all responses; 1 rater took 95 minutes. After raters fin-ished scoring study responses, they completed an open-endedcomment sheet and left the scoring session.
The External Rater Experience
The 10 external (non-NCSU) raters did not participate in atraining session. Instead, they were provided with study mate-rials, background information, and directions via the mail.When raters opened their study packets, they encounteredseveral documents. The first document inventoried the con-tents of the study packets. The second document includedthe purpose of the study, the major research questions, infor-mation explaining raters’ role in the study, and directions forparticipating in the study. Raters were provided with the URLfor LOBO and directions to login as a guest, screenshots fromLOBO, the full and student versions of the rubric, and hand-outs including the ACRL Information Literacy CompetencyStandards for Higher Education and LOBO Information Lit-eracy Objectives and Outcomes. The packet also included 75LOBO student responses and an open-ended comment sheetfor raters. Finally, raters were directed to place completedstudy materials in the postage-paid envelope and return themto the researcher.
Preparation for Statistical Analysis
At the close of the study, all raters returned their rubricscore sheets and open-ended comment sheets. The open-ended comment sheets were transcribed for later use as asource for raters’ perceptions and anecdotal comments. Therubric score sheets were organized for data entry and anal-ysis. Data from the rubric score sheets were entered into anExcel spreadsheet. The number of the response, the positionof the response among the 75 study responses, and the rater’snumber were included in the spreadsheet. For each response,each rater’s score for the four criteria were recorded, alongwith the total score (0–8).
Statistical Analysis
The major purpose of this study was to determine towhat degree different groups of raters can provide consis-tent scoring of artifacts of student learning using a rubric.The interrater reliability of rubric scores was examined bothwithin groups and across groups using Cohen’s κ. This statis-tic was calculated for each of the four criteria included in therubric. It also was calculated for the total score assigned tothe student response. Because of limitations of the κ statistic,total scores (0–8) were converted to letter grades (A, B, C, U)
Total rubric score Letter grade7–8 A5–6 B3–4 C0–2 U
FIG. 4. Total scores and their associated letter grades.
κ Strength of agreement<0.00 Poor
0.00–0.20 Slight0.21–0.40 Fair0.41–0.60 Moderate0.61–0.80 Substantial0.81–1.00 Almost Perfect
FIG. 5. Level of agreement indicated by κ score.
according to recommendations in the literature (see Figure 4)(Mertler, 2001). After this conversion, Cohen’s κ was run onthe “grade” assigned to the total student response.
To illustrate the reliability within each group of raters,charts were generated that showed the κ for each rater group.To clarify the meaning of each κ statistic, the level of agree-ment indicated by the κ scores was labeled (see Figure 5)using the index provided by Landis and Koch (1977, p. 165).For example, rater groups that produced a κ of .41 to .60 arelabeled “Moderate.”
Results
Interrater Reliability Within Groups
To determine the reliability of rubric scores providedby raters, each rater group was examined separately. Thegroups defined by the study are NCSU librarians, English101 instructors, English 101 students, external (non-NCSU)instruction librarians, and external (non-NCSU) referencelibrarians. The raters’ scores also were examined in two largegroups: internal (NCSU) raters and external (non-NCSU)raters.
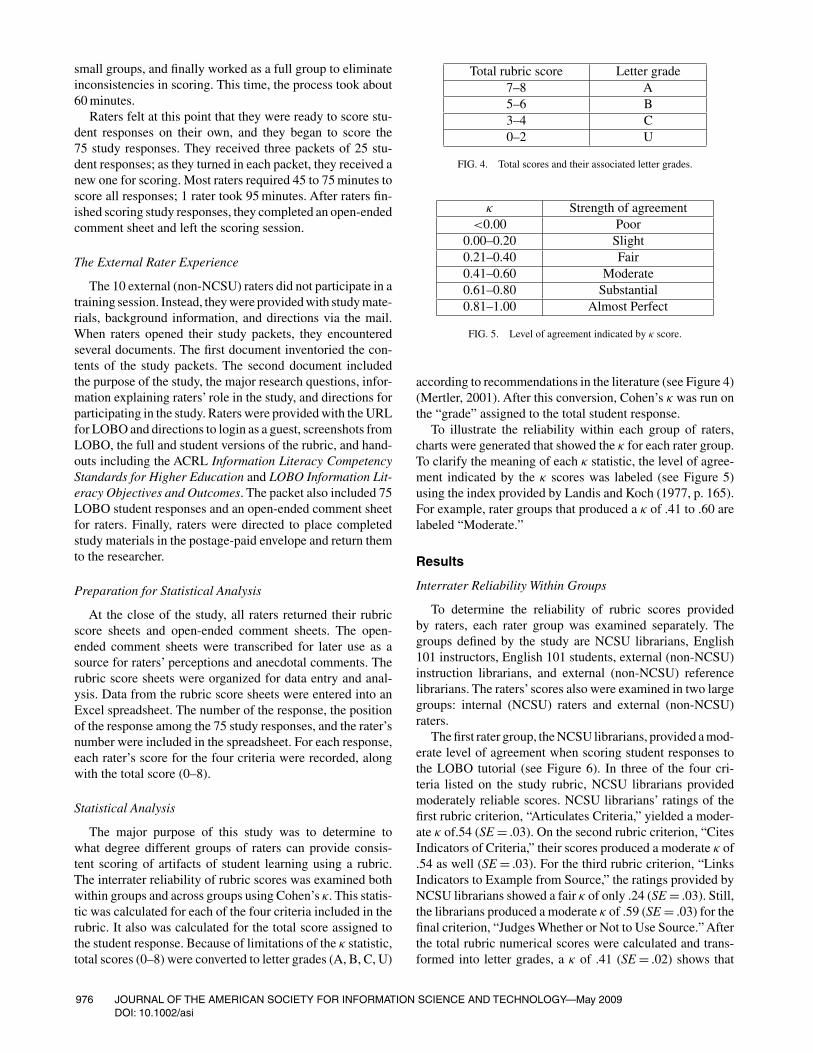
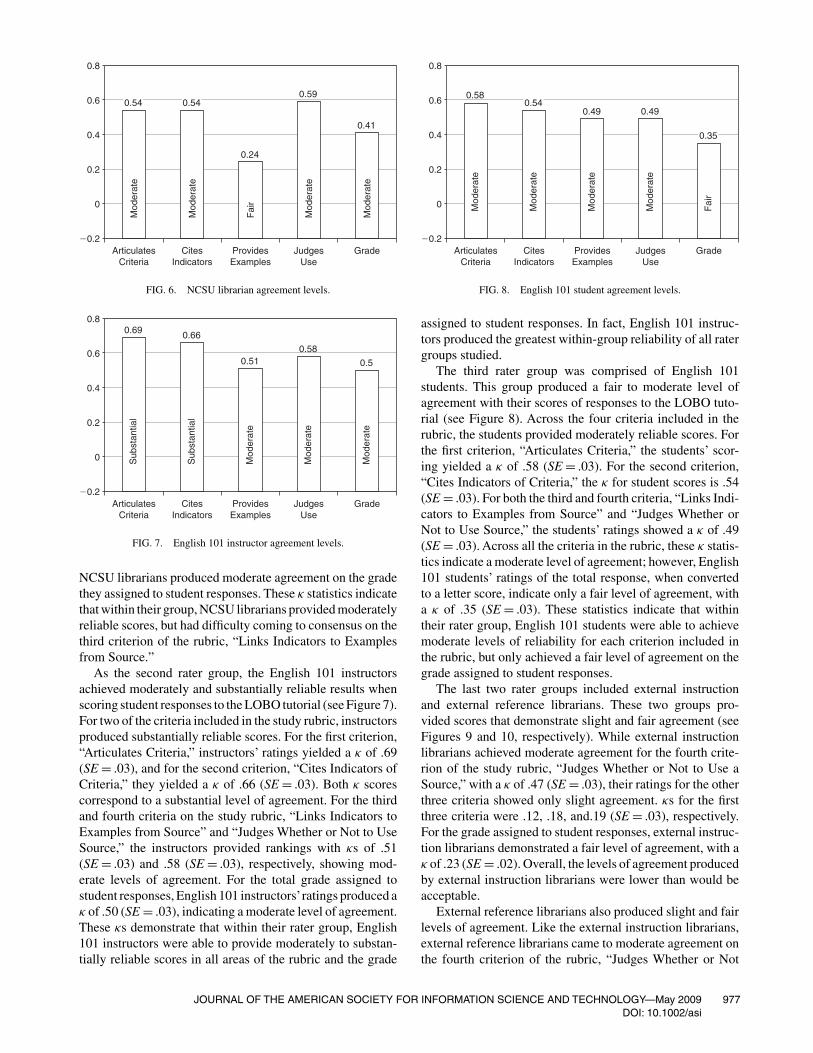
The first rater group, the NCSU librarians, provided a mod-erate level of agreement when scoring student responses tothe LOBO tutorial (see Figure 6). In three of the four cri-teria listed on the study rubric, NCSU librarians providedmoderately reliable scores. NCSU librarians’ ratings of thefirst rubric criterion, “Articulates Criteria,” yielded a moder-ate κ of.54 (SE = .03). On the second rubric criterion, “CitesIndicators of Criteria,” their scores produced a moderate κ of.54 as well (SE = .03). For the third rubric criterion, “LinksIndicators to Example from Source,” the ratings provided byNCSU librarians showed a fair κ of only .24 (SE = .03). Still,the librarians produced a moderate κ of .59 (SE = .03) for thefinal criterion, “Judges Whether or Not to Use Source.” Afterthe total rubric numerical scores were calculated and trans-formed into letter grades, a κ of .41 (SE = .02) shows that
976 JOURNAL OF THE AMERICAN SOCIETY FOR INFORMATION SCIENCE AND TECHNOLOGY—May 2009DOI: 10.1002/asi
0.24
0.59
0.41
�0.2
0
0.2
0.4
0.6
0.8
ArticulatesCriteria
CitesIndicators
ProvidesExamples
JudgesUse
Grade
0.54 0.54
Mod
erat
e
Mod
erat
e
Fai
r
Mod
erat
e
Mod
erat
e
FIG. 6. NCSU librarian agreement levels.
0.510.58
0.5
�0.2
0
0.2
0.4
0.6
0.8
ArticulatesCriteria
CitesIndicators
ProvidesExamples
JudgesUse
Grade
0.69 0.66
Sub
stan
tial
Sub
stan
tial
Mod
erat
e
Mod
erat
e
Mod
erat
e
FIG. 7. English 101 instructor agreement levels.
NCSU librarians produced moderate agreement on the gradethey assigned to student responses. These κ statistics indicatethat within their group, NCSU librarians provided moderatelyreliable scores, but had difficulty coming to consensus on thethird criterion of the rubric, “Links Indicators to Examplesfrom Source.”
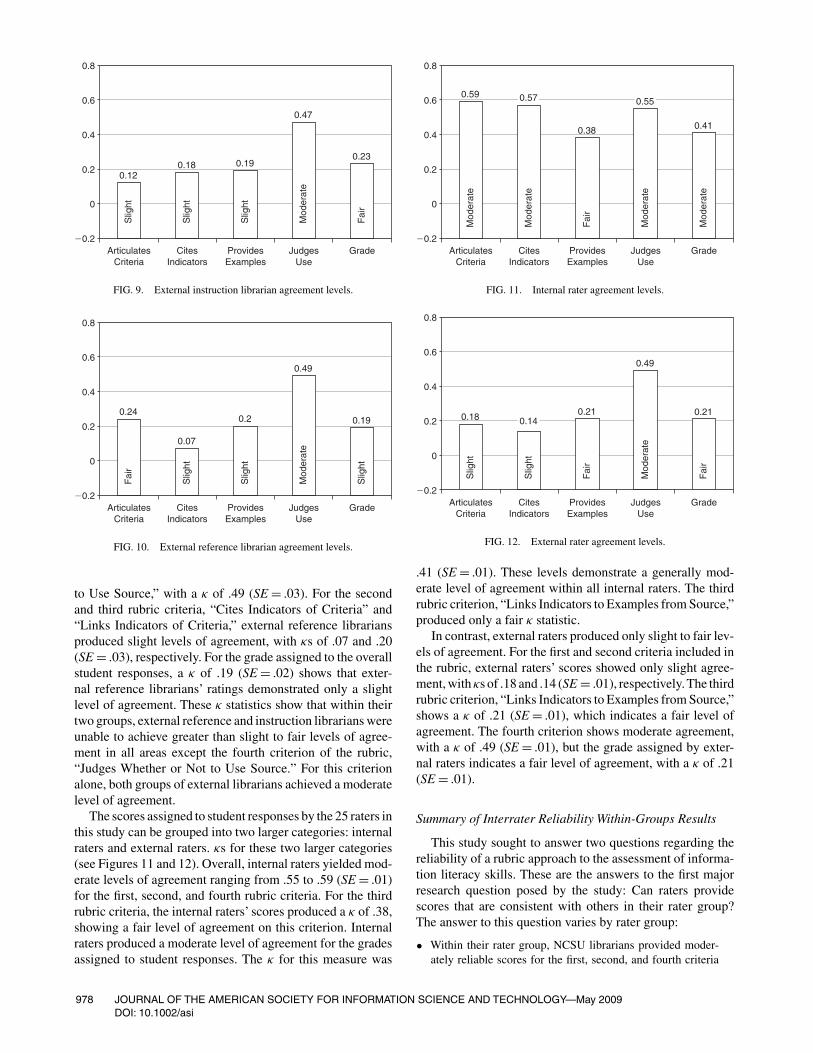
As the second rater group, the English 101 instructorsachieved moderately and substantially reliable results whenscoring student responses to the LOBO tutorial (see Figure 7).For two of the criteria included in the study rubric, instructorsproduced substantially reliable scores. For the first criterion,“Articulates Criteria,” instructors’ ratings yielded a κ of .69(SE = .03), and for the second criterion, “Cites Indicators ofCriteria,” they yielded a κ of .66 (SE = .03). Both κ scorescorrespond to a substantial level of agreement. For the thirdand fourth criteria on the study rubric, “Links Indicators toExamples from Source” and “Judges Whether or Not to UseSource,” the instructors provided rankings with κs of .51(SE = .03) and .58 (SE = .03), respectively, showing mod-erate levels of agreement. For the total grade assigned tostudent responses, English 101 instructors’ratings produced aκ of .50 (SE = .03), indicating a moderate level of agreement.These κs demonstrate that within their rater group, English101 instructors were able to provide moderately to substan-tially reliable scores in all areas of the rubric and the grade
0.49 0.49
�0.2
0
0.2
0.4
0.6
0.8
ArticulatesCriteria
CitesIndicators
ProvidesExamples
JudgesUse
Grade
0.580.54
Mod
erat
e
Mod
erat
e
Mod
erat
e
Mod
erat
e
Fai
r
0.35
FIG. 8. English 101 student agreement levels.
assigned to student responses. In fact, English 101 instruc-tors produced the greatest within-group reliability of all ratergroups studied.
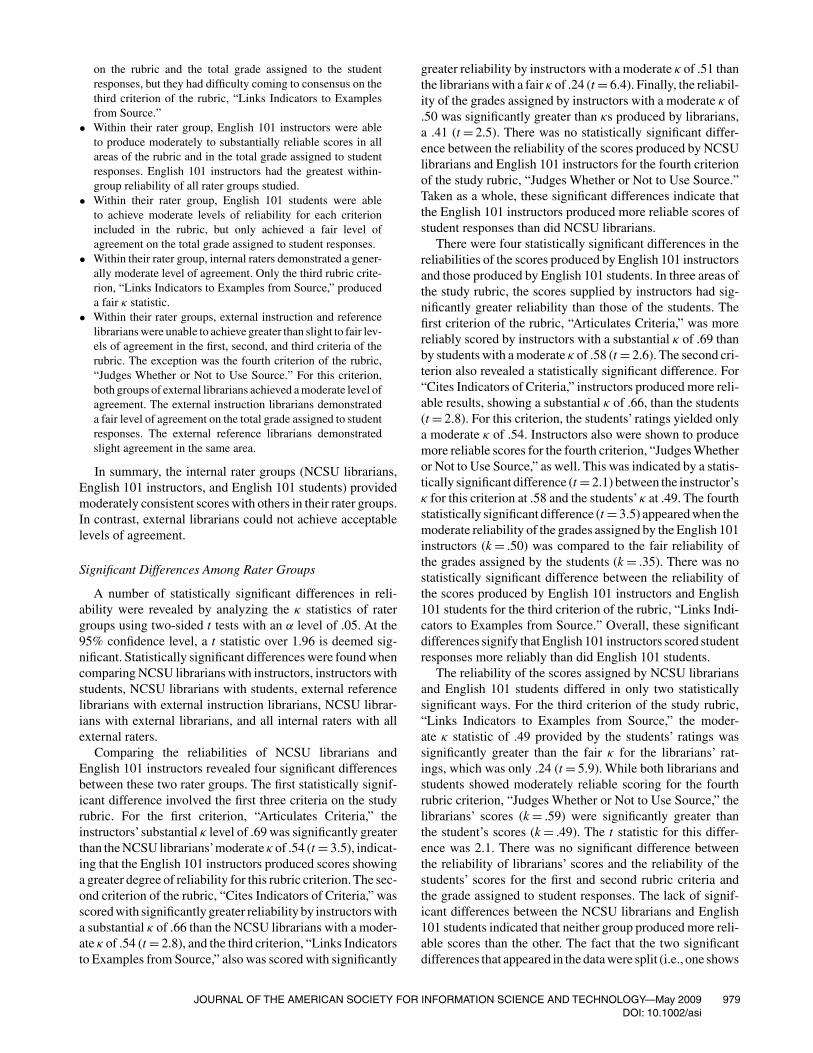
The third rater group was comprised of English 101students. This group produced a fair to moderate level ofagreement with their scores of responses to the LOBO tuto-rial (see Figure 8). Across the four criteria included in therubric, the students provided moderately reliable scores. Forthe first criterion, “Articulates Criteria,” the students’ scor-ing yielded a κ of .58 (SE = .03). For the second criterion,“Cites Indicators of Criteria,” the κ for student scores is .54(SE = .03). For both the third and fourth criteria, “Links Indi-cators to Examples from Source” and “Judges Whether orNot to Use Source,” the students’ ratings showed a κ of .49(SE = .03). Across all the criteria in the rubric, these κ statis-tics indicate a moderate level of agreement; however, English101 students’ ratings of the total response, when convertedto a letter score, indicate only a fair level of agreement, witha κ of .35 (SE = .03). These statistics indicate that withintheir rater group, English 101 students were able to achievemoderate levels of reliability for each criterion included inthe rubric, but only achieved a fair level of agreement on thegrade assigned to student responses.
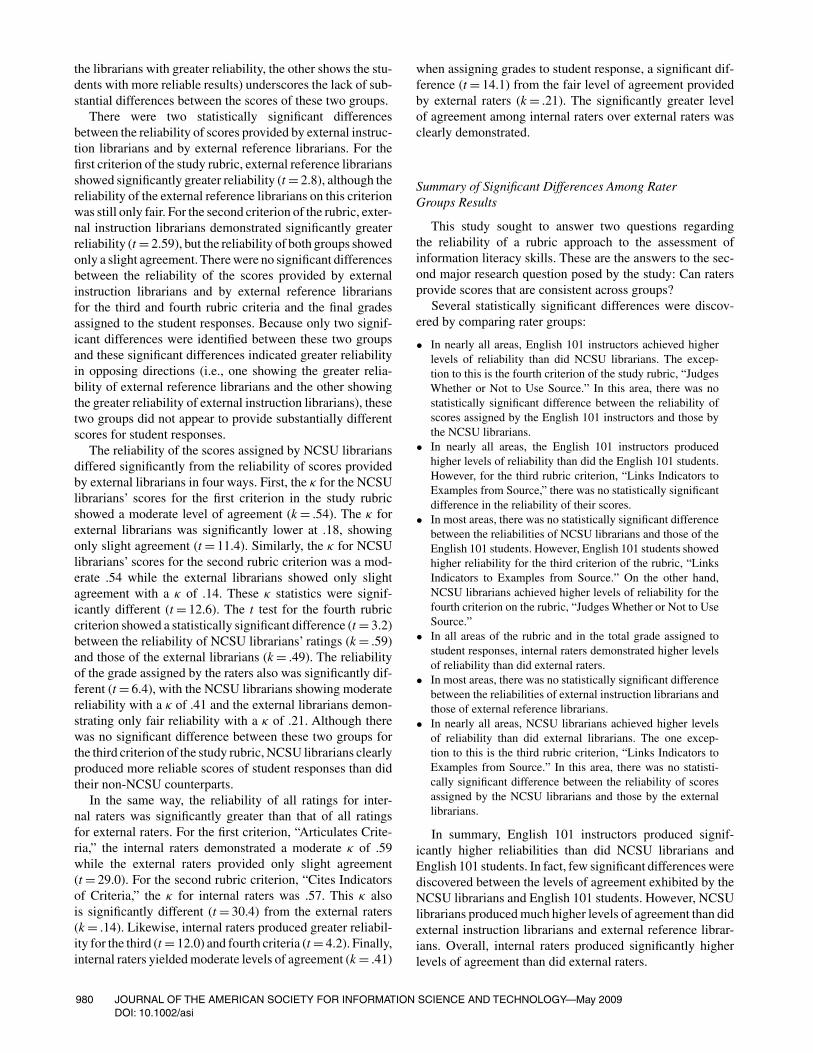
The last two rater groups included external instructionand external reference librarians. These two groups pro-vided scores that demonstrate slight and fair agreement (seeFigures 9 and 10, respectively). While external instructionlibrarians achieved moderate agreement for the fourth crite-rion of the study rubric, “Judges Whether or Not to Use aSource,” with a κ of .47 (SE = .03), their ratings for the otherthree criteria showed only slight agreement. κs for the firstthree criteria were .12, .18, and.19 (SE = .03), respectively.For the grade assigned to student responses, external instruc-tion librarians demonstrated a fair level of agreement, with aκ of .23 (SE = .02). Overall, the levels of agreement producedby external instruction librarians were lower than would beacceptable.
External reference librarians also produced slight and fairlevels of agreement. Like the external instruction librarians,external reference librarians came to moderate agreement onthe fourth criterion of the rubric, “Judges Whether or Not
JOURNAL OF THE AMERICAN SOCIETY FOR INFORMATION SCIENCE AND TECHNOLOGY—May 2009 977DOI: 10.1002/asi
0.19
0.47
�0.2
0
0.2
0.4
0.6
0.8
ArticulatesCriteria
CitesIndicators
ProvidesExamples
JudgesUse
Grade
0.120.18
Slig
ht
Slig
ht
Slig
ht
Mod
erat
e
Fai
r
0.23
FIG. 9. External instruction librarian agreement levels.
0.2
0.49
�0.2
0
0.2
0.4
0.6
0.8
ArticulatesCriteria
CitesIndicators
ProvidesExamples
JudgesUse
Grade
0.24
0.07
Fai
r
Slig
ht
Slig
ht
Mod
erat
e
Slig
ht
0.19
FIG. 10. External reference librarian agreement levels.
to Use Source,” with a κ of .49 (SE = .03). For the secondand third rubric criteria, “Cites Indicators of Criteria” and“Links Indicators of Criteria,” external reference librariansproduced slight levels of agreement, with κs of .07 and .20(SE = .03), respectively. For the grade assigned to the overallstudent responses, a κ of .19 (SE = .02) shows that exter-nal reference librarians’ ratings demonstrated only a slightlevel of agreement. These κ statistics show that within theirtwo groups, external reference and instruction librarians wereunable to achieve greater than slight to fair levels of agree-ment in all areas except the fourth criterion of the rubric,“Judges Whether or Not to Use Source.” For this criterionalone, both groups of external librarians achieved a moderatelevel of agreement.
The scores assigned to student responses by the 25 raters inthis study can be grouped into two larger categories: internalraters and external raters. κs for these two larger categories(see Figures 11 and 12). Overall, internal raters yielded mod-erate levels of agreement ranging from .55 to .59 (SE = .01)for the first, second, and fourth rubric criteria. For the thirdrubric criteria, the internal raters’ scores produced a κ of .38,showing a fair level of agreement on this criterion. Internalraters produced a moderate level of agreement for the gradesassigned to student responses. The κ for this measure was
0.38
�0.2
0
0.2
0.4
0.6
0.8
ArticulatesCriteria
CitesIndicators
ProvidesExamples
JudgesUse
Grade
0.59
Mod
erat
e
Mod
erat
e
Fai
r
Mod
erat
e
Mod
erat
e
0.41
0.550.57
FIG. 11. Internal rater agreement levels.
0.21
�0.2
0
0.2
0.4
0.6
0.8
ArticulatesCriteria
CitesIndicators
ProvidesExamples
JudgesUse
Grade
0.21
Fai
r
Slig
ht
0.18
Slig
ht
Mod
erat
e
Fai
r
0.49
0.14
Fai
r
FIG. 12. External rater agreement levels.
.41 (SE = .01). These levels demonstrate a generally mod-erate level of agreement within all internal raters. The thirdrubric criterion, “Links Indicators to Examples from Source,”produced only a fair κ statistic.
In contrast, external raters produced only slight to fair lev-els of agreement. For the first and second criteria included inthe rubric, external raters’ scores showed only slight agree-ment, withκs of .18 and .14 (SE = .01), respectively. The thirdrubric criterion, “Links Indicators to Examples from Source,”shows a κ of .21 (SE = .01), which indicates a fair level ofagreement. The fourth criterion shows moderate agreement,with a κ of .49 (SE = .01), but the grade assigned by exter-nal raters indicates a fair level of agreement, with a κ of .21(SE = .01).
Summary of Interrater Reliability Within-Groups Results
This study sought to answer two questions regarding thereliability of a rubric approach to the assessment of informa-tion literacy skills. These are the answers to the first majorresearch question posed by the study: Can raters providescores that are consistent with others in their rater group?The answer to this question varies by rater group:
• Within their rater group, NCSU librarians provided moder-ately reliable scores for the first, second, and fourth criteria
978 JOURNAL OF THE AMERICAN SOCIETY FOR INFORMATION SCIENCE AND TECHNOLOGY—May 2009DOI: 10.1002/asi
on the rubric and the total grade assigned to the studentresponses, but they had difficulty coming to consensus on thethird criterion of the rubric, “Links Indicators to Examplesfrom Source.”
• Within their rater group, English 101 instructors were ableto produce moderately to substantially reliable scores in allareas of the rubric and in the total grade assigned to studentresponses. English 101 instructors had the greatest within-group reliability of all rater groups studied.
• Within their rater group, English 101 students were ableto achieve moderate levels of reliability for each criterionincluded in the rubric, but only achieved a fair level ofagreement on the total grade assigned to student responses.
• Within their rater group, internal raters demonstrated a gener-ally moderate level of agreement. Only the third rubric crite-rion, “Links Indicators to Examples from Source,” produceda fair κ statistic.
• Within their rater groups, external instruction and referencelibrarians were unable to achieve greater than slight to fair lev-els of agreement in the first, second, and third criteria of therubric. The exception was the fourth criterion of the rubric,“Judges Whether or Not to Use Source.” For this criterion,both groups of external librarians achieved a moderate level ofagreement. The external instruction librarians demonstrateda fair level of agreement on the total grade assigned to studentresponses. The external reference librarians demonstratedslight agreement in the same area.
In summary, the internal rater groups (NCSU librarians,English 101 instructors, and English 101 students) providedmoderately consistent scores with others in their rater groups.In contrast, external librarians could not achieve acceptablelevels of agreement.
Significant Differences Among Rater Groups
A number of statistically significant differences in reli-ability were revealed by analyzing the κ statistics of ratergroups using two-sided t tests with an α level of .05. At the95% confidence level, a t statistic over 1.96 is deemed sig-nificant. Statistically significant differences were found whencomparing NCSU librarians with instructors, instructors withstudents, NCSU librarians with students, external referencelibrarians with external instruction librarians, NCSU librar-ians with external librarians, and all internal raters with allexternal raters.
Comparing the reliabilities of NCSU librarians andEnglish 101 instructors revealed four significant differencesbetween these two rater groups. The first statistically signif-icant difference involved the first three criteria on the studyrubric. For the first criterion, “Articulates Criteria,” theinstructors’substantial κ level of .69 was significantly greaterthan the NCSU librarians’moderate κ of .54 (t = 3.5), indicat-ing that the English 101 instructors produced scores showinga greater degree of reliability for this rubric criterion. The sec-ond criterion of the rubric, “Cites Indicators of Criteria,” wasscored with significantly greater reliability by instructors witha substantial κ of .66 than the NCSU librarians with a moder-ate κ of .54 (t = 2.8), and the third criterion, “Links Indicatorsto Examples from Source,” also was scored with significantly
greater reliability by instructors with a moderate κ of .51 thanthe librarians with a fair κ of .24 (t = 6.4). Finally, the reliabil-ity of the grades assigned by instructors with a moderate κ of.50 was significantly greater than κs produced by librarians,a .41 (t = 2.5). There was no statistically significant differ-ence between the reliability of the scores produced by NCSUlibrarians and English 101 instructors for the fourth criterionof the study rubric, “Judges Whether or Not to Use Source.”Taken as a whole, these significant differences indicate thatthe English 101 instructors produced more reliable scores ofstudent responses than did NCSU librarians.
There were four statistically significant differences in thereliabilities of the scores produced by English 101 instructorsand those produced by English 101 students. In three areas ofthe study rubric, the scores supplied by instructors had sig-nificantly greater reliability than those of the students. Thefirst criterion of the rubric, “Articulates Criteria,” was morereliably scored by instructors with a substantial κ of .69 thanby students with a moderate κ of .58 (t = 2.6). The second cri-terion also revealed a statistically significant difference. For“Cites Indicators of Criteria,” instructors produced more reli-able results, showing a substantial κ of .66, than the students(t = 2.8). For this criterion, the students’ ratings yielded onlya moderate κ of .54. Instructors also were shown to producemore reliable scores for the fourth criterion, “Judges Whetheror Not to Use Source,” as well. This was indicated by a statis-tically significant difference (t = 2.1) between the instructor’sκ for this criterion at .58 and the students’κ at .49. The fourthstatistically significant difference (t = 3.5) appeared when themoderate reliability of the grades assigned by the English 101instructors (k = .50) was compared to the fair reliability ofthe grades assigned by the students (k = .35). There was nostatistically significant difference between the reliability ofthe scores produced by English 101 instructors and English101 students for the third criterion of the rubric, “Links Indi-cators to Examples from Source.” Overall, these significantdifferences signify that English 101 instructors scored studentresponses more reliably than did English 101 students.
The reliability of the scores assigned by NCSU librariansand English 101 students differed in only two statisticallysignificant ways. For the third criterion of the study rubric,“Links Indicators to Examples from Source,” the moder-ate κ statistic of .49 provided by the students’ ratings wassignificantly greater than the fair κ for the librarians’ rat-ings, which was only .24 (t = 5.9). While both librarians andstudents showed moderately reliable scoring for the fourthrubric criterion, “Judges Whether or Not to Use Source,” thelibrarians’ scores (k = .59) were significantly greater thanthe student’s scores (k = .49). The t statistic for this differ-ence was 2.1. There was no significant difference betweenthe reliability of librarians’ scores and the reliability of thestudents’ scores for the first and second rubric criteria andthe grade assigned to student responses. The lack of signif-icant differences between the NCSU librarians and English101 students indicated that neither group produced more reli-able scores than the other. The fact that the two significantdifferences that appeared in the data were split (i.e., one shows
JOURNAL OF THE AMERICAN SOCIETY FOR INFORMATION SCIENCE AND TECHNOLOGY—May 2009 979DOI: 10.1002/asi
the librarians with greater reliability, the other shows the stu-dents with more reliable results) underscores the lack of sub-stantial differences between the scores of these two groups.
There were two statistically significant differencesbetween the reliability of scores provided by external instruc-tion librarians and by external reference librarians. For thefirst criterion of the study rubric, external reference librariansshowed significantly greater reliability (t = 2.8), although thereliability of the external reference librarians on this criterionwas still only fair. For the second criterion of the rubric, exter-nal instruction librarians demonstrated significantly greaterreliability (t = 2.59), but the reliability of both groups showedonly a slight agreement. There were no significant differencesbetween the reliability of the scores provided by externalinstruction librarians and by external reference librariansfor the third and fourth rubric criteria and the final gradesassigned to the student responses. Because only two signif-icant differences were identified between these two groupsand these significant differences indicated greater reliabilityin opposing directions (i.e., one showing the greater relia-bility of external reference librarians and the other showingthe greater reliability of external instruction librarians), thesetwo groups did not appear to provide substantially differentscores for student responses.
The reliability of the scores assigned by NCSU librariansdiffered significantly from the reliability of scores providedby external librarians in four ways. First, the κ for the NCSUlibrarians’ scores for the first criterion in the study rubricshowed a moderate level of agreement (k = .54). The κ forexternal librarians was significantly lower at .18, showingonly slight agreement (t = 11.4). Similarly, the κ for NCSUlibrarians’ scores for the second rubric criterion was a mod-erate .54 while the external librarians showed only slightagreement with a κ of .14. These κ statistics were signif-icantly different (t = 12.6). The t test for the fourth rubriccriterion showed a statistically significant difference (t = 3.2)between the reliability of NCSU librarians’ ratings (k = .59)and those of the external librarians (k = .49). The reliabilityof the grade assigned by the raters also was significantly dif-ferent (t = 6.4), with the NCSU librarians showing moderatereliability with a κ of .41 and the external librarians demon-strating only fair reliability with a κ of .21. Although therewas no significant difference between these two groups forthe third criterion of the study rubric, NCSU librarians clearlyproduced more reliable scores of student responses than didtheir non-NCSU counterparts.
In the same way, the reliability of all ratings for inter-nal raters was significantly greater than that of all ratingsfor external raters. For the first criterion, “Articulates Crite-ria,” the internal raters demonstrated a moderate κ of .59while the external raters provided only slight agreement(t = 29.0). For the second rubric criterion, “Cites Indicatorsof Criteria,” the κ for internal raters was .57. This κ alsois significantly different (t = 30.4) from the external raters(k = .14). Likewise, internal raters produced greater reliabil-ity for the third (t = 12.0) and fourth criteria (t = 4.2). Finally,internal raters yielded moderate levels of agreement (k = .41)
when assigning grades to student response, a significant dif-ference (t = 14.1) from the fair level of agreement providedby external raters (k = .21). The significantly greater levelof agreement among internal raters over external raters wasclearly demonstrated.
Summary of Significant Differences Among RaterGroups Results
This study sought to answer two questions regardingthe reliability of a rubric approach to the assessment ofinformation literacy skills. These are the answers to the sec-ond major research question posed by the study: Can ratersprovide scores that are consistent across groups?
Several statistically significant differences were discov-ered by comparing rater groups:
• In nearly all areas, English 101 instructors achieved higherlevels of reliability than did NCSU librarians. The excep-tion to this is the fourth criterion of the study rubric, “JudgesWhether or Not to Use Source.” In this area, there was nostatistically significant difference between the reliability ofscores assigned by the English 101 instructors and those bythe NCSU librarians.
• In nearly all areas, the English 101 instructors producedhigher levels of reliability than did the English 101 students.However, for the third rubric criterion, “Links Indicators toExamples from Source,” there was no statistically significantdifference in the reliability of their scores.
• In most areas, there was no statistically significant differencebetween the reliabilities of NCSU librarians and those of theEnglish 101 students. However, English 101 students showedhigher reliability for the third criterion of the rubric, “LinksIndicators to Examples from Source.” On the other hand,NCSU librarians achieved higher levels of reliability for thefourth criterion on the rubric, “Judges Whether or Not to UseSource.”
• In all areas of the rubric and in the total grade assigned tostudent responses, internal raters demonstrated higher levelsof reliability than did external raters.
• In most areas, there was no statistically significant differencebetween the reliabilities of external instruction librarians andthose of external reference librarians.
• In nearly all areas, NCSU librarians achieved higher levelsof reliability than did external librarians. The one excep-tion to this is the third rubric criterion, “Links Indicators toExamples from Source.” In this area, there was no statisti-cally significant difference between the reliability of scoresassigned by the NCSU librarians and those by the externallibrarians.
In summary, English 101 instructors produced signif-icantly higher reliabilities than did NCSU librarians andEnglish 101 students. In fact, few significant differences werediscovered between the levels of agreement exhibited by theNCSU librarians and English 101 students. However, NCSUlibrarians produced much higher levels of agreement than didexternal instruction librarians and external reference librar-ians. Overall, internal raters produced significantly higherlevels of agreement than did external raters.
980 JOURNAL OF THE AMERICAN SOCIETY FOR INFORMATION SCIENCE AND TECHNOLOGY—May 2009DOI: 10.1002/asi

Intrarater Reliability Differences Throughout theScoring Process
In this study, the intrarater reliability of all raters increasedas they scored the 75 student responses. When comparingthe reliabilities of the first third, middle third, and last thirdof student responses using a Bonferroni adjustment, a t testover 2.5 indicates a significant difference. In this study, thescores raters assigned to Responses 26 to 50 were more reli-able than the scores they assigned for Responses 1 to 25(t = 3.03). Additionally, the scores assigned to Responses 51to 75 were more reliable than those assigned to Responses 26to 50 (t = 3.03). Note that because the groups of responsescompared in this test were scored by the same raters, these t-test scores are statistically conservative. As a result, a greaterdifference might actually exist than what these t scores indi-cate. Because of SE increases when only 25 responses areexamined (rather than the full 75), analysis of the smallerrater groups was not statistically feasible.
Discussion
In this study, different rater groups arrived at varying levelsof agreement within their groups. For example, the English101 instructors achieved the greatest levels of agreementwithin a group, levels that were significantly higher thanthose of any other five original rater groups. The English 101instructors were the only one of five original rater groupsto attain moderate or substantial levels of agreement acrossall areas of the study rubric and the grade assigned to eachof the student responses. Although definitive reasons for thisgroup’s success must await future research, it seems likelythat the English 101 instructors’ familiarity with rubrics usedto assess writing may have increased their ability to come toagreement using rubrics to assess information literacy. It alsois possible that the English 101 instructors, through educa-tional background or personal experience, were familiar withoutcomes-based assessment. As teachers, they also are likelyto value the ability to produce consistent scores for complexartifacts of student learning.
English 101 students also produced moderate levels ofagreement across all areas of the research rubric. This levelof consistency might be attributed to previous experienceswith rubrics. Although it is probable that the study rubricwas the students’ first experience with a rubric designed toassess information literacy skills, they may have transferredskills acquired from earlier rubric experiences in other subjectareas to their activities in this study.
As a group, NCSU librarians produced moderately con-sistent scores in most areas of the assessment. Interestingly,there was little significant difference between the levels ofreliability achieved by NCSU librarians and by English 101students; however, in two areas, students and NCSU librari-ans differed significantly. For the fourth criterion of the rubric,“Judges Whether or Not to Use the Source,” librarians pro-duced greater levels of agreement than did the students. Forthe third criterion of the rubric, “Links Indicators to Examplesfrom Source,” NCSU librarians achieved less consistency
than did the students. The reason that NCSU librarians cameto only a fair level of agreement on this criterion is unclearand should be investigated in future research. Aside fromthis weak area, the NCSU librarians demonstrated far greaterreliabilities within their rater group than did the externalinstruction librarians and the external reference librarians.
External librarians (both instruction librarians and ref-erence librarians) could not produce consistent scoring ofstudent responses in this study, and there was no statisti-cally significant difference between the overall performanceof external reference librarians and external instruction librar-ians. These raters’ professional experiences as librarians didnot appear to be as important as the fact that they were exter-nal to the assessment environment and, as a result, did notreceive training. Taken as a group, external librarians wereunable to achieve more than fair levels of agreement on allareas of the assessment, with the exception of the fourth rubriccriterion, “Judges Whether or Not to Use Source” (For thisfourth criterion, external librarians achieved moderate levelsof agreement, but this does not indicate a particular level ofexpertise in this area. All rater groups were able to achievea moderate level of agreement for this criterion.) Overall,the external librarians achieved significantly lower levels ofreliability than did NCSU librarians and internal raters as awhole.
Conclusion
Although instructors and students exhibit a level of pro-ficiency in the use of rubrics, this study demonstrates thatlibrarians may be less proficient; however, this study indicatesthat internal librarians can be trained to become moder-ately consistent raters. It may be that external librarians,provided with additional training, could become consistentraters as well. Additional rubric training for external ratersshould teach (a) major concepts underlying outcomes-basedassessment, (b) differences between analytic and holisticapproaches to assessment, (c) strategies for comprehendingrubric content, (d) techniques for reconciling one’s personalbeliefs with rubric assumptions, (e) methods for tolerat-ing difficulties in student learning artifacts, and (f) waysto understand library context and campus culture (Oakleaf,2007, p. 38).
This study also demonstrates that Maki’s (2004, p. 126)model of calibration is a useful training tool for preparinglibrarians to become proficient rubric raters. In addition,the study highlights two suggestions for using the six-stepMaki calibration model. First, the researcher in this studymodeled rubric use by employing “think aloud” techniques.The researcher began the rubric training session by talkingthrough the application of the study rubric to assess fiveanchor responses. This prompted discussion among ratersand brought norming issues out early in the calibration pro-cess. This initial step in the rater calibration process appearedto expedite rater readiness. Second, Maki’s model calls fortwo to three rounds of rater practice scoring and discussion(p. 127). In this study, two rounds were used before raters felt
JOURNAL OF THE AMERICAN SOCIETY FOR INFORMATION SCIENCE AND TECHNOLOGY—May 2009 981DOI: 10.1002/asi
confident about independently scoring student responses. Inhindsight, it is possible that a third or even fourth round mayhave been advisable. It also may be that multiple calibrationsessions should be required for librarians who have spentlittle or no time using rubrics in the past.
Although this study indicates that librarians require train-ing to consistently and accurately use rubrics, the benefitsassociated with rubric assessment far outweigh the time spentin training. Indeed, 96% of the raters stated that they believerubrics have great instructional value.All internal raters statedthat they could envision using rubrics to improve informa-tion literacy instruction, and all but 1 external rater agreed(Oakleaf, 2006, p. 377).
Recommendations for Future Research
Because this study is the first of its kind in the area ofinformation literacy instruction, the findings described in thisstudy await testing and confirmation by future researchers.Besides replicating this research in other environments,several areas of research should be explored. First, futureresearch could determine what characteristics made English101 instructors the most successful raters in this study. Char-acteristics might include previous experience with rubrics,familiarity with outcomes-based assessment, or tolerance ofminor errors in student work. Future studies could examinethese characteristics by investigating other faculty popula-tions, including library and information science educators.In addition, future researchers could explore the effects ofdifferent uses of rater training. For instance, the study designcould be altered to compare the reliability of scores providedby internal librarians who participated in training and thosewho did not. In a similar vein, future research could investi-gate the effects of different types and levels of rater training inexternal librarian populations. Finally, future investigationscould include evaluations of a wide variety of performanceassessments, including student bibliographies, research jour-nals, and portfolios.All these areas of additional research willhelp build a strong foundation for future uses of informationliteracy assessment rubrics.
References
Andrade, H.G. (2000). Using rubrics to promote thinking and learning.Educational Leadership, 57(5), 13–18.
Arter, J., & McTighe, J. (2000). Scoring rubrics in the classroom: Usingperformance criteria for assessing and improving student performance.Thousand Oaks, CA: Corwin Press.
Association of College and Research Libraries. (2000). Information literacycompetency standards for higher education. Retrieved January 1, 2009,from http://www.ala.org/ala/mgrps/div/acr/standards/informationliteracycompetency.cfm
Bernier, R. (2004). Making yourself indispensible by helping teachers createrubrics. CSLA Journal, 27(2), 24–25.
Bresciani, M.J., Zelna, C.L., & Anderson, J.A. (2004). Assessing stu-dent learning and development: A handbook for practitioners. NationalAssociation of Student Personnel Administrators.
Buchanan, L.E. (2003). Assessing liberal arts classes. In E.F. Avery (Ed.),Assessing student learning outcomes for information literacy instructionin academic libraries (pp. 68–73). Chicago: Association of College andResearch Libraries.
Callison, D. (2000). Rubrics. School Library Media Activities Monthly,17(2), 34–36, 42.
Choinski, E., Mark, A.E., & Murphey, M. (2003). Assessment with rubrics:An efficient and objective means of assessing student outcomes in aninformation resources class. Portal: Libraries and the Academy, 3(4),563–575.
Colton, D.A. (1997). Reliability issues with performance assessments:A collection of papers. Iowa City, IA: ACT.
D’Angelo, B.J. (2001). Integrating and assessing information competenciesin a gateway course. Reference Services Review, 29(4), 282–293.
Emmons, M., & Martin, W. (2002). Engaging conversation: Evaluatingthe contribution of library instruction to the quality of student research.College and Research Libraries, 63(6), 545–560.
Franks, D. (2003). Using rubrics to assess information literacy attainmentin a community college education class. In E.F. Avery (Ed.), Assessingstudent learning outcomes for information literacy instruction in academiclibraries (pp. 132–147). Chicago: Association of College and ResearchLibraries.
Gauss, N., & Kinkema, K. (2003). Webliography assignment for a lifetimewellness class. In E.F. Avery (Ed.), Assessing student learning outcomesfor information literacy instruction in academic libraries (pp. 161–171).Chicago: Association of College and Research Libraries.
Hafner, J.C. (2003). Quantitative analysis of the rubric as an assessment tool:An empirical study of student peer-group rating. International Journal ofScience Education, 25(12), 1509–1528.
Hutchins, E.O. (2003). Assessing student learning outcomes in political sci-ence classes. In E.F. Avery (Ed.), Assessing student learning outcomesfor information literacy instruction in academic libraries (pp. 172–184).Chicago: Association of College and Research Libraries.
Kivel, A. (2003). Institutionalizing a graduation requirement. In E.F. Avery(Ed.), Assessing student learning outcomes for information literacyinstruction in academic libraries (pp. 192–200). Chicago: Association ofCollege and Research Libraries.
Knight, L.A. (2006). Using rubrics to assess information literacy. ReferenceServices Review, 34(1), 43–55.
Kobritz, B. (2003). Information literacy in community college communica-tions courses. In E.F. Avery (Ed.), Assessing student learning outcomesfor information literacy instruction in academic libraries (pp. 207–215).Chicago: Association of College and Research Libraries.
Landis, J.R., & Koch, G.G. (1977). The measure of observer agreement forcategorical data. Biometrics, 33, 159–174.
Maki, P.L. (2004). Assessing for learning: Building a sustainable commit-ment across the institution. Sterling, VA: Stylus.
Mertler, C.A. (2001). Designing scoring rubrics for your classroom. PracticalAssessment Research and Evaluation, 7(25). Retrieved January 1, 2009,from http://pareonline.net/getvn.asp?v=7&n=25
Merz, L.H., & Mark, B.L. (2002). Clip note #32: Assessment in col-lege library instruction programs. Chicago: Association of College andResearch Libraries.
Moskal, B.M. (2000). Scoring rubrics: What, when, and how? PracticalAssessment Research and Evaluation, 7(3). Retrieved January 1, 2009,from http:// pareonline.net/getvn.asp?v=7&n=3
Moskal, B.M., & Leydens, J.A. (2000). Scoring rubric development: Valid-ity and reliability. Practical Assessment Research and Evaluation, 7(10).Retrieved January 1, 2009, from http://pareonline.net/getvn.asp?v=7&n=10
Nitko, A.J. (2004). Educational assessment of students. Upper Saddle River,NJ: Pearson Education.
Oakleaf, M.J. (2006). Assessing information literacy instruction: Arubric approach (Doctoral dissertation, University of North Carolina atChapel Hill, 2006). Dissertation Abstracts International, Proquest No.1095444541.
Oakleaf, M.J. (2007). Using rubrics to collect evidence for decision-making: What do librarians need to know? Evidence Based Library andInformation Practice, 2(3), 27–42.
Oakleaf, M.J. (2008). Dangers and opportunities:A conceptual map of infor-mation literacy assessment approaches. Portal: Libraries and theAcademy,8(3), 233–253.
982 JOURNAL OF THE AMERICAN SOCIETY FOR INFORMATION SCIENCE AND TECHNOLOGY—May 2009DOI: 10.1002/asi
Oakleaf, M.J. (2009). The information literacy instruction assessment cycle:A conceptual framework. Journal of Documentation, 65(4).
Pausch, L.M., & Popp, M.P. (1997, April). Assessment of information lit-eracy: Lessons from the higher education assessment movement. Paperpresented at the meeting of the Association of College and ResearchLibraries, Nashville, TN.
Popham, W.J. (2003). Test better, teach better: The instructional role ofassessment. Alexandria, VA: Association for Supervision and CurriculumDevelopment.
Prus, J., & Johnson, R. (1994). A critical review of student assessmentoptions. New Directions for Community Colleges, 88, 69–83.
Rockman, I.F. (2002). Rubrics for assessing information competencein the California State University. Retrieved April 10, 2005, fromhttp://www.calstate.edu/LS/1_rubric.doc
SAS. (2006). Compute estimates and tests of agreement among multipleraters. Retrieved September 1, 2008, from http://support.sas.com/kb/25/006.html
Smalley, T.N. (2003). Bay Area Community Colleges information com-petency assessment project. Retrieved November 17, 2003, from http://www.topsy.org/ICAP/ICAProject.html
Stemler, S.E. (2004). A comparison of consensus, consistency, and measure-ment approaches to estimating interrater reliability. Practical Assessment,Research, and Evaluation, 9(4). Retrieved January 1, 2009, fromhttp://pareonline. net/getvn.asp?v=9&n=4
Stevens, D.D., & Levi, A. (2005). Introduction to rubrics: An assess-ment tool to save grading time, convey effective feedback, and promotestudent learning. Sterling, VA: Stylus.
Tierney, R., & Simon, M. (2004). What’s still wrong with rubrics: Focusingon the consistency of performance criteria across scales levels. PracticalAssessment Research and Evaluation, 9(2). Retrieved January 1, 2009,from http://pareonline.net/getvn.asp?v=9&n=2
Warmkessel, M.M. (2003). Assessing abilities of freshmen to reconcile newknowledge with prior knowledge. In E.F. Avery (Ed.), Assessing stu-dent learning outcomes for information literacy instruction in academiclibraries (pp. 249–256). Chicago: Association of College and ResearchLibraries.
Wiggins, G. (1996). Creating tests worth taking. In R.E. Blum & J. A. Arter(Eds.), A handbook for student performance in an era of restructur-ing (pp. V-6:1–V-6:9). Alexandria, VA: Association for Supervision andCurriculum Development.
JOURNAL OF THE AMERICAN SOCIETY FOR INFORMATION SCIENCE AND TECHNOLOGY—May 2009 983DOI: 10.1002/asi