using self-organizing map and clustering to investigate ... · bergner and mcnamara (2016) used a...
TRANSCRIPT
Article
Using Self-OrganizingMap and Clustering toInvestigate Problem-Solving Patterns in theMassive OpenOnline Course: AnExploratory Study
Youngjin Lee1
Abstract
This study investigated whether clustering can identify different groups of students
enrolled in a massive open online course (MOOC). This study applied self-organizing
map and hierarchical clustering algorithms to the log files of a physics MOOC
capturing how students solved weekly homework and quiz problems to identify
clusters of students showing similar problem-solving patterns. The usefulness of
the identified clusters was verified by examining various characteristics of students
such as number of problems students attempted to solve, weekly and daily problem
completion percentages, and whether they earned a course certificate. The findings
of this study suggest that the clustering technique utilizing self-organizing map and
hierarchical clustering algorithms in tandem can be a useful exploratory data analysis
tool that can help MOOC instructors identify similar students based on a large
number of variables and examine their characteristics from multiple perspectives.
Keywords
massive open online course, Educational Data Mining, log file analysis, self-
organizing map, clustering
Journal of Educational Computing
Research
0(0) 1–20
! The Author(s) 2018
Reprints and permissions:
sagepub.com/journalsPermissions.nav
DOI: 10.1177/0735633117753364
journals.sagepub.com/home/jec
1University of Kansas, Lawrence, KS, USA
Corresponding Author:
Youngjin Lee, University of Kansas, 1122 W. Campus Rd., Lawrence, KS 66045-3101, USA.
Email: [email protected]

Introduction
Since the first large-scale massive open online course (MOOC) was launched byCoursera in 2011, the number of people enrolled in MOOCs are increasing everyyear. According to Class Central (2015), more than 35 million students signed upfor at least one MOOC in 2015. One important characteristic of an MOOCis that students can be enrolled in the course anytime, and they are not requiredto complete all learning activities available in the course. Due to this opennessand flexibility, the ways in which students are engaged in learning in MOOCsare quite different, compared to traditional learning environments such as face-to-face or closed online courses in which all students are expected to completethe same set of learning activities during a fixed time period. Most notably, alarge number of students enrolled in MOOCs do not complete the course.Previous studies have found that the completion rate of MOOC students ismuch lower than that of face-to-face or closed online courses (Breslow et al.,2013; Ho et al., 2014; Jordan, 2014, 2015).
Another important characteristic of MOOCs, as a computer-based learningenvironment, is that they can capture in the log files what students are doingwithout interrupting their learning processes. Since information recorded in thelog files allows for reconstruction of how students were using various learningresources, log file analysis opens up a new avenue for understanding how stu-dents learn in the computer-based learning environment. By carefully analyzinglog files, it is possible to quantitatively study the learning behavior of studentsand the usefulness of computer-based learning contents. As a result, EducationalData Mining (EDM) is emerging as a new, exciting field of study.
According to Baker (2010), research in EDM falls into five general categories:prediction, clustering, relationship building, discovery with a model, and distil-lation of data for human judgment. While the first three categories are univer-sally acknowledged by all data mining researchers, the fourth and the fifthcategories are the ones investigated primarily by EDM researchers. The goalof prediction is to develop a quantitative model that can infer a single aspect ofthe data (e.g., whether MOOC students will earn a course certificate) from otheraspects of the data (e.g., how MOOC students solved weekly homework prob-lems). In clustering, the goal is to identify a set of clusters or groups of datapoints showing similar characteristics (e.g., finding MOOC students showingsimilar problem-solving patterns over the semester). Relationship mining triesto discover frequent patterns among (usually a large number of) variables in thedata. In EDM, relationship mining can be used to identify the sequence ofcourses or pedagogical strategies that can improve the learning outcome of stu-dents. In discovery with a model, an EDM model developed via prediction orclustering is then used as a component of another analysis such as prediction orrelationship mining. Distillation of data for human judgment is an approachthat aims to extract information from a large amount of data in order to helphuman users to make a better inference about the phenomenon of interest when
2 Journal of Educational Computing Research 0(0)

it is beyond the scope of fully automated data mining methods. Using theseapproaches, EDM researchers are investigating various educational issues andproblems such as providing feedback for instructors and students, predictinglearning performance of students, developing cognitive models of how studentslearn specific knowledge and skills, detecting undesirable behaviors of students,or grouping students according to their characteristics (Pena-Ayala, 2014;Romero & Ventura, 2010).
This exploratory study has two objectives. The first objective is to investigatewhether a clustering technique applied to fine-grained learner behaviors canidentify different groups of students enrolled in an MOOC. While previousstudies summarized in the literature review below aggregated learner behaviorsover the entire semester, this study performed a clustering analysis employingself-organizing map (SOM) and hierarchical clustering algorithms on the dailyand weekly problem-solving performance of students. Using SOM and hierarch-ical clustering algorithms together allows for easier exploration of complex,multidimensional log file data, which can lead to better understanding of pro-blem-solving patterns of students in the identified clusters. The second objectiveis to examine how the problem-solving patterns of students in the identifiedclusters are related to the completion rate of the MOOC. The rest of the articleis organized as follows. The Literature Review section summarizes previousresearch on completion rate of MOOCs, and clustering and SOM analysis con-ducted on the log files of computer-based learning environments. The Methodsection describes the log files of an MOOC analyzed, and SOM and hierarchicalclustering algorithms used in this study. The Results section describes the pro-blem-solving patterns of students in the identified clusters of students, followedby discussions and limitations of the study.
Literature Review
Completion Rate of MOOCs
Breslow et al. (2013) investigated the completion rate of 154,763 students whosigned up for a physics MOOC in Spring 2012. They found that 15% of regis-trants attempted to complete the first homework assignment, 6% of them passedthe midterm exam, and only 5% of them were able to complete the course andearned the course certificate. Ho et al. (2014) examined the completion rate ofstudents who were enrolled in seventeen HavardX and MITx MOOCs that wereoffered between Fall 2012 and Summer 2013. They found that about 5% ofregistrants were able to earn the course certificate, 4% of them explored halfor more of course materials without certifications, 56% of them viewed less thanhalf of course materials without certifications, and 35% of them were neverengaged in learning. Jordan (2015) surveyed 129 MOOCs having a varyinglength of study and a different grading scheme to examine the completion rate
Lee 3

of MOOC registrants. She found that the completion rate of MOOCs variedfrom 0.7% to 52.1% with median of 12.6%, depending on the length of course(shorter ones having higher completion rates), start date (more recent courseshaving higher completion rates), and assessment type (courses using auto grad-ing only having higher completion rates). In response to MOOC critics who areconcerned with low completion rates, Reich (2014) argues that it is important totake into account the intention of students when we examine the completion rateof MOOCs. His analysis of MOOC data from nine HarvardX courses, whichhad over 290,000 registrants and 79,000 survey responses, showed that 58% ofregistrants intended to earn a certificate, 25% of them to audit, 3% of them tobrowse, and 14% of them were unsure about their intention. He found that 22%of registrants who intended to complete a course earned the certificate, whereasonly 6% of registrants who intended to browse a course earned the certificate.
Clustering Analysis on MOOCs
Researchers conducted a clustering analysis on the clickstream MOOC data inorder to identify groups of students showing similar learning behaviors. Kizilcec,Piech, and Schneider (2013) examined the patterns of engagement of studentsenrolled in three computer science MOOCs offered on the Coursera platform.They found the four distinct patterns of engagement, completing, auditing, dis-engaging, and sampling, when they applied a clustering technique to the click-stream data capturing how MOOC students watched video lectures and solvedsummative assessment problems. Khalil and Ebner (2017) compared the engage-ment patterns of university students to those of nonuniversity students enrolledin the MOOC by conducting a clustering analysis on the frequency of reading,writing, playing videos, and quiz attempts. Liu, Brown, Lynch, Barnes, Baker,Bergner and McNamara (2016) used a hierarchical clustering algorithm to inves-tigate the relationship between engagement patterns of MOOC students andtheir background such as nationality. Ferguson and Clow (2016) investigatedwhether the four engagement patterns identified in Kizilcec et al. (2013)’s studycan be replicated in the MOOCs that are based on the socioconstructivist peda-gogy emphasizing discussions and formative assessment problems, rather thanvideo lectures and summative assessment problems. Rodrigues et al. (2016) usedhierarchical and k-means clustering algorithms to examine how students useddiscussion forums in the MOOC. Ezen-Can, Boyer, Kellogg, and Booth (2015)applied a k-medoids clustering algorithm to group similar posts in the discussionforum of an MOOC and compared the resulting clusters to the annotationscreated by human experts. Li, Kidzinski, Jermann, and Dillenbourg (2015)applied clustering to user interactions to examine how students watchedMOOC videos (e.g., pausing, forward and backward seeking, and speed chan-ging), and the relationship between user interactions and perceived difficulty ofvideos, video revisiting behaviors, and student performance on the course
4 Journal of Educational Computing Research 0(0)

assignments. Balint, Teodorescu, Colvin, Choi, and Pritchard (2017) applied aspectral clustering technique to various performance-based measurements (e.g.,fraction of correct answers to assessment problems, IRT skill parameter, etc.) togroup students based on their ability and examined how students in each abilitygroup used various learning resources, such as text, worked examples, video withand without human presence, computer simulation, discussion board, calendar,and syllabus, available in the MOOC.
SOM in EDM Research
Literature on applying SOM to EDM is sparse, compared to information retrie-val and traditional data mining. Only a handful of published studies employingSOM in the context of EDM exist. Merelo-Gervos et al. (2004) utilized SOM tocreate a community map visualizing clusters of community members havingsimilar interests determined by the URLs of web-based resources they used.Durfee, Schneberger, and Amoroso (2007) applied factor analysis and SOMto examine the relationship between student characteristics, such as demograph-ics, computing skills, expertise in using computer software, and self-efficacy, andtheir adoption and use of computer-based training and assessment software. Lee(2007) used SOM, k-means clustering, and principal component analysis (PCA)to assess the mastery level of students who are learning in an integrated onlinelearning environment. He found that applying PCA to the data preprocessedwith SOM and k-means clustering algorithms performed much better than theconventional PCA-only approach. Recently, Ahmad, Ishak, Alias, andMohamad (2015) used SOM to analyze the learning activities of 19 studentstaking a computer science course. The results of their analysis suggest that SOMcan identify clusters of students showing similar learning behaviors in terms ofthe websites and the course materials they visited and downloaded.
Method
Data Set
This study conducted a clustering analysis utilizing SOM and hierarchical clus-tering algorithms on the log files that captured how 4,337 students solved weeklyhomework and quiz problems while they were enrolled in edX 8.MReVxMechanics Review offered by MIT in Summer 2014 semester (hereafter,8.MReVx). 8.MReVx is designed to provide a comprehensive overviewof Newtonian mechanics and greater expertise in problem-solving. It providesvarious learning resources, such as e-texts, videos, discussion boards, wiki,checkpoints, weekly homework problems, quizzes, midterm exam, and finalexam, to help students learn Newtonian mechanics concepts. In 8.MReVx, theachievement of students was determined by checkpoints (8%), homework
Lee 5
problems (34%), quizzes (36%), midterm exam (7%), and final exam (16%).Students who scored more than 60% of the maximum possible points received acourse certificate. Checkpoints are easy formative assessment problemsembedded in the e-text of the MOOC, whereas homework and quiz are moredifficult summative assessment problems assigned each week during the 12-weeklong semester. Students were given 7 days to complete checkpoints, homework,and quiz problems that were due on Sunday at midnight every week. For furtherexploration of the course structure and the problems students solved in8.MReVx, visit the archived course at https://courses.edx.org/courses/MITx/8.MReVx/2T2014/course/.
Of these learning activities, this study focused on solving weekly homeworkand quiz problems because of the following two reasons. First, these summativeassessment problems could have incentivized students to exert more effortsbecause they were more important than checkpoint problems in getting acourse certificate. Second, midterm and final exam scores were excluded becausethis study was conducted as an exploratory data analysis that aimed to identifyvariables that may be able to predict the midterm and the final exam scores ofstudents. More specifically, this study focused on (a) how many weekly home-work and quiz problems students tried to solve throughout the semester (Ntotal);(b) the daily problem completion percentage (DPCP) 6, 5, 4, 3, 2, and 1 day(s)before and on due date; and (c) the weekly problem completion percentage(WPCP) at Weeks 1, 2, 3, 4, 5, 6, and 7. WPCPs beyond Week 7 were notincluded in the analysis because many students solved few problems once theyhad accumulated enough points for the course certificate around Week 7. These15 variables (Ntotal, DPCP6 – DPCPdue, WPCP1 – WPCP7) were used to rep-resent the problem-solving pattern of students in the data set analyzed in thisstudy.
Finding Clusters of Students Using SOM and HierarchicalClustering Algorithms
SOM is an artificial neural network that is designed to map a multidimensionaldata (e.g., Ntotal, DPCP6 – DPCPdue, WPCP1 – WPCP7) to an X-Y plane(Haykin, 1999). SOM is different from other clustering algorithms in the respectthat it places similar data points (e.g., MOOC students showing similar learningbehaviors) close together in the X-Y plane, allowing for easy visualization andexploration of complex data. This study used an open source R package calledkohonen (Wehrens & Buydens, 2007) to create an SOM of students enrolled in8.MReVx, based on how they solved weekly homework and quiz problems.
After students showing similar problem-solving patterns are placed nearby onthe SOM, a hierarchical clustering algorithm can be applied to produce clustersof students. Selecting a number of clusters is notoriously problematic withouta priori domain knowledge. As a number of clusters in the SOM increases,
6 Journal of Educational Computing Research 0(0)

students assigned in each cluster become more homogenous in terms of theirproblem-solving patterns. However, the SOM with too many clusters wouldhave a less practical importance because it is difficult to interpret the meaningof resulting SOM clusters. In order to determine an optimal number of clustersin the SOM, elbow method and Calinski–Harabasz (CH) index were utilized inthis study. Elbow method is the most frequently used heuristics in determiningan optimal number of clusters or factors in the clustering and factor analysis.It looks for an elbow point in the plot of total within sum of squares (WSS)versus number of clusters (k) (Antonenko, Toy, & Niederhauser, 2012).CH index is a ratio of between-cluster variance to total within-cluster vari-ance, which is maximized at an optimal number of clusters (Calinski &Harabasz, 1974). The plot of WSS versus number of clusters (k) suggests anelbow point at k¼ 4, which corresponds to the number of clusters at which CHindex is maximized (see Figure 1(b)). Based on the agreement between elbowmethod and CH index, an SOM with four clusters was created as shown inFigure 1(a).
Results
Fraction of Certificate Earners
This study found that only 434 students, out of 4,337 students who attempted tosolve at least one weekly homework or quiz problems, were able to get a coursecertificate at the end of the semester. This result is in line with previous studiesreporting a completion percentage lower than 10% (Breslow et al., 2013; Jordan,2014, 2015). In addition, we found that certificate and noncertificate earnerswere concentrated in specific SOM clusters. Moreover, 99.94% of students inCluster 1 did not get a course certificate, whereas 91.24% and 94.08% of stu-dents in Cluster 3 and Cluster 4 got a certificate. Number of noncertificateearners in Cluster 1 (N¼ 3,687) accounts for 94% of all noncertificate earnersin 8.MReVx. Unlike the other clusters that were quite homogeneous in terms ofstudent composition, Cluster 2 was found to be a mixture of certificate andnoncertificate earners; it consists of 148 students who earned a course certificateand 194 students who did not (see Figure 2).
When a hierarchical clustering algorithm was directly applied to the original15 variables, rather than SOM-transformed variables, it is much more difficult tovisualize the resulting clusters. Figure 3(a) is a cluster dendrogram created fromthe original 15 variables capturing how randomly selected 434 students solvedweekly homework and quiz problems. Although the cluster dendrogramincludes only 10% of the data (it would be nearly impossible to visualize adendrogram from the full data), it is already much more difficult to see theclusters, compared to the SOM created from the full data shown in Figure1(a). More importantly, the clusters obtained from the original 15 variables
Lee 7

appear to be less meaningful. Figure 3(b) shows the percentage of students whodid and did not earn a course certificate in each cluster created from the original15 variables. In this case, Cluster 1 and Cluster 2 exclusively contain studentswho did not get a course certificate, but Cluster 3 and Cluster 4 have a mixture
Figure 1. (a) SOM of problem-solving patterns of students enrolled in 8.MReVx. Numbers
in the parentheses indicate the number of students in each cluster in the SOM. (b) WSS
and CH index vs. number of clusters (k). To help make WSS and CH index comparable,
standardized scores were used. WSS¼within sum of squares; CH¼Calinski-Harabasz.
8 Journal of Educational Computing Research 0(0)

of certificate and noncertificate earners. The hierarchical clustering withoutSOM was not able to identify a cluster of students who earned a course certifi-cate. Since the SOM-based clustering yielded more informative clusters, which isin line with what Vesanto and Alhoniemi (2000) had found in their research, thesubsequent analyses were focused on the SOM-based clustering approach.
In order to better understand the students in the SOM-based Cluster 2, theirsuccess in getting a course certificate was fit to a logistic regression model withtotal number of problems (Ntotal), daily problem completion percentages(DPCP6 – DPCPdu), and weekly problem completion percentages (WPCP1 –WPCP7) as predictor variables. Table 1 summarizes the logistic regression coef-ficients, their standard errors, and p values. Not surprisingly, certificate earnersin Cluster 2 tried to solve more problems than their peers who did not get acourse certificate. When all the other predictor variables were held constant attheir mean values, solving one more weekly homework or quiz problem (Ntotal)increases the log odds for getting a course certificate by 0.006 (p¼ .005).Similarly, certificate earners in Cluster 2 showed a much higher problem com-pletion percentage on due date, compared to Cluster 2 students who did not geta course certificate; 1% increase in the problem completion percentage on duedate (DPCPdue) increases the log odds for getting a course certificate by 0.384(p< .0001). Also, the logistic regression analysis suggests that students in Cluster
Figure 2. Percentage of students who did and did not earn a course certificate. Numbers
indicate the size of each cluster.
Lee 9

Figure 3. (a) Cluster dendrogram created from a randomly selected 10% of original data.
Red rectangles indicate the four clusters identified. (b) Percentage of students who did and
did not earn a course certificate. Numbers indicate the size of each cluster created from
the original 15 variables.
10 Journal of Educational Computing Research 0(0)

2 who solved more homework and quiz problems early have a higher chance toget a course certificate; 1 point increase in the problem completion percentagefive (DPCP5) and 4 days before due date (DPCP4) are associated with theincreased log odds for getting a course certificate by 0.425 and 0.242, respect-ively. Interestingly, the log odds for getting a course certificate decrease slightlywhen the weekly problem completion percentages at Week 1 (WPCP1) or 2(WPCP2) increases. It may indicate that students in Cluster 2 who did not geta course certificate tried little bit harder than their successful peers when thecourse contents were easier early in the semester. However, these effects are notas strong as the other significant predictors, such as DPCP5, DPCP4, andDPCPdue, as indicated by the magnitude of the regression coefficients.
Number of Problems Students Attempted to Solve
As shown in Figure 4, students in Cluster 1 tried to solvemuch fewer problems thanstudents in the other clusters. The median of number of problems students inCluster 1 attempted to solve was just 17. Considering the fact that 99.94% ofstudents in Cluster 1 did not earn a course certificate, it is not a surprising result.On the other hand, students in Cluster 3 and Cluster 4 tried to solve a comparablenumber of problems. Themedians of number of problems students in Cluster 3 and
Table 1. Result of Logistic Regression Analysis on the Problem-Solving
Patterns of Students in Cluster 2.
Variable Estimate Standard error p
Ntotal 0.006 0.002 .005
DPCP6 0.157 0.107 .143
DPCP5 0.425 0.142 .003
DPCP4 0.242 0.112 .031
DPCP3 0.112 0.086 .156
DPCP2 �0.135 0.072 .061
DPCP1 �0.008 0.043 .859
DPCPdue 0.384 0.082 <.0001
WPCP1 �0.031 0.012 .011
WPCP2 �0.076 0.016 <.0001
WPCP3 0.001 0.011 .896
WPCP4 �0.001 0.011 .320
WPCP5 �0.001 0.010 .898
WPCP6 �0.007 0.010 .498
WPCP7 0.005 0.007 .489
Bold values denote the significant p- values, highlighting the predictors.
Lee 11

Cluster 4 tried to solve were 810 and 883, respectively. Students in Cluster 2 did nottry to solve asmany problems as students inCluster 3 andCluster 4.However, thesestudents tried to solve much more problems (median¼ 576.5) than students inCluster 1 (median¼ 17), indicating that these students exerted much more effortsto earn a course certificate than students in Cluster 1 who appeared to have quicklydropped out of the course early in the semester.
When students in Cluster 2 are divided into two groups, those who didand did not get a course certificate, their difference becomes much clearer (seeFigure 5). As expected, Cluster 2 students who got a course certificate solvedmuch more problems (median¼ 751.5) than students who did not (med-ian¼ 475.0). Interestingly, Cluster 2 students who did not get a course certificatesolved much more weekly homework and quiz problems, compared to studentsin Cluster 1. In other words, although these students may look similar in termsof their success in getting a course certificate, noncertificate earners in Cluster 2exerted much more efforts (especially during the first 3 weeks of the semester asexplained later) than students in Cluster 1 who dropped out of the course early.
Daily Problem Completion Percentages
Since students were given 7 days to complete the weekly homework and quizproblems, we examined how their problem completion percentage changesduring the 1-week assignment cycle. Students in Cluster 3 and Cluster 4 are similar
Figure 4. Density plots of number of problems students in each cluster tried to solve
throughout the semester.
12 Journal of Educational Computing Research 0(0)

in the respect that majority of them were able to successfully complete the course;91.24% and 94.08% of students in Cluster 3 and Cluster 4 got a course certificateat the end of the semester (see Figure 2). However, the difference lies in when theystarted working on the homework and quiz problems during the week. On aver-age, students in Cluster 4 were able to complete about 50% of their weekly home-work and quiz problems 6 days before the due date, which is, on average, whatstudents in Cluster 3 were able to achieve by the due date (see Figure 6).
Students in Cluster 3 seem to have allocated their efforts evenly throughoutthe week, resulting in a constant slop in their problem completion percentageplot as shown in Figure 6. On the other hand, students in Cluster 2 seemed tohave exerted more efforts as the due date came closer, which is shown as a sharpincrease in the completion percentage near the due date in Figure 6. However,these students did not have enough time to complete as many problems as stu-dents in Cluster 3 and Cluster 4 probably because they started working on theirproblems too late during the week. As a result, on average, students in Cluster 2ended up with completing less than 40% of the assigned homework and quizproblems by the due date.
Weekly Problem Completion Percentages
Figure 7 shows how the median of homework and quiz completion percentageswere changing during the first 7 weeks of the semester. Students in Cluster 1 were
Figure 5. Median of number of problems students who did and did not earn a course cer-
tificate tried to solve throughout the semester. The error bars indicate 95% confidence
intervals computed from bootstrapping.
Lee 13

not engaged in problem-solving at all. These students must have been droppedout of the course very early in the semester, and it is not surprising to find that99.94% of them did not get a course certificate. As discussed earlier, students inCluster 3 and Cluster 4 were quite similar in terms of the fraction of certificateearners (see Figure 2) although students in Cluster 4 started working on thehomework and quiz problems very early each week (see Figure 6). Similarly,their weekly problem completion profiles are similar except that students inCluster 4 were able to complete more homework and quiz problems than stu-dents in Cluster 3 probably because they were able to spend more time workingon the problems (see Figure 7).
Students in Cluster 2 show an interesting pattern in their weekly problemcompletion percentage over time. During the first 3 weeks, students in Cluster 2were able to complete a good number of weekly homework and quiz problems,compared to students in Cluster 3 and Cluster 4 who were able to get a coursecertificate. However, their median completion percentage started to drop atWeek 4, and many students in this cluster seemed to have given up completelyat Week 7 as shown in Figure 7.
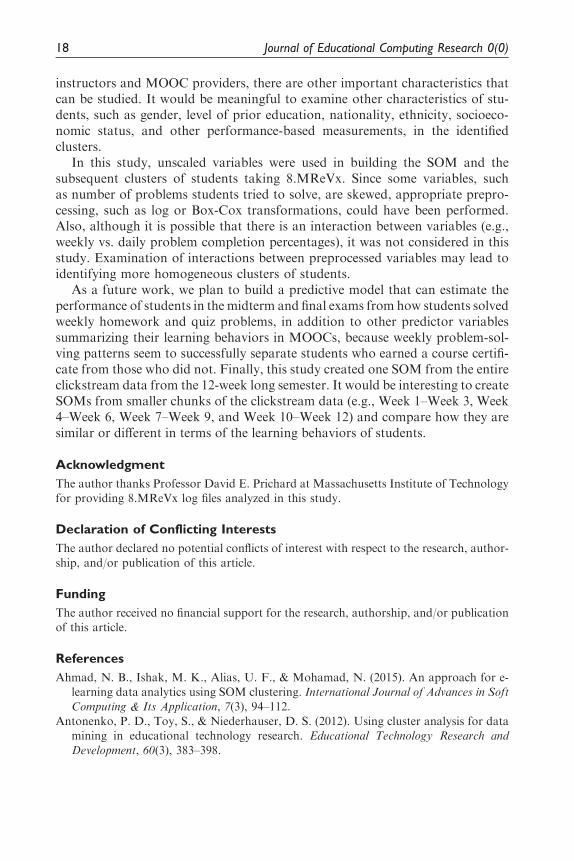
The heat maps of weekly problem completion percentages visualize how stu-dents in Cluster 2 were changing during this time period. At Week 1, manystudents in Cluster 2 were as hot as students in Cluster 3 and Cluster 4, indicat-ing that these students were able to complete as many homework and quizproblems as certificate earners in Cluster 3 and Cluster 4. At Week 5, the topportion of the heat map for Cluster 2 got cooler, indicating that these students
Figure 6. Median of problem completion percentages during the 1-week assignment cycle.
The error bars are 95% confidence intervals computed from bootstrapping.
14 Journal of Educational Computing Research 0(0)
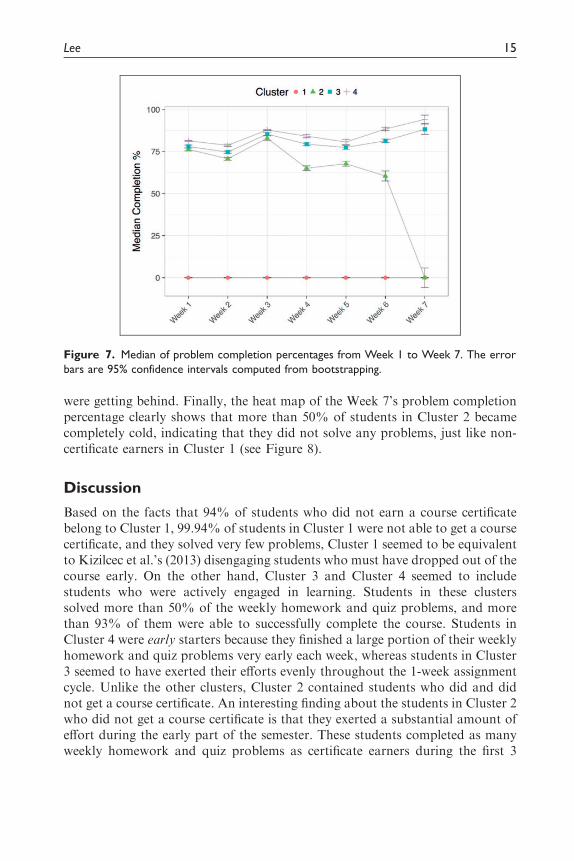
were getting behind. Finally, the heat map of the Week 7’s problem completionpercentage clearly shows that more than 50% of students in Cluster 2 becamecompletely cold, indicating that they did not solve any problems, just like non-certificate earners in Cluster 1 (see Figure 8).
Discussion
Based on the facts that 94% of students who did not earn a course certificatebelong to Cluster 1, 99.94% of students in Cluster 1 were not able to get a coursecertificate, and they solved very few problems, Cluster 1 seemed to be equivalentto Kizilcec et al.’s (2013) disengaging students who must have dropped out of thecourse early. On the other hand, Cluster 3 and Cluster 4 seemed to includestudents who were actively engaged in learning. Students in these clusterssolved more than 50% of the weekly homework and quiz problems, and morethan 93% of them were able to successfully complete the course. Students inCluster 4 were early starters because they finished a large portion of their weeklyhomework and quiz problems very early each week, whereas students in Cluster3 seemed to have exerted their efforts evenly throughout the 1-week assignmentcycle. Unlike the other clusters, Cluster 2 contained students who did and didnot get a course certificate. An interesting finding about the students in Cluster 2who did not get a course certificate is that they exerted a substantial amount ofeffort during the early part of the semester. These students completed as manyweekly homework and quiz problems as certificate earners during the first 3
Figure 7. Median of problem completion percentages from Week 1 to Week 7. The error
bars are 95% confidence intervals computed from bootstrapping.
Lee 15

Fig
ure
8.
Heat
map
ssh
ow
ing
the
pro
ble
mco
mple
tion
perc
enta
ges
of
students
atW
eek
1,3,5,an
d7.T
he
bla
cklin
es
mar
kth
ebord
er
of
clust
ers
.
16

weeks but appeared to have given up as the semester was progressing as shownin the heat maps of the SOM reported in this study.
Thanks to the advancement in information technology, it is easy to collectinformation about how students use a computer-based learning environmentsuch asMOOCs. However, it is not easy to use this multidimensional informationwhen we try to understand how students learn in the computer-based learningenvironment in part because it is extremely difficult to make sense of multifaceteddata. By placing similar multidimensional data close to one another in an X-Yplane, SOM allows us to easily visualize clusters of students who share similarcharacteristics measured on multiple dimensions. Therefore, MOOC instructorscan use SOM as a profiling tool that can enable them to easily identify groups ofstudents having similar characteristics and examine their academic performance.
From the perspective of learning, students in Cluster 2 would be most import-ant because many of them did not get a course certificate even though theyexerted significant efforts during the first 3 weeks of the semester. These studentsmight have been able to successfully complete the course if they received appro-priate supports and guidance in time (probably around Week 4). SOM may beable to help instructors find the students who need help the most, which might bea first step toward addressing the low completion rate issue in MOOCs.
Identifying meaningful predictor variables is one of the most important anddifficult tasks in the quantitative data analysis examining clickstream dataobtained from computer-based learning environments because the quality ofpredictor variables has much more impact on the predictive power of themodel than the complexity of the algorithm employed in the analysis. As aresult, many predictive modeling projects start with an exploratory data analysistrying to identify good predictor variables for the phenomenon being modeled.SOM can be an effective exploratory data analysis method since it can not onlycluster students showing similar characteristics but also provide an easy way tovisualize the characteristics of the students in each cluster.
Limitations of Study and Future Works
The focus of this study was on the pattern of student engagement in solvingweekly summative assessment problems in MOOCs. Considering the fact thatsolving problems that have one correct answer is not a primary learning activityin certain knowledge domains (e.g., social studies, literature), the findings fromthis study may not be generalized to the MOOCs emphasizing different types oflearning activities and pedagogies (e.g., discussions with peers). It would beinteresting to conduct a similar clustering analysis on the clickstream datafrom MOOCs employing socioconstructivist pedagogies. Also, this study exam-ined the program completion rate of students in the clusters identified by SOMand hierarchical clustering algorithms. Although the program completion rate isan important characteristic of students, especially from the perspective of
Lee 17
instructors and MOOC providers, there are other important characteristics thatcan be studied. It would be meaningful to examine other characteristics of stu-dents, such as gender, level of prior education, nationality, ethnicity, socioeco-nomic status, and other performance-based measurements, in the identifiedclusters.
In this study, unscaled variables were used in building the SOM and thesubsequent clusters of students taking 8.MReVx. Since some variables, suchas number of problems students tried to solve, are skewed, appropriate prepro-cessing, such as log or Box-Cox transformations, could have been performed.Also, although it is possible that there is an interaction between variables (e.g.,weekly vs. daily problem completion percentages), it was not considered in thisstudy. Examination of interactions between preprocessed variables may lead toidentifying more homogeneous clusters of students.
As a future work, we plan to build a predictive model that can estimate theperformance of students in the midterm and final exams from how students solvedweekly homework and quiz problems, in addition to other predictor variablessummarizing their learning behaviors in MOOCs, because weekly problem-sol-ving patterns seem to successfully separate students who earned a course certifi-cate from those who did not. Finally, this study created one SOM from the entireclickstream data from the 12-week long semester. It would be interesting to createSOMs from smaller chunks of the clickstream data (e.g., Week 1–Week 3, Week4–Week 6, Week 7–Week 9, and Week 10–Week 12) and compare how they aresimilar or different in terms of the learning behaviors of students.
Acknowledgment
The author thanks Professor David E. Prichard at Massachusetts Institute of Technologyfor providing 8.MReVx log files analyzed in this study.
Declaration of Conflicting Interests
The author declared no potential conflicts of interest with respect to the research, author-
ship, and/or publication of this article.
Funding
The author received no financial support for the research, authorship, and/or publicationof this article.
References
Ahmad, N. B., Ishak, M. K., Alias, U. F., & Mohamad, N. (2015). An approach for e-learning data analytics using SOM clustering. International Journal of Advances in SoftComputing & Its Application, 7(3), 94–112.
Antonenko, P. D., Toy, S., & Niederhauser, D. S. (2012). Using cluster analysis for datamining in educational technology research. Educational Technology Research andDevelopment, 60(3), 383–398.
18 Journal of Educational Computing Research 0(0)

Baker, R. (2010). Datamining for education. In B.McGaw, P. Peterson, &E. Baker (Eds.),International Encyclopedia of Education (3rd ed., pp. 112–118). Oxford, UK: Elsevier
Science.Balint, T. A., Teodorescu, R., Colvin, K., Choi, Y.-J., & Pritchard, D. (2017). Physics
instructional resource usage by high-, medium-, and low-skilled MOOC students. The
Physics Teacher, 55(4), 222–225.Breslow, L., Pritchard, D. E., DeBoer, J. D., Stump, G. S., Ho, A. D., & Seaton, D. T.
(2013). Studying learning in the worldwide classroom: Research into edX’s firstMOOC. Research Practice in Assessment, 8, 13–25.
Calinski, T., & Harabasz, J. (1974). A dendrite method for cluster analysis.Communications in Statistics, 3(1), 1–27.
Class Central. (2015). By the numbers: MOOCS in 2015 – Class Central’s MOOC report.
Retrieved from https://www.class-central.com/report/moocs-2015-stats/Durfee, A., Schneberger, S., & Amoroso, D. L. (2007). Evaluating students computer-
based learning using a visual data mining approach. Journal of Informatics Education
Research, 9, 1–28.Ezen-Can, A., Boyer, K. E., Kellogg, S., & Booth, S. (2015). Unsupervised modeling for
understanding MOOC discussion forums: A learning analytics approach. Proceedings
of the 5th International Conference on Learning Analytics and Knowledge. Retrievedfrom http://doi.acm.org/10.1145/2723576.2723589
Ferguson, R., & Clow, D. (2016). Consistent commitment: Patterns of engagement acrosstime in Massive Open Online Courses (MOOCs). Journal of Learning Analytics, 2(3),
55–80.Haykin, S. (1999). Neural Networks (2nd ed.). Upper Saddle River, NJ: Prentice Hall.Ho, A. D., Reich, J., Nesterko, S. O., Seaton, D. T., Mullaney, T., Waldo, J., & Chuang,
I. (2014). HarvardX and MITx: The first year of open online courses, fall 2012-summer 2013. SSRN Electronic Journal. doi:10.2139/ssrn.2381263
Jordan, K. (2014). Initial trends in enrolment and completion of massive open online
course. The International Review of Research in Open and Distributed Learning, 15(1),133–160.
Jordan, K. (2015). Massive open online course completion rates revisited: Assessment,length and attrition. The International Review of Research in Open and Distributed
Learning, 16(3). doi:10.19173/irrodl.v16i3.2112Khalil, M., & Ebner, M. (2017). Clustering patterns of engagement in Massive Open
Online Courses (MOOCs): The use of learning analytics to reveal student categories.
Journal of Computing in Higher Education, 29(1), 114–132.Kizilcec, R. F., Piech, C., & Schneider, E. (2013). Deconstructing disengagement:
Analyzing learner subpopulations in massive open online courses. Proceedings of the
3rd International Conference on Learning Analytics and Knowledge. Retrieved fromhttp://doi.acm.org/10.1145/2460296.2460330
Lee, C.-S. (2007). Diagnostic, predictive and compositional modeling with data mining in
integrated learning environments. Computers & Education, 49(3), 562–580.Li, N., Kidzinski, L., Jermann, P., & Dillenbourg, P. (2015). MOOC video interaction
patterns: What do they tell us?. Lecture Notes in Computer Science, 9307(6), 197–210.Liu, Z., Brown, R., Lynch, C., Barnes, T., Baker, R., Bergner, Y., & McNamara, D.
(2016). MOOC Learner Behaviors by Country and Culture; an Exploratory Analysis.
Lee 19

Proceedings of the 9th International Conference on Educational Data Mining. Retrievedfrom https://pdfs.semanticscholar.org/3c0a/68193049732f890b0632ed72d6e19d5119
e8.pdf?_ga=2.84644377.1215507837.1515768297-87580748.1508175188Merelo-Gervos, J. J., Perieto, B., Prierto, A., Romero, G., Valdivieso, P. C., & Tricas, F.
(2004). Clustering web-based communities using self-organizing maps. Proceedings of
IADIS Conference on Web Based Communities. Retrieved from https://pdfs.seman-ticscholar.org/f58b/1caa38e5673d6d533da16ba567034e1c27a7.pdf?_ga=2.139507507.1215507837.1515768297-87580748.1508175188
Pena-Ayala, A. (2014). Educational data mining: A survey and a data mining-based
analysis of recent works. Expert Systems with Applications, 41(P1), 1432–1462.Reich, J. R. (2014). MOOC completion and retention in the context of student intent
[EDUCAUSE Review Online]. Retrieved from http://www.educause.edu/ero/article/
mooc-completion-and-retention-context-student-intentRodrigues, R. L., Gomes, A. S., Souza, F. F., Ramos, J. L. C., Silva, J. C. S., & Maciel,
A. M. A. (2016). Discovering level of participation in MOOCs through clusters ana-
lysis. Proceedings of the IEEE 16th International Conference on Advanced LearningTechnologies. doi: 10.1109/ICALT.2016.45
Romero, C., & Ventura, S. (2010). Educational data mining: A review of the state of the
art. IEEE Transactions on Systems, Man, and Cybernetics, Part C (Applications andReviews), 40(6), 601–618.
Vesanto, J., & Alhoniemi, E. (2000). Clustering of the self-organizing map. IEEETransactions on Neural Networks, 11(3), 586–600.
Wehrens, R., & Buydens, L. M. C. (2007). Self- and super-organizing maps in R: TheKohonen package. Journal of Statistical Software, 21(5), 1–19.
Author Biography
Youngjin Lee is an associate professor of Educational Technology at theUniversity of Kansas. His current research is focusing on using EducationalData Mining and learning analytics to better understand how people learn incomputer-based learning environments such as massive open online courses.
20 Journal of Educational Computing Research 0(0)