using sensefly mapping drones to map geomorphological features in the subantartics
TRANSCRIPT
Using drones to mapgeomorphological features
in the Subantarctics

One of the keys to better understanding climate change
is to paint a more accurate picture of environmental conditions
in the distant past

A good place to measure environmental change over such long timescales?
New Subantarctic Islands

In November 2014, a team of researchers from the Climate
Change Research Centre at the University of New South Wales
set out to do just

This team decided to map the Musgrave
geomorphological features, since these provide evidence of past glaciation

complex geomorphology, so we wanted to map it, in high resolution, and create a 3D model that we could
use to identify and quantify past Dr. Zoë
Thomas, a research associate
By then taking sediment cores, we could also get an idea of what the
past vegetation and environmental

So why did the researchers
decide to use a drone?

No other method of data collection could provide the imagery required
in the time available.
There were
3 key reasons

Speed#1
#2Difficult terrain

High-resolutionimagery
#3

To map this area would have taken us weeks using traditional in-situ field
explains
resolution of the Landsat imagery is 30 metres, much lower than the 8.8 cm per pixel our eBee achievedshe adds

choice to use a senseFly eBee also brought anadditional benefit
low noise is important when working in protected areas
that contain large bird says Thomas

But carrying out the drone flights was not all plain
The Subantarctic islands are located in the latitudes of the
strong trade winds, so finding windows of opportunity to fly the
drone was always going to be a challenge says

How didthey do it?
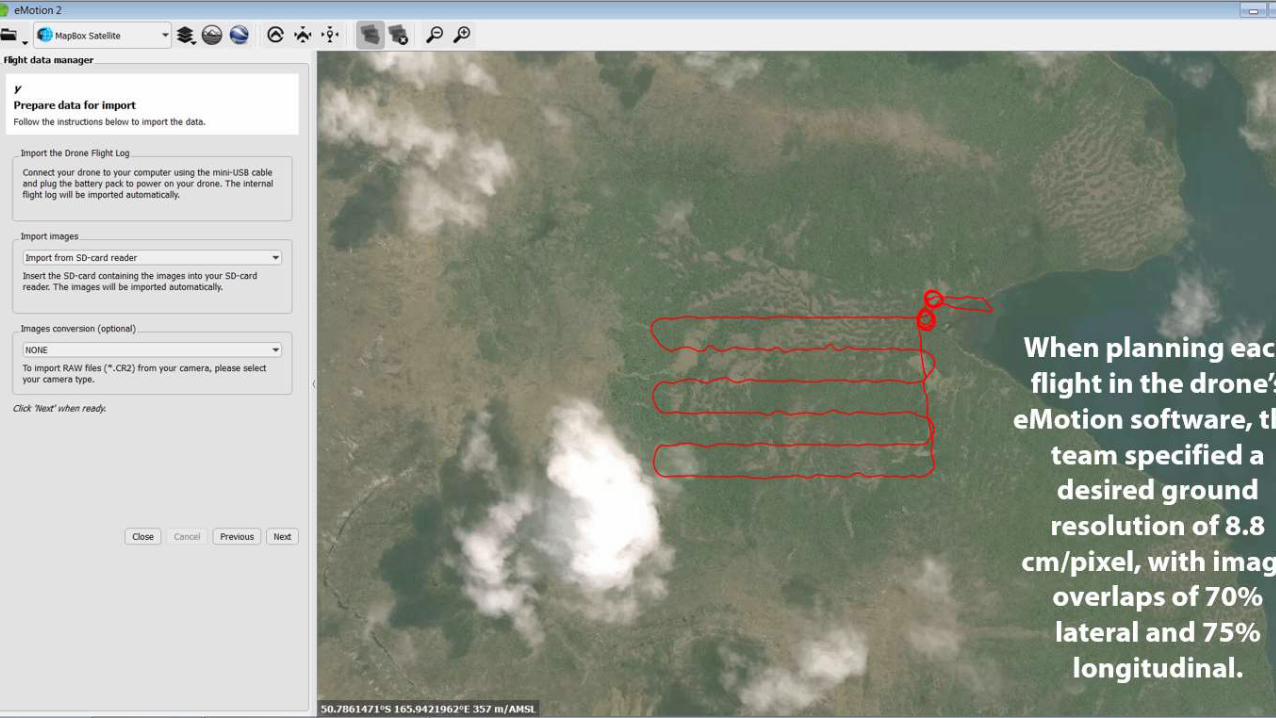
When planning each
eMotion software, the team specified a desired ground
resolution of 8.8 cm/pixel, with image
overlaps of 70% lateral and 75%
longitudinal.

The team took a total of 152 high-resolution RGB images over the course of two 20-25 minute flights

The result?

These images were used to create the digital surface model required to identify
geomorphological features

incredible, allowing us to identify a moraine feature that we had not picked up at all on
the Landsat imagery reports
The ability to identify features like this really helps us improve our
understanding of glacier flow lines

1 Identify site of interest
2 Identifysuitable area for
drone to map
3 Identify take-off/landing
locations
4 Wait for suitable weather
conditions
5 Fly the drone6 Process drone
images & generate 3D DSM
7 Analyse drone data
PROJECT WORKFLOW

PROJECT STATISTICS

For more information about using drones for environmental applications, visit:
www.sensefly.com/applications/environmental-protection.html