using sensitivity and scenario analysis to examine the
TRANSCRIPT
Using Sensitivity and Scenario Analysis to Examine the Costs and Benefits of Solar to Duke Energy Carolinas
by
Amit Singh
Dr. Timothy L. Johnson, Adviser
May 2015
Masters project submitted in partial fulfillment of the
requirements for the Master of Environmental Management degree in
the Nicholas School of the Environment of
Duke University, 2015
ii
Executive Summary
The issue of compensation for solar energy is a hotly debated national issue, with numerous solar cost/benefit studies commissioned in recent years. This project builds on existing studies by identifying a feasible range of values for the various benefits and costs that can be attributed to solar power. This range of values is then applied to 15-year (2015-2029) solar power projections from Duke Energy Carolina’s (DEC) 2014 Integrated Resource Plan to provide a net present value (NPV) of solar power to DEC.
This paper begins by giving context to the solar debate in North Carolina. While in many states there is much controversy around net metering, in North Carolina the more relevant topic is the Avoided Cost rate. Net metering is how distributed generation (DG) customers (i.e., homes and businesses with solar panels on their roofs) are compensated, and Avoided Costs are how utility-scale customers (i.e., solar farms of 20,000+ panels) are compensated. In North Carolina, over 90% of the solar is utility-scale.
The background data for this study comes primarily from three sources: 1) a prior study by Crossborder Energy examining the benefits and costs of solar for North Carolina, 2) a solar integration study for North Carolina carried out by Pacific Northwest National Laboratory, and 3) the 2014 Avoided Cost proceedings from the North Carolina Utilities Commission (NCUC). From these sources, the relevant benefits and costs of solar are identified, as well as a feasible range for the values ($/MWh) for each benefit and cost.
This study deviates from previous studies by using scenario and sensitivity analysis to account for future uncertainty. Since the benefits and costs of solar are controversial, three different scenarios are created, each incorporating different benefit and cost values from the identified feasible range.
Scenario 1 (“All Benefits, All Costs Scenario”) incorporates all the benefits and costs of solar. Scenario 2 (“Status Quo Scenario”) only incorporates the benefits and costs that are currently approved (or soon to be approved) by the NCUC. Scenario 3 (“2020 Scenario”) models a future outcome. It uses the values from Scenario 2, but adds on an Environmental Benefit of solar starting in 2020, when the compliance period for the Environmental Protection Agency’s Clean Power Plan begins. Scenario 3 also factors in an Integration Cost for solar to account for grid costs associated with maintaining reliability given higher penetration of solar resources.
In addition to scenario analysis, sensitivity analyses are performed on four key model inputs that are subject to uncertainty. These inputs are the energy output from a solar panel, the proportion of solar that is utility-scale vs. DG, the proportion of DG that is residential vs. commercial, and the discount rate used by DEC. The energy output from a solar panel can vary considerably depending on where it is in the state. The future solar mix in North Carolina could change depending on the policy landscape. Finally, the DEC’s discount rate changes from rate case to rate case.
Scenario 1 has a NPV of $164M, Scenario 2 has a NPV of -$188M, and Scenario 3 has a NPV of $41M.
iii
The results of the sensitivity analyses for Scenarios 1 and 3 show that for every 100 kWh per kW capacity increase in energy output, the NPV increase by $10.7M and $2.7M, respectively. For Scenario 2, a 100kWh increase in energy output per kW actually results in a $12.3M decrease in NPV. These counterintuitive results are explained by the fact that both costs and benefits in the model are based on production. If the costs of solar are higher than the benefits of solar, increased production is actually detrimental for DEC since they are paying the costs on a per kWh basis and receiving benefits on a per kWh basis.
Every 1% increase in discount rate results in approximately a 7% decrease, 7% increase, and 8% decrease in NPV for Scenarios 1, 2, and 3, respectively. The sensitivity analyses on the solar mix reveals that changes in proportion of utility-scale vs. DG solar have a much greater impact on NPV than changes in the proportion of residential DG vs. commercial DG. This is due to the low amount of DG solar in the state (~6%). For Scenario 1, the percentage of DG in the state can reach 81.7% before overall NPV is negative. For Scenario 3, the point where NPV becomes negative is 27.6%. These results can be attributed to the fact that DG solar is more expensive to DEC than utility-scale solar.
This paper concludes with the following points/recommendations:
x Scenario 2 shows that the Status Quo is a net negative NPV for solar energy to DEC. However, Scenarios 1 and 3 show that when you factor in additional benefits and costs of solar, the NPV becomes positive. These findings highlight the need for the NCUC to recognize all the benefits and costs of solar, which the commission has already acknowledged in its recent Order Setting Avoided Cost Parameters (12/31/14).
x In addition to recognizing the additional benefits and costs of solar, the NCUC should open up proceedings to put values on the benefits and costs of solar. This is already being piloted in Minnesota and in the city of Austin, TX. These proceedings should have transparent calculations so that stakeholders can see the methodology underlying the values.
x Nationally, solar energy is a flourishing job market. Increasing solar energy in North Carolina could give a boost to the state’s economy. By not properly compensating solar developers with a rate that incorporates all the benefits and costs of solar, we run the risk of losing these developers and their associated jobs to neighboring states.
Table of Contents
INTRODUCTION OVERVIEW 1 SOLAR POWER IN NORTH CAROLINA 3
x NORTH CAROLINA’S SOLAR MIX 3 x POLICY BACKGROUND FOR UTILITY-SCALE SOLAR IN NC: PURPA 4 x POLICY BACKGROUND FOR UTILITY-SCALE SOLAR IN NC: NCUC’S AVOIDED COST PROCEEDINGS 5 x POLICY BACKGROUND FOR ROOFTOP SOLAR IN NC: NET METERING 6
DECLINING COST OF SOLAR INFRASTRUCTURE 8 SOLAR COSTS & BENEFITS 8 STUDIES ASSESSING SOLAR IN NORTH CAROLINA 10
x CROSSBORDER STUDY 10 x PNNL STUDY 13
DATA & ANALYSIS MODEL OVERVIEW 14
x INPUT # 1: BENEFIT/COST VALUES FROM LITERATURE 14 x INPUT # 2: MODEL ASSUMPTIONS 17 x INPUT # 3: DEC’S SOLAR PROJECTIONS FROM 2014 IRP 18
MODEL SCENARIOS 19 MODEL SENSITIVITY ANALYSIS 20 RESULTS SCENARIO NPVS 22 SCENARIO 1 SENSITIVITY ANALYSIS 23 SCENARIO 2 SENSITIVITY ANALYSIS 25 SCENARIO 3 SENSITIVITY ANALYSIS 27 DISCUSSIONS & CONCLUSIONS 29 LIMITATIONS 32 ACKNOWLEDGEMENTS 34 APPENDIX SOLAR BENEFIT AND COST VALUES USED IN CROSSBORDER STUDY 35 MODEL CALCULATION METHODOLOGY 36 SCENARIOS 1-3 CASH FLOWS 38 LIST OF RELEVANT ACRONYMS 41 BIBLIOGRAPHY 42
1
Introduction
Overview North Carolina currently boasts 722 MW of installed solar PV, of which over 70% has been
installed since 2013 (SEIA, 2014). With this increase, North Carolina is now ranked 4th in the
nation for installed solar capacity, behind California, Arizona, and New Jersey. The growth in
solar can be attributed mostly to two factors: favorable policies in North Carolina and the
declining cost of solar infrastructure. This paper will examine solar policies in North Carolina.
The approach this paper takes in examining solar policies for North Carolina is to focus on utility
commission rules that pertain to how solar power producers are compensated. These rules are the
Avoided Cost rates paid to utility-scale solar power producers, and net metering rates paid to
residential and small commercial rooftop solar customers. This paper explores whether these
rates are appropriately compensating solar energy after considering all its benefits and costs.
Because there is uncertainty around how to value the benefits and costs of solar, this paper
incorporates both scenario and sensitivity analyses to previously documented values
(Crossborder Energy, 2013; Pacific Northwest National Laboratory, 2014; North Carolina
Utilities Commission, 2014).
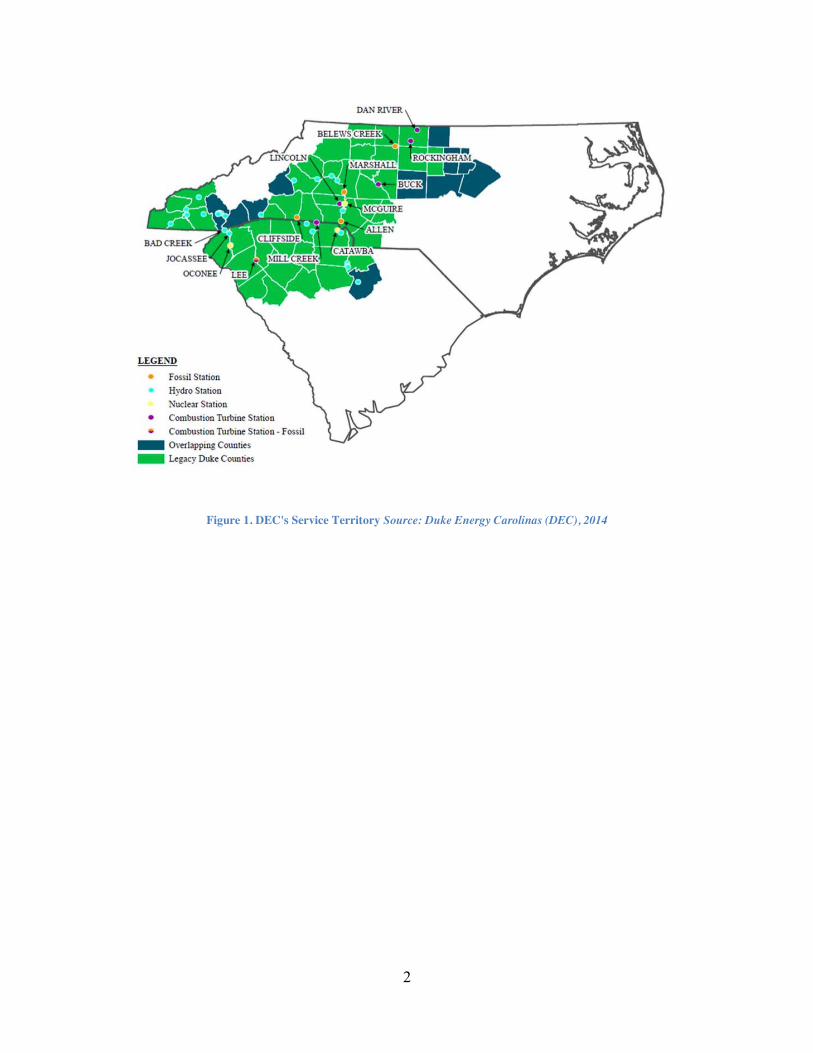
The scope of this paper is limited to the service territory of Duke Energy Carolinas (DEC),
shown in Figure 1. There are two other major investor-owned electric utilities (IOUs) in North
Carolina: Duke Energy Progress (DEP) and Dominion North Carolina Power (DNCP) (North
Carolina Utilities Commission, 2015). While both of these utilities also deal with policy issues
related to solar compensation for North Carolina customers, DEC serves the most customers
(Carolina Country Magazine, 2013), and thus was the focus for this analysis.
2
Figure 1. DEC's Service Territory Source: Duke Energy Carolinas (DEC), 2014
3
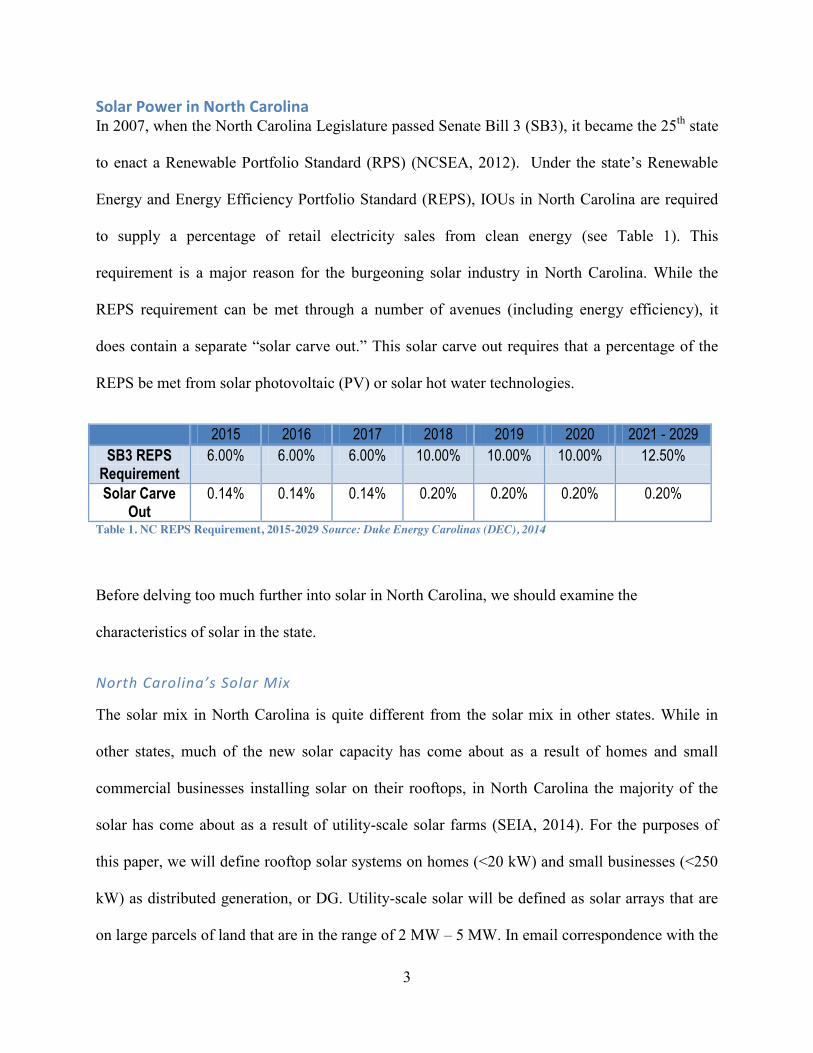
Solar Power in North Carolina In 2007, when the North Carolina Legislature passed Senate Bill 3 (SB3), it became the 25th state
to enact a Renewable Portfolio Standard (RPS) (NCSEA, 2012). Under the state’s Renewable
Energy and Energy Efficiency Portfolio Standard (REPS), IOUs in North Carolina are required
to supply a percentage of retail electricity sales from clean energy (see Table 1). This
requirement is a major reason for the burgeoning solar industry in North Carolina. While the
REPS requirement can be met through a number of avenues (including energy efficiency), it
does contain a separate “solar carve out.” This solar carve out requires that a percentage of the
REPS be met from solar photovoltaic (PV) or solar hot water technologies.
2015 2016 2017 2018 2019 2020 2021 - 2029 SB3 REPS
Requirement 6.00% 6.00% 6.00% 10.00% 10.00% 10.00% 12.50%
Solar Carve Out
0.14% 0.14% 0.14% 0.20% 0.20% 0.20% 0.20%
Table 1. NC REPS Requirement, 2015-2029 Source: Duke Energy Carolinas (DEC), 2014
Before delving too much further into solar in North Carolina, we should examine the
characteristics of solar in the state.
North Carolina’s Solar Mix
The solar mix in North Carolina is quite different from the solar mix in other states. While in
other states, much of the new solar capacity has come about as a result of homes and small
commercial businesses installing solar on their rooftops, in North Carolina the majority of the
solar has come about as a result of utility-scale solar farms (SEIA, 2014). For the purposes of
this paper, we will define rooftop solar systems on homes (<20 kW) and small businesses (<250
kW) as distributed generation, or DG. Utility-scale solar will be defined as solar arrays that are
on large parcels of land that are in the range of 2 MW – 5 MW. In email correspondence with the
4
North Carolina Utilities Commission, public staff member Jay Lucas stated that the solar
currently online in Duke Energy Carolinas’ service territory “is mostly utility scale (2 MWAC or
greater). I estimate that fewer than 30 MW is distributed, mostly constructed by residential
customers.” (Jay Lucas, personal communication, February 25, 2015). To understand the reasons
why solar in North Carolina is mostly utility-scale, we need to dig a little further into some of the
regulatory and policy issues surrounding solar. A big catalyst for the large build-out of utility-
scale solar in North Carolina is the Public Utilities Regulatory Policies Act (PURPA).
Policy Background for Utility-Scale Solar in NC: PURPA
In 1978, PURPA was passed as part of the National Energy Act. The catalyst for PURPA was
the series of energy crises that affected the United States and other industrialized nations during
the 1970s. In response to an inconsistent oil supply and rising oil costs from Middle East
suppliers, the Carter Administration made it a priority to lead the US towards energy
independence. PURPA attempted to achieve this by: 1) promoting energy conservation/energy
efficiency, and 2) encouraging domestic energy production from generators other than those
owned by electric utilities. One of the strategies to spur domestic energy production was to
require utilities to purchase power from “qualifying facilities” (QFs), so long as the cost of that
power was less than the utilities “Avoided Costs” from having to producing their own power or
purchase power from another supplier. On top of requiring utilities to purchase power from QFs,
PURPA required utilities to both provide back-up power to and interconnect with QFs (Electric
Power Supply Association, 2015).
The Federal Energy Regulatory Commission (FERC) divides QFs into two categories: small
power production facilities, and cogeneration facilities (Federal Energy Regulatory Commission,
2012). The small power production facilities are defined as having a capacity of 80 MW or less
5
and being powered primarily by one of the following: hydro, wind, solar, biomass, waste, or
geothermal.
For utilities that are subject to state jurisdiction (i.e., DEC, DEP, DNCP), FERC has delegated
implementation of the rules on how to compensate QFs to the state regulatory authorities. In
North Carolina, the rules are determined in biennial Avoided Cost proceedings.
Policy Background for Utility-Scale Solar in NC – NCUC’s Avoided Cost Proceedings
Every two years, the NCUC holds Avoided Cost proceedings where it considers opinions of
various stakeholders interested in the Avoided Cost rates. Avoided Cost rates are defined as the
marginal cost for the utility to produce one more unit of power (Independent Energy Producers
Association, 2015). As mentioned in the previous section, utilities are required to pay this rate to
QFs. In North Carolina, QFs are defined more strictly than how FERC defines QFs. Before 1985,
the size limit for QFs in North Carolina was 80 MW (North Carolina Utilities Commission, 2015,
p. 11), which aligns with FERC’s definition of a QF. At this time, the NCUC thought it prudent
to incentivize renewable energy developers, who were new to the energy industry and lacked the
bargaining power to negotiate with large utilities. By making them eligible for QF status, the
NCUC allowed these larger developers to apply for a “standard offer” contract, thus entitling
them to contracts based on the Avoided Cost rate and negating the need for negotiating contracts
with the utility. As renewable energy developers began to gain some footing and increase
bargaining, the NCUC lowered the size cap to 5 MW (North Carolina Utilities Commission,
1984). The 5 MW limit is still applicable today, though there have been recent requests by North
Carolina utilities to lower it to 100 kW (Henderson, 2014).
Due to the continued growth of solar in North Carolina, the 2014 Avoided Cost proceedings
were especially controversial. Solar developers and renewable energy advocates pushed to
6
expand the definition of a QF, thus making “standard offer” contracts applicable to a wider range
of utility-scale solar projects. Additionally, solar advocates sought longer contracts, which would
guarantee cash flows for an extended period of time and make financing of solar projects more
attractive. The North Carolina utilities, in contrast, are pushing to narrow the definition of QFs so
that they can enter into more “negotiated contracts” with solar project developers. By negotiating
contracts, the utilities could potentially pay lower rates for solar energy than they do with
“standard contracts.” Additionally, the utilities are seeking shorter contracts in order to not lock
themselves into rates that may be less attractive in ten or fifteen years.
The 2014 Order Setting Avoided Cost Input Parameters (North Carolina Utilities Commission,
2014) was arguably a victory for solar advocates. The NCUC upheld the 5 MW limit for QFs
(but did not raise it to 10 MW), declared that utilities continue to offer standard contracts up to
15 years (but did not increase the term to 20 years), and recognized the avoided fuel hedging
benefits of solar. The Order also stated that there are various costs and/or benefits associated
with increased renewables in the utilities’ energy mix, and that these costs/benefits should be
examined in a more comprehensive solar integration study. These second part of this paper
attempts to delve further into some of the applicable costs and benefits of solar to DEC, and uses
both scenario and sensitivity analyses to account for uncertainty in these values.
Policy Background for Rooftop Solar in NC – Net Metering
Net metering makes solar financially viable for residential and small commercial customers in
North Carolina. Net metering is an energy policy whereby customers who generate their own
electricity using solar panels or other renewable technologies can transfer that energy back onto
the electricity grid, offsetting their own electricity costs. Currently, over 40 states have net
metering policies (SEIA, 2013). The policies in states vary significantly, including differences in
7
individual system capacity limit, aggregate system capacity limit, eligible customer types,
eligible system types, treatment of net excess generation, payment for net excess generation, and
ownership of renewable energy certificates (RECs) associated with customer generation (DSIRE,
2012). RECs are the property rights to the environmental, social, and other nonpower qualities of
renewable energy generation (Environmental Protection Agency, 2014). One REC is generated
for every 1 Megawatt-hour (MWh) of electricity placed on the grid, and REC markets exist in
certain regions of the United States.
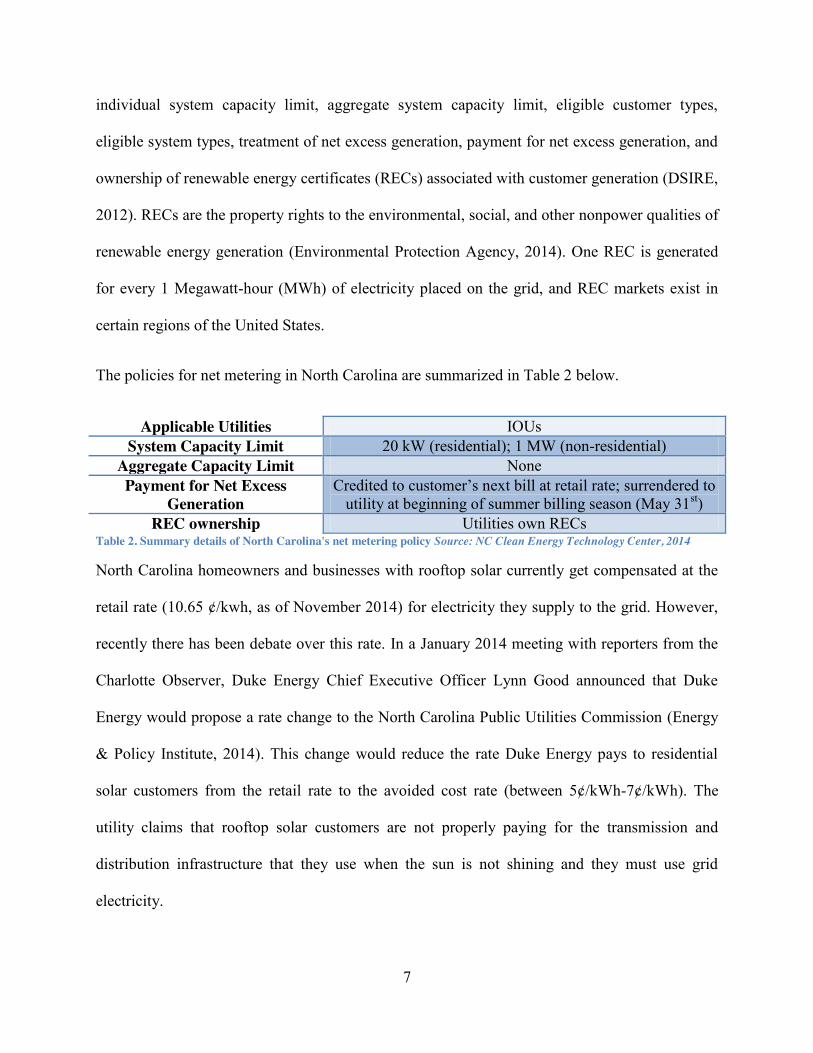
The policies for net metering in North Carolina are summarized in Table 2 below.
Applicable Utilities IOUs System Capacity Limit 20 kW (residential); 1 MW (non-residential)
Aggregate Capacity Limit None Payment for Net Excess
Generation Credited to customer’s next bill at retail rate; surrendered to
utility at beginning of summer billing season (May 31st) REC ownership Utilities own RECs
Table 2. Summary details of North Carolina's net metering policy Source: NC Clean Energy Technology Center, 2014
North Carolina homeowners and businesses with rooftop solar currently get compensated at the
retail rate (10.65 ¢/kwh, as of November 2014) for electricity they supply to the grid. However,
recently there has been debate over this rate. In a January 2014 meeting with reporters from the
Charlotte Observer, Duke Energy Chief Executive Officer Lynn Good announced that Duke
Energy would propose a rate change to the North Carolina Public Utilities Commission (Energy
& Policy Institute, 2014). This change would reduce the rate Duke Energy pays to residential
solar customers from the retail rate to the avoided cost rate (between 5¢/kWh-7¢/kWh). The
utility claims that rooftop solar customers are not properly paying for the transmission and
distribution infrastructure that they use when the sun is not shining and they must use grid
electricity.
8
Declining cost of solar infrastructure On top of a favorable policy environment, another reason for the growth of solar in North
Carolina is the declining cost of solar systems. In 2010, the U.S. Department of Energy started
the SunShot Initiative to help make solar energy fully cost-competitive with traditional energy
sources by 2020 (U.S. Department of Energy, 2015). The initiative’s goal is to reduce the cost of
solar energy to $0.06 per kilowatt-hour (kWh) by 2020. According to the Sunshot Initiative
website, solar energy costs are currently about 60% of the way to the goal as the price of utility-
scale PV systems have dropped to $0.11/kWh from 2011 prices of $0.21/kWh. Two big reasons
for the declining cost of solar systems are the increased supply of solar panels and the reduction
in the cost of the raw materials required to build the panels (Kincer, 2014).
Solar Costs and Benefits While there’s no disputing the growth of solar, the question of how much and how fast solar
should continue to grow remains unanswered. There are a number of benefits to more solar
power, but there are also a number of complications. As solar has grown in other states, various
cost-benefit analyses have been undertaken to try and assess whether more solar power is
warranted or not (Crossborder Energy, 2013; Crossborder Energy, 2013; Xcel Energy Services,
2013). In September 2013, the Rocky Mountain Institute (RMI) published a meta-analysis that
outlines the salient points of the various cost/benefit studies, and provides recommendations for
future cost/benefit studies (Rocky Mountain Institute, 2013).
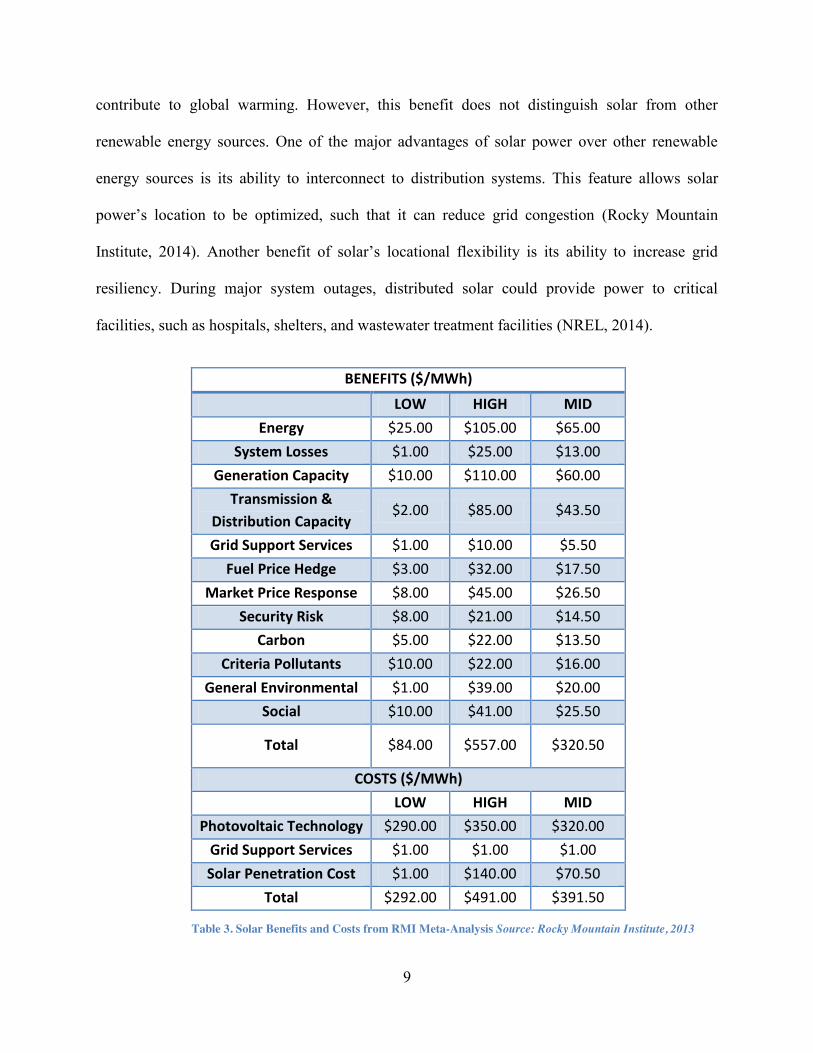
Table 3 shows some of the benefits and costs cited in the RMI meta-analysis, as well as their
associated values.
While different studies phrase the benefits and costs in different ways, there are many
commonalities across them. Arguably the most important benefit of solar is that it does not
9
contribute to global warming. However, this benefit does not distinguish solar from other
renewable energy sources. One of the major advantages of solar power over other renewable
energy sources is its ability to interconnect to distribution systems. This feature allows solar
power’s location to be optimized, such that it can reduce grid congestion (Rocky Mountain
Institute, 2014). Another benefit of solar’s locational flexibility is its ability to increase grid
resiliency. During major system outages, distributed solar could provide power to critical
facilities, such as hospitals, shelters, and wastewater treatment facilities (NREL, 2014).
Table 3. Solar Benefits and Costs from RMI Meta-Analysis Source: Rocky Mountain Institute, 2013
BENEFITS ($/MWh) LOW HIGH MID
Energy $25.00 $105.00 $65.00
System Losses $1.00 $25.00 $13.00
Generation Capacity $10.00 $110.00 $60.00
Transmission & Distribution Capacity
$2.00 $85.00 $43.50
Grid Support Services $1.00 $10.00 $5.50
Fuel Price Hedge $3.00 $32.00 $17.50
Market Price Response $8.00 $45.00 $26.50
Security Risk $8.00 $21.00 $14.50
Carbon $5.00 $22.00 $13.50
Criteria Pollutants $10.00 $22.00 $16.00
General Environmental $1.00 $39.00 $20.00
Social $10.00 $41.00 $25.50
Total $84.00 $557.00 $320.50
COSTS ($/MWh) LOW HIGH MID Photovoltaic Technology $290.00 $350.00 $320.00
Grid Support Services $1.00 $1.00 $1.00
Solar Penetration Cost $1.00 $140.00 $70.50
Total $292.00 $491.00 $391.50
10
Studies Assessing Solar in North Carolina Two studies regarding solar in North Carolina were used as a basis for the research.
Crossborder Study
The Crossborder study was commissioned by the North Carolina Sustainable Energy Association
(NCSEA) in order to try and value some of the less obvious benefits of solar. The NCSEA asked
Crossborder to replicate the solar cost/benefit methodology they had previously performed in
Arizona (Crossborder Energy, 2013). The study looks at the benefits and costs of solar for both
utility-scale and DG solar projects, for each of the major North Carolina utilities: DEC, DEP, and
DNCP.
The Crossborder study relies on data from the IRPs, avoided costs proceedings, and general rate
cases of the North Carolina utilities. To a certain extent, the study also uses data from the
regional gas and electric markets in which the utilities operate. The report aims to use publicly
available data and transparent calculations so that the methodology is clear.
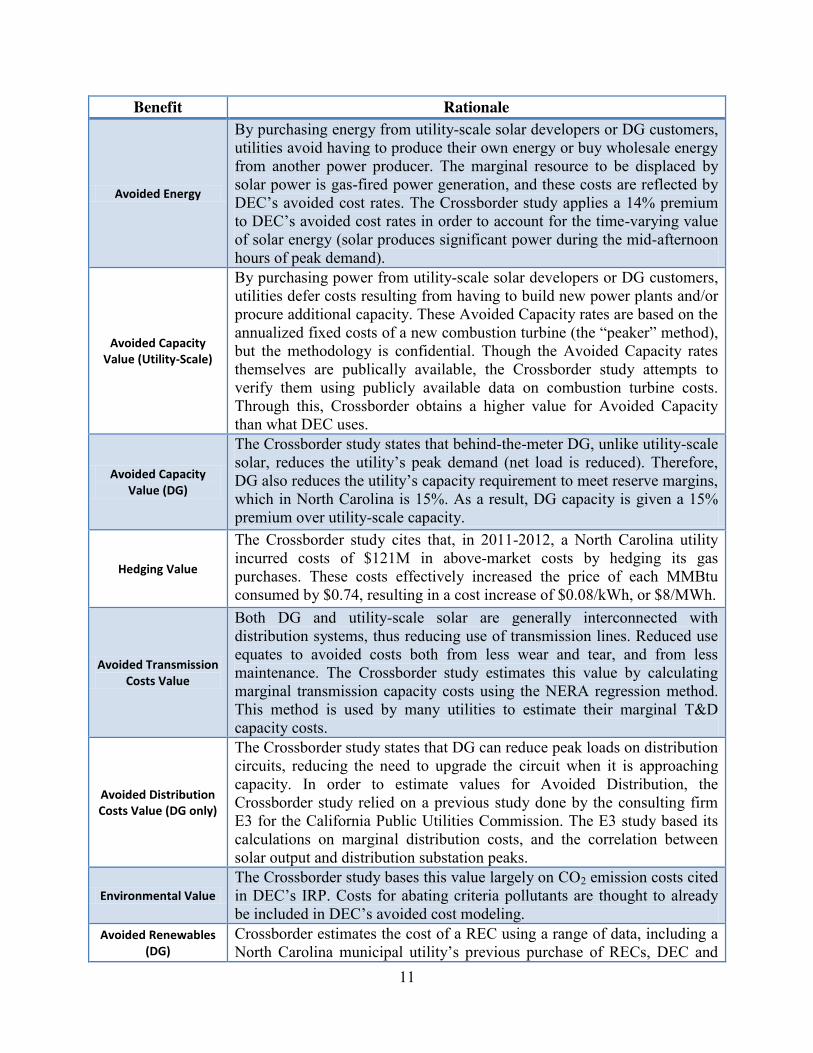
Because the solar benefits and costs from the Crossborder study were the same benefits and costs
used in this paper’s analysis, it is necessary to provide insight into the rationale that Crossborder
used in calculating their values for the benefits and costs of solar (Tables 4 & 5).
11
Benefit Rationale
Avoided Energy
By purchasing energy from utility-scale solar developers or DG customers, utilities avoid having to produce their own energy or buy wholesale energy from another power producer. The marginal resource to be displaced by solar power is gas-fired power generation, and these costs are reflected by DEC’s avoided cost rates. The Crossborder study applies a 14% premium to DEC’s avoided cost rates in order to account for the time-varying value of solar energy (solar produces significant power during the mid-afternoon hours of peak demand).
Avoided Capacity Value (Utility-Scale)
By purchasing power from utility-scale solar developers or DG customers, utilities defer costs resulting from having to build new power plants and/or procure additional capacity. These Avoided Capacity rates are based on the annualized fixed costs of a new combustion turbine (the “peaker” method), but the methodology is confidential. Though the Avoided Capacity rates themselves are publically available, the Crossborder study attempts to verify them using publicly available data on combustion turbine costs. Through this, Crossborder obtains a higher value for Avoided Capacity than what DEC uses.
Avoided Capacity Value (DG)
The Crossborder study states that behind-the-meter DG, unlike utility-scale solar, reduces the utility’s peak demand (net load is reduced). Therefore, DG also reduces the utility’s capacity requirement to meet reserve margins, which in North Carolina is 15%. As a result, DG capacity is given a 15% premium over utility-scale capacity.
Hedging Value
The Crossborder study cites that, in 2011-2012, a North Carolina utility incurred costs of $121M in above-market costs by hedging its gas purchases. These costs effectively increased the price of each MMBtu consumed by $0.74, resulting in a cost increase of $0.08/kWh, or $8/MWh.
Avoided Transmission Costs Value
Both DG and utility-scale solar are generally interconnected with distribution systems, thus reducing use of transmission lines. Reduced use equates to avoided costs both from less wear and tear, and from less maintenance. The Crossborder study estimates this value by calculating marginal transmission capacity costs using the NERA regression method. This method is used by many utilities to estimate their marginal T&D capacity costs.
Avoided Distribution Costs Value (DG only)
The Crossborder study states that DG can reduce peak loads on distribution circuits, reducing the need to upgrade the circuit when it is approaching capacity. In order to estimate values for Avoided Distribution, the Crossborder study relied on a previous study done by the consulting firm E3 for the California Public Utilities Commission. The E3 study based its calculations on marginal distribution costs, and the correlation between solar output and distribution substation peaks.
Environmental Value The Crossborder study bases this value largely on CO2 emission costs cited in DEC’s IRP. Costs for abating criteria pollutants are thought to already be included in DEC’s avoided cost modeling.
Avoided Renewables (DG)
Crossborder estimates the cost of a REC using a range of data, including a North Carolina municipal utility’s previous purchase of RECs, DEC and
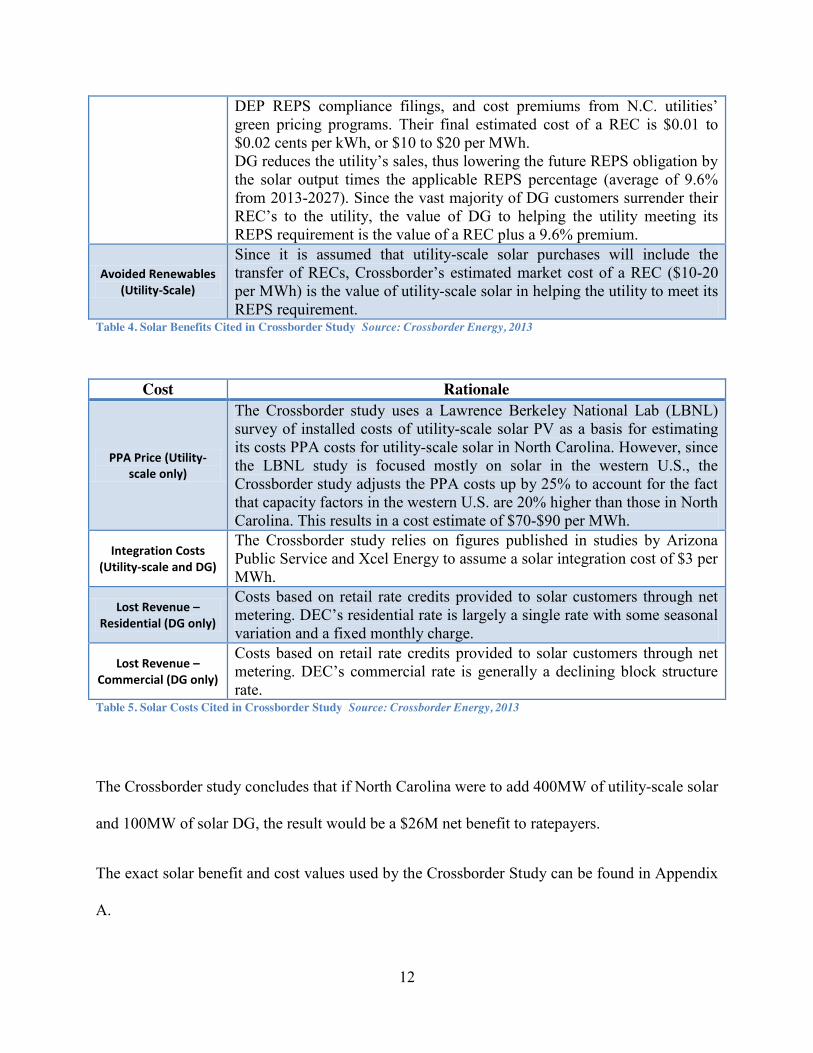
12
DEP REPS compliance filings, and cost premiums from N.C. utilities’ green pricing programs. Their final estimated cost of a REC is $0.01 to $0.02 cents per kWh, or $10 to $20 per MWh. DG reduces the utility’s sales, thus lowering the future REPS obligation by the solar output times the applicable REPS percentage (average of 9.6% from 2013-2027). Since the vast majority of DG customers surrender their REC’s to the utility, the value of DG to helping the utility meeting its REPS requirement is the value of a REC plus a 9.6% premium.
Avoided Renewables (Utility-Scale)
Since it is assumed that utility-scale solar purchases will include the transfer of RECs, Crossborder’s estimated market cost of a REC ($10-20 per MWh) is the value of utility-scale solar in helping the utility to meet its REPS requirement.
Table 4. Solar Benefits Cited in Crossborder Study Source: Crossborder Energy, 2013
Cost Rationale
PPA Price (Utility-scale only)
The Crossborder study uses a Lawrence Berkeley National Lab (LBNL) survey of installed costs of utility-scale solar PV as a basis for estimating its costs PPA costs for utility-scale solar in North Carolina. However, since the LBNL study is focused mostly on solar in the western U.S., the Crossborder study adjusts the PPA costs up by 25% to account for the fact that capacity factors in the western U.S. are 20% higher than those in North Carolina. This results in a cost estimate of $70-$90 per MWh.
Integration Costs (Utility-scale and DG)
The Crossborder study relies on figures published in studies by Arizona Public Service and Xcel Energy to assume a solar integration cost of $3 per MWh.
Lost Revenue – Residential (DG only)
Costs based on retail rate credits provided to solar customers through net metering. DEC’s residential rate is largely a single rate with some seasonal variation and a fixed monthly charge.
Lost Revenue – Commercial (DG only)
Costs based on retail rate credits provided to solar customers through net metering. DEC’s commercial rate is generally a declining block structure rate.
Table 5. Solar Costs Cited in Crossborder Study Source: Crossborder Energy, 2013
The Crossborder study concludes that if North Carolina were to add 400MW of utility-scale solar
and 100MW of solar DG, the result would be a $26M net benefit to ratepayers.
The exact solar benefit and cost values used by the Crossborder Study can be found in Appendix
A.
13
PNNL Study
The PNNL study (Pacific Northwest National Laboratory, 2014) was commissioned by Duke
Energy to examine the technical barriers and associated costs posed by the increased penetration
of solar, an intermittent resource. A PV penetration range of 2-20% of peak load was chosen.
The study found that, though the Duke Energy system was able to maintain reliability standards
with a 20% peak load solar penetration, reserve requirements increased, driving up costs. The
increased abundance of solar would lead to integration costs ranging from $1.43-$9.82 per MWh,
scaling up with higher penetration. Effects of solar on Duke Energy’s T&D system were also
examined, but those results fall outside the scope of this paper’s analysis.
14
Data & Analysis
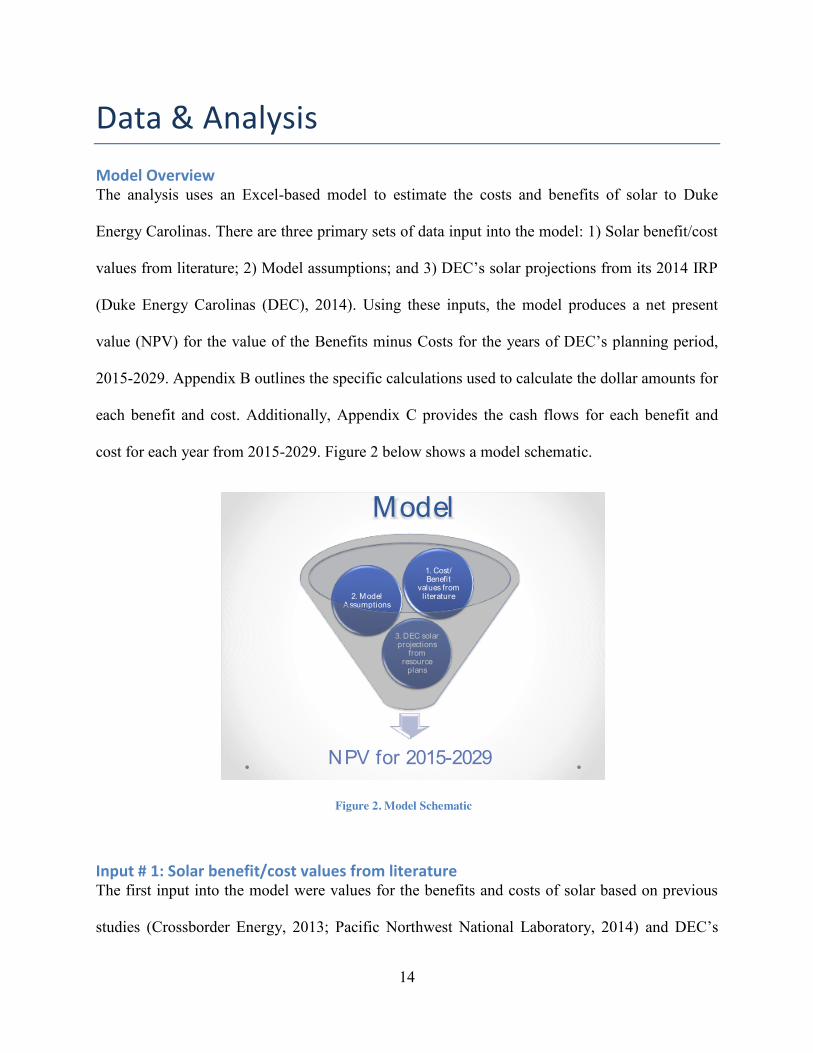
Model Overview The analysis uses an Excel-based model to estimate the costs and benefits of solar to Duke
Energy Carolinas. There are three primary sets of data input into the model: 1) Solar benefit/cost
values from literature; 2) Model assumptions; and 3) DEC’s solar projections from its 2014 IRP
(Duke Energy Carolinas (DEC), 2014). Using these inputs, the model produces a net present
value (NPV) for the value of the Benefits minus Costs for the years of DEC’s planning period,
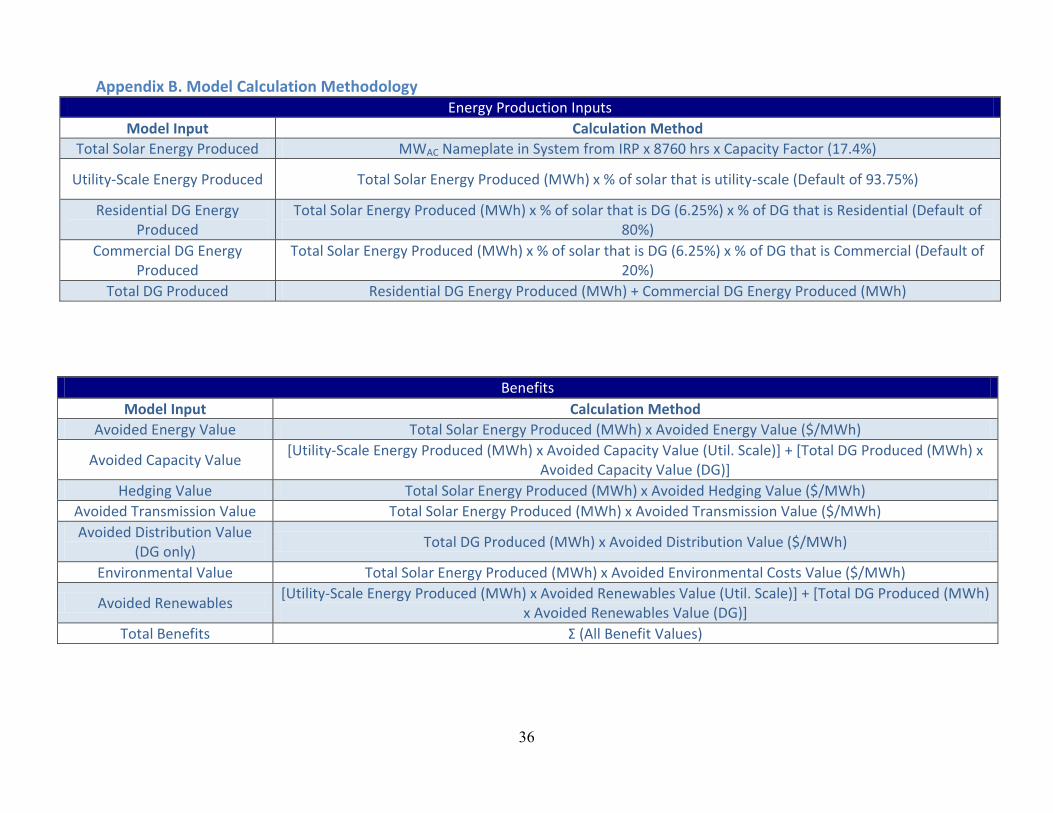
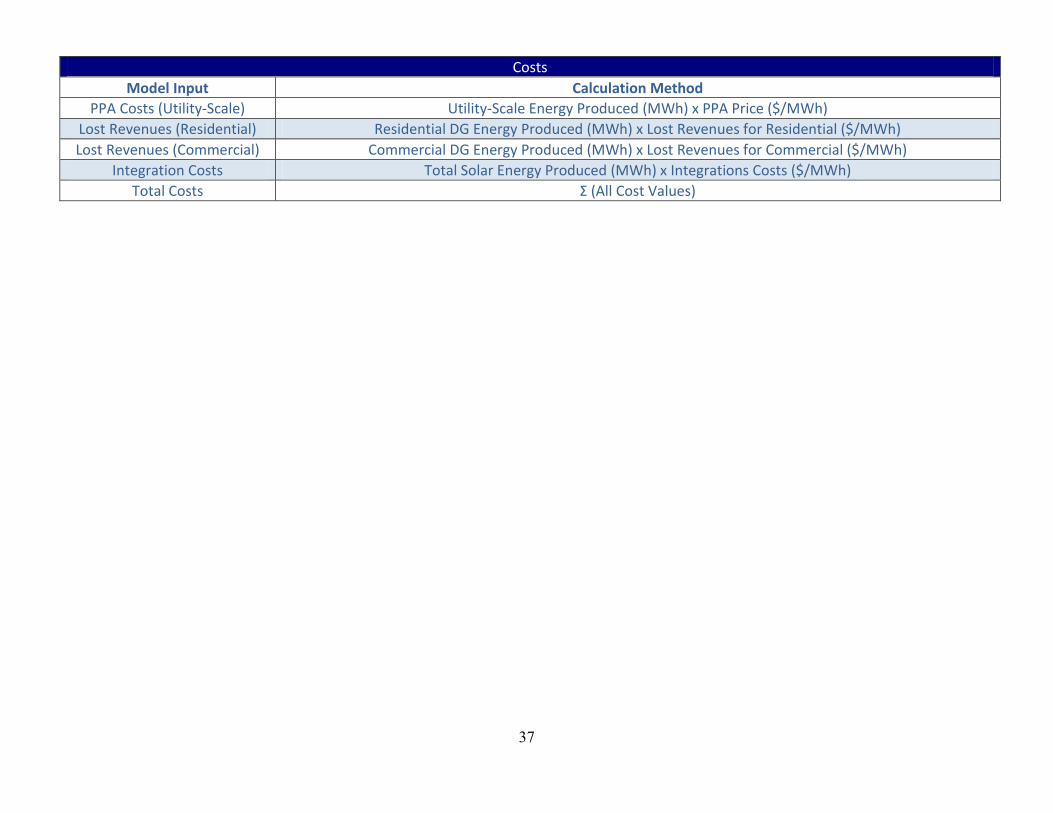
2015-2029. Appendix B outlines the specific calculations used to calculate the dollar amounts for
each benefit and cost. Additionally, Appendix C provides the cash flows for each benefit and
cost for each year from 2015-2029. Figure 2 below shows a model schematic.
Figure 2. Model Schematic
Input # 1: Solar benefit/cost values from literature The first input into the model were values for the benefits and costs of solar based on previous
studies (Crossborder Energy, 2013; Pacific Northwest National Laboratory, 2014) and DEC’s
Model
NPV for 2015-2029
3. DEC solar projections
from resource
plans
2. Model Assumptions
1. Cost/Benefit
values from literature

15
current Avoided Cost rates (Duke Energy Carolinas, 2014). Tables 6 and 7 below outline the
benefits and costs, respectively, that were incorporated into the analysis for this project. The
tables show a Low, High, and Mid value. The Low and High values are explained in the tables,
and the Mid values for all the benefits and costs are the midpoint between the Low and High
values.
BENEFITS ($/MWh)
Low High Mid Explanation
Avoided Energy $50.20 $57.00 $53.60
Low is the weighted average of DEC's Avoided
Cost Rates; High is the low value in the
Crossborder study range
Avoided Capacity Value (DG) $9.46 $36.76 $23.11 Both Low and High are 15% higher than the
Utility-Scale Avoided Capacity rates
Avoided Capacity Value (Utility-Scale) $8.23 $31.96 $20.10
Low is the weighted average of DEC's Avoided
Capacity Rates; High is the high value used in the
Crossborder study range
Hedging Value $0.00 $8.00 $4.00 Low is zero value, High is the value used in
Crossborder study
Avoided Transmission Costs Value $0.00 $10.00 $5.00
Low is low value from Crossborder study range;
High is high value from Crossborder study range
Avoided Distribution Costs Value (DG only) $2.00 $5.00 $3.50
Low is low value from Crossborder study range;
High is high value from Crossborder study range
Environmental Value $4.00 $22.00 $13.00 Low is low value from Crossborder study range;
High is high value from Crossborder study range
Avoided Renewables (DG) $0.96 $22.00 $11.48 Low is low value from Crossborder study range;
High is high value from Crossborder study range
Avoided Renewables (Utility-Scale) $10.00 $20.00 $15.00
Low is low value from Crossborder study range;
High is high value from Crossborder study range
Total Benefits (Utility-Scale) $72.43 $148.96 $110.70 Sum of above values applicable to Utility-Scale
Total Benefits (DG) $66.62 $160.76 $133.79 Sum of above values applicable to DG
Table 6. Range of Benefit Values Used in Model
16
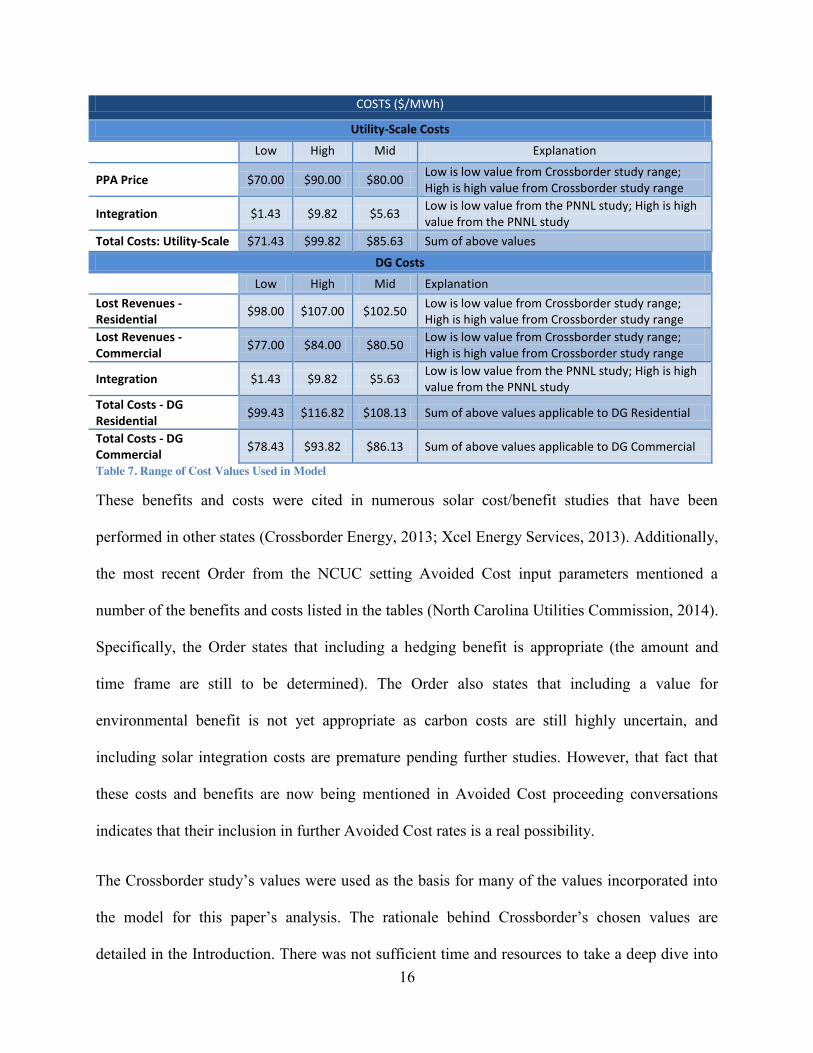
COSTS ($/MWh)
Utility-Scale Costs
Low High Mid Explanation
PPA Price $70.00 $90.00 $80.00 Low is low value from Crossborder study range;
High is high value from Crossborder study range
Integration $1.43 $9.82 $5.63 Low is low value from the PNNL study; High is high
value from the PNNL study
Total Costs: Utility-Scale $71.43 $99.82 $85.63 Sum of above values
DG Costs
Low High Mid Explanation
Lost Revenues - Residential $98.00 $107.00 $102.50
Low is low value from Crossborder study range;
High is high value from Crossborder study range
Lost Revenues - Commercial $77.00 $84.00 $80.50
Low is low value from Crossborder study range;
High is high value from Crossborder study range
Integration $1.43 $9.82 $5.63 Low is low value from the PNNL study; High is high
value from the PNNL study
Total Costs - DG Residential $99.43 $116.82 $108.13 Sum of above values applicable to DG Residential
Total Costs - DG Commercial $78.43 $93.82 $86.13 Sum of above values applicable to DG Commercial
Table 7. Range of Cost Values Used in Model
These benefits and costs were cited in numerous solar cost/benefit studies that have been
performed in other states (Crossborder Energy, 2013; Xcel Energy Services, 2013). Additionally,
the most recent Order from the NCUC setting Avoided Cost input parameters mentioned a
number of the benefits and costs listed in the tables (North Carolina Utilities Commission, 2014).
Specifically, the Order states that including a hedging benefit is appropriate (the amount and
time frame are still to be determined). The Order also states that including a value for
environmental benefit is not yet appropriate as carbon costs are still highly uncertain, and
including solar integration costs are premature pending further studies. However, that fact that
these costs and benefits are now being mentioned in Avoided Cost proceeding conversations
indicates that their inclusion in further Avoided Cost rates is a real possibility.
The Crossborder study’s values were used as the basis for many of the values incorporated into
the model for this paper’s analysis. The rationale behind Crossborder’s chosen values are
detailed in the Introduction. There was not sufficient time and resources to take a deep dive into
17
the assumptions behind Crossborder’s values, however the study is widely cited in articles and
reports, and provides a good starting point for this analysis
In a few cases, Crossborder’s values were either not used or were modified. For example, for the
Avoided Energy and Avoided Capacity rates, values from the 2014 DEC Avoided Cost tariffs
were substituted in to get a value for the Low end of the range. This was done because
Crossborder’s rates for Avoided Energy and Avoided Capacity rates seemed to be on the high
end, and it seemed prudent to use the rates directly from DEC’s tariffs in the model as the Low
boundary.
For the Avoided Capacity–DG rates, Crossborder set them 15% higher than the Avoided
Capacity–Utility-Scale rates. This is due to the fact that DG sits behind the meter and thus
reduces the need for DEC to meet its 15% reserve margin.
For the Avoided Hedging Value rates, the value for the low end of the range was set at zero since
the Crossborder study only specified one value rather than a range of values.
Finally, the Integration Cost values from the PNNL study were substituted for Crossborder’s
Integration Cost values since the PNNL study provided a much more robust methodology.
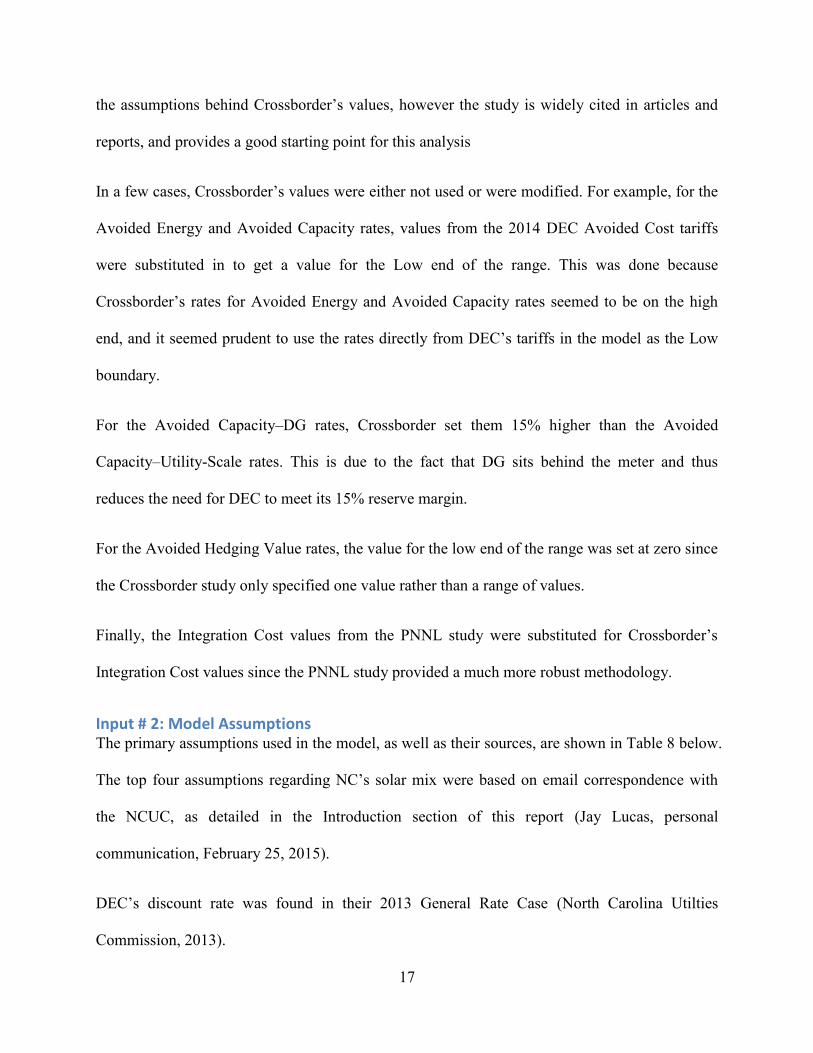
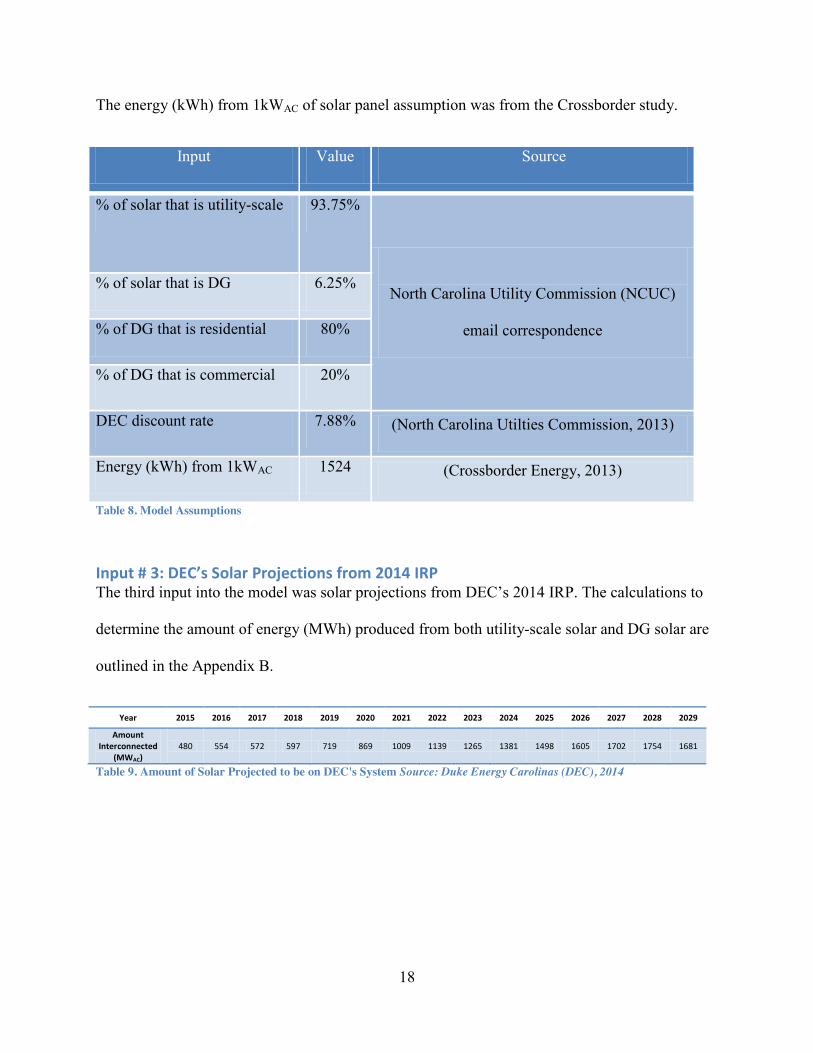
Input # 2: Model Assumptions The primary assumptions used in the model, as well as their sources, are shown in Table 8 below.
The top four assumptions regarding NC’s solar mix were based on email correspondence with
the NCUC, as detailed in the Introduction section of this report (Jay Lucas, personal
communication, February 25, 2015).
DEC’s discount rate was found in their 2013 General Rate Case (North Carolina Utilties
Commission, 2013).
18
The energy (kWh) from 1kWAC of solar panel assumption was from the Crossborder study.
Input Value Source
% of solar that is utility-scale 93.75%
North Carolina Utility Commission (NCUC)
email correspondence
% of solar that is DG 6.25%
% of DG that is residential 80%
% of DG that is commercial 20%
DEC discount rate 7.88% (North Carolina Utilties Commission, 2013)
Energy (kWh) from 1kWAC 1524 (Crossborder Energy, 2013)
Table 8. Model Assumptions
Input # 3: DEC’s Solar Projections from 2014 IRP The third input into the model was solar projections from DEC’s 2014 IRP. The calculations to
determine the amount of energy (MWh) produced from both utility-scale solar and DG solar are
outlined in the Appendix B.
Year 2015 2016 2017 2018 2019 2020 2021 2022 2023 2024 2025 2026 2027 2028 2029
Amount Interconnected
(MWAC) 480 554 572 597 719 869 1009 1139 1265 1381 1498 1605 1702 1754 1681
Table 9. Amount of Solar Projected to be on DEC's System Source: Duke Energy Carolinas (DEC), 2014
19
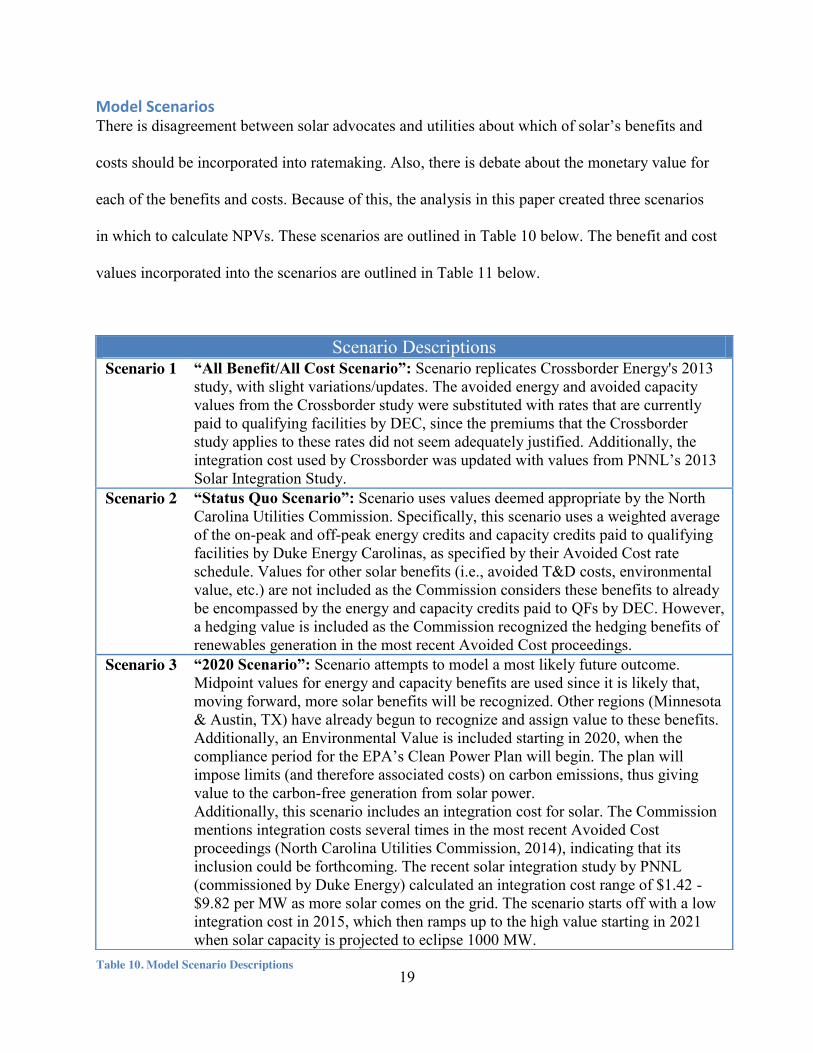
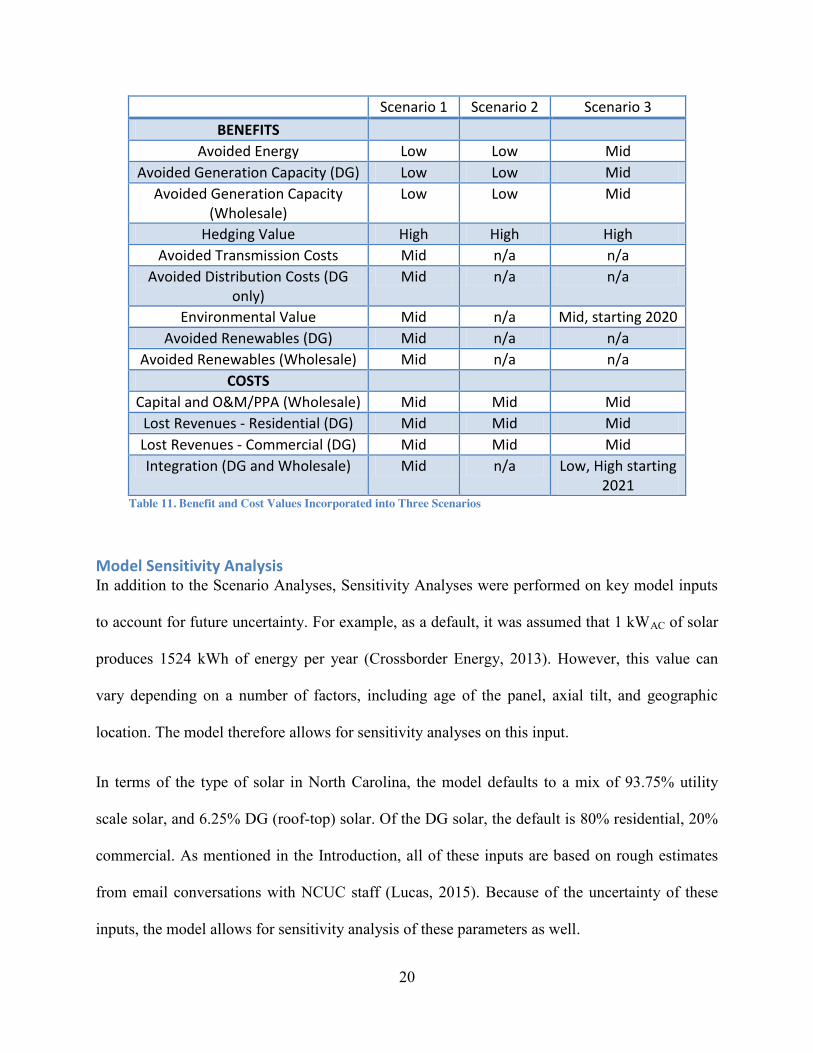
Model Scenarios There is disagreement between solar advocates and utilities about which of solar’s benefits and
costs should be incorporated into ratemaking. Also, there is debate about the monetary value for
each of the benefits and costs. Because of this, the analysis in this paper created three scenarios
in which to calculate NPVs. These scenarios are outlined in Table 10 below. The benefit and cost
values incorporated into the scenarios are outlined in Table 11 below.
Scenario Descriptions Scenario 1 “All Benefit/All Cost Scenario”: Scenario replicates Crossborder Energy's 2013
study, with slight variations/updates. The avoided energy and avoided capacity values from the Crossborder study were substituted with rates that are currently paid to qualifying facilities by DEC, since the premiums that the Crossborder study applies to these rates did not seem adequately justified. Additionally, the integration cost used by Crossborder was updated with values from PNNL’s 2013 Solar Integration Study.
Scenario 2 “Status Quo Scenario”: Scenario uses values deemed appropriate by the North Carolina Utilities Commission. Specifically, this scenario uses a weighted average of the on-peak and off-peak energy credits and capacity credits paid to qualifying facilities by Duke Energy Carolinas, as specified by their Avoided Cost rate schedule. Values for other solar benefits (i.e., avoided T&D costs, environmental value, etc.) are not included as the Commission considers these benefits to already be encompassed by the energy and capacity credits paid to QFs by DEC. However, a hedging value is included as the Commission recognized the hedging benefits of renewables generation in the most recent Avoided Cost proceedings.
Scenario 3 “2020 Scenario”: Scenario attempts to model a most likely future outcome. Midpoint values for energy and capacity benefits are used since it is likely that, moving forward, more solar benefits will be recognized. Other regions (Minnesota & Austin, TX) have already begun to recognize and assign value to these benefits. Additionally, an Environmental Value is included starting in 2020, when the compliance period for the EPA’s Clean Power Plan will begin. The plan will impose limits (and therefore associated costs) on carbon emissions, thus giving value to the carbon-free generation from solar power. Additionally, this scenario includes an integration cost for solar. The Commission mentions integration costs several times in the most recent Avoided Cost proceedings (North Carolina Utilities Commission, 2014), indicating that its inclusion could be forthcoming. The recent solar integration study by PNNL (commissioned by Duke Energy) calculated an integration cost range of $1.42 - $9.82 per MW as more solar comes on the grid. The scenario starts off with a low integration cost in 2015, which then ramps up to the high value starting in 2021 when solar capacity is projected to eclipse 1000 MW.
Table 10. Model Scenario Descriptions
20
Scenario 1 Scenario 2 Scenario 3
BENEFITS
Avoided Energy Low Low Mid
Avoided Generation Capacity (DG) Low Low Mid
Avoided Generation Capacity
(Wholesale)
Low Low Mid
Hedging Value High High High
Avoided Transmission Costs Mid n/a n/a
Avoided Distribution Costs (DG
only)
Mid n/a n/a
Environmental Value Mid n/a Mid, starting 2020
Avoided Renewables (DG) Mid n/a n/a
Avoided Renewables (Wholesale) Mid n/a n/a
COSTS
Capital and O&M/PPA (Wholesale) Mid Mid Mid
Lost Revenues - Residential (DG) Mid Mid Mid
Lost Revenues - Commercial (DG) Mid Mid Mid
Integration (DG and Wholesale) Mid n/a Low, High starting
2021
Table 11. Benefit and Cost Values Incorporated into Three Scenarios
Model Sensitivity Analysis In addition to the Scenario Analyses, Sensitivity Analyses were performed on key model inputs
to account for future uncertainty. For example, as a default, it was assumed that 1 kWAC of solar
produces 1524 kWh of energy per year (Crossborder Energy, 2013). However, this value can
vary depending on a number of factors, including age of the panel, axial tilt, and geographic
location. The model therefore allows for sensitivity analyses on this input.
In terms of the type of solar in North Carolina, the model defaults to a mix of 93.75% utility
scale solar, and 6.25% DG (roof-top) solar. Of the DG solar, the default is 80% residential, 20%
commercial. As mentioned in the Introduction, all of these inputs are based on rough estimates
from email conversations with NCUC staff (Lucas, 2015). Because of the uncertainty of these
inputs, the model allows for sensitivity analysis of these parameters as well.
21
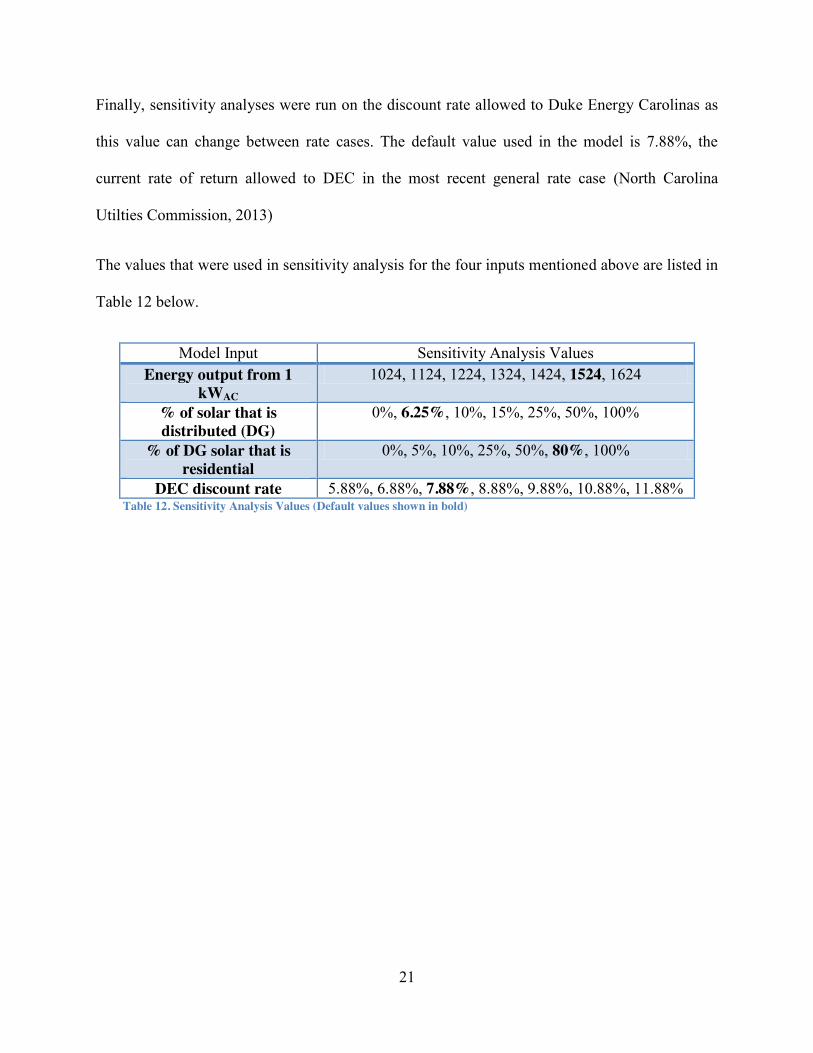
Finally, sensitivity analyses were run on the discount rate allowed to Duke Energy Carolinas as
this value can change between rate cases. The default value used in the model is 7.88%, the
current rate of return allowed to DEC in the most recent general rate case (North Carolina
Utilties Commission, 2013)
The values that were used in sensitivity analysis for the four inputs mentioned above are listed in
Table 12 below.
Model Input Sensitivity Analysis Values Energy output from 1
kWAC 1024, 1124, 1224, 1324, 1424, 1524, 1624
% of solar that is distributed (DG)
0%, 6.25%, 10%, 15%, 25%, 50%, 100%
% of DG solar that is residential
0%, 5%, 10%, 25%, 50%, 80%, 100%
DEC discount rate 5.88%, 6.88%, 7.88%, 8.88%, 9.88%, 10.88%, 11.88% Table 12. Sensitivity Analysis Values (Default values shown in bold)
22
Results
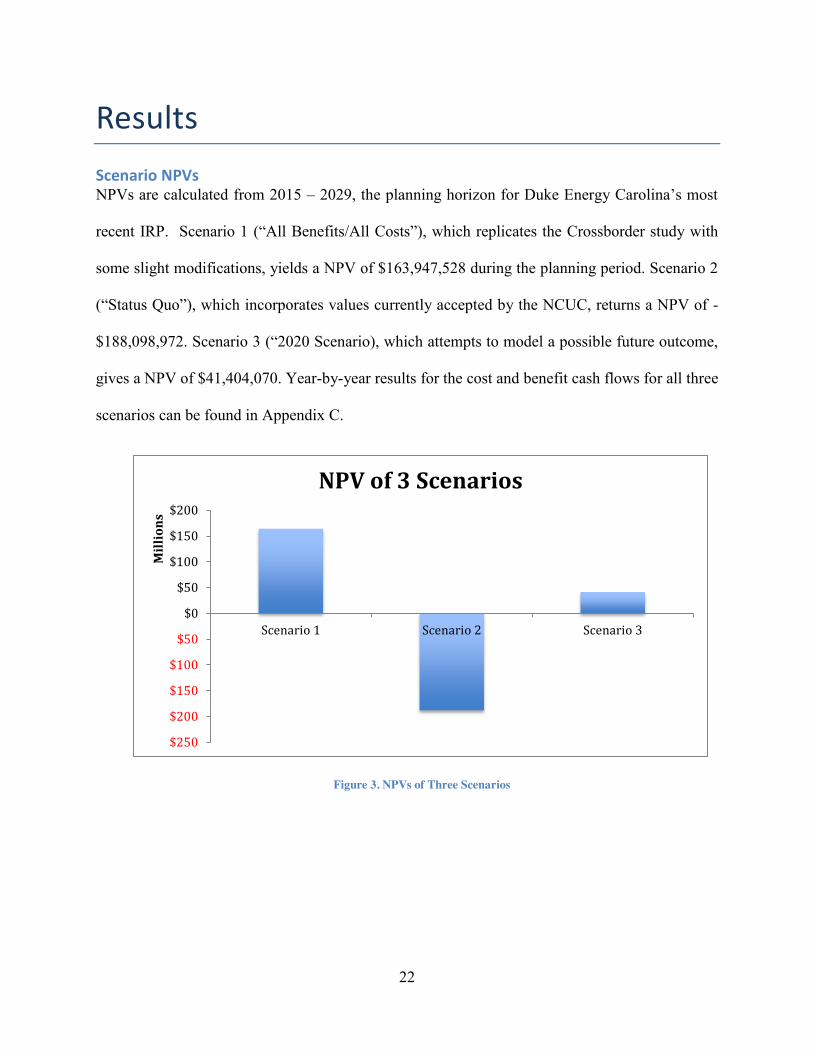
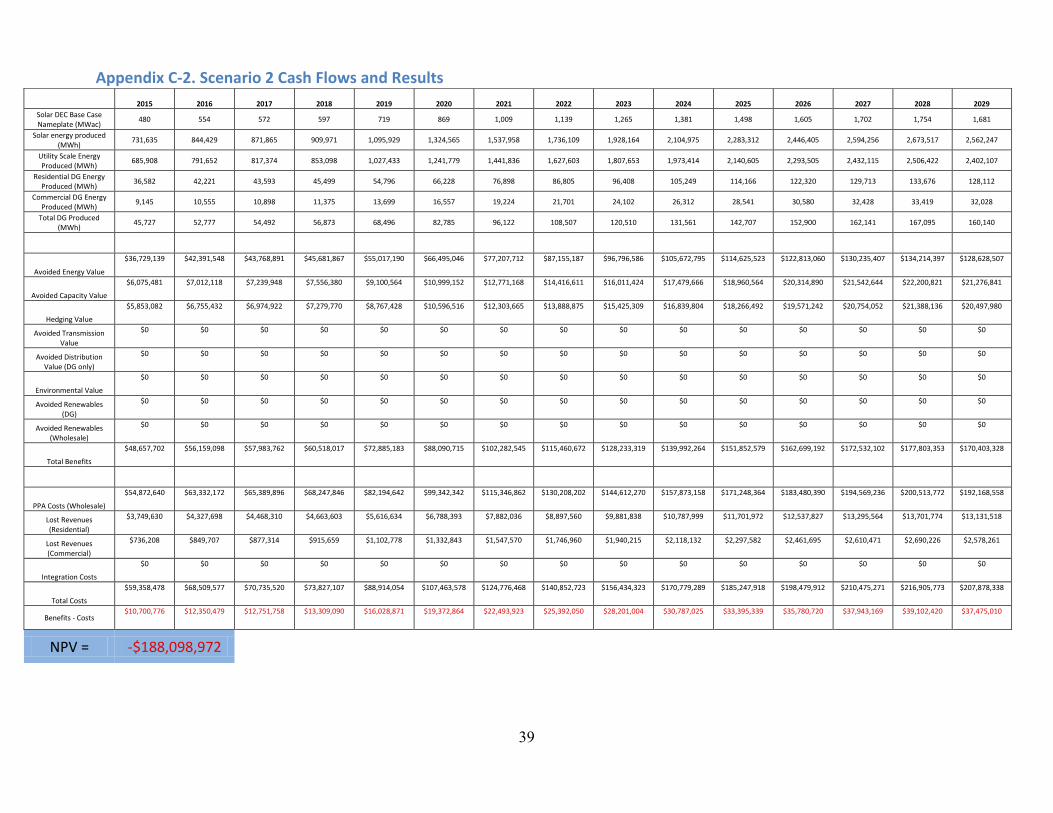
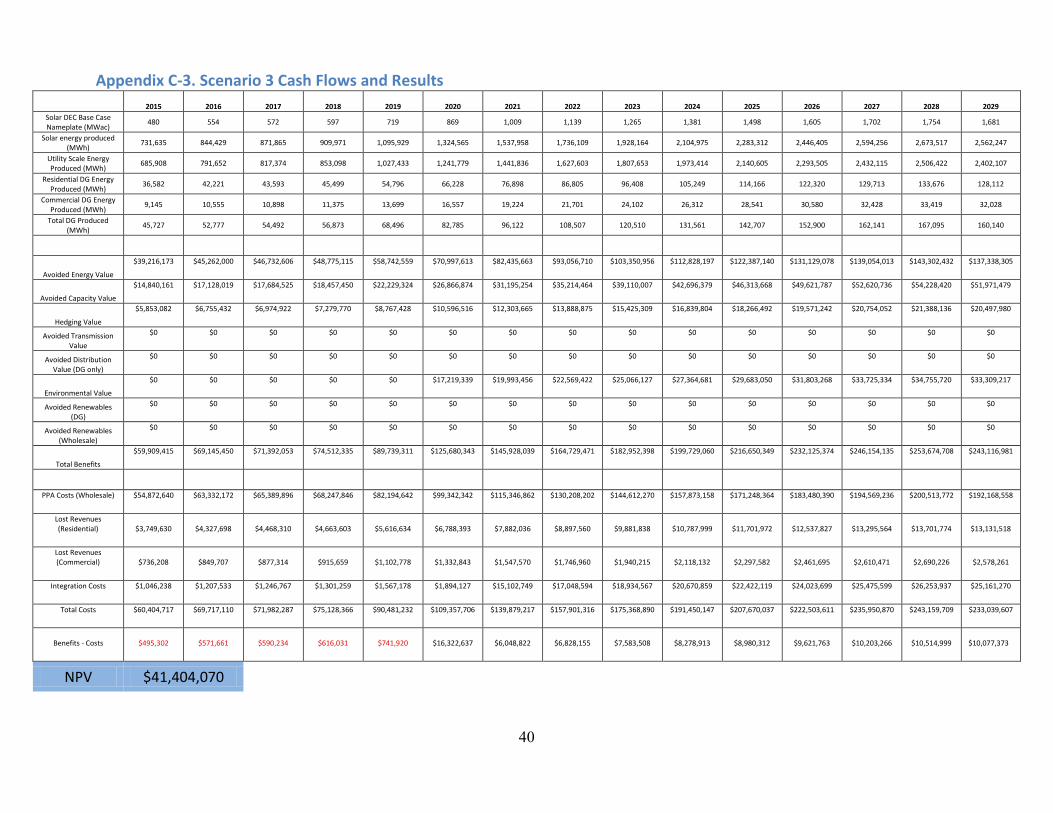
Scenario NPVs NPVs are calculated from 2015 – 2029, the planning horizon for Duke Energy Carolina’s most
recent IRP. Scenario 1 (“All Benefits/All Costs”), which replicates the Crossborder study with
some slight modifications, yields a NPV of $163,947,528 during the planning period. Scenario 2
(“Status Quo”), which incorporates values currently accepted by the NCUC, returns a NPV of -
$188,098,972. Scenario 3 (“2020 Scenario), which attempts to model a possible future outcome,
gives a NPV of $41,404,070. Year-by-year results for the cost and benefit cash flows for all three
scenarios can be found in Appendix C.
Figure 3. NPVs of Three Scenarios
$250
$200
$150
$100
$50
$0
$50
$100
$150
$200
Scenario 1 Scenario 2 Scenario 3
Mil
lion
s
NPV of 3 Scenarios
23
Scenario 1 Sensitivity Analysis - Results
Figure 4. Scenario 1 Sensitivity Analysis - PV Panel Energy Output Figure 5. Scenario 1 Sensitivity Analysis – DEC Discount Rate
Figure 6. Scenario 1 Sensitivity Analysis - NC Solar Mix
$0
$20
$40
$60
$80
$100
$120
$140
$160
$180
$200
1000 1100 1200 1300 1400 1500 1600
NP
V
Mil
lion
s
Energy from 1 kW AC
Sensitivity of Energy Output from 1kWAC
$0
$20
$40
$60
$80
$100
$120
$140
5.88% 6.88% 7.88% 8.88% 9.88% 10.88% 11.88%
NP
V
Mil
lion
s
Discount Rate
Sensitivity of DEC Discount Rate
-$40
-$20
$0
$20
$40
$60
$80
$100
0% 20% 40% 60% 80% 100%
NP
V
Mil
lion
s
Sensitivity of Solar Mix in North Carolina
% of solar that is DG
% of DG that is residential
24
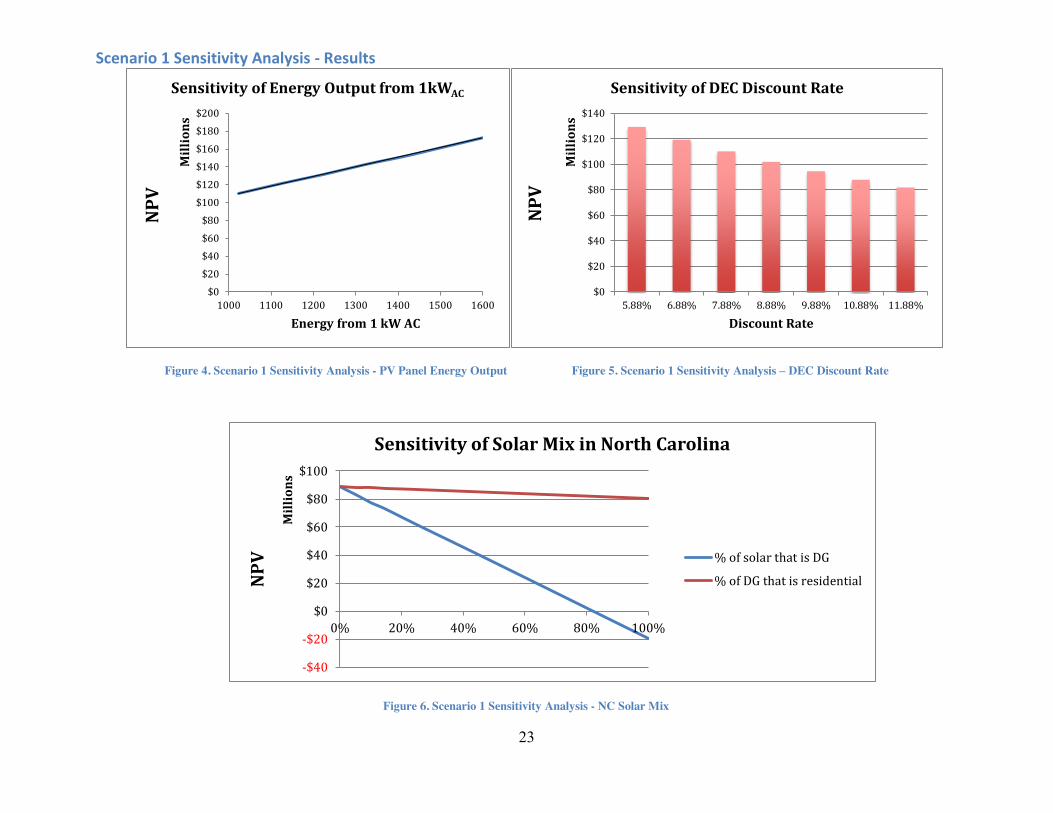
Figures 4 - 6 show the results for the sensitivity analyses performed on Scenario 1’s model inputs.
For Scenario 1, the NPV was positive regardless of the energy output from 1kW of solar power.
At the low end of the sensitivity analysis (1024 kWh/kW) the NPV was $110M, while at the high
end (1624 kWh/kW) the NPV was $175M. Every 100kWh increase in energy output per kW
resulted in a $10.7M increase in NPV, scaling linearly.
Figure 3 shows that NPV drops as DEC’s discount rate increases. At the lowest discount rate
used (5.88%) the NPV was $193M, while at the highest discount rate (11.88%) the NPV was
$122M. In the range specified, a 1% increase in discount rate resulted in a 7-8% drop in NPV.
Figure 4 shows the NPVs of solar for DEC given a range of: 1) the percentage of solar that is
distributed, and 2) the percentage of distributed solar that is residential. The NPV when DEC’s
solar is 100% utility-scale was $177M, while the NPV when the solar is 100% distributed (given
a default of 80% of DG being residential) was -$39M. The break-even point for the proportion of
solar that is DG is 81.7%, above which having more solar be distributed would yield a negative
NPV.
Given a default of 93.75% of utility-scale solar (6.75% DG), the NPV of 0% of the DG being
residential was $178M, while the NPV of 100% of the DG being residential was $160M. NPV
was much less affected by a change in the proportion of residential DG vs. commercial DG than
in a change to the proportion of utility-scale vs. distributed generation.
25
Scenario 2 Sensitivity Analysis – Results
Figure 7. Scenario 2 Sensitivity Analysis – PV Panel Energy Output Figure 8. Scenario 2 Sensitivity Analysis - DEC Discount Rate
Figure 9. Scenario 2 Sensitivity Analysis - NC Solar Mix
$0
$5
$10
$15
$20
$25
$30
$35
$40
$45
$50
1000 1100 1200 1300 1400 1500 1600
NP
V
Mil
lion
s
Energy from 1 kW AC
Sensitivity of Energy Output from 1kWAC
$0
$10
$20
$30
$40
$50
$60
5.88% 6.88% 7.88% 8.88% 9.88% 10.88% 11.88%
NP
V
Mil
lion
s
Discount Rate
Sensitivity of DEC Discount Rate
-$200
-$150
-$100
-$50
$0
$50
$100
0% 20% 40% 60% 80% 100%
NP
V
Mil
lion
s
Sensitivity of Solar Mix in North Carolina
% of solar that is DG
% of DG that isresidential
26
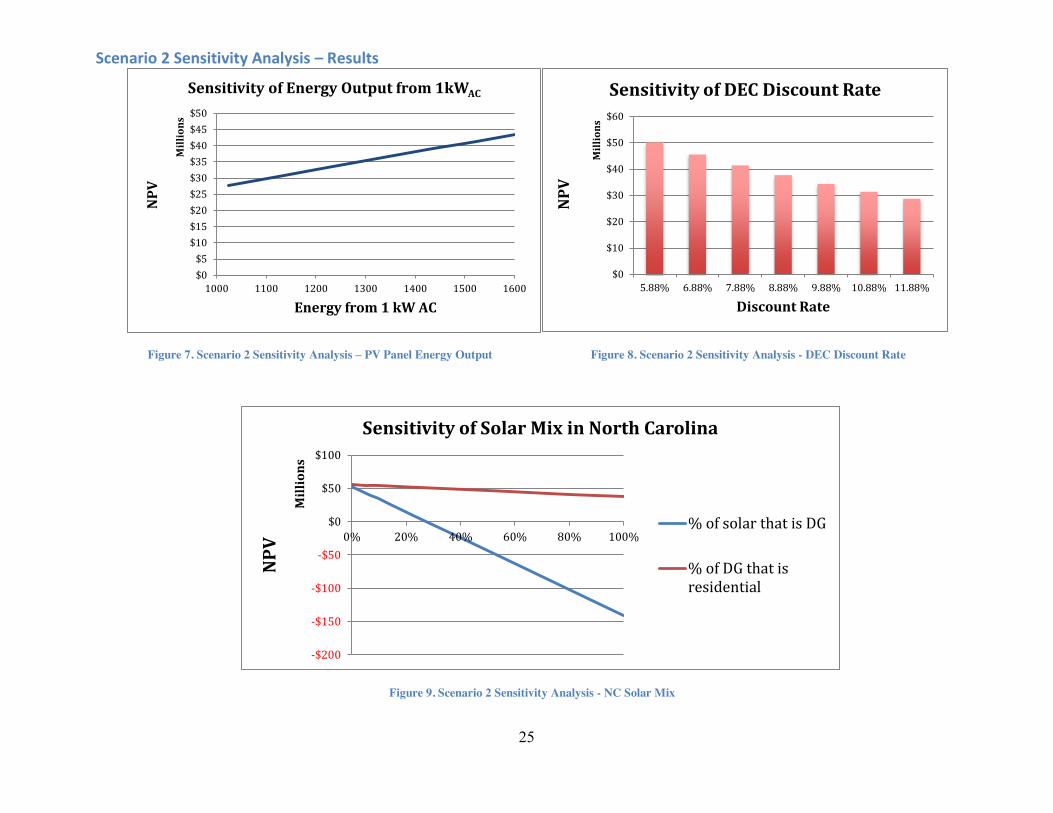
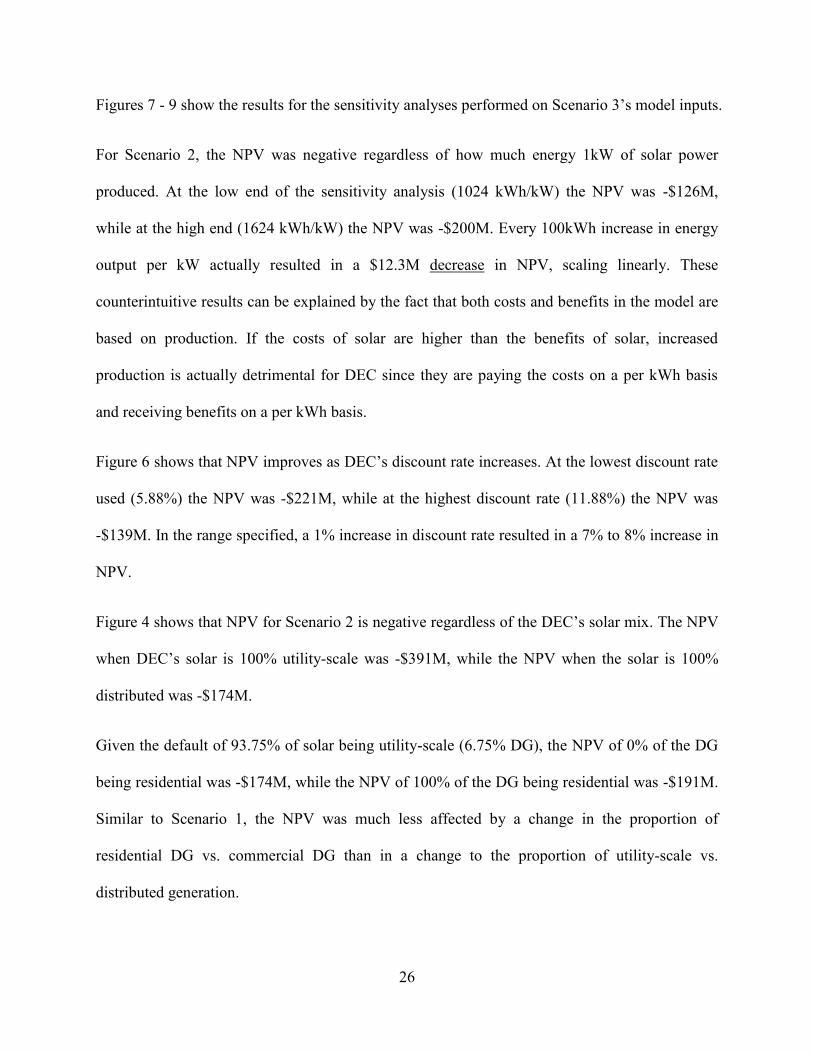
Figures 7 - 9 show the results for the sensitivity analyses performed on Scenario 3’s model inputs.
For Scenario 2, the NPV was negative regardless of how much energy 1kW of solar power
produced. At the low end of the sensitivity analysis (1024 kWh/kW) the NPV was -$126M,
while at the high end (1624 kWh/kW) the NPV was -$200M. Every 100kWh increase in energy
output per kW actually resulted in a $12.3M decrease in NPV, scaling linearly. These
counterintuitive results can be explained by the fact that both costs and benefits in the model are
based on production. If the costs of solar are higher than the benefits of solar, increased
production is actually detrimental for DEC since they are paying the costs on a per kWh basis
and receiving benefits on a per kWh basis.
Figure 6 shows that NPV improves as DEC’s discount rate increases. At the lowest discount rate
used (5.88%) the NPV was -$221M, while at the highest discount rate (11.88%) the NPV was
-$139M. In the range specified, a 1% increase in discount rate resulted in a 7% to 8% increase in
NPV.
Figure 4 shows that NPV for Scenario 2 is negative regardless of the DEC’s solar mix. The NPV
when DEC’s solar is 100% utility-scale was -$391M, while the NPV when the solar is 100%
distributed was -$174M.
Given the default of 93.75% of solar being utility-scale (6.75% DG), the NPV of 0% of the DG
being residential was -$174M, while the NPV of 100% of the DG being residential was -$191M.
Similar to Scenario 1, the NPV was much less affected by a change in the proportion of
residential DG vs. commercial DG than in a change to the proportion of utility-scale vs.
distributed generation.
27
Scenario 3 Sensitivity Analysis – Results
Figure 10. Scenario 3 Sensitivity Analysis – PV Panel Energy Output Figure 11. Scenario 3 Sensitivity Analysis - DEC Discount Rate
Figure 12. Scenario 3 Sensitivity Analysis - NC Solar Mix
$0
$5
$10
$15
$20
$25
$30
$35
$40
$45
$50
1000 1100 1200 1300 1400 1500 1600
NP
V
Mil
lion
s
Energy from 1 kW AC
Sensitivity of Energy Output from 1kWAC
$0
$10
$20
$30
$40
$50
$60
5.88% 6.88% 7.88% 8.88% 9.88% 10.88% 11.88%
NP
V
Mil
lion
s
Discount Rate
Sensitivity of DEC Discount Rate
-$200
-$150
-$100
-$50
$0
$50
$100
0% 20% 40% 60% 80% 100%
NP
V
Mil
lion
s
Sensitivity of Solar Mix in North Carolina
% of solar that is DG
% of DG that is residential
28
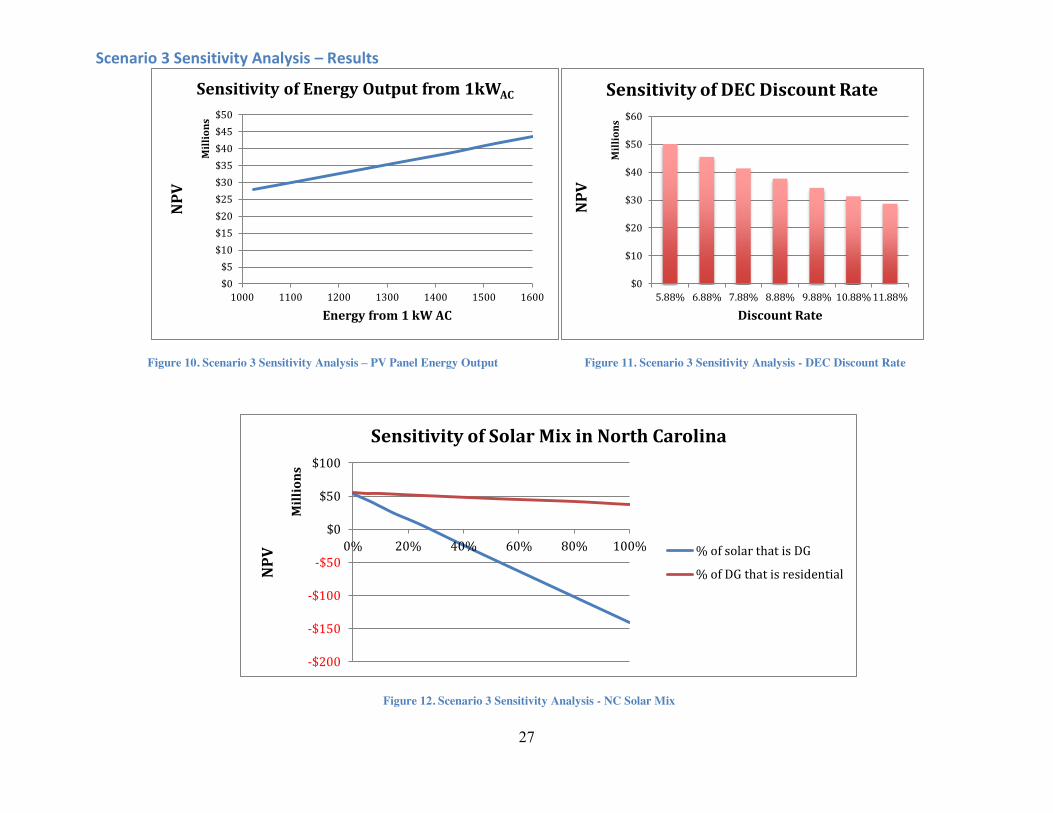
Figures 10 - 12 show the results for the sensitivity analyses performed on Scenario 3’s model
inputs.
Similar to Scenario 1, Scenario 3’s NPV was positive regardless of the energy output from 1kW
of solar power. At the low end of the sensitivity analysis (1024 kWh/kW) the NPV was $28M,
while at the high end (1624 kWh/kW) the NPV was $44M. Every 100kWh increase in energy
output per kW resulted in a $2.7M increase in NPV, scaling linearly.
Figure 9 shows that NPV drops as DEC’s discount rate increases. At the lowest discount rate
used (5.88%) the NPV was $50M, while at the highest discount rate (11.88%) the NPV was
$29M. In the range specified, a 1% increase in discount rate resulted in an 8% to 9% drop in
NPV.
Figure 10 shows the NPVs of solar for DEC given a range of: 1) the percentage of solar that is
distributed, and 2) the percentage of distributed solar that is residential. The NPV when DEC’s
solar is 100% utility-scale was $53M, while the NPV when the solar is 100% distributed (given a
default of 80% of DG being residential) was -$140M. The break-even point for the proportion of
solar that is DG is 27.6%, above which having more solar be distributed would yield a negative
NPV.
Given a default of 93.75% of solar being utility-scale (6.75% DG), the NPV of 0% of the DG
being residential was $56M, while the NPV of 100% of the DG being residential was $38M.
NPV was much less affected by a change in the proportion of residential DG vs. commercial DG
than in a change to the proportion of utility-scale vs. distributed.

29
Discussion and Conclusion
Comparing the NPVs of the three scenarios yields some interesting observations. First, as shown
by the negative NPV of Scenario 2, it is clear that current NCUC-approved avoided
energy/avoided capacity rates do not do enough to incentivize DEC to pursue more distributed
and/or utility-scale solar energy. However, the question of whether or not the NCUC is valuing
solar energy appropriately remains unanswered. Given that the REPS requirement includes a
solar carve out, it is mandatory that North Carolina utilities procure a certain amount of their
generation portfolio from solar resources, regardless of whether or not the incentives are aligned
correctly. However, until a more comprehensive valuation study of solar is completed for the
state, it likely that solar may not be growing at the rate that is optimal.
The positive NPVs of Scenarios 1 and 3 show that, when additional benefits of solar are
monetized and factored into value calculations, the benefits of solar outweigh the costs. This
finding is corroborated by the RMI study (Rocky Mountain Institute, 2013). In the fourteen
studies that the RMI analysis profiled, twelve of the studies showed the benefits of solar
outweighing the costs. The NCUC has already recognized the need for more detailed integration
studies, and has requested that these studies be carried out as solar penetration becomes more
pervasive (North Carolina Utilities Commission, 2014).
A logical solution to the controversy surrounding solar in North Carolina is for the NCUC to
follow the leads of the state of Minnesota and city of Austin, TX in enacting a Value-of-Solar
Tariff (VOST) (Clean Power Research, 2014; Clean Power Research, 2006). A VOST is a rate
design that assigns a value to each benefit of solar, and then compensates customers with solar
installations commensurate with the sum of those benefits. Currently in Minnesota and Austin,
the VOST is being used to compensate DG customers as an alternative to net metering. While
30
this same strategy could alleviate conflict surrounding solar DG compensation in North Carolina,
a bigger issue is how to compensate utility-scale solar customers. Considering the solar
landscape in North Carolina (>90% utility-scale solar), this is arguably the question that solar
advocates should be asking.
The most recent Avoided Cost proceedings revolved mostly around the length of PPA contracts,
and whether utility-scale developers should be given the standard contract offer or the negotiated
contract offer. However, there is still a lot of uncertainty about how the Avoided Cost rates are
calculated in the first place. NCUC staff state that Avoided Cost rates already encompass
avoided T&D costs, and that perhaps these costs are too high since DEC still has the obligation
to serve when the sun is not shining (North Carolina Utilities Commission, 2015). However, it is
impossible for outside stakeholders to check these assumptions given that the Avoided Cost
calculations are confidential. The same holds true for other benefits that may already
incorporated into Avoided Cost calculations. For this reason, many of the current solar
benefit/cost studies argue for greater transparency around Avoided Cost calculations (Rocky
Mountain Institute, 2013; Crossborder Energy, 2013).
In addition to greater transparency, it also makes sense for different energy resources to be paid
different Avoided Cost rates since each resource offers its own benefits and costs. For example,
utility-scale solar is easier to site closer to distribution networks than wind farms. Biomass
energy plants that combust swine and poultry waste may offer benefits from avoided water
pollution or avoided costs from less agricultural wastes. Duke Energy states that it spent $20M
on cleanup efforts from the Dan River coal ash spill (Duke Energy, 2014). NC WARN points out
that solar (and potentially other energy sources) have near-zero water usage, zero waste storage
costs, and zero risk of fuel cost increases (Kennedy, 2012). The NCUC has already begun to
31
address this issue with Finding of Fact # 10 in its 2014 Order Setting Avoided Cost Inputs (North
Carolina Utilities Commission, 2014):
“Integration of solar resources into a utility’s generation mix, depending in part upon their location, may result in costs and/or benefits, many of which may be appropriate for inclusion in a utility's avoided cost calculations. Thus, it is appropriate for the costs and benefits attributed to solar integration as such integration becomes more pervasive to be more fully evaluated in detailed integration studies.”
It is imperative that the NCUC make the methodologies from these studies transparent
so that all stakeholders can provide input.
While Duke Energy recently made a $500M investment into solar power for North
Carolina, the investment came with mixed reviews from the solar community (Trabish,
2014). Opponents claim that, according to its long-range plans, this investment is the
only step Duke Energy plans to move forward with solar in the next 15 years. Ultimately,
as long as North Carolina remains a fully-regulated state for electricity, it will be up to
the NCUC to determine solar growth in the state. While there is already an REPS
requirement in the state, the solar carve-out is low at 0.2% (Duke Energy Carolinas
(DEC), 2014). This number is relatively small compared to other states (Zientara, 2014).
One way the NCUC could increase solar power in the state would be to increase the
carve-out.
If North Carolina does not reevaluate how it compensates solar power producers, we run
the risk of stifling a growing job market. Solar is one of the fastest growing sectors of
the US economy (Kennedy, 2012). Additionally, neighboring states like South Carolina
and Georgia are beginning to enter the solar market. We could very well lose solar
developers to these states if our policies do not encourage the market to grow.
32
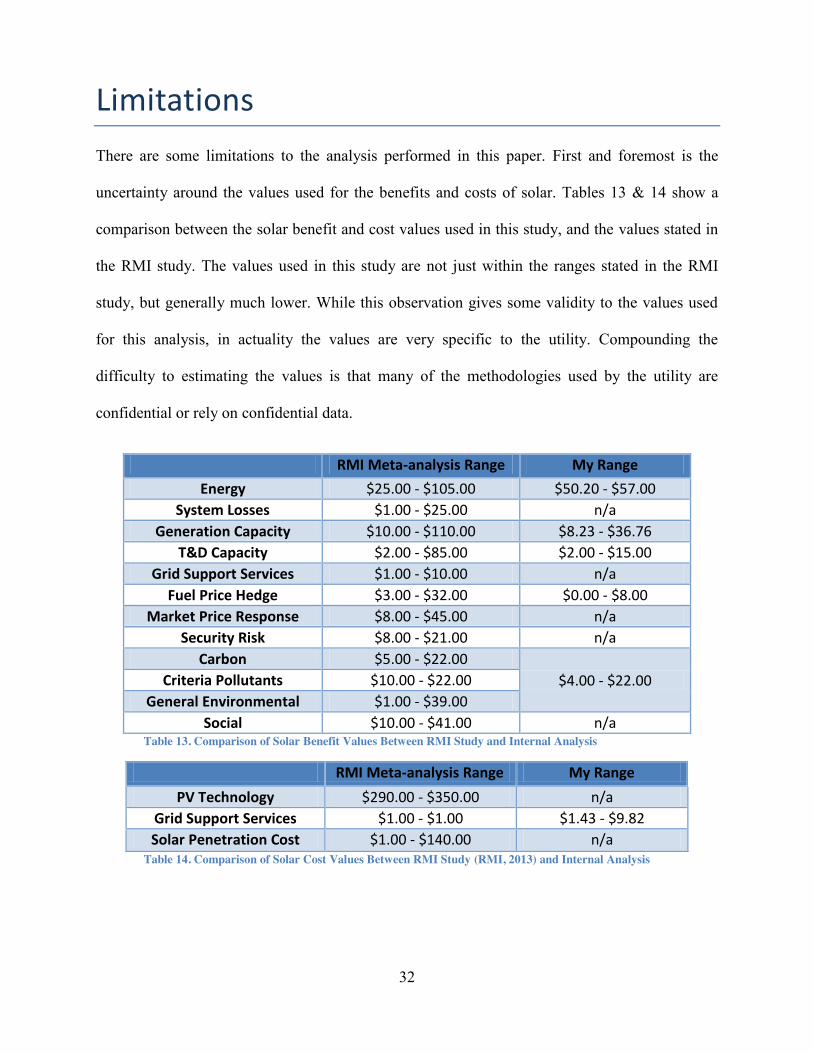
Limitations There are some limitations to the analysis performed in this paper. First and foremost is the
uncertainty around the values used for the benefits and costs of solar. Tables 13 & 14 show a
comparison between the solar benefit and cost values used in this study, and the values stated in
the RMI study. The values used in this study are not just within the ranges stated in the RMI
study, but generally much lower. While this observation gives some validity to the values used
for this analysis, in actuality the values are very specific to the utility. Compounding the
difficulty to estimating the values is that many of the methodologies used by the utility are
confidential or rely on confidential data.
RMI Meta-analysis Range My Range Energy $25.00 - $105.00 $50.20 - $57.00
System Losses $1.00 - $25.00 n/a
Generation Capacity $10.00 - $110.00 $8.23 - $36.76
T&D Capacity $2.00 - $85.00 $2.00 - $15.00
Grid Support Services $1.00 - $10.00 n/a
Fuel Price Hedge $3.00 - $32.00 $0.00 - $8.00
Market Price Response $8.00 - $45.00 n/a
Security Risk $8.00 - $21.00 n/a
Carbon $5.00 - $22.00
$4.00 - $22.00 Criteria Pollutants $10.00 - $22.00
General Environmental $1.00 - $39.00
Social $10.00 - $41.00 n/a
Table 13. Comparison of Solar Benefit Values Between RMI Study and Internal Analysis
RMI Meta-analysis Range My Range PV Technology $290.00 - $350.00 n/a
Grid Support Services $1.00 - $1.00 $1.43 - $9.82
Solar Penetration Cost $1.00 - $140.00 n/a
Table 14. Comparison of Solar Cost Values Between RMI Study (RMI, 2013) and Internal Analysis
33
A second limitation in the study is the uncertainty around the solar mix in North Carolina. In
email correspondence with the NCUC (North Carolina Utilities Commission, 2015), public staff
stated that the first report from DEC, DEP, and DNCP on interconnected facilities is due in
Spring 2015. This report should add clarity to exactly how much of the solar in DEC’s system is
utility-scale vs. DG. The Excel model used for this analysis allows for these inputs to be easily
changed.
Another limitation to this study is that it only encompasses a portion of North Carolina
ratepayers. Due to the limited time allowed to complete this project, it was impractical to scour
the commission documents of the two other major North Carolina utilities. However, since the
federal/state incentives and policy landscape do not vary by utility, it is likely that their situations
are similar to DEC’s. Additionally, DEP is a subsidiary of Duke Energy and thus likely faces
similar rules to DEC regarding Avoided Cost calculations and net metering rates.
A final limitation to this study is that it does not fully account for the effects of more solar on
DEC’s system. While integration costs attempt to put a monetary value of having more
intermittent resources on the system, the true technical impacts of more solar on the grid are still
unknown.
34
Acknowledgements
I would like to thank my advisor, Dr. Timothy L. Johnson, for his valuable and timely feedback,
and for providing a schedule of deadlines that helped break this undertaking into bite-size pieces.
Many thanks to the public staff at the NCUC, specifically Kennie Ellis, Jack Floyd, and Jay
Lucas, for their guidance in navigating the labyrinth of utility commission documents. I
benefitted greatly from conversations with Justin LaRoche from Duke Energy and Nancy
LaPlaca from NC WARN when I initially started researching the topic. They provided excellent
background on some of the key issues surrounding solar in North Carolina. I also need to
acknowledge R. Thomas Beach and Patrick G. McGuide, whom I never spoke with but who
authored the Crossborder study which served as a great jumping off point for my analysis.
Finally, I would like to thank the Nicholas School of the Environment for providing the
resources to get me interested in the topic in the first place.

35
Appendix
Appendix A. Solar Benefit and Cost Values Used in the Crossborder Study
BENEFITS
Avoided Energy $57 - $65
Avoided Generation Capacity (DG) $22 - $37
Avoided Generation Capacity (Utility-Scale) $19 - $32
Hedging Value $8
Avoided Transmission Costs $0 - $10
Avoided Distribution Costs (DG only) $2 - $5
Environmental Value $4 - $22
Avoided Renewables (DG) $1 - $22
Avoided Renewables (Wholesale) $10 - $20
COSTS PPA (Utility-Scale) $70 - $90
Lost Revenues - Residential (DG) $98 - $107
Lost Revenues - Commercial (DG) $80 - $87
Integration (DG and Wholesale) $3
36
Appendix B. Model Calculation Methodology Energy Production Inputs
Model Input Calculation Method Total Solar Energy Produced MWAC Nameplate in System from IRP x 8760 hrs x Capacity Factor (17.4%)
Utility-Scale Energy Produced Total Solar Energy Produced (MWh) x % of solar that is utility-scale (Default of 93.75%)
Residential DG Energy
Produced
Total Solar Energy Produced (MWh) x % of solar that is DG (6.25%) x % of DG that is Residential (Default of
80%)
Commercial DG Energy
Produced
Total Solar Energy Produced (MWh) x % of solar that is DG (6.25%) x % of DG that is Commercial (Default of
20%)
Total DG Produced Residential DG Energy Produced (MWh) + Commercial DG Energy Produced (MWh)
Benefits
Model Input Calculation Method Avoided Energy Value Total Solar Energy Produced (MWh) x Avoided Energy Value ($/MWh)
Avoided Capacity Value [Utility-Scale Energy Produced (MWh) x Avoided Capacity Value (Util. Scale)] + [Total DG Produced (MWh) x
Avoided Capacity Value (DG)]
Hedging Value Total Solar Energy Produced (MWh) x Avoided Hedging Value ($/MWh)
Avoided Transmission Value Total Solar Energy Produced (MWh) x Avoided Transmission Value ($/MWh)
Avoided Distribution Value
(DG only) Total DG Produced (MWh) x Avoided Distribution Value ($/MWh)
Environmental Value Total Solar Energy Produced (MWh) x Avoided Environmental Costs Value ($/MWh)
Avoided Renewables [Utility-Scale Energy Produced (MWh) x Avoided Renewables Value (Util. Scale)] + [Total DG Produced (MWh)
x Avoided Renewables Value (DG)]
Total Benefits Σ (All Benefit Values)
37
Costs
Model Input Calculation Method PPA Costs (Utility-Scale) Utility-Scale Energy Produced (MWh) x PPA Price ($/MWh)
Lost Revenues (Residential) Residential DG Energy Produced (MWh) x Lost Revenues for Residential ($/MWh)
Lost Revenues (Commercial) Commercial DG Energy Produced (MWh) x Lost Revenues for Commercial ($/MWh)
Integration Costs Total Solar Energy Produced (MWh) x Integrations Costs ($/MWh)
Total Costs Σ (All Cost Values)

38
Appendix C-1. Scenario 1 Cash Flows and Results
2015 2016 2017 2018 2019 2020 2021 2022 2023 2024 2025 2026 2027 2028 2029 Solar DEC Base Case
Nameplate (MWac) 480 554 572 597 719 869 1,009 1,139 1,265 1,381 1,498 1,605 1,702 1,754 1,681
Solar energy produced
(MWh) 731,635 844,429 871,865 909,971 1,095,929 1,324,565 1,537,958 1,736,109 1,928,164 2,104,975 2,283,312 2,446,405 2,594,256 2,673,517 2,562,247
Utility Scale Energy
Produced (MWh) 685,908 791,652 817,374 853,098 1,027,433 1,241,779 1,441,836 1,627,603 1,807,653 1,973,414 2,140,605 2,293,505 2,432,115 2,506,422 2,402,107
Residential DG Energy
Produced (MWh) 36,582 42,221 43,593 45,499 54,796 66,228 76,898 86,805 96,408 105,249 114,166 122,320 129,713 133,676 128,112
Commercial DG Energy
Produced (MWh) 9,145 10,555 10,898 11,375 13,699 16,557 19,224 21,701 24,102 26,312 28,541 30,580 32,428 33,419 32,028
Total DG Produced
(MWh) 45,727 52,777 54,492 56,873 68,496 82,785 96,122 108,507 120,510 131,561 142,707 152,900 162,141 167,095 160,140
Avoided Energy Value
$36,729,139 $42,391,548 $43,768,891 $45,681,867 $55,017,190 $66,495,046 $77,207,712 $87,155,187 $96,796,586 $105,672,795 $114,625,523 $122,813,060 $130,235,407 $134,214,397 $128,628,507
Avoided Capacity Value
$6,075,481 $7,012,118 $7,239,948 $7,556,380 $9,100,564 $10,999,152 $12,771,168 $14,416,611 $16,011,424 $17,479,666 $18,960,564 $20,314,890 $21,542,644 $22,200,821 $21,276,841
Hedging Value
$5,853,082 $6,755,432 $6,974,922 $7,279,770 $8,767,428 $10,596,516 $12,303,665 $13,888,875 $15,425,309 $16,839,804 $18,266,492 $19,571,242 $20,754,052 $21,388,136 $20,497,980
Avoided Transmission
Value
$3,658,176 $4,222,145 $4,359,326 $4,549,856 $5,479,643 $6,622,823 $7,689,791 $8,680,547 $9,640,818 $10,524,877 $11,416,558 $12,232,026 $12,971,282 $13,367,585 $12,811,237
Avoided Distribution
Value (DG only)
$160,045 $184,719 $190,721 $199,056 $239,734 $289,748 $336,428 $379,774 $421,786 $460,463 $499,474 $535,151 $567,494 $584,832 $560,492
Environmental Value
$9,511,258 $10,977,576 $11,334,249 $11,829,627 $14,247,071 $17,219,339 $19,993,456 $22,569,422 $25,066,127 $27,364,681 $29,683,050 $31,803,268 $33,725,334 $34,755,720 $33,309,217
Avoided Renewables
(DG)
$524,948 $605,878 $625,563 $652,904 $786,329 $950,375 $1,103,485 $1,245,658 $1,383,457 $1,510,320 $1,638,276 $1,755,296 $1,861,379 $1,918,248 $1,838,413
Avoided Renewables
(Wholesale)
$10,288,620 $11,874,782 $12,260,606 $12,796,471 $15,411,495 $18,626,689 $21,627,537 $24,414,038 $27,114,801 $29,601,217 $32,109,068 $34,402,573 $36,481,732 $37,596,332 $36,031,605
Total Benefits
$72,800,749 $84,024,198 $86,754,226 $90,545,932 $109,049,456 $131,799,690 $153,033,242 $172,750,111 $191,860,308 $209,453,822 $227,199,005 $243,427,505 $258,139,323 $266,026,071 $254,954,290
PPA Costs (Wholesale)
$54,872,640 $63,332,172 $65,389,896 $68,247,846 $82,194,642 $99,342,342 $115,346,862 $130,208,202 $144,612,270 $157,873,158 $171,248,364 $183,480,390 $194,569,236 $200,513,772 $192,168,558
Lost Revenues
(Residential)
$3,749,630 $4,327,698 $4,468,310 $4,663,603 $5,616,634 $6,788,393 $7,882,036 $8,897,560 $9,881,838 $10,787,999 $11,701,972 $12,537,827 $13,295,564 $13,701,774 $13,131,518
Lost Revenues
(Commercial)
$736,208 $849,707 $877,314 $915,659 $1,102,778 $1,332,843 $1,547,570 $1,746,960 $1,940,215 $2,118,132 $2,297,582 $2,461,695 $2,610,471 $2,690,226 $2,578,261
Integration Costs
$4,115,448 $4,749,913 $4,904,242 $5,118,588 $6,164,598 $7,450,676 $8,651,015 $9,765,615 $10,845,920 $11,840,487 $12,843,627 $13,761,029 $14,592,693 $15,038,533 $14,412,642
Total Costs $63,473,926 $73,259,490 $75,639,762 $78,945,696 $95,078,652 $114,914,254 $133,427,483 $150,618,338 $167,280,243 $182,619,776 $198,091,545 $212,240,941 $225,067,964 $231,944,306 $222,290,979
Benefits - Costs $9,326,823 $10,764,708 $11,114,464 $11,600,236 $13,970,803 $16,885,436 $19,605,759 $22,131,773 $24,580,064 $26,834,047 $29,107,460 $31,186,564 $33,071,359 $34,081,765 $32,663,311
NPV = $163,947,528
39
Appendix C-2. Scenario 2 Cash Flows and Results
2015 2016 2017 2018 2019 2020 2021 2022 2023 2024 2025 2026 2027 2028 2029 Solar DEC Base Case
Nameplate (MWac) 480 554 572 597 719 869 1,009 1,139 1,265 1,381 1,498 1,605 1,702 1,754 1,681
Solar energy produced
(MWh) 731,635 844,429 871,865 909,971 1,095,929 1,324,565 1,537,958 1,736,109 1,928,164 2,104,975 2,283,312 2,446,405 2,594,256 2,673,517 2,562,247
Utility Scale Energy
Produced (MWh) 685,908 791,652 817,374 853,098 1,027,433 1,241,779 1,441,836 1,627,603 1,807,653 1,973,414 2,140,605 2,293,505 2,432,115 2,506,422 2,402,107
Residential DG Energy
Produced (MWh) 36,582 42,221 43,593 45,499 54,796 66,228 76,898 86,805 96,408 105,249 114,166 122,320 129,713 133,676 128,112
Commercial DG Energy
Produced (MWh) 9,145 10,555 10,898 11,375 13,699 16,557 19,224 21,701 24,102 26,312 28,541 30,580 32,428 33,419 32,028
Total DG Produced
(MWh) 45,727 52,777 54,492 56,873 68,496 82,785 96,122 108,507 120,510 131,561 142,707 152,900 162,141 167,095 160,140
Avoided Energy Value
$36,729,139 $42,391,548 $43,768,891 $45,681,867 $55,017,190 $66,495,046 $77,207,712 $87,155,187 $96,796,586 $105,672,795 $114,625,523 $122,813,060 $130,235,407 $134,214,397 $128,628,507
Avoided Capacity Value
$6,075,481 $7,012,118 $7,239,948 $7,556,380 $9,100,564 $10,999,152 $12,771,168 $14,416,611 $16,011,424 $17,479,666 $18,960,564 $20,314,890 $21,542,644 $22,200,821 $21,276,841
Hedging Value
$5,853,082 $6,755,432 $6,974,922 $7,279,770 $8,767,428 $10,596,516 $12,303,665 $13,888,875 $15,425,309 $16,839,804 $18,266,492 $19,571,242 $20,754,052 $21,388,136 $20,497,980
Avoided Transmission
Value
$0 $0 $0 $0 $0 $0 $0 $0 $0 $0 $0 $0 $0 $0 $0
Avoided Distribution
Value (DG only)
$0 $0 $0 $0 $0 $0 $0 $0 $0 $0 $0 $0 $0 $0 $0
Environmental Value
$0 $0 $0 $0 $0 $0 $0 $0 $0 $0 $0 $0 $0 $0 $0
Avoided Renewables
(DG)
$0 $0 $0 $0 $0 $0 $0 $0 $0 $0 $0 $0 $0 $0 $0
Avoided Renewables
(Wholesale)
$0 $0 $0 $0 $0 $0 $0 $0 $0 $0 $0 $0 $0 $0 $0
Total Benefits
$48,657,702 $56,159,098 $57,983,762 $60,518,017 $72,885,183 $88,090,715 $102,282,545 $115,460,672 $128,233,319 $139,992,264 $151,852,579 $162,699,192 $172,532,102 $177,803,353 $170,403,328
PPA Costs (Wholesale)
$54,872,640 $63,332,172 $65,389,896 $68,247,846 $82,194,642 $99,342,342 $115,346,862 $130,208,202 $144,612,270 $157,873,158 $171,248,364 $183,480,390 $194,569,236 $200,513,772 $192,168,558
Lost Revenues
(Residential)
$3,749,630 $4,327,698 $4,468,310 $4,663,603 $5,616,634 $6,788,393 $7,882,036 $8,897,560 $9,881,838 $10,787,999 $11,701,972 $12,537,827 $13,295,564 $13,701,774 $13,131,518
Lost Revenues
(Commercial)
$736,208 $849,707 $877,314 $915,659 $1,102,778 $1,332,843 $1,547,570 $1,746,960 $1,940,215 $2,118,132 $2,297,582 $2,461,695 $2,610,471 $2,690,226 $2,578,261
Integration Costs
$0 $0 $0 $0 $0 $0 $0 $0 $0 $0 $0 $0 $0 $0 $0
Total Costs
$59,358,478 $68,509,577 $70,735,520 $73,827,107 $88,914,054 $107,463,578 $124,776,468 $140,852,723 $156,434,323 $170,779,289 $185,247,918 $198,479,912 $210,475,271 $216,905,773 $207,878,338
Benefits - Costs $10,700,776 $12,350,479 $12,751,758 $13,309,090 $16,028,871 $19,372,864 $22,493,923 $25,392,050 $28,201,004 $30,787,025 $33,395,339 $35,780,720 $37,943,169 $39,102,420 $37,475,010
NPV = -$188,098,972
40
Appendix C-3. Scenario 3 Cash Flows and Results
2015 2016 2017 2018 2019 2020 2021 2022 2023 2024 2025 2026 2027 2028 2029 Solar DEC Base Case
Nameplate (MWac) 480 554 572 597 719 869 1,009 1,139 1,265 1,381 1,498 1,605 1,702 1,754 1,681
Solar energy produced
(MWh) 731,635 844,429 871,865 909,971 1,095,929 1,324,565 1,537,958 1,736,109 1,928,164 2,104,975 2,283,312 2,446,405 2,594,256 2,673,517 2,562,247
Utility Scale Energy
Produced (MWh) 685,908 791,652 817,374 853,098 1,027,433 1,241,779 1,441,836 1,627,603 1,807,653 1,973,414 2,140,605 2,293,505 2,432,115 2,506,422 2,402,107
Residential DG Energy
Produced (MWh) 36,582 42,221 43,593 45,499 54,796 66,228 76,898 86,805 96,408 105,249 114,166 122,320 129,713 133,676 128,112
Commercial DG Energy
Produced (MWh) 9,145 10,555 10,898 11,375 13,699 16,557 19,224 21,701 24,102 26,312 28,541 30,580 32,428 33,419 32,028
Total DG Produced
(MWh) 45,727 52,777 54,492 56,873 68,496 82,785 96,122 108,507 120,510 131,561 142,707 152,900 162,141 167,095 160,140
Avoided Energy Value
$39,216,173 $45,262,000 $46,732,606 $48,775,115 $58,742,559 $70,997,613 $82,435,663 $93,056,710 $103,350,956 $112,828,197 $122,387,140 $131,129,078 $139,054,013 $143,302,432 $137,338,305
Avoided Capacity Value
$14,840,161 $17,128,019 $17,684,525 $18,457,450 $22,229,324 $26,866,874 $31,195,254 $35,214,464 $39,110,007 $42,696,379 $46,313,668 $49,621,787 $52,620,736 $54,228,420 $51,971,479
Hedging Value
$5,853,082 $6,755,432 $6,974,922 $7,279,770 $8,767,428 $10,596,516 $12,303,665 $13,888,875 $15,425,309 $16,839,804 $18,266,492 $19,571,242 $20,754,052 $21,388,136 $20,497,980
Avoided Transmission
Value
$0 $0 $0 $0 $0 $0 $0 $0 $0 $0 $0 $0 $0 $0 $0
Avoided Distribution
Value (DG only)
$0 $0 $0 $0 $0 $0 $0 $0 $0 $0 $0 $0 $0 $0 $0
Environmental Value
$0 $0 $0 $0 $0 $17,219,339 $19,993,456 $22,569,422 $25,066,127 $27,364,681 $29,683,050 $31,803,268 $33,725,334 $34,755,720 $33,309,217
Avoided Renewables
(DG)
$0 $0 $0 $0 $0 $0 $0 $0 $0 $0 $0 $0 $0 $0 $0
Avoided Renewables
(Wholesale)
$0 $0 $0 $0 $0 $0 $0 $0 $0 $0 $0 $0 $0 $0 $0
Total Benefits
$59,909,415 $69,145,450 $71,392,053 $74,512,335 $89,739,311 $125,680,343 $145,928,039 $164,729,471 $182,952,398 $199,729,060 $216,650,349 $232,125,374 $246,154,135 $253,674,708 $243,116,981
PPA Costs (Wholesale) $54,872,640 $63,332,172 $65,389,896 $68,247,846 $82,194,642 $99,342,342 $115,346,862 $130,208,202 $144,612,270 $157,873,158 $171,248,364 $183,480,390 $194,569,236 $200,513,772 $192,168,558
Lost Revenues
(Residential) $3,749,630 $4,327,698 $4,468,310 $4,663,603 $5,616,634 $6,788,393 $7,882,036 $8,897,560 $9,881,838 $10,787,999 $11,701,972 $12,537,827 $13,295,564 $13,701,774 $13,131,518
Lost Revenues
(Commercial) $736,208 $849,707 $877,314 $915,659 $1,102,778 $1,332,843 $1,547,570 $1,746,960 $1,940,215 $2,118,132 $2,297,582 $2,461,695 $2,610,471 $2,690,226 $2,578,261
Integration Costs $1,046,238 $1,207,533 $1,246,767 $1,301,259 $1,567,178 $1,894,127 $15,102,749 $17,048,594 $18,934,567 $20,670,859 $22,422,119 $24,023,699 $25,475,599 $26,253,937 $25,161,270
Total Costs $60,404,717 $69,717,110 $71,982,287 $75,128,366 $90,481,232 $109,357,706 $139,879,217 $157,901,316 $175,368,890 $191,450,147 $207,670,037 $222,503,611 $235,950,870 $243,159,709 $233,039,607
Benefits - Costs $495,302 $571,661 $590,234 $616,031 $741,920 $16,322,637 $6,048,822 $6,828,155 $7,583,508 $8,278,913 $8,980,312 $9,621,763 $10,203,266 $10,514,999
$10,077,373
NPV $41,404,070
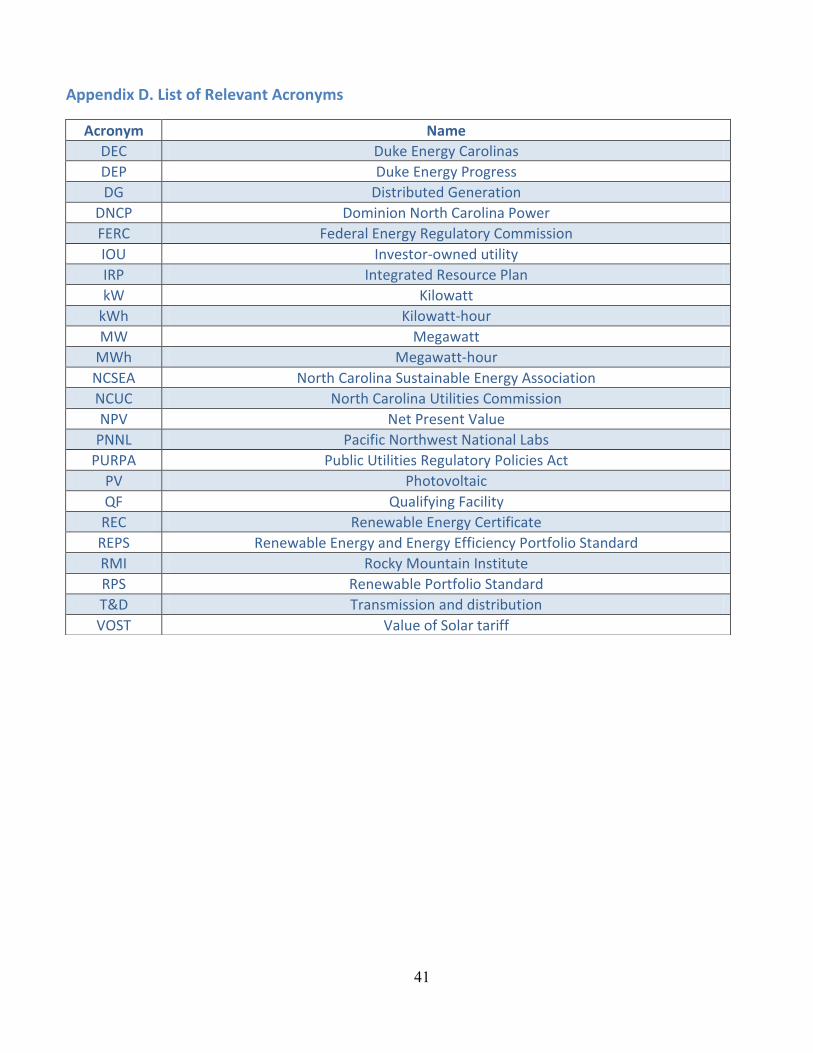
41
Appendix D. List of Relevant Acronyms
Acronym Name
DEC Duke Energy Carolinas
DEP Duke Energy Progress
DG Distributed Generation
DNCP Dominion North Carolina Power
FERC Federal Energy Regulatory Commission
IOU Investor-owned utility
IRP Integrated Resource Plan
kW Kilowatt
kWh Kilowatt-hour
MW Megawatt
MWh Megawatt-hour
NCSEA North Carolina Sustainable Energy Association
NCUC North Carolina Utilities Commission
NPV Net Present Value
PNNL Pacific Northwest National Labs
PURPA Public Utilities Regulatory Policies Act
PV Photovoltaic
QF Qualifying Facility
REC Renewable Energy Certificate
REPS Renewable Energy and Energy Efficiency Portfolio Standard
RMI Rocky Mountain Institute
RPS Renewable Portfolio Standard
T&D Transmission and distribution
VOST Value of Solar tariff
42
Bibliography Carolina Country Magazine. (2013). A Guide to Electric Utilities in North Carolina. Raleigh: Carolina Country Magazine.
Clean Power Research. (2014). Minnesota Value of Solar: Methodology . St. Paul, MN: Minnesota Department of Commerce, Division of Energy Resources .
Clean Power Research. (2006). The Value of Distributed Photovoltaics to Austin Energy and the City of Austin . Austin, TX: Austin Energy.
Crossborder Energy. (2013). The Benefits and Costs of Solar Distributed Generation for Arizona Public Service . Phoenix: Arizona Public Service.
Crossborder Energy. (2013). The Benefits and Costs of Solar Generation for Electric Ratepayers in North Carolina . Raleigh: North Carolina Sustainable Energy Association.
Duke Energy Carolinas (DEC). (2014). Integrated Resource Plan (Annual Report). Charlotte: Duke Energy.
Duke Energy Carolinas. (2014, March 31). Schedule PP-N (NC) Non-Hydorelectric Qualifying Facilities Purchased Power. NCUC Docket No. E-100, Sub13 . Raleigh, NC, USA.
Duke Energy. (2014, September 1). Duke Energy website. Retrieved April 16, 2015, from Dan River Response: http://www.duke-energy.com/dan-river/
Electric Power Supply Association. (2015, April 8). Electric Power Supply Association website. Retrieved April 8, 2015, from What is PURPA?: https://www.epsa.org/industry/faqs/?fa=purpa).
Energy & Policy Institute. (2014, February 20). Energy & Policy Institute Website. Retrieved April 14, 2014, from Net Metering 2014: North Carolina’s Duke Energy Plans Attack on Solar: http://www.energyandpolicy.org/net_metering_2014_north_carolina_s_duke_energy_plans_attack_on_solar
Environmental Protection Agency. (2014, April 15). Green Power Partnership - Renewable Energy Certificates (RECs). Retrieved April 5, 2015, from United States Environmental Protection Agency website: http://www.epa.gov/greenpower/gpmarket/rec.htm
Federal Energy Regulatory Commission. (2012, February 3). FERC website. Retrieved April 8, 2015, from What is a Qualifying Facility?: http://www.ferc.gov/industries/electric/gen-info/qual-fac/what-is.asp
Henderson, B. (2014, July 15). The Charlotte Observer website. Retrieved April 8, 2015, from Loca News: http://www.charlotteobserver.com/news/local/article9140906.html#.U8_CZYBdXSY
Independent Energy Producers Association. (2015, April 8). Independent Energy Producers Association website. Retrieved April 8, 2015, from Avoided Costs: http://www.iepa.com/avoid.asp
43
Kennedy, D. (2012, November 5). Forbes website. Retrieved April 21, 2015, from Solar: America's Fastest Growing Job-Creation Engine?: http://www.forbes.com/sites/toddwoody/2012/11/05/solar-americas-fastest-growing-job-creation-engine/
Kincer, H. B. (2014). Here Comes the Sun: Solar Energy Price Trends. Novogradac & Company LLP. San Francisco: Michael J. Novogradac.
Long-Run Avoided Cost of Duke, CP&L, and Virginia Power., E-100 Sub 41A (State of North Carolina October 1, 1984).
Lucas, J. (2015, February 25). Public staff at North Carolina Utilities Commission. (A. Singh, Interviewer)
NC Clean Energy Technology Center. (2014, September 4). DSIRE: Database of Energy Efficiency, Renewable Energy Solar Incentives, Rebates, Programs, Policy. Retrieved April 14, 2014, from http://programs.dsireusa.org/system/program/detail/1246
NCSEA. (2012). A Citizen's Guide - North Carolina Renewable Energy & Energy Efficiency Portfolio Standard. Industry Report, North Carolina Sustainable Energy Association, Raleigh.
North Carolina Utilities Commission. (2015, February 25). Email correspondance. Raleigh, NC, USA.
North Carolina Utilities Commission. (2015). North Carolina Utilities Commission website. Retrieved April 10, 2015, from Electric Industry: http://www.ncuc.commerce.state.nc.us/industries/electric/electric.htm
NREL. (2014). Distributed Solar PV for Electrcity System Resiliency - Policy and Regulatory Considerations. Golden: NREL.
Order Granting General Rate Case Increase, E-7 Sub 1026 (State of North Carolina September 24, 2013).
Order Setting Avoided Cost Input Parameters, E-100 Sub 140 (State of North Carolina December 31, 2014).
Pacific Northwest National Laboratory. (2014). Duke Energy Photovoltaic Integration Study: Carolinas Service Areas . Washington, D.C.: US Department of Energy.
Rocky Mountain Institute. (2013). A Review of Solar PV Benefit & Cost Studies. Rocky Mountain Institute. Boulder: Rocky Mountain Institute.
Rocky Mountain Institute. (2014). Bridges to New Solar Business Models: Opportunities to Increase and Capture the Value of Distributed Solar Photovoltaics. Boulder: RMI.
SEIA. (2013, July 1). SEIA website. Retrieved April 21, 2015, from Net Metering: http://www.seia.org/policy/distributed-solar/net-metering
SEIA. (2014, December 1). SEIA website. Retrieved April 21, 2015, from Solar Industry Data: http://www.seia.org/research-resources/solar-industry-data
44
SEIA. (2014). State Solar Policy - North Carolina Solar. Retrieved February 23, 2014, from SEIA Website: http://www.seia.org/state-solar-policy/north-carolina
Trabish, H. K. (2014, September 18). Greentech Media Solar Website. Retrieved April 16, 2015, from Duke Buying $500M of North Carolina Solar to Mixed Reviews: http://www.greentechmedia.com/articles/read/Duke-Buying-500M-of-North-Carolina-Solar-to-Mixed-Reviews
U.S. Department of Energy. (2015, April 5). Mission - SunShot Initiative. Retrieved Aprl 5, 2015, from Energy.gov Office of Energy Efficiency and Renewable Energy: http://energy.gov/eere/sunshot/mission
Xcel Energy Services. (2013). Costs and Benefits of Distributed Solar Generation on the Public Service Company of Colorado System . Denver: Colorado Public Utilities Commission.
Zientara, B. (2014). Solar Power Rocks website. Retrieved April 16, 2015, from Why a state’s solar carve out is so important: http://www.solarpowerrocks.com/affordable-solar/states-solar-carve-important/