using sentence enhancements to distinguish between
TRANSCRIPT

USING SENTENCE ENHANCEMENTSTO DISTINGUISH BETWEEN DETERRENCE
AND INCAPACITATION*
DANIEL KESSLER and STEVEN D. LEVITTStanford University and University of Chicago
National Bureau of and American BarEconomic Research Foundation
Abstract
Differentiating empirically between deterrence and incapacitation is difficultsince both are a function of expected punishment. In this article we demonstrate thatthe introduction of sentence enhancements provides a direct means of measuringdeterrence. Because the criminal would have been sentenced to prison even withoutthe law change, there is no additional incapacitation effect from the sentence en-hancement in the short run. Therefore, any immediate decrease in crime must bedue to deterrence. We test the model using California’s Proposition 8, which im-posed sentence enhancements for a selected group of crimes. Proposition 8 appearsto reduce eligible crimes by 4 percent in the year following its passage and 8 per-cent 3 years after passage. These immediate effects are consistent with deterrence.The impact of the law continues to increase 5–7 years after its passage, suggestingthat incapacitation may be important as well.
I. Introduction
Since Gary Becker’s seminal paper on the economic model of crime,1
there have been more than 100 published studies attempting to test for de-terrence.2 While there is disagreement on the topic, many studies published
* We would like to thank John Donohue, Isaac Ehrlich, Edward Glaeser, AustanGoolsbee, John Lott, Anne Piehl, conference participants, an anonymous referee, and espe-cially Bruce Kobayashi and the editor Sam Peltzman for comments and suggestions. Finan-cial support of the National Science Foundation is gratefully acknowledged. David Beckerand Justin Wood provided outstanding research assistance. Correspondence may be ad-dressed either to Daniel Kessler, Graduate School of Business, Stanford University, Stanford,CA 94305 (e-mail: [email protected]) or to Steven Levitt, Department ofEconomics, University of Chicago, 1126 East 59th Street, Chicago, IL 60637 (e-mail: [email protected]).
1 Gary Becker, Crime and Punishment: An Economic Approach, 76 J. Pol. Econ. 169(1968).
2 Surveys of this literature include Samuel Cameron, The Economics of Crime Deterrence:A Survey of Theory and Evidence, 41 Kyklos 301 (1988); Issac Ehrlich, Crime, Punishment,and the Market for Offenses, 10 J. Econ. Persp. 43 (1996); and Daniel Nagin, Criminal Deter-
[Journal of Law and Economics, vol. XLII (April 1999)] 1999 by The University of Chicago. All rights reserved. 0022-2186/99/4201-0013$01.50
343

344 the journal of law and economics
in recent years have found results that are at a minimum consistent withthe presence of an important deterrence effect using a range of differentmeasures.3
One important shortcoming associated with almost all of these empiricalanalyses, however, is the difficulty in distinguishing between deterrence andincapacitation. As long as the primary means of punishment is imprison-ment, policy changes that increase the expected punishment per crime leadto both greater deterrence and greater incapacitation. Consequently, mostempirical tests of deterrence are, in practice, joint tests of deterrence andincapacitation. For example, reductions in crime associated with increasedarrest rates or rising prison populations are consistent with the presence ofdeterrent effects, incapacitation, or both. Given the strong evidence in sup-port of incapacitation effects,4 caution is warranted in attributing a causalrole to deterrence in such contexts.5
In this article, we present a novel approach to separating deterrencefrom incapacitation. We exploit the unique transition path associated withwhat are commonly termed ‘‘sentence enhancements.’’ With sentence en-hancements, additional prison time is tacked on to the basic sentence forcrimes of a particular type, for example, crimes committed with a gun or
rence Research: A Review of the Evidence and a Research Agenda for the Outset of theTwenty-First Century (unpublished manuscript, Carnegie Mellon Univ. 1997).
3 Isaac Ehrlich, Participation in Illegitimate Activities: A Theoretical and Empirical Inves-tigation, 81 J. Pol. Econ. 531 (1973); Jeff Grogger, Certainty vs. Severity, 29 Econ. Inquiry297 (1991); Steven Levitt, Using Electoral Cycles in Police Hiring to Estimate the Effect ofPolice on Crime, 87 Am. Econ. Rev. 270 (1997); Thomas Marvell & Carlisle Moody, PrisonPopulation Growth and Crime Reduction, 10 J. Quant. Criminology 109 (1994); ThomasMarvell & Carlisle Moody, Police Levels, Crime Rates, and Specification Problems, 34Criminology 609 (1996); Patricia Mayhew et al., Crime in Public View (Home Office Re-search Study No. 49, London 1979); Helen Tauchen, Anne Witte, & Harriet Griesinger,Criminal Deterrence: Revisiting the Issue with a Birth Cohort (unpublished manuscript, Univ.North Carolina at Chapel Hill, Dep’t Econ. 1993); Ann Witte, Estimating the EconomicModel of Crime with Individual Data, 94 Q. J. Econ. 57 (1980).
4 Christy Visher, The RAND Inmate Survey: A Reanalysis, in Criminal Careers and Ca-reer Criminals (A. Blumstein et al. eds., vol. 2 1986); John DiIulio & Anne Piehl, DoesPrison Pay? The Stormy National Debate over the Cost-Effectiveness of Imprisonment, 1991Brookings Rev. 28; William Spelman, Criminal Incapacitation (1994).
5 There are a few studies that make an attempt to carefully differentiate between deter-rence and incapacitation. Robert McCormick & Robert Tollison, Crime on the Court, 92 J.Pol. Econ. 223 (1984), analyzes the impact of increasing the number of basketball refereeson the frequency with which fouls are committed. Because the punishment in this context isnot incarceration, the effects are solely deterrence related. Steven Levitt, Why Do IncreasedArrest Rates Appear to Reduce Crime: Deterrence, Incapacitation, or Measurement Error? 36Econ. Inquiry 353 (1998), attempts to distinguish between deterrence and incapacitation us-ing the impact of increased arrest rates for one crime on the frequency with which othercrimes are committed.

sentence enhancements 345
third convictions for qualifying crimes in the presence of ‘‘three strikes’’laws.6 The key insight of the analysis is that initially such laws may havea deterrent effect but will not have any impact on the amount of incapacita-tion. The criminal is already required to serve the basic sentence. Only afterthat term7 has elapsed and the sentence enhancement takes effect will therebe an added incapacitation effect. Any deterrent effect, however, will ariseimmediately as the criminal incorporates the increased punishment associ-ated with the sentence enhancement into the decision calculus. Thus, bylooking at changes in crime immediately following the introduction of asentence enhancement, it is possible to isolate a pure deterrent effect thatis not contaminated by incapacitation.
We begin the article by developing a theoretical model that formalizesthe intuition of the preceding paragraph. We then provide an empirical testof the model using California’s experiences with Proposition 8, a popularreferendum passed in 1982 that increased the scope and severity of repeat-offender enhancements. In the years immediately following Proposition 8,crime rates for those offenses covered by the sentence enhancements fellsharply, both in absolute terms and relative to a set of similar offenses thatwere excluded from Proposition 8. In the years preceding passage of Propo-sition 8, the time path of eligible and noneligible crimes in California mir-rors that of the United States as a whole. Immediately following Proposition8, California’s crime pattern diverges from that of the rest of the UnitedStates. These results are consistent with the presence of a deterrent effectof the sentence enhancements. Furthermore, the continued decline over theensuing years in relative crime rates for the offenses covered by Proposition8 are consistent with the model’s prediction that the transition to a newsteady state will involve a continued fall in crime as the incapacitative im-pact of the enhancements slowly takes effect.
Differentiating between deterrence and incapacitation is not merely anacademic exercise. Rather, the distinction between those two forces is criti-cal to determining the costs and benefits associated with sentence enhance-ments, particularly for three-strikes laws that entail extremely long sen-tences. If incapacitation is the primary force, than three-strikes laws willlead to enormous increases in the number of prisoners and eventually to a
6 As discussed in the following section of the article, there has been a substantial move-ment toward a variety of sentence enhancements in the United States in recent years. Forinstance, since 1993, three-strikes laws have been adopted in 24 states and have been addedto the federal sentencing guidelines. These laws are in addition to a range of repeat-offenderand gun enhancements already in place in the great majority of states.
7 Or more precisely, the proportion of that sentence that would have actually been served.
346 the journal of law and economics
geriatric prison population that has largely aged out of crime, poses littlethreat to society, and requires costly health care.8 In contrast, as demon-strated in the model, if deterrence is the operative force, then three-strikeslaws will lead to an equilibrium with both lower crime and lower levels ofincarceration, making them a very attractive policy. Our results providemixed support for three-strikes laws. Although the lower bound on deter-rence effects that we estimate from Proposition 8 are nontrivial (4–8 per-cent), we also find large lagged declines in crime that are consistent withincapacitation effects associated with a rising prison population. Thus, thereis not clear evidence that increasing punishment in this instance led to a‘‘golden’’ equilibrium with both lower crime and lower levels of incarcera-tion.
The structure of the article is as follows. Section II presents the theoreti-cal model of sentence enhancements, demonstrating formally how deter-rence and incapacitation can be distinguished. The third section examinesthe use of sentence enhancements in the United States. Section IV providesan empirical test of the theoretical model using the response of crime ratesto Proposition 8 in California and compares crime patterns in California tothe rest of the United States. The final section considers the broader impli-cations of our findings, particularly with respect to three-strikes laws.
II. Theoretical Model
In this section we develop a stylized economic model of crime incorpo-rating sentence enhancements into the analysis. We characterize the steady-state equilibria with and without sentence enhancements, as well as thetransition path when sentence enhancements are introduced into aneconomy.
A. The Basic Model
For simplicity, we consider a model with a continuum of infinitely-livedagents.9 In every period, each individual chooses either to engage in a singlecriminal act or in the noncrime alternative (except those who are currentlyincarcerated, who do neither). If the agent commits a crime in period t,there is an exogenously given, predetermined likelihood of detection (pt).
8 Alfred Blumstein, Prisons, in Crime (J. Q. Wilson and J. Petersilia eds. 1995); EdithFlynn et al., Three Strikes Legislation: Prevalence and Definitions in Critical Criminal JusticeIssues: Task Force Reports from the American Society of Criminology to Attorney GeneralJanet Reno (1997).
9 The results that we derive would continue to hold in an overlapping generations frame-work or in a model with finite-lived agents. Limiting the focus to one cohort, however,greatly simplifies both the notation and calculations.
sentence enhancements 347
The punishment, conditional on being caught committing a crime, is aprison sentence of S periods that begins in period t 1 1 and runs throughperiod t 1 S 1 1.10 While incarcerated, the agent is unable to commit fur-ther crimes. The utility loss associated with this prison sentence is denotedJt(S). Initially, the sentence length S is assumed to be one period. Later,when sentence enhancements are introduced, the enhancement will raise thesentence length to two periods.
The private return to crime (not including the punishment if detected) isdenoted r and is the only factor that varies across individuals. The returnto the noncrime alternative is normalized to zero for all individuals. Agentsare assumed to be risk neutral and future utilities are not discounted, al-though either of those factors could be incorporated into the present frame-work.11 Thus, the agent’s maximization problem in any period is simply
MAXCit∈{0,1}
(ri 2 pt Jt(S))Cit, (1)
where i indexes individuals; Cit is an indicator variable equal to one if acrime is committed by agent i in period t, and zero otherwise. An agentcommits crime if and only if the private return to crime r exceeds the ex-pected punishment (pt Jt).12 For simplicity, it is assumed that ri is uniformlydistributed over agents with a range from zero to R and a density of 1/R.If there were no punishment, all agents would engage in criminal activities,and the total crime rate Ct would be equal to one. With a positive expectedpunishment, some agents will be deterred. In order to ensure an interior so-lution, R is chosen such that R . pt Jt. Thus, some agents will commitcrimes in all periods, assuming they are not already incarcerated.
Because prison sentences from one period are served in the followingperiod(s), crime in period t depends not only on expected punishment inperiod t (deterrence), but also on actual levels of crime and punishment in
10 Both the likelihood of punishment and the length of the prison sentence could be en-dogenized to allow for optimal policy determination as is standard in the literature; see, forexample, Becker, supra note 1; Louis Kaplow & Steven Shavell, Optimal Law Enforcementwith Self-Reporting of Behavior, 102 J. Pol. Econ. 583 (1994); John Lott, Should theWealthy Be Able to Buy Justice? 95 J. Pol. Econ. 1307 (1987); A. Mitchell Polinsky & Dan-iel Rubinfeld, A Model of Optimal Fines for Repeat Offenders, 46 J. Pub. Econ. 291 (1991);A. Mitchell Polinsky & Steven Shavell, The Optimal Use of Fines and Imprisonment, 24 J.Pub. Econ. 89 (1984). Our interest, however, is not in deriving the optimal policy but, rather,in examining how individual criminal decisions respond to changes in observed policy, re-gardless of whether the policies implemented are optimal.
11 A. Mitchell Polinsky & Steven Shavell, On the Disutility and Discounting of Imprison-ment and the Theory of Deterrence (Working paper, Harvard Law School 1997).
12 Implicit in equation (1) is the assumption that the criminal receives the utility of thecriminal act even if caught and punished. This assumption is not necessary to obtain the re-sults presented below.

348 the journal of law and economics
the preceding period(s) (incapacitation).13 It is relatively straightforward todemonstrate that the steady-state level of crime is as follows:14
Ct 5 1 2pt Jt
R2 pt21 Ct21. (2)
If there were neither deterrence nor incapacitation, all agents would commitcrime, leading to Ct 5 1. The second term on the right-hand side of equa-tion (2) is deterrence; anyone with ri , pt Jt decides against committing thecrime. The final term in equation (2) is the number of crimes that do notoccur as a result of incarceration (that is, the incapacitation effect). In asteady state, all agents who committed crime in the previous period willcommit crime in the current period unless they are behind bars. Thereforethe incapacitation effect is simply equal to the size of the prison population.
Setting crime in the current and preceding periods equal, the steady-statesolution to the model solely in terms of parameters is
Ct 511 2
pt Jt
R 21 1 pt
. (3)
B. Adding Sentence Enhancements to the Model
We model sentence enhancements as an increase in the prison sentencefrom one period to two periods. We assume that the probability of detectionremains constant.15 In analyzing the effect of introducing sentence enhance-ments, it is critical to identify not only the new steady state but also thetransition path.
Assume that sentence enhancements are introduced in period t. Also, letthe disutility of a two-period prison sentence be (1 1 d )J, where d . 0;there is disutility associated with the second period in prison. We allowfor the marginal disutility associated with increases in the prison term to beincreasing (d . 1), decreasing (d , 1), or constant (d 5 1). Crime in thefirst period with sentence enhancements in place is given by
13 Initially we consider prison sentences that are exactly one period in length. Thus, thisperiod’s crime depends only on last period’s crime and punishment levels.
14 Out of steady state, the equation becomes more complicated because the pool of prison-ers may be composed of some agents who committed a crime last period but would not en-gage in crime this period due to changes in the expected punishment.
15 Although from the perspective of optimal policy design, holding p fixed would not nec-essarily be optimal.

sentence enhancements 349
Ct 5 1 2 3pt Jt
R1
dpt Jt
R(1 2 pt21 Ct21)4 2 pt21 Ct21. (4)
The only difference between equations (2) and (4) is in the deterrence term,which is in square brackets in equation (4). With sentence enhancementsall agents who were previously deterred continued to be deterred. In addi-tion, some additional agents are also deterred by the increased expectedpunishment. Note, however, that some agents who would be deterred if freeare actually incarcerated, necessitating the 1 2 pt21 Ct21 term in the squarebrackets.
The two important observations emerging from a comparison of equa-tions (2) and (4) are as follows. First, crime is lower in equation (4) due tothe increased deterrence associated with longer sentences resulting fromthe sentence enhancements. Second, in the first period following the intro-duction of sentence enhancements, the incapacitation effect is unaffected.Not until the original sentence expires does the increased incapacitation as-sociated with sentence enhancements materialize. Thus, any immediate re-duction in crime associated with sentence enhancements is attributable todeterrence rather than incapacitation.
The steady-state level of crime after the introduction of sentence en-hancements is
Ct 5 1 2(1 1 d )pt Jt
R2 (pt21 Ct21) 2 (pt22 Ct22). (5)
Comparing equations (2) and (5), the steady-state deterrence effect (the sec-ond term on the right-hand side of both equations) is greater after the sen-tence enhancement. This, of course, is a straightforward outcome of anyeconomic model of crime. Comparing the first period after sentence en-hancements to the steady state with such enhancements (eqq. [4] and [5]),a more subtle result emerges. The deterrence effect associated with sentenceenhancements increases over time. The explanation for this result is thatinitially some of those who could be deterred are incarcerated and thereforecannot respond to the change in incentives. Over time, those agents will bereleased from prison and deterred thereafter.16 Note that this channel for ris-ing deterrence is separate from lags in behavioral changes on the part of
16 In some sense, the last italicized point is a relatively minor one from a public policyperspective since these agents are not committing crime either immediately after the sentenceenhancements or in the steady state. The only difference is whether the reduction in crimeis assigned to deterrence or incapacitation. The reason that this distinction is important, how-ever, is that the measured reduction in crime directly following the introduction of sentenceenhancements captures only the immediate rise in deterrence, not the long-run rise.

350 the journal of law and economics
criminals that are likely to be empirically relevant but are not explicitlymodeled.
Thus, for both of these reasons, the initial change in crime represents alower bound on the long-run increase in deterrence. This will have implica-tions for the interpretation of the empirical results presented in later sec-tions.
Solving for the steady-state crime rate in equation (5) solely in terms ofparameters yields
Ct 5
11 2(1 1 d )pt Jt
R 21 1 2pt
. (6)
Comparing equations (3) and (6), the steady-state crime rates before andafter the sentence enhancements, crime is unambiguously lower with theenhancements. The change in deterrence is easily computed from equations(2) and (4) as dpJ/R. Tedious algebraic manipulation of equations (3) and(6) (not shown) demonstrates that the change in the crime rate can eitherbe greater than or less than the change in deterrence. Therefore, the intro-duction of sentence enhancements has an ambiguous impact on the inca-pacitation effect. Translated into more meaningful terms, this implies thatthe size of the prison population may either rise or fall with sentence en-hancements. There are two countervailing forces affecting the prison popu-lation. Sentences are longer, but fewer crimes are committed, so there arefewer criminals being sentenced.
III. An Overview of the Use of Sentence Enhancementsin the United States
In recent years, many of the changes in sentencing policy that have beenadopted have had one thing in common: they all impose mandatory, statu-tory increases in prison sentences on individuals who were already goingto be incarcerated. Whether the new policies were called determinate sen-tencing laws, sentencing guidelines, gun enhancements, or repeat-offenderenhancements, they all shared this common feature. By 1994, all 50 statesand the federal government had adopted one or more mandatory sentencinglaws.17 In particular, repeat-offender enhancements were in use in 41 statesand in the federal sentencing guidelines as of 1993.18
17 Michael Tonry, Sentencing Matters (1996).18 United States Sentencing Commission, The Federal Sentencing Guidelines: A Report
on the Operation of the Guidelines System and Short-Term Impacts on Disparity in Sentenc-ing, Use of Incarceration, and Prosecutorial Discretion and Plea Bargaining (1991); Bureauof Justice Assistance, National Assessment of Structured Sentencing (1996).

sentence enhancements 351
In addition to those existing laws, 24 state legislatures enacted a new,more stringent breed of repeat-offender enhancements called ‘‘ThreeStrikes and You’re Out’’ laws19 between 1993 and 1995. Repeat-offenderenhancements can be characterized along two dimensions: the range of cur-rent crimes and criminal histories that qualify for the enhancement (scope)and the magnitude of the enhancement imposed (severity). Three-strikeslaws toughened existing repeat-offender enhancements in both dimensions,expanding the scope of the enhancements beyond the most serious felonsand increasing the severity of the enhancements. In many states, three-strikes laws impose life imprisonment without parole for a third-time of-fender.
Furthermore, with the passage of the Violent Crime Control and Law En-forcement Act of 1994, the U.S. Congress made three-strikes sentencing afundamental part of federal sentencing policy. First, the Act created a fed-eral three-strikes law. The Act mandates life imprisonment for all seriousviolent federal felonies, if the defendant has been sentenced for two or moreprior separate serious violent felonies or serious drug offenses in state orfederal court.20 Second, the Act provided incentives to states for increasingstate penalties for repeat violent offenders. One way that a state can becomeeligible for a Truth-in-Sentencing Grant is to have in effect at the time ofapplication laws requiring that violent felons who have been convicted ofat least one prior separate serious violent felony or serious drug offence instate or federal court serve at least 85 percent of their sentence.21
Previous research on the impact of enhancements has reported conflictingfindings on the aggregate impact of enhancements on crime. One of the fewstudies of the effect of a three-strikes law, undertaken by RAND, predictedthat California’s 1994 law would have a substantial incapacitative effect oncrime.22 Although some studies of the effect of gun enhancements reportthat adoption of enhancements reduces some or all gun-related crimes,23
19 John Clark, James Austin, & D. Alan Henry, ‘‘Three Strikes and You’re Out’’: A Re-view of State Legislation (NCJ 165369, U.S. Dep’t of Justice, Office of Justice Statistics,1997).
20 18 U.S.C. §3559(c)(1).21 42 U.S.C. §13702(a)(2)(D).22 Peter W. Greenwood et al., Three Strikes and You’re Out: Estimated Benefits and Costs
of California’s New Mandatory Sentencing Law (RAND 1994); but see James Austin,‘‘Three Strikes and You’re Out’’: The Likely Consequences on the Courts, Prisons, andCrime in California and Washington State, 14 St. Louis U. Pub. L. Rev. 239 (1994), for acritique, and James Austin (presentation at the meetings of the American Criminological So-ciety, San Diego, Cal., November 1997), for evidence that these predictions have not beenrealized.
23 For example, Glen L. Pierce & William J. Bowers, The Bartley-Fox Gun Law’s Short-Term Impact on Crime in Boston, 455 Annals Am. Acad. Pol. & Soc. Sci. 120 (1981); David
352 the journal of law and economics
other studies of gun enhancements report no effect.24 Disagreement in theliterature extends to the existence and magnitude of the impact of increasingmandatory sentences on crime generally.25
Previous research, however, has failed to recognize both the importanceand possibility of distinguishing between deterrence and incapacitation.26
Thus, further investigation of the effects of repeat-offender enhancementsis essential to the analysis of recent changes in state and federal sentencingpolicy. Guided by our theoretical model, we exploit the transition path asso-ciated with the adoption of sentence enhancements. Short-run declines incrime are likely to be attributable largely or solely to deterrence since theincapacitative effect of sentence enhancements will occur only with a lag.Over time, continued declines in crime should continue as the full extent ofdeterrence is realized and incapacitation becomes operative. In the follow-ing section, we test the predictions of the model using California’s experi-ence with Proposition 8.27
IV. Proposition 8 in California: The Effects ofRepeat-Offender Enhancements28
Proposition 8 was passed directly by California voters through the initia-tive process on June 8, 1982, and went into effect the next day. By addingSections 667(a) and 1192.7(c) to the California Penal Code, Proposition 8substantially increased both the scope and the severity of California’s ex-isting repeat-offender enhancement.29 Before the passage of Proposition 8,
McDowall, Colin Loftin, & Brian Wiersema, A Comparative Study of the Preventive Effectsof Mandatory Sentencing Laws for Gun Crimes, 83 J. Crim. L. & Criminology 378 (1992).
24 For example, Colin Loftin, Milton Heumann, & David McDowall, Mandatory Sentenc-ing and Firearms Violence: Evaluating an Alternative to Gun Control, 17 L. & Soc’y Rev.287 (1983).
25 See, for example, Michael Tonry, Mandatory Penalties, in 16 Crime and Justice: A Re-view of Research (Michael Tonry ed. 1992); Tonry, supra note 17; and Bureau of JusticeAssistance, supra note 18, for studies finding no effect.
26 Indeed, the RAND study discussed above (Greenwood et al., supra note 22) assumesthat the California three-strikes law will have no deterrent effect at all in its assessment ofthe benefits and costs of the law.
27 As discussed in the concluding section of the article, we have also examined states’experiences with three-strikes laws. Unlike Proposition 8, however, three-strikes laws havegenerally not been rigorously enforced. Consequently, there is no evidence that punishmentshave actually increased as a result of three-strikes laws, except in California.
28 The introduction to Section IV draws heavily on Daniel Kessler & Anne Morrison Piehl,The Role of Discretion in the Criminal Justice System, 14 J. L. Econ. & Org. 256 (1998).
29 Before the passage of Proposition 8, California’s Determinate Sentencing Law providedfor several types of sentence enhancements: enhancements for causing great bodily injury,gun enhancements, and repeat-offender enhancements. At that time, § 667.5 of the CaliforniaPenal Code governed repeat-offender enhancements.

sentence enhancements 353
the existing law required a 3-year enhancement of violent felony offenders’sentences for each prior prison term served for a violent felony or a 1-yearenhancement of nonviolent felony offenders’ sentences for each priorprison term served for a nonviolent felony, whichever was greater. WithProposition 8, all ‘‘serious’’ felony offenders under Section 1192.7(c) re-ceived a 5-year enhancement for each prior conviction of a ‘‘serious’’ fel-ony offense or a 1-year enhancement for each prior prison term served forany offense, whichever was greater.30 In addition, Proposition 8 expandedthe scope and severity of the enhancement by eliminating the statute of lim-itations in Section 667.5 that only considered a defendant’s record for atmost the past 10 years, by prohibiting judges from sentencing defendantsto serve their enhancements concurrently with their base sentence and byrequiring that each of the enhancements be served consecutively.31
Kessler and Piehl32 show that Proposition 8 increased sentences for re-peat offenders charged with serious felonies but not for repeat offenderscharged with certain nonserious felonies.33 Thus, because Proposition 8 af-fected punishment levels for some crimes but not for others, its passageprovides an experiment with which we can evaluate the deterrent effect ofrepeat-offender enhancements.
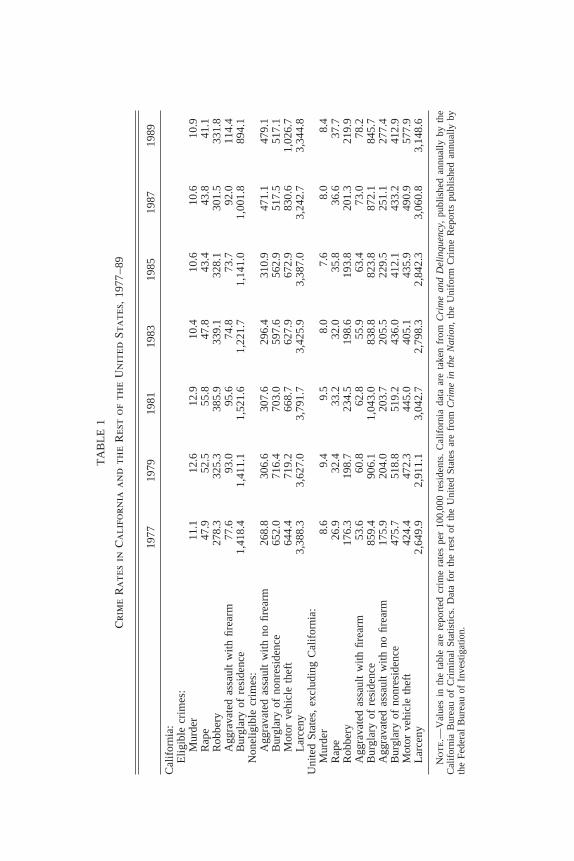
The raw data for our analysis are presented in Table 1. For California,crime categories are divided into two groups: those eligible for enhance-ments under Proposition 8 (murder, rape, robbery, aggravated assault witha firearm, and burglary of a residence) and those that are not eligible (aggra-vated assault without a firearm, burglary of a nonresidence, motor vehicle
30 Cal. Penal Code § 1192.7(c); ‘‘serious’’ felonies include all ‘‘violent’’ felonies coveredunder the previous law as well as some nonviolent felonies, in particular burglary of a resi-dence.
31 The only data available are aggregated by crime category. Thus we are able to makecomparisons between eligible and noneligible crime categories, but not to differentiate be-tween criminals who are or are not eligible for sentence enhancements.
32 Kessler & Piehl, supra note 28.33 In id., Kessler and Piehl also find small spillover effects of Proposition 8 affecting re-
peat offenders charged with ‘‘similar’’ nonserious felonies, where ‘‘similar’’ nonserious fel-onies are nonserious felonies that have legal elements in common with one or more seriousfelonies. However, spillover effects only strengthen our finding that increases in the scopeand severity of repeat-offender enhancements attributable to Proposition 8 lead to decreasesin crime. Because spillover effects increase sentences for ‘‘control’’ group crimes, they couldonly lead to decreases in the number of ‘‘control’’ group crimes, and therefore only lead todecreases in the magnitude of the estimated deterrent effect of Proposition 8 relative to ratesof ‘‘control’’ group crimes. In contrast to Kessler and Piehl’s findings, id., it should be notedthat earlier research found no effect of Proposition 8 on sentence lengths; see, for example,Candace McCoy & Robert Tillman, Controlling Felony Plea Bargaining in California: TheImpact of the ‘‘Victims’ Bill of Rights’’ (Cal. Dep’t of Justice, Bureau of Criminal Statistics,1986); and Robert Tillman & Candace McCoy, The Impact of California’s ‘‘Prior FelonyConviction’’ Law (Cal. Dep’t of Justice, Bureau of Criminal Statistics, 1986).
TA
BL
E1
Cri
me
Rat
esin
Cal
ifor
nia
and
the
Res
tof
the
Un
ited
Stat
es,
1977
–89
1977
1979
1981
1983
1985
1987
1989
Cal
ifor
nia:
Elig
ible
crim
es:
Mur
der
11.1
12.6
12.9
10.4
10.6
10.6
10.9
Rap
e47
.952
.555
.847
.843
.443
.841
.1R
obbe
ry27
8.3
325.
338
5.9
339.
132
8.1
301.
533
1.8
Agg
rava
ted
assa
ult
with
firea
rm77
.693
.095
.674
.873
.792
.011
4.4
Bur
glar
yof
resi
denc
e1,
418.
41,
411.
11,
521.
61,
221.
71,
141.
01,
001.
889
4.1
Non
elig
ible
crim
es:
Agg
rava
ted
assa
ult
with
nofir
earm
268.
830
6.6
307.
629
6.4
310.
947
1.1
479.
1B
urgl
ary
ofno
nres
iden
ce65
2.0
716.
470
3.0
597.
656
2.9
517.
551
7.1
Mot
orve
hicl
eth
eft
644.
471
9.2
668.
762
7.9
672.
983
0.6
1,02
6.7
Lar
ceny
3,38
8.3
3,62
7.0
3,79
1.7
3,42
5.9
3,38
7.0
3,24
2.7
3,34
4.8
Uni
ted
Stat
es,
excl
udin
gC
alif
orni
a:M
urde
r8.
69.
49.
58.
07.
68.
08.
4R
ape
26.9
32.4
33.2
32.0
35.8
36.6
37.7
Rob
bery
176.
319
8.7
234.
519
8.6
193.
820
1.3
219.
9A
ggra
vate
das
saul
tw
ithfir
earm
53.6
60.8
62.8
55.9
63.4
73.0
78.2
Bur
glar
yof
resi
denc
e85
9.4
906.
11,
043.
083
8.8
823.
887
2.1
845.
7A
ggra
vate
das
saul
tw
ithno
firea
rm17
5.9
204.
020
3.7
205.
522
9.5
251.
127
7.4
Bur
glar
yof
nonr
esid
ence
475.
751
8.8
519.
243
6.0
412.
143
3.2
412.
9M
otor
vehi
cle
thef
t42
4.4
472.
344
5.0
405.
143
5.9
490.
957
7.9
Lar
ceny
2,64
9.9
2,91
1.1
3,04
2.7
2,79
8.3
2,84
2.3
3,06
0.8
3,14
8.6
Not
e.—
Val
ues
inth
eta
ble
are
repo
rted
crim
era
tes
per
100,
000
resi
dent
s.C
alif
orni
ada
taar
eta
ken
from
Cri
me
and
Del
inqu
ency
,pu
blis
hed
annu
ally
byth
eC
alif
orni
aB
urea
uof
Cri
min
alSt
atis
tics.
Dat
afo
rth
ere
stof
the
Uni
ted
Stat
esar
efr
omC
rim
ein
the
Nat
ion,
the
Uni
form
Cri
me
Rep
orts
publ
ishe
dan
nual
lyby
the
Fede
ral
Bur
eau
ofIn
vest
igat
ion.

sentence enhancements 355
theft, and larceny). Because Proposition 8 was passed by popular referen-dum, observed changes in crime around the time of its passage may reflecta combination of the true deterrent impact of harsher repeat-offender en-hancements and of other factors correlated with but not caused by the lawchange, such as changes in demographics, in other state policies, and inbroad social norms against crime. This makes the availability of a controlgroup of noneligible crimes critical to the analysis. Rates for these crimesin the rest of the United States are also presented.34 These nine crime cate-gories exhaust the set of crimes for which comparable data are availablefrom California and the rest of the United States. The years presented,1977–89, provide 5 years of data before the passage of Proposition 8 and7 years after.
Inspection of Table 1 reveals that levels of crime rates in California arehigher than those in the rest of the nation, but increases and decreases inCalifornia’s crime rates tend to closely parallel those of the nation. Crimerates were generally rising until 1981, falling between 1981 and 1983, andmixed thereafter. Identifying a causal impact of Proposition 8 on eligiblecrimes in California requires differentiating between the impact of the lawchange and the widespread decline in crime outside California that happensto coincide with its passage in 1982.
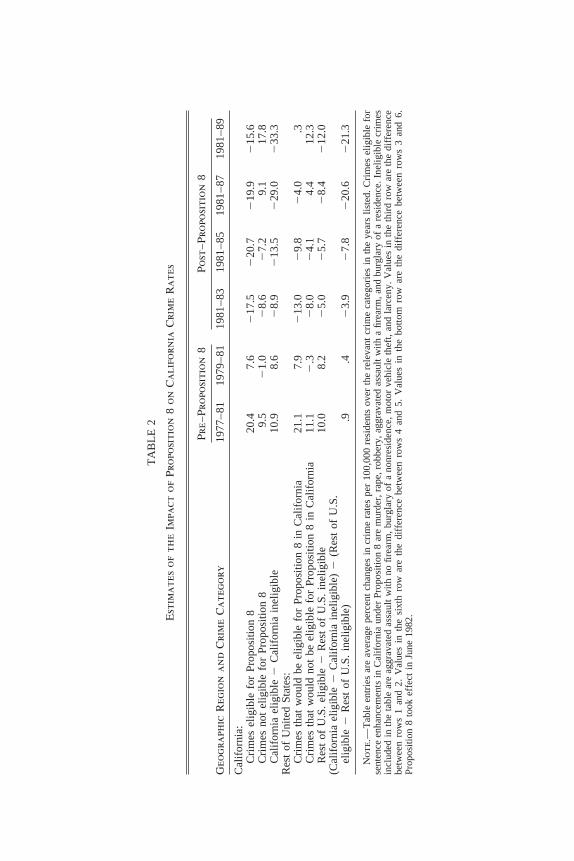
Table 2 presents a number of alternative estimates of the impact of Prop-osition 8 using a ‘‘natural experiment’’ framework. Eligible crimes in Cali-fornia are the ‘‘treatment’’ group. Ineligible crimes in California make upone ‘‘control’’ group. In addition, eligible and ineligible crime categoriesin the rest of the United States are also presented. The extent to which eligi-ble and ineligible crimes outside California (neither of which should be af-fected by California’s law change) exhibit differential time paths providesanother potential control.
The first two columns of the table contain percent changes in crime ratesbefore passage of the law; the final four columns show crime patterns afterthe law change. As the top row of Table 2 demonstrates, eligible crimeswere rising in California before the passage of Proposition 8, then droppedsharply with the law change (a 17.5 percent decline) between 1981 and1983, and remained roughly stable thereafter. A naive interpretation of thedata might conclude that Proposition 8 had an enormous immediate effectthat did not increase over time. Such a conclusion, however, is likely incor-
34 Reported crime data in California include information on all of the crime categorieslisted. Uniform Crime Reports, which provide data on reported crime for the United Statesas a whole, only include overall burglary and aggravated assault for individual states. Thepercentage of burglaries that involve a residence for the nation as a whole, however, is re-ported, as is the fraction of aggravated assaults with a handgun.
TA
BL
E2
Est
imat
esof
the
Impa
ctof
Prop
osit
ion
8on
Cal
ifor
nia
Cri
me
Rat
es
Pre–
Prop
osit
ion
8Po
st–P
ropo
siti
on8
Geo
grap
hic
Reg
ion
and
Cri
me
Cat
egor
y19
77–8
119
79–8
119
81–8
319
81–8
519
81–8
719
81–8
9
Cal
ifor
nia:
Cri
mes
elig
ible
for
Prop
ositi
on8
20.4
7.6
217
.52
20.7
219
.92
15.6
Cri
mes
not
elig
ible
for
Prop
ositi
on8
9.5
21.
02
8.6
27.
29.
117
.8C
alif
orni
ael
igib
le2
Cal
ifor
nia
inel
igib
le10
.98.
62
8.9
213
.52
29.0
233
.3R
est
ofU
nite
dSt
ates
:C
rim
esth
atw
ould
beel
igib
lefo
rPr
opos
ition
8in
Cal
ifor
nia
21.1
7.9
213
.02
9.8
24.
0.3
Cri
mes
that
wou
ldno
tbe
elig
ible
for
Prop
ositi
on8
inC
alif
orni
a11
.12
.32
8.0
24.
14.
412
.3R
est
ofU
.S.
elig
ible
2R
est
ofU
.S.
inel
igib
le10
.08.
22
5.0
25.
72
8.4
212
.0(C
alif
orni
ael
igib
le2
Cal
ifor
nia
inel
igib
le)
2(R
est
ofU
.S.
elig
ible
2R
est
ofU
.S.
inel
igib
le)
.9.4
23.
92
7.8
220
.62
21.3
Not
e.—
Tab
leen
trie
sar
eav
erag
epe
rcen
tch
ange
sin
crim
era
tes
per
100,
000
resi
dent
sov
erth
ere
leva
ntcr
ime
cate
gori
esin
the
year
slis
ted.
Cri
mes
elig
ible
for
sent
ence
enha
ncem
ents
inC
alif
orni
aun
der
Prop
ositi
on8
are
mur
der,
rape
,rob
bery
,agg
rava
ted
assa
ult
with
afir
earm
,and
burg
lary
ofa
resi
denc
e.In
elig
ible
crim
esin
clud
edin
the
tabl
ear
eag
grav
ated
assa
ult
with
nofir
earm
,bur
glar
yof
ano
nres
iden
ce,m
otor
vehi
cle
thef
t,an
dla
rcen
y.V
alue
sin
the
thir
dro
war
eth
edi
ffer
ence
betw
een
row
s1
and
2.V
alue
sin
the
sixt
hro
war
eth
edi
ffer
ence
betw
een
row
s4
and
5.V
alue
sin
the
botto
mro
war
eth
edi
ffer
ence
betw
een
row
s3
and
6.Pr
opos
ition
8to
okef
fect
inJu
ne19
82.
sentence enhancements 357
rect given the pattern of noneligible crimes in California (row 2). Thesecrimes also fell between 1981 and 1983. Unlike eligible crimes, ineligiblecrimes sharply increased in 1987 and 1989.
Row 3 of Table 2 computes the difference between patterns in eligibleand ineligible crime for each time period, providing one estimate of the im-pact of Proposition 8 on eligible crimes. Before the passage of the law, eli-gible crimes were increasing at a faster rate than ineligible crimes. Afterpassage, there is an immediate 8.9 percent reduction in eligible crimes thatsteadily grows over time to 33.3 percent. Under the assumption that otherdeterminants of the two crime categories were uncorrelated with the scopeand passage of Proposition 8, this approach provides an unbiased estimateof the impact of the enhancement.
Examination of the pattern of eligible and ineligible crimes in the rest ofthe United States, however, calls into question that assumption. The penulti-mate row of Table 2 presents the relative time pattern of eligible and ineli-gible crimes outside of California. The rest of the United States experienceschanges in crime that parallel California, but with a smaller magnitude. Be-fore 1982, eligible crimes outpace ineligible crimes, after 1982 the trendreverses.
Given that eligible and ineligible crimes exhibit systematic changes out-side of California, the most convincing estimate of the true impact of Prop-osition 8 is the change in eligible crimes relative to ineligible crimesin California minus the corresponding change outside California (a‘‘differences-in-differences’’ estimator). The bottom row of Table 2 pre-sents that estimate. Before Proposition 8, crime patterns inside and outsideof California for eligible and ineligible crimes match up closely: eligiblecrimes are growing less than one percentage point faster in California. Afterthe passage of Proposition 8, an immediate decline of 3.9 percent in eligiblecrimes occurs. Three years after the law change, the decline has doubledto 7.9 percent. The immediacy with which crime in the eligible categoriesresponded to the passage of Proposition 8 implies the presence of a deter-rent effect. All of the immediate 3.9 percent decline in eligible crime islikely attributable to deterrence (as may be some of the later declines). It isworth noting that this finding with respect to the effectiveness of increasingthe severity of punishment is unusual; most of the previous literature hasfound that changes in the certainty of punishment are much better predictorsof changes in crime rates than are changes in severity.35
35 For example, Grogger, supra note 3. Past findings of a greater impact of punishmentcertainty relative to punishment severity are consistent with our arguments earlier in the arti-cle that typical estimates of the economic model of crime confound deterrence and incapaci-tation. Increases in punishment certainty will result in an immediate increase in both deter-

358 the journal of law and economics
Our theoretical model predicts not only an immediate fall in crime withthe adoption of sentence enhancements, but also a continued decline overthe longer run as incapacitation effects and further deterrence incrementallytake hold. This pattern appears in the data. By 1989, a total decline of over20 percent is observed. This result suggests that crime does not fall immedi-ately to its steady-state level, but rather falls steadily along a transition pathas the incapacitation effect is incorporated.
While the results in Table 2 are consistent with an impact of Proposition8, it is important to consider other possible explanations for the observedpatterns. One possible explanation for the patterns observed in Table 2would be an increase in the certainty of punishment for eligible crimes rela-tive to noneligible crimes after the passage of Proposition 8. In practice,however, just the opposite appears to have occurred. Between 1981 and1985, the arrest rate (arrests in a crime category divided by reported crimesin that category) in California fell for two of the three eligible crime catego-ries (homicide and robbery) for which we are able to obtain comparablearrest data.36 In contrast, arrest rates rose between 1981 and 1985 for lar-ceny and motor vehicle theft, the two noneligible crimes for which compa-rable arrest data are available.
A second possible explanation for the results involves the differential re-sponsiveness of violent and property crimes to economic conditions. Previ-ous research37 finds that property crime is countercyclical, whereas violentcrime is not strongly affected by the economy. Over the period analyzed,however, unemployment rates in California tracked those of the UnitedStates as a whole very closely, rising between 1981 and 1983 and then fall-ing. Thus, while changing economic conditions might explain some of thedifferential trends in eligible and ineligible crime within California (row 3of Table 2), the situation inside and outside of California was similar, soour preferred estimator (the bottom row of Table 2) would not be affected.
One final factor that could overstate the impact of Proposition 8 is substi-tution across crime categories. The more similar the crime categories, themore likely it is that criminals will substitute away from eligible crimes
rence and incapacitation. Increases in punishment severity, on the other hand, will only haveimmediate deterrence effects, with incapacitation effects occurring only with a lag.
36 Arrest data are available only for the seven FBI Index I crime categories, not the moredetailed crime categories reported in Table 1. Consequently, in the arrest data we cannotdistinguish between aggravated assaults with and without a handgun, or burglaries of resi-dences and nonresidences.
37 David Cantor & Kenneth Land, Unemployment and Crime Rates in the Post–WorldWar II United States: A Theoretical and Empirical Analysis, 50 Am. Soc. Rev. 317 (1985);Joel Devine, Joseph Sheley, & Dwayne Smith, Macroeconomic and Social-Control PolicyInfluences on Crime Rate Changes, 1948–1985, 53 Am. Soc. Rev. 407 (1988); and Levitt,supra note 3.

sentence enhancements 359
toward noneligible crimes because of the increased penalties for the for-mer.38 This would lead to an exaggerated increase in the ineligible crimecategory. In particular, aggravated assault with and without a firearm, aswell as burglary of a residence and a nonresidence, are likely to be closesubstitutes. Empirically, the results for aggravated assault and burglary mir-ror the more general pattern of results. Replicating the bottom row of Table2, but only for these four crimes (the two types of aggravated assault andthe two burglary measures), in the year after Proposition 8 the eligiblecrimes are 4.0 percent lower, by 1985 the eligible crimes are 9.8 percentlower, and by the end of the sample period the eligible crimes are reducedby 24.8 percent. Including all crimes, the corresponding numbers are 23.9,27.8, and 221.3. Thus, substitution from eligible to ineligible crimes doesnot appear to be of a magnitude great enough to substantially alter the con-clusions.
V. Discussion and Conclusions
This article demonstrates theoretically that sentence enhancements pro-vide a means of distinguishing deterrence from incapacitation. Because en-hancements are tacked on to prison sentences that would have been servedanyway, there is no immediate incapacitation effect associated with suchenhancements. Thus any immediate decrease in crime that is observed isattributable to deterrence. In the long run, however, both the full deterrentand the incapacitation effects of sentence enhancements become operative.Consequently, crime will not fall immediately to the new steady state, butrather will decline gradually over time. The predictions of the model areborne out in an empirical application using eligible and noneligible crimesfor California’s Proposition 8. Crimes that were affected by the sentenceenhancements in Proposition 8 fall by 4 percent relative to crimes that werenot covered in the first year after the law change. The impact of the lawchange increases to a decline of over 20 percent in eligible crimes 7 yearsafter it is passed. These results suggest the presence of a deterrent effect,but also a potentially important role for incapacitation.
Our results suggest that criminals respond to the severity and not just thecertainty of sentences, a result that is predicted by the economic model ofcrime but has proven elusive empirically. This suggests that the increasingreliance on sentence enhancements in both state law and the federal sen-tencing guidelines may represent an effective means of reducing crime. Tothe extent that sentence enhancements target the most frequent and danger-ous offenders, such measures may be more cost effective than further ex-
38 Levitt, supra note 5.

360 the journal of law and economics
panding the prison population through the incarceration of the marginalcriminal who, given the skewed distribution of crime involvement,39 islikely to impose relatively low crime-related costs on society.
These results, if generalizable, have important implications for three-strikes laws. If deterrence is the primary reason for crime reduction withsuch laws, then they represent an attractive public policy option: both equi-librium crime rates and prison populations will fall. In contrast, if all of thereduction in crime were due to incapacitation, three-strikes laws would beinefficient because they lead to the long-term incarceration of individualswho are no longer criminally active. Our findings suggest that the answerlikely lies somewhere in the middle. There are important behavioral re-sponses to increased punishments on the part of criminals, but the delayedresponse to the law change suggests that incapacitation associated with ris-ing prison populations may explain more than half of the drop in crime.
Unfortunately, a direct empirical test of the impact of three strikes is notpossible because of the failure of states to enforce such laws in spite ofhaving them on the books. Of the 24 states passing three-strikes laws since1993, only California has widely applied these statutes. In California, 3,281individuals had been sentenced under three-strikes laws as of June 1,1997.40 Washington, the first state to pass a three-strikes law and after Cali-fornia the most active state in applying the law, has sentenced only 97 pris-oners under the statute. In most states, three-strikes statutes have never beenenforced. Consequently, it is not surprising that passage of three-strikeslaws is not associated with any discernible change in either crime rates orimprisonment rates, except perhaps in California. Between 1993 and 1996(three-strikes laws were implemented in 1994), California has seen a 20percent decline in violent crime per capita and a 19 percent decline in prop-erty crime per capita. In comparison, violent crime has fallen 13 percent inthe rest of the nation, and property crime is down only 4 percent over thesame period. California’s prison population has grown at roughly the samerate as the nation as a whole since adoption (22 percent vs. 21 percent). Infact, contrary to the dire predictions of an explosion in California’s prisonpopulation as a consequence of three strikes, the current prison populationis at almost exactly the level projected without the passage of three-strikeslaw.41 Without further investigation, however, it is difficult to know whether
39 DiIulio & Piehl, supra note 4.40 Austin, ‘‘Three Strikes and You’re Out’’: The Likely Consequences on the Courts, Pris-
ons, and Crime in California and Washington State, supra note 22.41 In defense of Greenwood et al., supra note 22, one partial explanation for the lack of
impact of three strikes on the prison population is the uneven application of the law by judgesand prosecutors.

sentence enhancements 361
declining crime in California can be causally attributed to the presence ofthree strikes.42
The reasons underlying the failure to enforce three-strikes laws in moststates merits greater attention, especially given that a wide variety of otherenhancements are frequently enforced at both the state and federal level.The two notable differences between three-strikes laws and other enhance-ments are (1) the much narrower applicability of three strikes in most statesand (2) the extremely harsh penalties associated with three strikes. To-gether, these two features lead to horizontal inequity, that is, offenders con-victed of relatively similar offenses being treated in radically different man-ners. Combined with the fact that the third-strike penalty is often out of linewith the third-strike offense (almost 40 percent of third strikes in Californiawere for property offenses, and another 11 percent were for drug posses-sion), prosecutors and judges appear to exercise discretion in circumventingthe statutes.43 The observed failure of most jurisdictions to enforce three-strikes laws suggests that from the perspective of fighting crime, sentenceenhancements that are broader in scope and less punitive, such as Proposi-tion 8, may ultimately prove more effective.
Bibliography
Andreoni, James. ‘‘Reasonable Doubt and the Optimal Magnitude of Fines: Shouldthe Penalty Fit the Crime?’’ Rand Journal of Economics 22, No. 3 (1991): 385–95.
Austin, James. ‘‘ ‘Three Strikes and You’re Out’: The Likely Consequences on theCourts, Prisons, and Crime in California and Washington State.’’ St. Louis Uni-versity Public Law Review 14 (1994): 239–57.
Austin, James. Presentation at the meetings of the American Criminological Soci-ety, San Diego, Cal., November 1997.
Becker, Gary. ‘‘Crime and Punishment: An Economic Approach.’’ Journal of Po-litical Economy 76 (1968): 169–217.
Blumstein, Alfred. ‘‘Prisons.’’ In Crime, edited by J. Q. Wilson and J. Petersilia.San Francisco, Cal.: Institute for Contemporary Studies, 1995.
Bureau of Justice Assistance. National Assessment of Structured Sentencing. NCJ153853. Washington, D.C.: U.S. Department of Justice, Office of Justice Pro-grams, 1996.
California Bureau of Criminal Statistics. Crime and Delinquency, 1979–85. Sacra-mento, Cal.: California Department of Justice, 1979–85.
42 Unfortunately it is not possible to conduct an analysis of the three-strikes law in Califor-nia paralleling that for Proposition 8 because conviction of any felony triggers the applicationof the enhancement. Thus, for three strikes, there is no good counterpart to the noneligiblecrimes used as controls in the Proposition 8 analysis.
43 James Andreoni, Reasonable Doubt and the Optimal Magnitude of Fines: Should thePenalty Fit the Crime? 22 Rand J. Econ. 385 (1991).

362 the journal of law and economics
Cameron, Samuel. ‘‘The Economics of Crime Deterrence: A Survey of Theory andEvidence.’’ Kyklos 41 (1988): 301–23.
Cantor, David, and Land, Kenneth. ‘‘Unemployment and Crime Rates in the Post–World War II United States: A Theoretical and Empirical Analysis.’’ AmericanSociological Review 50 (1985): 317–32.
Clark, John; Austin, James; and Henry, D. Alan. ‘‘Three Strikes and You’re Out’’:A Review of State Legislation. NCJ 165369. Washington, D.C.: U.S. Departmentof Justice, Office of Justice Programs, 1997.
Devine, Joel; Sheley, Joseph; and Smith, Dwayne. ‘‘Macroeconomic and Social-Control Policy Influences on Crime Rate Changes, 1948–1985.’’ American So-ciological Review 53 (1988): 407–20.
DiIulio, John, and Piehl, Anne. ‘‘Does Prison Pay? The Stormy National Debateover the Cost-Effectiveness of Imprisonment.’’ The Brookings Review (Fall1991), pp. 28–35.
Ehrlich, Isaac. ‘‘Participation in Illegitimate Activities: A Theoretical and EmpiricalInvestigation.’’ Journal of Political Economy 81 (1973): 531–67.
Ehrlich, Isaac. ‘‘Crime, Punishment, and the Market for Offenses.’’ Journal of Eco-nomic Perspectives 10 (1996): 43–67.
Flynn, Edith E.; Flanagan, Timothy; Greenwood, Peter; and Krisberg, Barry.‘‘Three Strikes Legislation: Prevalence and Definitions.’’ In Critical CriminalJustice Issues: Task Force Reports from the American Society of Criminology toAttorney General Janet Reno. NCJ 158837. Washington, D.C.: U.S. Departmentof Justice, Office of Justice Programs, 1997.
Greenwood, Peter; Rydell, C. Petter; Abrahamse, Allan F.; Caulkins, Jonathan P.;Chiesa, James; Model, Karyn E.; and Klein, Stephen P. Three Strikes and You’reOut: Estimated Benefits and Costs of California’s New Mandatory SentencingLaw. Santa Monica, Cal.: RAND, 1994.
Grogger, Jeff. ‘‘Certainty vs. Severity.’’ Economic Inquiry 29 (1991): 297–309.Kaplow, Louis, and Shavell, Steven. ‘‘Optimal Law Enforcement with Self-
Reporting of Behavior.’’ Journal of Political Economy 102 (1994): 583–606.Kessler, Daniel, and Piehl, Anne Morrison. ‘‘The Role of Discretion in the Criminal
Justice System.’’ Journal of Law, Economics, and Organization 14 (1998): 256–75.
Levitt, Steven. ‘‘Using Electoral Cycles in Police Hiring to Estimate the Effect ofPolice on Crime.’’ American Economic Review 87 (1997): 270–90.
Levitt, Steven. ‘‘Why Do Increased Arrest Rates Appear to Reduce Crime: Deterrence,Incapacitation, or Measurement Error?’’ Economic Inquiry 36, No. 3 (1998): 353–72.
Loftin, Colin; Heumann, Milton; and McDowall, David. ‘‘Mandatory Sentencingand Firearms Violence: Evaluating an Alternative to Gun Control.’’ Law and So-ciety Review 17 (1983): 287–318.
Lott, John. ‘‘Should the Wealthy Be Able to Buy Justice?’’ Journal of PoliticalEconomy 95 (1987): 1307–16.
Marvell, Thomas, and Moody, Carlisle. ‘‘Prison Population Growth and Crime Re-duction.’’ Journal of Quantitative Criminology 10 (1994): 109–40.
Marvell, Thomas, and Moody, Carlisle. ‘‘Police Levels, Crime Rates, and Specifi-cation Problems.’’ Criminology 34 (1996): 609–46.

sentence enhancements 363
Mayhew, Patricia; Clarke, Ronald; Burrows, John; Hough, J. Mike; and Winches-ter, Stuart. Crime in Public View. Home Office Research Study No. 49. London:Home Office, 1979.
McCormick, Robert, and Tollison, Robert. ‘‘Crime on the Court.’’ Journal of Polit-ical Economy 92 (1984): 223–35.
McCoy, Candace, and Tillman, Robert. ‘‘Controlling Felony Plea Bargaining inCalifornia: The Impact of the ‘Victims’ Bill of Rights.’ ’’ Sacramento: CaliforniaDepartment of Justice, Bureau of Criminal Statistics, 1986.
McDowall, David; Loftin, Colin; and Wiersema, Brian. ‘‘A Comparative Study ofthe Preventive Effects of Mandatory Sentencing Laws for Gun Crimes.’’ Journalof Criminal Law and Criminology 83 (1992): 378–94.
Nagin, Daniel. ‘‘Criminal Deterrence Research: A Review of the Evidence and aResearch Agenda for the Outset of the Twenty-First Century.’’ Unpublishedmanuscript. Pittsburgh: Carnegie Mellon University, 1997.
Pierce, Glen L., and Bowers, William J. ‘‘The Bartley-Fox Gun Law’s Short-TermImpact on Crime in Boston.’’ Annals of the American Academy of Political andSocial Science 455 (1981): 120–32.
Polinsky, A. Mitchell, and Rubinfeld, Daniel. ‘‘A Model of Optimal Fines for Re-peat Offenders.’’ Journal of Public Economics 46 (1991): 291–306.
Polinsky, A. Mitchell, and Shavell, Steven. ‘‘The Optimal Use of Fines and Impris-onment.’’ Journal of Public Economics 24 (1984): 89–99.
Polinsky, A. Mitchell, and Shavell, Steven. ‘‘On the Disutility and Discounting ofImprisonment and the Theory of Deterrence.’’ Working paper. Cambridge,Mass.: Harvard Law School, 1997.
Spelman, William. Criminal Incapacitation. New York: Plenum Press, 1994.Tauchen, Helen; Witte, Anne; and Griesinger, Harriet. ‘‘Criminal Deterrence: Re-
visiting the Issue with a Birth Cohort.’’ Mimeographed manuscript. Chapel Hill:University of North Carolina, Department of Economics, 1993.
Tillman, Robert, and McCoy, Candace. The Impact of California’s ‘‘Prior FelonyConviction’’ Law. Sacramento: California Department of Justice, Bureau ofCriminal Statistics, 1986.
Tonry, Michael. ‘‘Structuring Sentencing.’’ In Crime and Justice: A Review of Re-search. Vol. 10, edited by Michael Tonry and Norval Morris. Chicago: Univer-sity of Chicago Press, 1988.
Tonry, Michael. ‘‘Mandatory Penalties.’’ In Crime and Justice: A Review of Research.Vol. 16, edited by Michael Tonry. Chicago: University of Chicago Press, 1992.
Tonry, Michael. Sentencing Matters. New York: Oxford University Press, 1996.U.S. Sentencing Commission. The Federal Sentencing Guidelines: A Report on the
Operation of the Guidelines System and Short-Term Impacts on Disparity in Sen-tencing, Use of Incarceration, and Prosecutorial Discretion and Plea Bar-gaining. Washington, D.C.: U.S. Sentencing Commission, 1991.
Visher, Christy. ‘‘The RAND Inmate Survey: A Reanalysis.’’ In Criminal Careersand Career Criminals. Vol. 2, edited by A. Blumstein et al. Washington, D.C.:National Academy Press, 1986.
Witte, Ann. ‘‘Estimating the Economic Model of Crime with Individual Data.’’Quarterly Journal of Economics 94 (1980): 57–84.
