using smartphones to collect information about health ...using smartphones to collect information...
TRANSCRIPT
Using Smartphones to Collect Information about Health Behaviors:
A Formative and Process Evaluation
Sean Hu, MD, MS, DrPH
Centers for Disease Control and Prevention
Office on Smoking and Health (OSH)
James Dayton, MBA
Naomi Freedner-Maguire, MPH
Piper DuBray
ICF International
18th Annual Federal Computer Assisted Survey Information Collection
March 17, 2014
National Center for Chronic Disease Prevention and Health Promotion
Office on Smoking and Health
Disclaimer
The findings and conclusions of this study are those of
the authors and do not necessarily represent the views
of the Centers for Disease Control and Prevention or
ICF International.
Overview
• Background
• Study Phase I: Focus Group
• Study Phase II: Smartphone Survey
• Conclusion
• Next Step: Outcome Evaluation
Background
In June 2011, CDC’s Office on Smoking and Health convened
an expert panel to address rapid response surveillance for
tobacco prevention and control.
Rapid response surveillance is a system designed to provide
accurate and reliable information on an emerging tobacco
control-related issue in a quick, cost-efficient manner.
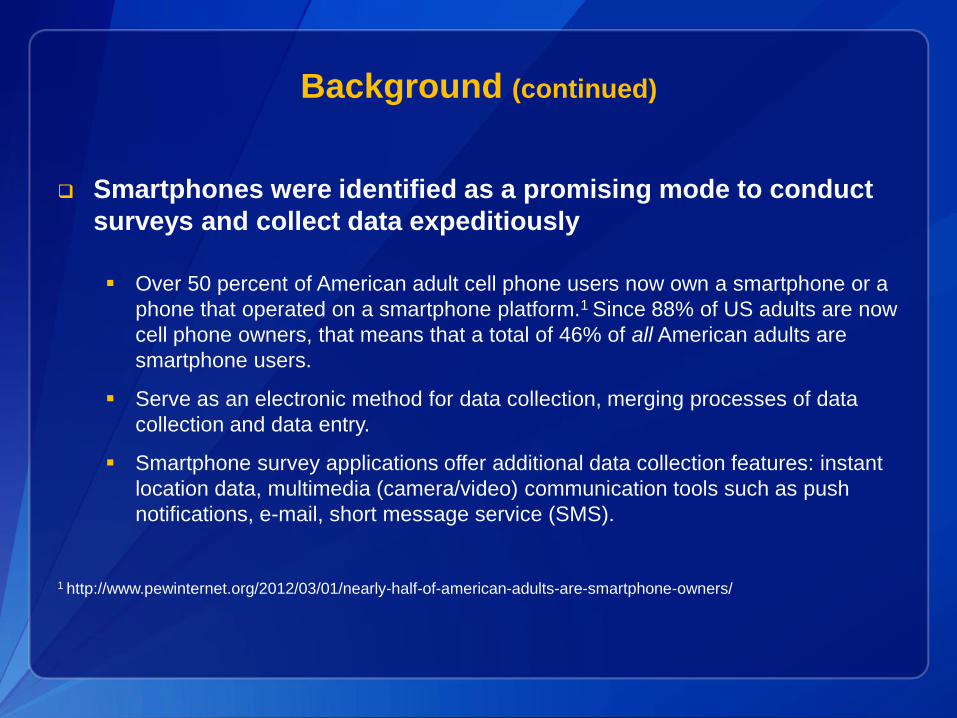
Background (continued)
Smartphones were identified as a promising mode to conduct
surveys and collect data expeditiously
Over 50 percent of American adult cell phone users now own a smartphone or a
phone that operated on a smartphone platform.1 Since 88% of US adults are now
cell phone owners, that means that a total of 46% of all American adults are
smartphone users.
Serve as an electronic method for data collection, merging processes of data
collection and data entry.
Smartphone survey applications offer additional data collection features: instant
location data, multimedia (camera/video) communication tools such as push
notifications, e-mail, short message service (SMS).
1 http://www.pewinternet.org/2012/03/01/nearly-half-of-american-adults-are-smartphone-owners/
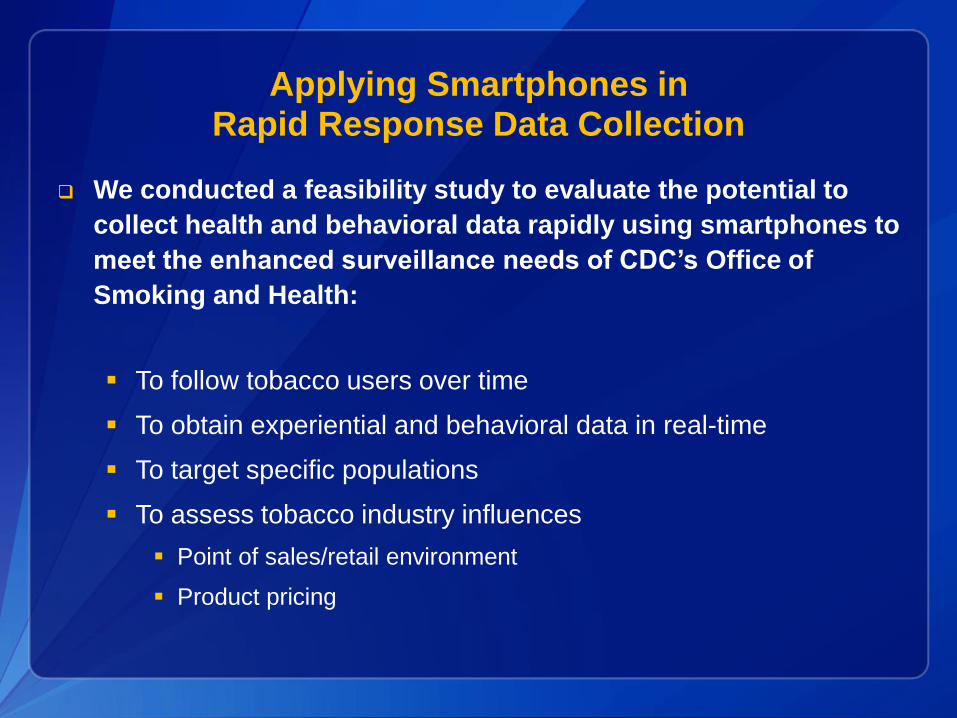
Applying Smartphones in Rapid Response Data Collection
We conducted a feasibility study to evaluate the potential to
collect health and behavioral data rapidly using smartphones to
meet the enhanced surveillance needs of CDC’s Office of
Smoking and Health:
To follow tobacco users over time
To obtain experiential and behavioral data in real-time
To target specific populations
To assess tobacco industry influences
Point of sales/retail environment
Product pricing
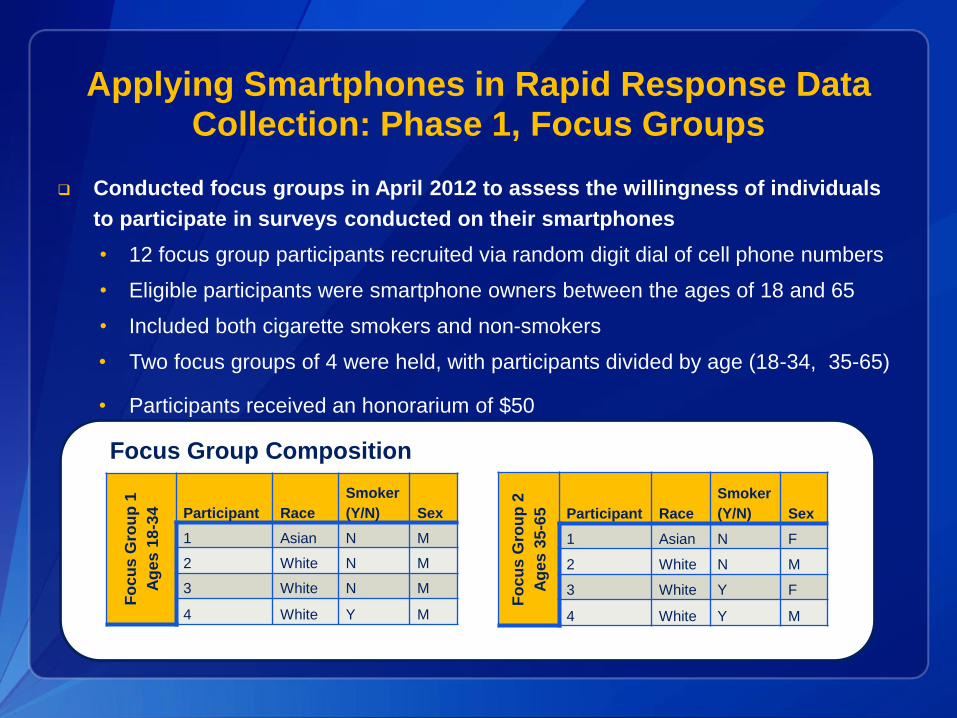
Applying Smartphones in Rapid Response Data Collection: Phase 1, Focus Groups
Conducted focus groups in April 2012 to assess the willingness of individuals
to participate in surveys conducted on their smartphones
• 12 focus group participants recruited via random digit dial of cell phone numbers
• Eligible participants were smartphone owners between the ages of 18 and 65
• Included both cigarette smokers and non-smokers
• Two focus groups of 4 were held, with participants divided by age (18-34, 35-65)
• Participants received an honorarium of $50
Fo
cu
s G
rou
p 1
Ag
es
18
-34 Participant Race
Smoker
(Y/N) Sex
1 Asian N M
2 White N M
3 White N M
4 White Y M
Fo
cu
s G
rou
p 2
Ag
es
35
-65 Participant Race
Smoker
(Y/N) Sex
1 Asian N F
2 White N M
3 White Y F
4 White Y M
Focus Group Composition
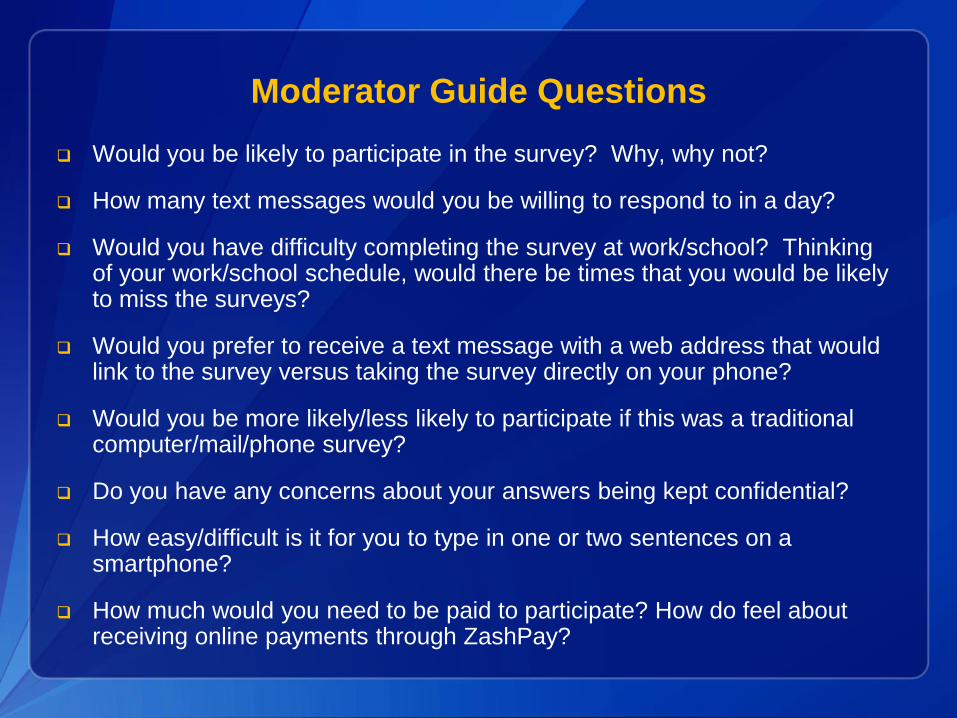
Moderator Guide Questions
Would you be likely to participate in the survey? Why, why not?
How many text messages would you be willing to respond to in a day?
Would you have difficulty completing the survey at work/school? Thinking of your work/school schedule, would there be times that you would be likely to miss the surveys?
Would you prefer to receive a text message with a web address that would link to the survey versus taking the survey directly on your phone?
Would you be more likely/less likely to participate if this was a traditional computer/mail/phone survey?
Do you have any concerns about your answers being kept confidential?
How easy/difficult is it for you to type in one or two sentences on a smartphone?
How much would you need to be paid to participate? How do feel about receiving online payments through ZashPay?
Focus Group Results
Information obtained from focus group participants was
organized into the following categories:
Security concerns
Usability concerns
Perceived burden
Perceived social benefit
Use of Incentives
Security Concerns
Privacy of information transmitted on smartphones: “You download an app and then they have all your info.”
Risks posed by viruses and spam when sending and receiving surveys over e-mail
Concern that data collected would be stored on the smartphone: “Smart phones are easy to get stolen, and then they have all your information.”
Usability Concerns: Screen Size and Formatting
iPhone is much easier to use than a Blackberry or Droid; these
devices would pose a barrier to participating. Comments about
non-iPhone smartphones:
“The screen size on the iPhone is better than the Blackberry and more
‘magical.’”
“I find it difficult to scroll, and the screen size is difficult.”
“I have a less fancy smartphone, so when there is a page that doesn’t
format correctly…like it puts all the pictures up front…it is annoying for
me.”
“Types of sites can be different, and formatting looks different on
different phones.”
Usability Concerns: Text Message vs. Web Link
Device preference when answering questions by text messaging or via a link to Web survey
More difficult to complete the survey on a website using an older phone: “Texts would be more successful than a web survey. It is quicker and easier to text”; “Texting is an easy way to communicate, I will always respond.”
Some participants indicated that they would be less likely to complete surveys via text message when being asked to provide sensitive information, whereas others preferred this mode: “I would prefer the smartphone for sensitive questions. I would not want to talk to someone on the phone about it.”; “I wouldn’t want to use mail for these questions…what if it fell out of the mailbox and a neighbor picked it up?”
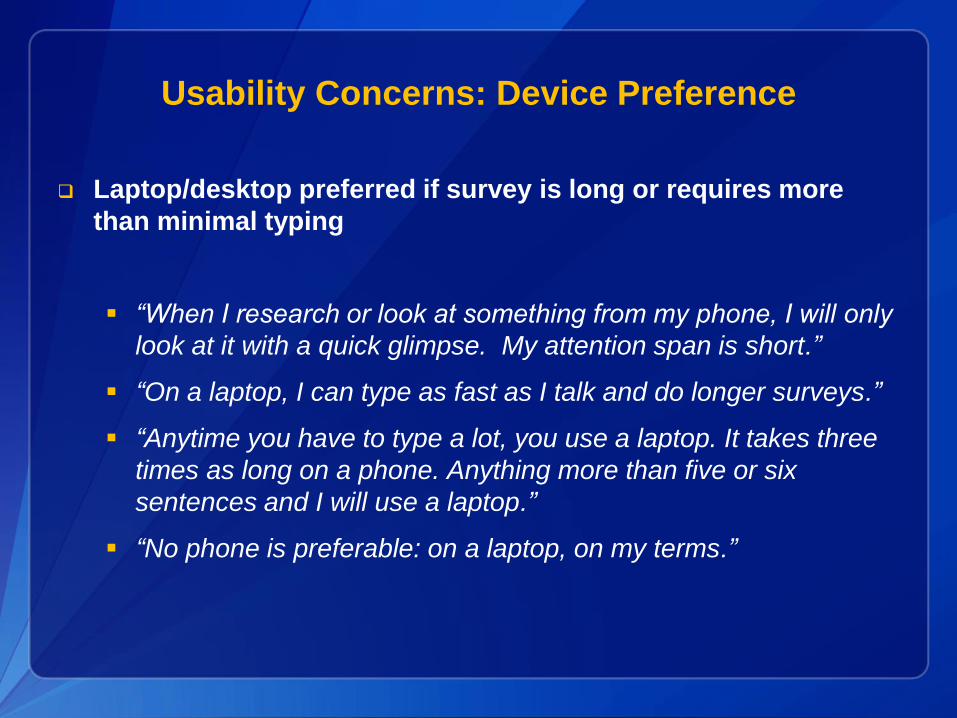
Usability Concerns: Device Preference
Laptop/desktop preferred if survey is long or requires more
than minimal typing
“When I research or look at something from my phone, I will only
look at it with a quick glimpse. My attention span is short.”
“On a laptop, I can type as fast as I talk and do longer surveys.”
“Anytime you have to type a lot, you use a laptop. It takes three
times as long on a phone. Anything more than five or six
sentences and I will use a laptop.”
“No phone is preferable: on a laptop, on my terms.”
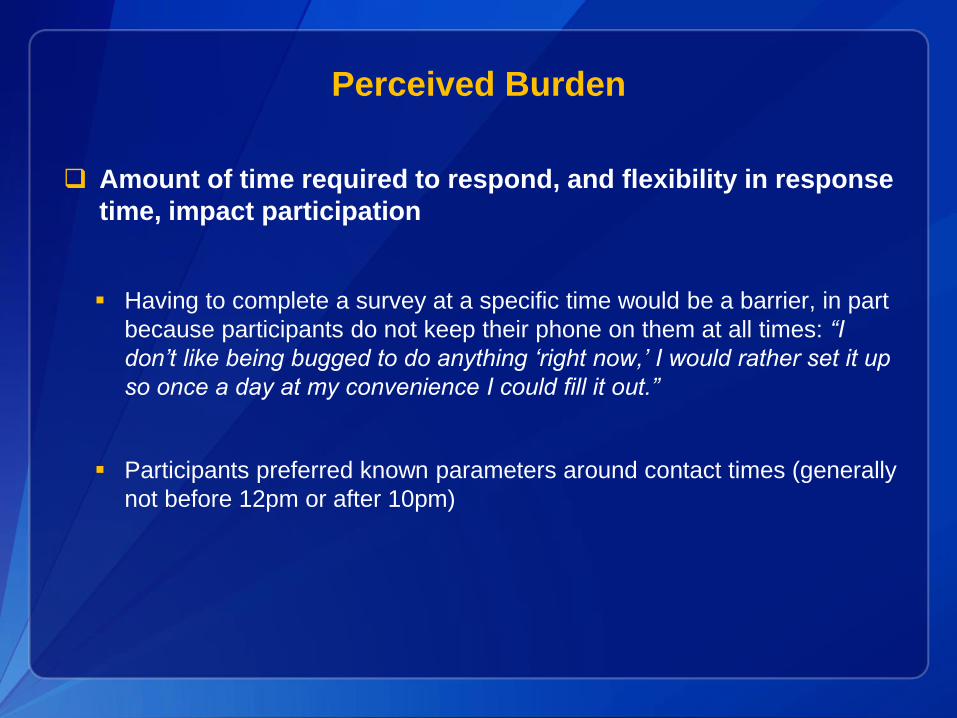
Perceived Burden
Amount of time required to respond, and flexibility in response
time, impact participation
Having to complete a survey at a specific time would be a barrier, in part
because participants do not keep their phone on them at all times: “I
don’t like being bugged to do anything ‘right now,’ I would rather set it up
so once a day at my convenience I could fill it out.”
Participants preferred known parameters around contact times (generally
not before 12pm or after 10pm)
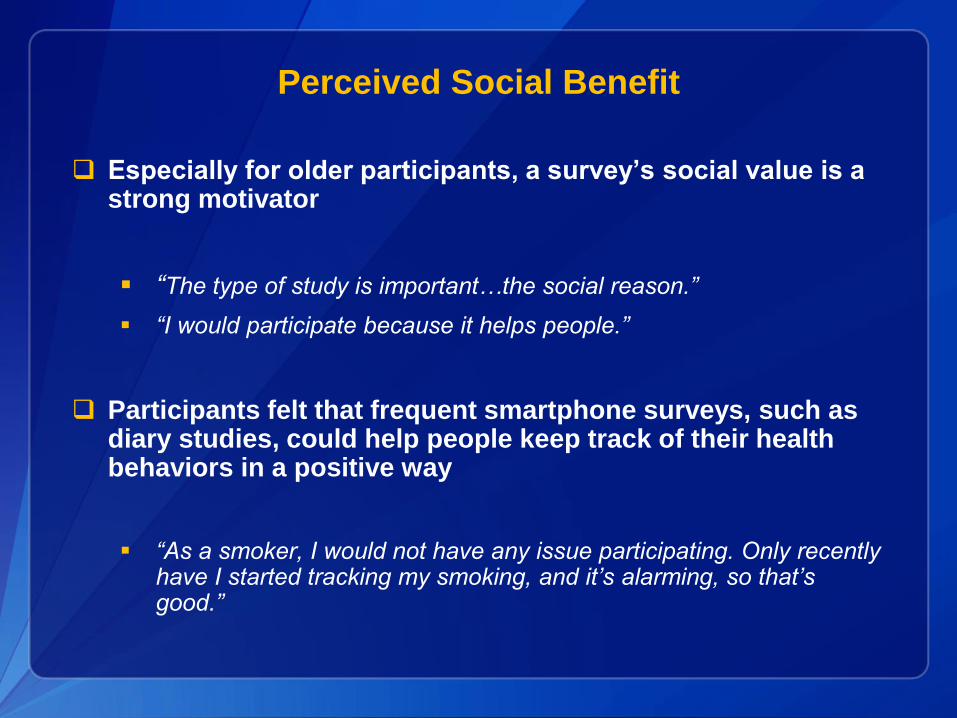
Perceived Social Benefit
Especially for older participants, a survey’s social value is a strong motivator
“The type of study is important…the social reason.”
“I would participate because it helps people.”
Participants felt that frequent smartphone surveys, such as diary studies, could help people keep track of their health behaviors in a positive way
“As a smoker, I would not have any issue participating. Only recently have I started tracking my smoking, and it’s alarming, so that’s good.”
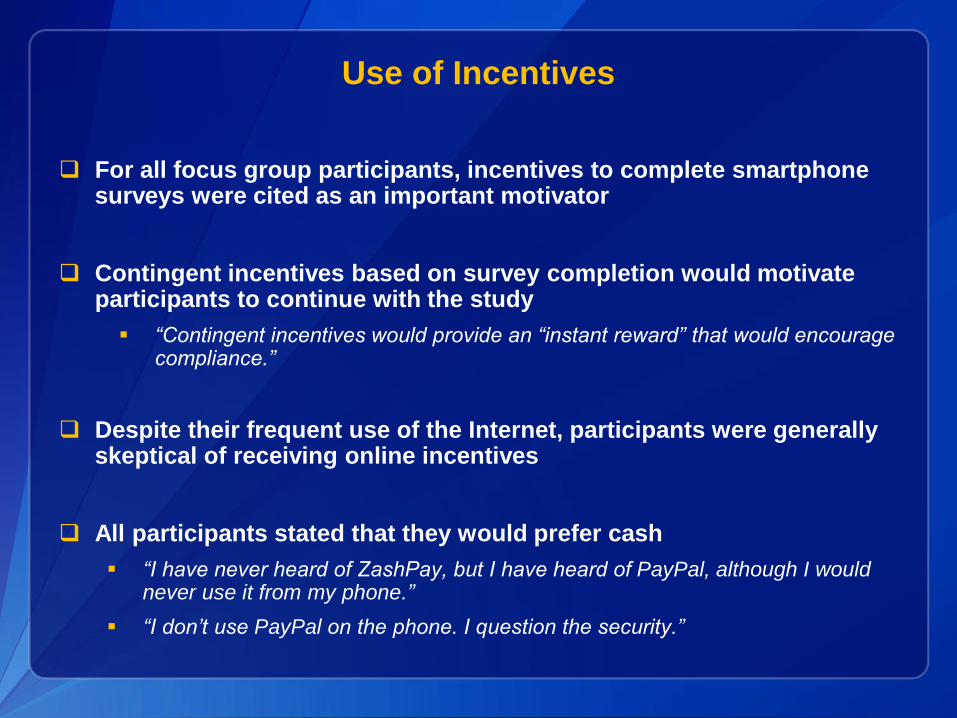
Use of Incentives
For all focus group participants, incentives to complete smartphone surveys were cited as an important motivator
Contingent incentives based on survey completion would motivate participants to continue with the study
“Contingent incentives would provide an “instant reward” that would encourage compliance.”
Despite their frequent use of the Internet, participants were generally skeptical of receiving online incentives
All participants stated that they would prefer cash
“I have never heard of ZashPay, but I have heard of PayPal, although I would never use it from my phone.”
“I don’t use PayPal on the phone. I question the security.”
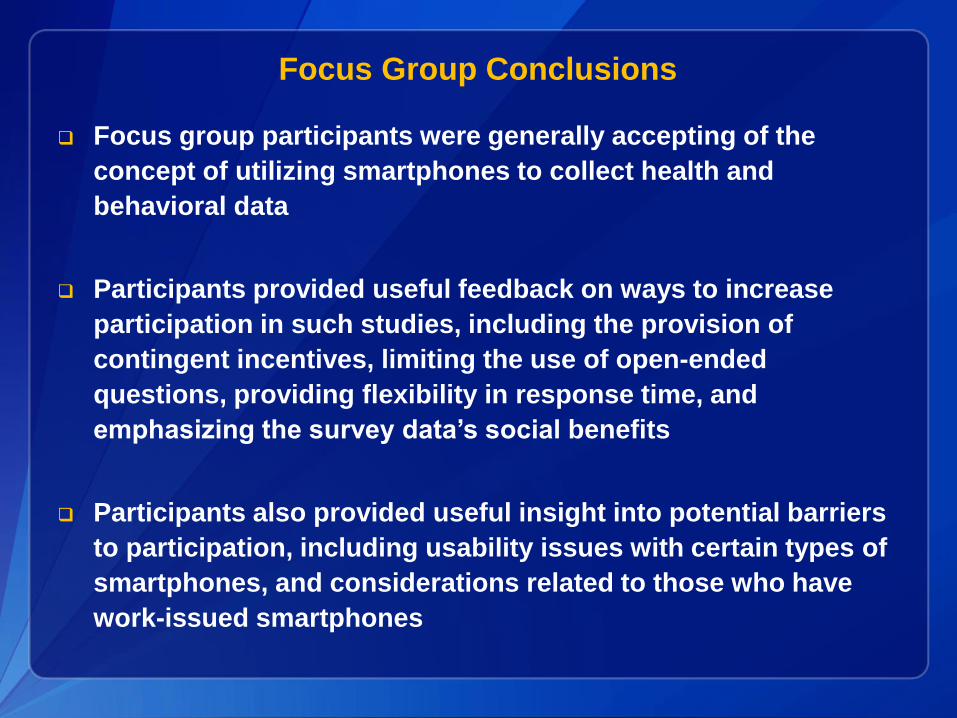
Focus Group Conclusions
Focus group participants were generally accepting of the
concept of utilizing smartphones to collect health and
behavioral data
Participants provided useful feedback on ways to increase
participation in such studies, including the provision of
contingent incentives, limiting the use of open-ended
questions, providing flexibility in response time, and
emphasizing the survey data’s social benefits
Participants also provided useful insight into potential barriers
to participation, including usability issues with certain types of
smartphones, and considerations related to those who have
work-issued smartphones
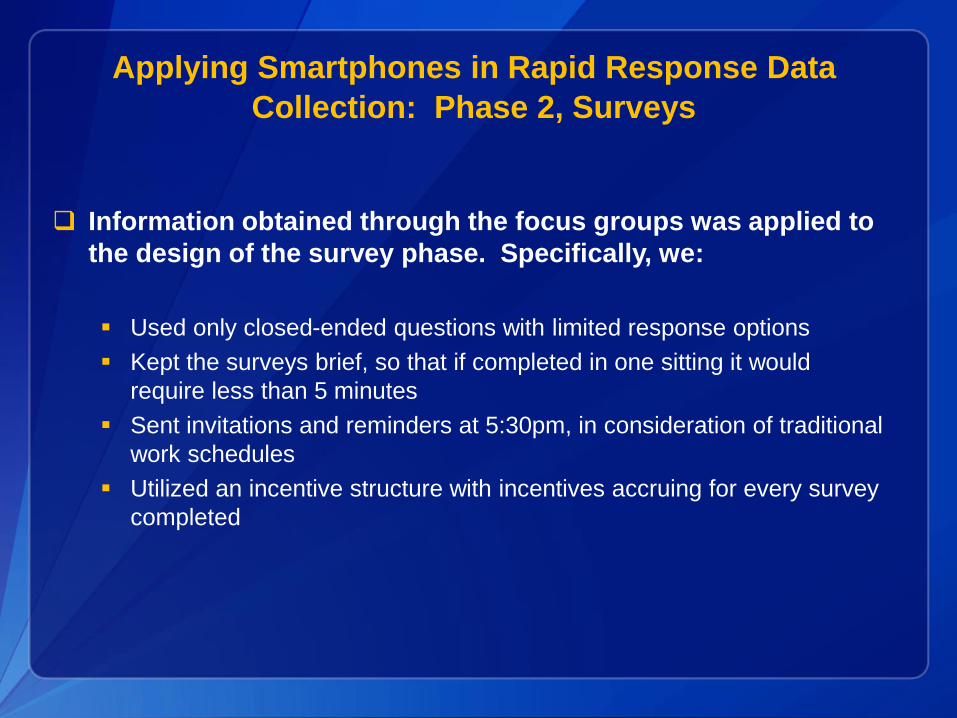
Information obtained through the focus groups was applied to
the design of the survey phase. Specifically, we:
Used only closed-ended questions with limited response options
Kept the surveys brief, so that if completed in one sitting it would
require less than 5 minutes
Sent invitations and reminders at 5:30pm, in consideration of traditional
work schedules
Utilized an incentive structure with incentives accruing for every survey
completed
Applying Smartphones in Rapid Response Data
Collection: Phase 2, Surveys
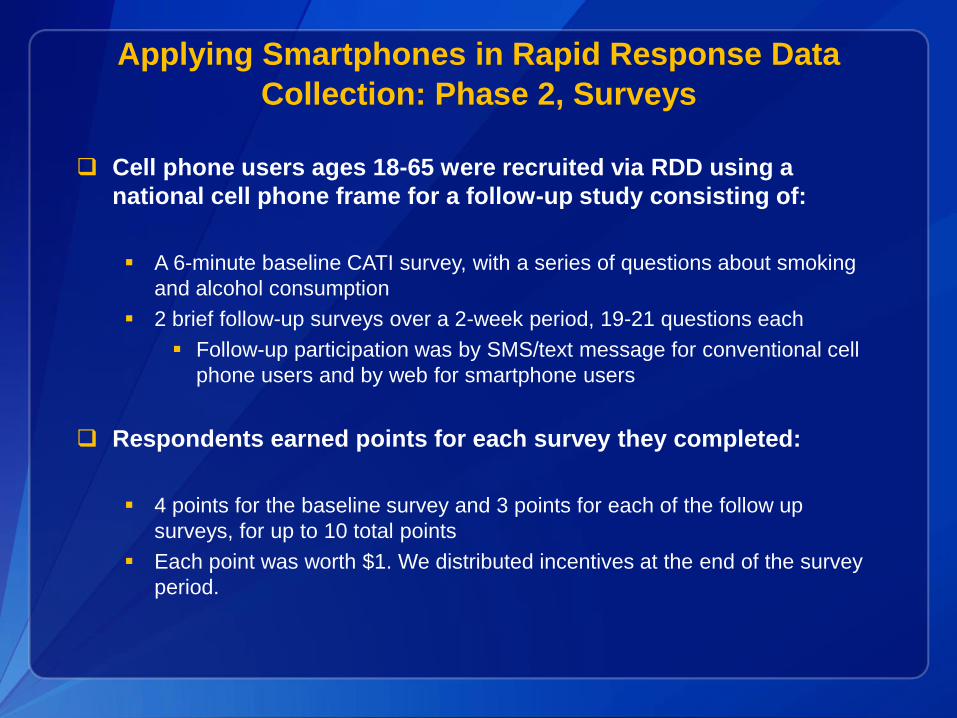
Cell phone users ages 18-65 were recruited via RDD using a
national cell phone frame for a follow-up study consisting of:
A 6-minute baseline CATI survey, with a series of questions about smoking
and alcohol consumption
2 brief follow-up surveys over a 2-week period, 19-21 questions each
Follow-up participation was by SMS/text message for conventional cell
phone users and by web for smartphone users
Respondents earned points for each survey they completed:
4 points for the baseline survey and 3 points for each of the follow up
surveys, for up to 10 total points
Each point was worth $1. We distributed incentives at the end of the survey
period.
Applying Smartphones in Rapid Response Data
Collection: Phase 2, Surveys
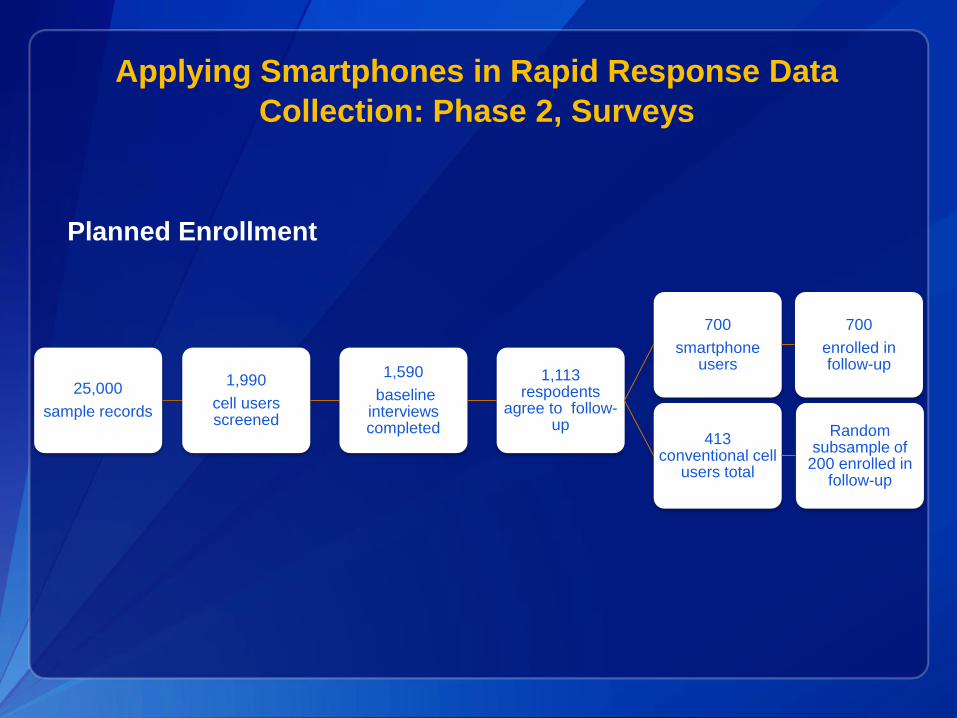
25,000
sample records
1,990
cell users screened
1,590
baseline interviews completed
1,113 respodents
agree to follow-up
700
smartphone users
700
enrolled in follow-up
413 conventional cell
users total
Random subsample of
200 enrolled in follow-up
Planned Enrollment
Applying Smartphones in Rapid Response Data
Collection: Phase 2, Surveys
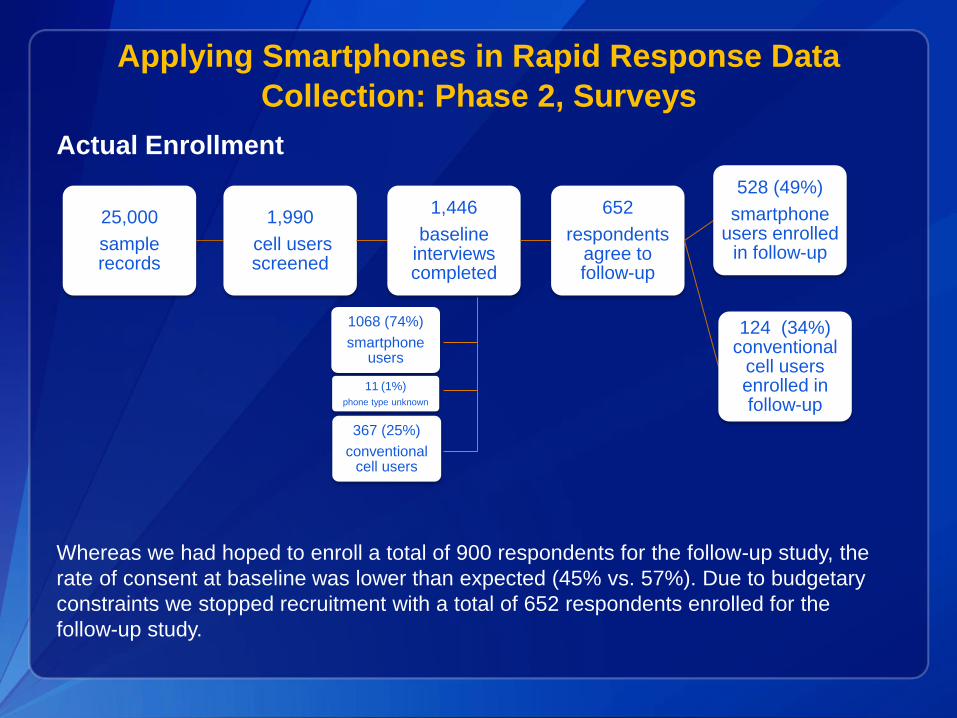
25,000
sample records
1,990
cell users screened
1,446
baseline interviews completed
652
respondents agree to follow-up
528 (49%)
smartphone users enrolled
in follow-up
124 (34%) conventional
cell users enrolled in follow-up
1068 (74%)
smartphone users
367 (25%)
conventional cell users
11 (1%)
phone type unknown
Actual Enrollment
Whereas we had hoped to enroll a total of 900 respondents for the follow-up study, the
rate of consent at baseline was lower than expected (45% vs. 57%). Due to budgetary
constraints we stopped recruitment with a total of 652 respondents enrolled for the
follow-up study.
Applying Smartphones in Rapid Response Data
Collection: Phase 2, Surveys
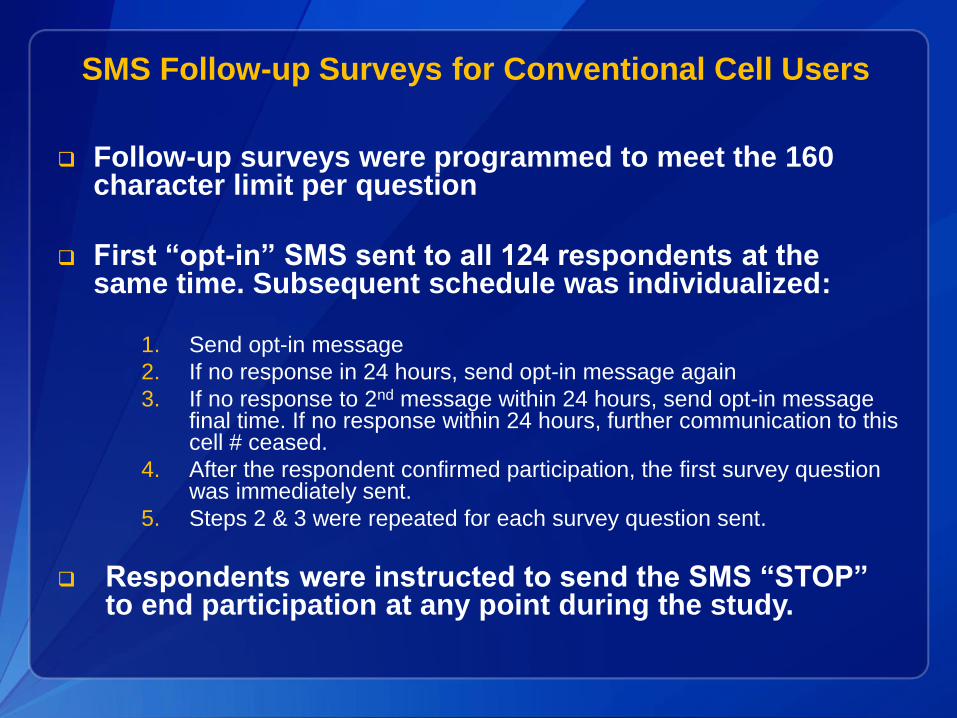
SMS Follow-up Surveys for Conventional Cell Users
Follow-up surveys were programmed to meet the 160 character limit per question
First “opt-in” SMS sent to all 124 respondents at the same time. Subsequent schedule was individualized:
1. Send opt-in message
2. If no response in 24 hours, send opt-in message again
3. If no response to 2nd message within 24 hours, send opt-in message final time. If no response within 24 hours, further communication to this cell # ceased.
4. After the respondent confirmed participation, the first survey question was immediately sent.
5. Steps 2 & 3 were repeated for each survey question sent.
Respondents were instructed to send the SMS “STOP” to end participation at any point during the study.
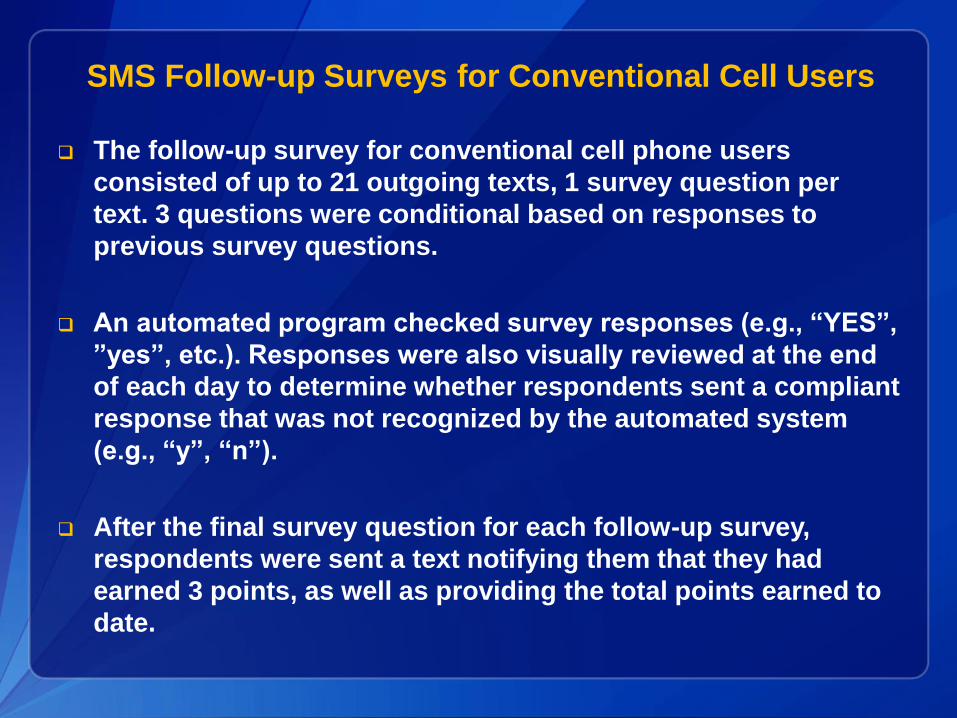
SMS Follow-up Surveys for Conventional Cell Users
The follow-up survey for conventional cell phone users
consisted of up to 21 outgoing texts, 1 survey question per
text. 3 questions were conditional based on responses to
previous survey questions.
An automated program checked survey responses (e.g., “YES”,
”yes”, etc.). Responses were also visually reviewed at the end
of each day to determine whether respondents sent a compliant
response that was not recognized by the automated system
(e.g., “y”, “n”).
After the final survey question for each follow-up survey,
respondents were sent a text notifying them that they had
earned 3 points, as well as providing the total points earned to
date.
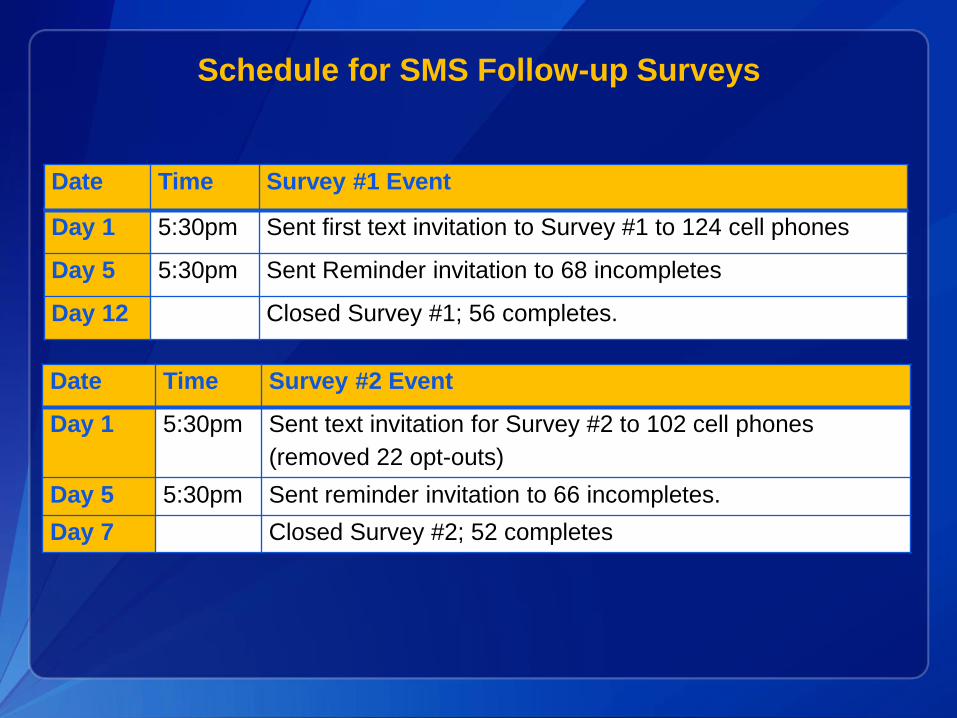
Schedule for SMS Follow-up Surveys
Date Time Event
Day 1 5:30pm Sent first text invitation to Survey #1 to 124 cell phones
Day 5 5:30pm Sent Reminder invitation to 68 incompletes
Day 12 Closed Survey #1; 56 completes.
Date Time Survey #1 Event
Day 1 5:30pm Sent first text invitation to Survey #1 to 124 cell phones
Day 5 5:30pm Sent Reminder invitation to 68 incompletes
Day 12 Closed Survey #1; 56 completes.
Date Time Survey #2 Event
Day 1 5:30pm Sent text invitation for Survey #2 to 102 cell phones
(removed 22 opt-outs)
Day 5 5:30pm Sent reminder invitation to 66 incompletes.
Day 7 Closed Survey #2; 52 completes
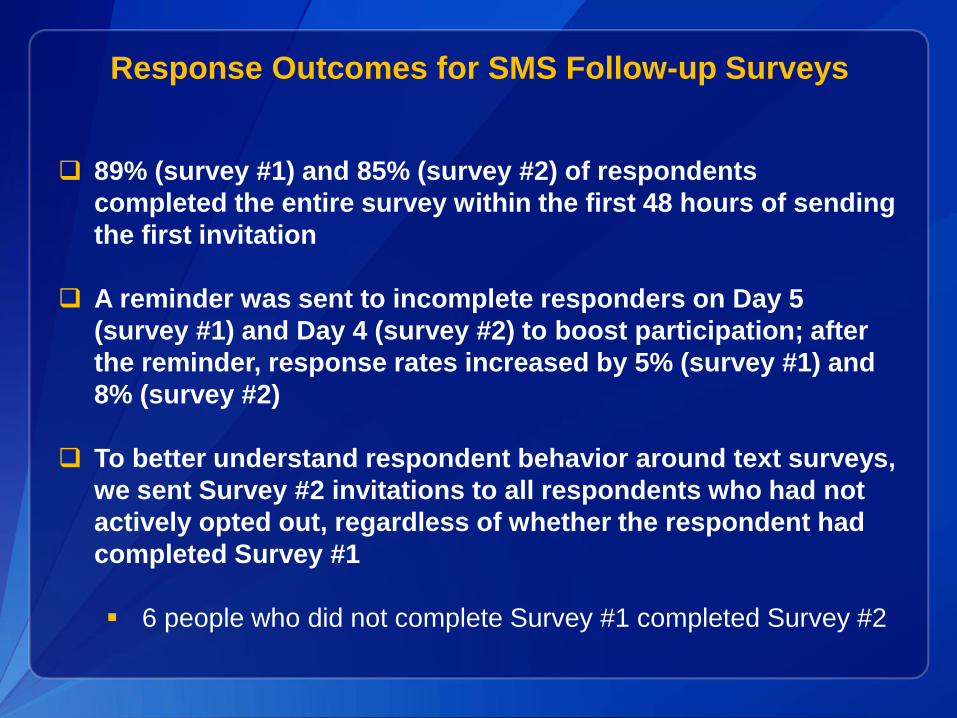
Response Outcomes for SMS Follow-up Surveys
89% (survey #1) and 85% (survey #2) of respondents
completed the entire survey within the first 48 hours of sending
the first invitation
A reminder was sent to incomplete responders on Day 5
(survey #1) and Day 4 (survey #2) to boost participation; after
the reminder, response rates increased by 5% (survey #1) and
8% (survey #2)
To better understand respondent behavior around text surveys,
we sent Survey #2 invitations to all respondents who had not
actively opted out, regardless of whether the respondent had
completed Survey #1
6 people who did not complete Survey #1 completed Survey #2
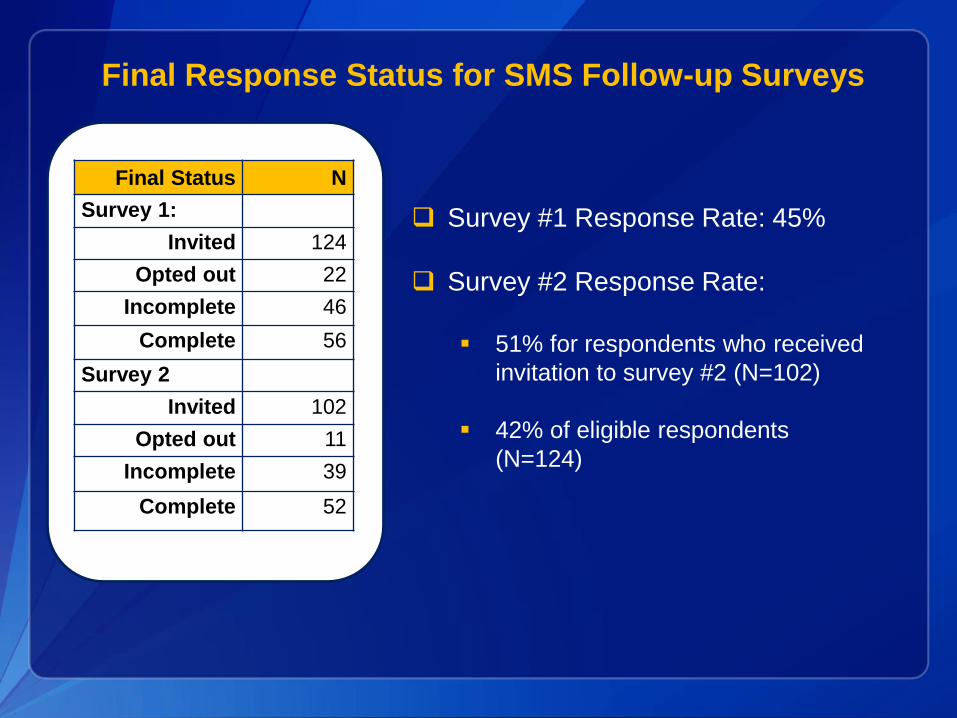
Final Response Status for SMS Follow-up Surveys
Final Status N
Survey 1:
Invited 124
Opted out 22
Incomplete 46
Complete 56
Survey 2
Invited 102
Opted out 11
Incomplete 39
Complete 52
Survey #1 Response Rate: 45%
Survey #2 Response Rate:
51% for respondents who received
invitation to survey #2 (N=102)
42% of eligible respondents
(N=124)
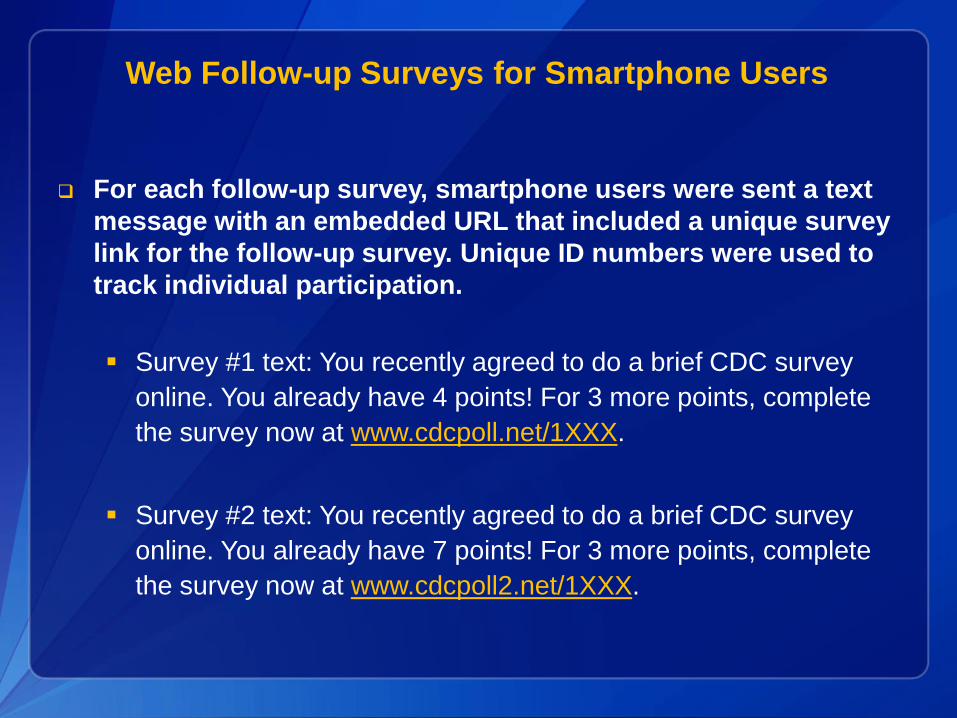
Web Follow-up Surveys for Smartphone Users
For each follow-up survey, smartphone users were sent a text
message with an embedded URL that included a unique survey
link for the follow-up survey. Unique ID numbers were used to
track individual participation.
Survey #1 text: You recently agreed to do a brief CDC survey
online. You already have 4 points! For 3 more points, complete
the survey now at www.cdcpoll.net/1XXX.
Survey #2 text: You recently agreed to do a brief CDC survey
online. You already have 7 points! For 3 more points, complete
the survey now at www.cdcpoll2.net/1XXX.
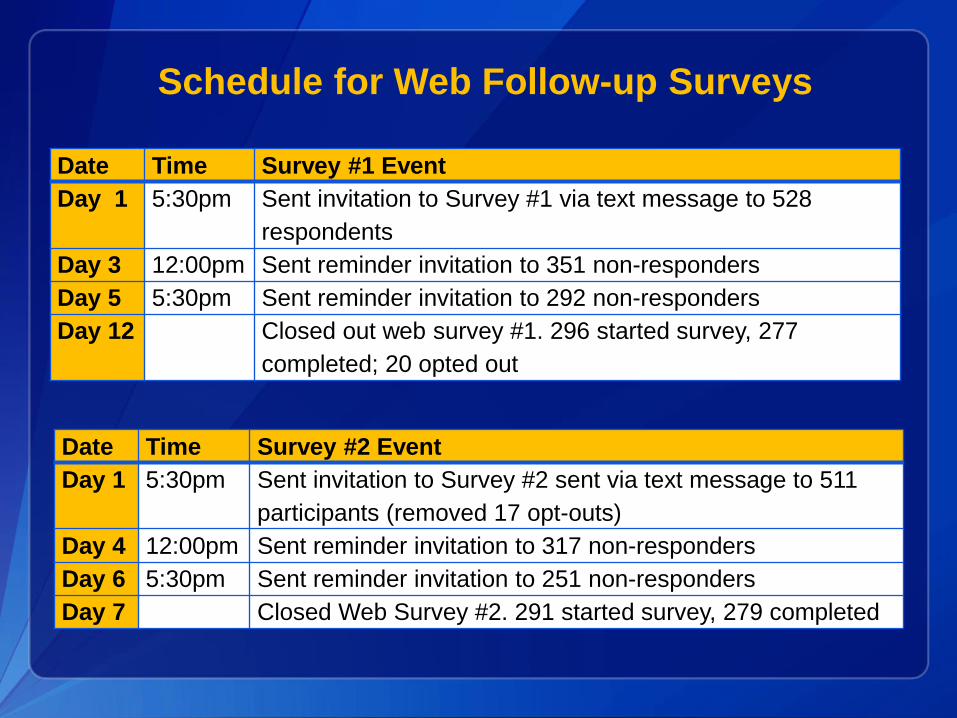
Schedule for Web Follow-up Surveys
Date Time Survey #1 Event
Day 1 5:30pm Sent invitation to Survey #1 via text message to 528
respondents
Day 3 12:00pm Sent reminder invitation to 351 non-responders
Day 5 5:30pm Sent reminder invitation to 292 non-responders
Day 12 Closed out web survey #1. 296 started survey, 277
completed; 20 opted out
Date Time Survey #2 Event
Day 1 5:30pm Sent invitation to Survey #2 sent via text message to 511
participants (removed 17 opt-outs)
Day 4 12:00pm Sent reminder invitation to 317 non-responders
Day 6 5:30pm Sent reminder invitation to 251 non-responders
Day 7 Closed Web Survey #2. 291 started survey, 279 completed
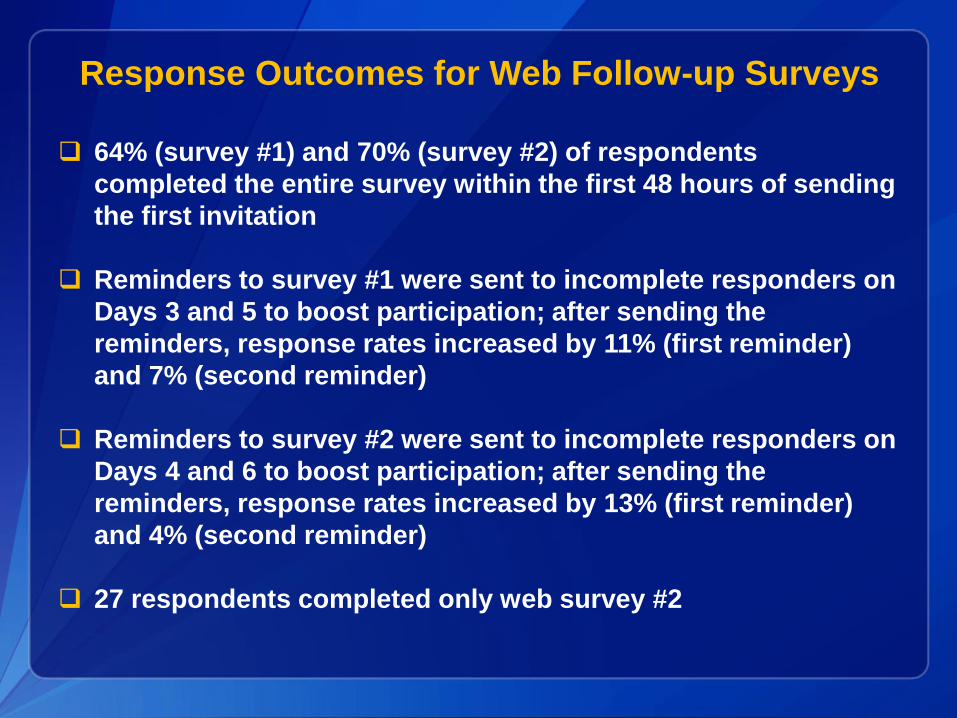
Response Outcomes for Web Follow-up Surveys
64% (survey #1) and 70% (survey #2) of respondents
completed the entire survey within the first 48 hours of sending
the first invitation
Reminders to survey #1 were sent to incomplete responders on
Days 3 and 5 to boost participation; after sending the
reminders, response rates increased by 11% (first reminder)
and 7% (second reminder)
Reminders to survey #2 were sent to incomplete responders on
Days 4 and 6 to boost participation; after sending the
reminders, response rates increased by 13% (first reminder)
and 4% (second reminder)
27 respondents completed only web survey #2
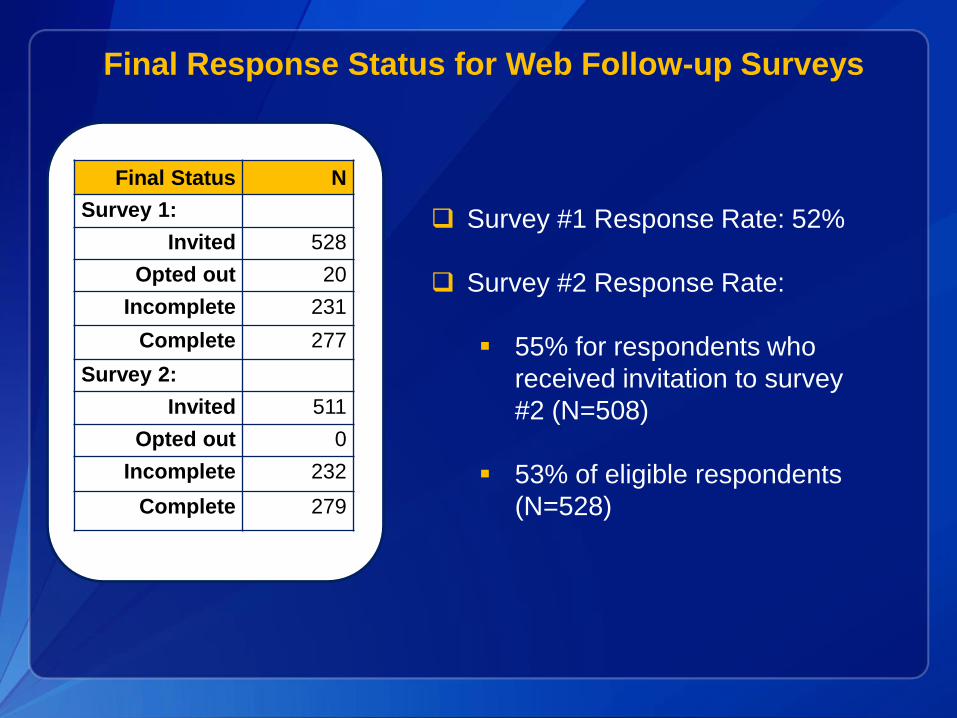
Final Response Status for Web Follow-up Surveys
Final Status N
Survey 1:
Invited 528
Opted out 20
Incomplete 231
Complete 277
Survey 2:
Invited 511
Opted out 0
Incomplete 232
Complete 279
Survey #1 Response Rate: 52%
Survey #2 Response Rate:
55% for respondents who
received invitation to survey
#2 (N=508)
53% of eligible respondents
(N=528)
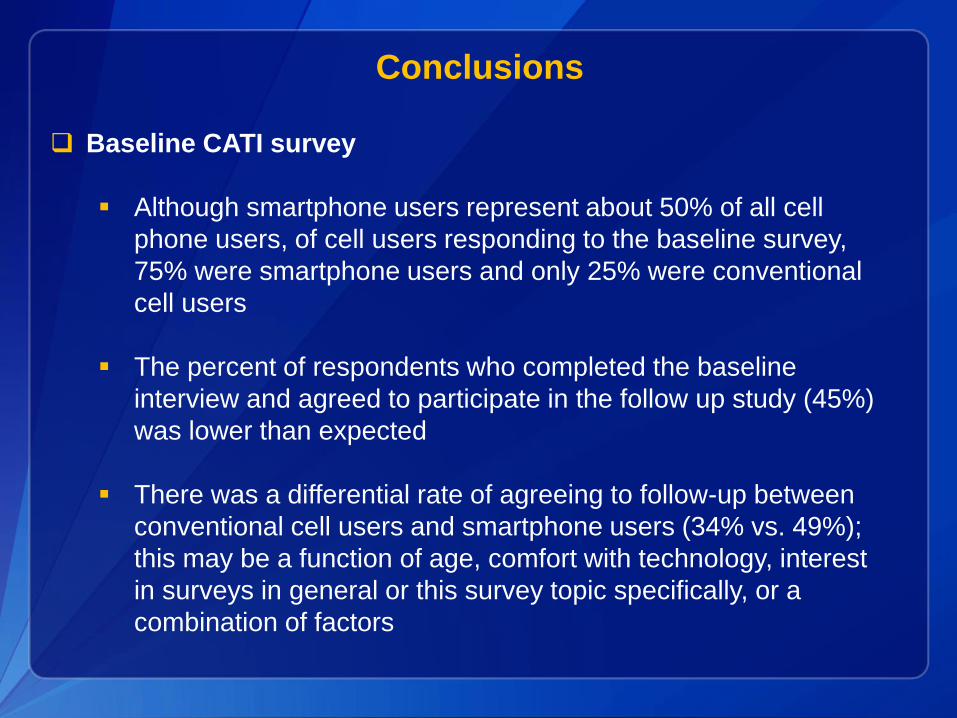
Conclusions
Baseline CATI survey
Although smartphone users represent about 50% of all cell
phone users, of cell users responding to the baseline survey,
75% were smartphone users and only 25% were conventional
cell users
The percent of respondents who completed the baseline
interview and agreed to participate in the follow up study (45%)
was lower than expected
There was a differential rate of agreeing to follow-up between
conventional cell users and smartphone users (34% vs. 49%);
this may be a function of age, comfort with technology, interest
in surveys in general or this survey topic specifically, or a
combination of factors
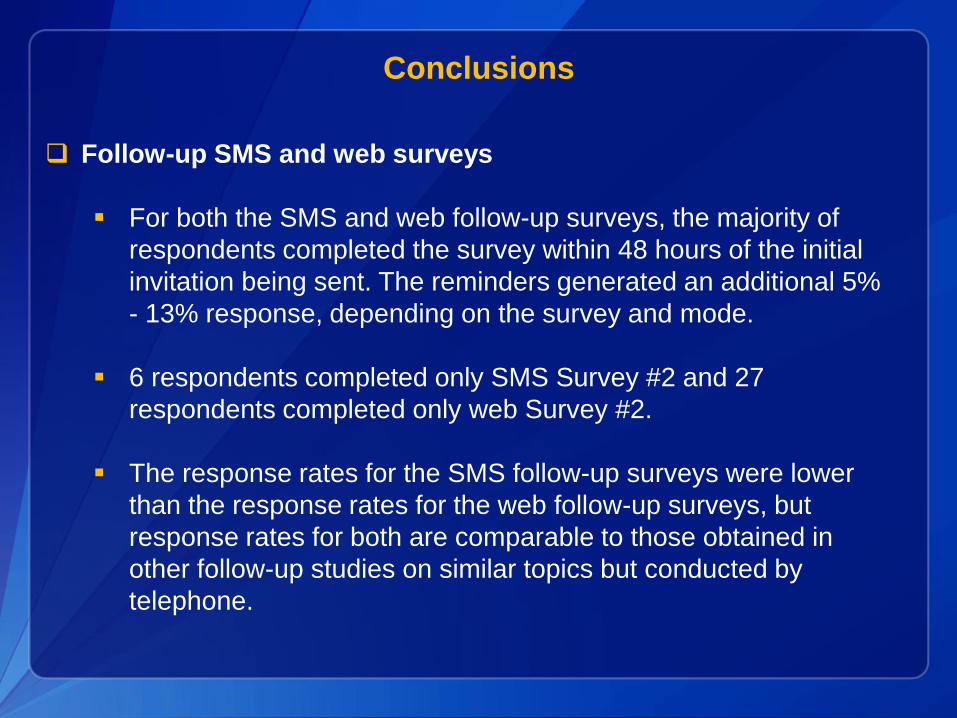
Conclusions
Follow-up SMS and web surveys
For both the SMS and web follow-up surveys, the majority of
respondents completed the survey within 48 hours of the initial
invitation being sent. The reminders generated an additional 5%
- 13% response, depending on the survey and mode.
6 respondents completed only SMS Survey #2 and 27
respondents completed only web Survey #2.
The response rates for the SMS follow-up surveys were lower
than the response rates for the web follow-up surveys, but
response rates for both are comparable to those obtained in
other follow-up studies on similar topics but conducted by
telephone.
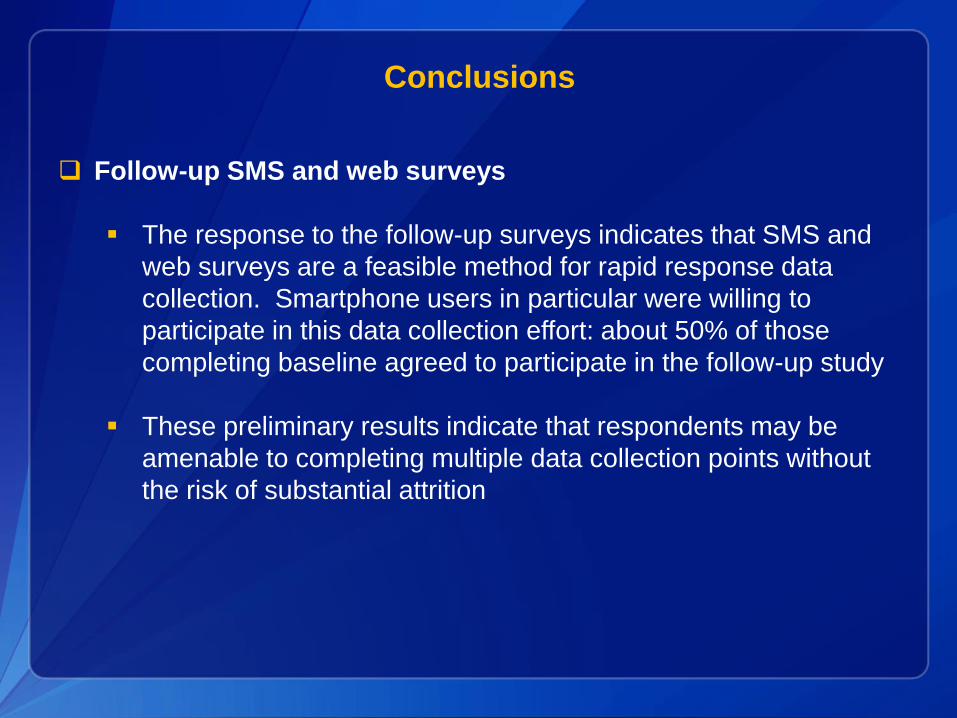
Conclusions
Follow-up SMS and web surveys
The response to the follow-up surveys indicates that SMS and
web surveys are a feasible method for rapid response data
collection. Smartphone users in particular were willing to
participate in this data collection effort: about 50% of those
completing baseline agreed to participate in the follow-up study
These preliminary results indicate that respondents may be
amenable to completing multiple data collection points without
the risk of substantial attrition
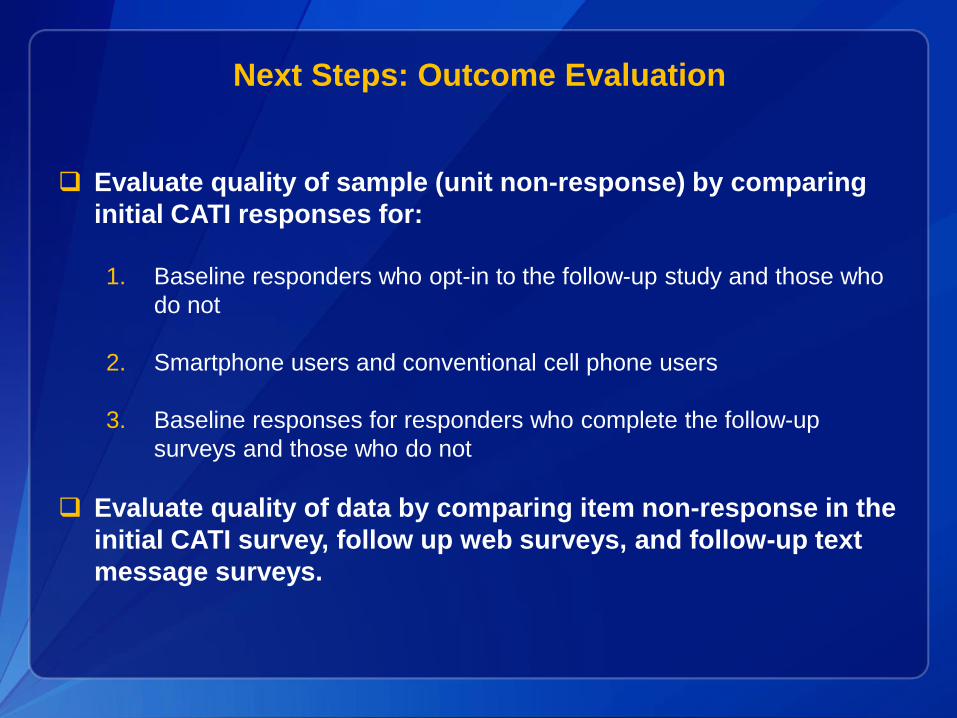
Next Steps: Outcome Evaluation
Evaluate quality of sample (unit non-response) by comparing
initial CATI responses for:
1. Baseline responders who opt-in to the follow-up study and those who
do not
2. Smartphone users and conventional cell phone users
3. Baseline responses for responders who complete the follow-up
surveys and those who do not
Evaluate quality of data by comparing item non-response in the
initial CATI survey, follow up web surveys, and follow-up text
message surveys.
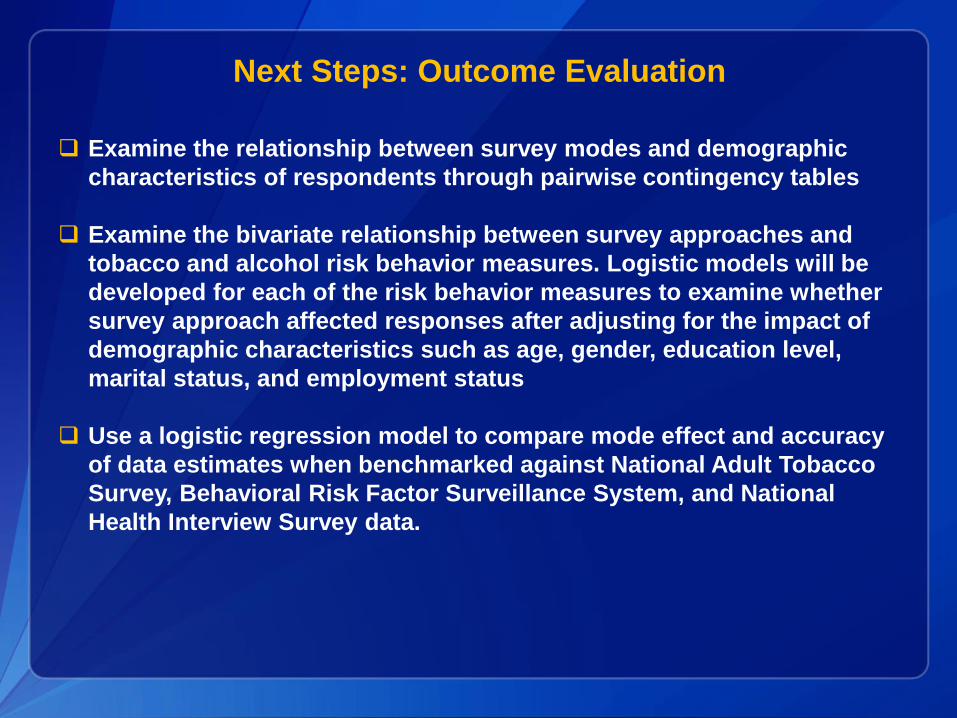
Next Steps: Outcome Evaluation
Examine the relationship between survey modes and demographic
characteristics of respondents through pairwise contingency tables
Examine the bivariate relationship between survey approaches and
tobacco and alcohol risk behavior measures. Logistic models will be
developed for each of the risk behavior measures to examine whether
survey approach affected responses after adjusting for the impact of
demographic characteristics such as age, gender, education level,
marital status, and employment status
Use a logistic regression model to compare mode effect and accuracy
of data estimates when benchmarked against National Adult Tobacco
Survey, Behavioral Risk Factor Surveillance System, and National
Health Interview Survey data.
Thank you!
For more information please contact:
Sean Hu, MD, MS, DrPH
Centers for Disease Control and Prevention
Office on Smoking and Health (OSH)
(770)488-5845; [email protected]
James Dayton, MBA
(802)264-3723; [email protected]
Naomi Freedner-Maguire, MPH
Piper DuBray
ICF International
The findings and conclusions in this report are those of the authors and do not necessarily represent the official position of
the Centers for Disease Control and Prevention and ICF International.
National Center for Chronic Disease Prevention and Health Promotion
Office on Smoking and Health