using social media to improve foodborne illness reporting... · using social media to improve...
TRANSCRIPT

Using Social Media to Improve Foodborne Illness Reporting
Jenine K. Harris Washington University in St. Louis

Many people get sick, but few report it…
• Every year… – 1 in 4 Americans get sick – 128,000 are hospitalized – 3,000 die of foodborne diseases – Costs approximately $2-$4 Billion annually in the US
2.9% of people who get sick seek medical care and few report their illness
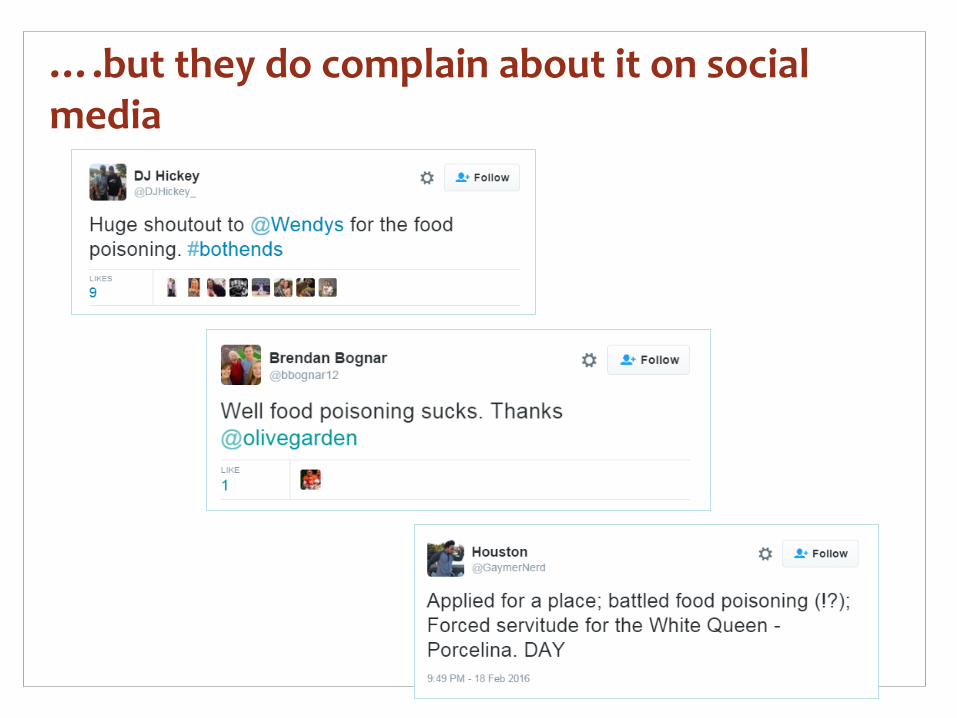
….but they do complain about it on social media

http://www.pewinternet.org/2015/10/08/social-networking-usage-2005-2015/
Social media use in the US

68% 62%
Women MenSex
54% 70% 76%
HS or less Somecollege
College+
Education
90% 77%
51% 35%
18-29 30-49 50-64 65+Age
56% 69% 72% 78%
<$30k/yr
$30k -$49.9k
$50k -$74.9k
$75k+
Income
65% 56%
65%
Whitenon-Hisp
Blacknon-Hisp
Hispanic
Race/Ethnicity
64% 68% 58%
Urban Suburban RuralUrbanicity
US social media users by the numbers
http://www.pewinternet.org/2015/10/08/social-networking-usage-2005-2015/

How can we tap into social media to improve surveillance and reporting?
Chicagoan tweets about possible foodborne illness
Twitter tool captures the tweets and sends to health
department
Health department replies to the tweet with a message
and form to report the foodborne illness

Identify and reply to tweets

Foodborne Chicago first 10 months
• 2,241 Tweets identified and classified
• 270 Response tweets
• 193 Reports submitted
• 179 Food establishments identified
• 133 Inspections
• 21 (15.8%) failed inspection

Taking the show on the road

Label Definition Example Tweets
Relevant Tweet about a possible current case of foodborne illness
• I’m straight hella sick with food poisoning • Well, things didn’t go my way this weekend in St. Louis. I got some
bad food poisoning and couldn’t… https://t.co/dmYeuyfG9R
Unclear Unable to distinguish whether tweet is relevant or not relevant
• Woohoo possible food poisoning • BREAKING: Food Poisoning SUCKS • Chipotle will close restaurants briefly on Feb.8 to address food safety
issues: Successive food poisonings… https://t.co/ZbbTgTh77Zm
Not Relevant Not about a possible current case of foodborne illness
• Hope I don’t get food poisoning from Ikea. • Food poisoning makes you terrified to eat any food ever again • 48 Million People Get Ill from Food Poisoning Says Chef Remi
https://t.co/Sj7hepmmwF#pr
Classifying tweets in the Dashboard

Responding to relevant tweets

Reporting form linked in each response tweet

In the first seven months of Dashboard use
• 442 tweets captured by Dashboard • 193 relevant and received a reply • 13 reports filed • 5 in jurisdiction • 31 reports filed
via other mechanisms

Inspection results for Food Safety STL Dashboard vs. other reporting mechanisms
0%
10%
20%
30%
40%
50%
No violations Non-critical CriticalDashboard Other sources
No significant difference in proportions (p=.60).

Strengths of the Dashboard
• Encourages interaction with residents on foodborne illness
• Increases transparency and trust of health department
• Increases public knowledge of reporting processes

Strengths of the implementation process
• Health department employees involved in implementation reported that the Dashboard…
– was easy to implement – fit in seamlessly with existing systems – allowed the health department to connect with segments of the population
not reached in other ways
“Honestly, I think its goal is really big, but honestly, you guys have narrowed it down to a pretty simple procedure. This is even easier than if they call and then I have to go through the interview process. This is easier than what we normally do. So as far as intricacy goes, I think it doesn't have too many steps. It's really pretty streamlined. I really do. And I think for people who are afraid to pick up the phone and call but are willing to text or follow the steps online it makes it easier for them.” - DOH employee

Challenges of the Dashboard
• People like us but they don’t report!
• Reports from out of jurisdiction
• Big Brother is watching (trust issues)

Challenges facing the implementation process
• Health department employees involved in implementation reported that…
– There was a lack of awareness by stakeholders including other government agencies and citizens, this hinders use
– Some stakeholders perceived the Dashboard as a threat to local restaurants
“So there's sort of a perception in the administration that this may target food and beverage providers in the city and that that may create some anxiety on their part and some tension between the public administration and the private citizens and businesses in the city.” - DOH employee
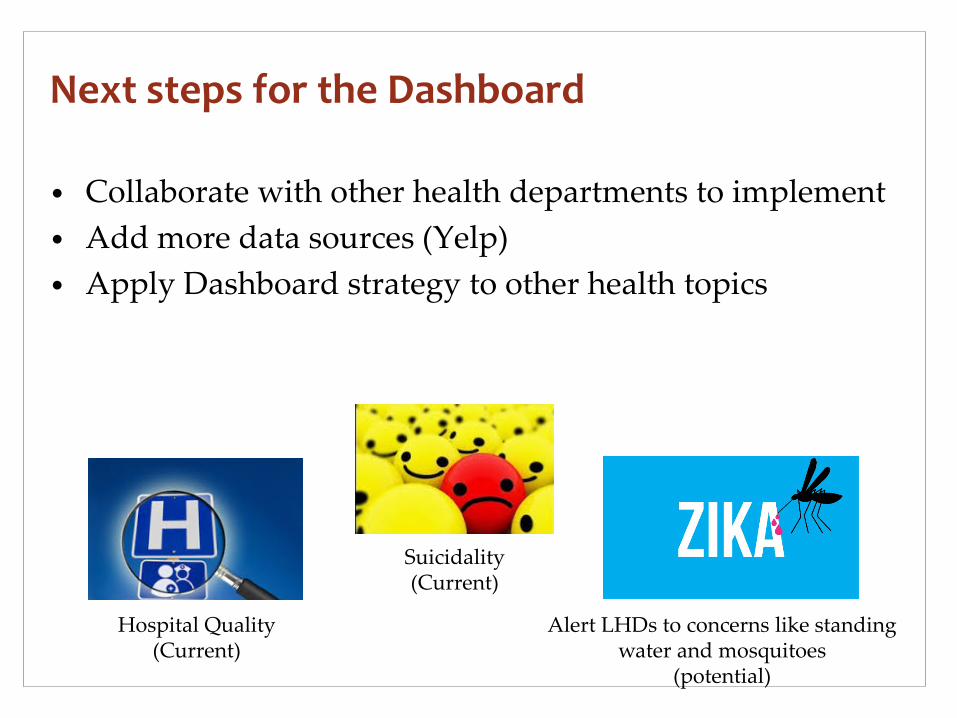
• Collaborate with other health departments to implement • Add more data sources (Yelp) • Apply Dashboard strategy to other health topics
Hospital Quality (Current)
Suicidality (Current)
Alert LHDs to concerns like standing water and mosquitoes
(potential)
Next steps for the Dashboard
