using splunk ml to optimize t-mobile 5g for better throughput
TRANSCRIPT

© 2 0 2 0 S P L U N K I N C .
© 2 0 2 0 S P L U N K I N C .
Using Splunk MLto OptimizeT-Mobile 5G for Better Throughput
Nirmal ChandrasekaranSenior Engineer | T-Mobile USA
Vijay VeggalamMember of Technical Staff | T-Mobile USA

During the course of this presentation, we may make forward‐looking statements regarding future events or plans of the company. We caution you that such statements reflect our current expectations and estimates based on factors currently known to us and that actual events or results may differ materially. The forward-looking statements made in the this presentation are being made as of the time and date of its live presentation. If reviewed after its live presentation, it may not contain current or accurate information. We do not assume any obligation to update any forward‐looking statements made herein.
In addition, any information about our roadmap outlines our general product direction and is subject to change at any time without notice. It is for informational purposes only, and shall not be incorporated into any contract or other commitment. Splunk undertakes no obligation either to develop the features or functionalities described or to include any such feature or functionality in a future release.
Splunk, Splunk>, Data-to-Everything, D2E and Turn Data Into Doing are trademarks and registered trademarks of Splunk Inc. in the United States and other countries. All other brand names, product names or trademarks belong to their respective owners. © 2020 Splunk Inc. All rights reserved
Forward-LookingStatements

© 2 0 2 0 S P L U N K I N C .
Member of Technical Staff | T-Mobile USA
Vijay VeggalamSenior Engineer | T-Mobile USA
Nirmal Chandrasekaran

© 2 0 2 0 S P L U N K I N C .
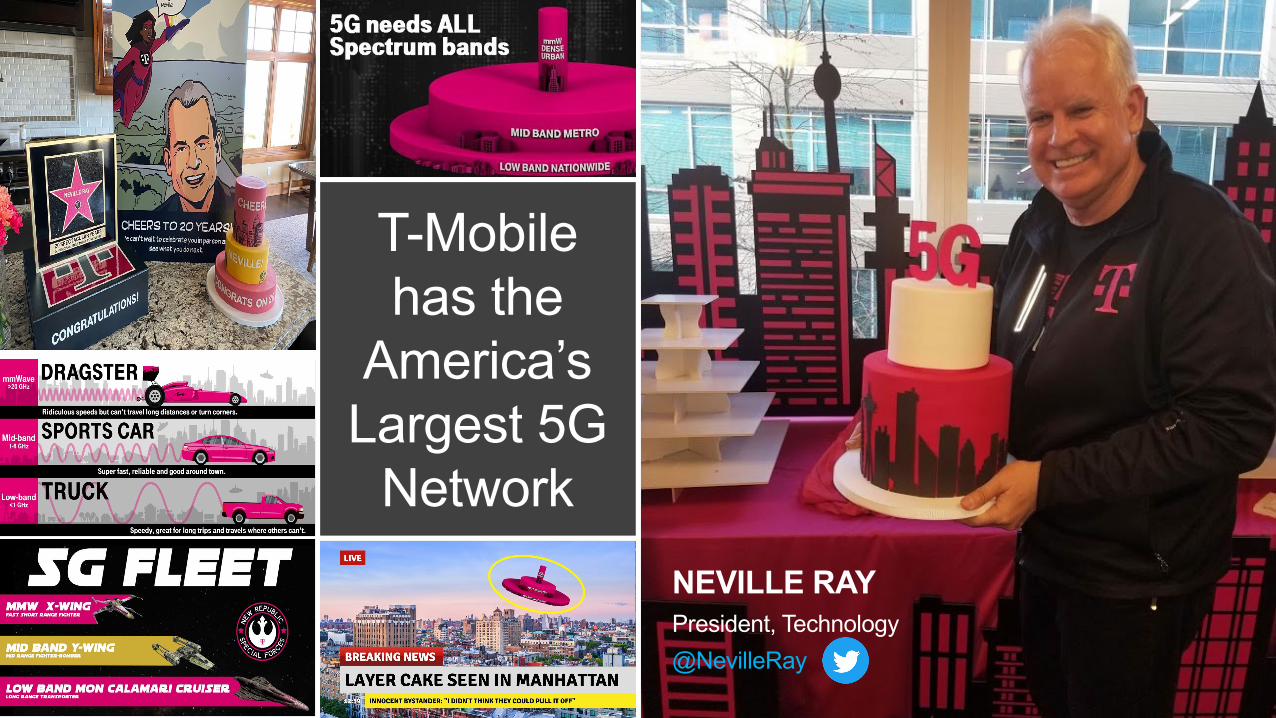
T-Mobile has the
America’s Largest 5G
Network

© 2 0 2 0 S P L U N K I N C .
T-Mobile has the
America’s Largest 5G
Network

© 2 0 2 0 S P L U N K I N C .
T-Mobile has the
America’s Largest 5G
NetworkNEVILLE RAYPresident, Technology@NevilleRay

© 2 0 2 0 S P L U N K I N C .
T-Mobile has the
America’s Largest 5G
NetworkNEVILLE RAYPresident, Technology@NevilleRay

© 2 0 2 0 S P L U N K I N C .
T-Mobile has the
America’s Largest 5G
NetworkNEVILLE RAYPresident, Technology@NevilleRay

© 2 0 2 0 S P L U N K I N C .
T-Mobile has the
America’s Largest 5G
NetworkNEVILLE RAYPresident, Technology@NevilleRay
© 2 0 2 0 S P L U N K I N C .
T-Mobile has the
America’s Largest 5G
NetworkNEVILLE RAYPresident, Technology@NevilleRay

© 2 0 2 0 S P L U N K I N C .
Agenda 1) Spectrum BandsBusiness Challenges in Subscriber ManagementComplexity for Radio Frequency Engineers
2) Solution OverviewData Analysis TechniquesMachine Learning Algorithms
3) Benefits and Lessons LearnedSuccess in NY TrialChallenges Addressed

© 2 0 2 0 S P L U N K I N C .
1) Spectrum BandsWhat are Bands or Layers? How to overcome challenges and complexities for happy subscribers

© 2 0 2 0 S P L U N K I N C .
Efficient Use of Layers for Happy Subscribers

© 2 0 2 0 S P L U N K I N C .
How do Subscribers Experience Our Network?
Coverage• Customer perceives as ‘bars’ on device
Capacity• Customer perceives as ‘Speed’ on device
5G/LTE in Midband
5G/LTE in LowBand
Low Capacity, Great Coverage
Great Capacity, Smaller Coverage
© 2 0 2 0 S P L U N K I N C .
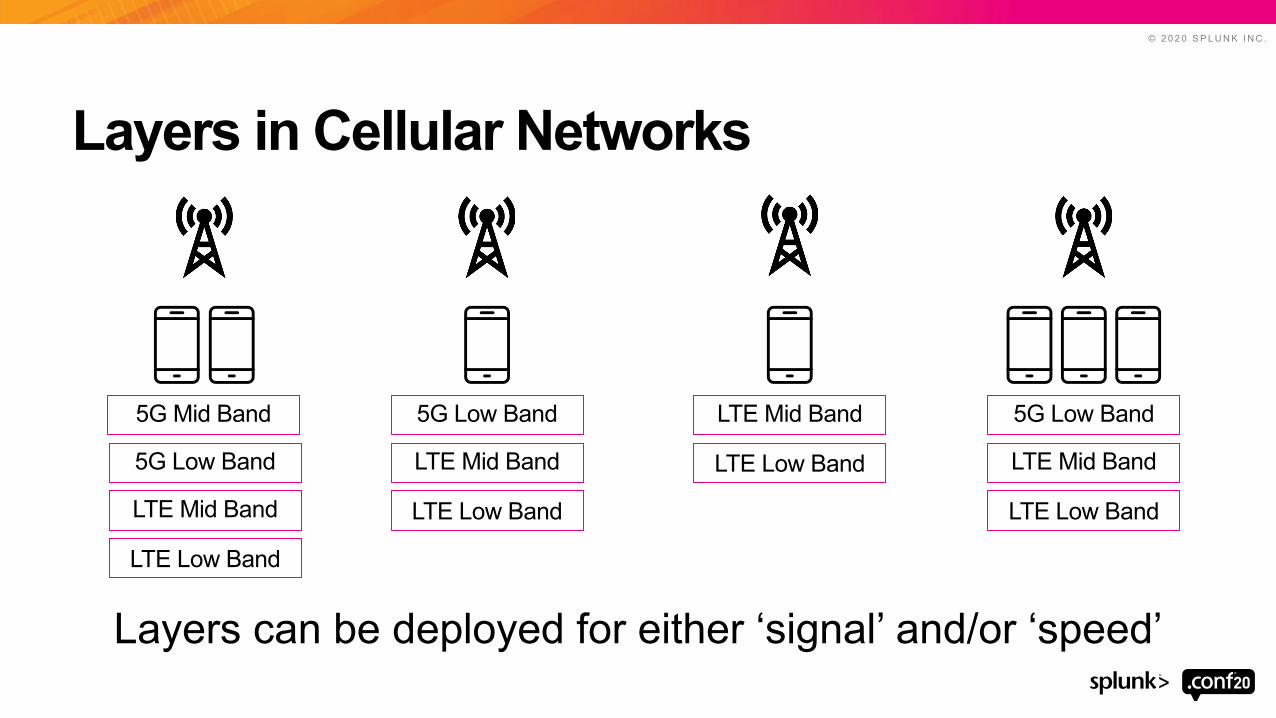
Layers in Cellular Networks
Layers can be deployed for either ‘signal’ and/or ‘speed’
5G Mid Band
5G Low Band
LTE Mid Band
LTE Low Band
5G Low Band
LTE Mid Band
LTE Low Band
LTE Mid Band
LTE Low Band
5G Low Band
LTE Mid Band
LTE Low Band

© 2 0 2 0 S P L U N K I N C .
Role of RF Engineers
Analyze Tune Repeat
Data from 1000s of cell towers in network
100s of Configurable Network Parameters
Multiple iterations to reach optimal performance

© 2 0 2 0 S P L U N K I N C .
Challenges in Managing Cellular Networks
Network ComplexityInterworking of multiple layers
Data Nuggets Huge dataset
Time Consuming Manual process & tuning

© 2 0 2 0 S P L U N K I N C .
2) Solution JourneyOverview of Data Analysis Techniques, Visualization and ML Capabilities

© 2 0 2 0 S P L U N K I N C .
Solution Journey
Feasibility Assessment
• Enable Data Analysis- Visualization
• Identify Features- SME Validation

© 2 0 2 0 S P L U N K I N C .
Solution Journey
Machine Learning
Feasibility Assessment
• Enable Data Analysis- Visualization
• Identify Features- SME Validation
• Anomaly Detection- Actionable Insights
• Clustering- Tune CM parameters

© 2 0 2 0 S P L U N K I N C .
Solution Journey
Validation & Testing
Machine Learning
Feasibility Assessment
• Enable Data Analysis- Visualization
• Identify Features- SME Validation
• Anomaly Detection- Actionable Insights
• Clustering- Tune CM parameters
• Validation- Iterative Feedback
• Trial- New York City

© 2 0 2 0 S P L U N K I N C .
Data Analysis | Visualization CapabilitiesEasier Analysis
• Gather relevant data (Performance and Configuration Management data) into Splunk

© 2 0 2 0 S P L U N K I N C .
Data Analysis | Visualization CapabilitiesEasier Analysis
• Gather relevant data (Performance and Configuration Management data) into Splunk
Leverage Charts• Parallel Coordinates for
impact analysis and finding tunable Configuration Management features

© 2 0 2 0 S P L U N K I N C .
Machine Learning Algorithms
Preprocessing for Accuracy
Anomaly Detection
• Feature Transformation• Standard scaling
• Density Function• Persistent Trends
Clustering Using Features
• Cluster similar sectors• Improved Accuracy

© 2 0 2 0 S P L U N K I N C .
3) Benefits & LessonsTrial Results, Benefits and Lessons Learned

© 2 0 2 0 S P L U N K I N C .
Benefits of ML Based Layer Tuning
Happier SubscribersGranular data-based tuning result
in Speed improvements
Engineer EfficiencyAutomated platform yields time savings for Engineers
Network EfficiencyUtilize spectrum and
network resources better

© 2 0 2 0 S P L U N K I N C .
Changes made on real cell site based on Anomaly
Detected yielded over 80% improvement in Data
speeds in a busy NYC area
Success ScenarioReal life example of Network Improvement with Splunk MLTK
Improved SubscriberExperience

© 2 0 2 0 S P L U N K I N C .
Automated Reports vs. Manual TuningReal life example of time-savings with Splunk MLTK platform
30 MinutesData Collection
Generate InsightsAnomaly Detection
Verification of Anomaly
<5 MinutesSetup Daily Report
Generate ReportVisualize ML Results

© 2 0 2 0 S P L U N K I N C .
Challenges Faced | Operational Issues
Anomalies• Avoid noise
- Persistent trends• Time to Validate
- Drilldown
Configuration• Reduce Number of
Models
Sizing• Memory Limits
- Algorithm- Splunk Instance

© 2 0 2 0 S P L U N K I N C .
Actionable Anomalies | Key to Solution Accuracy

© 2 0 2 0 S P L U N K I N C .
Easier Validation | Drilldown and Reduce Time to Validate

© 2 0 2 0 S P L U N K I N C .
DensityFunction | Persistent Downward Trends| mvexpand BoundaryRanges | rex field=BoundaryRanges"(?<lower_bound>.+):(?<upper_bound>.+):(?<pct_of_boundary_region>.+)"| eval BoundaryRangeType=case(lower_bound=="-Infinity","lower",upper_bound=="Infinity","upper",isnum(lower_bound) AND isnum(upper_bound),"middle")| eval OutlierInBoundaryRange=case(BoundaryRangeType=="lower" ANDparameter2 < upper_bound, 1, BoundaryRangeType=="upper" AND parameter2 > lower_bound, 1, parameter2 > lower_bound AND parameter2 < upper_bound, 1,1=1, 0)| where OutlierInBoundaryRange>0 AND BoundaryRangeType="lower"… | streamstats count time_window=3d by object | where _time >= relative_time(now(),"-2d@d") AND count>0

© 2 0 2 0 S P L U N K I N C .
DensityFunction | Reduce Number of Models| table _time, object, parameter1, parameter2| eval metric_names=mvappend(" parameter1 "," parameter2 "), metric_values=mvappend(parameter1, parameter2), name_value=mvzip(metric_names,metric_values,";")| fields _time object name_value| mvexpand name_value| rex field=name_value "(?<metric_name>[^;]+);(?<metric_value>.+)"| fields - name_value| fit DensityFunction metric_value by “object,metric_name" threshold=0.02

© 2 0 2 0 S P L U N K I N C .
Key Takeaways
Pursue Incremental Data Analysis via Visualization
Actionable Anomalies are Key to Solution Accuracy
Cross-functional team collaboration is vital for success
1
2
3

SESSION SURVEYPlease provide feedback via the
© 2 0 2 0 S P L U N K I N C .