using survey banking data to measure financial wellbeing
TRANSCRIPT

Toward better outcomes for Australians… every day, rainy day, one day
Improving the Financial Wellbeing of Australians
April 2019

2
Matt Comyn,CEO, Commonwealth Bank of Australia
Our purpose at Commonwealth Bank is to “improve the financial wellbeing of our customers and communities”.
To understand how we can improve financial wellbeing, we are listening to our customers to understand what is important to them, as well as working with community groups, experts in economic and social studies, and policy makers to better understand Australia’s most pressing financial challenges.
A vital step to achieving our purpose is also defining and measuring financial wellbeing so that we can work to improve it in meaningful ways.
To do this, we have worked with the Melbourne Institute (MI): Applied Economic & Social Research to create two ground-breaking measures of financial wellbeing:
• The CBA-MI Reported Financial Wellbeing Scale (version 1) is formed from people’s responses to 10 questions about their perceptions and experiences of their own financial wellbeing; and
• The CBA-MI Observed Financial Wellbeing Scale (version 2) is formed from five measures that come from customers’ financial records.
The Scales provide comprehensive yet simple measures of financial wellbeing outcomes that can be used by Australians to better understand their own financial
wellbeing. The Scales are also available to others, such as institutions, policy makers, academics and community organisations, to help build a body of knowledge that can be shared and replicated, both in Australia and internationally.
The following report is an easy-to-read summary of some of the Scales research findings. As well as suggesting a comprehensive definition and way to measure financial wellbeing, the report shares insights gained using these new measures.
We will continue to refine and build on this research in the years ahead to help us pursue our purpose through practical actions that make a real difference to those we serve.
In sharing this research, we invite others to do the same.

Improving Financial Wellbeing of Australians
Professor David C. Ribar,Director of the Economic and Social Disadvantage Research Program at the Melbourne Institute: Applied Economic & Social Research, University of Melbourne
The research team at the Melbourne Institute: Applied Economic & Social Research is pleased to deliver this important report on Australians’ financial wellbeing. The Melbourne Institute has been actively collaborating with the Commonwealth Bank to develop and analyse Scales of financial wellbeing.
The first stage in our collaboration was to develop the Scales themselves. We are proud to have developed the CBA-MI Reported and Observed Financial Wellbeing Scales – two innovative first-of-their-kind measures that not only draw on self-reports of people’s financial experiences but also draw on bank-record indicators of their outcomes. We are equally proud of the careful conceptualisation and rigorous analyses that underpin the Scales and establish that they work in the Australian context.
As excited as we were to create the Scales, we are even more excited by this second stage in the collaboration in which we improved the Observed Financial Wellbeing Scale (v2). The revised scale has twice as many outcomes than the first version, is more reliable, and differentiates finely across all levels of financial wellbeing. We use the new Scale to investigate Australians’ financial wellbeing and to examine the characteristics that are associated with high and low financial wellbeing. The insights
from these analyses add to our understanding of financial wellbeing.
For more than 50 years, the Melbourne Institute has conducted path-breaking applied and engaged research on the economic lives of Australians. During that time, it has pioneered the development of many widely-used measures of wellbeing. We are confident that the CBA-MI Reported and Observed Financial Wellbeing Scales will take their place alongside these other measures and be valuable tools for policymakers, financial institutions, service providers, researchers, and the public for many years to come.
We look forward to continuing the collaboration with the Commonwealth Bank to measure, understand, and improve Australians’ financial wellbeing.
3

4
5
Improving Financial Wellbeing of Australians
ContentsIntroduction: about this report and why it is needed 6
In search of a common definition and metric 6
Transparent methodology and verifiable values 6
A new approach to better capture the dimensions and complexity of financial wellbeing 7
Some key findings: understanding financial wellbeing in Australia 8
Reported Scale and Observed Scale findings 8
Surprising insights 11
The CBA-MI Financial Wellbeing Scales 12
What is financial wellbeing? 12
Our approach 12
The CBA-MI definition of financial wellbeing 13
How Australians are faring financially: every day, rainy day, one day 14
Distribution of customers’ Reported and Observed financial wellbeing outcomes 14
Every day 16
Rainy day 16
One day 16
Characteristics, conditions and behaviour: what makes financial wellbeing? 18
The CBA-MI conceptual model of determinants of financial wellbeing 18
Characteristics associated with financial wellbeing 20
Perception vs reality 22
Where now? A universal foundation for wellbeing 24
Creation of a new financial wellbeing assessment tool 24
Where to find out more 24
Appendix: characteristics associated with financial wellbeing scores 26
Financial behaviours 26
Household characteristics 29
External circumstances 35

6
For a long time, in Australia and elsewhere, achieving a common understanding of the dimensions and measures of financial wellbeing has been problematic. Despite the huge body of research on its various aspects, no definition or metric has been consistently adopted.
Much of the difficulty stems from the complex and multi-faceted nature of financial wellbeing. Financial wellbeing involves outcomes with a time dimension, including outcomes that occur now, in the future, and under uncertainty. It also involves many motivations, including responsibility, enjoyment, control, and security. Financial wellbeing also depends on context
and the types of social support that people can draw on.
In search of a common definition and metricUse of many different definitions and research methodologies has given rise to an equally varied range of findings – even about the same groups. Such differences have meant that no two sets of findings are truly comparable. This has limited our ability to gain a true understanding of where different groups might stand relative to each other; or whether, when and by how much the financial wellbeing of groups or individuals is changing.
Most research has also relied solely on self-reported data, without including objectively observed measures, another inherently limiting feature.
Transparent methodology and verifiable valuesWhen you consider these variables, it’s not surprising that there are also inconsistencies in the way much financial wellbeing research is reported or ‘scored’.
In the absence of a consistently agreed, universally applicable benchmark, measures of convenience and public digestibility are often favoured over those linked
About this report and why it is needed

7
Improving Financial Wellbeing of Australians
to careful, holistic definitions of financial wellbeing. Further, there is often little or no transparency about how various scores or values are arrived at, so they are difficult to test or replicate.
Opaque scoring and variations in how financial wellbeing is reported not only make it difficult to compare different studies. It can also throw the accuracy, applicability and practical utility of some research into question, with potentially serious implications. For example, it may
discourage consumers, government, financial institutions or other groups from targeting areas most likely to make a difference to financial wellbeing – or encourage them to focus on areas that are not.
A new approach to better capture the dimensions and complexity of financial wellbeingThe findings summarised in this report are based on a new approach that we believe overcomes the
problems associated with past research. Underpinning it is our own definition and our own research methodology.
Both are described at length, along with a full breakdown of our findings, in the descriptive report linked in the ‘Where to find out more?’ section below.

8
Some key findings: understanding financial wellbeing in Australia
The scores from the CBA-MI Reported and Observed Financial Wellbeing Scales (‘Scales’) have been developed to measure the relative extent of someone’s financial wellbeing – they indicate higher or lower positions along a distribution. The scores do not identify specific, absolute ‘good’ or ‘bad’ conditions.
This report uses these two Scales to quantitatively analyse how financial wellbeing differs among Australians.
We apply descriptive categories to the scores of the Reported and Observed Financial Wellbeing Scale and found that:
Reported Scale
• 9 per cent of customers were ‘having trouble’ (scores of 22.5 or below, which implied that they experienced the worst possible outcome for one or more reported financial wellbeing conditions),
• 31 per cent were ‘just coping’ (scores of 25-47.5, which implied they experienced a negative outcome for one or more reported conditions),
• 48 per cent were ‘getting by’ (scores of 50-75, which implied the averages of their reported outcomes were in neutral or second-highest categories), and
• 12 per cent were ‘doing great’ (scores of 77.5 or higher, which implied they experienced the best possible outcome for one or more reported conditions).
Observed Scale
• 18.4 per cent of customers were ‘having trouble’ (scores of 26.3 or below, which implied that they had frequent dishonours, held payday loans, had frequent low balances, or could seldom raise a month’s expenses);
• 31.3 per cent were ‘just coping’ (scores of 31.6-52.6 meaning they experienced a negative outcome for one or more conditions);
• 35.1 per cent were ‘getting by’ (scores of 57.9-78.9 implying the averages of people’s outcomes were in the neutral or second-highest categories);
• 15.2 per cent were ‘doing great’ (scores of 84.2 or higher, which implied they experienced the best possible outcome for one or more observed conditions).

9
Improving Financial Wellbeing of Australians
Improving Financial Wellbeing of Australians
The Observed Financial Wellbeing Scale median score is 57.9. The distribution is slightly skewed towards higher values.
The Reported Financial Wellbeing Scale median score is 55. The distribution is skewed towards higher scale values, meaning that customers were somewhat more likely to report experiencing or perceiving good outcomes for a given condition than bad outcomes.
Reported Financial Wellbeing Scale Observed Financial Wellbeing Scale
Having trouble
9%
31%
48%
12%
0-22.5 25-47.5 50-75 77.5-100
Just coping Doing okay Doing great
18%
31% 35%
15%
0-26.5 31-53 57-79
Having trouble Doing okay Doing greatJust coping
10
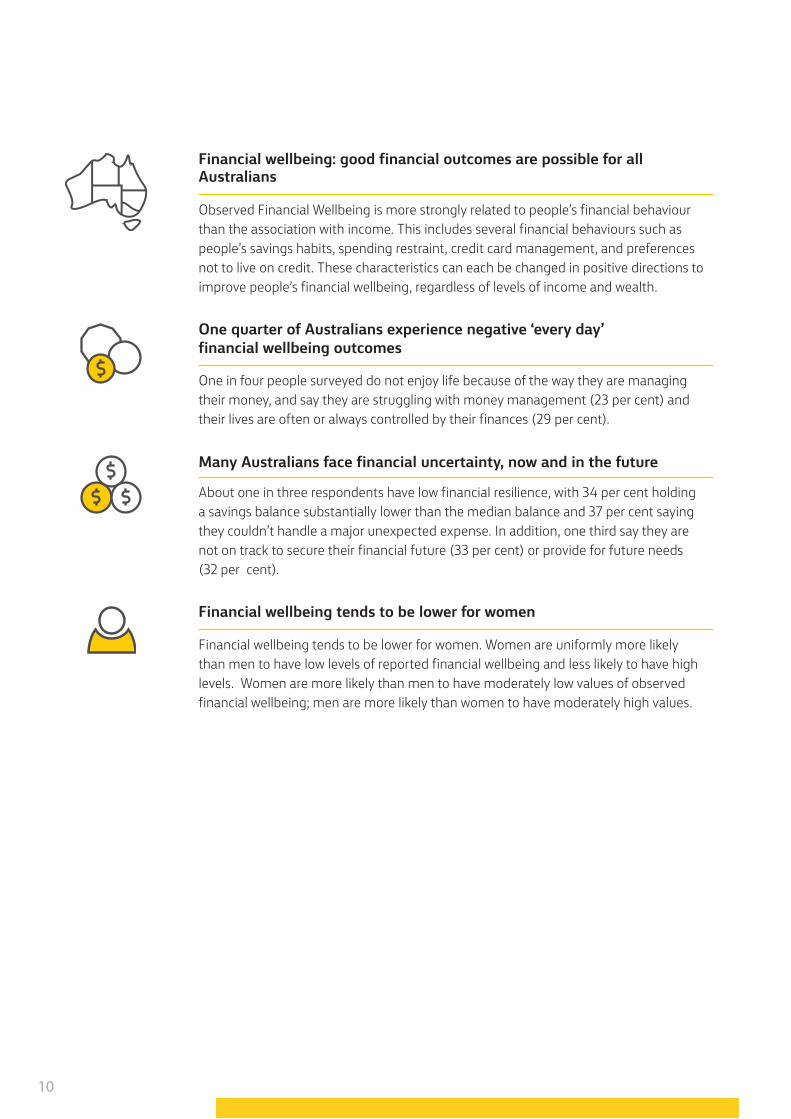
One quarter of Australians experience negative ‘every day’ financial wellbeing outcomes
One in four people surveyed do not enjoy life because of the way they are managing their money, and say they are struggling with money management (23 per cent) and their lives are often or always controlled by their finances (29 per cent).
Financial wellbeing: good financial outcomes are possible for all Australians
Observed Financial Wellbeing is more strongly related to people’s financial behaviour than the association with income. This includes several financial behaviours such as people’s savings habits, spending restraint, credit card management, and preferences not to live on credit. These characteristics can each be changed in positive directions to improve people’s financial wellbeing, regardless of levels of income and wealth.
Financial wellbeing tends to be lower for women
Financial wellbeing tends to be lower for women. Women are uniformly more likely than men to have low levels of reported financial wellbeing and less likely to have high levels. Women are more likely than men to have moderately low values of observed financial wellbeing; men are more likely than women to have moderately high values.
Many Australians face financial uncertainty, now and in the future
About one in three respondents have low financial resilience, with 34 per cent holding a savings balance substantially lower than the median balance and 37 per cent saying they couldn’t handle a major unexpected expense. In addition, one third say they are not on track to secure their financial future (33 per cent) or provide for future needs (32 per cent).

11
Improving Financial Wellbeing of Australians
Improving Financial Wellbeing of Australians
Actions can speak louder than income and assetsUnsurprisingly, financial wellbeing increases with income. But how people behave with their finances has an even stronger effect on their financial wellbeing than how much they earn. For example, there is a much higher gap in financial wellbeing between people who have disciplined saving and spending habits and those who don’t than between those who earn less than $20,000 and those who earn more than $100,000 a year.
Budgeting: just think itHaving a budget can help people better manage their finances. Does that mean hauling out the spreadsheets? Not necessarily. Our findings show that it doesn’t matter if the budget is a ‘mental’ one or a ‘formal’ one: either type is equally associated with higher Reported financial wellbeing. Just find a budget that works for you!
Confused about finances? A good understanding is enough There is a strong association between higher Reported financial wellbeing and an understanding of finances. However, once people reach a ‘good’ rather than ‘very good’ level of understanding, Reported wellbeing levels out. Encouragingly, this suggests that a firm grasp of the basics rather than highly specialised knowledge is enough to make significant positive difference.
The importance of staying social Social contact has a strong influence on financial wellbeing, with Reported wellbeing in particular rising steadily the more social contact a person had. Further, people who said they would always receive social support in a crisis or considered it very likely had higher wellbeing on both Reported and Observed measures. Conversely, people who were socially isolated had extremely low Reported and low Observed financial wellbeing. Interestingly, people who were ‘uncertain’ whether they would receive social support in a crisis had lower levels of Reported financial wellbeing than those who were certain they wouldn’t.
Surprising insights

12
The CBA-MI Financial Wellbeing Scales are the first of their kind to combine both self-reported financial wellbeing data and objectively observed measures. In so doing, they provide new dimensions of understanding and a model for researchers both locally and globally.
What is financial wellbeing?The definition of financial wellbeing we used in our research (see box) has been adapted and evolved from those of other leading Australian and international researchers and other sources.
Importantly, our study has been tailored for the local context, taking into account the types of unique matters that Australians face such as long-term future outcomes in light of our superannuation and retirement income system. This is a significant factor often overlooked or under-weighted by local studies that take overseas methodologies as their starting point.
Our findings are derived from a methodology that is easily tested and verified, so anyone can accurately assess their own financial wellbeing. The Reported and Observed Financial Wellbeing Scales are formed from people’s answers to ten survey questions (Reported) and from five key measures from their financial records (Observed).
The inclusion of observed measures, based on people’s financial records, accounts and transactions is a
pioneering feature that adds new insights and additional robustness to our findings. It also provides a strong foundation for deeper understanding as we continue to refine our objective measures in future research.
Our approachThe research underpinning the Scales is based on findings drawn from an online survey of 5,682 CBA customers in August 2017, and analysis of financial record data that were linked to the customers’ responses.
The research components for both the Reported and Observed elements of the survey, along with more information about respondents and the methodology used to calculate degrees of financial wellbeing among Australians can be found in the descriptive report linked in the ‘Where to find out more?’ section below.
The two Scales:
• The Reported Financial Wellbeing Scale (version 1) is formed from people’s responses to 10 questions that ask about their perceptions and experiences of financial wellbeing outcomes. Each question has 5 possible responses, with the worst outcomes assigned values of 0 and the best outcomes, values of 4. The score can be calculated by adding the responses to all 10 questions and multiplying the sum by 2.5.
The CBA-MI Financial Wellbeing Scales

13
Improving Financial Wellbeing of Australians
• The Observed Financial Wellbeing Scale (version 2) is formed from five measures that come from customers’ financial records. Each measure, but one, has five possible outcomes, with the worst financial
wellbeing outcomes assigned values of zero and the best outcomes assigned higher values. The score is calculated adding the outcomes to all five items and multiplying the sum by 100/19.
The CBA-MI definition of financial wellbeingWe define people’s financial wellbeing as the extent to which people both perceive and have:
1. Financial outcomes in which they meet their financial obligations;2. Financial freedom to make choices that allow them to enjoy life; 3. Control of their finances; and4. Financial security – now, in the future, and under possible adverse circumstances.
In our definition, financial wellbeing is a state that is best described in degrees or extents, rather than with absolute values or as an ‘either / or’ condition.
Every day, rainy day, one day
Often to simplify communication, we will refer to the financial wellbeing components in colloquial terms as:
• ‘Every day’ financial situations: how well people are meeting their immediate needs, such as mortgage or rent and utilities payments.
• ‘Rainy day’ financial situations: how well prepared people are to deal with unexpected, adverse events such as illness or job loss.
• ‘One day’ financial situations: how well people can achieve long-term goals such as buying an auto-home or a comfortable retirement.

14
How Australians are faring financially: every day, rainy day, one day
Reported Conditions
Distribution of customers’ Reported and Observed financial wellbeing outcomes
2nd Worst Middle 2nd Best Best Worst
I am on track to have enough money to provide for my
financial needs in the future
I am securing my financial future
I have money left over at the end of the month
Ever
y da
y (%
)Ra
iny
day
(%)
One
day
(%)
My finances control my life
Difficulty meeting necessary living expenses
I feel on top of my day to day finances
I can enjoy life because of the way I am managing my money
I am comfortable with my current levels of spending relative
to the funds I have coming in
I could handle a major unexpected expense
Giving a gift would put a strain on my finances for the month
5
5
6
22
17
10
13
10
5
7
10
13
19
7
10
10
7
4
8
4
22
20
18
12
19
19
16
14
17
20
29
42
38
27
30
35
41
26
45
25
33
20
19
32
23
27
23
46
26
44

15
Improving Financial Wellbeing of Australians
Due to rounding, some charts may not add up to 100 per cent.
Observed Conditions
Ability to cover expenses from available cash, savings and credit
Months spending more than 90% of inflows
Age-normed percentile of customer’s median savings
balance over last year
Payment problems (dishonours, declines, overlimits, payday loans,
late fees and arrears)Days in the last year with liquid
balances below one week’s average expenses
34 20
2633
19
3817
17
15
13
12
8
12
37
23 24
0
24
20
19 24 25
8
20
12
2nd Worst Middle 2nd Best Best Worst
Ever
y da
y (%
)Ra
iny
day
(%)
One
day
(%)

16
The Scales show a broadly positive pattern, with some two thirds of people exhibiting neutral to positive financial wellbeing outcomes on either the Reported or Observed Scale.
However, that still leaves up to a third experiencing negative outcomes across some or all of the ‘every day’, ‘rainy day’ and ‘one day’ measures.
Overall, compared to ‘rainy day’ and ‘one day’ financial wellbeing, respondents reported fewer problems with ‘every day’ financial wellbeing, such as being able to meet necessary expenses, having money left over at the end of the month and being able to afford gifts.
These findings are in line with other research showing that on average people achieve ‘every day’ financial wellbeing before they achieve wellbeing on unexpected ‘rainy day’ or future ‘one day’ financial outcomes.
Following on from this, the Scales also show that people who have good ‘rainy day’ and ‘one day’ outcomes generally have higher overall levels of financial wellbeing than those who simply have good ‘every day’ outcomes.
Every day‘One in four are struggling with money management’Close to one in four (23 per cent) of respondents said it was easy; and 13 per cent said it was very easy to meet necessary expenses in the preceding year. Large percentages also reported good outcomes for other ‘every day’ measures: 37 per cent said finances rarely or never controlled their lives and 40 per cent said they often or always had money left over at the end of the month.
But it’s not all plain sailing• Nearly a quarter (23 per cent)
of people reported difficulty meeting necessary expenses in the preceding year.
• About a quarter (24 per cent) indicated that they were not comfortable with their spending.
• One in four (25 per cent) agreed that they did not enjoy life because of the way they were managing their money.
• 29 per cent said that finances often or always controlled their lives.
• 29 per cent said that they never or rarely had money left over at the end of the month.
•
•
•
• About an 8th of customers had liquid balances below one week’s expenses for 75 per cent of the year or more; and a 6th had low balances for 50-75% of the year. 48% had low balances for less than 10% of the year, and half of those always had balances above 4 weeks’ expenses.
Rainy day‘One in three have low resilience’To gauge reported levels of ‘rainy day’ financial wellbeing, the Reported Scale asks whether respondents feel able to handle major unexpected expenses. For Observed wellbeing, we looked at whether a respondent’s bank balances and available credit were sufficient to cover over one month’s expenses.
• 37 per cent said they were not able to handle a major unexpected expense.
• 32 per cent could raise one month’s expenses on less than a quarter of the days of the year.
One day‘One in three are not on track to meet longer term future financial needs’One of the key differences between the Scales and other Australian-focused research is our consideration of ‘one day’, or future long-term, financial wellbeing.

17
Improving Financial Wellbeing of Australians
The quality of financial wellbeing for Australians as they move into retirement has major social, economic and policy implications for our nation. Our research represents a brand new, reliable metric that, over time, can increasingly inform the national discussion on securing long-term future financial wellbeing for all Australians.
The research shows that Australian retirees on average have higher Reported and Observed financial wellbeing than other Australians. However, the next generation of retirees might be at risk. According to the Scales, around a third of Australians are falling short when it comes to their ‘one day’ financial needs, with 33 per cent saying they
are not on track to secure their financial future and 32 per cent saying they are not on track to provide for future needs.

18
Characteristics, conditions and behaviour: what makes financial wellbeing?
Financial Wellbeing Outcomes
Perceiving & having (1) financial outcomes to meet financial obligations, (2) financial freedoms to make choices, (3) control of finances, & (4) financial security now, in the future, & under possible adverse circumstances
The CBA-MI Conceptual Model of the Determinants of Financial Wellbeing Outcomes
Household Characteristics
• Economic & material resources
• Personal capabilities• Household needs• Preferences• Attitudes
External Conditions
• Economic conditions• Access to financial
products/services• Social support &
social capital• Social norms• Public programs &
social insurance
Financial Behaviour
• Financial management• Spending habits• Savings habits• Borrowing habits• Financial discipline• Planning & budgeting

19
Improving Financial Wellbeing of Australians
In our analysis, we assessed a range of such characteristics to help identify which contribute to people’s financial wellbeing, and in what ways.
Specifically, we focused in on:
• Household characteristics, including income, economic and material resources, personal capabilities, personal characteristics, household structure, household needs, preferences and attitudes.
• External conditions, including economic conditions, access to financial products and services, social support, social norms, public programs, and social insurance.
• Financial behaviours, including financial management, spending, saving and borrowing habits, financial discipline, planning and budgeting.
Of the wide range of characteristics included, we found that a number were strongly associated with higher or lower financial wellbeing. Some of the strongest associations are outlined in the following pages.
The results also point to possible areas of intervention to improve people’s financial wellbeing. The report shows that a host of financial behaviours, capabilities, and attitudes have exceptionally strong associations with financial wellbeing, both Reported and Observed.
Behaviours, capabilities, and attitudes can be changed in positive directions.
Knowing that there are such strong associations between financial wellbeing and financial behaviour, capabilities and attitudes suggests that, with the right kind of support, people can be empowered to change their own financial wellbeing for the better.

20
Characteristics associated with financial wellbeing
Financial behaviour
Overall, ‘Financial behaviours’ are the strongest correlates with financial wellbeing outcomes. (refer to Appendix pg. 26)
In particular, spending, saving and borrowing habits, willingness to sacrifice, and plan are most strongly correlated with Reported and Observed financial wellbeing outcomes.
People who budget, either mentally or formally, have higher Reported financial wellbeing outcomes on average than people who don’t budget at all.
External conditions
Social contact and community and government support are strongly associated with financial wellbeing. (refer to Appendix pg. 35)
People who report having a major worsening in financial circumstances, as well as separation, job loss and illness on average have markedly lower financial wellbeing outcomes.
Household characteristics
Overall, ‘Household characteristics’ have medium to strong correlation with financial wellbeing outcomes. (refer to Appendix pg. 29)
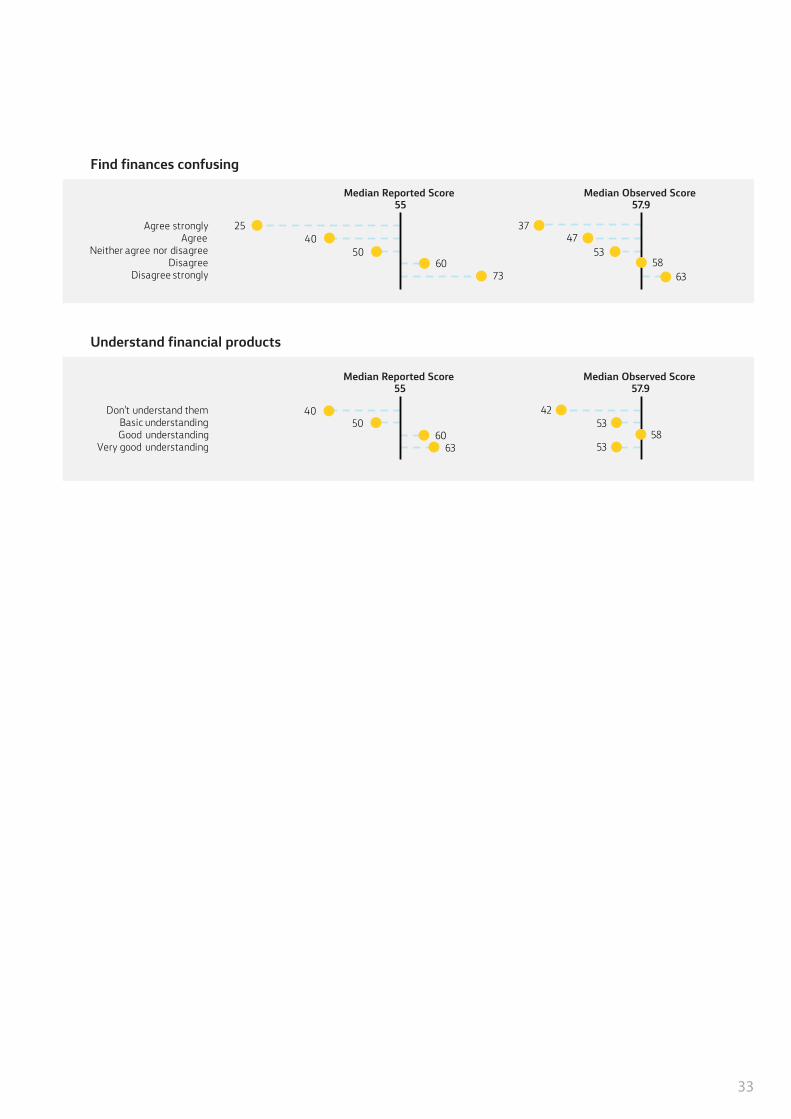
Strong correlates include personal capabilities like general health, mental health, disabilities, understanding of finances and financial products.
Employment, income, and assets and liabilities have medium correlation with Reported and Observed financial wellbeing.
Home owners on average have much higher Reported and Observed financial wellbeing than renters.
Age does not appear to be correlated but on average financial wellbeing outcomes rise between the ages of 50 and 70.
Financial wellbeing on average is higher among people who are partnered than people who live alone.

21
Improving Financial Wellbeing of Australians
22
One of the interesting findings of our research is that although Reported and Observed financial wellbeing are positively related, they are also distinct.
The way people perceive and experience their own financial outcomes can be very different from the way an outsider might observe them based on objective financial data.
Further, our quantitative analysis shows that there is sufficient difference between them to consider them to be separate components of financial wellbeing.
For the majority (approximately 70 per cent of customers), both reported and observed financial scores are closely aligned (within one quintile). 11 per cent of customers though, have scores that do not align (more than two quintiles apart).
Perception vs reality

23
Improving Financial Wellbeing of Australians
6%Top 20%
Observed
Repo
rted
Distribution of combined financial wellbeing
9%
70%
10%
5%
Middle 20%
Middle 20%
Lowest 20%
Lowest 20%
Top 20%
Scores from the two scales that are within one quintile of each other
Reported score is two quintiles below Observed Score
Reported score is more than two quintiles above Observed Score
Reported score is two quintiles above Observed Score
Reported score is more than two quintiles below Observed Score

24
As stated at the outset, the findings summarised in this report represent a promising beginning of just one initiative out of many we are undertaking to help secure and enhance Australians’ financial wellbeing.
Already, our research has added to the evidence base supporting the development of more targeted tools, education programs and other activities to help people move closer to this goal.
Its new methodology and its robust, verifiable nature have also opened up new areas for investigation, which may in turn offer new possibilities for understanding, quantifying, monitoring and improving financial wellbeing.
Further, and perhaps most important of all, the research has the potential to open a wider worldwide conversation about financial wellbeing, and provide a much-needed consistent foundation which other individuals and institutions can use to continue their research for the benefit of all.
Creation of a new financial wellbeing assessment toolAlready, we have launched the CBA Financial Wellbeing Score; an all-new online financial wellbeing assessment tool now available on the CBA website.
The tool enables Australians to assess their own financial wellbeing
using the methodology that underpins the Reported Scales methodology.
Users will then be able to access tailored content and other resources to help them improve in relevant areas.
To try out the tool, head to www.commbank.com.au/digital/fwbscore
Where to find out moreThe full descriptive reports can be found here:
https://fbe.unimelb.edu.au/research/streams/health-and-wellbeing/measuring-financial-wellbeing
Where now? A universal foundation for wellbeing

25
Improving Financial Wellbeing of Australians

26
Spending habits
Appendix: characteristics associated with financial wellbeing scores
Financial behaviour
Good job balancing spending and savings
Median Reported Score 55
Median Observed Score 57.9
Not at allVery li�le
SomewhatVery well
Completely
2840
5065
75
2637
5363
74

27
Improving Financial Wellbeing of Australians
Approach to finances
Saving & borrowing habits
Try to save money regularly
Credit card management
Median Reported Score 55
Median Observed Score 57.9
Not at allVery li�le
SomewhatVery well
Completely
3340
5060
68
3737
5363
68
Median Reported Score 55
Median Observed Score 57.9
Always carry balanceTend to carry balance
Sometimes pay balanceTry to always pay balance
Always pay balance
3848
5053
65
3237
4747
68
Sacrifice now to secure future
Median Reported Score 55
Median Observed Score 57.9
Disagree stronglyDisagree
Neither agree nor disagreeAgree
Agree strongly
3048
5058
65
3747
5358
63
Put off financial decisions
Median Reported Score 55
Median Observed Score 57.9
Disagree stronglyDisagree
Neither agree nor disagreeAgree
Agree strongly
7060
5345
38
6358
5353
47

28
Regularly review finances
Median Reported Score 55
Median Observed Score 57.9
Disagree stronglyDisagree
Neither agree nor disagreeAgree
Agree strongly
3548
5060
68
475353
5858
Financial forward-planning
Median Reported Score 55
Median Observed Score 57.9
Focused on todayStarting to plan
Actively planning
4053
68
4253
63
Approach to budgeting
Median Reported Score 55
Median Observed Score 57.9
None at allSpend what I can
Mental budgetFormal budget
4350
5858
4753
5853
Planning and budgeting
Organised with everyday spending
Median Reported Score 55
Median Observed Score 57.9
Not at allVery li�le
SomewhatVery well
Completely
3043
5363
73
2642
5363
68

29
Improving Financial Wellbeing of Australians
Household characteristics
Personal characteristics
Gender
Median Reported Score 55
Median Observed Score 57.9
WomenMen
5358
5358
Median Reported Score 55
Median Observed Score 57.9
18 to 2425 to 3940 to 4950 to 64
65 or more
5354
5355
65
5853
4753
68
Age
Median Reported Score 55
Median Observed Score 57.9
Australian Capital TerritoryNew South WalesNorthern Territory
QueenslandSouth Australia
TasmaniaVictoria
Western Australia
58
5853
55
55
535555
5858
5047
5853
5853
Lives in metropolitan area
State/Territory
Median Reported Score 55
Median Observed Score 57.9
NoYes
5355
5358

30
Household structure
Income and work status
Total income
Median Reported Score 55
Median Observed Score 57.9
Less than $20,000$20,000 to $49,999$50,000 to $99,999
$100,000 or more
4048
5363
475353
58
Income type
Marital status
Median Reported Score 55
Median Observed Score 57.9
SingleSeparated
DivorcedWidowed
Living with a partnerMarried
5345
4860
5360
5837
5358
5358
Work status
Median Reported Score 55
Median Observed Score 57.9
Full-time workPart-time work
Home dutiesSemi-retired
RetiredStudent
Unemployed
5850
486868
4935
5853
4263
6858
42
Median Reported Score 55
Median Observed Score 57.9
No incomeNon-wage income
Wage, variableWage, consistent
Pension, fixedWage, fixed
Own business
5153
4855
5858
68
5558
5353
5858
63
Median Reported Score 55
Median Observed Score 57.9
SingleSeparated
DivorcedWidowed
Living with a partnerMarried
5345
4860
5360
5837
5358
5358
Median Reported Score 55
Median Observed Score 57.9
Less than $20,000$20,000 to $49,999$50,000 to $99,999
$100,000 or more
4048
5363
475353
58

31
Improving Financial Wellbeing of Australians
Assets and liabilities
Home ownership
Median Reported Score 55
Median Observed Score 57.9
RenterHome owner with mortgage
Home owner without mortgageOther
4858
7054
4753
6863
Total credit card or personal loans
Median Reported Score 55
Median Observed Score 57.9
Less than $1,000$1,000 to $19,999
$20,000 to $49,999$50,000 to $99,999
$300,000 or more$100,000 to $299,999
6055
4845
6353
4242
2861
6368
Total bank deposits
Median Reported Score 55
Median Observed Score 57.9
Less than $1,000$1,000 to $19,999
$20,000 to $49,999$50,000 to $99,999
$100,000 to $299,999$300,000 or more
4055
6570
7373
3258
798484
74
Total superannuation
Median Reported Score 55
Median Observed Score 57.9
Less than $1,000$1,000 to $19,999
$20,000 to $49,999$50,000 to $99,999
$100,000 to $299,999$300,000 or more
4553
5055
6070
47535353
5868
Median Reported Score 55
Median Observed Score 57.9
Less than $1,000$1,000 to $19,999
$20,000 to $49,999$50,000 to $99,999
$300,000 or more$100,000 to $299,999
6055
4845
6353
4242
2861
6368
Median Reported Score 55
Median Observed Score 57.9
Less than $1,000$1,000 to $19,999
$20,000 to $49,999$50,000 to $99,999
$100,000 to $299,999$300,000 or more
4055
6570
7373
3258
798484
74

32
Personal capabilities
Median Reported Score 55
Median Observed Score 57.9
PoorFair
GoodVery goodExcellent
2840
5060
65
4247
5358
63
Median Reported Score 55
Median Observed Score 57.9
NoYes
5845
5853
Median Reported Score 55
Median Observed Score 57.9
None or lowModarate
High
6348
30
5853
42
Highest education
General health
Disability
Mental distress
Median Reported Score 55
Median Observed Score 57.9
Year 9 or belowYear 10 or 11
Year 12Certificate -any level
Advanced diploma or diplomaBachelor's degree or higher
4550
5148
5560
3742
5347
5363
33
Improving Financial Wellbeing of Australians
Find finances confusing
Understand financial products
Median Reported Score 55
Agree stronglyAgree
Neither agree nor disagreeDisagree
Disagree strongly
2540
5060
73 63
Median Observed Score 57.9
3747
5358
Median Reported Score 55
Median Observed Score 57.9
Don't understand themBasic understandingGood understanding
Very good understanding
4050
6063
4253
5853

34
Clear savings goals
Prefer not to live on credit
Feel in control of their lives
Median Reported Score 55
Median Observed Score 57.9
Disagree stronglyDisagree
Neither agree nor disagreeAgree
Agree strongly
3043
5060
68
3747
5358
63
Median Reported Score 55
Median Observed Score 57.9
Disagree stronglyDisagree
Neither agree nor disagreeAgree
Agree strongly
395050
5560
4247
4258
63
Median Reported Score 55
Median Observed Score 57.9
0 to 456789
10
3045
4853
6068
65
4247
5553
6363
58
Preferences and attitudes

35
Improving Financial Wellbeing of Australians
External conditions
Economic and life conditions
Hours with hours worked
Social contact
Community/government support used or needed
Median Reported Score 55
Median Observed Score 57.9
IsolatedOccasional contact
Regular contactGood contact
3345
5560
3747
5858
Median Reported Score 55
Median Observed Score 57.9
Not at allVery li�le
SomewhatVery well
Completely
* 5848
403333
584747
2142
Median Reported Score 55
Median Observed Score 57.9
Would like moreWould like less
Happy with amount
4553
60
4753
58
Not at all = not neededVery little = occasionally used but not reliantSomewhat = specialised support services usedVery well = emergency services usedCompletely = needed but inaccessible
*
