using taxation to reduce sugar consumption - ifs · pdf fileusing taxation to reduce sugar...
TRANSCRIPT

Using taxation to reduce sugar consumption
Rachel GriffithMelanie LührmannMartin O'ConnellKate Smith
IFS Briefing Note BN180

© Institute for Fiscal Studies, 2016
1
Using taxation to reduce sugar consumption
Rachel Griffith, Melanie Lührmann, Martin O’Connell and Kate Smith1
Institute for Fiscal Studies
© The Institute for Fiscal Studies, March 2016 ISBN: 978-1-911102-09-0
Executive summary
• In the recent Budget, the Chancellor introduced a tax on the sugar content of soft drinks, citing concerns about childhood obesity. This tax will be introduced in 2018 and will not apply to fruit juices or milk-based drinks.
• Government intervention to reduce sugar intake is potentially justified if there are costs associated with consumption that are not taken into account by the individual when choosing what to eat – for example, the publicly-funded health costs of treating diet-related disease or unanticipated future health problems.
• The extent of these costs is likely to vary across individuals and potentially across different types of products.
• Corrective taxes, such as the kind levied on cigarettes, alcohol, fuel and other goods that are thought to have high social costs, should aim to raise the price to bring the costs perceived by an individual into line with the true costs associated with their consumption.
1 We gratefully acknowledge financial support from the European Research Council (ERC) under ERC-2009-AdG grant agreement number 249529 and the Economic and Social Research Council (ESRC) under the Centre for the Microeconomic Analysis of Public Policy (CPP) grant number ES/M010147/1 and under the Open Research Area (ORA) grant number ES/I012222/1. Data were supplied by TNS UK Limited. The use of TNS UK Ltd data in this work does not imply the endorsement of TNS UK Ltd in relation to the interpretation or analysis of the data. All errors and omissions remain the responsibility of the authors.
© Institute for Fiscal Studies, 2016
2
• An appropriately-defined tax base can help to ensure that a tax is better targeted at socially costly consumption. The tax base will determine the way that the tax changes relative prices faced by individuals, and hence how they switch across products in response.
• A tax levied on sugary soft drinks has the advantage that reduction in consumption of these products is not likely to directly adversely impact other aspects of diet quality. However, its effectiveness at reducing sugar consumption will depend on the products towards which people switch.
• Carbonated and non-carbonated soft drinks account for on average around 17% of the added sugar that households purchase. Therefore, a tax imposed on these products would target only a fraction of the average household’s total added sugar purchases.
• However, households that purchase the largest amounts of sugar get around twice as much of their sugar from carbonated and non-carbonated soft drinks as households that purchase the lowest amounts of sugar (based on a comparison of the top 20% and the bottom 20% of households’ share of calories from processed added sugar), making a soft drinks tax potentially well targeted.
• In addition, households with children purchase on average around 50% more of their added sugar from carbonated and non-carbonated soft drinks, compared with households without children, which also suggests that a soft drinks tax could potentially be well targeted.
• A broader-based tax levied on a wider range of sugary products would raise the price of products that collectively account for a larger fraction of added sugar, but is likely to be less well targeted – for instance, potentially strongly impacting consumers for whom the rationale for government intervention is weak.

© Institute for Fiscal Studies, 2016
3
1. Introduction
In the recent Budget, the Chancellor introduced a tax on the sugar content of soft drinks, citing concerns about childhood obesity. This tax will be introduced in 2018 and will not apply to fruit juices or milk-based drinks. It has followed calls from various bodies for intervention to reduce people’s sugar consumption.2,3 In this briefing note, we provide some descriptive evidence on the main sources of dietary sugar and we lay out some of the economic issues related to the introduction of a tax on sugar. We begin first by considering the rationale behind government intervention of this sort.
Rationale for government intervention to curb sugar consumption
If everyone took into account all the costs, imposed both on themselves in the future and on broader society, that were associated with their sugar consumption, then there would be little reason for government intervention. The case for government to try to influence what foods people choose rests on the idea that the full costs of consumption are not taken into account by individuals when deciding what to eat. The divergence between the perceived and actual costs of consuming an additional unit leads individuals to consume more than is ideal. This sort of market failure is thought to exist and be large for many goods, including cigarettes, alcohol and petrol.
In the case of sugar, there are a number of possible reasons why people may fail to take into account all of the costs associated with their consumption. Many of these stem from the relationship between excessive sugar consumption, diet-related disease and long-term health, economic and social outcomes. For instance, there is evidence that excessive sugar consumption increases the risk of consuming too many calories, thus contributing to obesity, and that obesity increases the risk of developing
2 Page 13 of House of Commons Health Committee, Childhood Obesity: Brave and Bold Action, November 2015, http://www.publications.parliament.uk/pa/cm201516/cmselect/cmhealth/465/465.pdf. 3 Page 8 of Public Health England, Sugar Reduction: The Evidence for Action, October 2015, https://www.gov.uk/government/publications/sugar-reduction-from-evidence-into-action.
© Institute for Fiscal Studies, 2016
4
heart disease, type 2 diabetes, strokes and some cancers.4 There is evidence that poor diet is responsible for up to 40% of the non-communicable disease burden in Europe.5 In addition, excessive sugar consumption is linked to tooth decay, particularly in children.
Many of the health costs resulting from excess sugar consumption will be borne by the individual – for example, through lower quality of life, reduced wages and premature mortality. However, excess sugar consumption may also generate costs borne by society more broadly, such as those associated with publicly-funded medical costs6 and through lost tax revenues and increased benefit payments due to diet-related illness.
In addition, it is likely that the full effects of consumption on the individual themselves may not be taken into account by them at the time of consumption. For example, some people may be unaware of the future impact on health of high sugar consumption or, indeed, of what products are high in sugar. Children are a particularly compelling example of this: it is unlikely that children are fully able to understand the effect of eating a lot of sugar on their future health and well-being.7 Some individuals might also face self-control problems that lead them to underweight the future health consequences relative to the instantaneous gratification of eating a sugary snack (and hence subsequently to regret their choice).
The economic rationale behind taxing sugar is to try to bring the costs that an individual perceives when making a purchasing decision more closely into line with the total costs (including both the costs to society and potential future costs for the individual). This type of tax is known as a corrective tax, and it aims to raise the price so that the perceived costs are 4 Scientific Advisory Committee on Nutrition, Carbohydrates and Health, 2015, https://www.gov.uk/government/publications/sacn-carbohydrates-and-health-report. 5 C. J. Murray et al., ‘Disability-adjusted life years (DALYs) for 291 diseases and injuries in 21 regions, 1990–2010: a systematic analysis for the Global Burden of Disease Study 2010’, The Lancet, 2012, 380, 2197–223. 6 For instance, the NHS bill for treating obesity is £5 billion per year and the bill for treating diabetes is £10 billion per year – see page 5 of Public Health England, Sugar Reduction: The Evidence for Action, October 2015, https://www.gov.uk/government/publications/sugar-reduction-from-evidence-into-action and page 5 of Diabetes UK, The Cost of Diabetes Report, January 2014, https://www.diabetes.org.uk/Documents/Diabetes%20UK%20Cost%20of%20Diabetes%20Report.pdf. 7 For further discussion of these issues, see R. Griffith and M. O’Connell, ‘Public policy towards food consumption’, Fiscal Studies, 2010, 31, 481–507.
© Institute for Fiscal Studies, 2016
5
brought into line with the actual costs of consuming an additional unit of the product.
In practice, it can be difficult to effectively target the tax on purchases where the costs that an individual faces when making the purchasing decision are most out of line with the actual costs. This divergence is likely to vary across people and across consumption occasions. For example, the social costs from an obese person eating an additional chocolate bar are likely to be higher than those from a competitive marathon runner eating the same chocolate bar. Even if we were able to identify the size of the divergence for each individual, it would be difficult to design a tax system that treats people differently. Therefore, any tax is likely to affect not only the people for whom the actual costs are most out of line with their perceived costs, but also the people for whom there is no social or unaccounted-for future private cost (e.g. the competitive marathon runner). The tax makes the latter type of individual worse off, since they face a higher price, and there is no benefit to society or to the individual in the future.
This means that there is a trade-off between reducing the consumption of people who consume more than is ideal and raising the prices faced by individuals whose behaviour does not create any excess costs. When considering the merits of introducing a corrective tax, it is important to consider this trade-off, and not to simply focus on a set of problematic individuals and ignore the impact on others.
These complications do not mean that we cannot design effective corrective taxes, but they should be borne in mind when considering the merits of such a policy and in its design. In this briefing note, we consider the share of total calories that a household purchases from added sugar as an (imperfect) indicator of the size of the divergence between the perceived costs when taking the purchase decision and the total costs of consumption. This is because consuming a high share of calories in the form of added sugar is associated with a higher risk of various health conditions and is therefore more likely to create a divergence between perceived and actual costs. We also pay particular attention to households with children, as it is likely that the future costs of consuming too much sugar are both particularly high for children and not fully taken into account by them (or their parents) when deciding what to eat.

© Institute for Fiscal Studies, 2016
6
2. Sources of dietary sugar
Official government advice recommends that no more than 5% of total calorie intake should come from ‘added sugar’.8,9 However, most households purchase more than this: Figure 1 shows that more than 90% of households buy in excess of 5% of their calories as added sugar and that more than 30% of households buy in excess of 15% of their calories as added sugar.10 On average, households buy 14% of their calories in the form of added sugar. Figure 1. Distribution of share of total calories bought as added sugar
Note: Added sugar includes all sugars added to foods plus those naturally present in fruit juices, syrups and honey. It does not include the sugars naturally present in intact fruit and vegetables or milk and dairy products. For each household, we calculate the share of their total calories that comes from added sugar. The bars show the percentage of households that fall within each 1 percentage point bin of total calories from added sugar. The dashed line shows the recommended 5% level. Source: Living Costs and Food Survey 2013.
8 Added sugar includes all sugars added to foods plus those naturally present in fruit juices, syrups and honey. It does not include the sugars naturally present in intact fruit and vegetables or milk and dairy products. 9 Page 4 of Scientific Advisory Committee on Nutrition, Carbohydrates and Health, 2015, https://www.gov.uk/government/publications/sacn-carbohydrates-and-health-report. 10 Authors’ calculations using the Living Costs and Food Survey 2013. Includes food brought into the home, takeaways and food eaten out in restaurants and pubs.
© Institute for Fiscal Studies, 2016
7
We use data from the Living Costs and Food Survey from 2001 to 2013. These data record the food and drink purchases of a representative sample of UK households (there are between 5,000 and 7,500 households in the survey each year). Each household records spending and quantity of food and drinks purchased, including food brought into the home, takeaways and food eaten out in restaurants and pubs, over a two-week period. Quantities are converted into nutrients using nutrient conversion factors calculated by the Department for Food and Rural Affairs.
Long-run trend in sugar purchases
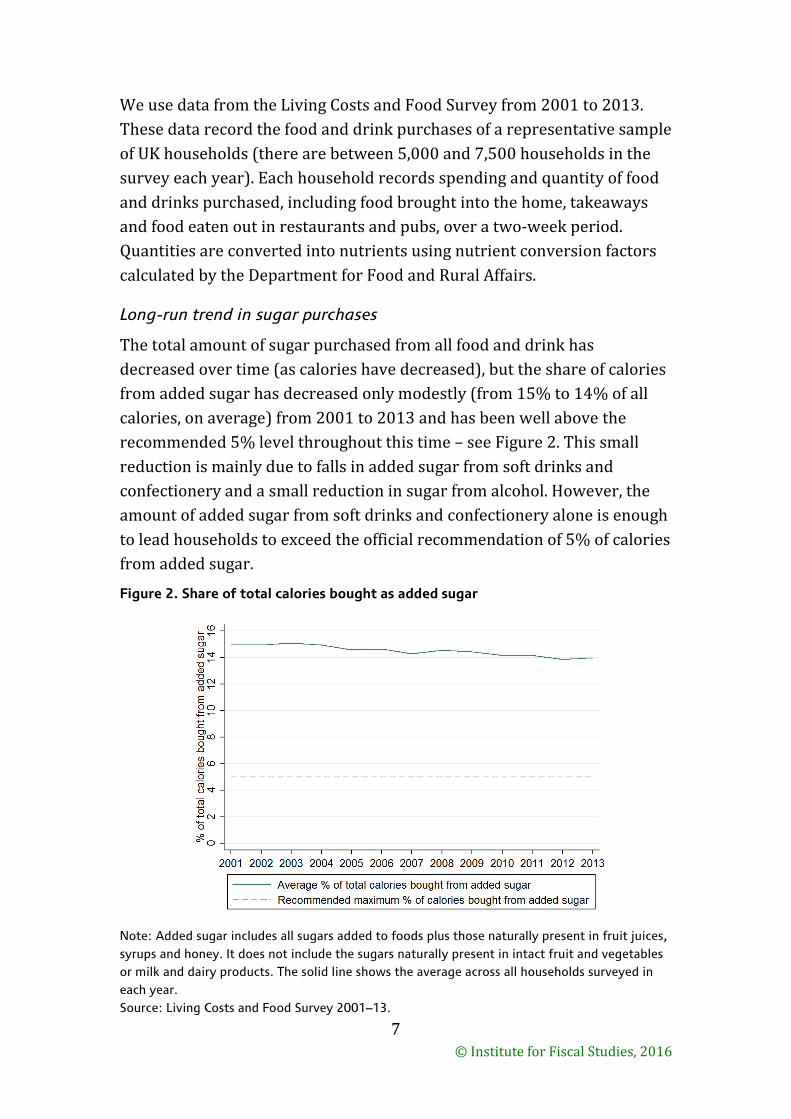
The total amount of sugar purchased from all food and drink has decreased over time (as calories have decreased), but the share of calories from added sugar has decreased only modestly (from 15% to 14% of all calories, on average) from 2001 to 2013 and has been well above the recommended 5% level throughout this time – see Figure 2. This small reduction is mainly due to falls in added sugar from soft drinks and confectionery and a small reduction in sugar from alcohol. However, the amount of added sugar from soft drinks and confectionery alone is enough to lead households to exceed the official recommendation of 5% of calories from added sugar.
Figure 2. Share of total calories bought as added sugar
Note: Added sugar includes all sugars added to foods plus those naturally present in fruit juices, syrups and honey. It does not include the sugars naturally present in intact fruit and vegetables or milk and dairy products. The solid line shows the average across all households surveyed in each year. Source: Living Costs and Food Survey 2001–13.

© Institute for Fiscal Studies, 2016
8
Which products are the main sources of sugar purchases?
Purchases of sugar are concentrated in a relatively small number of food groups – see Figure 3. Chocolate and confectionery contribute an average of around 19% of total added sugar purchases, raw sugar around 18% and biscuits and cake a further 15%. Carbonated soft drinks (e.g. cola, lemonade) contribute around 12% and non-carbonated soft drinks (e.g. fruit squash) make up a further 5% of total added sugar purchases.
Figure 3. Share of total added sugar bought from various food groups
Note: Bars show the share of total added sugar bought (across all households) in 2013 from each food group shown on the horizontal axis. Source: Living Costs and Food Survey 2013.
Understanding from where people get sugar is an important first step in assessing what products any tax should target. The breadth of the tax base will determine how effective such a tax might be at moving people towards the recommended level of sugar consumption. For example, if a tax on carbonated soft drinks reduced sugar bought from this food group to zero and was accompanied by no switching to other sugary products, then the percentage of households purchasing in excess of the 5% recommended calories from added sugar would fall only marginally from 93% to 91%,
© Institute for Fiscal Studies, 2016
9
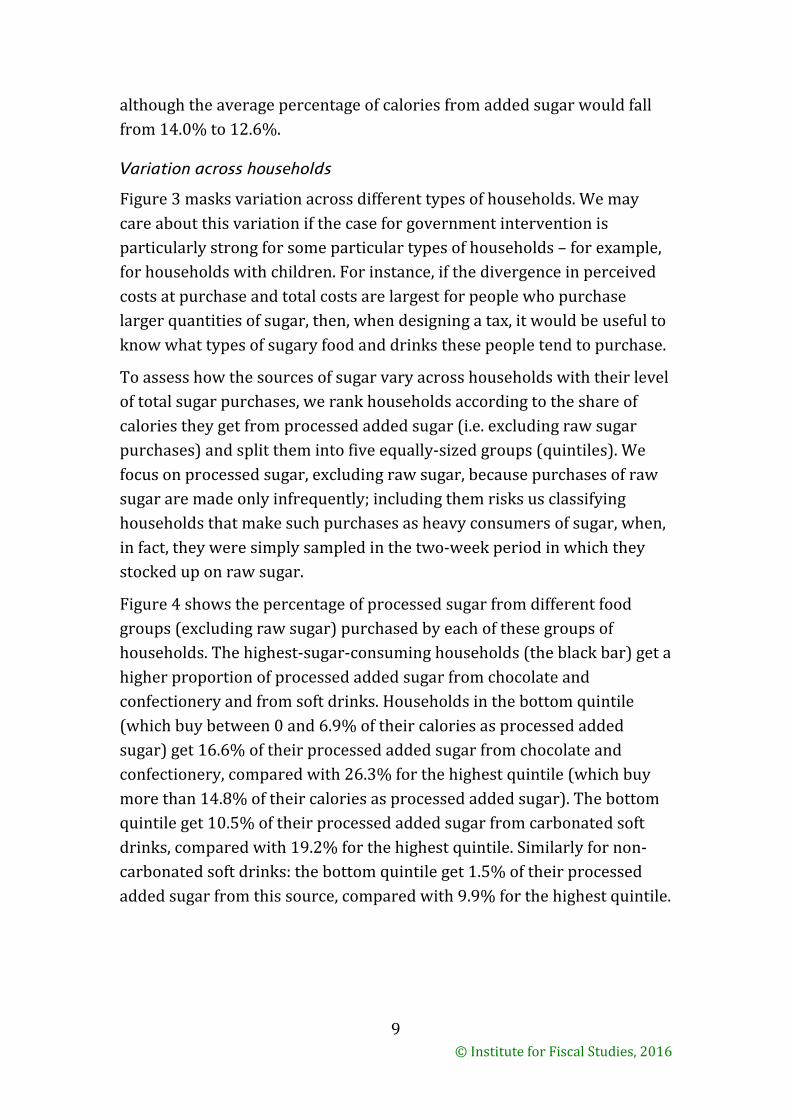
although the average percentage of calories from added sugar would fall from 14.0% to 12.6%.
Variation across households
Figure 3 masks variation across different types of households. We may care about this variation if the case for government intervention is particularly strong for some particular types of households – for example, for households with children. For instance, if the divergence in perceived costs at purchase and total costs are largest for people who purchase larger quantities of sugar, then, when designing a tax, it would be useful to know what types of sugary food and drinks these people tend to purchase.
To assess how the sources of sugar vary across households with their level of total sugar purchases, we rank households according to the share of calories they get from processed added sugar (i.e. excluding raw sugar purchases) and split them into five equally-sized groups (quintiles). We focus on processed sugar, excluding raw sugar, because purchases of raw sugar are made only infrequently; including them risks us classifying households that make such purchases as heavy consumers of sugar, when, in fact, they were simply sampled in the two-week period in which they stocked up on raw sugar.
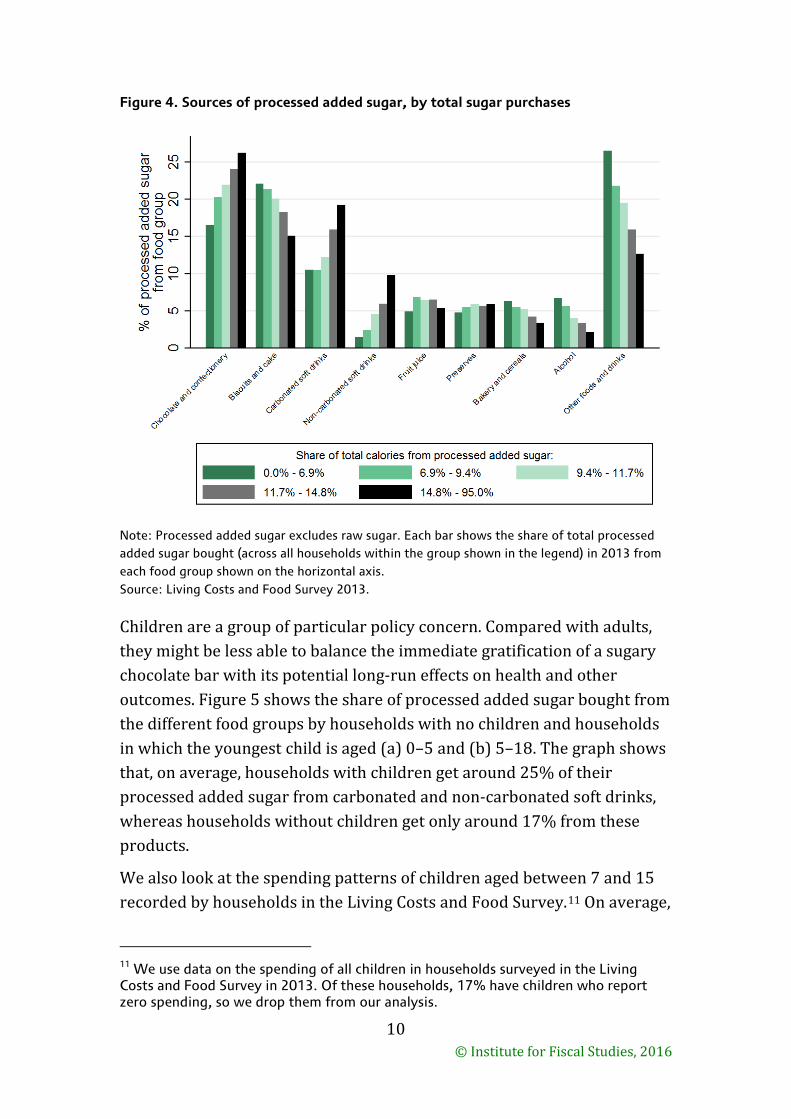
Figure 4 shows the percentage of processed sugar from different food groups (excluding raw sugar) purchased by each of these groups of households. The highest-sugar-consuming households (the black bar) get a higher proportion of processed added sugar from chocolate and confectionery and from soft drinks. Households in the bottom quintile (which buy between 0 and 6.9% of their calories as processed added sugar) get 16.6% of their processed added sugar from chocolate and confectionery, compared with 26.3% for the highest quintile (which buy more than 14.8% of their calories as processed added sugar). The bottom quintile get 10.5% of their processed added sugar from carbonated soft drinks, compared with 19.2% for the highest quintile. Similarly for non-carbonated soft drinks: the bottom quintile get 1.5% of their processed added sugar from this source, compared with 9.9% for the highest quintile.
© Institute for Fiscal Studies, 2016
10
Figure 4. Sources of processed added sugar, by total sugar purchases
Note: Processed added sugar excludes raw sugar. Each bar shows the share of total processed added sugar bought (across all households within the group shown in the legend) in 2013 from each food group shown on the horizontal axis. Source: Living Costs and Food Survey 2013.
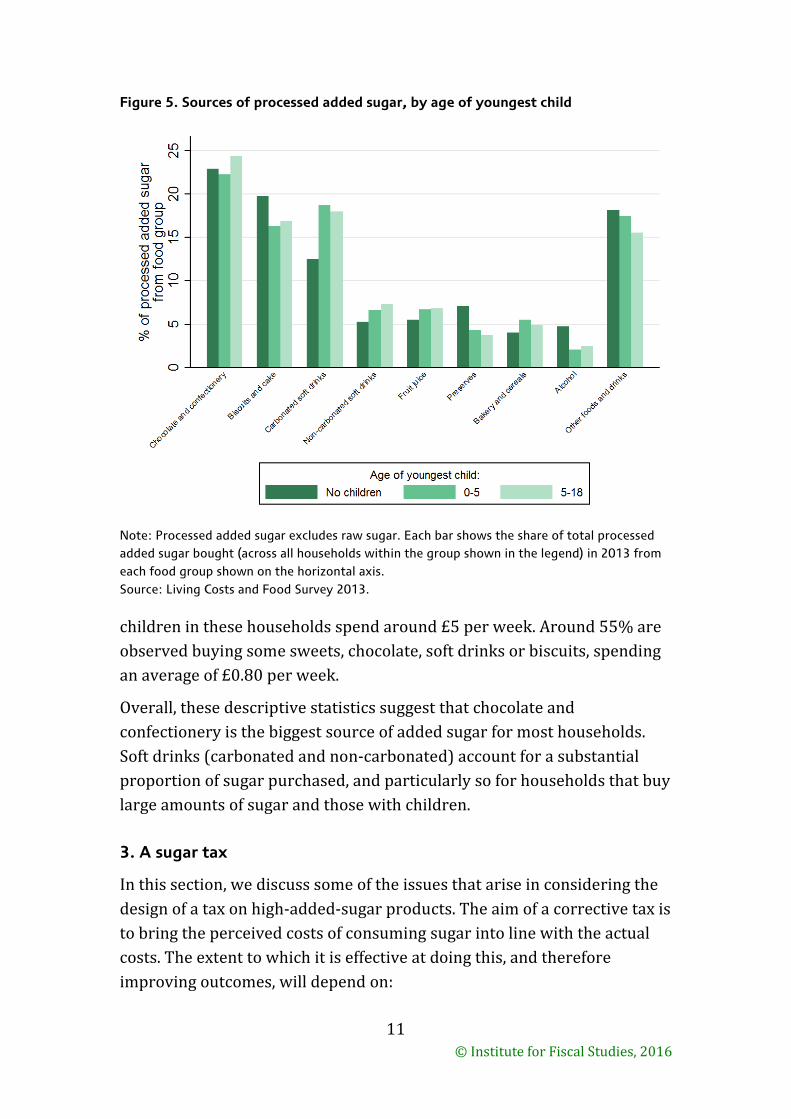
Children are a group of particular policy concern. Compared with adults, they might be less able to balance the immediate gratification of a sugary chocolate bar with its potential long-run effects on health and other outcomes. Figure 5 shows the share of processed added sugar bought from the different food groups by households with no children and households in which the youngest child is aged (a) 0–5 and (b) 5–18. The graph shows that, on average, households with children get around 25% of their processed added sugar from carbonated and non-carbonated soft drinks, whereas households without children get only around 17% from these products.
We also look at the spending patterns of children aged between 7 and 15 recorded by households in the Living Costs and Food Survey.11 On average,
11 We use data on the spending of all children in households surveyed in the Living Costs and Food Survey in 2013. Of these households, 17% have children who report zero spending, so we drop them from our analysis.
© Institute for Fiscal Studies, 2016
11
Figure 5. Sources of processed added sugar, by age of youngest child
Note: Processed added sugar excludes raw sugar. Each bar shows the share of total processed added sugar bought (across all households within the group shown in the legend) in 2013 from each food group shown on the horizontal axis. Source: Living Costs and Food Survey 2013.
children in these households spend around £5 per week. Around 55% are observed buying some sweets, chocolate, soft drinks or biscuits, spending an average of £0.80 per week.
Overall, these descriptive statistics suggest that chocolate and confectionery is the biggest source of added sugar for most households. Soft drinks (carbonated and non-carbonated) account for a substantial proportion of sugar purchased, and particularly so for households that buy large amounts of sugar and those with children.
3. A sugar tax
In this section, we discuss some of the issues that arise in considering the design of a tax on high-added-sugar products. The aim of a corrective tax is to bring the perceived costs of consuming sugar into line with the actual costs. The extent to which it is effective at doing this, and therefore improving outcomes, will depend on:

© Institute for Fiscal Studies, 2016
12
• the tax base: what products are taxed and by how much; • consumer response: how consumers reallocate their spending in
response to a price change; • retailer and manufacturer response: how the relative prices of different
products change as a result of the tax.
Several countries have introduced taxes on various sets of high-sugar products – see Box 1. The tax base determines which products are subject to the tax, and hence which products are likely to see an increase in price relative to the prices of untaxed products. The tax proposed in the March 2016 Budget has a relatively narrow base, including soft drinks but excluding fruit juices and milk-based drinks. A tax on sugary soft drinks would increase their price relative to other goods, creating an incentive for consumers to switch away from them.
Box 1. Sugar taxes around the world
Various countries have introduced taxes targeting high-added-sugar products in order to counter the rising problems of obesity and diet-related disease. The tax base (i.e. which products are subject to the tax) varies across countries. For example, only sugary soft drinks are targeted in the US, whereas chocolate, sweets and all non-alcoholic beverages that contain added sugar or sweeteners are taxed in Norway.
A broader tax base would probably lead to a greater reduction in total sugar purchased; however, it risks having a larger effect on people for whom the perceived costs of consuming are not that much lower than the true costs. If we believe that the divergence in perceived and true costs is larger for households that purchase relatively large amounts of sugar, or for households that contain children, we can use the differential purchase patterns of these groups to help determine what a reasonable tax base may be. Figure 4 above shows that households that purchase relatively
Country Tax base includes: Australia Soft drinks, confectionery, biscuits, bakery products
Finland Soft drinks, sweets, ice cream
France Drinks containing added sugar or sweeteners
Hungary Sugary drinks, sweets, biscuits, ice cream, chocolate, jams
Mexico Non-alcoholic and non-dairy drinks with added sugar
Norway Non-alcoholic beverages containing added sugar or sweeteners, chocolate, sweets
US (some states) Sugary soft drinks
Source: Table 1, annexe 2 of Public Health England, Sugar Reduction: The Evidence for Action, October 2015, https://www.gov.uk/government/publications/sugar-reduction-from-evidence-into-action.

© Institute for Fiscal Studies, 2016
13
large amounts of sugar tend to purchase disproportionately large amounts in the form of chocolate, confectionery, and carbonated and non-carbonated soft drinks, while Figure 5 shows that households with children tend to obtain a relatively large share of their sugar from carbonated and non-carbonated soft drinks. This suggests that a tax on soft drinks and probably also on chocolate and confectionery may be reasonably well targeted.
How people respond to changes in the relative prices of different foods will determine the effects of a sugar tax. A key issue is to what products people switch after a change in price. For example, if in response to a sugary soft drinks tax, individuals switch towards drinking water (rather than cola), then the tax will have a relatively large impact on total sugar consumption; however, if they switch towards confectionery, then the tax may have little or no effect on total sugar consumption.
The effect of an increase in price on the quantity purchased of that product is typically measured by the ‘own-price elasticity of demand’. This tells us, for example, how much the quantity of cola purchased would decline in response to a 1% increase in its price. If demand is very elastic, then people will buy a lot less of the product in response to an increase in its price, and therefore a tax-induced price change will be quite effective at changing purchasing decisions. On the other hand, if demand is very inelastic because people have particularly strong preferences for that product, then even a large increase in price might only have a small impact on quantity purchased.
As people switch away from a taxed product, they are likely to shift some of their demand to alternative products. While some people may simply not purchase any other food products, others may respond by purchasing a similar type of food. The percentage change in quantity bought, given a 1% change in another product’s price, is called the ‘cross-price elasticity of demand’. The magnitude and pattern of cross-price elasticities across products will be an important determinant of the impact that a tax has on the overall quantity of sugar purchased. For example, if people have a strong taste for soft drinks, then an increase in the price of sugary soft drinks would lead them to switch to diet alternatives. On the other hand, if people have a strong taste for sugar, then they may switch towards chocolate or confectionery rather than low-sugar soft drinks. If people have a strong taste for sugary drinks, but only some sugary drinks are

© Institute for Fiscal Studies, 2016
14
taxed, then they may switch to untaxed sugary drinks.12 This is a possible concern with the soft drinks tax announced in the March 2016 Budget, which leaves fruit juices untaxed. In addition, sugar may not be the only nutrient that is associated with poor health outcomes. For example, if people switch towards chocolate, then this might increase saturated fat consumption while reducing sugar consumption, leading to an ambiguous effect on overall diet quality.
Importantly, the size of own- and cross-price elasticities is likely to vary across people. To assess whether a policy targets the groups with the highest divergence in their perceived and actual costs of consumption, it is important to understand these patterns of differential response. For example, if the government particularly wanted to reduce the sugar consumption of children, then it would be especially important to understand the substitution patterns of households with children.
To illustrate the importance of consumer switching in determining the effectiveness of any tax, we consider the effect of a notional 15% tax applied to drinks containing added sugar (including carbonated and non-carbonated soft drinks and fruit juice). We make several alternative assumptions about how strong people’s tastes for sugar are, and so how willing they are to switch from soft drinks to other products, such as water or diet soft drinks, or chocolate and confectionery. For illustrative purposes, we assume that the own-price elasticity for drinks containing added sugar is –1.0, which means that a tax that increases the price of sugary soft drinks by 15% is associated with a fall in purchases of sugary soft drinks of 15%. We consider four alternative scenarios that describe various ways in which households might reallocate their spending – see Table 1:
• Scenario 1: All households have a very weak taste for sugar, so that they switch entirely to diet soft drinks; purchases of chocolate and confectionery do not change (this implies a cross-price elasticity of 0). This is a ‘best-case’ scenario. Under this scenario, the tax would lead to a decline in total sugar purchases of 3%; this is because it leads to a
12 For example, see J. M. Fletcher, D. E. Frisvold and N. Tefft, ‘The effects of soft drink taxes on child and adolescent consumption and weight outcomes’, Journal of Public Economics, 2010, 94, 967–74.

© Institute for Fiscal Studies, 2016
15
15% reduction in purchases of sugary soft drinks and fruit juice, which account for roughly 20% of total added sugar purchases.
• Scenario 2: All households have a moderate taste for sugar, so that they partially switch to diet soft drinks and partially switch towards chocolate and confectionery, increasing their purchases of the chocolate and confectionery products (we assume they have a cross-price elasticity of 0.2). This offsets the reduction in sugar from sugary drinks, leading to a smaller decline in total sugar purchases, of 2.4%.
• Scenario 3: All households have a strong taste for sugar, so that they increase their purchases of chocolate and confectionery (we assume they have a cross-price elasticity of 0.5). This almost halves the impact of the tax on total sugar purchases, to 1.6%, relative to assuming no substitution towards chocolate and confectionery.
• Scenario 4: Households that buy a lot of sugar have a strong taste for sugar, while households that buy less have only a moderate taste. This results in an average reduction in total sugar purchases of only 2.1%, with a smaller reduction of 1.6% for the households with strong sugar preferences.
Table 1. Percentage change in total sugar resulting from a tax on sugary drinks
Scenario 1 Scenario 2 Scenario 3 Scenario 4 Taste for sugar
For households that buy:
high amount of added sugar Weak Moderate Strong Strong
low amount of added sugar Weak Moderate Strong Moderate
% change in total sugar
For households that buy:
high amount of added sugar –3.0% –2.4% –1.6% –1.6%
low amount of added sugar –3.0% –2.4% –1.6% –2.4%
Average –3.0% –2.4% –1.6% –2.1% Note: We assume that: a tax on sugary drinks (carbonated, non-carbonated and fruit juice) would lead to a price increase of 15%; the own-price elasticity of sugary drinks is –1.0; and the cross-price elasticity of chocolate and confectionery with respect to the change in the price of sugary drinks is 0 in scenario 1, 0.2 in scenario 2, 0.5 in scenario 3, and 0.5 for high-added-sugar households and 0.2 for low-added-sugar households in scenario 4. We consider households that purchase more/less than 15% of their calories from added sugar as households that buy a high/low amount of sugar. Source: Authors’ calculations using the Living Costs and Food Survey 2013.

© Institute for Fiscal Studies, 2016
16
These numbers are illustrative; in reality, people’s substitution patterns are more complicated and would need to be estimated. However, these examples show that it is important to take into account the fact that when a tax leads people to reduce purchases of one good, they will switch to other products, which might also have an important influence on the outcome of interest (in this case, the amount of sugar purchased).
One further issue when considering the impact of a sugar tax, which is often neglected in the discussion of such policies, is the way in which food manufacturers and retailers respond to the introduction of the tax. They may respond in terms of the prices they charge for their products and/or in terms of the products that they offer, the nutritional composition of those products and the ways that they are advertised. These considerations add additional uncertainty to the effect of a sugar tax.
In realistic market settings, manufacturers and retailers often have some power to set prices above cost. This means that taxes will not necessarily translate one-for-one into price changes, and indeed the relationship between taxes and changes in price can be very complicated. It is possible that a tax may be ‘overshifted’ to prices (meaning the price increases by more than the amount of the tax) or ‘undershifted’ to prices (meaning the price increases by less than the tax imposed). If a tax is undershifted or overshifted in a uniform way across products, then this will have little consequence for the overall effects of the policy (a higher or lower tax rate can always be chosen to achieve the desired reduction in purchases). However, it is often the case that the transmission of tax to prices is affected by factors that vary across firms, and so the tax might be undershifted to some products and overshifted to others. This can mean that the impact of the tax is very different from what it would appear to be if these effects were not taken into account.13
A related point is that manufacturers and retailers may respond to the tax by changing the prices of products that are not subject to the tax. This may happen if demand for a close substitute of a taxed product suddenly increases as a consequence of the introduction of the tax. For example, if a tax on sugary soft drinks leads to an increase in demand for diet cola, then 13 For example, see S. P. Anderson, A. De Palma and B. Kreider, ‘Tax incidence in differentiated product oligopoly’, Journal of Public Economics, 2001, 81, 173–92 and C. Bonnet and V. Réquillart, ‘Tax incidence with strategic firms in the soft drink market’, Journal of Public Economics, 2013, 106, 77–88.
© Institute for Fiscal Studies, 2016
17
it may be profitable for its manufacturers and retailers to raise its price, which would dampen the effects of the tax because it would mean that the increase in the price of sugary relative to non-sugary soft drinks would be smaller. However, such pricing responses are uncertain, with evidence from modelling the impact of tax on sugary drinks in France even pointing to the possibility that the price of diet drinks would decrease.14
Manufacturers may also respond to a tax levied on sugar by reformulating their products. If they try to avoid the tax by reducing the amount of sugar in their products (e.g. to just below the threshold value for the tax), this could contribute to the success of the policy in reducing sugar consumption. The overall impact would also depend on whether manufacturers alter other ingredients – for example, if manufacturers respond by replacing the sugar in products with more salt or fat, this could dampen the positive impact of the policy on overall diet quality.
4. Conclusions
The existence of health costs associated with high sugar consumption that lead to external costs to society, and the likelihood that some people, particularly children, may not be fully aware of these health costs, provide a potential justification for government intervention in the food market to lower sugar consumption. A tax on high-added-sugar products is one way to try to bring the perceived costs of consuming an additional unit of sugar into line with the actual costs. A tax on sugary soft drinks seems to be well targeted at high-sugar-consuming households and households with children. However, chocolate and confectionery also account for a large part of these households’ purchases, and if they remained untaxed then it seems likely that consumers with a strong taste for sugar would substitute towards these products in response to the tax. It is also likely that firms would respond to the tax by changing the prices of substitute products as well as taxed products.
The effectiveness of any sugar tax will ultimately depend on how both consumers and firms change their behaviour in response. Careful, evidence-based design and a clear understanding of the role of sugar taxes alongside other initiatives will help contribute to the design of effective policies in this area. 14 C. Bonnet and V. Réquillart, ‘Tax incidence with strategic firms in the soft drink market’, Journal of Public Economics, 2013, 106, 77–88.