using the visual studio® debugger -...
TRANSCRIPT

HUsing the Visual Studio® Debugger
O b j e c t i v e sIn this appendix you’ll:
■ Set breakpoints and run a program in the debugger.
■ Use the Continue command to continue execution.
■ Use the Locals window to view and modify the values of variables.
■ Use the Watch window to evaluate expressions.
■ Use the Step Into, Step Out and Step Over commands to control execution.
■ Use the Autos window to view variables that are used in the surrounding statements.
■ Set breakpoints and run a program in the debugger.
■ Use the Continue command to continue execution.
cppfp2_appH.fm Page 1 Tuesday, March 26, 2013 3:32 PM

H-2 Appendix H Using the Visual Studio® Debugger
Ou
tlin
e
H.1 IntroductionIn Chapter 2, you learned that there are two types of errors—compilation errors and logicerrors—and you learned how to eliminate compilation errors from your code. Logic errors(also called bugs) do not prevent a program from compiling successfully, but can cause theprogram to produce erroneous results when it runs. Most C++ compiler vendors providesoftware called a debugger, which allows you to monitor the execution of your programsto locate and remove logic errors. The debugger will be one of your most important pro-gram development tools. This appendix demonstrates key features of the Visual Studio de-bugger. Appendix I discusses the features and capabilities of the GNU C++ debugger
H.2 Breakpoints and the Continue CommandWe begin our study of the debugger by investigating breakpoints, which are markers thatcan be set at any executable line of code. When program execution reaches a breakpoint,execution pauses, allowing you to examine the values of variables to help determine wheth-er a logic error exists. For example, you can examine the value of a variable that stores theresult of a calculation to determine whether the calculation was performed correctly. Notethat attempting to set a breakpoint at a line of code that is not executable (such as a com-ment) will actually set the breakpoint at the next executable line of code in that function.
To illustrate the features of the debugger, we use the program listed in Fig. H.3, whichcreates and manipulates an object of class Account (Figs. H.1–H.2). Execution begins inmain (lines 10–27 of Fig. H.3). Line 12 creates an Account object with an initial balanceof $50.00. Account’s constructor (lines 9–21 of Fig. H.2) accepts one argument, whichspecifies the Account’s initial balance. Line 15 of Fig. H.3 outputs the initial account bal-ance using Account member function getBalance. Line 17 declares a local variable with-drawalAmount, which stores a withdrawal amount read from the user. Line 19 prompts theuser for the withdrawal amount, and line 20 inputs the amount into withdrawalAmount.Line 23 subtracts the withdrawal from the Account’s balance using its debit memberfunction. Finally, line 26 displays the new balance.
H.1 Introduction H.2 Breakpoints and the Continue
Command H.3 Locals and Watch Windows
H.4 Controlling Execution Using the Step Into, Step Over, Step Out and Continue Commands
H.5 Autos Window H.6 Wrap-Up
1 // Fig. H.1: Account.h2 // Definition of Account class.3 class Account4 {5 public:6 Account( int ); // constructor initializes balance7 void credit( int ); // add an amount to the account balance
Fig. H.1 | Header file for the Account class. (Part 1 of 2.)
cppfp2_appH.fm Page 2 Tuesday, March 26, 2013 3:32 PM

H.2 Breakpoints and the Continue Command H-3
8 void debit( int ); // subtract an amount from the account balance9 int getBalance(); // return the account balance
10 private:11 int balance; // data member that stores the balance12 }; // end class Account
1 // Fig. H.2: Account.cpp2 // Member-function definitions for class Account.3 #include <iostream>4 using namespace std;56 #include "Account.h" // include definition of class Account78 // Account constructor initializes data member balance9 Account::Account( int initialBalance )
10 {11 balance = 0; // assume that the balance begins at 01213 // if initialBalance is greater than 0, set this value as the14 // balance of the account; otherwise, balance remains 015 if ( initialBalance > 0 )16 balance = initialBalance;1718 // if initialBalance is negative, print error message19 if ( initialBalance < 0 )20 cout << "Error: Initial balance cannot be negative.\n" << endl;21 } // end Account constructor2223 // credit (add) an amount to the account balance24 void Account::credit( int amount )25 {26 balance = balance + amount; // add amount to balance27 } // end function credit2829 // debit (subtract) an amount from the account balance30 void Account::debit( int amount )31 {32 if ( amount <= balance ) // debit amount does not exceed balance33 balance = balance - amount;34 else // debit amount exceeds balance35 cout << "Debit amount exceeded account balance.\n" << endl;36 } // end function debit3738 // return the account balance39 int Account::getBalance()40 {41 return balance; // gives the value of balance to the calling function42 } // end function getBalance
Fig. H.2 | Definition for the Account class.
Fig. H.1 | Header file for the Account class. (Part 2 of 2.)
cppfp2_appH.fm Page 3 Tuesday, March 26, 2013 3:32 PM

H-4 Appendix H Using the Visual Studio® Debugger
Creating a Project in Visual Studio Express 2012 for Windows DesktopIn the following steps, you’ll create a project that includes the code from Figs. H.1–H.3.
1. In Visual Studio 2012 Express for Windows Desktop select File > New Project…to display the New Project dialog.
2. In the Installed Templates list under Visual C++, select Win32, and in the center ofthe dialog, select Win32 Console Application.
3. In the Name: field, enter a name for your project and in the Location: field, specifywhere you’d like to save the project on your computer, then click OK.
4. In the Win32 Application Wizard dialog, click Next >.
5. Under Application type:, select Console application, and under Additional options:uncheck Precompiled header and Security Development Lifecycle (SDL) checks,select Empty project then click Finish.
6. In the Solution Explorer, right click your project’s Source Files folder and selectAdd > Existing Item… to display the Add Existing Item dialog.
7. Locate the folder containing the Appendix H example code, select all three filesand click Add.
1 // Fig. H.3: figH_03.cpp2 // Create and manipulate Account objects.3 #include <iostream>4 using namespace std;56 // include definition of class Account from Account.h7 #include "Account.h"89 // function main begins program execution
10 int main()11 {12 Account account1( 50 ); // create Account object1314 // display initial balance of each object15 cout << "account1 balance: $" << account1.getBalance() << endl;1617 int withdrawalAmount; // stores withdrawal amount read from user1819 cout << "\nEnter withdrawal amount for account1: "; // prompt20 cin >> withdrawalAmount; // obtain user input21 cout << "\nattempting to subtract " << withdrawalAmount 22 << " from account1 balance\n\n";23 account1.debit( withdrawalAmount ); // try to subtract from account12425 // display balances26 cout << "account1 balance: $" << account1.getBalance() << endl;27 } // end main
Fig. H.3 | Test class for debugging.
cppfp2_appH.fm Page 4 Tuesday, March 26, 2013 3:32 PM

H.2 Breakpoints and the Continue Command H-5
Enabling Debug Mode, Inserting Breakpoints and Running in Debug ModeIn the following steps, you’ll use breakpoints and various debugger commands to examinethe value of the variable withdrawalAmount declared in Fig. H.3.
1. Enabling the debugger. The debugger is normally enabled by default. If it isn’t, youcan change the settings of the Solution Configurations combo box (Fig. H.4) in thetoolbar. To do this, click the combo box’s down arrow, then select Debug.
2. Inserting breakpoints. Open figH_03.cpp by double-clicking it in the Solution Ex-plorer. To insert a breakpoint, click inside the margin indicator bar (the gray mar-gin at the left of the code window in Fig. H.5) next to the line of code at which youwish to break or right click that line of code and select Breakpoint > Insert Break-point. You can set as many breakpoints as necessary. Set breakpoints at lines 17 and21 of your code. A red circle appears in the margin indicator bar where you clicked,indicating that a breakpoint has been set (Fig. H.5). When the program runs, thedebugger pauses execution at any line that contains a breakpoint. The program issaid to be in break mode when the debugger pauses the program. Breakpoints canbe set before running a program, in break mode and while a program is running.
Fig. H.4 | Enabling the debugger.
Fig. H.5 | Setting two breakpoints.
Solution Configurations combo box
BreakpointMargin
indicator barBreakpoint
cppfp2_appH.fm Page 5 Tuesday, March 26, 2013 3:32 PM

H-6 Appendix H Using the Visual Studio® Debugger
3. Starting to debug. After setting breakpoints in the code editor, select Debug >Start Debugging to build the program and begin the debugging process. Whenyou debug a console application, a Command Prompt window appears (Fig. H.6)in which you can specify program input and view program output. The debuggerenters break mode when execution reaches the breakpoint at line 17.
4. Examining program execution. Upon entering break mode at the first breakpoint(line 17), the IDE becomes the active window (Fig. H.7). The yellow arrow tothe left of line 17 indicates that this line contains the next statement to execute.
5. Using the Continue command to resume execution. To resume execution, selectDebug > Continue. The Continue command resumes program execution until thenext breakpoint or the end of main is encountered, whichever comes first. Theprogram continues executing and pauses for input at line 18. Enter 13 as thewithdrawal amount. The program executes until it stops at the next breakpoint(line 21). Notice that when you place your mouse pointer over the variable namewithdrawalAmount, the value stored in the variable is displayed in a Quick Infobox (Fig. H.8). As you’ll see, this can help you spot logic errors in your programs.
6. Setting a breakpoint at main’s closing brace. Set a breakpoint at line 25 in thesource code by clicking in the margin indicator bar to the left of line 25. This willprevent the program from closing immediately after displaying its result. Whenthere are no more breakpoints at which to suspend execution, the program willexecute to completion and the Command Prompt window will close. If you do not
Fig. H.6 | Inventory program running.
Fig. H.7 | Program execution suspended at the first breakpoint.
Yellow arrow that indicates
the next statement to execute
cppfp2_appH.fm Page 6 Tuesday, March 26, 2013 3:32 PM

H.3 Locals and Watch Windows H-7
set this breakpoint, you won’t be able to view the program’s output before theconsole window closes.
7. Continuing program execution. Use the Debug > Continue command to executethe code up to the next breakpoint. The program displays the result of its calcu-lation (Fig. H.9).
8. Removing a breakpoint. Click the breakpoint in the margin indicator bar.
9. Finishing program execution. Select Debug > Continue to execute the program tocompletion.
In this section, you learned how to enable the debugger and set breakpoints so thatyou can examine the results of code while a program is running. You also learned how tocontinue execution after a program suspends execution at a breakpoint and how to removebreakpoints.
H.3 Locals and Watch WindowsIn the preceding section, you learned that the Quick Info feature allows you to examine avariable’s value. In this section, you’ll learn to use the Locals window to assign new values
Fig. H.8 | Quick Info box showing the value of a variable.
Fig. H.9 | Program output.
Quick Info box
cppfp2_appH.fm Page 7 Tuesday, March 26, 2013 3:32 PM

H-8 Appendix H Using the Visual Studio® Debugger
to variables while your program is running. You’ll also use the Watch window to examinethe value of more complex expressions.
1. Inserting breakpoints. Clear the existing breakpoints. Then, set a breakpoint atline 21 in the source code by clicking in the margin indicator bar to the left ofline 21 (Fig. H.10). Set another breakpoint at line 24 by clicking in the marginindicator bar to the left of line 24.
2. Starting debugging. Select Debug > Start. Type 13 at the Enter withdrawal amountfor account1: prompt and press Enter so that your program reads the value youjust entered. The program executes until the breakpoint at line 21.
3. Suspending program execution. The debugger enters break mode at line 21(Fig. H.11). At this point, line 18 has input the withdrawalAmount that you en-tered (13), lines 19–20 have output that the program will attempt to withdrawmoney and line 21 is the next statement that will execute.
Fig. H.10 | Setting breakpoints at lines 21 and 24.
Fig. H.11 | Program execution suspended when debugger reaches the breakpoint at line 21.
cppfp2_appH.fm Page 8 Tuesday, March 26, 2013 3:32 PM

H.3 Locals and Watch Windows H-9
4. Examining data. In break mode, you can explore the values of your local variablesusing the debugger’s Locals window, which is normally displayed at the bottomleft of the IDE when you are debugging. If it is not shown, you can view theLocals window, select Debug > Windows > Locals. Figure H.12 shows the valuesfor main’s local variables account1 and withdrawalAmount (13).
5. Evaluating arithmetic and boolean expressions. You can evaluate arithmetic andboolean expressions using the Watch window. You can display up to four Watchwindows. Select Debug > Windows > Watch > Watch 1. In the first row of theName column, type (withdrawalAmount + 3) * 5, then press Enter. The value ofthis expression (80 in this case) is displayed in the Value column (Fig. H.13). Inthe next row of the Name column, type withdrawalAmount == 3, then press Enter.This expression determines whether the value of withdrawalAmount is 3. Expres-sions containing the == operator (or any other relational or equality operator) aretreated as bool expressions. The value of the expression in this case is false(Fig. H.13), because withdrawalAmount currently contains 13, not 3.
6. Resuming execution. Select Debug > Continue to resume execution. Line 21 debitsthe account by the withdrawal amount, and the debugger reenters break mode atline 24. Select Debug > Windows > Locals or click the Locals tab at the bottom ofVisual Studio to redisplay the Locals window. The updated balance in account1is now displayed in red (Fig. H.14) to indicate that it has been modified since thelast breakpoint. Click the plus box to the left of account1 in the Name column ofthe Locals window. This allows you to view each of account1’s data member valuesindividually—this is particularly useful for objects that have several data members.
Fig. H.12 | Examining variable withdrawalAmount.
Fig. H.13 | Examining the values of expressions.
Fig. H.14 | Displaying the value of local variables.
Evaluating a bool expressionEvaluating an arithmetic expression
Value of account1’s balance data member displayed in red
cppfp2_appH.fm Page 9 Tuesday, March 26, 2013 3:32 PM
H-10 Appendix H Using the Visual Studio® Debugger
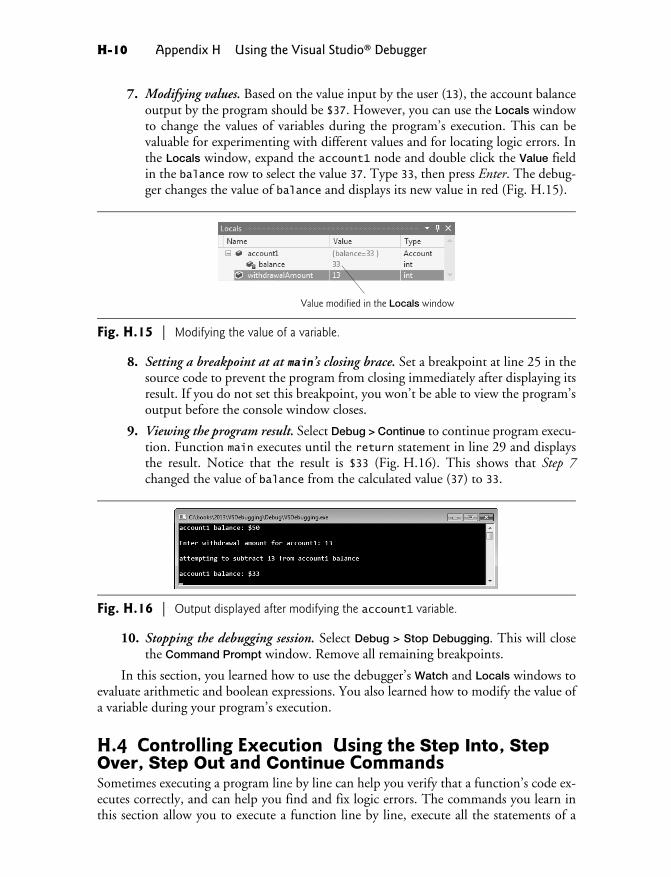
7. Modifying values. Based on the value input by the user (13), the account balanceoutput by the program should be $37. However, you can use the Locals windowto change the values of variables during the program’s execution. This can bevaluable for experimenting with different values and for locating logic errors. Inthe Locals window, expand the account1 node and double click the Value fieldin the balance row to select the value 37. Type 33, then press Enter. The debug-ger changes the value of balance and displays its new value in red (Fig. H.15).
8. Setting a breakpoint at at main’s closing brace. Set a breakpoint at line 25 in thesource code to prevent the program from closing immediately after displaying itsresult. If you do not set this breakpoint, you won’t be able to view the program’soutput before the console window closes.
9. Viewing the program result. Select Debug > Continue to continue program execu-tion. Function main executes until the return statement in line 29 and displaysthe result. Notice that the result is $33 (Fig. H.16). This shows that Step 7changed the value of balance from the calculated value (37) to 33.
10. Stopping the debugging session. Select Debug > Stop Debugging. This will closethe Command Prompt window. Remove all remaining breakpoints.
In this section, you learned how to use the debugger’s Watch and Locals windows toevaluate arithmetic and boolean expressions. You also learned how to modify the value ofa variable during your program’s execution.
H.4 Controlling Execution Using the Step Into, Step Over, Step Out and Continue CommandsSometimes executing a program line by line can help you verify that a function’s code ex-ecutes correctly, and can help you find and fix logic errors. The commands you learn inthis section allow you to execute a function line by line, execute all the statements of a
Fig. H.15 | Modifying the value of a variable.
Fig. H.16 | Output displayed after modifying the account1 variable.
Value modified in the Locals window
cppfp2_appH.fm Page 10 Tuesday, March 26, 2013 3:32 PM

H.4 Using the Step Into, Step Over, Step Out and Continue Commands H-
function at once or execute only the remaining statements of a function (if you’ve alreadyexecuted some statements within the function).
1. Setting breakpoints. Set breakpoints at lines 21 and 25 by clicking in the marginindicator bar to the left of the line.
2. Starting the debugger. Select Debug > Start. Enter the value 13 at the Enter with-drawal amount for account1: prompt. Execution will halt when the programreaches the breakpoint at line 21.
3. Using the Step Into command. The Step Into command executes the next state-ment in the program (line 21), then immediately halts. If that statement is a func-tion call (as is the case here), control transfers into the called function. Thisenables you to execute each statement inside the function individually to confirmthe function’s execution. Select Debug > Step Into (or press F11) to enter thedebit function. Then, Select Debug > Step Into again so the yellow arrow is po-sitioned at line 31 of Account.cpp.
4. Using the Step Over command. Select Debug > Step Over to execute the currentstatement (line 31) and transfer control to line 32. The Step Over command be-haves like the Step Into command when the next statement to execute does notcontain a function call. You’ll see how the Step Over command differs from theStep Into command in Step 9.
5. Using the Step Out command. Select Debug > Step Out to execute the remainingstatements in the function and return control to the next executable statement(line 28 in Fig. H.3). Often, in lengthy functions, you’ll want to look at a few keylines of code, then continue debugging the caller’s code. The Step Out commandenables you to continue program execution in the caller without having to stepthrough the entire called function line by line.
6. Using the Continue command. Select Debug > Continue to execute until the nextbreakpoint is reached at line 25. Using the Continue command is useful when youwish to execute all the code up to the next breakpoint.
7. Stopping the debugger. Select Debug > Stop Debugging to end the debugging ses-sion. This will close the Command Prompt window.
8. Starting the debugger. Before we can demonstrate the next debugger feature, youmust start the debugger again. Start it, as you did in Step 2, and enter 13 in re-sponse to the prompt. The debugger enters break mode at line 21.
9. Using the Step Over command. Select Debug > Step Over. This command behaveslike the Step Into command when the next statement to execute does not containa function call. If the next statement to execute contains a function call, the calledfunction executes in its entirety (without pausing execution at any statement in-side the function), and the yellow arrow advances to the next executable line (af-ter the function call) in the current function. In this case, the debugger executesline 21, located in main (Fig. H.3). Line 21 calls the debit function. The debug-ger then pauses execution at line 24, the next executable line in the current func-tion, main.
cppfp2_appH.fm Page 11 Tuesday, March 26, 2013 3:32 PM

H-12 Appendix H Using the Visual Studio® Debugger
10. Stopping the debugger. Select Debug > Stop Debugging. This will close the Com-mand Prompt window. Remove all remaining breakpoints.
In this section, you learned how to use the debugger’s Step Into command to debugfunctions called during your program’s execution. You saw how the Step Over commandcan be used to step over a function call. You used the Step Out command to continue exe-cution until the end of the current function. You also learned that the Continue commandcontinues execution until another breakpoint is found or the program exits.
H.5 Autos WindowThe Autos window displays the variables used in the previous statement executed (includ-ing the return value of a function, if there is one) and the variables in the next statementto execute.
1. Setting breakpoints. Clear your prior breakpoints, then set breakpoints at lines 10and 18 in main.
2. Using the Autos window. Start the debugger by selecting Debug > Start. When thedebugger enters break mode at line 10, open the Autos window by selectingDebug > Windows > Autos (Fig. H.17). Since we are just beginning the program’sexecution, the Autos window lists only the variable(s) in the next statement thatwill execute—in this case, the account1 object, its value and its type. Viewing thevalues stored in an object lets you verify that your program is manipulating thesevariables correctly. Notice that account1 contains a large negative value. This val-ue, which may be different each time the program executes, is account1’s unini-tialized value. This unpredictable (and often undesirable) value demonstrateswhy it is important to initialize all C++ variables before they are used.
3. Using the Step Over command. Select Debug > Step Over to execute line 10. TheAutos window updates the value of account1’s balance data member (Fig. H.18)after it is initialized.
Fig. H.17 | Autos window displaying the state of account1 object.
Fig. H.18 | Autos window displaying the state of account1 object after initialization.
cppfp2_appH.fm Page 12 Tuesday, March 26, 2013 3:32 PM

H.6 Wrap-Up H-13
4. Continuing execution. Select Debug > Continue to execute the program until thesecond breakpoint at line 18. The Autos window displays uninitialized local vari-able withdrawalAmount (Fig. H.19), which has a large negative value.
5. Entering data. Select Debug > Step Over to execute line 18. At the program’s in-put prompt, enter a value for the withdrawal amount. The Autos window updatesthe value of local variable withdrawalAmount with the value you entered(Fig. H.20).
6. Stopping the debugger. Select Debug > Stop Debugging to end the debugging ses-sion. Remove all remaining breakpoints.
H.6 Wrap-UpIn this appendix, you learned how to insert, disable and remove breakpoints in the VisualStudio debugger. Breakpoints allow you to pause program execution so you can examinevariable values. This capability will help you locate and fix logic errors in your programs.You saw how to use the Locals and Watch windows to examine the value of an expressionand how to change the value of a variable. You also learned debugger commands Step Into,Step Over, Step Out and Continue that can be used to determine whether a function is ex-ecuting correctly. Finally, you learned how to use the Autos window to examine variablesused specifically in the previous and next commands.
Fig. H.19 | Autos window displaying local variable withdrawalAmount.
Fig. H.20 | Autos window displaying updated local variable withdrawalAmount.
cppfp2_appH.fm Page 13 Tuesday, March 26, 2013 3:32 PM