using topological data analysis to explore emergent consumer experience from digital interactions
TRANSCRIPT
© Novak and Hoffman 2015 | http://postsocial.gwu.edu
Using Topological Data Analysis to Explore Emergent Consumer Experience
from Digital Interactions
Tom Novak Donna Hoffman
The George Washington University Center for the Connected Consumer
NYU 2015 Conference on Digital Big Data, Smart Life, Mobile Marketing Analytics October 23, 2015
1

© Novak and Hoffman 2015 | http://postsocial.gwu.edu
Interactivity is Evolving and New Consumer Experiences are Emerging
The consumer IoT represents a multitude of on-going, evolving heterogeneous interactions among many different components: C2M, M2M, M2P, C2C – a set of recurrent “assemblages” (Hoffman and Novak 2015). What kind of insights can we derive about emergent consumer experience in the IoT (the “possibility space”) from actual interactions? These interactions represent a lot of digital “big data” – very high dimensionality data consisting of often millions of ongoing interactions among complex, heterogeneous component devices (and consumers!). So IoT big data are big in two ways: 1) size, and more importantly, 2) complexity. The challenge: Get from the complex unknown to the more interpretable known. 2

© Novak and Hoffman 2015 | http://postsocial.gwu.edu
Predictive Analytics approach: Fit predictive models to the data. But the complexity of the data means hypothesis testing is often challenging. We need to know what questions to ask. Are we asking the right questions? With big data, insights can be slow. Conventional approaches for reduction and visualization: Use linear and nonlinear dimension reduction techniques such as PCA, MCA, and MDS. But, even if they work, are sensitive to distance metrics and do not preserve topological structures of the data. Data-Driven Discovery Approach: Hypothesis-free approach based on computational topology to qualitatively analyze functions on very high-dimensional data and visualize the data structure in low-dimensional topological spaces. Topological data analysis (TDA) reveals structures in the data that have invariant properties and can propel insight and improve hypothesis-generation and predictive modeling; “digital serendipity” (Singh 2013). 132 million data points
Making Sense of of Digital Big Data from the IoT
3
© Novak and Hoffman 2015 | http://postsocial.gwu.edu 4
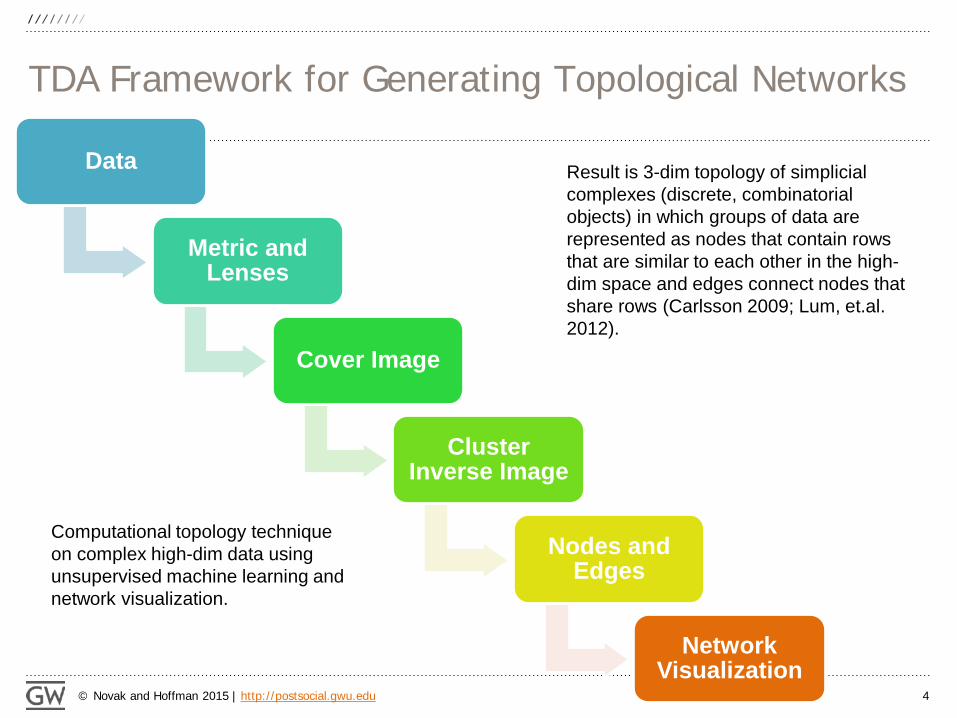
TDA Framework for Generating Topological Networks
Data
Metric and Lenses
Cover Image
Cluster Inverse Image
Nodes and Edges
Network Visualization
Computational topology technique on complex high-dim data using unsupervised machine learning and network visualization.
Result is 3-dim topology of simplicial complexes (discrete, combinatorial objects) in which groups of data are represented as nodes that contain rows that are similar to each other in the high-dim space and edges connect nodes that share rows (Carlsson 2009; Lum, et.al. 2012).
© Novak and Hoffman 2015 | http://postsocial.gwu.edu 5
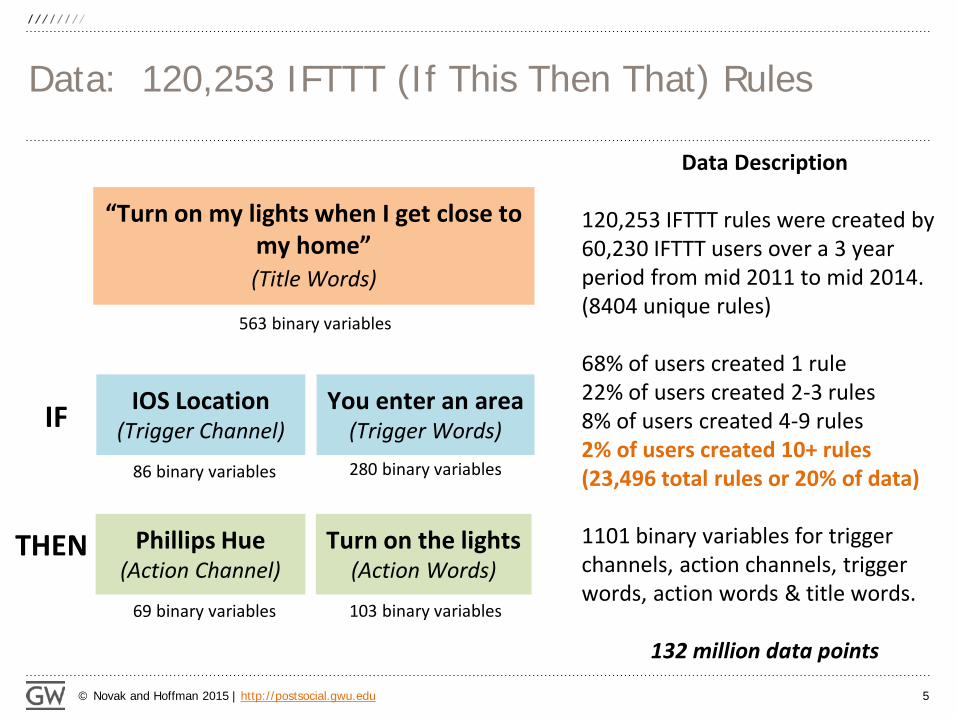
Data: 120,253 IFTTT (If This Then That) Rules
“Turn on my lights when I get close to my home” (Title Words)
IOS Location (Trigger Channel)
You enter an area (Trigger Words)
Phillips Hue (Action Channel)
Turn on the lights (Action Words)
IF
THEN
86 binary variables
69 binary variables 103 binary variables
280 binary variables
563 binary variables
Data Description 120,253 IFTTT rules were created by 60,230 IFTTT users over a 3 year period from mid 2011 to mid 2014. (8404 unique rules) 68% of users created 1 rule 22% of users created 2-3 rules 8% of users created 4-9 rules 2% of users created 10+ rules (23,496 total rules or 20% of data) 1101 binary variables for trigger channels, action channels, trigger words, action words & title words.
132 million data points
© Novak and Hoffman 2015 | http://postsocial.gwu.edu 6
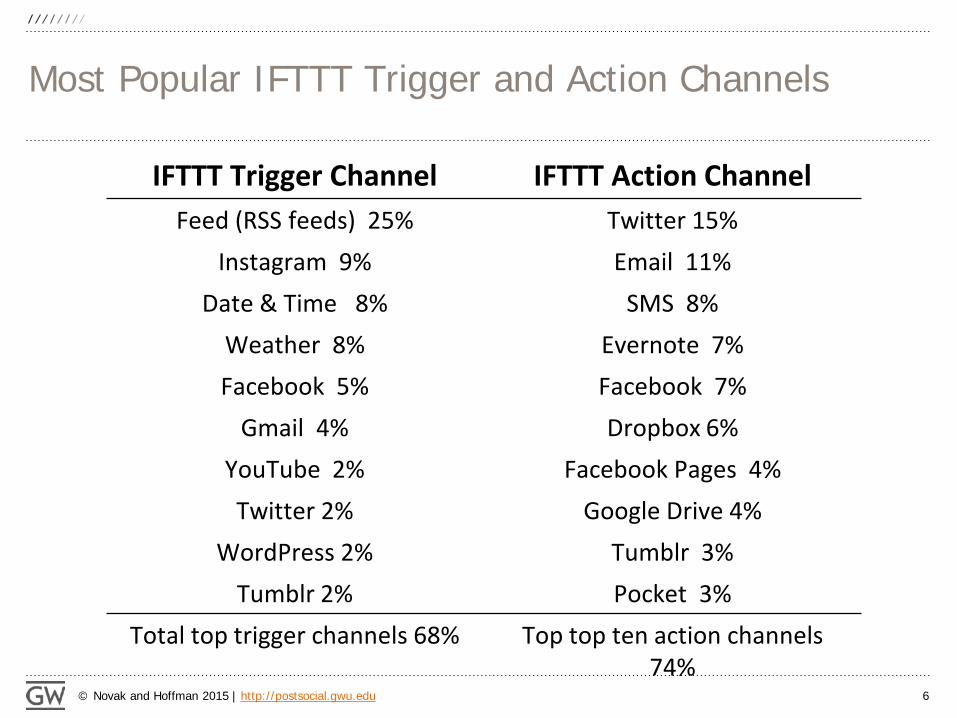
Most Popular IFTTT Trigger and Action Channels
IFTTT Trigger Channel IFTTT Action Channel Feed (RSS feeds) 25% Twitter 15%
Instagram 9% Email 11% Date & Time 8% SMS 8%
Weather 8% Evernote 7% Facebook 5% Facebook 7%
Gmail 4% Dropbox 6% YouTube 2% Facebook Pages 4% Twitter 2% Google Drive 4%
WordPress 2% Tumblr 3% Tumblr 2% Pocket 3%
Total top trigger channels 68% Top top ten action channels 74%

© Novak and Hoffman 2015 | http://postsocial.gwu.edu 7
Some IFTTT Rules Were Reinvented Again and Again
Trigger Channel Trigger
Action Channel Action
# of users creating this rule
Feed New feed item Email Send me an email 4987
Feed New feed item Twitter Post a tweet 2868
Date & Time Every hour at Twitter Post a tweet 1114
Facebook You are tagged in a photo Dropbox Add file from URL 926
Weather Sunrise SMS Send me an SMS 416
8404 unique rules, where: 39% of unique rules were created by 1 user
24% of unique rules were created by 2-3 users 18% of unique rules were created by 4-9 users 19% of unique rules were created by 10+ users
1% of unique rules were created by 200+ users (49,201 total rules of 41% of data)

© Novak and Hoffman 2015 | http://postsocial.gwu.edu 8
1. What IFTTT rules are people creating?
2. Are there interesting and important patterns that underlie the IFTTT rules that have been created?
3. Do these patterns suggest emergent themes?
Let’s take a look at some conventional reduction and
visualization approaches first…
Preliminary Research Questions
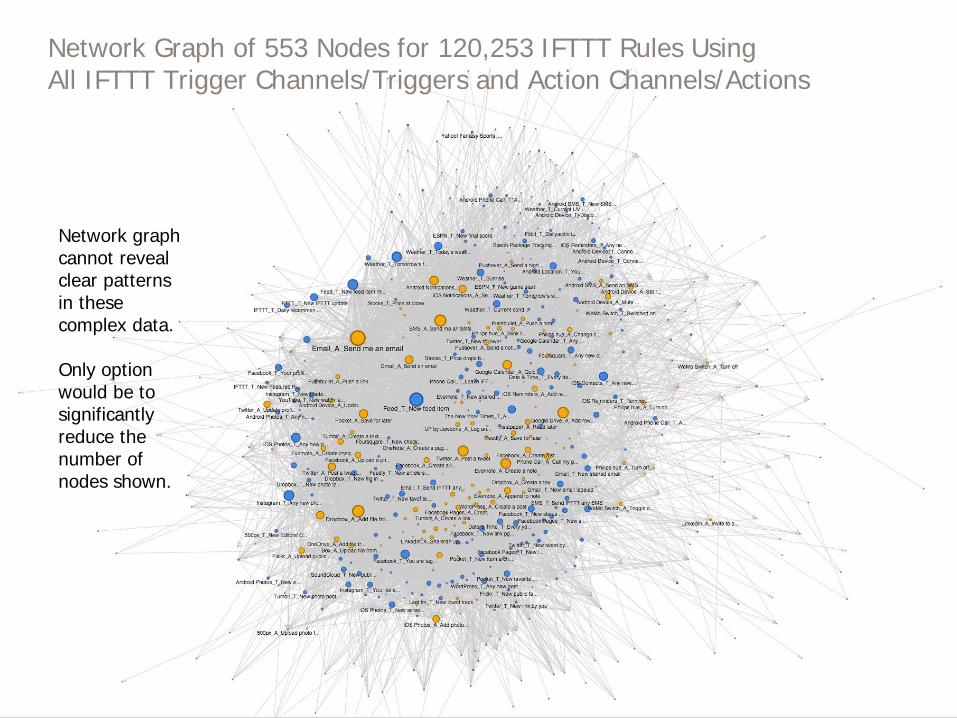
Network Graph of 553 Nodes for 120,253 IFTTT Rules Using All IFTTT Trigger Channels/Triggers and Action Channels/Actions
Network graph cannot reveal clear patterns in these complex data. Only option would be to significantly reduce the number of nodes shown.
© Novak and Hoffman 2015 | http://postsocial.gwu.edu 10
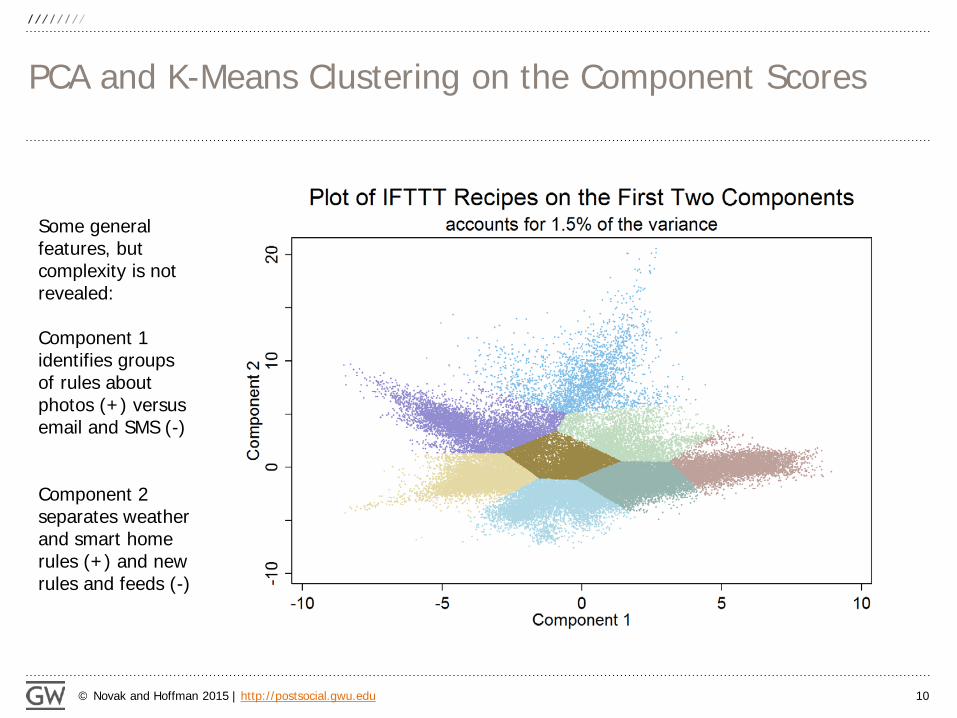
PCA and K-Means Clustering on the Component Scores
Some general features, but complexity is not revealed: Component 1 identifies groups of rules about photos (+) versus email and SMS (-) Component 2 separates weather and smart home rules (+) and new rules and feeds (-)
© Novak and Hoffman 2015 | http://postsocial.gwu.edu 11
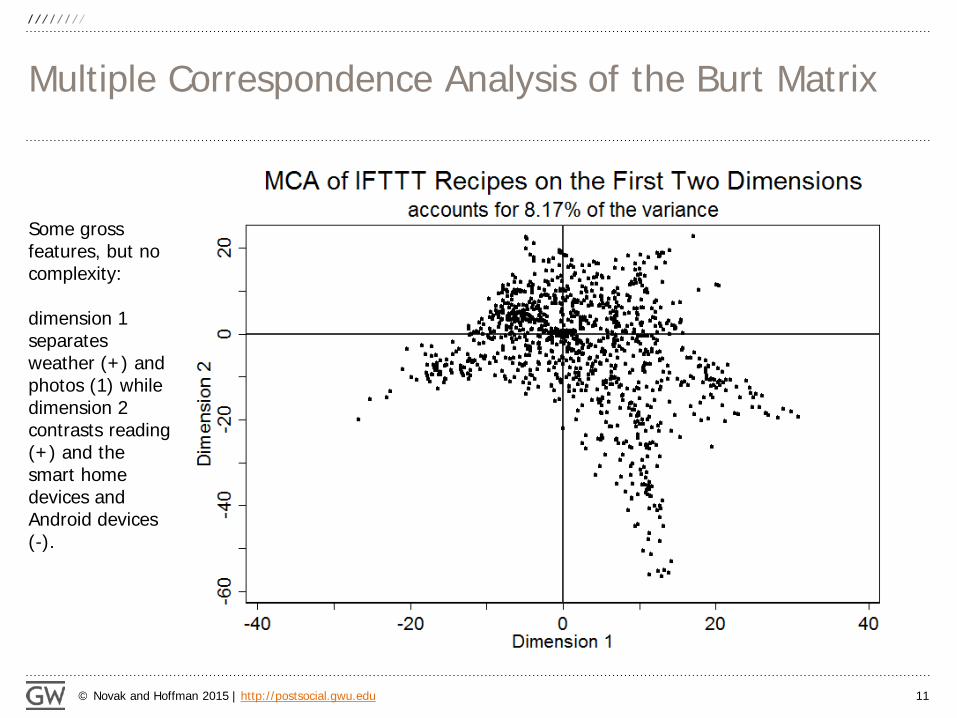
Multiple Correspondence Analysis of the Burt Matrix
Some gross features, but no complexity: dimension 1 separates weather (+) and photos (1) while dimension 2 contrasts reading (+) and the smart home devices and Android devices (-).
© Novak and Hoffman 2015 | http://postsocial.gwu.edu
TDA Provides a Different Approach
Conventional dimension reduction and visualization approaches have difficulty revealing clear patterns in these complex data of 1100+ vars.
Need about 400 dimensions to account for most of the variance in the data. Took Stata 6 hours to compute the MCA solution. General features that grossly separate rules are apparent, but it’s difficult to see the more subtle behavioral patterns underlying rule creation, let alone potential emergent themes.
Topological data analysis offers an approach to visualization of network structure that is more revealing and useful. 12
© Novak and Hoffman 2015 | http://postsocial.gwu.edu 13
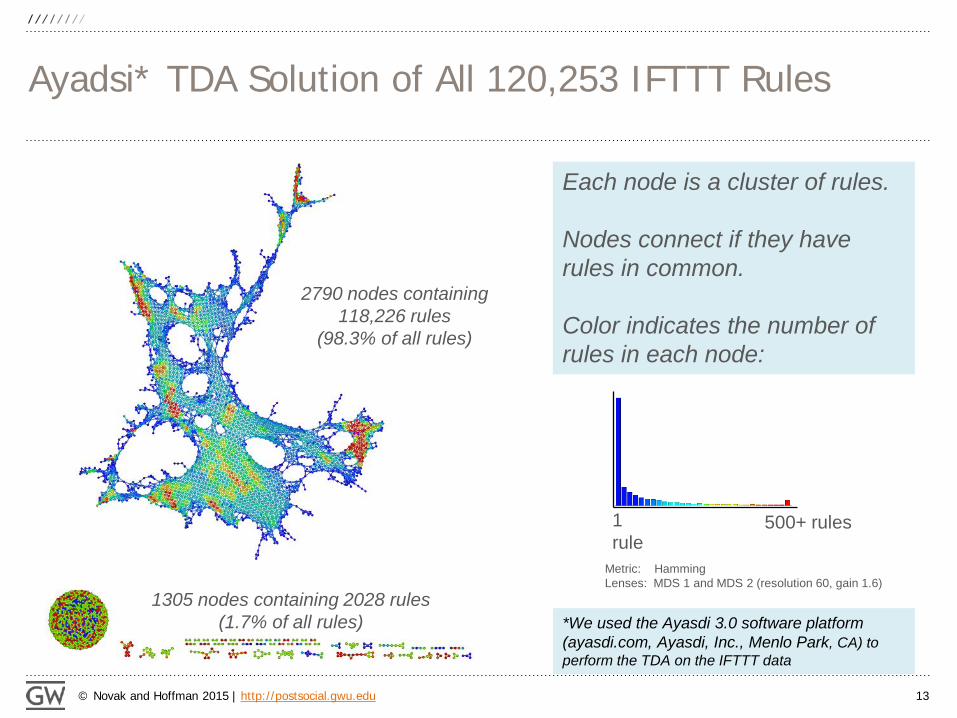
Ayadsi* TDA Solution of All 120,253 IFTTT Rules
Each node is a cluster of rules. Nodes connect if they have rules in common. Color indicates the number of rules in each node:
2790 nodes containing 118,226 rules
(98.3% of all rules)
1305 nodes containing 2028 rules (1.7% of all rules)
1 rule
500+ rules
Metric: Hamming Lenses: MDS 1 and MDS 2 (resolution 60, gain 1.6)
*We used the Ayasdi 3.0 software platform (ayasdi.com, Ayasdi, Inc., Menlo Park, CA) to perform the TDA on the IFTTT data
© Novak and Hoffman 2015 | http://postsocial.gwu.edu 14
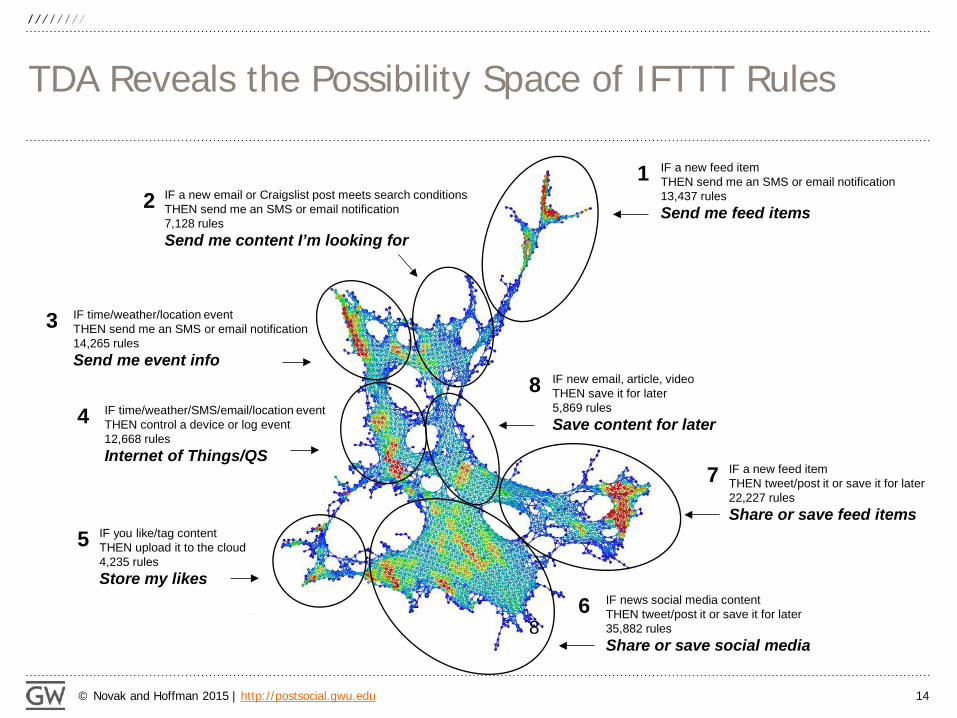
TDA Reveals the Possibility Space of IFTTT Rules
8
IF a new feed item THEN send me an SMS or email notification 13,437 rules Send me feed items
1
IF a new feed item THEN tweet/post it or save it for later 22,227 rules Share or save feed items
7
IF you like/tag content THEN upload it to the cloud 4,235 rules Store my likes
5
IF time/weather/SMS/email/location event THEN control a device or log event 12,668 rules Internet of Things/QS
4
IF time/weather/location event THEN send me an SMS or email notification 14,265 rules Send me event info
3
IF a new email or Craigslist post meets search conditions THEN send me an SMS or email notification 7,128 rules Send me content I’m looking for
2
IF new email, article, video THEN save it for later 5,869 rules Save content for later
8
IF news social media content THEN tweet/post it or save it for later 35,882 rules Share or save social media
6

© Novak and Hoffman 2015 | http://postsocial.gwu.edu 15
We can use categorical variables as “data lenses” to separate the IFTTT rules into groups with distinct structures. For example:
› Whether the IFTTT rule did - or did not - include a social media channel (e.g. Facebook, Twitter, YouTube, etc.). Does the structure of IFTTT rules vary based on whether the rule includes a social media channel?
› The year the IFTTT rule was created. Does the structure of IFTTT rules change over time?
Using Data Lenses to Include Known Structure

© Novak and Hoffman 2015 | http://postsocial.gwu.edu 16
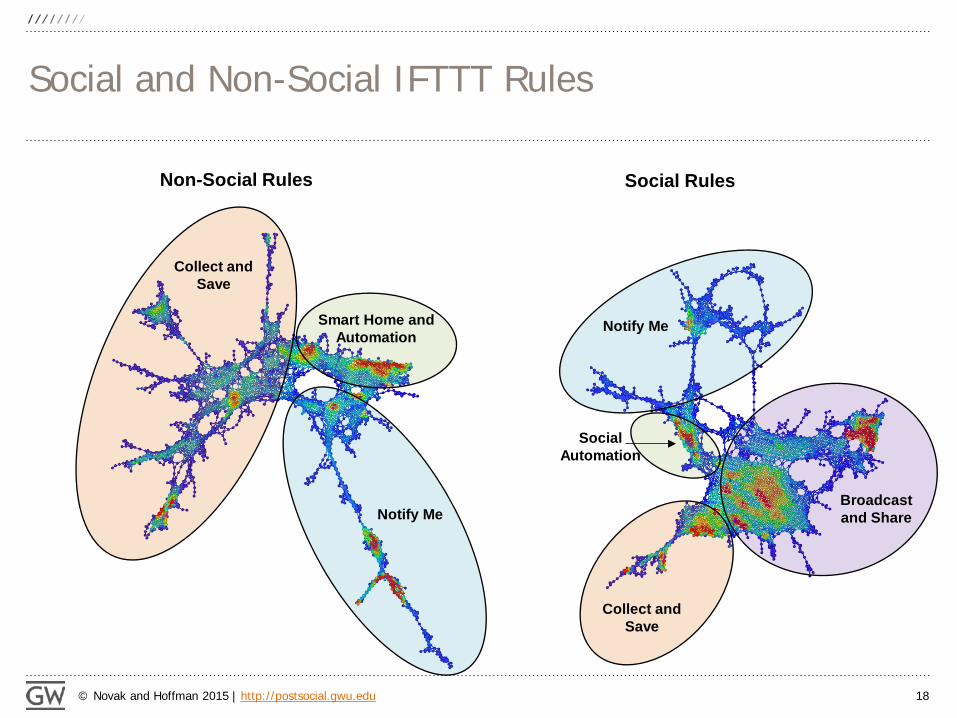
Social and Non-Social IFTTT Rules
54,300 Non-Social Rules (45% of rules do not use a Social Media channel)
65,953 Social Rules (55% of rule use a Social Media channel)
Metric: Hamming Lens: MDS 1 & 2 (resolution 60, gain 1.9) Data Lens: Social Media (2 groups)

© Novak and Hoffman 2015 | http://postsocial.gwu.edu 17
Social and Non-Social IFTTT Rules
Non-Social Rules Social Rules
Send an SMS or email if a new feed item
Save new feed item to read later
Save new feed item to cloud
Save new photo or file to cloud
Add event to cloud from a location or SMS/email trigger
Save tagged or favorited content to cloud
Smart Home and Wearables Day, Time and Weather
Create a note from email
Send email to notify me when something happens
Send me email or SMS if Craigslist or Reddit post
Send me email or SMS if tagged in Facebook
Schedule tweet/update by day and time
Save Facebook or Instagram content to cloud
Save Instagram pic to cloud, or send to FB or Flickr
Send Instagram content to Twitter or blog
Send content from one social platform to another
Tweet, blog, post new feed item
© Novak and Hoffman 2015 | http://postsocial.gwu.edu 18
Social and Non-Social IFTTT Rules
Non-Social Rules Social Rules
Smart Home and Automation
Collect and Save
Notify Me
Notify Me
Social Automation
Collect and Save
Broadcast and Share

© Novak and Hoffman 2015 | http://postsocial.gwu.edu 19
TDA of IFTTT Rules Over Time
Non-Social IFTTT Rules
Social IFTTT Rules
Year 1 2011-12
Year 2 2012-13
Year 3 2013-14
Metric: Hamming Lens: MDS 1 & 2 (resolution 50, gain 2.1) Data Lens: Social Media (2 groups), Year (3 groups)

© Novak and Hoffman 2015 | http://postsocial.gwu.edu 20
Non-Social IFTTT Rules
Social IFTTT Rules
Year 1 2011-12
Year 2 2012-13
Year 3 2013-14
Collect & Save
Notify Me
Automation The basic structure of IFTTT emerged in year 1, but became more organized and interconnected in years 2 and 3. Broadcast & Share

© Novak and Hoffman 2015 | http://postsocial.gwu.edu 21
TDA provides a way to visualize what emerges from the IoT using interaction events as the unit of analysis. IFTTT is an assemblage that emerges from the capacities of the components (i.e. triggers and actions) exercised in the interaction over time between apps and devices that are connected through the individual rules. Based on our assemblage theory framework (Hoffman and Novak 2015), the topology represents the possibility space (DeLanda 2006, 2011) underlying the potential capacities of the IFTTT assemblage. Supports productive hypothesis generation and subsequent predictive modeling.
Summary
© Novak and Hoffman 2015 | http://postsocial.gwu.edu 22
The Ayasdi 3.0 software platform for topological data analysis (ayasdi.com) was used to construct all networks of the IFTTT data. The authors acknowledge the support of Devi Ramanan, Global Head – Product Collaborations, Ayasdi Inc., Menlo Park, CA IFTTT data were collected from a crawl during May - June 2014 and are used with permission of IFTTT.com, San Francisco, CA.