using tracer surveys to establish the co injection and ... using tracer surveys to establish the co2...
TRANSCRIPT

1
Using Tracer Surveys to Establish the CO2 Injection and Flow Profiles of CO2 in the GLSAU ROZ “Pilot Test” and “Study Area”
Theme Session #2: CO2 Flood Ops, Planning & Case HistoriesThe Permian Basin 12-County ROZ Study Results
Prepared for:2015 CO2 Conference Week: Midland, Texas
Prepared By: Vello A. Kuuskraa, PresidentTaylor MaloneBrett MurrayAdvanced Resources International, Inc.
December 10, 2015Midland, TX
Using Tracer Surveys to Establish the CO2 Injection and Flow Profiles of CO2 in the GLSAU ROZ “Pilot Test” and “Study Area”
| JAF2015_116. PPT | December 7, 2015 | www.adv-res.com
2
Using Tracer Surveys to Establish the CO2 Injection and Flow Profiles of CO2 in the GLSAU ROZ “Pilot Test” and “Study Area”
Presentation Outline
1 The GLSAU ROZ Field Research Project
2 Relationship of Well Completion Practices to CO2 Injection Profiles
3 CO2 Profiles in the ROZ “Study Area” and “Pilot Test”
4 Using CO2 Tracer Surveys to Improve Project Performance
5 Closing Thoughts and Comments
| JAF2015_116. PPT | December 7, 2015 | www.adv-res.com

3
Using Tracer Surveys to Establish the CO2 Injection and Flow Profiles of CO2 in the GLSAU ROZ “Pilot Test” and “Study Area”
1. The GLSAU ROZ Field Research Project
| JAF2015_116. PPT | December 7, 2015 | www.adv-res.com

4
Using Tracer Surveys to Establish the CO2 Injection and Flow Profiles of CO2 in the GLSAU ROZ “Pilot Test” and “Study Area”
The Goldsmith oil field is located in Ector County, West Texas and contains a series of “units”. The Goldsmith-Landreth San Andres Unit (GLSAU) within this field, formerly operated by Legado, is currently operated by KinderMorgan.
The GLSA Unit was the location of the joint industry/NETL field research project entitled: “Next-Generation CO2-EOR Technologies to
Optimize the Residual Oil Zone CO2 Flood at the Goldsmith-Landreth
Unit, Ector County, Texas.”
The project was conducted by a consortium, including the University of Texas of the Permian Basin (UTPB), KinderMorgan, Melzer Consulting, and Advanced Resources International.
Background
| JAF2015_116. PPT | December 7, 2015 | www.adv-res.com

5
Using Tracer Surveys to Establish the CO2 Injection and Flow Profiles of CO2 in the GLSAU ROZ “Pilot Test” and “Study Area”
Establishing CO2 Injection and Flow Profiles
| JAF2015_116. PPT | December 7, 2015 | www.adv-res.com
Key Research Questions. Some of the research questions examined by the GLSAU field research project were:
What portion of the injecting CO2 is entering and flooding the
MPZ, the ROZ, and/or other (unproductive) reservoir intervals?
How does the choice of well completion practices - - (1) open-
hole, (2) partially cased and perforated plus open-hole, (3)
cased/perforated dual interval, and (4) cased/perforated single
interval completions - - impact the placement and profile of
injected CO2?
What is the vertical profile of the injected CO2 within the ROZ?
What steps would be taken to improve the CO2 flood in the ROZ?

6
Using Tracer Surveys to Establish the CO2 Injection and Flow Profiles of CO2 in the GLSAU ROZ “Pilot Test” and “Study Area”
Location and Geologic Setting: Goldsmith Oil Field
| JAF2015_116. PPT | December 7, 2015 | www.adv-res.com
From: Robert F. Ward, Christopher G. St. C. Kendall, and Paul M. Harris, 1986,
“Upper Permian (Guadalupian) facies and their association with hydrocarbons;
Permian Basin, West Texas and New Mexico”, AAPG Bulletin, , v. 70, no. 3, p.
239-262.
Goldsmith Oil Field

7
Using Tracer Surveys to Establish the CO2 Injection and Flow Profiles of CO2 in the GLSAU ROZ “Pilot Test” and “Study Area”
Goldsmith Field Complex
| JAF2015_116. PPT | December 7, 2015 | www.adv-res.com
Source: Legado Resources, 2015
Discovered in 1934 Large anticlinal structure with
prominent highs to the north and south
Oil production of 780 MMBO mainly from Permian-age Grayburg, San Andres and Clearfork Fms.– Clearfork - 385 MMBO– San Andres - 365 MMBO– Others – 30 MMBO
The 6,166 acre Goldsmith-Landreth San Andres waterflood unit is outlined in yellow.

8
Using Tracer Surveys to Establish the CO2 Injection and Flow Profiles of CO2 in the GLSAU ROZ “Pilot Test” and “Study Area”
The remaining MPZ and ROZ oil resources in the 6,166 acre GLSA Unit are substantial, estimated at 308 million barrels of OIP.
The ROZ accounts for half of the oil in-place in the GLSA Unit. A portion (22 MM Bbls) of the oil in-place in the MPZ has saturated the gas cap at the top of the San Andres formation.
Goldsmith-Landreth San Andres Unit Oil In-Place
| JAF2015_116. PPT | December 7, 2015 | www.adv-res.com
MPZ ROZ Total
(MM Bbls) (MM Bbls) (MM Bbls)
OOIP 228 254(e)* 482
Cum. Recovery (74) (100)(e) (174)(e)
Remaining OIP 154 154 308
*Assumes 500 B/AF, 82 feet of net pay, and 6,166 acres for OOIP.

9
Using Tracer Surveys to Establish the CO2 Injection and Flow Profiles of CO2 in the GLSAU ROZ “Pilot Test” and “Study Area”
GLSAU ROZ “Study Area” and “Pilot Test”
| JAF2015_116. PPT | December 7, 2015 | www.adv-res.com
Source: Legado Resources, 2010.
Well Utility ($3.8 MM)
– 15 Deepen and Equip
– 7 Re-entry and Deepen
– 3 Drill Wells
Facilities ($4.5 MM)
– 3.5 Mile 8” CO2 Service Pipeline
– 700 HP Recycle Compressor (~3.2 MMCFD)
– Separation and Test Satellite
The ROZ field research project involved a larger 360 acre, nine pattern “Study Area” and a smaller confined 40 acre ROZ “Pilot Test” (Pattern #190). Considerable investment and well drilling accompanied this field research project.
10
Using Tracer Surveys to Establish the CO2 Injection and Flow Profiles of CO2 in the GLSAU ROZ “Pilot Test” and “Study Area”
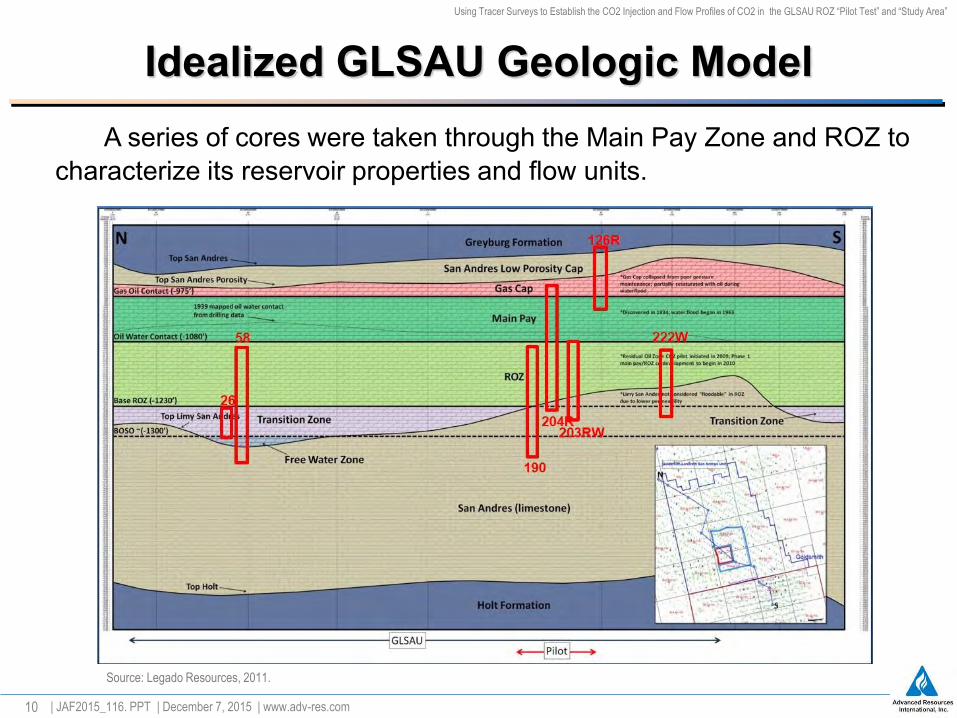
Idealized GLSAU Geologic Model
| JAF2015_116. PPT | December 7, 2015 | www.adv-res.com
Source: Legado Resources, 2011.
A series of cores were taken through the Main Pay Zone and ROZ to characterize its reservoir properties and flow units.

11
Using Tracer Surveys to Establish the CO2 Injection and Flow Profiles of CO2 in the GLSAU ROZ “Pilot Test” and “Study Area”
ROZ Reservoir Properties: Pattern #190
| JAF2015_116. PPT | December 7, 2015 | www.adv-res.com
Core and log analyses established 78 feet of porous net pay with substantial oil saturations of 38% to 45%.
Ft from Top of
ROZNet Pay
Porosity of Net
Pay
Oil Saturation
of Net PayNet Pay
Porosity of
Net Pay
Oil Saturation
of Net Pay
(feet) (%) (%) (feet) (%) (%)
10 7 8 45 4 11.1 48
20 5 7.8 50 7 9.7 40
30 9 10.0 53 10 14.3 41
40 6 10.9 43 6 8.9 41
50 2 6.7 46 6 10.0 35
60 6 7.2 47 6 8.1 45
70 5 8.6 45 5 8.7 46
80 8 9.3 40 2 7.7 45
90 8 11.2 56 5 7.4 44
100 10 15.7 44 8 7.7 30
110 10 17.3 32 10 10.4 34
10 12.7 27
Total 76 11.0 45 79 10.2 38
JAF2015_028.XLS
Well #190 Well #204R
12
Using Tracer Surveys to Establish the CO2 Injection and Flow Profiles of CO2 in the GLSAU ROZ “Pilot Test” and “Study Area”
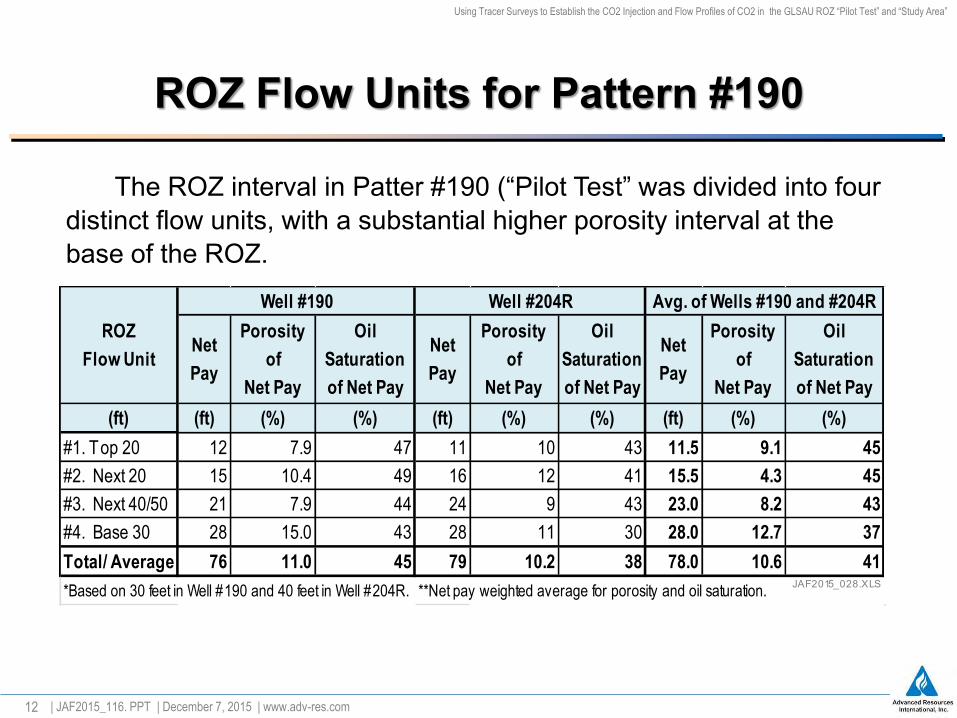
ROZ Flow Units for Pattern #190
| JAF2015_116. PPT | December 7, 2015 | www.adv-res.com
Net
Pay
Porosity
of
Net Pay
Oil
Saturation
of Net Pay
Net
Pay
Porosity
of
Net Pay
Oil
Saturation
of Net Pay
Net
Pay
Porosity
of
Net Pay
Oil
Saturation
of Net Pay
(ft) (ft) (%) (%) (ft) (%) (%) (ft) (%) (%)
#1. Top 20 12 7.9 47 11 10 43 11.5 9.1 45
#2. Next 20 15 10.4 49 16 12 41 15.5 4.3 45
#3. Next 40/50 21 7.9 44 24 9 43 23.0 8.2 43
#4. Base 30 28 15.0 43 28 11 30 28.0 12.7 37
Total/ Average 76 11.0 45 79 10.2 38 78.0 10.6 41
*Based on 30 feet in Well #190 and 40 feet in Well #204R. **Net pay weighted average for porosity and oil saturation. JAF2015_028.XLS
Avg. of Wells #190 and #204R
ROZ
Flow Unit
Well #190 Well #204R
The ROZ interval in Patter #190 (“Pilot Test” was divided into four distinct flow units, with a substantial higher porosity interval at the base of the ROZ.
13
Using Tracer Surveys to Establish the CO2 Injection and Flow Profiles of CO2 in the GLSAU ROZ “Pilot Test” and “Study Area”
2. Relationship of Well Completion Practices to CO2Injection and Flow Profiles
| JAF2015_116. PPT | December 7, 2015 | www.adv-res.com

14
Using Tracer Surveys to Establish the CO2 Injection and Flow Profiles of CO2 in the GLSAU ROZ “Pilot Test” and “Study Area”
In the GLSAU “Study Area”, 55 Bcf of CO2 has been injected into 16 CO2 injection wells with 35.8 Bcf entering the nine Study Area production patterns.
| JAF2015_116. PPT | December 7, 2015 | www.adv-res.com
GLSAU ROZ “Study Area”
“To what extent is the CO2 being injected into the formation processing the high resource concentration intervals of the reservoir?”
Source: Legado Resources, 2010.
Comparing the vertical distribution of CO2 and the vertical location of the remaining oil in-place in the MPZ and ROZ would provide valuable insights on the effectiveness of the CO2 flood.
Establishing CO2 Injection and Flow Profiles

15
Using Tracer Surveys to Establish the CO2 Injection and Flow Profiles of CO2 in the GLSAU ROZ “Pilot Test” and “Study Area”
As part of the research program, 42 CO2 injection profile surveys were conducted in the 16 CO2 injection well, 9 production pattern GLSAU “Study Area.”
Each of the 16 CO2 injection wells received at least one CO2 profile survey (consisting of tracers placed into the injected CO2 stream), with most wells receiving multiple CO2 surveys, including: CO2 profile surveys before and after well
remediation,
CO2 profile surveys before and after changes in well completions, and
Time-lapse CO2 profile surveys to track changes in the entry and location of CO2 with time.
The CO2 Tracer Program
| JAF2015_116. PPT | December 7, 2015 | www.adv-res.com
CO2
Injection
Well
Dates of CO2 Tracer Survey
Survey
#1
Survey
#2
Survey
#3
Survey
#4
Survey
#5
#152W 3/3/2011
#153 2/25/2011 9/12/2012 12/3/2012
#154 2/28/2011 11/8/2011 7/6/2011
#155W 9/26/2011 10/18/2012
#176W 4/22/2010 3/8/2011 9/13/2012 10/4/2012
#177 9/21/2011 12/1/2012
#178R 8/25/2011 9/10/2012
#179W 9/23/2011 10/20/2012
#202W 3/31/2010 2/18/2011 5/22/2012
#203 9/19/2011
#204R 8/24/2009 8/24/2009 2/26/2011 7/16/2012
#205W 5/7/2010 12/9/2011 12/6/2012
#224W 6/29/2011 8/31/2012
#225W 2/17/2011 6/28/2011 7/10/2012 9/4/2012 11/30/2012
#226W 6/20/2011 8/27/2012 12/6/2012
#227R 10/3/2011

16
Using Tracer Surveys to Establish the CO2 Injection and Flow Profiles of CO2 in the GLSAU ROZ “Pilot Test” and “Study Area”
With four distinct well completion practices applied in the 16 CO2injection wells, the GLSAU “Study Area” provides a rich data set for examining the impact of well completion practices on CO2 injection and its reservoir contact:
Seven wells with open-hole (OH) completions in both MPZ and ROZ,
Three wells partially perforated in the MPZ, with rest of the MPZ and ROZ OH,
Two wells cased and perforated in both the MPZ and ROZ, and
Seven wells cased and perforated in ROZ only.
| JAF2015_116. PPT | December 7, 2015 | www.adv-res.com
Impact of Well Completion Practices on CO2 Distribution
17
Using Tracer Surveys to Establish the CO2 Injection and Flow Profiles of CO2 in the GLSAU ROZ “Pilot Test” and “Study Area”
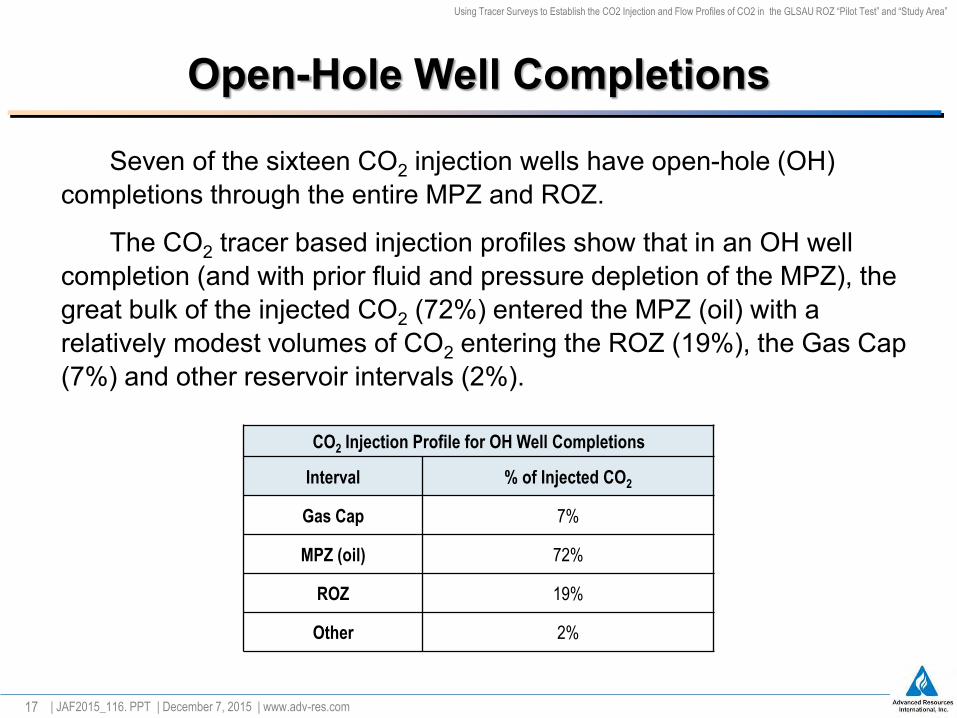
Seven of the sixteen CO2 injection wells have open-hole (OH) completions through the entire MPZ and ROZ.
The CO2 tracer based injection profiles show that in an OH well completion (and with prior fluid and pressure depletion of the MPZ), the great bulk of the injected CO2 (72%) entered the MPZ (oil) with a relatively modest volumes of CO2 entering the ROZ (19%), the Gas Cap (7%) and other reservoir intervals (2%).
Open-Hole Well Completions
| JAF2015_116. PPT | December 7, 2015 | www.adv-res.com
CO2 Injection Profile for OH Well Completions
Interval % of Injected CO2
Gas Cap 7%
MPZ (oil) 72%
ROZ 19%
Other 2%

18
Using Tracer Surveys to Establish the CO2 Injection and Flow Profiles of CO2 in the GLSAU ROZ “Pilot Test” and “Study Area”
The two figures illustrate the CO2 injection profiles for two open hole wells - - Well #202W and Well #205W.
CO2 Tracer Profiles in Open Hole MPZ and
ROZ CO2 Injection Well Completions
| JAF2015_116. PPT | December 7, 2015 | www.adv-res.com
Well #202W
Tracer Survey #1: Mar. 31, 2010
Well #205W
Tracer Survey #3: Dec. 6, 2012
In Well #202W, the injected CO2 is concentrated in the MPZ with very little entering the ROZ.
In Well #205W, the injected CO2 is concentrated in the middle and lower portions of the MPZ, with some CO2entering the top of the ROZ.
SA Main Pay
SA ROZ
SA Main Pay
SA ROZ

19
Using Tracer Surveys to Establish the CO2 Injection and Flow Profiles of CO2 in the GLSAU ROZ “Pilot Test” and “Study Area”
“Dual MPZ and ROZ” Well Completions. Two of the sixteen CO2injection wells are cased and perforated in both the MPZ and ROZ.
The CO2 tracer based injection profile shows that for “dual MPZ and ROZ” cased and perforated CO2 injection wells, the majority of the injected CO2 (77%) entered the MPZ with only a modest volumes entering the ROZ (17%).
Cased and Perforated “Dual MPZ and ROZ” CO2 Injection Wells
| JAF2015_116. PPT | December 7, 2015 | www.adv-res.com
CO2 Injection Profile for
Cased and Perforated “Dual MPZ and ROZ” Well Completions
Interval % of Injected CO2
Gas Cap 6%
MPZ (Oil) 77%
ROZ 17%
Other -

20
Using Tracer Surveys to Establish the CO2 Injection and Flow Profiles of CO2 in the GLSAU ROZ “Pilot Test” and “Study Area”
“ROZ Only” Well Completions. The CO2 injection profiles in cased and perforated “ROZ only” CO2 injection wells show:
The bulk of the CO2 (70%) is concentrated in the top 40 feet of the ROZ interval.
The middle 40 to 50 feet of the ROZ interval receives 25% of the CO2.
The bottom 30 feet of the ROZ interval receives 3% of the CO2, with 2% entering the MPZ (above the ROZ).
| JAF2015_116. PPT | December 7, 2015 | www.adv-res.com
Cased and Perforated “ROZ Only” CO2 Injection Well Completions
One of the “ROZ only” well completions (Well #204R) was subsequently perforated in the MPZ, providing additional information.
21
Using Tracer Surveys to Establish the CO2 Injection and Flow Profiles of CO2 in the GLSAU ROZ “Pilot Test” and “Study Area”
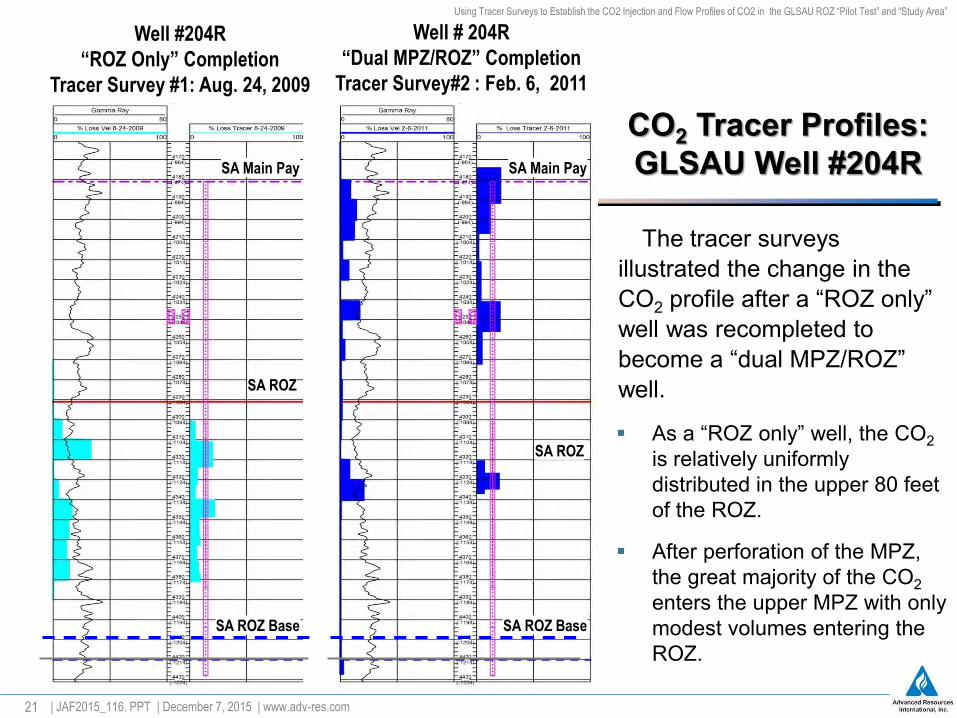
The tracer surveys illustrated the change in the CO2 profile after a “ROZ only” well was recompleted to become a “dual MPZ/ROZ” well.
CO2 Tracer Profiles: GLSAU Well #204R
| JAF2015_116. PPT | December 7, 2015 | www.adv-res.com
Well #204R
“ROZ Only” Completion
Tracer Survey #1: Aug. 24, 2009
Well # 204R
“Dual MPZ/ROZ” Completion
Tracer Survey#2 : Feb. 6, 2011
SA Main Pay
SA ROZ
SA ROZ Base
SA Main Pay
SA ROZ
SA ROZ Base
As a “ROZ only” well, the CO2is relatively uniformly distributed in the upper 80 feet of the ROZ.
After perforation of the MPZ, the great majority of the CO2enters the upper MPZ with only modest volumes entering the ROZ.

22
Using Tracer Surveys to Establish the CO2 Injection and Flow Profiles of CO2 in the GLSAU ROZ “Pilot Test” and “Study Area”
The CO2 profile surveys at GLSAU show that without direct control over the entry points of CO2 injection, such as by using a “ROZ only” well completion, the great bulk of the injected CO2 will enter and process the MPZ.
Impact of Well Completion Practices on CO2 Distribution
| JAF2015_116. PPT | December 7, 2015 | www.adv-res.com
Reservoir
Interval
Type of CO2 Injection Well Completion
OHPartial Perf
Plus OH
Dual
MPZ/ROZ
ROZ
Only
(% CO2) (% CO2) (% CO2) (% CO2)
Gas Cap 7% 25% 6% 0%
MPZ 72% 48% 77% 1%
ROZ 19% 20% 17% 99%
Other 2% 7% 0% 0%

23
Using Tracer Surveys to Establish the CO2 Injection and Flow Profiles of CO2 in the GLSAU ROZ “Pilot Test” and “Study Area”
3. CO2 Profiles in the ROZ “Study Area” and “Pilot Test”
| JAF2015_116. PPT | December 7, 2015 | www.adv-res.com

24
Using Tracer Surveys to Establish the CO2 Injection and Flow Profiles of CO2 in the GLSAU ROZ “Pilot Test” and “Study Area”
The ROZ “Study Area” and “Pilot Test”
| JAF2015_116. PPT | December 7, 2015 | www.adv-res.com
Source: Legado Resources, 2010.
The Pilot Test in Pattern #190, one of the nine patterns in the “Study Area”, involved 4 CO2 injection wells surrounding the #190 production well.

25
Using Tracer Surveys to Establish the CO2 Injection and Flow Profiles of CO2 in the GLSAU ROZ “Pilot Test” and “Study Area”
The GLSAU MPZ/ROZ project established a confined nine pattern “Study Area” to better understand how CO2 injection into the San Andres MPZ/ROZ interval would perform in the Goldsmith oil field.
A significant pre-CO2 flood investment was made in the “Study Area”, including deepening 22 existing wells, drilling 3 new wells, and installing field facilities.
The 16 CO2 injection wells in the “Study Area” have a variety of well completion practices, with open-hole (OH) being the most common.
CO2 injection started in mid- to late-2009, followed by expansion of CO2 injection into the “Study Area” in 2010 and 2011.
The ROZ “Study Area”
| JAF2015_116. PPT | December 7, 2015 | www.adv-res.com

26
Using Tracer Surveys to Establish the CO2 Injection and Flow Profiles of CO2 in the GLSAU ROZ “Pilot Test” and “Study Area”
The table below tabulates the volume of injected CO2 and the distribution of the injected CO2 for: (1) each of the nine production patterns in the GLSAU “Study Area” and (2) the distribution of the injected CO2 into the MPZ and ROZ.
CO2 Injection into the ROZ “Study Area” and “Pilot Test”
| JAF2015_116. PPT | December 7, 2015 | www.adv-res.com
CO2
Injection #163 #164 #165 #189 #190 #191 #211 #212 #213
2009 0.0 0.0 0.0 0.1 0.2 0.0 0.1 0.2 0.0 0.7
2010 0.3 0.6 0.3 0.6 1.3 0.7 0.4 0.9 0.5 5.6
2011 0.5 1.0 1.1 0.5 1.1 1.2 0.5 1.1 1.1 8.2
2012 0.6 1.0 1.1 0.7 1.2 1.3 0.6 1.3 1.0 8.8
2013 0.3 0.6 0.9 0.6 0.6 0.7 1.1 1.1 0.9 6.8
2014 0.4 0.4 0.5 0.6 0.7 0.6 0.9 0.7 0.7 5.5
Total 2.1 3.6 3.8 3.2 5.2 4.6 3.7 5.3 4.1 35.8
Gas Cap 13% 10% 8% 4% 2% 5% 4% 3% 5% 5%
MPZ 34% 28% 31% 34% 13% 14% 67% 37% 26% 30%
ROZ 42% 58% 45% 58% 84% 68% 29% 60% 68% 59%
NonPay 11% 3% 17% 3% 0% 13% 0% 1% 2% 5%
Gas Cap Volume 0.3 0.4 0.3 0.1 0.1 0.2 0.1 0.1 0.2 1.9
MPZ Volume 0.7 1.0 1.2 1.1 0.7 0.6 2.5 1.9 1.1 10.8
ROZ Volume 0.9 2.1 1.7 1.9 4.4 3.2 1.1 3.1 2.8 21.2
NonPay Volume 0.2 0.1 0.6 0.1 0.0 0.6 0.0 0.0 0.1 1.8
Total 2.1 3.6 3.8 3.2 5.2 4.6 3.7 5.3 4.1 35.8
JAF2015_028.XLS
TOTAL
(Bcf)
GLSAU "Study Area" CO2 Volume by Production Pattern (Bcf)
27
Using Tracer Surveys to Establish the CO2 Injection and Flow Profiles of CO2 in the GLSAU ROZ “Pilot Test” and “Study Area”
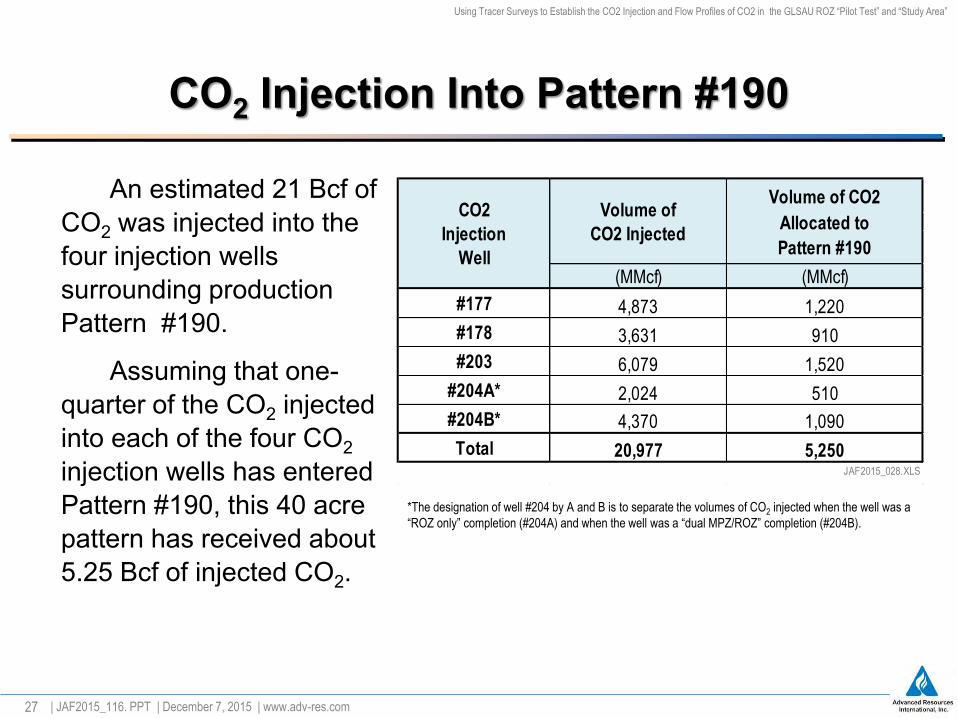
An estimated 21 Bcf of CO2 was injected into the four injection wells surrounding production Pattern #190.
Assuming that one-quarter of the CO2 injected into each of the four CO2injection wells has entered Pattern #190, this 40 acre pattern has received about 5.25 Bcf of injected CO2.
CO2 Injection Into Pattern #190
| JAF2015_116. PPT | December 7, 2015 | www.adv-res.com
*The designation of well #204 by A and B is to separate the volumes of CO2 injected when the well was a
“ROZ only” completion (#204A) and when the well was a “dual MPZ/ROZ” completion (#204B).
Volume of CO2
Allocated to
Pattern #190
(MMcf) (MMcf)
#177 4,873 1,220
#178 3,631 910
#203 6,079 1,520
#204A* 2,024 510
#204B* 4,370 1,090
Total 20,977 5,250JAF2015_028.XLS
CO2
Injection
Well
Volume of
CO2 Injected

28
Using Tracer Surveys to Establish the CO2 Injection and Flow Profiles of CO2 in the GLSAU ROZ “Pilot Test” and “Study Area”
The CO2 profile surveys for the four CO2 injection wells (#177, #178, #203 and #204A) show the distribution of CO2 within the ROZ interval in Pattern #190 during the time period when Well #204A was a “ROZ only” completion.
CO2 Profile for Pattern #190 During “ROZ Only” Well Completion
| JAF2015_116. PPT | December 7, 2015 | www.adv-res.com
The well perforations were primarily in the upper 60 to 80 feet of the ROZ.
(%) (MMcf) (%) (MMcf) (%) (MMcf) (%) (MMcf) (%) (MMcf)
MPZ 8% 100 10 - - - 3% 110
ROZ Feet From Top
0-20 52% 630 120 22% 330 11% 50 31% 1,130
20-40 40% 490 280 59% 880 21% 110 42% 1,760
40-60 - 280 8% 120 35% 180 11% 580
60-80 - 100 11% 160 29% 150 12% 410
80+ - 120 30 4% 20 1% 170
Total (ROZ) 1,120 900 1,520 510 4,050
JAF2015_028.XLS
Interval
Pattern
#190
Well #177 Well #178 Well #203 Well #204A
CO2 Entry CO2 Entry CO2 Entry CO2 Entry CO2 Entry
Perfs: (4,290'-4,350') Perfs: (4,300'-4,380') Perfs: (4,300'-4,370') Perfs: (4,300'-4,380')

29
Using Tracer Surveys to Establish the CO2 Injection and Flow Profiles of CO2 in the GLSAU ROZ “Pilot Test” and “Study Area”
CO2 Profile of Well #204 Before and After Perforation of MPZ
| JAF2015_116. PPT | December 7, 2015 | www.adv-res.com
After perforation of the MPZ in Well #204: the majority of the CO2(66%) entered the MPZ, and the 34% of the CO2 that entered the ROZ was confined to the top 40 feet of the ROZ.
Perfs: 4,300'-4,380' Perfs: 4,180'-4,300'
4,300'-4,380'
(%) (MMcf) (%) (MMcf)
MPZ - - 66% 720
ROZ (feet from top)
0-20 11% 50 4% 40
20-40 21% 110 30% 330
40-60 35% 180 - -
60-80 29% 150 - -
80+ 4% 20 - -
Total (ROZ) 100% 510 34% 370JAF2015_028.XLS
"ROZ Only" "Dual ROZ and MPZ"
CO2 Entry CO2 Entry
Interval

30
Using Tracer Surveys to Establish the CO2 Injection and Flow Profiles of CO2 in the GLSAU ROZ “Pilot Test” and “Study Area”
Even with the recompletion of CO2 injection well #204 into a “dual MPZ and ROZ” CO2 injector in early 2011, but with wells #177, #178 and #203 remaining as ROZ only injectors, the great bulk (4.42 Bcf) of the CO2 in Pattern #190 entered the ROZ.
CO2 Injection and Distribution in Pattern #190
| JAF2015_116. PPT | December 7, 2015 | www.adv-res.com
*The designation of well #204 by A and B is to separately determine the volumes of CO2 injected when the well was a ROZ only
completion (#204A) and when it was a joint MPZ/ROZ completion (#204B).
Injection CO2 Allocated to CO2 In CO2 In
Well Pattern #190 ROZ MPZ
(MMcf) (MMcf) (MMcf)
#177 1,220 1,120 100
#178 910 900 10
#203 1,520 1,520 -
#204A* 510 510 -
#204B* 1,090 370 720
Total 5,250 4,420 830JAF2015_028.XLS
31
Using Tracer Surveys to Establish the CO2 Injection and Flow Profiles of CO2 in the GLSAU ROZ “Pilot Test” and “Study Area”
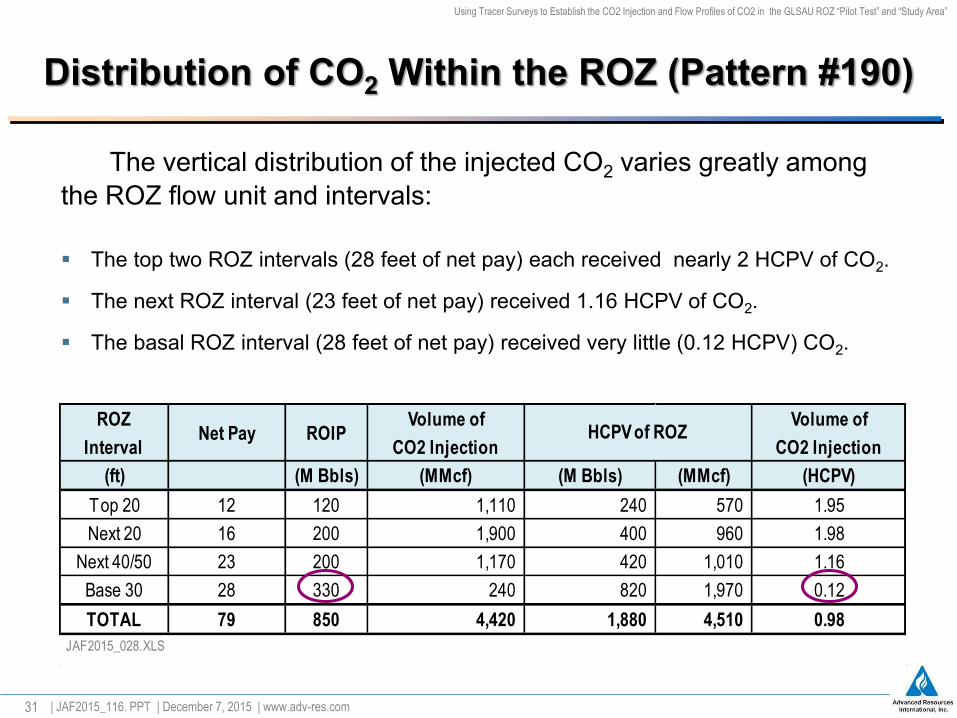
The vertical distribution of the injected CO2 varies greatly among the ROZ flow unit and intervals:
Distribution of CO2 Within the ROZ (Pattern #190)
| JAF2015_116. PPT | December 7, 2015 | www.adv-res.com
The top two ROZ intervals (28 feet of net pay) each received nearly 2 HCPV of CO2.
The next ROZ interval (23 feet of net pay) received 1.16 HCPV of CO2.
The basal ROZ interval (28 feet of net pay) received very little (0.12 HCPV) CO2.
ROZ
IntervalNet Pay ROIP
Volume of
CO2 Injection
Volume of
CO2 Injection
(ft) (M Bbls) (MMcf) (M Bbls) (MMcf) (HCPV)
Top 20 12 120 1,110 240 570 1.95
Next 20 16 200 1,900 400 960 1.98
Next 40/50 23 200 1,170 420 1,010 1.16
Base 30 28 330 240 820 1,970 0.12
TOTAL 79 850 4,420 1,880 4,510 0.98
JAF2015_028.XLS
HCPV of ROZ

32
Using Tracer Surveys to Establish the CO2 Injection and Flow Profiles of CO2 in the GLSAU ROZ “Pilot Test” and “Study Area”
Our modeling showed that flooding the MPZ, then plugging off the MPZ and flooding the ROZ (a sequential MPZ/ROZ flood) is more effective than injecting CO2 into dually completed MPZ and ROZ wells (a simultaneous MPZ/ROZ flood). The simultaneous MPZ/ROZ flood recovers 496,000 barrels of oil in 12 years,
equal to a recovery efficiency of 24% of OIP (14% of estimated OOIP).
The sequential MPZ/ROZ flood enables more of the CO2 to contact the ROZ, improving oil recovery by 166,000 barrels, thus increasing overall oil recovery from the MPZ and ROZ in Pattern #190 to 662,000 barrels, equal to 32% OIP (18% of estimated OOIP).
In addition, the sequential MPZ/ROZ flood reduces the net CO2/oil ratio to 10 Mcf/B from 13 Mcf/B for the simultaneous MPZ/ROZ flood.
| JAF2015_116. PPT | December 7, 2015 | www.adv-res.com
Modeling the Performance of the ROZ CO2-EOR Pilot
The actual CO2 injection experience in Pattern #190 is consistent with the results of CO2-PROPHET modeling. The CO2 tracer surveys in Pattern #190 showed that in dually completed CO2 injection wells, 83% of the CO2entered the GasCap MPZ with only 17% of the CO2 entering the ROZ.
33
Using Tracer Surveys to Establish the CO2 Injection and Flow Profiles of CO2 in the GLSAU ROZ “Pilot Test” and “Study Area”
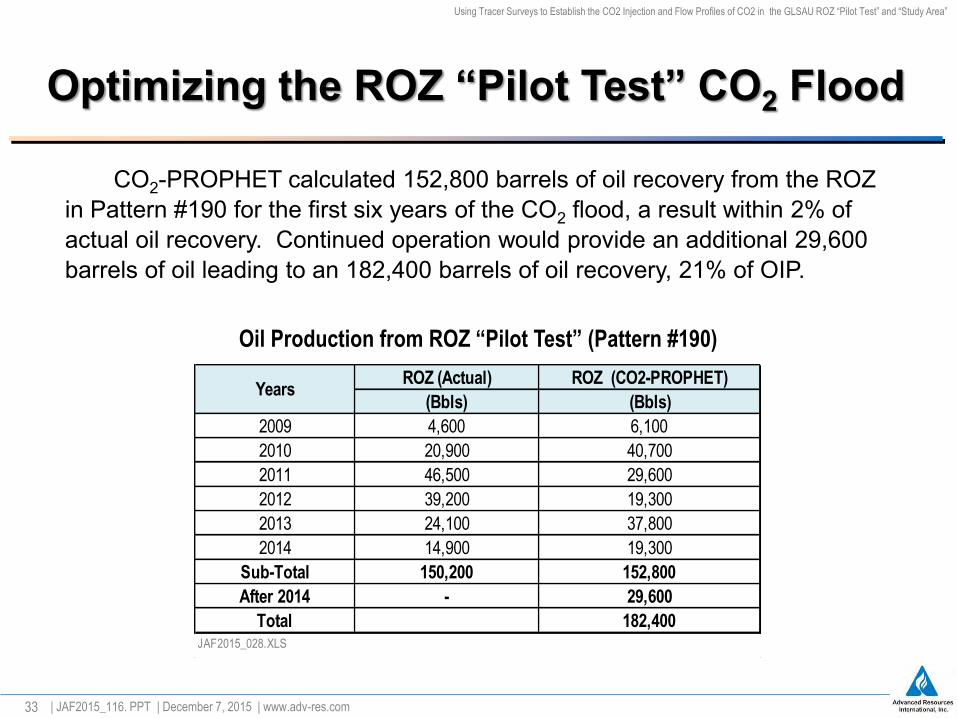
CO2-PROPHET calculated 152,800 barrels of oil recovery from the ROZ in Pattern #190 for the first six years of the CO2 flood, a result within 2% of actual oil recovery. Continued operation would provide an additional 29,600 barrels of oil leading to an 182,400 barrels of oil recovery, 21% of OIP.
| JAF2015_116. PPT | December 7, 2015 | www.adv-res.com
Optimizing the ROZ “Pilot Test” CO2 Flood
Oil Production from ROZ “Pilot Test” (Pattern #190)
ROZ (Actual) ROZ (CO2-PROPHET)
(Bbls) (Bbls)
2009 4,600 6,100
2010 20,900 40,700
2011 46,500 29,600
2012 39,200 19,300
2013 24,100 37,800
2014 14,900 19,300
Sub-Total 150,200 152,800
After 2014 - 29,600
Total 182,400JAF2015_028.XLS
Years
34
Using Tracer Surveys to Establish the CO2 Injection and Flow Profiles of CO2 in the GLSAU ROZ “Pilot Test” and “Study Area”
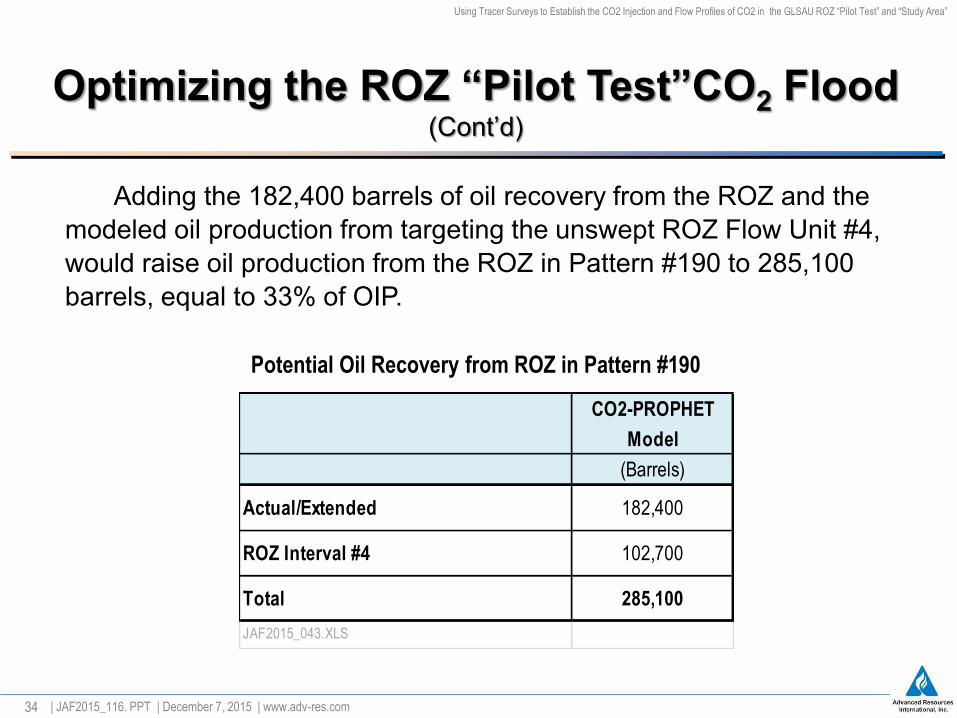
Adding the 182,400 barrels of oil recovery from the ROZ and the modeled oil production from targeting the unswept ROZ Flow Unit #4, would raise oil production from the ROZ in Pattern #190 to 285,100 barrels, equal to 33% of OIP.
| JAF2015_116. PPT | December 7, 2015 | www.adv-res.com
Optimizing the ROZ “Pilot Test”CO2 Flood (Cont’d)
Potential Oil Recovery from ROZ in Pattern #190
CO2-PROPHET
Model
(Barrels)
Actual/Extended 182,400
ROZ Interval #4 102,700
Total 285,100
JAF2015_043.XLS
35
Using Tracer Surveys to Establish the CO2 Injection and Flow Profiles of CO2 in the GLSAU ROZ “Pilot Test” and “Study Area”
The CO2 injection profiles in the ROZ “Pilot Test” and “Study Area” provided valuable information on the injection profiles and distribution of the CO2 in the San Andres ROZ at GLSAU.
Closing Thoughts
| JAF2015_116. PPT | December 7, 2015 | www.adv-res.com
1. CO2 injection control is essential in a dual MPZ/ROZ flood, otherwise (partially due to lower pressures in the depleted MPZ) the great bulk of the CO2 will enter the MPZ.
2. Even in the “ROZ only” flood, the injected CO2 preferentially floods the upper reservoir flow units (due to differences in fluid densities) with the lower reservoir flow units receiving limited CO2 contact.
3. Reservoir modeling of the ROZ “Pilot Test” indicates that an additional 12% recovery of OIP would be achieved with effective conformance control raising overall recovery efficiency to 33% of OIP while also improving the CO2/oil ratio.

36
Using Tracer Surveys to Establish the CO2 Injection and Flow Profiles of CO2 in the GLSAU ROZ “Pilot Test” and “Study Area”DRAFT June 11, 2015
Our assessment of the San Andres ROZ “fairway” resource in this twelve county area of the Permian Basin identified 191 billion barrels of oil in-place, with 135 billion barrels as “higher quality”.
In-Place San Andres ROZ “Fairway” Oil Resource
Yoakum Terry
DawsonGaines
San Andres ROZ “Fairways, Permian Basin
| JAF2015_116. PPT | December 7, 2015 | www.adv-res.com
Eight County Area of West Texas
Four-County Area of West Texas
County
In-Place Resource
Total Higher Quality* Lower Quality
(B Bbls) (B Bbls) (B Bbls)
Gaines 45.5 35.4 10.1
Yoakum 20.7 16.1 4.6
Terry 17.9 10.6 7.3
Dawson 27.8 14.6 13.2
Total 111.9 76.7 35.2
County
In-Place Resource
TotalHigher
Quality*
Lower
Quality
(B Bbls) (B Bbls) (B Bbls)
Andrews 37.1 31.2 5.9
Martin** 6.7 4.8 1.9
Winkler 9.5 8.0 1.5
Ector** 7.0 5.6 1.4
Three Southern Tier** 19.2 8.7 10.5
Midland *** - - -
Total 79.5 58.3 21.2*Porosity greater than 8% and oil saturation greater than 25%.
**Counties with Grayburg ROZ “Fairways” *** Grayburg ROZ Only

37
Using Tracer Surveys to Establish the CO2 Injection and Flow Profiles of CO2 in the GLSAU ROZ “Pilot Test” and “Study Area”DRAFT June 11, 2015
Size and Distribution of the In-Place San Andres ROZ “Fairway” Oil Resource
Source: Advanced Resources International, 2015.
Our assessment of the San Andres ROZ “fairway” resource in this four-county area of the Permian Basin West Texas identifies 112 billion barrels of oil in-place.
Much of this in-place resource (77 billion barrels) is “higher quality”, offering promise for commercially viable development with by-produce storage of CO2.
County
In-Place Resource
Total Higher Quality* Lower Quality**
(B Bbls) (B Bbls) (B Bbls)
Gaines 45.5 35.4 10.1
Yoakum 20.7 16.1 4.6
Terry 17.9 10.6 7.3
Dawson 27.8 14.6 13.2
Total 111.9 76.7 35.2
*Porosity greater than 8% and oil saturation greater than 25%.
**Porosity less than or equal to 8% and/or oil saturation less than or equal to 25%.
Four-County Area of West Texas
| JAF2015_116. PPT | December 7, 2015 | www.adv-res.com

38
Using Tracer Surveys to Establish the CO2 Injection and Flow Profiles of CO2 in the GLSAU ROZ “Pilot Test” and “Study Area”
Summary of San Andres ROZ “Fairway” Resources:
Eight Counties of the Permian Basin
| JAF2015_116. PPT | December 7, 2015 | www.adv-res.com
Higher Quality Lower Quality Total
County ROZ Resources ROZ Resources ROZ Resources
(Billion Bbls) (Billion Bbls) (Billion Bbls)
Andrews 31.23 5.90 37.13
Martin* 4.80 1.94 6.74
Winkler 7.98 1.49 9.47
Ector* 5.55 1.40 6.95
Three Southern Tier* 8.67 10.51 19.18
Midland (Grayburg ROZ Only)* - - -
Total (San Andres ROZ) 58.23 21.24 79.47
JAF2015_037.XLSCounties with Grayburg ROZ “fairways”.

39
Using Tracer Surveys to Establish the CO2 Injection and Flow Profiles of CO2 in the GLSAU ROZ “Pilot Test” and “Study Area”
Office LocationsWashington, DC4501 Fairfax Drive, Suite 910Arlington, VA 22203Phone: (703) 528-8420
Houston, Texas11931 Wickchester Ln., Suite 200 Houston, TX 77043-4574 Phone: (281) 558-9200
Cincinnati, Ohio1282 Secretariat CourtBatavia, OH 45103Phone: (513) 460-0360
AdvancedResources
Internationalwww.adv-res.com
| JAF2015_116. PPT | December 7, 2015 | www.adv-res.com