using transient shear rheology to determine …approach to determining material parameters by...
TRANSCRIPT

Ffloflaa“spFcrla
I
trDai
a
©J
Using transient shear rheology to determine materialparameters in fiber suspension theory
Aaron P. R. Eberle and Donald G. Bairda)
Department of Chemical Engineering, Virginia Tech, Blacksburg, Virginia 24061
Peter Wapperom
Department of Mathematics, Virginia Tech, Blacksburg, Virginia 24061
Gregorio M. Vélez-García
Department of Macromolecular Science and Engineering, Virginia Tech,Blacksburg, Virginia 24061
(Received 1 September 2008; final revision received 17 February 2009�
Synopsis
iber suspension theory model parameters for use in the simulation of fiber orientation in complexows are, in general, either calculated from theory or fit to experimentally determined fiberrientation generated in processing flows. Transient stress growth measurements in startup of shearow and flow reversal in the shear rate range, �̇=1–10 s−1, were performed on a commerciallyvailable short glass fiber-filled polybutylene terephthalate using a novel “donut-shaped” sample incone-and-plate geometry. Predictions using the Folgar–Tucker model for fiber orientation, with a
slip” factor, combined with the Lipscomb model for stress were fit to the transient stresses at thetartup of shear flow. Model parameters determined by fitting at �̇=6 s−1 allowed for reasonableredictions of the transient stresses in flow reversal experiments at all the shear rates tested.urthermore, fiber orientation model parameters determined by fitting the transient stresses wereompared to the experimentally determined evolution of fiber orientation in startup of flow. Theesults suggested that fitting model predictions to the stress response in well-defined flows couldead to unambiguous model parameters provided the fiber orientation as a function of time or straint some shear rate was known. © 2009 The Society of Rheology. �DOI: 10.1122/1.3099314�
. INTRODUCTION
Parts made from short glass fiber composites are typically manufactured using injec-ion or compression molding where the composite melt is forced into a mold cavity whichesults in the formation of a layered fiber microstructure �Advani and Sozer �2003��.epending on the complexity of the part and the mold filling process, local variations can
rise in the fiber orientation which can severely affect the mechanical, thermal, andnsulative properties of the part. As a result, it is highly desirable to be able to predict the
�
Author to whom correspondence should be addressed; electronic mail: [email protected]2009 by The Society of Rheology, Inc.685. Rheol. 53�3�, 685-705 May/June �2009� 0148-6055/2009/53�3�/685/21/$27.00

flm
ccos�ntpi
netaCJvCtbnhab
�pBftFht
stebaatopu�ts
686 EBERLE et al.
ow behavior of the composite fluid in connection to the fiber orientation to optimizeold design and processing conditions to maximize the part performance.The simulation of the flow of fiber suspensions has been the subject of many publi-
ations over the past three decades. Subsequently, we give a brief introduction to theoncepts relevant to this work, but for concept specifics the reader is referred to the worksf Lipscomb et al. �1988�, Bay and Tucker �1992a�, and Chung and Kwon �2002b� forimulations in complex flow field geometries and Dinh and Armstrong �1984�, Petrie1999�, and Sepehr et al. �2004a� for predictions in simple flow field geometries. We alsoote that fiber suspension theory has two components: an equation describing the evolu-ion of fiber orientation and an equation for stress. For some cases, such as dilute sus-ensions, the two equations may be combined to form a constitutive equation. However,n most situations they are solved separately and, therefore, are discussed independently.
The theoretical framework for the evolution of fiber orientation begins with the pio-eering work of Jeffery �1922�. Jeffery mathematically described the motion of a singlellipsoidal particle suspended in a Newtonian fluid subjected to a Stokes flow field. Thisheory is easily extended to blunt-ended particles, such as fibers, using an equivalentspect ratio of which various empirical relations have been suggested �Bretherton �1962�;ox �1971��. For nondilute fiber suspensions Folgar and Tucker �1984� included a term to
effery’s equation similar in formulation to isotropic diffusivity but proportional to theelocity gradient to account for fiber interaction influencing the degree of fiber alignment.urrently, there is no theoretical approach to calculate the interaction coefficient, CI, in
he Folgar–Tucker �F-T� model. For complex flow simulations, CI has been determinedy fitting simulation results to experimentally determined fiber orientation, which mayot be a practical or efficient approach �Bay and Tucker �1992b��. Empirical relationsave been proposed by Bay �1991� and Phan-Thien et al. �2002� which indicate that CI isfunction of fiber volume fraction and aspect ratio. However, these relations have not
een confirmed.The contribution from the fiber to the bulk extra stress for dilute suspensions ��
ar−2, where � is the volume fraction� arises from the hydrodynamic drag of the sus-
ending fluid over the fiber and is well established �Hand �1961�; Giesekus �1962�;atchelor �1970��. In nondilute suspensions interparticle hydrodynamic and contact
orces can significantly influence the dynamic behavior of the fiber and the stresses. Theheories of Batchelor �1971�, Evans �1975�, Dinh and Armstrong �1984�, and Shaqfeh andredrickson �1990� attempt to account for enhanced stress as a result of interparticleydrodynamic interaction. The most commonly used theories in complex flow simula-ions are that of Dinh and Armstrong �1984� and Shaqfeh and Fredrickson �1990�.
Sepehr et al. �2004a, 2004b� found the best agreement between simulations of thetress growth functions and experimental results for a nondilute suspension occur whenhe model parameters were empirically adjusted to fit the results and when a slip param-ter was added to the F-T model �F-T-S�. However, the feasibility of determining unam-iguous material parameters by fitting was not discussed. Wang et al. �2008� discussed anpproach to determining material parameters by fitting to the transient rheology, but theuthors were unable to fit both the transient shear stress growth coefficient and theransient first normal stress difference simultaneously. As a result, the predictions werenly fit to the transient shear stress growth coefficient without discussion of whether thearameters were unambiguous. Furthermore, we note that the stress growth experimentssed in the comparison by Sepehr et al. �2004a, 2004b� and for fitting by Wang et al.2008� were performed in a rotational rheometer with parallel disk geometry in whichhere is a varying shear rate from the center of the plates to the rim. Recent results have
hown that the inhomogeneous shear field in the parallel disk geometry induces excessive
fiht2ebw
Irtec�fior
fssscdLptw3dawgpui
I
A
atm
687FITTING FIBER THEORY MODEL PARAMETERS
ber-fiber interaction in concentrated fiber suspensions �Eberle et al. �2008a��. This canave a severe effect on the magnitude of the stress growth overshoot peak and width ofhe overshoot. Also, in the model predictions presented by both Sepehr et al. �2004a,004b� and Wang et al. �2008� the initial fiber orientation was assumed random. How-ver, recent results clearly show that the initial fiber orientation in rheometer samples cane closer to a planar random orientation as a result of the sample deformation historyhich can have a large impact on the transient predictions �Eberle �2008��.The addition of the slip parameter to the F-T model renders the equation nonobjective.
n other words, the solutions of the equation may be dependent on the external frame ofeference �see, for example, Tanner �2000��. However, the physical aspects of the predic-ions, in the case of simple shear flow, are still acceptable and have shown to agree withxperimental rheological and simple shear injection molding data �Huynh �2001��. Re-ently, Wang et al. �2008� proposed an objective model called the reduced-strain closureRSC� model, which has an analogous purpose of the F-T-S model to reduce the rate ofber reorientation. Similar to the F-T-S the RSC model is phenomenological, but focusesn the concept of reducing the growth rates of the eigenvalues without modifying theotation rates of the eigenvectors.
For this work the F-T-S model is chosen and not the RSC because of the simpleormulation and because only simple shear flow is considered. In a previous paper wehowed the F-T-S can be used to accurately describe the evolution of fiber orientation inimple shear flow �Eberle �2008�; Eberle et al. �2008b��. However, we do note that theame concepts of determining material parameters via fitting transient rheological dataould apply to the RSC model. The objective of this paper is to define an approach foretermining unambiguous model parameters for the F-T-S model combined with theipscomb stress equation by fitting model predictions to transient shear rheological ex-eriments performed using a donut sample in a cone-and-plate �CP� rheometer. In par-icular, stress growth measurements in the startup of simple shear flow and flow reversalere performed on a 30 wt % short glass fiber-filled polybutylene terephthalate �PBT-0� at various shear rates. The transient rheology is discussed with the intention ofetermining at which shear rate the rheological material functions should be measurednd then fit. The Lipscomb model combined with the F-T-S model for fiber orientation,ith experimentally determined initial conditions for fiber orientation, is fit to the stressrowth behavior at a shear rate of 6 s−1. The same model parameters are later used toredict the stress growth behavior at other shear rates. The equation for fiber orientationsing the fit model parameters is directly compared to measurements of fiber orientationn startup of flow.
I. THEORY
. Orientation tensors
The use of orientation tensors has become the conventional method for describing theverage orientation state of a distribution of fibers. The second- and fourth-order orien-ation tensors, A and A4, respectively, have been defined as the second and fourth mo-ents of the orientation distribution function, ��u , t� �Advani and Tucker �1987��
A�t� = uu��u,t�du , �1�
�
wttn
B
epo
wa+aoidfit
watis
Epw
w=sS
688 EBERLE et al.
A4�t� =� uuuu��u,t�du , �2�
here u is a unit vector parallel to the backbone of each fiber. A is symmetric and has arace equal to 1. For a completely random orientation state A=1 /3 I, where I is the unityensor and in the limit that all the fibers are perfectly aligned in the x1 direction the onlyonzero component of A is A11=1.
. Orientation evolution equation
The common approach to predicting the motion of a single fiber begins with Jeffery’squation derived for non-Brownian axisymmetric particles �Jeffery �1922��. For a largeopulation of similar noninteracting particles whose orientation is represented with therientation tensors, the time evolution of A can be written as �Advani and Tucker �1987��
DA
Dt= �W · A − A · W� + B�D · A + A · D − 2D:A4� , �3�
here DA /Dt is the material derivative, B is a constant that depends on the aspect ratio,
r, of the particle B= �ar2−1� / �ar
2+1�, W= ���v�t−�v� /2 is the vorticity, D= ��v��v�t� /2 is the rate of strain tensor, and �v=�v j /�xi. For fibers, it is common tossume the particle’s aspect ratio approaches infinity, in which case B→1. The time ratef change of A in Eq. �3� is governed purely by the macroscopic flow field and does notnclude Brownian motion effects, gravity, or particle interactions, i.e., hydrodynamic orirect contact. For nondilute suspensions, Folgar and Tucker �1984� hypothesized thatber interaction acted similarly to isotropic diffusion and as a result added a diffusionlike
erm to Jeffery’s equation and can be written as
DA
Dt= �W · A − A · W� + �D · A + A · D − 2D:A4� + 2CI�̇�I − 3A� , �4�
here CI is the interaction coefficient and �̇ is the scalar magnitude of D. The F-T modelllows for the control of the steady state fiber orientation through the magnitude of CI buthe rate of fiber reorientation is still dominated by the flow field for typical values of CI
n the range of 0.016–0.0001 �Bay �1991��. Bay �1991� developed an empirical expres-ion for concentrated suspensions ���ar
−1�,
CI = 0.0184 exp�− 0.7148�ar� . �5�
quation �5� predicts that CI decreases for increasing �ar, a result explained by a pro-osed caging effect. Phan-Thien et al. �2002� proposed a model in which CI increasesith increasing �ar as
CI = M�1.0 − exp�− N�ar�� , �6�
here M and N are constants. Phan-Thien et al. �2002� determined M =0.03 and N0.224 by fitting Eq. �6� to experimental data by Folgar and Tucker �1984� for various
uspensions of nylon fibers subject to simple shear flow. The slip parameter proposed by
epehr et al. �2004a� can be incorporated into the F-T model as follows:
wpp
tp��oincpe
C
tL
wmtEhstcUf
w
cc
a
689FITTING FIBER THEORY MODEL PARAMETERS
DA
Dt= ���W · A − A · W� + �D · A + A · D − 2D:A4� + 2CI�̇�I − 3A�� , �7�
here the slip coefficient, �, is some value between 0 and 1. As a note, the slip parameterroposed by Sepehr et al. �2004a� is essentially equivalent to the strain reduction factorroposed by Huynh �2001� used in complex flow simulations.
To solve Eqs. �4� and �7� a closure approximation is needed to express the fourth-orderensor A4 in terms of the second-order tensor. Many closure approximations have beenroposed including the quadratic �Doi and Edwards �1988��, hybrid �Advani and Tucker1987��, eigenvalue-based �Cintra and Tucker �1995��, and invariant-based optimal fittedChung and Kwon �2002a��. A good review of their accuracy can be found in the worksf Advani and Tucker �1990� and Chung and Kwon �2002b�. For this work we use thenvariant-based orthotropic fitted �IBOF� closure approximation with the fifth order poly-omial coefficients for its high degree of accuracy compared to the quadratic and hybridlosures and computational efficiency compared to the eigenvalue-based closures. A com-lete description of the IBOF, its accuracy and polynomial coefficients, can be foundlsewhere �Chung and Kwon �2002b��.
. Stress equation
A general expression for high aspect ratio non-Brownian particles can be derived fromhe theories of Hand �1961� and Giesekus �1962� and is commonly referred to as theipscomb model �Lipscomb et al. �1988�; Sepehr et al. �2004b��
� = − pI + 2�sD + 2c1��sD + 2��sND:A4, �8�
here � is the total stress, p is pressure, �s is the suspending medium viscosity, c1 is aaterial constant, and N is a dimensionless parameter that represents the coupling be-
ween hydrodynamic stress and fiber orientation. The third term on the right hand side ofq. �8� is the viscosity enhancement as a result of the fibers and is similar to the en-ancement term for a dilute suspension of spheres proposed by Einstein �1906�. Lip-comb et al. �1988� gave c1 to be equal to 2 for the limiting case of ar→�, but we chooseo use it as a fitting parameter. The fourth term on the right hand side of Eq. �8� is theontribution to stress from the hydrodynamic drag of the fluid as it flows past a particle.sing Eq. �8� the shear stress growth coefficient, �+, and the first normal stress growth
unction, N1+, can be written as
�+ = 12/�̇ = �s + c1�s� + 2�s�NA1212, �9�
N1+ = 2��s�̇N�A1211 − A1222� , �10�
here the fourth-order tensor components are a function of time.Subsequently, we define various theories for calculating the material coefficient N for
omparison to those which were determined by fitting. For dilute suspensions ��ar−2� N
an be calculated from the theories of Batchelor �1971�,
N =ar
2
3 ln�2ar�f���, f��� =
1 + 0.64�
1 − 1.5�+ 1.659�2, � = �ln�2ar��−1, �11�
nd Lipscomb et al. �1988�,

EtA
woSs
wfiotp
I
A
p�poobAtbpgoti
Pla=dwlfT
690 EBERLE et al.
N =ar
2
2 ln ar. �12�
quation �8� can also be adapted to semidilute theories �ar−2�ar
−1� by replacing N forhe dilute case to one that accounts for interparticle hydrodynamics such as the Dinh andrmstrong �1984� model
N =ar
2
3 ln�2h/D�, in which h = � �nL2�−1 random
�nL�−1/2 aligned,� �13�
here h is the interparticle spacing given for a completely random and aligned fiberrientation, D is the fiber diameter, and n is the number of fibers per unit volume.haqfeh and Fredrickson �1990� derived an expression for dilute and semidilute suspen-ions
N =4ar
2
3� 1
ln�1/�� + ln ln�1/�� + C�� , �14�
here C� is a constant which for randomly oriented fibers is C�=−0.66 and for alignedbers C�=0.16. As a note, semidilute suspension theories typically neglect the third termn the right side of the equal sign in Eq. �8�. As a result, when the fibers completely alignhemselves in the flow direction, as predicted by Jeffery’s equation with �=1, N1
+ ap-roaches zero and �+ approaches the suspending medium viscosity, �.
II. EXPERIMENTAL
. Materials
It was of a primary importance to the practical relevance of this work to use a com-osite fluid of industrial significance. In keeping with this material objective, a 30 wt %volume fraction, �=0.1766� short glass fiber-filled polybutylene terephthalate �PBT-30�,rovided by GE Plastics under the trade name Valox 420, was used. To examine the effectf fiber concentration on the rheological behavior, PBT-30 was diluted to concentrationsf 4.07, 8.42, 15, 20, and 25 wt %. Compounding was accomplished by passing drylended amounts of PBT-30 and the neat matrix through the extruder section of an Arburglrounder 221-55-250 injection molder at an 200 rpm. To maintain a uniform shear and
hermal history between concentrations the PBT-30 was also passed through the extruderefore testing. The extrudate was collected before entering the runner of the mold andelletized. The pellets were then compression molded for rheological testing to a CPeometry sample at 260 °C. Precautions were taken to minimize the degree of thermo-xidative degradation of the polybutylene terephthalate �PBT� matrix by drying the ma-erials at 120 °C for a minimum of 12 h in a vacuum oven at a pressure smaller than 0.4n Hg before sample extrusion, molding, or testing.
To characterize the glass fiber within the suspension, pyrolysis was performed on theBT-30 pellets at 500 °C after extrusion to separate the fibers from the matrix. The fiber
ength was determined by randomly measuring the length of 1000 fibers. The numberverage and weight average fiber length of PBT-30 was found to be Ln=0.3640 and Lw
0.4388 mm, respectively. The same fiber length measurement was performed on all theiluted concentrations and was found to be slightly higher for these concentrations andithin 0.3640 Ln 0.3740 and 0.4388 Lw 0.4578 mm. In general, the average fiber
ength increased slightly for decreasing fiber concentration and is attributed to attritionrom abrasive contact between fibers, which is more prevalent at higher concentrations.
he fiber diameter was determined directly from images taken of fiber cross sections
ufiP
B
tafP0trcdea2
seWcflaaf
wt
691FITTING FIBER THEORY MODEL PARAMETERS
sing a confocal laser microscope, discussed later, and the average diameter of 1000bers was found to be D=12.9 �m. This relates to a number average aspect ratio forBT-30 of ar�28.2.
. Rheological measurements
All rheological measurements were performed on a Rheometrics Mechanical Spec-rometer �RMS-800� at 260 °C. To minimize the degree of thermo-oxidative degradation,ll experiments were performed in a nitrogen environment with a freshly loaded pre-ormed sample. Rheological measurements on the PBT matrix and the glass fiber-filledBT were performed with 25 and 50 mm CP fixtures, respectively, both of which had a.1 rad cone angle. For the fiber-filled PBT, donut-shaped samples were used to eliminatehe interaction of the fibers with the plate walls near the center of the plates where theheometer gap is small compared to the fiber length. The dimensions of the donut samplean be seen in Fig. 1 before sample loading. A detailed discussion of the donut sampleesign and testing can be found elsewhere �Eberle �2008�; Eberle et al. �2008a��. Afterach experiment the void space at the center was measured to account for sample loadings the gap was adjusted to proper dimensions. The hole diameter varied slightly,3.8�0.5 mm, and was accounted for when calculating the stresses for each run.
In this work we are primarily interested in the transient rheological behavior at thetartup of shear flow and flow reversal following startup of flow. In the flow reversalxperiments a sample was subject to startup of flow in the clockwise �CW� direction.hen the stresses reached a steady state the flow was removed and reapplied in the
ounter clockwise direction �CCW� at the same shear rate. The quiescent period betweenows in the CW and CCW directions was roughly 10 s. The experiments were limited tomaximum shear rate of �̇=10 s−1 due to transducer overload. For the measurements, �+
nd N1+ were calculated as functions of torque, M�t�, and normal force, F�t�, from the
ollowing equations adapted from Macosko �1994�:
�+�t� = 12+ /�̇ =
3M�t�2��̇
�Ro3 − Ri
3�−1, �15�
N1+�t� =
2Fz�t��
�Ro2 − Ri
2�−1, �16�
here Ro and Ri are the outer and inner radii of the sample, respectively. The experimen-+ +
FIG. 1. Schematic drawing and cross-sectional profile of the donut sample.
al reproducibility was found to be �5% for � and �7% for N1.

C
i�=qsp�wpxfdos
fi5�imdmcctccmeb
fit
Fdop
692 EBERLE et al.
. Measurement of fiber orientation
The flow-induced fiber microstructure within the rheological samples was character-zed using confocal laser microscopy in a similar approach to that proposed by Lee et al.2002�. Donut samples composed of PBT-30 were deformed using the RMS-800 at �̇1 s−1 for a specified amount of time. To prepare the rheometer samples for imaging,uartered sections were imbedded in epoxy to aid in sample integrity. The embeddedamples were then sanded to a specific plane depth and polished to a final abrasivearticle size of 0.3 �m aluminum oxide �Al2O3� following standardized techniquesSawyer and Grubb �1995��. A schematic drawing of the polished planes and locationshere the images were taken can be found in Fig. 2. Each sample was imaged at twolanes: perpendicular to the neutral direction x3 and perpendicular to the flow direction
1. A series of images was taken at three locations at distances of 4.0, 6.25, and 8.5 mmrom the outer edge denoted by PD-1, PD-2, and PD-3, respectively. Images in the neutralirection were only taken at one location denoted by PD-4 at a depth of 4.0 mm from theuter edge. PD-1 and PD-4 can be considered mutually perpendicular planes of differentections of the donut sample.
Imaging was performed using a Zeiss LSM510 confocal laser scanning microscopetted with a 40� water immersion objective lens and a laser excitation wavelength of43 nm. The dimensions of each image were 230�230 �m with a resolution of 10241024 pixels. For each sample, sequential images were taken from the bottom to the top
n the direction of the velocity gradient and at two planes of depth. For PBT-30 theaximum penetration was found to be 8 �m. This allowed for a three-dimensional �3D�
escription of the fiber orientation and removed the ambiguity associated with reflectionicroscopy techniques such as the Leeds method �Hine et al. �1993��. In the images, the
ross section of each fiber appeared as circles or ellipselike shapes. To improve theontrast between the fibers and the matrix the images were imported into power point,raced by hand, and converted to a binary image. A computer program was written andombined with image analysis software in MATLAB that measured the position of theenter of mass, the major and minor axes, and local angle between the image axis and theajor axis of the ellipse. The components of u for each fiber were determined from the
lliptical “footprint” at two cross-sectional planes. A full description of this technique cane found elsewhere �Eberle �2008�; Eberle et al. �2008b��.
In total, the fiber orientation was measured for 11 samples which corresponded to theollowing strains: �=0, 4, 7, 9, 12, 25, 50, 100, and 200. Strains 4, 25, 100, and 200 weremaged at locations PD-1 and PD-4 all other strains were imaged at locations PD-1
IG. 2. Schematic drawing of the polished and imaged planes perpendicular to the neutral, r, and flow, �,irections. Images were taken at four positions: three positions perpendicular to the flow direction at a distancef 4.0, 6.25, and 8.5 mm from the outer edge denoted by PD-1, PD-2, and PD-3, respectively, and one positionerpendicular to the neutral direction denoted by PD-4.
hrough PD-4 as depicted in Fig. 2. Strain 0 relates to the initial fiber orientation. In

atsc
w
wt�iba
I
mtdfNPcWrrbspa
A
1
tfststN
693FITTING FIBER THEORY MODEL PARAMETERS
ddition, �=9 was repeated to determine the experimental reproducibility of the analysis;he maximum error was found to be �12.4% for Aij. The total number of fiber crossections counted for each sample varied depending on the strain and number of positionsounted but was on the order of 1000.
With knowledge of the components of the vector u for each fiber, the tensors A and A4
ere determined as follows:
Aij = �uiuj�nFn
Fn
, Fn =Mn
mn, �17�
Aijkl = �uiujukul�nFn
Fn
, �18�
here Mn and mn are the major and minor axes, respectively, of the elliptical footprint ofhe nth fiber cross section and Fn is a weighting factor for the nth fiber �Bay and Tucker1992c��. The weighting function is based on the probability of a two-dimensional planentersecting a fiber. Meaning, a fiber aligned perpendicular to the plane is more likely toe severed than one that is aligned parallel. Using the weighting function, the larger thespect ratio of the ellipse, the more that fiber is weighted.
V. RESULTS AND DISCUSSION
The objective of this paper is to present an approach for determining unambiguousaterial parameters for fiber suspension theory by way of fitting model predictions to
ransient shear flow rheology coupled with knowledge of the initial fiber orientation. Aominant assumption of the theory is that the suspending medium is Newtonian, there-ore, we first present the linear viscoelastic behavior of the neat PBT to confirm theewtonian-type behavior. In addition, the first normal stress difference N1 of the neatBT is presented in conjunction with the PBT composite fluids containing various con-entrations of short glass fiber to aid in the discussion of the contributing factors to N1.e then present experimentally determined values of the initial fiber orientation of the
heometer samples as it is necessary to have this knowledge to accurately fit transientheological data. This is followed by a thorough description of the transient stress growthehavior of PBT-30 following startup of flow and in flow reversal experiments at varioushear rates in an attempt to determine an optimum shear rate for fitting. Finally, weresent the simulation of transient shear flow at other shear rates and shear flow reversalnd discuss model fitting.
. Rheology
. Linear viscoelastic behavior of neat PBT
The linear viscoelastic behavior of the neat suspending medium including the magni-ude of the complex viscosity, ��, the storage modulus, G�, and loss modulus G� vsrequency, �, can be seen in Fig. 3. The measurement was performed at 3% strain; atrain sweep at a frequency �=100 rad /s confirmed that 3% was in the linear viscoelas-ic regime. The suspending medium did exhibit a storage modulus but its magnitude wasmall relative to the loss modulus and �� showed little dependence on frequency overhe range tested �0.1–100 rad/s�. Hence, the suspending medium behaved similar to a
ewtonian fluid.
2
vessTaittdts
F
694 EBERLE et al.
. First normal stress difference, N1
Many researchers have reported nonzero steady state first normal stress difference, N1,alues for fluids containing fibers which are believed not to be an enhancement to thelastic behavior of the suspending medium �Zirnsak et al. �1994��. To aid in the discus-ion of the contributing factors to the first normal stress growth function �N1
+�, the steadytate first normal stress difference, N1, is plotted as a function of concentration in Fig. 4.he neat PBT exhibited a small N1 of roughly 100 Pa at �̇=1 s−1. Interestingly, theddition of 4.07 wt % fiber caused a dramatic reduction in N1 to �2.18 Pa. This behav-or coincides with the literature in that the addition of fiber seems to dramatically impedehe elastic component of the suspending medium �Eberle et al. �2008c��. As the concen-ration of fiber is increased from 4.07 to 30 wt %, N1 appears to have a linear depen-ence on fiber volume fraction which is attributed to the fiber and not an enhancement ofhe elastic component of the suspending medium. This behavior further indicates that theuspending medium behaves in a similar manner to that of a Newtonian fluid.
IG. 3. The linear viscoelastic behavior of the neat PBT. The symbols ���, ���, and ��� represent G�, G�, and��, respectively. The solid line is the Carreau–Yasuda model fit to ��.
˙ −1
FIG. 4. N1 as a function of fiber weight fraction at �=1 s .
3
h�ot
Tidwus
4
stdSd
r�bteoon�saos
���c
oaisp
695FITTING FIBER THEORY MODEL PARAMETERS
. Initial fiber orientation
The stress growth behavior of a suspension containing high aspect ratio particles isighly dependent on the initial fiber orientation distribution of the particles �Eberle et al.2008a��. This is a direct manifestation of the connection between rheology and fiberrientation. The initial fiber orientation within the donut samples represented in terms ofhe tensor A is shown in Eq. �19�
A�=0 = �0.5167 0.0753 0.0584
0.0753 0.0349 0.0347
0.0584 0.0347 0.4484 . �19�
he experimental data represented in Eq. �19� show that the majority of the fibers werenitially oriented in the flow, x1, and neutral, x3, directions with very few in the shear, x2,irection. In literature it is common to assume the initial orientation is random in 3D bute find that the orientation is closer to a planar random orientation state. This is attrib-ted to the deformation history given to the sample during compression molding of theample disk and while the sample was loaded into the rheometer.
. Stress growth
The rheological property of major interest is the stress growth behavior followingtartup of shear flow and in flow reversal experiments because of the connection betweenhe transient stresses and the fiber orientation. In Sec. IV B we present an approach toetermining model parameters by fitting the predictions to the stress growth behavior.ubsequently, we discuss the experimental stress growth behavior and its shear rateependence to determine an optimum shear rate at which to fit the transient stresses.
The experimental values of �+ measured during startup of flow as a function of shearate in the range of �̇=1–10 s−1 for PBT�30 can be seen in Fig. 5�a�. The magnitude of+ vs strain, �, in Fig. 5�a� decreases by more than 20% over the shear rate range testedut the neat suspending medium only exhibits a 3% reduction in viscosity. The reason forhe enhanced shear thinning behavior of the suspending medium is not obvious. How-ver, one possible contributor could be local shear rate variations within close proximityf the fiber. In addition, increasing shear rates have been shown to impart a high degreef fiber orientation, effectively lowering the viscosity �Guo et al. �2005��. When �+ isormalized by the steady state viscosity, depicted in Fig. 5�b�, the overshoot region of+ /� scales in magnitude and strain for �̇�1 s−1 but for �̇=1 s−1, �+ /� exhibits alightly enhanced behavior compared to higher shear rates. The consistent values of �+ /�t various shear rates, for �̇�1 s−1, suggest that the enhance shear thinning was a resultf the suspending medium. It is not directly intuitive as to why �+ /� at �̇=1 s−1 does notcale in strain and magnitude with measurements at other shear rates.
N1+ / �̇ vs strain is depicted in Fig. 6 for PBT-30 as a function of shear rate in the range
˙ =1–10 s−1 in startup of flow. N1+ / �̇ scales in magnitude and strain for �̇�2 s−1 but for
˙ 2 s−1, N1+ / �̇ exhibits an enhanced behavior compared to higher shear rates. Similar to
+ /� it is unclear why at low shear rates, �̇ 2 s−1, N1+ / �̇ exhibits an enhanced value
ompared to higher shear rates.�+ vs strain as a function of shear rate, �̇=1–10 s−1, in flow reversal following startup
f flow for PBT-30 can be seen in Fig. 7�a�. The shear stress growth behavior of PBT-30t �̇=6 s−1 was added for direct comparison. Similar to the shear stress growth behaviorn startup of flow, �+ in flow reversal exhibits a transient overshoot that decays toward ateady state. However, the overshoot grows at a slower rate, resulting in an overshoot
eak that occurs at a strain of �14.7 which is more than twice the strain at which the
Fa
Fs
696 EBERLE et al.
IG. 5. Shear stress growth coefficient, �+, as a function of shear rate �̇ for 1 ���, 2 ���, 4 ���, 6 ���, 8 ���,−1 + +
nd 10 s ���. �a� � and �b� � /� where � is the viscosity.IG. 6. First normal stress difference growth function, N1+, normalized by the shear rate, �̇, as a function of
˙ −1
hear rate � for 1 ���, 2 ���, 4 ���, 6 ���, 8 ���, and 10 s ���.
psrimpmr�
saioismo
F�v
697FITTING FIBER THEORY MODEL PARAMETERS
eak occurred in �+ during startup of flow. Furthermore, the magnitude of the �+ over-hoot is on average smaller for the flow reversal experiment. For example, at �̇=6 s−1 theeverse overshoot maximum is roughly 6% less than the initial overshoot peak, though its within experimental error. In addition, �+ in the flow reversal experiments decreased by
ore than 20% over the �̇ range tested. Figure 7�b� depicts �+ normalized by the sus-ending medium viscosity, �, vs strain. Interestingly, �+ /� scales relatively well inagnitude and strain for all shear rates tested. Also, the magnitude of �+ /� in flow
eversal is very similar to the magnitude of �+ /� measured in startup of flow for �̇1 s−1.The overshoot in �+ measured in flow reversal experiments for suspensions containing
hort glass fibers has been previously reported in literature �Sepehr et al. �2004c��. It isttributed to a fraction �but unspecified� of the fibers which were not completely alignedn the flow direction, rotating in the opposite direction. It is proposed that only a fractionf the fibers changes their steady state orientation because the magnitude of the overshoots typically less than the initial overshoot. However, we find the magnitude of �+ /� intartup of flow and flow reversal to be of similar magnitude. This suggests the sameechanisms that contribute to the overshoot in startup of flow also contribute to the
IG. 7. Shear stress growth coefficient, �+, in flow reversal following startup of flow as a function of shear rate˙ for 1 ���, 2 ���, 4 ���, 6 ���, 8 ���, and 10 s−1 ���. �a� �+ and �b� �+ /� where � is the suspensioniscosity. Broken line represents �+ in startup of flow at �̇=6 s−1 for comparison.
vershoot in flow reversal and are of similar magnitude.

aPdat�
obr��pb
B
1
NFu
wcema
FfB
698 EBERLE et al.
The first normal stress difference growth function normalized by the shear rate, N1+ / �̇,
s a function of �̇ in flow reversal for PBT-30 can be seen in Fig. 8. In addition, N1+ / �̇ of
BT-30 at �̇=6 s−1 was added for direct comparison. N1+ / �̇ in flow reversal behaves very
ifferently than in startup of flow. N1+ initially exhibits a negative value that decreases to
minimum before increasing to a positive value where it then goes through a maximumhat decays to a steady state. Similarly to �+, the difference between N1
+ / �̇ measured at˙ =1 and 10 s−1 is more than 20%.
Fiber suspension theory predicts �+x, Eq. �9�, and N1+ / �̇, Eq. �10�, to be independent
f shear rate for a suspension in which the suspending medium is Newtonian. A similarehavior has been shown for PBT-30 in startup of flow when �+ is normalized by � toemove the effects of the enhanced shear thinning of the suspending medium for �̇
1 s−1. The same is true for the experimental N1+ / �̇ in which �̇�2 s−1. In flow reversal
+/� and N1+ / �̇ were found to be independent of shear rate for all rates tested. For fitting
urposes one should choose the experimental measurements where �+ /� and N1+ / �̇ have
een confirmed to be independent of shear rate.
. Simulation of transient shear flows
. Numerical method and model fitting
As previously discussed and shown in Fig. 3, the neat PBT behaved similarly to aewtonian fluid, but did exhibit a slight dependence on frequency over the range tested.or the subsequent model predictions the suspending medium viscosity, �s, was predictedsing the Carreau–Yasuda model
� − ��
�0 − ��
= �1 + ���̇�a��n−1�/a, �20�
here �0 is the zero-shear-rate viscosity, �� is the infinite-shear-rate viscosity, � is a timeonstant, n is the power-law exponent, a is a dimensionless parameter, and �̇ is takenqual to �. The Carreau–Yasuda model parameters were determined by fitting to theagnitude of the complex viscosity over the frequency range of �=0.1–100 rad /s using
˙
IG. 8. First normal stress difference growth function, N1+, normalized by the shear rate, �̇, in flow reversal
ollowing startup of flow as a function of shear rate �̇ for 1 ���, 2 ���, 4 ���, 6 ���, 8 ���, and 10 s−1 ���.roken line represents N1
+ in startup of flow at �̇=6 s−1 for comparison.
least-squares approach and taking � to be equal to � using the Cox–Merz rule. The

C=
nmtaErtwakke
�pebmt
Pt
�tmhocoT�torspt
=ipu
699FITTING FIBER THEORY MODEL PARAMETERS
arreau–Yasuda model fit can be seen in Fig. 3 for the following parameters: �0
428.2 Pa s, ��=0 Pa s, �=96.7 s, n=0.973, and a=5.For the equation governing the evolution of fiber orientation, Eq. �7�, was solved
umerically using Gears implicit predictor-corrector method at a time step of 0.01 s. Theodel predictions were repeated at a time step of 0.001 s for the highest �̇=10 s−1 and
he values were found to be within �10−4. Also, for Eqs. �9� and �10� the IBOF closurepproximation was used to express A4 in terms of A. Subsequent model predictions useq. �7� for the fiber orientation combined with Eqs. �9� and �10� to calculate �+ and N1
+,espectively. Model predictions, including the rate of fiber reorientation and magnitude ofhe Aij components which are directly linked to the magnitude of the transient stresses,ere found to be highly dependent on the initial conditions used in the model �Eberle etl. �2008a��. As a result, we were only able to determine unambiguous parameters withnowledge of the fiber orientation at some point in the simulation. Model fitting withoutnowledge of the fiber orientation at some point led to purely ambiguous model param-ters.
Simulations of �+ using the experimentally determined initial conditions given in Eq.19� predicts �+ to decrease from t=0. We believe that this is a deficiency in the physicalredictions of Eq. �7� and is out of the scope of this paper but is discussed in detaillsewhere �Eberle et al. �2008b��. As a result, the model predictions for startup of flowegin from �=7, the peak of the �+ which coincides with the experimentally determinedaximum in the A12 component. The average orientation at �=7 for PBT-30 was found
o be
A�=7 = � 0.5457 0.1378 − 0.0400
0.1378 0.0789 − 0.0049
− 0.0400 − 0.0049 0.3754 . �21�
redictions of the stress growth functions in flow reversal begin with values of orienta-ion determined when the stresses reach steady state following the startup of shear flow.
In the model there are two fit parameters, � and CI, for the fiber orientation in Eq. �7�.determines the rate of fiber reorientation and CI controls the steady state fiber orienta-
ion. For the stress growth functions there are two parameters: c1 and N. c1 affects theagnitude of �+ only and N controls the magnitude of �+ and N1
+ as a result of theydrodynamic drag of the fluid over the fiber. Because CI controls the steady state fiberrientation, the combination of parameters CI, N, and c1 must be simultaneously fit. Wehose to determine these parameters by fitting the model predictions to the peak of the �+
vershoot in addition to the steady state values of �+ and N1+ measured in startup of flow.
his leaves � which can be determined by simultaneously fitting the transient behavior of+ and N1
+. The discussed method to fitting the model parameters was determined to behe best approach after exhausting all other possible methods. We do not include the peakf the N1
+ overshoot in the fitting scheme because all attempts to include the peak of N1+
esulted in large deviations between the predicted and experimental �+ and the onset ofteady state for N1
+. Because the parameters were determined by fitting the model to aortion of the stress growth curve, subsequently, we loosely use the term model predic-ions when points have been fit to specific magnitudes.
The model fit to the stress growth behavior in startup of flow and flow reversal at �̇6 s−1 can be seen in Figs. 9�a� and 9�b�, respectively. The fit parameters can be found
n Table I. In Fig. 9�a� the model predictions show reasonable agreement with the ex-erimental results for �+ over the complete range of strain. In contrast the model severely
+ + +
nderpredicts the magnitude of N1 in the overshoot region. The model fits of � and N1
irfii
Fab
T
FBPLBDSE
700 EBERLE et al.
n flow reversal give good agreement with the experimental results over the completeange of strain which can be seen in Fig. 9�b�. It is interesting that the model is unable tot the large N1
+ in startup of flow but is capable in flow reversal. This suggests that theres an additional contribution to N1
+ in startup that is not present in flow reversal. One
IG. 9. Experimental results �symbols� and model predictions �solid lines� of the stress growth functions �+
nd N1+ in �a� startup of flow and �b� flow reversal following startup of flow at �̇=6 s−1. Model parameters can
e found in Table I.
ABLE I. Suspension theory fit and calculated model parameters.
� CI N c1
it to startup flow at �̇=6 s−1 0.4 0.002 27 0.4ay �1991�Eq. �5� 0.00052han-Thien et al. �2002�Eq. �6� 0.0202ipscomb et al. �1988�Eq. �12� 119.2atchelor �1971�Eq. �11� 128.1 2inh and Armstrong �1984�Eq. �13� 184.4 �aligned�haqfeh and Fredrickson �1990�q. �14�
653.7 �random�434.4 �aligned�

pocfificr
bestveer
2
1drs�e�Cm=TaNsth
semawr
ofwttp
701FITTING FIBER THEORY MODEL PARAMETERS
lausible explanation is direct fiber contact. In startup of flow the fibers reorient from anrientation that is mostly random in the shear plan where the potential for direct fiberontact is greatest. In the flow reversal experiment, the shear history has conditioned thebers so that they are mostly aligned in the same direction. Upon inception of flow thebers that do rotate would most likely reorient in unison, minimizing the degree ofontact. The fiber suspension theory does not include a contribution to the stresses as aesult of mechanical contact.
Wang et al. �2008� considered a similar approach to determining material parametersy fitting solely to the transient shear stress coefficient of Valox 420. All model param-ters were determined via a least-squares approach, including the contribution from theuspending medium which they found to be �s=55.7 Pa s. This differs considerably tohe value of �s=428.2 Pa s used in this work. The most obvious reason as to why thealues are so different is that one was determined via fitting and the other determinedxperimentally. The overall effect on the model predictions depends on the form of thequation for stress. In the case of Eq. �8� including �s as a fit parameter would haveendered it impossible to determine a unique set of material parameters.
. Model predictions
We now discuss the model predictions of the flow reversal experiments at �̇=1 and0 s−1 using the parameters determined by fitting stress growth at �̇=6 s−1. In Fig. 10�a�,epicting �+ vs �, the model predictions show close agreement with the experimentalesults. At �̇=1 s−1 �+ predicts the width of the experimental overshoot and the onset ofteady state but deviates slightly at the overshoot maximum. At �̇=10 s−1 the predicted+ shows good agreement to the overshoot maximum but the onset of steady state isnhanced compared to the experimental values. The difference in the model predictions at
˙ =1 s−1 and �̇=10 s−1 is a result of the suspending medium viscosity determined by thearreau–Yasuda model fit to the neat suspending medium. The discrepancy between theodel predictions and the experimental results for the onset of steady state of �+ at �̇10 s−1 suggests the suspending medium viscosity is lower than the predicted value.his is a direct result of the enhanced shear thinning exhibited by the fiber suspensionnd not the neat suspending medium. The model predictions and experimental results for
1+ at �̇=1 and 10 s−1 can be seen in Fig. 10�b�. Predictions at both �̇=1 and 10 s−1
how good agreement with the experimental results. However, in a similar fashion to �+
he model predictions of the onset of steady state for N1+ at �̇=10 s−1 are slightly en-
anced compared to the experimental results.We have shown that model parameters can be determined by fitting to the transient
tresses in startup of flow and flow reversal. To discuss the accuracy of the fitted param-ters, Fig. 11 illustrates the predictions of Eq. �7� compared to the experimentally deter-ined fiber orientation in startup of flow at �̇=1 s−1. The predictions show reasonable
greement with the experimentally determined fiber orientation, especially at long strainshich suggest that the CI parameter is accurate. However, the model over predicts the
ate of fiber reorientation which suggests the fitted � parameter is slightly too large.To determine the accuracy of the parameters c1 and N, associated with the magnitude
f the stresses, the fourth-order tensor components in Eqs. �9� and �10� were calculatedrom the experimental fiber orientation. By using the experimentally determined A1212
ith the fitted model parameters, the peak value of �+ was found to be �+=876 Pa s andhe experimental �+=854 Pa s. Interestingly, they are within experimental error. In con-rast N1
+ determined by using the experimentally measured A1112−A2212 with the fitted+ +
arameters was found to be N1 =386 Pa and the experimental N1 =1909 Pa. The discrep-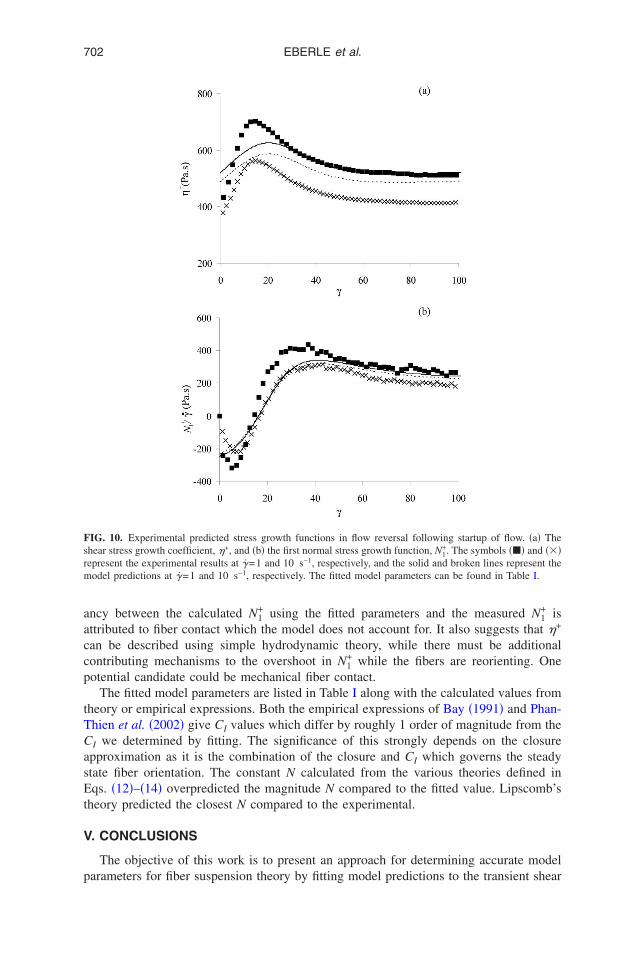
aaccp
tTCasEt
V
p
Fsrm
702 EBERLE et al.
ncy between the calculated N1+ using the fitted parameters and the measured N1
+ isttributed to fiber contact which the model does not account for. It also suggests that �+
an be described using simple hydrodynamic theory, while there must be additionalontributing mechanisms to the overshoot in N1
+ while the fibers are reorienting. Oneotential candidate could be mechanical fiber contact.
The fitted model parameters are listed in Table I along with the calculated values fromheory or empirical expressions. Both the empirical expressions of Bay �1991� and Phan-hien et al. �2002� give CI values which differ by roughly 1 order of magnitude from the
I we determined by fitting. The significance of this strongly depends on the closurepproximation as it is the combination of the closure and CI which governs the steadytate fiber orientation. The constant N calculated from the various theories defined inqs. �12�–�14� overpredicted the magnitude N compared to the fitted value. Lipscomb’s
heory predicted the closest N compared to the experimental.
. CONCLUSIONS
The objective of this work is to present an approach for determining accurate model
IG. 10. Experimental predicted stress growth functions in flow reversal following startup of flow. �a� Thehear stress growth coefficient, �+, and �b� the first normal stress growth function, N1
+. The symbols ��� and ���epresent the experimental results at �̇=1 and 10 s−1, respectively, and the solid and broken lines represent theodel predictions at �̇=1 and 10 s−1, respectively. The fitted model parameters can be found in Table I.
arameters for fiber suspension theory by fitting model predictions to the transient shear

mtpsi
gpinYomitapficmt
A
mG
R
A
Fsi
703FITTING FIBER THEORY MODEL PARAMETERS
aterial functions �+ and N1+ / �̇. To determine these parameters, first, one must determine
he range of shear rates where the measured material functions �+ and N1+ / �̇ are inde-
endent of shear rate. Second, one must have knowledge of the fiber orientation at thetartup of shear flow assuming random fiber orientation may lead to ambiguous andnaccurate parameters.
Using the parameters determined at one shear rate we were able to predict the stressrowth behavior at other shear rates. However, the model for stress did not accuratelyredict the shear rate dependence of the viscosity. Experimentally the suspension exhib-ted a higher shear rate dependence than the model predicted even when the shear thin-ing behavior of the neat suspending medium was accounted for using the Carreau–asuda model. Furthermore, the model was unable to predict the magnitude of the N1
+
vershoot in startup of flow. This was attributed to the direct fiber contact of which theodel does not account for. However, we show that �+ in startup of flow and �+ and N1
+
n flow reversal following startup of flow can be explained using simple hydrodynamicheory. As a result we believe this approach can lead to obtaining unambiguous andccurate model parameters. In addition we believe that fitting can lead to more accuratearameters than those determined using the available theory or empirical relations. Also,tting allows one to determine the � parameter for which no mathematical expressionurrently exists. The full test of the approach will be when calculations of orientation areade in processing flows and compared against experimentally determined fiber orien-
ation values.
CKNOWLEDGMENTS
The financial support for this work from the National Science Foundation and Depart-ent of Energy through Grant No. DMI-0521918 is gratefully acknowledged. We thankE Plastics for supplying the materials used in this work.
eferences
IG. 11. Experimental and predicted fiber orientation represented through the Aii components in startup ofimple shear flow at �̇=1 s−1. Lines represent the model predictions of Eq. �7�. Model parameters can be foundn Table I.
dvani, S. G. and E. M. Sozer, Process Modeling in Composites Manufacturing �Marcel Dekker, New York,

A
A
B
B
B
B
B
B
B
C
C
C
C
D
D
E
E
E
E
E
E
F
G
G
H
H
704 EBERLE et al.
2003�.dvani, S. G. and C. L. Tucker, “The use of tensors to describe and predict fiber orientation in short fiber
composites,” J. Rheol. 31, 751–784 �1987�.dvani, S. G. and C. L. Tucker, “Closure approximations for three-dimensional structure tensors,” J. Rheol. 34,
367 �1990�.atchelor, G. K., “The stress system in a suspension of force-free particles,” J. Fluid Mech. 41, 545–570
�1970�.atchelor, G. K., “The stress generated in a non-dilute suspension of elongated particles by pure straining
motion,” J. Fluid Mech. 46, 813–829 �1971�.ay, R. S., “Fiber orientation in injection molded composites: A comparison of theory and experiment,” Ph.D.
thesis, University of Illinois Urbana-Champaign, 1991.
ay, R. S. and C. L. Tucker, “Fiber orientation in simple injection moldings. Part I: Theory and numerical
methods,” Polym. Compos. 13, 317–334 �1992a�.ay, R. S. and C. L. Tucker, “Fiber orientation in simple injection moldings. Part II. Experimental results,”
Polym. Compos. 13, 332–341 �1992b�.ay, R. S. and C. L. Tucker, “Stereological measurement and error estimates for three dimensional fibre
orientation,” Polym. Eng. Sci. 32, 240–253 �1992c�.retherton, F. P., “The motion of rigid particles in a shear flow at low Reynolds number,” J. Fluid Mech. 14,
284–304 �1962�.hung, D. H. and T. H. Kwon, “An invariant based optimal fitting closure approximation for the numerical
prediction of flow-induced fiber orientation,” J. Rheol. 46, 169–194 �2002a�.hung, D. H. and T. H. Kwon, “Fiber orientation in the processing of polymer composites,” Korea-Aust. Rheol.
J. 14, 175–188 �2002b�.intra, J. S. and C. L. Tucker III, “Orthotropic closure approximations for flow-induced fiber orientation,” J.
Rheol. 39, 1095–1022 �1995�.ox, R. G., “The motion of long slender bodies in a viscous fluid. Part 2: Shear flow,” J. Fluid Mech. 45,
625–657 �1971�.inh, S. M. and R. C. Armstrong, “A rheological equation of state for semiconcentrated fiber suspensions,” J.
Rheol. 28, 207–227 �1984�.oi, M. and S. F. Edwards, The Theory of Polymer Dynamics �Oxford University Press, New York, 1988�.berle, A. P. R., “The dynamic behavior of a concentrated composite fluid containing non-Brownian glass fibers
in rheometrical flows,” Ph.D. thesis, Virginia Tech �2008�.berle, A. P. R., D. Baird, and P. Wapperom, “Rheology of non-Newtonian fluids containing glass fibers: A
review of experimental literature,” Ind. Eng. Chem. Res. 47, 3470–3488 �2008c�.berle, A. P. R., D. G. Baird, P. Wapperom, and G. Velez-Garcia, “Obtaining reliable transient rheological data
on concentrated short fiber suspensions using a rotational rheometer,” J. Rheol., submitted �2008a�.berle, A. P. R., D. G. Baird, P. Wapperom, and G. M. Velez-Garcia, “Fiber orientation kinetics of a concen-
trated short glass fiber suspension in startup of simple shear flow,” J. Non-Newtonian Fluid Mech., submit-
ted �2008b�.instein, A., “A new determination of molecular dimensions,” Ann. Phys. 19, 289–306 �1906�.vans, J. G., “The flow of a suspension of force-free rigid rods in a Newtonian fluid,” Ph.D. thesis, Cambridge
University, 1975.
olgar, F. P. and C. L. Tucker, “Orientation behavior of fibers in concentrated suspensions,” J. Reinf. Plast.
Compos. 3, 98–119 �1984�.iesekus, H., “Stromungen mit konstantem Geschwindigkeitsgradienten und die Bewegung von darin suspendi-
erten Teilchen. Teil I: Raumliche Stromungen,” Rheol. Acta 2, 101–112 �1962�.uo, R., J. Azaiez, and C. Bellehumeur, “Rheology of fiber filled polymer melts: Role of fiber-fiber interactions
and polymer-fiber coupling,” Polym. Eng. Sci. 45, 385–399 �2005�.and, G. L., “A theory of dilute suspensions,” Arch. Ration. Mech. Anal. 7, 81–86 �1961�.ine, P. J., N. Davidson, R. A. Duckett, and I. M. Ward, “Measuring the fibre orientation and modeling the
elastic properties of injection-moulded long-glass-fibre-reinforced nylon,” Compos. Sci. Technol. 53, 125–
131 �1995�.

H
J
L
L
M
P
P
S
S
S
S
S
T
W
Z
705FITTING FIBER THEORY MODEL PARAMETERS
uynh, H. M., “Improved fiber orientation predictions for injection-molded composites,” MS thesis, University
of Illinois at Urbana-Champaign �2001�.effery, G. B., “The motion of ellipsoidal particles immersed in a viscous fluid,” Proc. R. Soc. London, Ser. A
102, 161–179 �1922�.ee, Y., S. Lee, J. Youn, K. Chung, and T. Kang, “Characterization of fiber orientation in short fiber reinforced
composites with an image processing technique,” Mater. Res. Innovations 6, 65 �2002�.ipscomb, G. G., M. M. Denn, D. U. Hur, and D. V. Boger, “The flow of fiber suspensions in complex
geometries,” J. Non-Newtonian Fluid Mech. 26, 297–325 �1988�.acosko, C. W., Rheology Principles, Measurements, and Applications �Wiley, New York, 1994�.
etrie, C. J. S., “The rheology of fibre suspensions,” J. Non-Newtonian Fluid Mech. 87, 369–402 �1999�.han-Thien, N., X.-J. Fan, R. I. Tanner, and R. Zheng, “Folgar–Tucker constant for fiber suspension in a
Newtonian fluid,” J. Non-Newtonian Fluid Mech. 103, 251–260 �2002�.awyer, L. C. and D. Grubb, Polymer Microscopy �Springer, New York, 1995�.epehr, M., G. Ausias, and P. J. Carreau, “Rheological properties of short fiber filled polypropylene in transient
shear flow,” J. Non-Newtonian Fluid Mech. 123, 19–32 �2004a�.epehr, M., P. J. Carreau, M. Grmela, G. Ausias, and P. G. Lafleur, “Comparison of rheological properties of
fiber suspensions with model predictions,” J. Polym. Eng. 24, 579–610 �2004b�.epehr, M., P. J. Carreau, M. Moan, and G. Ausias, “Rheological properties of short fiber model suspensions,”
J. Rheol. 48, 1023–1048 �2004c�.haqfeh, E. S. G. and G. H. Fredrickson, “The hydrodynamic stress in a suspension of rods,” Phys. Fluids A 2,
7–25 �1990�.anner, R. I., Engineering Rheology �Oxford University Press, New York, 2000�.ang, J., J. F. O’Gara, and C. L. Tucker, “An objective model for slow orientation kinetics in concentrated fiber
suspensions: Theory and rheological evidence,” J. Rheol. 52, 1179–1200 �2008�.irnsak, M. A., D. U. Hur, and D. V. Boger, “Normal stresses in fibre suspensions,” J. Non-Newtonian Fluid
Mech. 54, 153–193 �1994�.