using trees to depict a forest bin liu, h. v. jagadish eecs, university of michigan, ann arbor...
Post on 19-Dec-2015
220 views
TRANSCRIPT

1
Using Trees to Depict a ForestBin Liu, H. V. JagadishEECS, University of Michigan, Ann Arbor
Presented bySergey Shepshelvich

2
Motivation
In interactive database querying, we often get more results than we can comprehend immediately
When do you actually click over 2-3 pages of results? 85% of users never go to the second page! What to display on the first page?

3
Standard solutions
Sorting by attributes Computationally expensive Similar results can be distributed many pages
apart Ranking
Hard to estimate of the user's preference. In database queries, all tuples are equally
relevant! What to do when there are millions of results?

4
Make the First Page Count
Human beings are very capable of learning from examples
Show the most “representative” results Best help users learn what is in the result set User can decide further actions based on
representatives

5
The Proposal:MusiqLens Experience(Model-driven Usable Systems for Information Querying)

Suppose a user wants a 2005 Civic6
but there are too many of them…

7
MusiqLens on the Car Data
Id Model Price Year Mileage Condition
872 Civic $12,000 2005 50,000 Good 122 more like this
901 Civic $16,000 2005 40,000 Excellent 345 more like this
725 Civic $18,500 2005 30,000 Excellent 86 more like this
423 Civic $17,000 2005 42,000 Good 201 more like this
132 Civic $9,500 2005 86,000 Fair 185 more like this
322 Civic $14,000 2005 73,000 Good 55 more like this
8
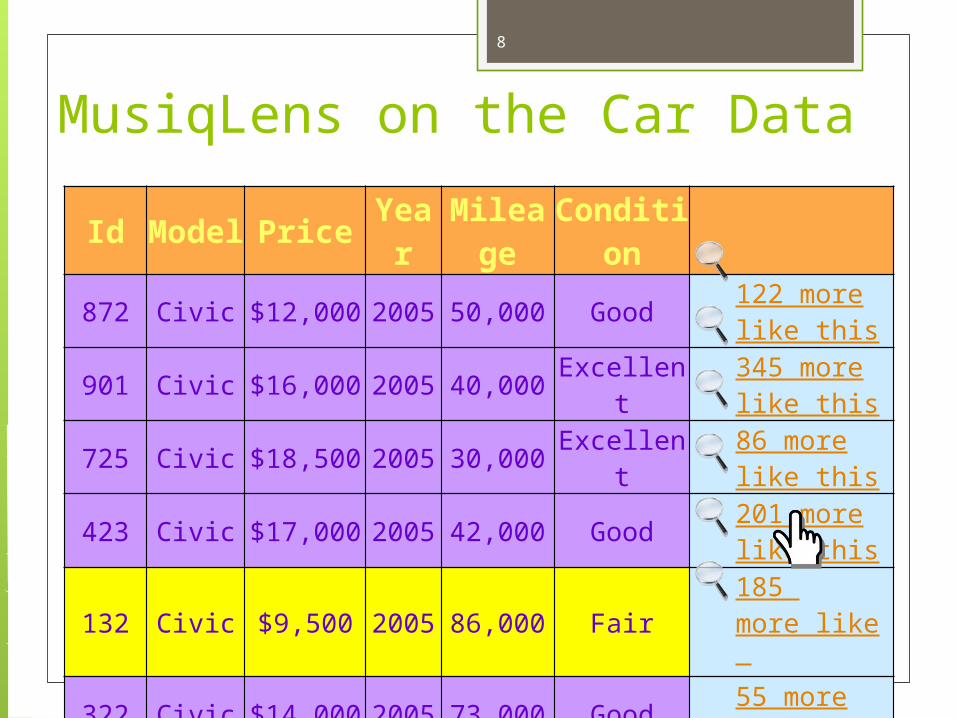
MusiqLens on the Car Data
Id Model Price Year Mileage Condition
872 Civic $12,000 2005 50,000 Good 122 more like this
901 Civic $16,000 2005 40,000 Excellent 345 more like this
725 Civic $18,500 2005 30,000 Excellent 86 more like this
423 Civic $17,000 2005 42,000 Good 201 more like this
132 Civic $9,500 2005 86,000 Fair 185 more like this
322 Civic $14,000 2005 73,000 Good 55 more like this

9
After Zooming in:2005 Honda Civics ~ ID 132
Id Model Price Year Mileage Condition
342 Civic $9,800 2005 72,000 Good 25 more like this
768 Civic $10,000 2005 60,000 Good 10 more like this
132 Civic $9,500 2005 86,000 Fair 63 more like this
122 Civic $9,500 2005 76,000 Good 5 more like this
123 Civic $9,100 2005 81,000 Fair 40 more like this
898 Civic $9,000 2005 69,000 Fair 42 more like this

10
After Filtering by “Price < 9,500”
Id Model Price Year Mileage Condition
123 Civic $9,100 2005 81,000 Fair 40 more like this
898 Civic $9,000 2005 69,000 Fair 42 more like this
133 Civic $9,300 2005 87,000 Fair 33 more like this
126 Civic $9,200 2005 89,000 Good 3 more like this
129 Civic $8,900 2005 81,000 Fair 20 more like this
999 Civic $9,000 2005 87,000 Fair 12 more like this

11
Challenges
Representation Modeling: finding a suitable metric What is the best set of representatives?
Representative finding How to find them efficiently?
Query Refinement How to efficiently adapt to user’s query
operations?

12
Finding a Suitable Metric
Users should be the ultimate judge Which metric generates the representatives that
I can learn the most from? User study to evaluate different
representation modeling
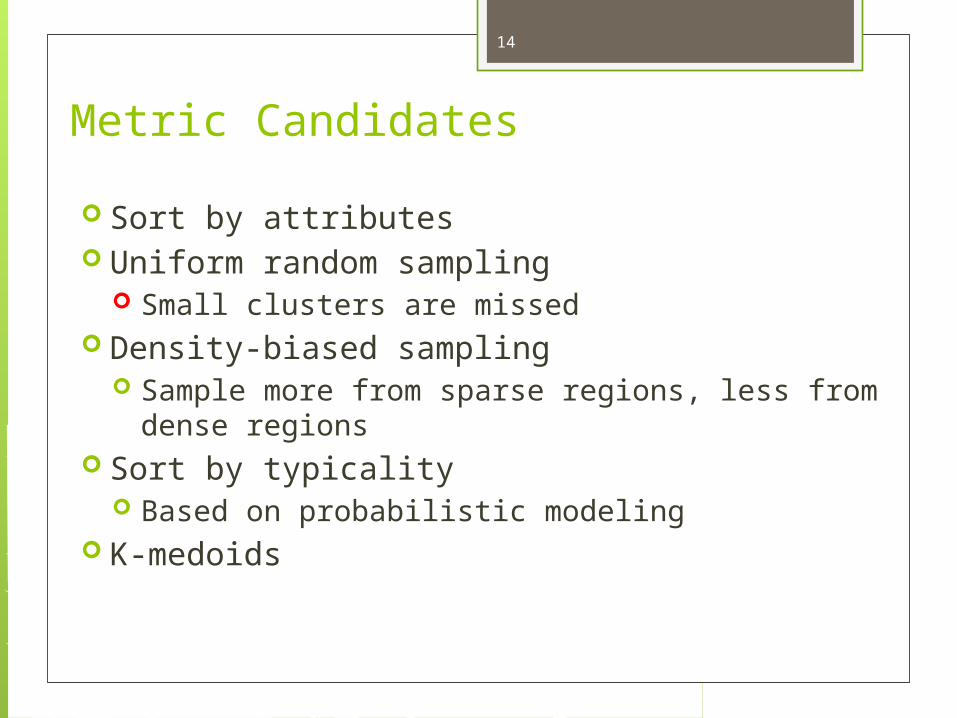
Metric Candidates
Sort by attributes Uniform random sampling
Small clusters are missed Density-biased sampling
Sample more from sparse regions, less from dense regions
Sort by typicality Based on probabilistic modeling
K-medoids
14

Metric Candidates - K-medoids
A medoid of a cluster is the object whose dissimilarity to others is smallest Average medoid and max medoid
K-medoids are k objects, each from a different cluster where the object is the medoid
Why not K-means? K-means cluster centers do not exist in
database We must present real objects to users
16

17
Plotting the Candidates
0 0.1 0.2 0.3 0.4 0.5 0.6 0.7 0.8 0.9 10
0.1
0.2
0.3
0.4
0.5
0.6
0.7
0.8
0.9
1Random
Data: Yahoo! Autos, 3922 data points. Price and mileage are normalized to 0..1
0 0.1 0.2 0.3 0.4 0.5 0.6 0.7 0.8 0.9 10
0.1
0.2
0.3
0.4
0.5
0.6
0.7
0.8
0.9
1Density Biased

18
Plotting the Candidates - Typicality
0 0.1 0.2 0.3 0.4 0.5 0.6 0.7 0.8 0.9 10
0.1
0.2
0.3
0.4
0.5
0.6
0.7
0.8
0.9
1
Typical

19
Plotting the Candidates –k-medoids
0 0.1 0.2 0.3 0.4 0.5 0.6 0.7 0.8 0.9 10
0.1
0.2
0.3
0.4
0.5
0.6
0.7
0.8
0.9
1
Max-Medoids
0 0.1 0.2 0.3 0.4 0.5 0.6 0.7 0.8 0.9 10
0.1
0.2
0.3
0.4
0.5
0.6
0.7
0.8
0.9
1
Avg-Medoids

20
User Study Procedure
Users are given: 7 sets of data, generated using the 7 candidate
methods Each set consists of 8 representative points
Users predict 4 more data points That are most likely in the data set Should not pick those already given
Measure the predication error

21
Verdict
K-meoids is the winner In this paper, authors choose average k-
medoids Proposed algorithm can be extended to max-
medoids with small changes

22
Challenges
Representation Modeling: finding a suitable metric What is the best set of representatives?
Representative finding How to find them efficiently?
Query Refinement How to efficiently adapt to user’s query
operations?

23
Cover Tree Based Algorithm
Cover Tree was proposed by Beygelzimer, Kakade, and Langford in 2006
Briefly discuss Cover Tree properties See Cover Tree based algorithms for
computing k-medoids

24
Cover Tree Properties (1)Nesting: for all ,
C i
C i+1
Points in the Data (One Dimension)

25
Cover Tree Properties (2)
Distance from node to any descendant is less than . This value is called the “span” of the node.
Covering: node in is within distance of to its children in
C i
C i+1

26
Cover Tree Properties (3)Separation: nodes in are separated by at least
Note: allowed to be negative to satisfy above conditions.
C i
C i+1
27
s1s2
s10
s8s6
s7
s3
s5
s3 s8s5
s6s1 s2 s7
s8s5
s9s4s5 s8
s9
s5
s4
s3
s2
s10
s7s3
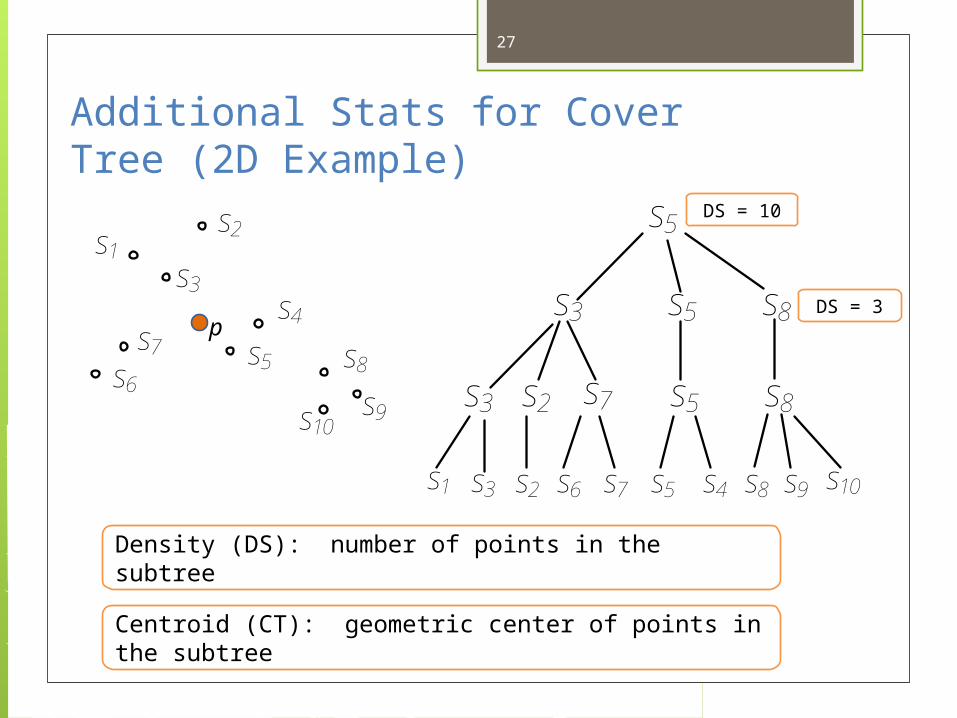
Additional Stats for Cover Tree (2D Example)
Density (DS): number of points in the subtree
DS = 10
DS = 3
Centroid (CT): geometric center of points in the subtree
p

28
k-medoid Algorithm Outline
We descend the cover tree to a level with more than nodes
Choose an initial points as first set of medoids (seeds) Bad seeds can lead to local minimums with a
high distance cost Assigning nodes and repeated update until
medoids converge

29
Cover Tree Based Seeding
Descend the cover tree to a level with more than nodes (denote as level m)
Use the parent level as starting point for seeds Each node has a weight, calculated as product of
span and density (the contribution of the subtree to the distance cost)
Expand nodes using a priority queue Fetch the first nodes from the queue as seeds

A Simple Example: k = 4
30
s1s2
s10
s8s6
s7
s3
s5
s3 s8s5
s6s1 s2 s7
s8s5
s9s4s5 s8
s9
s5
s4
s3
s2
s10
s7s3
Span = 2
Span = 1
Span = 1/2
Span = 1/4
Priority Queue on node weight (density * span):
S3 (5), S8 (3), S5 (2)
S8 (3/2), S5 (1), S3 (1), S7 (1), S2 (1/2)
Final set of seeds

31
Update Process
1. Initially, assign all nodes to closest seed to form clusters
2. For each cluster, calculate the geometric center
Use centroid and density information to approximate subtree
3. Find the node that is closest to the geometric center, designate as a new medoid
4. Repeat from step 1 until medoids converge

32
Challenges
Representation Modeling: finding a suitable metric What is the best set of representatives?
Representative finding How to find them efficiently?
Query Refinement How to efficiently adapt to user’s query
operations?

33
Query Adaptation
Handle user actions Zooming Selection (filtering)

34
Zooming
Zooming Expand all nodes assigned to the medoid Run k-medoid algorithm on the new set of nodes

35
Selection
Effect of selection on a node Completely invalid Fully valid Partially valid
Estimate the validity percentage (VG) of each node
Multiply the VG with weight of each node
50
150
A
Mileage
S1S2
S3S4
S5S6
S7
a
Price
1200030
201
45
57
90b

37
Experiments – Initial Medoid Quality Compare with R-tree based method by M.
Ester, H. Kriegel, and X. Xu Data sets
Synthetic dataset: 2D points with zipf distribution
Real dataset: LA data set from R-tree Portal, 130k points
Measurement Time to compute the medoids Average distance from a data point to its medoid

Results on Synthetic Data
38
256K 512K 1024K 2048K 4096K-1.73472347597681E-18
0.002
0.004
0.006
0.008
0.01
R-tree
Cover Tree
Cardinality
Tim
e (s
econ
ds)
256K 512K 1024K 2048K 4096K0
100
200
300
400
500
600
700
800
R-tree
Cover Tree
CardinalityDi
stan
ce
For various sizes of data, Cover-tree based method outperforms R-tree based method
Time Distance

39
Results on Real Data
2 8 32 128 5120
200
400
600
800
1000
1200
1400
1600
R-tree
Cover Tree
k
Dist
ance
2 8 32 128 5120
0.01
0.02
0.03
0.04
0.05
0.06
R-tree
Cover Tree
k
Tim
e (s
econ
ds)
For various k values, Cover-tree based method outperforms R-tree based method on real data

Query Adaptation
40
0.8 0.6 0.4 0.20
100
200
300
400
500
600
Re-Compute
Incremental
Selectivity
Dis
tanc
e
0.8 0.6 0.4 0.20
50
100
150
200
250
300
350
Re-Compute
Incremental
Selectivity
Dis
tanc
e
Synthetic Data Real Data
Compare with re-building the cover tree and running the k-medoid algorithm from scratch.
Time cost of re-building is orders-of-magnitude higher than incremental computation.

41
Conclusion
Authors proposed MusiqLens framework for solving the many-answer problem
Authors conducted user study to select a metric for choosing representatives
Authors proposed efficient method for computing and maintaining the representatives under user actions
Part of the database usability project at Univ. of Michigan Led by Prof. H.V. Jagadish http://www.eecs.umich.edu/db/usable/