using vertical rock uplift patterns to constrain the three … · 2009-01-13 · using vertical...
TRANSCRIPT

Using Vertical Rock Uplift Patterns to Constrain the Three-Dimensional
Fault Configuration in the Los Angeles Basin
by Andrew J. Meigs, Michele L. Cooke, and Scott T. Marshall
Abstract Comparison of geologic uplift patterns with results of three-dimensionalmechanical models provides constraints on the fault geometry compiled by the South-ern California Earthquake Center community fault model in the northern Los Angelesbasin, California. The modeled uplift matches well the geologic pattern of uplift as-sociated with the Santa Fe Springs and Coyote Hills segments of the Puente Hillsthrust fault but does not match structures to the west of the San Gabriel River. Tobetter match the geologic patterns in this area, alternative fault configurations weretested. The best match to geologic uplift is attained with a model incorporating (1) asteep blind thrust fault at the location of the Los Angeles segment of the Puente Hillsthrust system (following interpretations of the Las Cienegas fault geometry at thislocation), (2) removal of an inferred linking fault between the Raymond and Holly-wood faults, and (3) lateral continuation of the Lower Elysian Park fault, a blind low-angle detachment at >10 km depth, along strike to the northwest. These geometricrevisions alter the connectivity of northern Los Angeles basin faults and significantlyimprove the match of model uplift pattern to geologic data. Model results suggest thatfault connectivity may be more important in governing fault slip rate than are fault dipand fault area. The preferred model alters slip rates by >0:2 mm=yr for the UpperElysian Park, Hollywood, Lower Elysian Park, Raymond, Sierra Madre West, andVerdugo faults. Additionally, the preferred model alters the surface area of severalfaults in the northern Los Angeles basin, such as the Puente Hills thrust and the LowerElysian Park fault, which may have important implications for seismic hazard assess-ment in the northern Los Angeles basin.
Introduction
Accurate three-dimensional fault surface representationsare imperative for understanding how regional fault networksaccommodate strain, how they interact, and how they are or-ganized internally. The Southern California EarthquakeCenter has developed a three-dimensional model of southernCalifornia’s network of active faults, the community faultmodel (CFM) (Plesch et al., 2002), in order to improveregional geophysical modeling efforts and model seismichazard (e.g., Field et al., 2005). One of the most topologi-cally complex regions of the southern California fault net-work is the northern Los Angeles (LA) basin, wherenorthwest–southeast trending strike-slip faults of the Penin-sular ranges intersect with the east–west trending reverse andoblique faults of the Transverse ranges (Fig. 1) (e.g., Wright,1991; Meigs and Oskin, 2002). A network of about 34 activefault surfaces comprises the CFM within the northern LAbasin. This highly urbanized region is vulnerable to seismicdamage that might result from even small or moderate earth-quakes on nearby faults. Validation of the CFM within the LAbasin will provide accurate fault surface area and will con-
strain fault configurations for use in geophysical models ofslip rates, recurrence intervals, and rupture propagation. Thisstudy explores the details of the complex fault configurationwithin the CFM in this region in an effort to define what faultgeometries (dip, connectivity, length) are compatible withgeological uplift patterns revealed by deformed stratigraphichorizons.
Fault surfaces comprising the CFM have been assembledfrom a range of geological and geophysical data sets (Pleschet al., 2002). Faults such as the Northridge blind thrust andthe Puente Hills thrust identified themselves in earthquakes(Hauksson et al., 1988; Hauksson and Jones, 1989; Yeatsand Huftile, 1995; Hudnut et al., 1996; Carena and Suppe,2002). Industry geophysical and geological data have beenused to locate and characterize fault location, orientation, andslip rate (Huftile and Yeats, 1995; Schneider et al., 1996;Shaw and Shearer, 1999; Tsutsumi and Yeats, 1999; Tsutsu-mi et al., 2001; Shaw et al., 2002; Myers et al., 2003). Otherfault locations and geometries have been inferred from struc-tural models (Davis et al., 1989; Shaw and Suppe, 1996;
106
Bulletin of the Seismological Society of America, Vol. 98, No. 2, pp. 106–123, April 2008, doi: 10.1785/0120060254
Meigs et al., 2003). Relatively few fault shapes and extentsare known across the seismogenic layer (e.g., Shaw andShearer, 1999; Carena and Suppe, 2002), and most faultcharacteristics are well defined for only the upper few kilo-meters of the crust (e.g., Schneider et al., 1996; Tsutsumiet al., 2001; Myers et al., 2003). To midcrustal depths,the seismogenic layer is well defined across the LA basin(Nazareth and Hauksson, 2004). Between the upper crustand the base of the seismogenic layer, fault geometry is de-fined via geometrical models, projection, mechanicalmodels, aftershock sequences, hypocentral locations, and in-terpretation (e.g., Schneider et al., 1996; Tsutsumi and Yeats,1999; Carena and Suppe, 2002; Shaw et al., 2002; Griffithand Cooke, 2004). Plesch et al. (2002) determined that 95%of the seismic moment release from earthquakes between1981 and 2003 in southern California fell within 4 km ofthe surfaces of faults within the CFM. Whereas better con-straint of subsurface fault geometry can be achieved vianew seismic imaging or collection of additional geologicdata, mechanical modeling represents a viable, economicalalternative to exploring fault geometries within the seismo-genic layer.
In this study, we use three-dimensional mechanicalmodel results to test the CFM fault network and alternativeconfigurations using geologic uplift data (Fig. 1). Maps ofrock uplift were derived from well data and cross-sectionalinterpretations of the depth of the base of the Pico Member ofthe Fernando Formation (2.9 Ma), which is well representedthroughout the northern LA basin (Blake, 1991; Wright,1991; Schneider et al., 1996; Tsutsumi et al., 2001; Myerset al., 2003). To simulate deformation, we utilize three-dimensional mechanical models that contain fault surfacesdefined by the CFM working group and that are deformedaccording to regional geodetic information. Blind thrust faultdip and the extent of low-angle detachments are varied with-in the numerical models, and the resultant uplift patterns arecompared to the spatial variation of rock uplift. The inte-grated geologic and modeling evaluative approach we em-ploy for this relatively well-studied region of southernCalifornia serves to validate portions of the CFM, identifiesareas of mismatch between CFM-based models of uplift andgeologic data, and explores alternative fault configurationsthat better match the geologic uplift pattern in the mis-matched regions.
Major Structures of the Northern Los Angeles Basin
Two distinct structural domains, the central trough andthe northern shelf, comprise the northern LA basin. Thecentral trough is a regionally continuous northwest-trendingsyncline that defines the basin axis where the sedimentary fillreaches its maximum thickness (Wright, 1991). The northernshelf defines the northern and northeastern margin of thecentral trough and comprises a series of active folds andblind and surface-cutting faults (Fig. 2). In the west, betweenSanta Monica and the San Gabriel River, major structures of
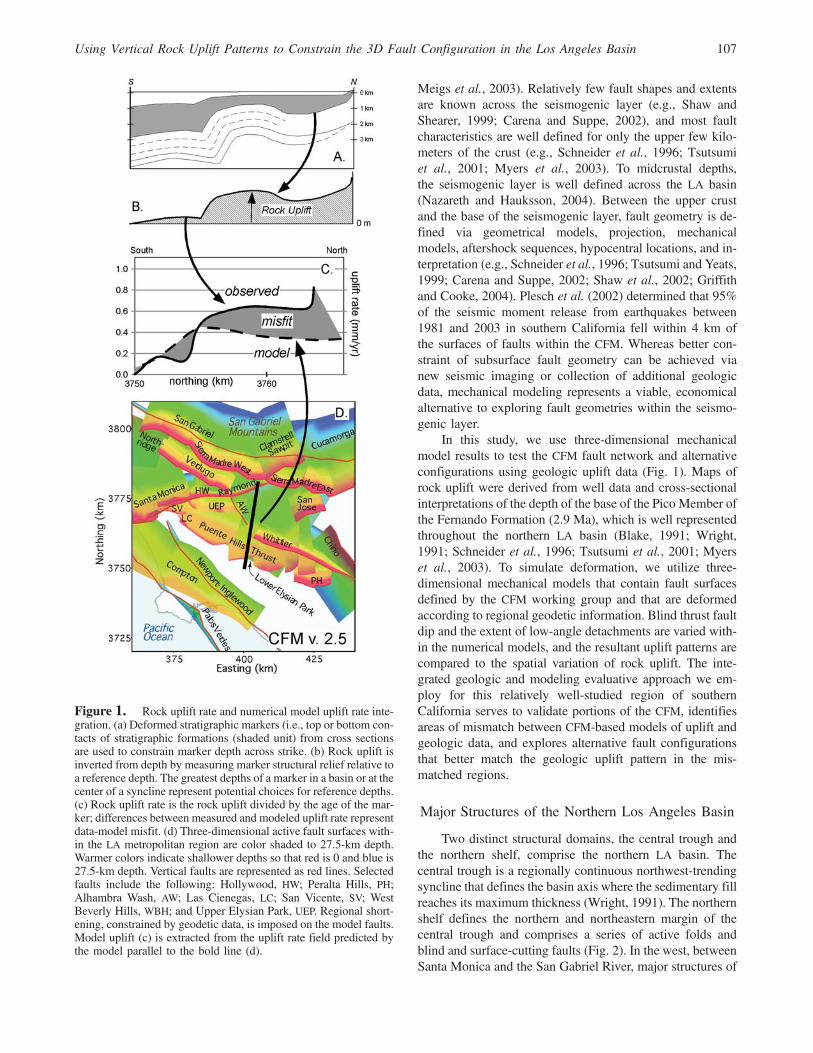
Figure 1. Rock uplift rate and numerical model uplift rate inte-gration. (a) Deformed stratigraphic markers (i.e., top or bottom con-tacts of stratigraphic formations (shaded unit) from cross sectionsare used to constrain marker depth across strike. (b) Rock uplift isinverted from depth by measuring marker structural relief relative toa reference depth. The greatest depths of a marker in a basin or at thecenter of a syncline represent potential choices for reference depths.(c) Rock uplift rate is the rock uplift divided by the age of the mar-ker; differences between measured and modeled uplift rate representdata-model misfit. (d) Three-dimensional active fault surfaces with-in the LA metropolitan region are color shaded to 27.5-km depth.Warmer colors indicate shallower depths so that red is 0 and blue is27.5-km depth. Vertical faults are represented as red lines. Selectedfaults include the following: Hollywood, HW; Peralta Hills, PH;Alhambra Wash, AW; Las Cienegas, LC; San Vicente, SV; WestBeverly Hills, WBH; and Upper Elysian Park, UEP. Regional short-ening, constrained by geodetic data, is imposed on the model faults.Model uplift (c) is extracted from the uplift rate field predicted bythe model parallel to the bold line (d).
Using Vertical Rock Uplift Patterns to Constrain the 3D Fault Configuration in the Los Angeles Basin 107
the northern shelf include the Santa Monica–Hollywoodfault system and the Newport–Inglewood faults (Dibblee,1982; Wright, 1991; Dolan and Pratt, 1997; Dolan et al.,1997; Dolan, Sieh, et al., 2000; Dolan, Stevens, et al.,2000; Meigs and Oskin, 2002). Folds associated with blindthrust faults are the Santa Monica Mountains anticlinorium,the Elysian Park anticlinorium (including the MacArthurPark escarpment and the Coyote Pass escarpment), theMontebello Hills (Fig. 2) anticline, and the La Cienegasmonocline (Buwalda, 1940; Davis et al., 1989; Wright,1991; Dolan and Sieh, 1992; Bullard and Lettis, 1993;Schneider et al., 1996; Meigs et al., 1999; Oskin et al.,2000; Weaver and Dolan, 2000; Tsutsumi et al., 2001; Meigsand Oskin, 2002; Meigs et al., 2003). East of the San GabrielRiver, the Whittier fault is the major fault that extends to thesurface (Rockwell et al., 1992; Bjorklund, 2002; Griffith andCooke, 2004). Active folds are forming above the Puente
Hills and Coyote Hills blind thrust fault systems, which in-clude the Coyote anticline and La Habra syncline (Yerkeset al., 1965; Yerkes, 1972; Shaw and Shearer, 1999; Shawet al., 2002; Myers et al., 2003; Griffith and Cooke, 2004).
Rock Uplift Patterns within the Los Angeles Basin
Folded geologic markers provide evidence of the wave-length, amplitude, and rates of deformation associated withblind thrust fault displacement (e.g., Stein et al., 1988; Shawet al., 2002; Myers et al., 2003). Rates of shortening, faultslip, and fold growth can be inferred from deformed, datedstrata given knowledge about fold shape, fault shape, andinferences about how fault slip is translated into fold growth(e.g., Stein et al., 1988; Hardy and Poblet, 1994; Ford et al.,1997; Suppe et al., 1997; Shaw and Shearer, 1999; Allmen-dinger and Shaw, 2000). Because blind thrust faults within
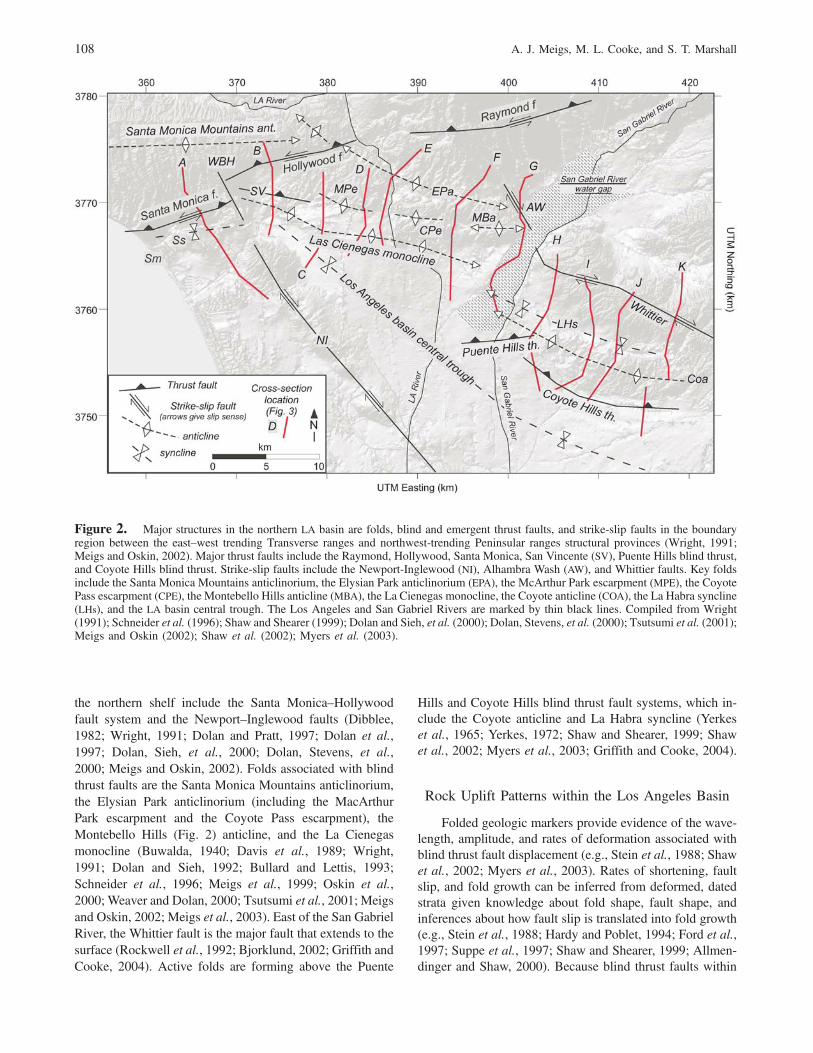
Figure 2. Major structures in the northern LA basin are folds, blind and emergent thrust faults, and strike-slip faults in the boundaryregion between the east–west trending Transverse ranges and northwest-trending Peninsular ranges structural provinces (Wright, 1991;Meigs and Oskin, 2002). Major thrust faults include the Raymond, Hollywood, Santa Monica, San Vincente (SV), Puente Hills blind thrust,and Coyote Hills blind thrust. Strike-slip faults include the Newport-Inglewood (NI), Alhambra Wash (AW), and Whittier faults. Key foldsinclude the Santa Monica Mountains anticlinorium, the Elysian Park anticlinorium (EPA), the McArthur Park escarpment (MPE), the CoyotePass escarpment (CPE), the Montebello Hills anticline (MBA), the La Cienegas monocline, the Coyote anticline (COA), the La Habra syncline(LHs), and the LA basin central trough. The Los Angeles and San Gabriel Rivers are marked by thin black lines. Compiled from Wright(1991); Schneider et al. (1996); Shaw and Shearer (1999); Dolan and Sieh, et al. (2000); Dolan, Stevens, et al. (2000); Tsutsumi et al. (2001);Meigs and Oskin (2002); Shaw et al. (2002); Myers et al. (2003).
108 A. J. Meigs, M. L. Cooke, and S. T. Marshall

the LA basin have the greatest uncertainty in terms of geo-metry, connectivity, slip rate, and earthquake potential (e.g.,Davis and Namson, 1994; Yeats and Huftile, 1995; Shawet al., 2002; Griffith and Cooke, 2005), three-dimensionalcharacterization of fault shape must be inferred from foldshape. Whereas kinematic models provide a geometricmeans for inferring fault shape from folds (e.g., Suppe,1983; Davis et al., 1989; Woodward et al., 1989; Suppeand Medwedeff, 1990; Shaw and Suppe, 1996), they excludethe mechanics of deformation. Kinematic models satisfy theequations of compatibility but do not satisfy force equili-brium equations, nor do they follow the constitutive lawsof deformation. Fault dislocation models, such as the modelsemployed in this study, readily produce both kinematicallycompatible and mechanically robust uplift fields that can becompared with geodetic and geologic data to determine faultorientation, shape, and slip rate (Stein et al., 1988; Ward andValensise, 1994; Myers et al., 2003; Savage and Cooke,2003; Griffith and Cooke, 2004; Savage and Cooke,2004; Argus et al., 2005).
Rock Uplift Map Construction
Our objective is a comparative analysis of uplift patternsas determined from geological data and models. To realizethis objective, an appropriate datum for measurement ofthe vertical uplift of structures that underlie the northern shelfmust be identified. A geologic marker such as the base of thePico Member of the Fernando Formation provides such adatum. The Pico Member is nearly ideal because of its con-tinuity throughout the study region, because upper fault tipsof blind thrusts occur at depths greater than the base of theunit (Wright, 1991; Schneider et al., 1996; Shaw andShearer, 1999; Tsutsumi et al., 2001; Shaw et al., 2002;Myers et al., 2003), and because the base of the unit is ofa known age and easily identifiable in subsurface data(Myers et al., 2003). Description of absolute uplift rates(or subsidence) would require a different choice of datum(sea level or paleowater depth, for example) because fault-related folding may produce localized uplift within a regionthat is otherwise characterized by net subsidence (Seeber andSorlien, 2000).
Rock uplift and uplift rates were determined in a two-step process (Fig. 1a,b). A series of cross sections was com-piled from Santa Monica in the west to the Coyote Hills inthe east (Figs. 2 and 3). Each of the sections extends to atleast a 3-km depth in the subsurface (Fig. 3). Outcrop dataand between 12 and 26 wells constrain the location and struc-tural geometry of folds, stratigraphic thickness, and growthstrata geometry across each cross section (see Fig. 3 captionfor original references). Subsurface structural relief is repre-sented by the difference between the subsurface depths of thebase of the Pico Member within folds relative to the depth atthe axis of the central trough (Fig. 1b).
We assume an average depth of �3000 m for the con-version of rock uplift from structural relief. Contour maps of
rock uplift reflect the difference between depth to the base ofthe Pico Member on a cross section and �3000 m at the axisof the LA trough (Fig. 4a). A contour map of rock uplift rateis based on point values of rock uplift on each cross sectiondivided by 2.9 Ma, the age of the base of the Pico Member(Fig. 4b). An age of 2.9 Ma for the base is older than otherpublished ages (Blake, 1991) and is based on a linear inter-polation between a dated tuff in near the top of the RepettoMember, a revised age for the Pico Member–San PedroFormation boundary, and the position of the Bruhnes–Matuyama paleomagnetic reversal within the San PedroFormation (Myers et al., 2003). The error in age of the baseis ∼10%, and the error associated with assuming an averagedepth for the Pico Member base is ∼15%.
Compaction represents a potential source of uncertaintyrelated with measuring rock uplift rate from structural reliefof sedimentary strata. The deepest parts of the LA troughmay have undergone greater compaction than the flanksof the uplifting anticlines and monoclines, which wouldresult in overestimation of structural relief because the upliftwill be underestimated to a greater degree within the basins(e.g., the LA trough) than on the crest of the anticlines. Asecond source of uncertainty in the rock uplift estimates isthe assumption that the base of the Pico Member is the sameage everywhere in the LA basin. Well data indicate that stratawithin the Pico Member thin, rather than onlap, across thelimbs and crest of folds (Fig. 3). Although this observationdoes not guarantee that time, and therefore rock, is not miss-ing across the crests of folds, it does indicate that limitedpaleorelief existed in the basin at the onset of Pico Memberdeposition. If significant paleorelief were present, the struc-tural relief may be overestimated; the degree of overestima-tion will be a proportion of the paleorelief and correspond tothe amount of compaction. Whereas these issues may be sig-nificant for the rates of rock uplift, in this study we placeheavier emphasis on the patterns of uplift. Uncertainties as-sociated with compaction, age, and paleorelief therefore donot affect the overall pattern of uplift associated with grow-ing structures or the comparison with model rates.
The map of rock uplift rate illustrates that the principalstructures are the Las Cienegas–Elysian Park anticlinoriumin the west and the Coyote Hills–Santa Fe Springs anticlinesin the east (Fig. 4) (Schneider et al., 1996; Shaw et al., 2002;Myers et al., 2003). A broad, southwest-sloping structuralhigh separating the Las Cienegas monocline on the south-west from the Elysian Park anticline on the northeast char-acterizes the Elysian Park anticlinorium (EPA) (Figs. 2, 3,and 4a). In the west, the EPA plunges to the west towardsthe West Beverly Hills lineament (Fig. 2). In the east, theEPA plunges to the east and loses structural relief at theSan Gabriel River (Figs. 2 and 3f,g). None of the individualaxial traces of the anticlines comprising the EPA extendacross the San Gabriel River. Rock uplift across the LasCienegas monocline are >1:0 mm=yr in the west and<0:6 mm=yr in the east since 2.9 Ma (Fig. 4a). To the south-east, the Coyote Hills–Santa Fe Springs anticlines form a dis-
Using Vertical Rock Uplift Patterns to Constrain the 3D Fault Configuration in the Los Angeles Basin 109
crete structural high separating the La Habra syncline andPuente Hills on the north from the axis of the LA troughon the south (Figs. 2 and 4a). Contours of rock uplift revealan arcuate shape to the axial trace of the Coyote Hills anti-cline, which plunges northwest towards Santa Fe Springs andthe San Gabriel River. A continuous anticline between theCoyote Hills and Santa Fe Springs is indicated, althoughstructural relief varies along strike. The structural relief of
the anticline has a local minimum at section I with greaterrelief to the east along the Coyote Hills (Fig. 3j,k) and tothe west at Santa Fe Springs (Fig. 3h). Rock uplift rate isgreatest in the Coyote Hills (>0:5 mm=yr; Fig. 4a). Whereasthe La Habra syncline is a prominent and regionally exten-sive structure, it is being uplifted with respect to the trough ofthe LA basin at rates comparable to the Coyote Hills anticline(Figs. 3h–k and 4a).
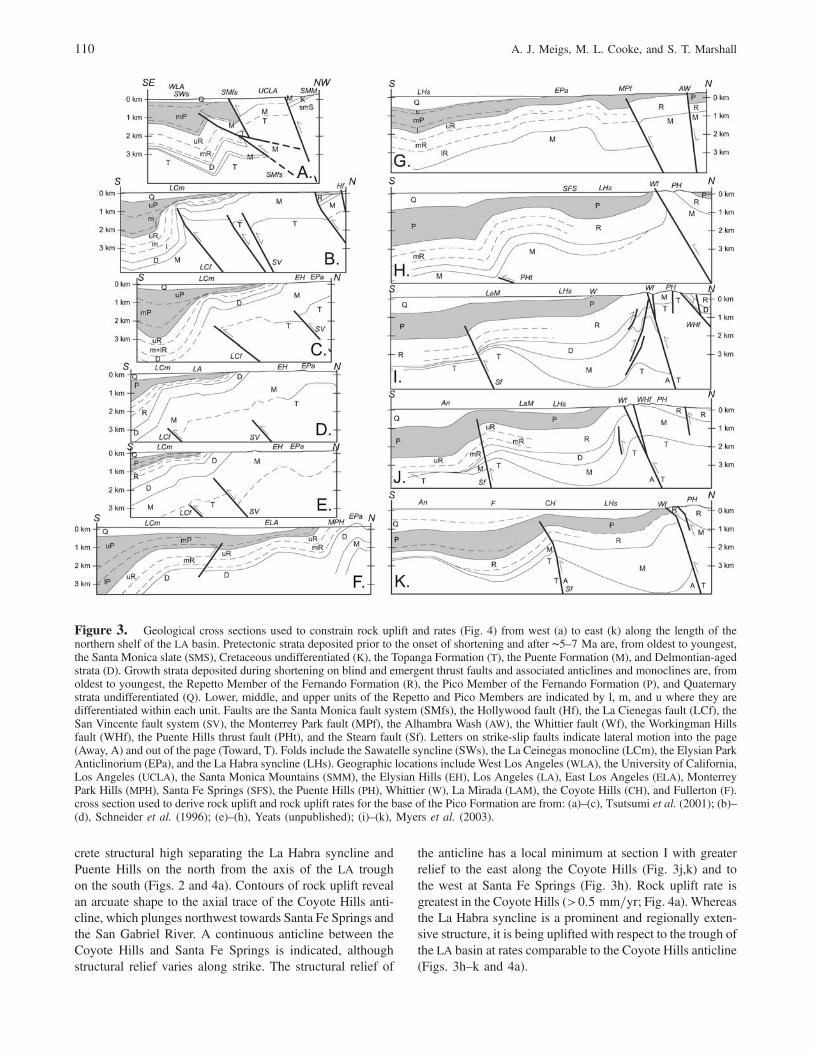
Figure 3. Geological cross sections used to constrain rock uplift and rates (Fig. 4) from west (a) to east (k) along the length of thenorthern shelf of the LA basin. Pretectonic strata deposited prior to the onset of shortening and after ∼5–7 Ma are, from oldest to youngest,the Santa Monica slate (SMS), Cretaceous undifferentiated (K), the Topanga Formation (T), the Puente Formation (M), and Delmontian-agedstrata (D). Growth strata deposited during shortening on blind and emergent thrust faults and associated anticlines and monoclines are, fromoldest to youngest, the Repetto Member of the Fernando Formation (R), the Pico Member of the Fernando Formation (P), and Quaternarystrata undifferentiated (Q). Lower, middle, and upper units of the Repetto and Pico Members are indicated by l, m, and u where they aredifferentiated within each unit. Faults are the Santa Monica fault system (SMfs), the Hollywood fault (Hf), the La Cienegas fault (LCf), theSan Vincente fault system (SV), the Monterrey Park fault (MPf), the Alhambra Wash (AW), the Whittier fault (Wf), the Workingman Hillsfault (WHf), the Puente Hills thrust fault (PHt), and the Stearn fault (Sf). Letters on strike-slip faults indicate lateral motion into the page(Away, A) and out of the page (Toward, T). Folds include the Sawatelle syncline (SWs), the La Ceinegas monocline (LCm), the Elysian ParkAnticlinorium (EPa), and the La Habra syncline (LHs). Geographic locations include West Los Angeles (WLA), the University of California,Los Angeles (UCLA), the Santa Monica Mountains (SMM), the Elysian Hills (EH), Los Angeles (LA), East Los Angeles (ELA), MonterreyPark Hills (MPH), Santa Fe Springs (SFS), the Puente Hills (PH), Whittier (W), La Mirada (LAM), the Coyote Hills (CH), and Fullerton (F).cross section used to derive rock uplift and rock uplift rates for the base of the Pico Formation are from: (a)–(c), Tsutsumi et al. (2001); (b)–(d), Schneider et al. (1996); (e)–(h), Yeats (unpublished); (i)–(k), Myers et al. (2003).
110 A. J. Meigs, M. L. Cooke, and S. T. Marshall

Three-Dimensional Fault Modelof the Los Angeles Basin
Southern California Earthquake Center CommunityFault Model
The CFM is a database of potentially seismogenic faultsacross the seismogenic crust of southern California using thebest available information on the location, dip, and along-
strike continuity. The fault surfaces are represented withinthe CFM as triangular tessellated surfaces to preserve thenonplanar surfaces and irregular fault intersections inferredin the subsurface. Faults within the CFM extend to the localbase of seismicity at roughly 18 km (Plesch et al., 2002).Fault representation uncertainty in the CFM is a functionof the strength of the available constraints (e.g., seismic linesand seismicity) on location and orientation (Plesch et al.,
Figure 4. (a) Rock uplift rate inverted from the depth of the base of the Pico Member of the Fernando Formation along the northern shelfof the LA basin. Rock uplift represents the structural relief of the base Pico Member relative to 3000 m at depth (Fig. 3). Rock uplift rate is thestructural relief divided by the age of the unit. The base of the Pico Formation is 2.9 Ma (Myers et al., 2003). Major structures defined in theFigure 2 caption. (b) Uplift and subsidence predicted from BEM of CFM version 2.5 (model 1). The Las Cienegas and Coyote/Santa FeSprings monocline and anticline are indicated by LC and CO/SFS, respectively.
Using Vertical Rock Uplift Patterns to Constrain the 3D Fault Configuration in the Los Angeles Basin 111

2002). A high confidence level is assigned to faults con-strained by direct observation, and a lower level of confi-dence is given to faults inferred from models or othersources. Alternative fault configurations are ranked accord-ing to preference of workers in the region. For this study, weexplore the preferred fault configuration of the CFM ver-sion 2.5 and several alternatives (Fig. 5). We focus on theblind fault system underlying the northern shelf of the LAbasin in the region bounded on the west by the Newport–Inglewood fault, in the north by the Santa Monica, Holly-wood, and Raymond faults, on the east by the eastern endof the Coyote segment of the Puente Hills thrust system,and on the south by the central trough of the LA ba-sin (Fig. 2).
Three-Dimensional Boundary-ElementMethod Models
The boundary-element method (BEM) is well suited forthe investigation of three-dimensional active faulting becausethis method accurately simulates deformation associatedwith sliding cracks within an elastic continuum (e.g.,Thomas, 1994; Crider and Pollard, 1998) Unlike other con-tinuum mechanics methods like finite element methods thatdiscretize the volumes around faults, the BEM requires dis-cretization of only the fault surfaces. This enables BEM mod-els to represent complex fault systems with fewer elementsand fewer three-dimensional meshing challenges. For thisstudy, we use the BEM code, POLY3D, developed by re-searchers at Stanford University (Thomas, 1994) and theIgeoss Corporation (www.igeoss.com). The triangular ele-ments that POLY3D uses to discretize fault surfaces permitthe accurate representation of the nonplanar and nonrectan-gular CFM faults (Griffith and Cooke, 2004, 2005; Cookeand Marshall, 2006). Whereas previous studies of southernCalifornia have used BEM models to investigate slip senseand tectonic boundary conditions (e.g., Griffith and Cooke2004, 2005), fault propagation (Olson and Cooke, 2005),and geologic fault slip rates (e.g., Cooke and Marshall,2006), here we use BEM models to predict locations of upliftand subsidence and compare results to an independent geo-logic data set.
The modeled CFM faults freely slip in response to boththe applied tectonic boundary conditions and interaction withnearby faults. We apply 72 nanostrain per year of contractionat N09°E and 0 nanostrain per year contraction at S81°E ac-cording to present-day geodetic velocities (Argus et al.,2005). Within three-dimensional models, these tectonicboundary conditions produce fault slip senses that match ex-pected slip sense (Griffith and Cooke, 2005) and slip ratesthat match the available geologic slip rates (Cooke andMarshall, 2006). Present-day tectonic boundary conditionsmay not have persisted over the 2.9 Ma following the begin-ning of deposition of the Pico Member and younger strata.Since 2.9 Ma, the San Gabriel block has rotated about ∼18°degrees counterclockwise (Molnar and Gipson, 1994;
Nicholson et al., 1994), strike-slip displacement along faultssuch as the Newport–Inglewood and Whittier faults mayhave increased (Wright, 1991; Bjorklund, 2002), and growthhas been initiated on the Coyote and Santa Fe Springs anti-clines (Shaw et al., 2002; Myers et al., 2003). Growth of theElysian Park anticlinorium, including the Las Cienegasmonocline, was initiated after ∼5 Ma and persists to the pre-sent (Wright, 1991; Schneider et al., 1996; Meigs and Oskin,2002; Meigs et al., 2003). Therefore, the CFM structures in-corporated into the BEM models were faults active over thetime frame beginning with deposition of the Pico Member.
The LA basin fault network of the CFM version 2.5 isused as boundaries within the mechanical model. Fault sur-face meshes of the CFM are adjusted so that element size isroughly constant in order to prevent numerical artifacts. Forsimilar reasons, every fault intersection is adjusted so that theelements intersect at coincident nodes to insure compatibilityof the resulting slip distribution. The model of the LA regionuses over 5200 elements to simulate 34 faults within an aver-age element diameter of 3 km. Most fault intersections withinthe upper 18 km were maintained in the model; however, afew minor faults were altered to abut against others to reduceinordinate complexity and improve stability of the model.
To simulate geologic deformation throughout the seis-mogenic crust, we extend the CFM faults from the base ofseismicity to a depth of 27.5 km where they sole into a freelyslipping horizontal detachment. This detachment sits at theinferred depth of the Moho imaged in Los Angeles regionseismic experiment 1 (LARSE I; Fuis et al., 2001) and is with-in the range of Moho depths inferred from seismic velocitymodeling of the region (Magistrale et al., 2000). The faultsurfaces between 18 and 27.5 km simulate the lower crustaldeformation that occurs within geologic times scales andyields more accurate surface geologic uplift rates. Majorfaults that intersect below 18 km were permitted to intersecteach other, but minor faults were assumed to abut into majorfaults below 18 km. For example, the LA fault and theVerdugo/Eagle Rock faults abut the Lower Elysian Park faultat ∼21 km depth. The Puente Hills fault is soft linked to theLower Elysian Park fault because the small interfault angleled to geometric instabilities within the model. This faultgeometry was shown by Cooke and Marshall (2006) tomatch well the geologic slip rates on the faults of theLA basin.
The modeled faults are embedded within a linear-elastichalf-space with Young’s modulus of 30 GPa and Poisson’sratio of 0.25; these values represent properties between thevalues for basement and the values for young sedimentarymaterial (Birch, 1966). If the models were to include the ef-fects of heterogeneous compliant sedimentary fill within theLA trough, the resulting uplift patterns might differ; we ex-pect the applied contraction would produce greater fault slipwithin the stiffer basement rocks than within the more com-pliant sedimentary rocks. Lesser slip within the near-surfacesediments might diffuse the local expression of geologicuplift from the model results presented here. An implicit as-
112 A. J. Meigs, M. L. Cooke, and S. T. Marshall
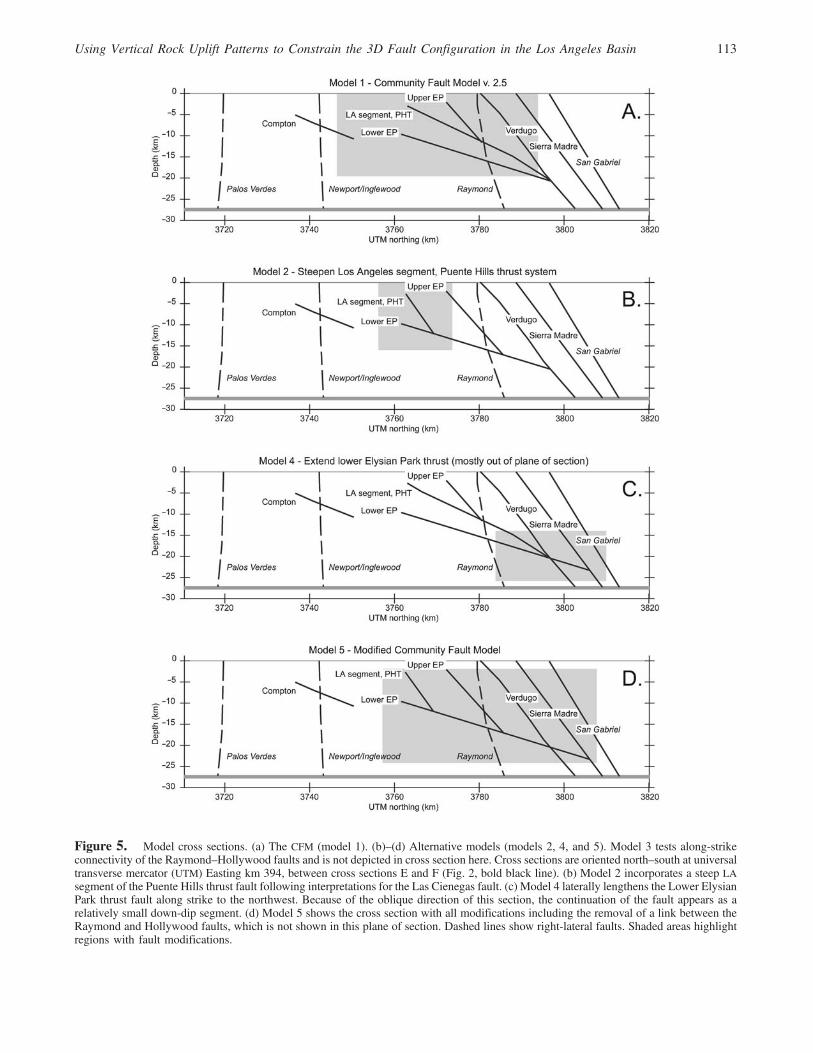
Figure 5. Model cross sections. (a) The CFM (model 1). (b)–(d) Alternative models (models 2, 4, and 5). Model 3 tests along-strikeconnectivity of the Raymond–Hollywood faults and is not depicted in cross section here. Cross sections are oriented north–south at universaltransverse mercator (UTM) Easting km 394, between cross sections E and F (Fig. 2, bold black line). (b) Model 2 incorporates a steep LAsegment of the Puente Hills thrust fault following interpretations for the Las Cienegas fault. (c) Model 4 laterally lengthens the Lower ElysianPark thrust fault along strike to the northwest. Because of the oblique direction of this section, the continuation of the fault appears as arelatively small down-dip segment. (d) Model 5 shows the cross section with all modifications including the removal of a link between theRaymond and Hollywood faults, which is not shown in this plane of section. Dashed lines show right-lateral faults. Shaded areas highlightregions with fault modifications.
Using Vertical Rock Uplift Patterns to Constrain the 3D Fault Configuration in the Los Angeles Basin 113
sumption in our approach is that loci of uplift and subsidenceproduced by the elastic model are a proxy for regions ofuplift and subsidence revealed by the structural and strati-graphic data. Whereas the deformation within elastic modelsis recoverable, geologic materials accumulate permanentstrains via distributed inelastic processes such as microcrack-ing, grain boundary sliding, and calcite twinning. These in-elastic processes are not simulated in our models, but thedistribution of inelastic deformation should mimic the elasticstress field; for example, greatest microcracking occurswhere stresses are greatest. Elastic deformation acquiredon short time scales (i.e., slip on fault in an earthquake)can be accommodated by inelastic processes, which wouldpreserve strain and dissipate stresses over longer time scales.Thus, the pattern of uplift within our elastic models approxi-mates the first-order deformation of geologic materials, in-cluding inelastic processes.
The absolute rates of model uplift are expected to besignificantly less than those inferred from the geologic databecause the modeled faults are embedded in an unlayeredlinear-elastic half-space. This half-space formulation doesnot incorporate inelastic flexural slip along bedding planesthat act to tighten and increase amplitude of folds (e.g.,Erickson, 1996; Johnson and Johnson, 2000; Savage andCooke, 2003), thereby increasing local uplift rates. Thestrong tendency for flexural slip to enhance folding may,in many settings, overwhelm the diffusing effect of near-surface soft sediments. Although the amplitude of modeland geologic uplift may not be matched, the pattern of fold-ing can be matched with half-space models (e.g., Savage andCooke, 2004). The critical comparison, from the point ofview of exploring fault geometries that best fit the data, isbetween the geologically constrained pattern of uplift andsubsidence associated with major structures and the patternsarising from three-dimensional models.
Comparison of Model and GeologicUplift Rate Patterns
Model-data compatibility was evaluated on the basis ofstructural trend, spatial variation in rates, and location ofmajor structures (i.e., near-surface folds). Whereas the geo-logical cross sections capture the structural details, BEMmodels produce regions of uplift and subsidence that are con-trolled by fault geometry, connectivity, interaction of closelyspaced faults, and contraction rate. It is unreasonable, there-fore, to expect that the BEMmodels will match the geologicaldata on the scale of the fine details of the structures. Further-more, uncertainties associated with compaction, age, andpaleorelief may influence the details of the geologic structur-al relief. Regions of uplift and subsidence produced by BEMmodels should, however, capture the major regions of geo-logic uplift and subsidence. A key feature, for example, thatshould result from the models is the central trough of the LAbasin (Fig. 2). To the east of the San Gabriel River, modelsare expected to accurately mimic the location and extent of
the structural highs associated with the Coyote and Santa FeSprings anticlines and the structural low represented by theLa Habra syncline. West of the San Gabriel River, the EPA,including the Las Cienegas monocline, extends to theNewport–Inglewood fault (Fig. 2) and has greater structuralrelief than the Santa Fe and Coyote anticlines. Cross sectionsC, F, and H, which depict the major structures to the west andeast of the San Gabriel River, respectively, are used to high-light data-model compatibility (Figs. 2 and 6–8)
Model 1: CFM Version 2.5
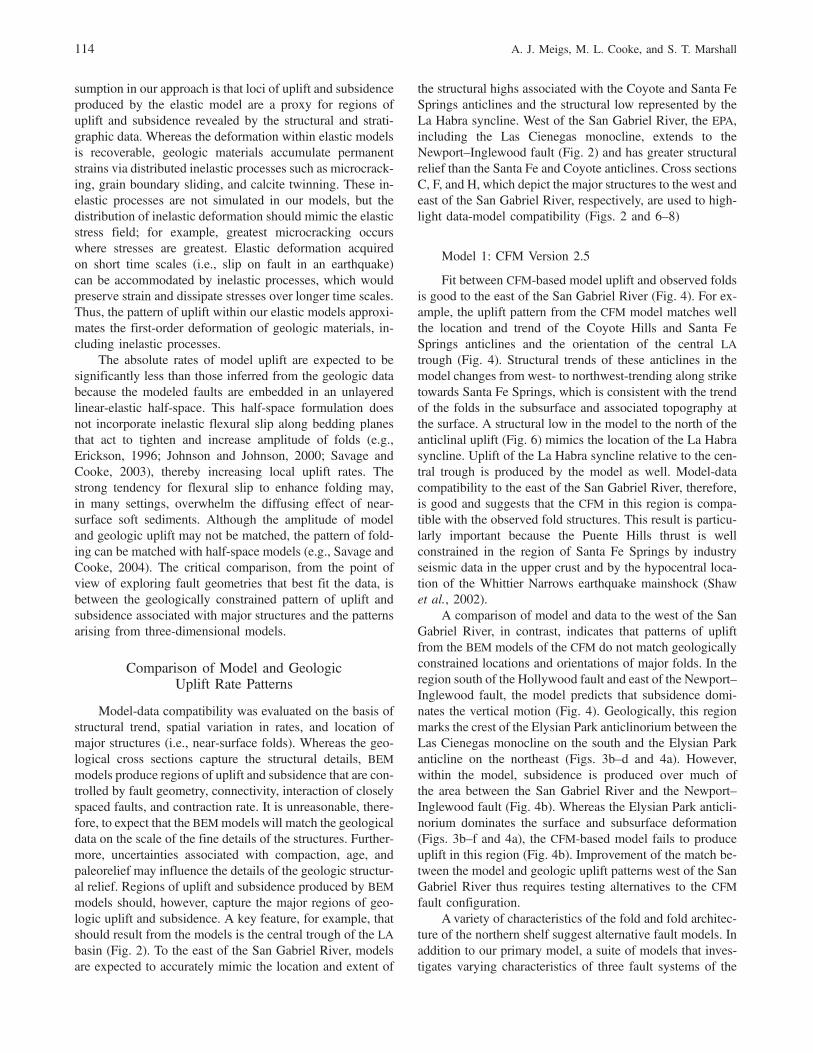
Fit between CFM-based model uplift and observed foldsis good to the east of the San Gabriel River (Fig. 4). For ex-ample, the uplift pattern from the CFM model matches wellthe location and trend of the Coyote Hills and Santa FeSprings anticlines and the orientation of the central LAtrough (Fig. 4). Structural trends of these anticlines in themodel changes from west- to northwest-trending along striketowards Santa Fe Springs, which is consistent with the trendof the folds in the subsurface and associated topography atthe surface. A structural low in the model to the north of theanticlinal uplift (Fig. 6) mimics the location of the La Habrasyncline. Uplift of the La Habra syncline relative to the cen-tral trough is produced by the model as well. Model-datacompatibility to the east of the San Gabriel River, therefore,is good and suggests that the CFM in this region is compa-tible with the observed fold structures. This result is particu-larly important because the Puente Hills thrust is wellconstrained in the region of Santa Fe Springs by industryseismic data in the upper crust and by the hypocentral loca-tion of the Whittier Narrows earthquake mainshock (Shawet al., 2002).
A comparison of model and data to the west of the SanGabriel River, in contrast, indicates that patterns of upliftfrom the BEM models of the CFM do not match geologicallyconstrained locations and orientations of major folds. In theregion south of the Hollywood fault and east of the Newport–Inglewood fault, the model predicts that subsidence domi-nates the vertical motion (Fig. 4). Geologically, this regionmarks the crest of the Elysian Park anticlinorium between theLas Cienegas monocline on the south and the Elysian Parkanticline on the northeast (Figs. 3b–d and 4a). However,within the model, subsidence is produced over much ofthe area between the San Gabriel River and the Newport–Inglewood fault (Fig. 4b). Whereas the Elysian Park anticli-norium dominates the surface and subsurface deformation(Figs. 3b–f and 4a), the CFM-based model fails to produceuplift in this region (Fig. 4b). Improvement of the match be-tween the model and geologic uplift patterns west of the SanGabriel River thus requires testing alternatives to the CFMfault configuration.
A variety of characteristics of the fold and fold architec-ture of the northern shelf suggest alternative fault models. Inaddition to our primary model, a suite of models that inves-tigates varying characteristics of three fault systems of the
114 A. J. Meigs, M. L. Cooke, and S. T. Marshall
CFM: model 2, the LA segment of the Puente Hills blindthrust fault; model 3, a low-angle detachment below thesefaults (the Lower Elysian Park thrust (Davis et al., 1989);and model 4, the Hollywood and Raymond faults (Fig. 5).All other CFM faults are unchanged in models 2–4. The ob-jective in testing alternative models is to create patterns ofuplift that more closely mimic the location, trend, and rela-tive rate of uplift as recorded by the observed folds. Changesin fault dip, lateral extent, and connectivity based on surfaceand subsurface data will affect model uplift patterns andthereby potentially decrease the mismatch between modelsand data. Variability of a single parameter (e.g., fault dip)for a given fault is tested in each alternative model (models 2–4; Figs. 7 and 8). A fifth model data comparison includes allthe modified fault geometries (model 5; Figs. 8 and 9).
Two transects are used to assess the effects of varyingfault geometry on patterns of uplift and uplift rate west of theSan Gabriel River. Transect C represents the fold structure inthe west near the Newport–Inglewood fault (Figs. 2 and 3c).Major features of the structure on transect C are the centraltrough and northern shelf structures, including the LasCienegas monocline, and the crest of the Las Cienegas
monocline (Fig. 4a). Transect F, which is parallel to and im-mediately west of the San Gabriel River (Figs. 2 and 3f),shows a geologic structure characterized by a step-like pro-file where structural relief and uplift rate change rapidlyacross the Las Cienegas monocline, gradually across thecrest of the Las Cienegas monocline, and rapidly acrossthe eastern Elysian Park anticline from south to north, re-spectively (Fig. 3f).
Model 2: Steepen the Los Angeles Segment of thePuente Hills Thrust System
Dip and location of the LA segment of the Puente Hillsthrust (PHT) system in the CFM have been interpreted fromgeometric-kinematic models based on growth strata geome-try observed in seismic lines (Plesch et al., 2002; Shaw et al.,2002) and has been assigned a 27° dip (Fig. 5). The upper tipof the LA segment of the PHT as proposed by Shaw et al.(2002) follows the trace of the Las Cienegas monoclineand fault mapped by Schneider et al. (1996) and Wright(1991). Direct observation of the fault dip at depth is pro-vided by well data, which intersect a fault that dips 60° toa 4-km depth (referred to as the Las Cienegas fault) (Schnei-
Figure 6. Plots of geologic rock uplift rate (top) and CFM-based and alternative model results along transect H across the Puente Hillsanticline (bottom). Individual alternative models include steepening the LA fault to match dip of the Las Cienegas fault (model 2), discon-necting the Raymond from the Hollywood faults (model 3), and lengthening the Lower Elysian Park ramp (model 4). Model 5 incorporatesall alternative fault configurations tested in models 2–4. See Figure 2 for location.
Using Vertical Rock Uplift Patterns to Constrain the 3D Fault Configuration in the Los Angeles Basin 115
der et al., 1996). If the Las Cienegas monocline is the up-dipexpression of the Las Cienegas fault at depth, the continuityof the monocline is a proxy for the fault location fromthe Newport–Inglewood fault to the San Gabriel River(Fig. 3b–f). Steepening the LA segment in the CFM to 60°is therefore equivalent to extending the Las Cienegas faultalong-strike, which, in the CFM, is restricted to a short seg-ment in the northwest portion of the Los Cienegas monoclinetrend (Fig. 1).
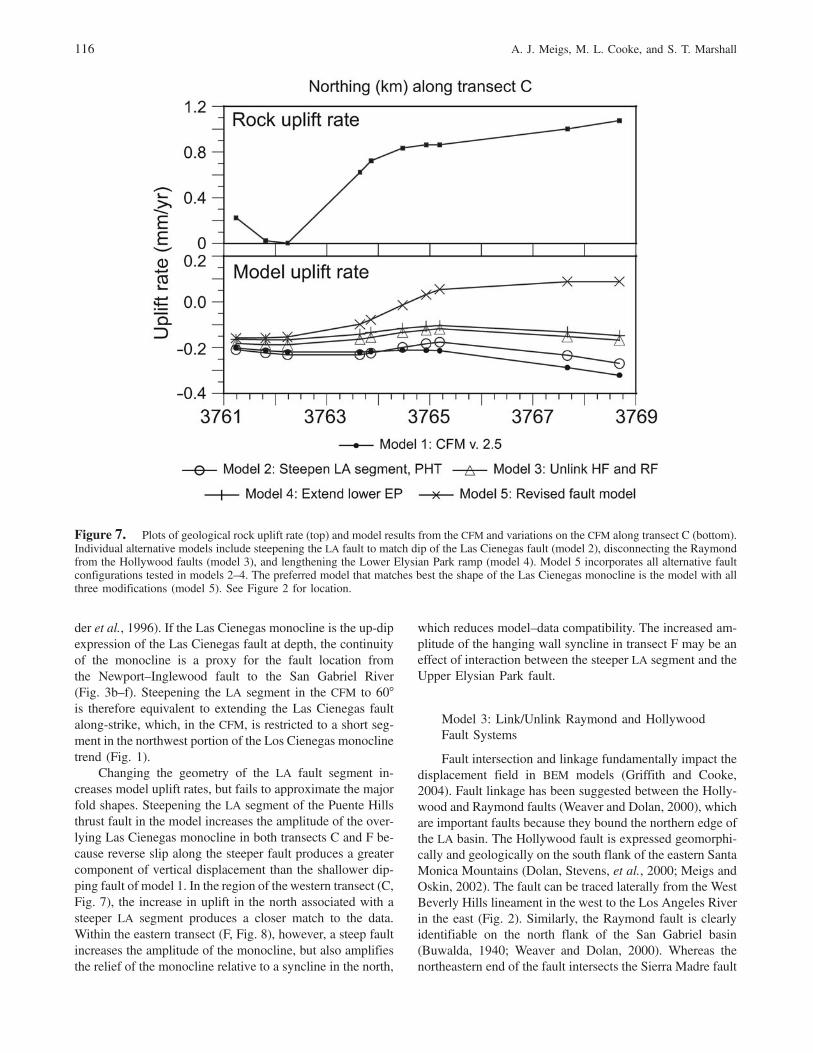
Changing the geometry of the LA fault segment in-creases model uplift rates, but fails to approximate the majorfold shapes. Steepening the LA segment of the Puente Hillsthrust fault in the model increases the amplitude of the over-lying Las Cienegas monocline in both transects C and F be-cause reverse slip along the steeper fault produces a greatercomponent of vertical displacement than the shallower dip-ping fault of model 1. In the region of the western transect (C,Fig. 7), the increase in uplift in the north associated with asteeper LA segment produces a closer match to the data.Within the eastern transect (F, Fig. 8), however, a steep faultincreases the amplitude of the monocline, but also amplifiesthe relief of the monocline relative to a syncline in the north,
which reduces model–data compatibility. The increased am-plitude of the hanging wall syncline in transect F may be aneffect of interaction between the steeper LA segment and theUpper Elysian Park fault.
Model 3: Link/Unlink Raymond and HollywoodFault Systems
Fault intersection and linkage fundamentally impact thedisplacement field in BEM models (Griffith and Cooke,2004). Fault linkage has been suggested between the Holly-wood and Raymond faults (Weaver and Dolan, 2000), whichare important faults because they bound the northern edge ofthe LA basin. The Hollywood fault is expressed geomorphi-cally and geologically on the south flank of the eastern SantaMonica Mountains (Dolan, Stevens, et al., 2000; Meigs andOskin, 2002). The fault can be traced laterally from the WestBeverly Hills lineament in the west to the Los Angeles Riverin the east (Fig. 2). Similarly, the Raymond fault is clearlyidentifiable on the north flank of the San Gabriel basin(Buwalda, 1940; Weaver and Dolan, 2000). Whereas thenortheastern end of the fault intersects the Sierra Madre fault
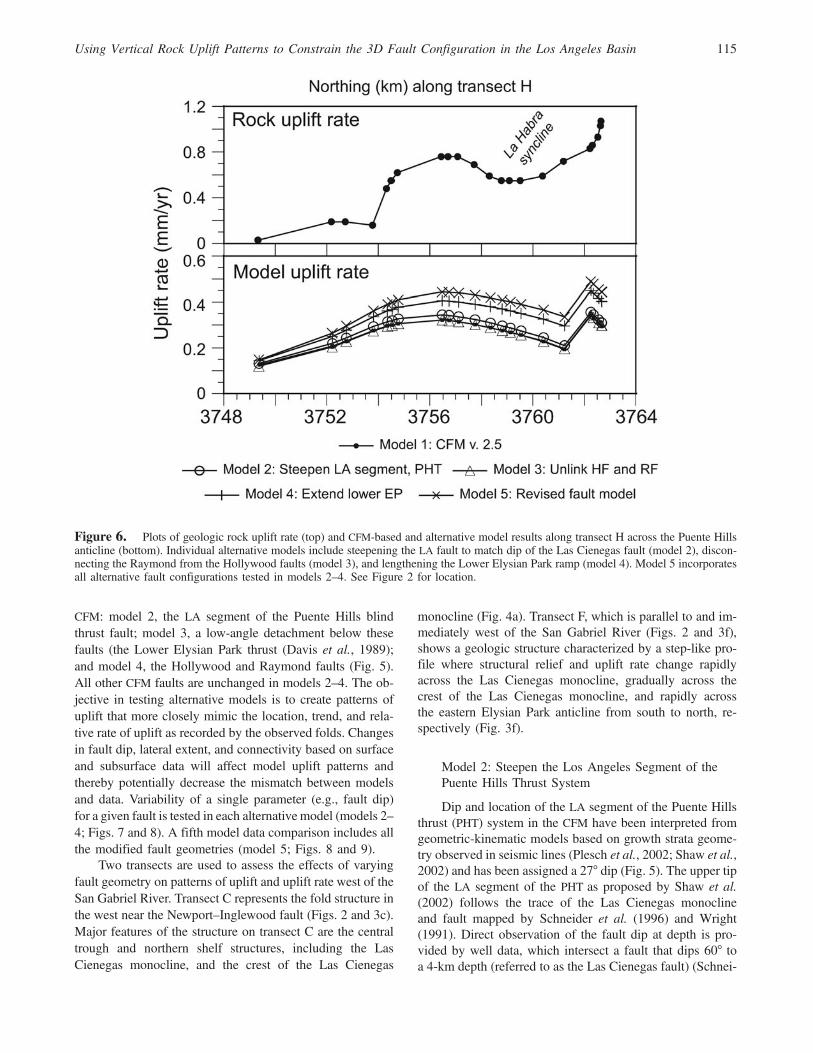
Figure 7. Plots of geological rock uplift rate (top) and model results from the CFM and variations on the CFM along transect C (bottom).Individual alternative models include steepening the LA fault to match dip of the Las Cienegas fault (model 2), disconnecting the Raymondfrom the Hollywood faults (model 3), and lengthening the Lower Elysian Park ramp (model 4). Model 5 incorporates all alternative faultconfigurations tested in models 2–4. The preferred model that matches best the shape of the Las Cienegas monocline is the model with allthree modifications (model 5). See Figure 2 for location.
116 A. J. Meigs, M. L. Cooke, and S. T. Marshall
(Crook et al., 1987), its southwestern end is uncertain(Weaver and Dolan, 2000). Despite the fact that both theRaymond and Hollywood faults project laterally along-striketowards the Los Angeles River, there is no through-goingfault trace at the surface to indicate they are different strandsof the same fault system (Dibblee, 1989, 1991).
Model 3 was constructed with no connection alongstrike (unlinked) between the Raymond and Hollywoodfaults (Fig. 5). Uplift across the crest of the Las Cienegasmonocline is higher than that for model 1 and better matchesthe geologic pattern across the western transect C in the un-linked model (Fig. 7b). The model-created syncline in thehanging wall of the LA segment has lower amplitude whenthe link between the Raymond and Hollywood faults is re-moved. The resultant fold shape more closely resembles amonocline than it does an anticline–syncline pair. Increasesin structural relief between the Las Cienegas monocline crestand the Elysian Park anticline are seen on the eastern transect(F, Fig. 8b). Although uplift rate across the crest of the LasCienegas monocline is effectively unchanged from model 1,
an increased uplift rate on the northern end of transect F hasthe effect of increasing the differential relief between thenorthern region of the model and points to the south. Asa result of the increase in rate on the north, the uplift patternmore closely mimics the observed fold geometry.
Removing the link between the Raymond and Holly-wood faults increases average reverse slip along the UpperElysian Park fault from 0.3 to 0:4 mm=yr, which subse-quently increases the amplitude of the overlying Elysian Parkanticline. Furthermore, average reverse slip along the Holly-wood and Raymond faults is reduced from 0.7 to 0:4 mm=yr, respectively. These reductions, along with removal of thelink, which has 1:0 mm=yr reverse slip in model 1 (theCFM), transfer a greater proportion of contraction tothe hanging walls of the Upper Elysian Park and Puente HillsThrust faults.
Model 4: Extend Lower Elysian Park Thrust
In model 4, the Lower Elysian Park thrust is continuedalong strike to the northwest to test the impact of a laterally
Figure 8. Plots of geologic rock uplift rate (top) and model results from the CFM and variations on the CFM along transect F (bottom).Individual alternative models include steepening the LA fault to match dip of the Las Cienegas fault (model 2), lengthening the Lower ElysianPark ramp (model 3), and disconnecting the Raymond from the Hollywood faults (model 4). Model 5 incorporates all alternative faultconfigurations tested in models 2–4. The preferred model that matches best the shape of the Las Cienegas monocline and the Elysian Parkanticline is the model with all three modifications. See Figure 2 for location.
Using Vertical Rock Uplift Patterns to Constrain the 3D Fault Configuration in the Los Angeles Basin 117
extensive deep ramp on the uplift field. The extended portionof the Lower Elysian Park low-angle detachment intersectsthe Verdugo, Hollywood, Santa Monica, and Sierra MadreWest faults providing greater fault connectivity to the model.The CFM and other models of the fault structure of the LAbasin hypothesize the existence of the Lower Elysian Parkthrust, a deep north-dipping blind fault (extending from adepth of 10 km on the south to >20 km below the PuenteHills thrust system (Fig. 5a). Originally inferred from
geometric-kinematic models of the Elysian Park anticlinor-ium (Davis et al., 1989), the Lower Elysian Park thrust hasbeen invoked to explain a syncline in the footwall of the San-ta Fe Springs segment of the Puente Hills thrust (Shaw andShearer, 1999; Shaw et al., 2002). According to the CFM,therefore, the fault system under metro LA is a stack of shal-lowly north-dipping thrust sheets. The Lower Elysian Parkfault dips ∼20° to the northeast and is located structurallybeneath the ∼27° northeast-dipping Puente Hills thrust sys-
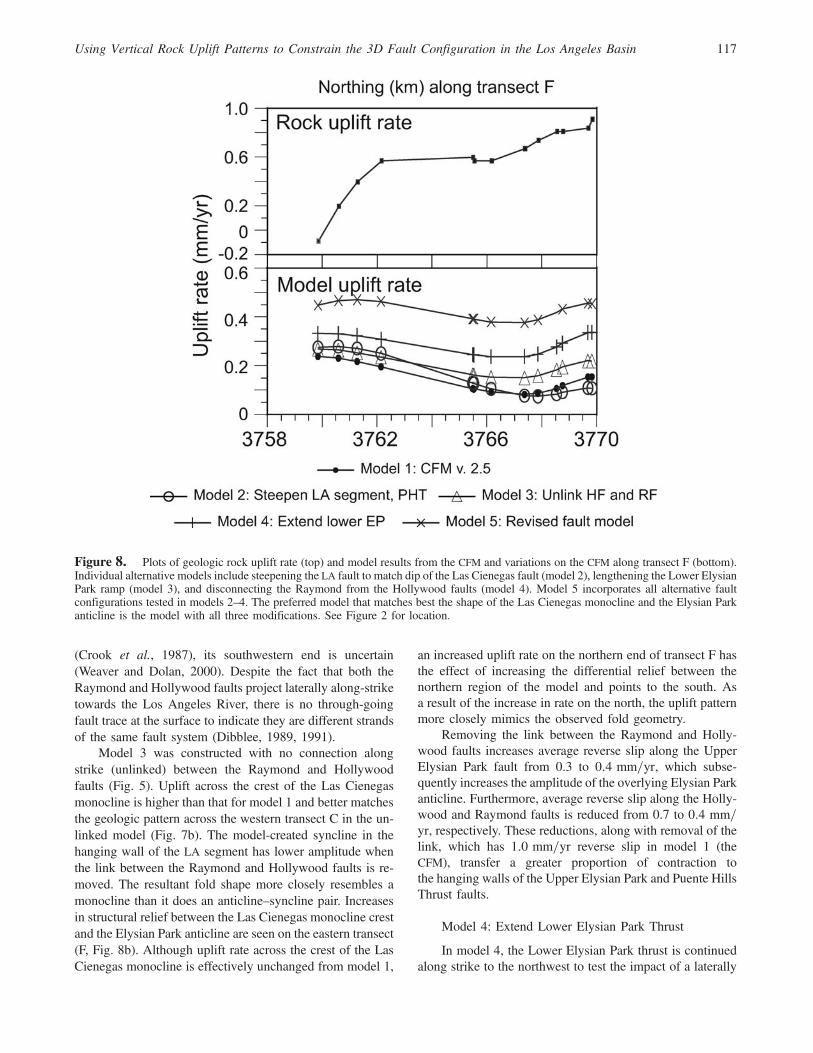
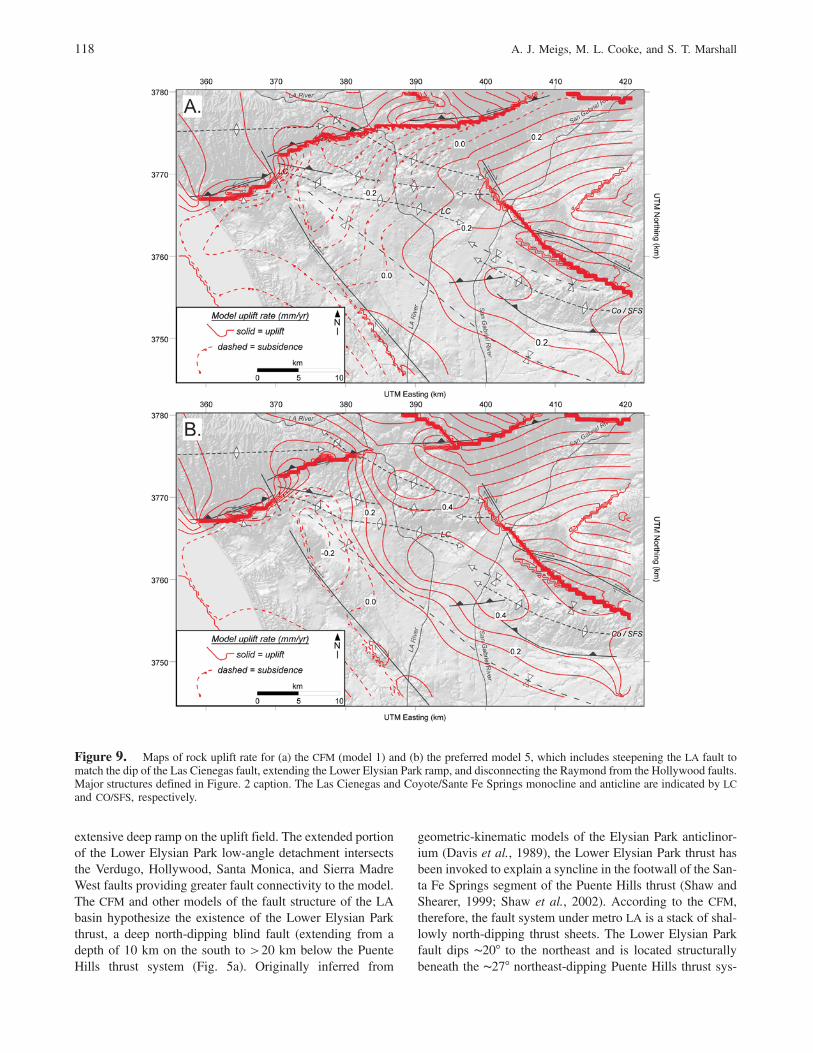
Figure 9. Maps of rock uplift rate for (a) the CFM (model 1) and (b) the preferred model 5, which includes steepening the LA fault tomatch the dip of the Las Cienegas fault, extending the Lower Elysian Park ramp, and disconnecting the Raymond from the Hollywood faults.Major structures defined in Figure. 2 caption. The Las Cienegas and Coyote/Sante Fe Springs monocline and anticline are indicated by LCand CO/SFS, respectively.
118 A. J. Meigs, M. L. Cooke, and S. T. Marshall
tem (Shaw et al., 2002). An alternative to this structural ar-chitecture is suggested by results from the LARSE I geophy-sical experiment (Fuis et al., 2001). The crustal scale crosssection suggested by the LARSE I data consists of a singlenorth-dipping ramp at depth beneath LA. Blind and emergentfaults in the LA basin are interpreted to root into this décolle-ment (Fuis et al., 2001). The crustal structure across the east-ern Santa Monica Mountains, the Verdugo Mountains, andthe southern San Gabriel Mountains is consistent with amodel of crustal structure consisting of a single master rampat depth (Meigs et al., 2003).
Unlinking the Raymond and Hollywood faults and ex-tending the Lower Elysian Park thrust have similar effects onthe form of the uplift rate across the two transects (Figs. 7and 9). Extending the Lower Elysian Park fault nearly dou-bles the model uplift rate from CFM values for both tran-sects C and F (Figs. 8 and 9). A clear monoclinal form resultsfrom extending the Lower Elysian Park thrust to the north-west (Fig. 7b). Lateral extension of the Lower Elysian Parkfault to the region of transect F (Fig. 8) increases the upliftrate gradient and structural relief, which represents a bettermatch to the geologic data across the Las Cienegas mono-cline crest and the Elysian Park anticline. Whereas the formof the model uplift pattern mimics well the crest of the LasCienegas monocline and the south limb of the Elysian Parkanticline, the southern limb of the Las Cienegas monocline inthis and the other models is farther south than in the geologicdata (Fig. 7b). Mismatch between the model and observedfold limb location may reflect poor control on the fault loca-tion. Alternatively, flexural slip within the strata overlyingthe Las Cienegas fault would tighten the hanging wall foldand shift the monoclinal limb slightly to the north therebyexplaining the mismatch.
Extending the Lower Elysian Park thrust enhances theconnectivity of faults within the model, which increasesreverse slip along the Lower Elysian Park, Upper ElysianPark, Hollywood, and Raymond faults. Average reverse slipalong the Lower Elysian Park fault increases from 0.6 to0:8 mm=yr, and reverse slip rates along the Upper ElysianPark, Hollywood and Raymond faults increases by 0.07,0.2, and 0:1 mm=yr, respectively. Increased reverse slipalong the upper Elysian Park fault serves to amplify thedevelopment of the Elysian Park monocline whereas in-creased reverse slip on the deep Lower Elysian Park faulthas the effect of increased uplift over the broad region repre-sented within transects C and F.
Model 5: An Alternative CFM
An alternate CFM (model 5) includes (1) a steep LA seg-ment of the Puente Hills thrust, (2) unlinked Raymond andHollywood faults, and (3) a Lower Elysian Park thrust thatextends from the San Gabriel River to the northwest underthe Santa Monica Mountains, which results in uplift rates anda pattern of uplift that departs from that of the CFM modeland approaches that of the geologically defined folds
(Figs. 7–9). Marked improvement in model-data compatibil-ity is seen in both map and cross-section views (Figs. 7–9). Aclearly defined northwest-trending region of subsidence islocalized to the east of the Newport–Inglewood fault, whichcoincides well with the location of the central trough of theLA basin (Fig. 2). Some features of the Elysian Park anti-clinorium are more clearly expressed in the compositemodel. A doubly plunging west–northwest-trending regionof uplift, for example, develops to the south of the Raymondand Hollywood faults at the location of the Elysian Park anti-cline (Figs. 2, 5, and 9). Discrete anticlinal crests are createdin the region of the Las Cienegas monocline on the south andthe Elysian Park anticline on the north. The model well de-scribes the monoclinal form of the geologic structure in theregion of transect C in the west (Fig. 7). To the east, alongtransect F, the measured uplift rate increases uniformly fromthe monocline northward, whereas the model uplift rate de-creases and then increases from south to north (Fig. 8). Upliftin the region of the Santa Fe and Coyote segments of thePuente Hills thrust system is higher and more laterally exten-sive in model 5 than in the CFM (model 1). Uplift rates frommodel 5 more closely approximate geologic rates, althoughthe fit in the east on transect F is better than in the west ontransect C (compare Figs. 7 and 8). Whereas the alternatefault geometries of model 5 do not affect the pattern of upliftabove the Santa Fe Springs thrust, they do cause an overallincrease in uplift rate (Fig. 6).
Discussion
The sensitivity of uplift pattern to alterations in subsur-face fault configuration within the LA basin reveals the in-fluence of fault connectivity and fault area on fault slip rates.Steepening the LA segment of the Puente Hills thrust fault sothat it soles into the Lower Elysian Park fault, as in the pre-ferred model (model 5; Fig. 5), decreases fault surface area ofthe LA segment dramatically from 795 to 268 km2. Becausethe fault is smaller and steeper, we should expect a decreasein slip rate along the steeper LA segment of the Puente Hillsthrust fault. Smaller faults generally slip at slower rates thanlarger faults. Furthermore, isolated 60°-dipping faults are lessfavorably oriented for slip under horizontal contraction than30°-dipping faults. Whereas we expect slower slip rates, theaverage reverse slip rate along the LA segment increasesfrom 0.5 to 0:6 mm=yr between the CFM (model 1) andmodel 5. Fault slip and associated uplift are thus morestrongly influenced by the connectivity of the faults thanby fault dip and fault area.
Cooke and Marshall (2006) show that fault slip ratesfrom three-dimensional mechanical models using the CFMversion 2.5 match well the geologic and paleoseismic sliprates on most faults of the LA basin. The alterations tothe fault geometry within the preferred model presented heremay affect the match to available geologic slip rate data.Faults that change by 0:2 mm=yr or more in average reverseor strike-slip rates from model 1 to the preferred model 5 are
Using Vertical Rock Uplift Patterns to Constrain the 3D Fault Configuration in the Los Angeles Basin 119

the Upper Elysian Park, Hollywood, Lower Elysian Park,Raymond, Sierra Madre West, and Verdugo faults (Table 1).The 0:2 mm=yr reduction of reverse slip along the WesternSierra Madre fault is still within the geologic range(0:6 mm=yr; Crook et al., 1987; Rubin et al., 1998). Thefault surface area on the Upper Elysian Park fault is un-changed, but revisions to the CFM model increase the reverseslip rates from 0:3 mm=yr in model 1 to 0:5 mm=yr inmodel 5. The model 5 slip rate is closer to the geologic rateson the Upper Elysian Park fault (0:58–2:2 mm=yr; Oskinet al., 2000) than the CFM-based model 1. A larger LowerElysian Park fault area increases the reverse slip rate, but thefaster rate of 0:8 mm=yr is significantly less than the1:3–2:1 mm=yr estimated from geometric models (Shawand Suppe, 1996). Between the CFM-based and the preferredmodel, the strike-slip rates decrease on the Raymond andHollywood faults with the removal of the link between these
faults. The preferred model slip rate for the Hollywood faultis within the paleoseismic estimate of >0:35 mm:yr (Dolanet al., 1997) and the geologic estimate of 0.5 to 0:6 mm=yr(Meigs and Oskin, 2002). In contrast, the modeled Raymondfault strike-slip rate is 0:9 mm=yr in model 5, which isslower than the lower bound of the geologic estimate(1:5 mm=yr; Marin et al., 2000). Connectivity with the near-by Verdugo and Eagle Rock faults likely influences slip ratealong the Raymond fault and further alternatives might im-prove the mismatch.
These examples of slip rate changes without associatedchanges in fault surface area or dip further demonstrate thefirst-order effects of fault system configuration and connec-tivity on fault slip rates. Moreover, because the BEM modelsinclude off-fault deformations such as folding, the slip ratesalong the faults need not sum to the regional contractionrates. Several of the model variations tested here produced
Table 1Average Fault Slip Rates for the Los Angeles Basin (Working Group of California Earthquake Probabilities [WGCEP], 2006)
Geologic Rates CFM Model Preferred Model
FaultReverse Slip
(mm/yr)Left-Lateral Slip
(mm/yr)Reverse Slip(mm/yr)
Left-Lateral Slip(mm/yr)
Net slip(mm/yr)
Reverse Slip(mm/yr)
Left-Lateral Slip(mm/yr)
Net Slip(mm/yr)
Palos Verdes 0.26–0.38 �2:5 to � 3:8 0.0 �3:2 3.2 0.0 �3:2 3.2San Gabriel �1:0 to � 2:5 1.7 �1:5 2.3 1.7 �1:5 2.2
Sierra Madre East 0.1–5.0 2.3 �0:2 2.3 2.2 �0:2 2.2
Cucamonga >4:5 1.9 0.8 2.1 1.9 0.8 2.1
Whittier/Glen Ivy �1:0 to � 3:0 0.4 �1:8 1.8 0.4 �1:8 1.8
Sierra Madre West 0.6–2.2 1.5 �0:6 1.6 1.3 �0:6 1.4
Northridge 1.2 �0:4 1.3 1.2 �0:4 1.3
Chino �0:35 to � 1:9 1.0 �0:7 1.2 1.0 �0:7 1.2
Newport–Inglewood �0:3 to � 1:5 0.2 �1:2 1.2 0.1 �1:2 1.2
Fontana 0.2 1.0 1.1 0.2 1.0 1.1
Lower Elysian Park 0.6 �0:6 0.8 0.8 �0:6 1.0
Santa Monica 0.5–1.3 0.8 0.6 1.0 0.7 0.6 1.0
Workman Hill 0.6 �0:8 1.0 0.6 �0:8 1.0
Verdugo/Eagle Rock 0.5 �0:6 0.8 0.7 �0:6 0.9
Clamshell–Sawpit 0.4 0.7 0.8 0.4 0.7 0.8
Raymond >1:5 0.7 0.9 1.2 0.4 0.6 0.8
San Jose 0.4 0.6 0.7 0.4 0.6 0.7
Uplands 0.3 0.6 0.6 0.3 0.6 0.6
Hollywood >0:35 0.7 0.6 1.0 0.5 0.4 0.6
Los Angeles/Las Cienegas
0.5 �0:1 0.5 �0:6 �0:2 0.6
Walnut Creek 0.2 0.5 0.6 0.2 0.5 0.6
Peralta Hills 0.5 0.0 0.5 �0:5 0.0 0.5
East Montebello(Alhambra, WA)
0.3 �0:4 0.5 0.2 �0:5 0.5
Puente Hills 0.4–1.7 0.4 0.1 0.5 0.5 0.1 0.5
Upper Elysian Park 0.58–2.2 0.3 �0:1 0.3 0.5 0.0 0.5
San Joaquin Hills 0.3 �0:2 0.4 0.3 �0:2 0.4
Compton 0.3 0.0 0.3 0.3 0.0 0.3
Redondo 0.0 �0:3 0.3 0.0 �0:3 0.3
San Vicente 0.2 0.0 0.2 0.3 0.1 0.3
Richfield 0.2 0.1 0.2
120 A. J. Meigs, M. L. Cooke, and S. T. Marshall

net decrease or increase in fault slip rates, while the overallcontraction was balanced by changes in contraction accom-modated between faults. Kinematic models, which assumethat fault slip rates should sum to the overall deformation,neglect to consider the deformation that occurs between faultsurfaces and are likely to misrepresent fault slip rates.
Changes to fault surface area between the CFM and thepreferred model 5, which best matches the uplift pattern, mayalter the degree of seismic hazard estimates on the activefaults. Expanding the lateral extent of the Lower Elysian Parkfault greatly increases the fault surface area available forrupture from 2030 to 3160 km2. Using the Wells andCoppersmith (1994) empirical relationship between rupturearea and earthquake magnitude on reverse faults, this in-crease in fault area predicts in increase in earthquake mag-nitude on the Lower Elysian Park thrust fromM 7.3 toM 7.5.A second notable difference is the decrease in area of thePuente Hills thrust system, from 1740 km2 in the CFM,which includes the LA segment, to 940 km2 in the preferredmodel, which consists of only the Santa Fe Springs andCoyote segments (Fig. 5). This 45% decrease in fault surfacearea implies that the maximum credible earthquake magni-tude for the Puente Hills thrust would be proportionatelysmaller than reported previously and used in hazard assess-ments (Shaw et al., 2002; Dolan et al., 2003; Fieldet al., 2005).
Conclusions
A comparison of geologically defined patterns of upliftwith models of uplift produced by boundary-element modelsfor faults from the northern LA basin in the Southern Cali-fornia Earthquake Center’s community fault model (CFM)was conducted. Model 1 uses the CFM version 2.5 fault geo-metry and produces uplift patterns that match the geologicuplift at the Santa Fe Springs and Coyote Hills anticlinesbut do not match uplift between the San Gabriel Riverand the Newport–Inglewood fault. To achieve better matchin the western part of the northern shelf of the LA basin, weexplored a variety of alternative fault configurations. Thepreferred model that best fits the geologic uplift data departsfrom the CFM in a number of significant ways (Fig. 5). Keydifferences include (1) using the 60° dip from the LasCienegas fault for the LA segment of the Puente Hills thrustsystem, (2) linking the steeper LA segment of the PuenteHills thrust system into the Lower Elysian Park thrust, (3) ex-tending the Lower Elysian Park thrust along strike to thenorthwest, and (4) unlinking the Raymond and Hollywoodfaults. Incremental model-data improvement results from in-dependent variation of fault dip, from linking and unlinkingkey faults, and from varying the lateral extent of blindthrusts; however, the most substantial improvements comefrom a model that integrates all the alternative geometries(compare Figs. 4 and 9). This result implies that connectivityexerts a strong control on fault behavior.
Acknowledgments
Authors Andrew J. Meigs andMichele L. Cooke contributed equally tothis article. This research was supported by the Southern California Earth-quake Center (SCEC). The SCEC is funded by the National Science Founda-tion’s Cooperative Agreement EAR-0106924 and the U.S. GeologicalSurvey’s Cooperative Agreement 02HQAG0008. Three-dimensional mod-eling software was provided by Igeoss and Midland Valley. Gary Fuis, MikeOskin, Andreas Plesch, and John Shaw are thanked for numerous discus-sions and encouragement. Thoughtful reviews by Juliet Crider, Mike Oskin,and Associate Editor Mark Hemphill-Haley improved both the analysis andpresentation of our results. Della Fawcett assisted with the rock uplift anal-ysis as part of Southern California Earthquake Center summer undergrad-uate research experience. The SCEC’s Contribution Number for this article is1110.
References
Allmendinger, R. W., and J. H. Shaw (2000). Estimation of fault propagationdistance from fold shape: implications for earthquake hazard assess-ment, Geology 28, 1099–1102.
Argus, D. F., M. B. Heflin, G. Peltzer, F. Crampe, and F. H. Webb (2005).Interseismic strain accumulation and anthropogenic motion in metro-politan Los Angeles, J. Geophys. Res. 110, 1–26.
Birch, F. (1966). Compressibility; elastic constants, inHandbook of PhysicalConstants, J. Sydney and P. Clark (Editors), Geological Society ofAmerica, Boulder, Colorado, pp. 97–173.
Bjorklund, T. K. (2002). Evolution of the Whittier fold-fault system of thenortheastern Los Angeles basin, California, Ph.D. Thesis, 128 pp, Uni-versity of Houston, Houston, Texas.
Blake, G. H. (1991). Review of the Neogene biostratigraphy and strati-graphy of the Los Angeles basin and implications for basin evolution,in Active Margin Basins, K. T. Biddle (Editor), American Associationof Petroleum Geologists Memoir 52, Tulsa, Oklahoma, 135–184.
Bullard, T. F., and W. R. Lettis (1993). Quaternary deformation associatedwith blind thrust faulting, J. Geophys. Res. 98, 8349–8369.
Buwalda, J. P. (1940).Geology of the Raymond Basin, California Institute ofTechnology, Pasadena, California, 131 pp.
Carena, S., and J. Suppe (2002). Three-dimensional imaging of active struc-tures using earthquake aftershocks: the Northridge thrust, California, J.Struct. Geol. 24, 887–904.
Cooke, M. L., and S. T. Marshall (2006). Fault slip rates from three-dimen-sional models of the Los Angles metropolitan area, California, Geo-phys. Res. Lett. 33, 5.
Crider, J. G., and D. D. Pollard (1998). Fault linkage: 3D mechanical inter-action between overlapping normal faults, J. Geophys. Res. 103,24,373–24,391.
Crook, R., Jr., C. R. Allen, B. Kamb, C. M. Payne, and R. J. Proctor (1987).Quaternary geology and seismic hazard of the Sierra Madre and asso-ciated faults, western San Gabriel Mountains, in Recent Reverse Fault-ing in the Transverse Ranges, California, D. M. Morton and R. F.Yerkes (Editors), United States Geological Survey, Washington,D.C., pp. 27–64.
Davis, T. L., and J. S. Namson (1994). A balanced cross-section of the 1994Northridge earthquake, southern California, Nature 372, 167–169.
Davis, T. L., J. Namson, and R. F. Yerkes (1989). A cross-section of the LosAngeles area: seismically active fold and thrust belt, the 1987 WhittierNarrows earthquake, and earthquake hazard, J. Geophys. Res. 94,9644–9664.
Dibblee, T. W. (1982). Geology of the Santa Monica Mountains andSimi Hills, southern California, in Geology and Mineral Wealth ofthe California Transverse Ranges, D. L. Fife and J. A. Minch, (Edi-tors), South Coast Geological Society, Santa Ana, California, pp. 94–130.
Dibblee, T. W. (1989). Geologic Map of the Los Angeles Quadrangle, LosAngeles County, California, Dibblee Geological Foundation, SantaBarbara, California, Map DF-22, scale 1:24,000, one sheet.
Using Vertical Rock Uplift Patterns to Constrain the 3D Fault Configuration in the Los Angeles Basin 121

Dibblee, T. W. (1991). Geologic Map of the Hollywood and Burbank (South1/2) Quadrangles, Los Angeles County, California, Dibblee Geologi-cal Foundation, Santa Barbara, Califiornia, Map DF-30, scale1:24,000, one sheet.
Dolan, J. F., and T. L. Pratt (1997). High-resolution seismic-reflection pro-filing of the Santa Monica fault zone, west Los Angeles, California,Geophys. Res. Lett. 24, 2051–2054.
Dolan, J. F., and K. Sieh (1992). Tectonic geomorphology of the northernLos Angeles basin: seismic hazards and kinematics of young faultmovement, in Engineering Geology Field Trips: Orange County,Santa Monica Mountains, and Malibu, P. L. Ehlig and E. A. Steiner(Editors), Southern California Section of the Association of Engineer-ing Geologists, Los Angeles, California, pp. B20–B26.
Dolan, J., S. Christofferson, and J. H. Shaw (2003). Recognition of paleo-earthquakes on the Puente Hills blind thrust fault, California, Science300, 115–118.
Dolan, J. F., K. Sieh, P. Guptill, G. Miller, and T. K. Rockwell (1997). Activetectonics, paleoseismology, and seismic hazards of the Hollywoodfault, southern California, Geol. Soc. Am. Bull. 12, 1595–1616.
Dolan, J. F., K. Sieh, and T. K. Rockwell (2000). Late Quaternaryactivity and seismic potential of the Santa Monica fault system, north-western Los Angeles basin, California,Geol. Soc. Am. Bull 112, 1559–1581.
Dolan, J. F., D. Stevens, and T. K. Rockwell (2000). Paleoseismologic evi-dence for an early to mid-Holocene age of the most recent surface rup-ture on the Hollywood fault, Los Angeles, California, Bull. Seismol.Soc. Am. 90, 334–344.
Erickson, S. G. (1996). Influence of mechanical stratigraphy on folding vs.faulting, J. Struct. Geol. 18, 443–450.
Field, E. H., H. A. Seligson, N. Gupta, T. H. Jordan, and K. W. Campbell(2005). Loss estimates for a Puente Hills blind-thrust earthquake inLos Angeles, California, Earthq. Spectra 21, 329–338.
Ford, M., A. Artoni, E. A. Williams, J. Vergés, and S. Hardy (1997). Pro-gressive evolution of a fault propagation fold pair from growth stratageometries, Sant Llorenç de Morunys, SE Pyrenees, J. Struct. Geol.19, 413–441.
Fuis, G. S., T. Ryberg, N. J. Godfrey, D. A. Okaya, and J. M. Murphy(2001). Crustal structure and tectonics from the Los Angeles basinto the Mojave Desert, southern California, Geology 29, 15–18.
Griffith, A., and M. L. Cooke (2004). Mechanical validation of the three-dimensional intersection geometry between the Puente Hills blind-thrust system and the Whittier fault, Bull. Seismol. Soc. Am. 94,493–505.
Griffith, A., and M. L. Cooke (2005). How sensitive are fault-slip rates in theLos Angeles basin to tectonic boundary conditions?, Bull. Seismol.Soc. Am. 95, 1263–1275.
Hardy, S., and J. Poblet (1994). Geometric and numerical model of progres-sive limb rotation in detachment folds, Geololgy 22, 371–374.
Hauksson, E., and L. M. Jones (1989). The 1987 Whittier Narrows earth-quake sequence in Los Angeles, southern California: seismologicaland tectonic analysis, J. Geophys. Res. 94, 9569–9589.
Hauksson, E., L. M. Jones, T. L. Davis, K. L. Hutton, P. Williams, A. L.Bent, G. Brady, P. A. Reasenberg, A. J. Michael, R. F. Yerkes, E.Etheredge, R. L. Porcella, M. J. S. Johnston, G. Reagor, C. W. Stover,C. G. Bufe, E. Cranswick, and A. K. Shakal (1988). The 1987 WhittierNarrows earthquake in the Los Angeles metropolitan area, California,Science 239, 1409–1412.
Hudnut, K. W., Z. Shen, M. Murray, S. McClusky, R. King, T. Herring, B.Hager, Y. Feng, P. Fang, A. Donnellan, and Y. Bock (1996). Co-seismic displacements of the 1994 Northridge, California earthquake,Bull. Seismol. Soc. Am. 86, S19–S36.
Huftile, G. J., and R. S. Yeats (1995). Convergence rates across a displace-ment transfer zone in the western Transverse Ranges, Ventura basin,California, J. Geophys. Res. 100, 2043–2067.
Johnson, K. M., and A. M. Johnson (2000). Localization of delaminatedbedding in San Rafael Swell, Utah and other monoclinal folds, J.Struct. Geol. 22, 1455–1468.
Magistrale, H., S. Day, R. W. Clayton, and R. Graves (2000). The SCECsouthern California reference three-dimensional seismic velocitymodel version 2, Bull. Seismol. Soc. Am. 90, S65–S76.
Marin, M., J. F. Dolan, R. D. Hartleb, S. A. Christofferson, A. Z. Tucker, andL. A. Owen (2000). A latest Pleistocene-Holocene slip rate on theRaymond Fault based on 3-D trenching, East Pasadena, California,EOS 81, 855.
Meigs, A. J., and M. E. Oskin (2002). Convergence, block rotation, andstructural interference across the Peninsular-Transverse Ranges bound-ary, eastern Santa Monica Mountains, California, in Contributions toCrustal Evolution of the Southwestern United States, A. Barth (Editor),Geological Society of America, Boulder, pp. 279–293.
Meigs, A. J., N. Brozovic, and M. L. Johnson (1999). Steady, balanced ratesof uplift and erosion of the Santa Monica mountains, California, BasinRes. 11, 59–73.
Meigs, A., D. Yule, A. Blythe, and D. Burbank (2003). Implications of dis-tributed crustal deformation for exhumation in a portion of a transpres-sional plate boundary, western Transverse ranges, southern California,Quat. Int. 101–102, 169–177.
Molnar, P., and J. M. Gipson (1994). Very long baseline interferometry andactive rotations of crustal blocks in the western Transverse ranges,California, Geol. Soc. Am. Bull 106, 594–606.
Myers, D. J., J. L. Nabelek, and R. S. Yeats (2003). Dislocation modeling ofblind thrusts in the eastern Los Angeles basin, California, J. Geophys.Res. 108, no. B9, 2443, doi 10.1029/2002JB002150.
Nazareth, J. J., and E. Hauksson (2004). The seismogenic thickness of thesouthern California crust, Bull. Seismol. Soc. Am. 94, 940–960.
Nicholson, C., C. Sorlien, T. Atwater, J. C. Crowell, and B. P. Luyendyk(1994). Microplate capture, rotation of the western Transverse ranges,and initiation of the San Andreas transform as a low-angle fault sys-tem, Geololgy 22, 491–495.
Olson, E., and M. L. Cooke (2005). Application of three fault growth criteriato the Puente Hills thrust system, Los Angeles, California, USA, J.Struct. Geol. 27, 1765–1777.
Oskin, M., K. Sieh, T. K. Rockwell, P. Guptill, G. Miller, M. Curtis, M.Payne, S. McArdle, and P. Elliot (2000). Active parasitic folds onthe Elysian Park anticline: implications for seismic hazard in centralLos Angeles, California, Geol. Soc. Am. Bull 112, 693–707.
Plesch, A., J. H. Shaw, C. Benson, W. A. Bryant, S. Carena, M. L. Cooke, J.Dolan, G. Fuis, E. M. Gath, L. Grant, E. Hauksson, T. Jordan, M. Kam-merling, M. Legg, S. Lindvall, H. Magistrale, C. Nicholson, N. A. Nie-mi, M. Oskin, S. E. Perry, G. Planansky, T. Rockwell, P. Shearer, C.Sorlien, M. P. Suss, J. Suppe, J. Treiman, and R. Yeats (2007). Com-munity fault model (CFM) for southern California, Bull. Seismol. Soc.Am. 97, 1793–1802.
Rockwell, T. K., E. M. Gath, and T. Gonzalez (1992). Sense and rate of slipon the Whittier fault zone eastern Los Angeles basin, California, inProceedings of the 35th Annual Meeting of Engineering Geologists,M. L. Stout (Editor), Association of Engineering Geologists, SantaAna, California, 679.
Rubin, C. M., S. C. Lindvall, and T. K. Rockwell (1998). Evidence for largeearthquakes in metropolitan Los Angeles, Science 281, 398–402.
Savage, H., and M. Cooke (2003). Can flat-ramp-flat fault geometry by in-ferred from fold shape?: a comparison of kinematic and mechanicalfolds, J. Struct. Geol. 23, 203–2034.
Savage, H., and M. Cooke (2004). An investigation into the role of faultinteraction on fold pattern, J. Struct. Geol. 26, 905–917.
Schneider, C. L., C. Hummon, R. S. Yeats, and G. J. Huftile (1996). Struc-tural evolution of the northern Los Angeles basin, California, based ongrowth strata, Tectonics 15, 341–355.
Seeber, L., and C. C. Sorlien (2000). Listric thrusts in the western Transverseranges, California, Geol. Soc. Am. Bull 112, 1067–1079.
Shaw, J. H., and P. M. Shearer (1999). An elusive blind-thrust fault beneathmetropolitan Los Angeles, Science 283, 1516–1518.
Shaw, J. H., and J. Suppe (1996). Earthquake hazards of active blind-thrustfaults under the central Los Angeles basin, California, J. Geophys. Res.101, 8623–8642.
122 A. J. Meigs, M. L. Cooke, and S. T. Marshall
Shaw, J. H., A. Plesch, J. F. Dolan, T. L. Pratt, and P. Fiore (2002). PuenteHills blind-thrust system, Los Angeles, California, Bull. Seismol. Soc.Am. 92, 2946–2960.
Stein, R. S., G. C. P. King, and J. B. Rundle (1988). The growth of geolo-gical structures by repeated earthquakes 2: Field examples of continen-tal dip-slip faults, J. Geophys. Res. 93, 13,319–13,331.
Suppe, J. (1983). Geometry and kinematics of fault bend folding, Am. J. Sci.283, 648–721.
Suppe, J., and D. A. Medwedeff (1990). Geometry and kinematics of fault-propagation folding, Ecol. Geol. Helv. 83, 409–454.
Suppe, J., F. Sàbat, J. A. Muñoz, J. Poblet, E. Roca, and J. Vergés (1997).Bed-by-bed fold growth by kink-band migration: Sant Llorenç deMorunys, eastern Pyrenees, J. Struct. Geol. 19, 443–461.
Thomas, A. L. (1994). POLY3D: a three-dimensional, polygonal element,displacement discontinuity boundary element computer program withapplications to fractures, faults, and cavities in the Earth’s crust, Mas-ter’s Thesis, Stanford University, Palo Alto, California, 52 pp.
Tsutsumi, H., and R. S. Yeats (1999). Tectonic setting of the 1971 Sylmarand 1994 Northridge earthquakes in the San Fernando Valley, Califor-nia, Bull. Seismol. Soc. Am. 89, 1232–1249.
Tsutsumi, H., R. S. Yeats, and G. J. Huftile (2001). Late Cenozoic tectonicsof the northern Los Angeles fault system, California, Geol. Soc. Am.Bull 113, 454–468.
Ward, S. N., and G. Valensise (1994). The Palos Verdes terraces, California:bathtub rings from a buried reverse fault, J. Geophys. Res. B99, 4485–4494.
Weaver, K. D., and J. F. Dolan (2000). Paleoseismology and geomorphologyof the Raymond fault, Los Angeles County, California, Bull. Seismol.Soc. Am. 90, 1409–1429.
Wells, D. L., and K. J. Coppersmith (1994). New empirical relationshipsamong magnitude, rupture length, rupture width, rupture area, and sur-face displacement, Bull. Seismol. Soc. Am. 84, 974–1002.
Woodward, N. B., S. E. Boyer, and J. Suppe (1989). Balanced GeologicalCross-Sections: An Essential Technique in Geological Research and
Exploration, American Geophysical Union Short Course in Geology,Vol. 6, 132 pp.
Working Group of California Earthquake Probabilities (WGCEP) (2006).Fault section database 2.0, http://gravity.usc.edu/WGCEP/resources/data/refFaultParams/fltSectData2.html, and references therein (lastaccessed January 2008).
Wright, T. L. (1991). Structural geology and tectonic evolution of the LosAngeles basin, California, in Active Margin Basins, K. T. Biddle,American Association of Petroleum Geologists Memoir 52, Tulsa, Ok-lahoma, 35–134.
Yeats, R. S., and G. J. Huftile (1995). The Oak Ridge fault system and the1994 Northridge earthquake, Nature 373, 418–420.
Yerkes, R. F. (1972). Geology and oil resources of the western Puente Hillsarea, southern California, U.S. Geol. Surv. Profess. Pap. 420-C, 63 pp.
Yerkes, R. F., T. H. McCulloh, J. E. Schoellhamer, and J. G. Vedder (1965).Geology of the Los Angeles Basin, California: an introduction, U.S.Geol. Surv. Prof. Pap. 420-A, 1–57.
Department of GeosciencesOregon State University104 Wilkinson HallCorvallis, Oregon 97330
(A.J.M.)
University of Massachusetts611 North Pleasant StreetAmherst, Massachusetts 01003-9297
(M.L.C., S.T.M.)
Manuscript received 8 December 2006
Using Vertical Rock Uplift Patterns to Constrain the 3D Fault Configuration in the Los Angeles Basin 123