utah’s final 2016 integrated report...utah’s final 2016 integrated report final 2016 ir: version...
TRANSCRIPT
UTAH’S FINAL 2016
INTEGRATED REPORT
2016 Final Integrated Report
December 7, 2016
Utah’s Final 2016 Integrated Report
Final 2016 IR: version 2.1
CITATION:
DIVISION OF WATER QUALITY. 2016. UTAH’S FINAL 2016 INTEGRATED REPORT. SALT LAKE CITY, UTAH.
UTAH DEPARTMENT OF ENVIRONMENTAL QUALITY.
Available at:
http://www.deq.utah.gov/ProgramsServices/programs/water/wqmanagement/assessment/currentIR2016.htm

Utah’s Final 2016 Integrated Report
Final 2016 IR: version 2.1
[This page is intentionally left blank].
Utah’s Final 2016 Integrated Report
Final 2016 IR: version 2.1
PREPARERS
This document was prepared by the following Division of Water Quality Staff:
Emilie Flemer, James Harris, Jodi Gardberg, Benjamin Holcomb, Jake Vander Laan, Lenora Sullivan, Calah
Seese, Mark Stanger, Chris Bittner, Jeff Ostermiller, Suzan Tahir, Alexander Anderson, Marshall Baillie, Robert
Bird, Benjamin Brown, Daniel English, Trisha Johnson, Brent Shaw, Carl Adams, Mike Allred, Jim Bowcutt, Amy
Dickey, Scott Daly, Kari Lundeen, and Sandy Wingert.
ACKNOWLEDGEMENTS
A special thank you is also extended to Walter Baker, Leah Ann Lamb, and Erica Gaddis for giving us the
opportunity to rethink the way we assess and report on our waters. Karl Hermann, Julie Kinsey, Tina Laidlaw,
and Sandra Spence (U.S. Environmental Protection Agency Region 8) were also instrumental in creating this
report; they provided significant comments and advice on this document, which helped us ensure consistency
between programs, assessment methods, and reporting tools.
Numerous agencies and entities have contributed to the data that went into the creation of this report. These
include the Bureau of Land Management, U.S. Forest Service, National Park Service, Salt Lake County, Davis
County, Bureau of Reclamation, Utah State University, Central Davis Sewer District, and other members of
DWQ’s Cooperative Monitoring Program. Special thanks go out to the staff at the United States Geological
Survey and the Utah Division of Oil, Gas and Mining for providing additional data.
Numerous agencies and entities also contributed to the development of methods that went into the creation of this document. These include:
Colorado’s Department of Public Health and Environment Washington State Department of Ecology
Idaho’s Water Quality Division’s Source Water Assessment Program
Nevada’s Bureau of Water Quality Planning in the Nevada Division of Environmental Protection
New Mexico’s Surface Water Quality Bureau in the New Mexico Environment Department
Oregon’s Department of Environmental Quality
Pennsylvania’s Department of Environmental Protection Bureau of Point and Non-point source Management
Virginia’s Department of Environmental Quality
Wisconsin’s Water Division as part of the Department of Natural Resources The previously published work by these states allowed us to develop these draft assessment methods for high frequency data and helped us define credible data requirements specific to DWQ’s High-Frequency Assessment program.
This 2016 Integrated Report was developed with funding provided by the U.S. Environmental Protection
Agency’s Clean Water Act, Sections 604(b), 106, and 319 grant funds.
Utah’s Final 2016 Integrated Report
Final 2016 IR: version 2.1
CONTENTS
CHAPTER 1: INTRODUCTION
CHAPTER 2: 2016 303(D) ASSESSMENT METHODS
CHAPTER 3: RIVERS AND STREAM ASSESSMENTS
CHAPTER 4: LAKES AND RESERVOIR ASSESSMENTS
CHAPTER 5: NARRATIVE STANDARD ASSESSMENT OF RECREATIONAL USE SUPPORT IN LAKES AND
RESERVOIRS AND APPLICATION TO UTAH LAKE
CHAPTER 6: EVALUATION OF HARMFUL ALGAL BLOOM DATA IN FARMINGTON BAY, GREAT SALT
LAKE
CHAPTER 7: UTAH’S DRAFT ASSESSMENT METHODS FOR HIGH FREQUENCY DATA AND PILOT
APPLICATION FOR THE JORDAN RIVER
2016 INTEGRATED REPORT RESPONSE TO PUBLIC COMMENTS
UTAH’S FINAL 2016 INTEGRATED REPORT
CHAPTER 1:
INTRODUCTION
2016 Final Integrated Report

Chapter 1: Introduction
Final 2016 IR: version 2.1 Page 2
[This page is intentionally left blank].
Chapter 1: Introduction
Final 2016 IR: version 2.1 Page 3
CONTENTS
ABBREVIATIONS ......................................................................................................................................... 4
FIGURES ...................................................................................................................................................... 5
Introduction ........................................................................................................................................................................... 6
PURPOSE OF THE INTEGRATED REPORT ................................................................................................... 7
Clean Water Act 305(b) Reporting Requirements ....................................................................................................... 7
Clean Water Act 303(d) Reporting Requirements ....................................................................................................... 8
Integrated Report Classified Use Categories ................................................................................................................ 8
Utah Division of Water Quality’s Tiered Monitoring Framework ........................................................................... 13
Assessment Summary ....................................................................................................................................................... 15
Restoring Impaired Waters: Delistings ......................................................................................................................... 15
Public Participation Process ............................................................................................................................................ 16
CHANGES IN THE 2016 INTEGRATED REPORT ........................................................................................ 17
New Data Sources............................................................................................................................................................ 17
Narrative Standard Assessment of Recreational Use Support ................................................................................ 18
Credible Data Review ..................................................................................................................................................... 18
Changes to Assessment Units .......................................................................................................................................... 18
303(d) Vision ..................................................................................................................................................................... 18
Changes to Assessment Methods ................................................................................................................................... 18
LITERATURE CITED .................................................................................................................................... 20
Chapter 1: Introduction
Final 2016 IR: version 2.1 Page 4
ABBREVIATIONS
AU(s) assessment unit(s)
CFR Code of Federal Regulations
CWA Clean Water Act
DWQ Division of Water Quality
EPA U.S. Environmental Protection Agency
HABs harmful algal blooms
IR Integrated report
MLID monitoring location ID
NPS nonpoint source
QA quality assurance
TMDL(s) total maximum daily load(s)
USGS U.S. Geological Survey
WQSs water quality standards
Chapter 1: Introduction
Final 2016 IR: version 2.1 Page 5
FIGURES Figure 1. EPA’s five-category system for classifying water quality standards for waterbodies. ............. 9
Figure 2. DWQ’s adaptive monitoring approach. ........................................................................................... 13
Figure 3. Summary of DWQ's 6-year rotating basin monitoring schedule. ................................................ 14
Figure 4. Number of AUs assessed and stream miles in each assessment category. ................................. 15
Chapter 1: Introduction
Final 2016 IR: version 2.1 Page 6
Introduction
The Division of Water Quality (DWQ) is pleased to issue the final 2016 Integrated Report (IR) on the condition of Utah’s rivers, streams, and lakes. Included with the report is a summary of public comment received during the Public Comment Period (June 10th – September 8th, 2016). The Division received approximately 30 comment letters with over 450 unique comments. To facilitate addressing a large number of comments regarding Harmful Algal Blooms in Utah Lake and Farmington Bay, a Joint Comment Responses document is provided in Appendix A of the 2016 Final Integrated Report Response to Public Comments table provided with this report.
Chapter 1: Introduction
Final 2016 IR: version 2.1 Page 7
PURPOSE OF THE INTEGRATED REPORT The Utah Division of Water Quality (DWQ) is responsible for a variety of programs that monitor,
assess, and protect the surface and ground waters of the state. Partnering with a range of public and
private entities, DWQ combines its data collection efforts with the data collected by identified
stakeholders to characterize the surface water quality of the state. This report is the result of that
collaborative effort. The 2016 Integrated Report (IR) contains updates from previous reports (e.g., the
2012 - 2014 IR) and a comprehensive survey of the water quality of surface waters in the state from
2008 to 2014.
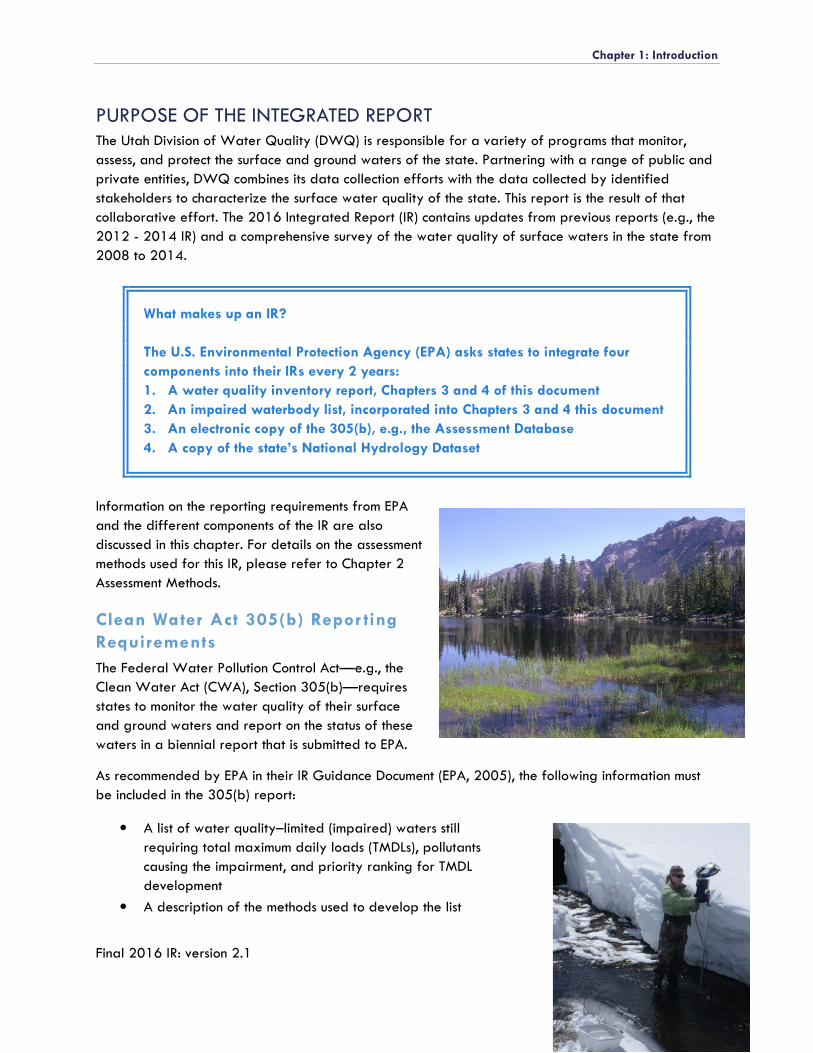
What makes up an IR?
The U.S. Environmental Protection Agency (EPA) asks states to integrate four
components into their IRs every 2 years:
1. A water quality inventory report, Chapters 3 and 4 of this document 2. An impaired waterbody list, incorporated into Chapters 3 and 4 this document 3. An electronic copy of the 305(b), e.g., the Assessment Database
4. A copy of the state’s National Hydrology Dataset
Information on the reporting requirements from EPA
and the different components of the IR are also
discussed in this chapter. For details on the assessment
methods used for this IR, please refer to Chapter 2
Assessment Methods.
Clean Water Act 305(b) Repor ting
Requirements
The Federal Water Pollution Control Act—e.g., the
Clean Water Act (CWA), Section 305(b)—requires
states to monitor the water quality of their surface
and ground waters and report on the status of these
waters in a biennial report that is submitted to EPA.
As recommended by EPA in their IR Guidance Document (EPA, 2005), the following information must
be included in the 305(b) report:
• A list of water quality–limited (impaired) waters still
requiring total maximum daily loads (TMDLs), pollutants
causing the impairment, and priority ranking for TMDL
development
• A description of the methods used to develop the list
Chapter 1: Introduction
Final 2016 IR: version 2.1 Page 8
• A description of the data and information used to identify waters, including a description of
the existing and readily available data and information used
• A rationale for any decision to not use any existing and readily available data and
information
• Any other reasonable information requested by EPA, such as demonstrating good cause for
not including a water or waters on the list
Clean Water Act 303(d) Repor ting Requirements
In addition to the 305(b) report, Section 303(d) of the CWA requires states to submit a list biennially
to EPA that identifies the waterbodies in that state that do not meet the state’s WQSs. This list is
reviewed by EPA and helps guide the state’s TMDL development process to correct the specified
impairment.
• As recommended by EPA in their IR Guidance Document (EPA, 2005), the following information
must be included in the 303(d) report:
• A list of water quality–limited (impaired and threatened) waters still requiring TMDL(s),
pollutants causing the impairment, and priority ranking for TMDL development
• A description of the methods used to develop the list
• A description of the data and information used to identify waters, including a description of
the existing and readily available data and information used
• A rationale for any decision to not use any existing and readily available data and
information
• Any other reasonable information requested by EPA, such as demonstrating good cause for
not including a water or waters on the list
Cleaning up a State’s Impaired Waters:
For waterbodies that are listed as impaired, the CWA requires a TMDL to be
developed. TMDLs document the nature of the water quality impairment,
determine the maximum amount of a pollutant discharge (while still meeting state
standards), and identify acceptable loads from the pollutant source. EPA also
recognizes alternative mechanisms that can be used to restore an impaired water
including watershed based implementation plans.
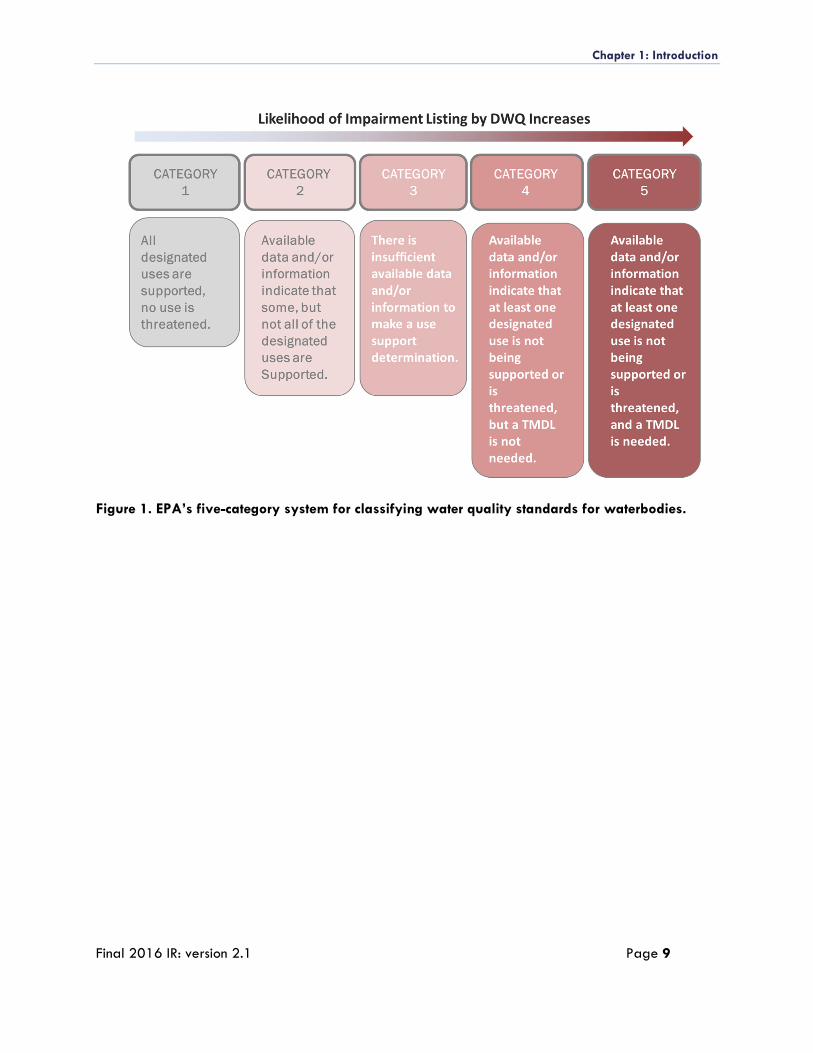
Integrated Repor t Classified Use Categories
Utah refers to designated uses as the basic unit for reporting water quality and uses EPA-
recommended reporting categories to classify segments of waterbodies as meeting or not meeting
applicable WQS. These categories are presented in Figure 1 and are described in further detail
following the figure. The specific methods used by DWQ to make any of the below conclusions are
documented in detail in Chapter 2 Assessment Methods.
Chapter 1: Introduction
Final 2016 IR: version 2.1 Page 9
Figure 1. EPA’s five-category system for classifying water quality standards for waterbodies.
Chapter 1: Introduction
Final 2016 IR: version 2.1 Page 10
Category 1: All designated uses are attained.
Assessment units (AUs) are reported as Category 1 if all beneficial uses have been assessed
against one more numeric criterion and each use is found to be fully supporting all uses.
Category 2: Some of the designated uses are attained, but there are insufficient data to
determine beneficial use support for the remaining designated uses.
AUs are reported as Category 2 if some but not all designated uses have been evaluated, yet
those uses that have been assessed are found to be supporting designated uses.
Category 3: There are insufficient data to make a determination, or lakes and reservoirs show
indication of impairment for a single monitoring cycle.
For each designated use, AUs are reported as Category 3 if some data and information are
available to evaluate one or more of an AU’s designated uses, yet available data are insufficient
to make a conclusive assessment determination. Inconclusive decisions result from datasets that fail
to meet data quality objectives that DWQ has established for making IR assessment decisions.
Examples of situations where AUs are reported as Category 3 include the following: datasets with
an insufficient number of samples available for analysis, situations where there were contradictory
conclusions from multiple data sources, or situations where quality assurance/quality control
procedures were improper or poorly documented.
By reporting an AU as Category 3, versus simply reporting the AU as not assessed, DWQ is
making a commitment to prioritize future monitoring to make a final assessment determination. In
part due to this intrinsic commitment to prioritize monitoring, DWQ uses six Category 3
subcategories for planning purposes, which are defined as follows at the monitoring location
identification (MLID):
• Category 3A: MLIDs are listed in Category 3A if there are insufficient data and
information to make an assessment and if the data include violations of water quality
criteria. Information on Category 3A waters will be used to guide future monitoring and
evaluations.
• Category 3B: Lakes and reservoirs that have been assessed as not supporting a beneficial
use for one monitoring cycle are included in Category 3B. If a lake or reservoir is assessed
as impaired for two consecutive monitoring cycles, it is listed on the 303(d) list.
• Category 3C: This category is currently used for Great Salt Lake (Designated Use Class
5). Assessment of this ecosystem with traditional approaches is complicated by the current
lack of numeric criteria, with the exception of a selenium standard applicable to bird
eggs. Also, the lake is naturally hypersaline, so traditional assessment methods are not
appropriate. DWQ is working toward developing both numeric criteria and assessment
methods for this ecosystem. In the interim, the IR documents the progress that was made in
the most recent 2-year reporting cycle.
• Category 3D: Further investigations are required. For example, MLIDs with potential
impairments for nutrients and biochemical oxygen demand were placed in Category 3D
until such time that numeric nutrient criteria are developed.
Chapter 1: Introduction
Final 2016 IR: version 2.1 Page 11
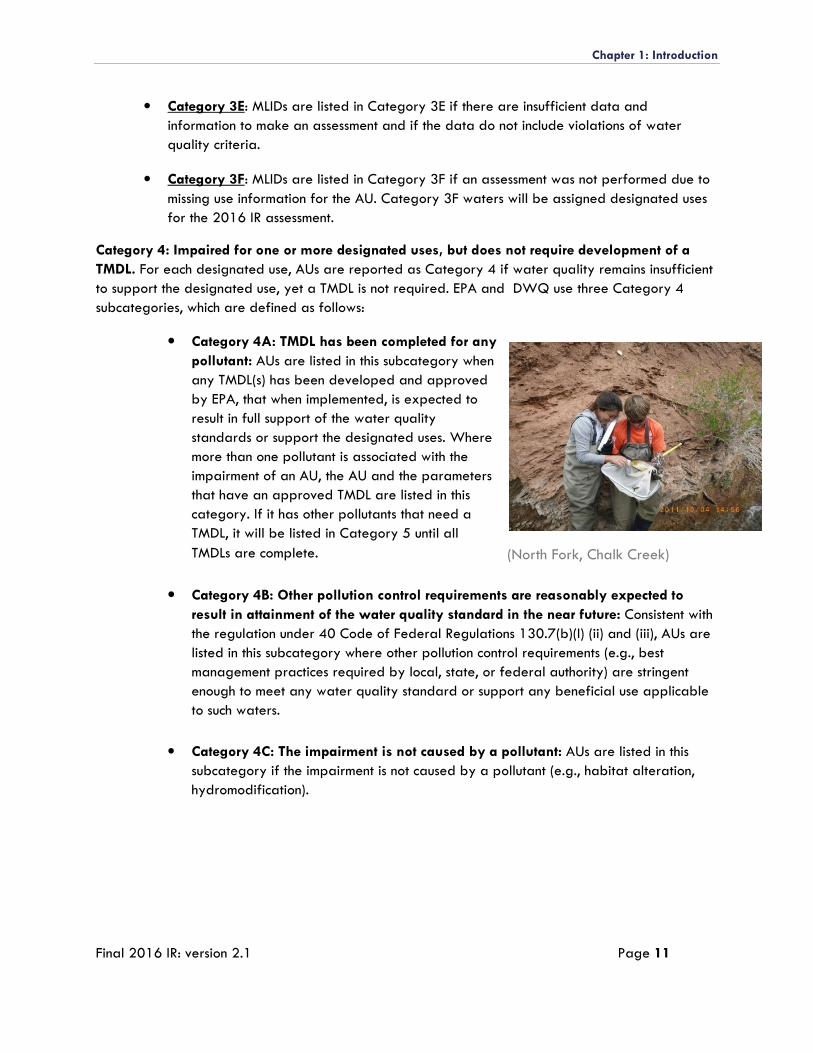
(North Fork, Chalk Creek)
• Category 3E: MLIDs are listed in Category 3E if there are insufficient data and
information to make an assessment and if the data do not include violations of water
quality criteria.
• Category 3F: MLIDs are listed in Category 3F if an assessment was not performed due to
missing use information for the AU. Category 3F waters will be assigned designated uses
for the 2016 IR assessment.
Category 4: Impaired for one or more designated uses, but does not require development of a
TMDL. For each designated use, AUs are reported as Category 4 if water quality remains insufficient
to support the designated use, yet a TMDL is not required. EPA and DWQ use three Category 4
subcategories, which are defined as follows:
• Category 4A: TMDL has been completed for any
pollutant: AUs are listed in this subcategory when
any TMDL(s) has been developed and approved
by EPA, that when implemented, is expected to
result in full support of the water quality
standards or support the designated uses. Where
more than one pollutant is associated with the
impairment of an AU, the AU and the parameters
that have an approved TMDL are listed in this
category. If it has other pollutants that need a
TMDL, it will be listed in Category 5 until all
TMDLs are complete.
• Category 4B: Other pollution control requirements are reasonably expected to
result in attainment of the water quality standard in the near future: Consistent with
the regulation under 40 Code of Federal Regulations 130.7(b)(I) (ii) and (iii), AUs are
listed in this subcategory where other pollution control requirements (e.g., best
management practices required by local, state, or federal authority) are stringent
enough to meet any water quality standard or support any beneficial use applicable
to such waters.
• Category 4C: The impairment is not caused by a pollutant: AUs are listed in this
subcategory if the impairment is not caused by a pollutant (e.g., habitat alteration,
hydromodification).
Chapter 1: Introduction
Final 2016 IR: version 2.1 Page 12
Interpreting a WQS:
When deciding if a segment of a river or stream or a lake or reservoir should be
put into a Category 1, 2, 3, 4, or 5, DWQ must consider the following factors:
WQSs applied to that segment, the designated use assigned to the segment, and
numeric criteria applicable to the designated use.
These factors help answer the following: What do the monitoring data and other
information tell us about whether or not this river/stream or lake is meeting WQSs? For
more information on how Utah interprets a WQS, please refer to Chapter 2 Utah’s
2016 303(d) Assessment Methods
Category 5: The concentration of a pollutant—or several pollutants—exceeds numeric water
quality criteria, or quantitative biological assessments indicate that the biological designated uses
are not supported (narrative water quality standards are violated).
Waters reported as Category 5 are impaired, which means that they are not meeting their
designated uses. The list of Category 5 waters is sometimes called the “303(d) list” in reference to this
section of the CWA, which among other things, requires states to identify impaired waters. There are
several sources of data and information that are used when making impairment decisions. First,
chemical assessments evaluate designated use support for an AU by comparing pollutant
concentrations against numeric criteria that have been established to protect the use. A designated use
of an AU is reported as Category 5 if any of the following apply:
• The concentration of any pollutant exceeds—as defined by the methods described in
this document—a numeric water quality criterion.
• Quantitative biological assessment results for streams and rivers are statistically
different than the reference site conditions.
• Weight of evidence assessments for lakes and reservoirs indicate that designated uses
are not being supported.
Category 5- Alt
The 303(d) program vision promotes the identification of alternative approaches to TMDL
development for impaired waters where these approaches would result in a more rapid attainment of
water quality standards. The alternatives include “4C candidates,” waterbodies impaired by causes
that cannot be addressed by a TMDL such as hydrologic and habitat modification; waterbodies
impaired by total dissolved solids that fall within the auspices of the Colorado River Basin Salinity
Control Program; impaired waters that have existing TMDLs in place for related parameters and are
therefore already being addressed; waterbody impairments that are the result of natural
uncontrollable pollutant sources and therefore require development of site-specific standards; and
Chapter 1: Introduction
Final 2016 IR: version 2.1 Page 13
impaired waters that have taken a straight-to-implementation approach through ongoing watershed
implementation activities.
Utah Division of Water Quality’s Tiered Monitoring Framework
To integrate the various programmatic data needs within the division, DWQ employs an adaptive
approach to its annual monitoring plans, which allows for an efficient and adaptive monitoring and
management program.
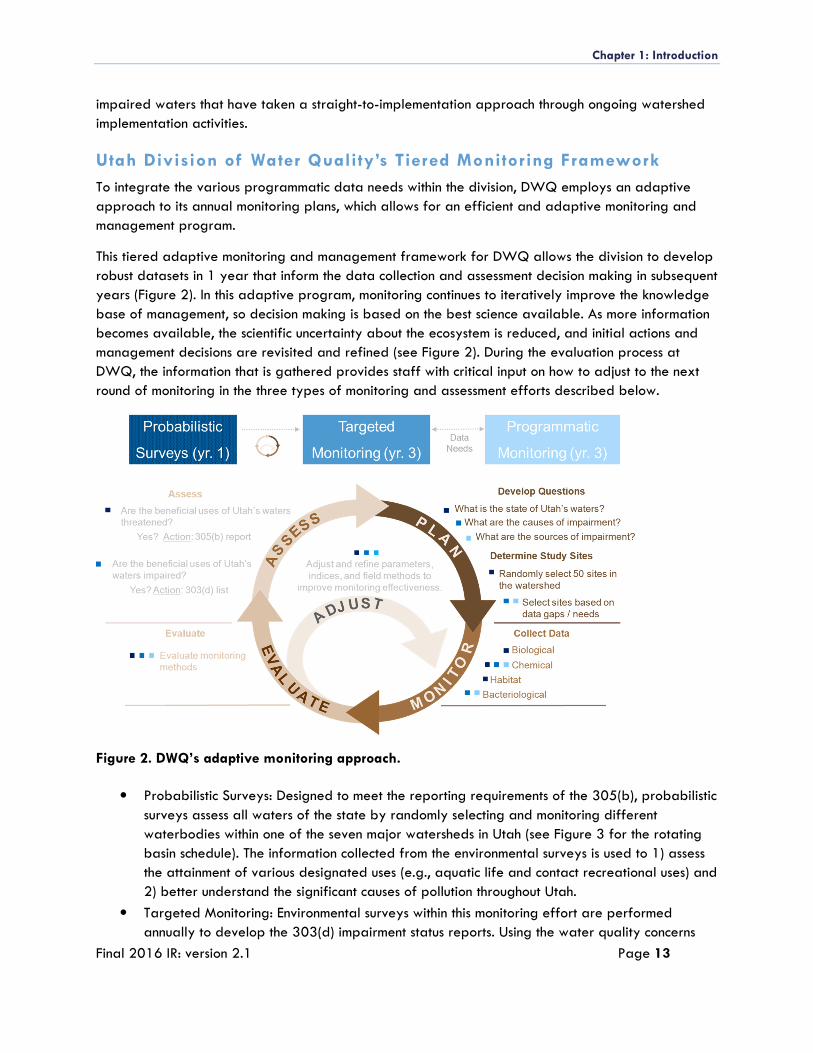
This tiered adaptive monitoring and management framework for DWQ allows the division to develop
robust datasets in 1 year that inform the data collection and assessment decision making in subsequent
years (Figure 2). In this adaptive program, monitoring continues to iteratively improve the knowledge
base of management, so decision making is based on the best science available. As more information
becomes available, the scientific uncertainty about the ecosystem is reduced, and initial actions and
management decisions are revisited and refined (see Figure 2). During the evaluation process at
DWQ, the information that is gathered provides staff with critical input on how to adjust to the next
round of monitoring in the three types of monitoring and assessment efforts described below.
Figure 2. DWQ’s adaptive monitoring approach.
• Probabilistic Surveys: Designed to meet the reporting requirements of the 305(b), probabilistic
surveys assess all waters of the state by randomly selecting and monitoring different
waterbodies within one of the seven major watersheds in Utah (see Figure 3 for the rotating
basin schedule). The information collected from the environmental surveys is used to 1) assess
the attainment of various designated uses (e.g., aquatic life and contact recreational uses) and
2) better understand the significant causes of pollution throughout Utah.
• Targeted Monitoring: Environmental surveys within this monitoring effort are performed
annually to develop the 303(d) impairment status reports. Using the water quality concerns
Chapter 1: Introduction
Final 2016 IR: version 2.1 Page 14
that are highlighted during probabilistic surveys as a guide, site-specific monitoring plans
during targeted monitoring efforts are used to assess the biological and chemical conditions of
a specific stream (see Figure 2). These more intensive surveys allow DWQ to more fully
understand the scope and extent of water quality problems in the state.
• Programmatic Monitoring: Surveys within this monitoring effort are performed annually,
alongside targeted monitoring efforts. This is done to maximize division resources in the
targeted watershed. During these programmatic monitoring efforts, the data needs of the
division are met; these needs include TMDL development, evaluation of nonpoint source (NPS)
project effectiveness, development or refinement of numeric water quality criteria, and a
variety of compliance monitoring programs.
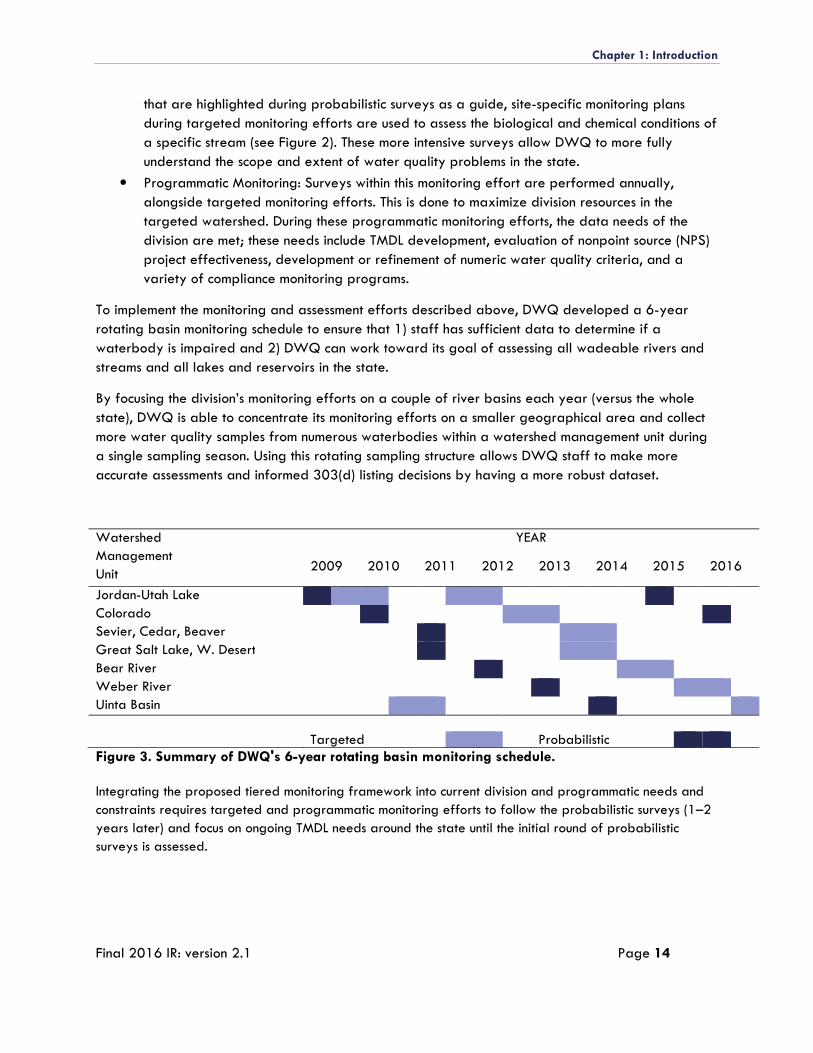
To implement the monitoring and assessment efforts described above, DWQ developed a 6-year
rotating basin monitoring schedule to ensure that 1) staff has sufficient data to determine if a
waterbody is impaired and 2) DWQ can work toward its goal of assessing all wadeable rivers and
streams and all lakes and reservoirs in the state.
By focusing the division’s monitoring efforts on a couple of river basins each year (versus the whole
state), DWQ is able to concentrate its monitoring efforts on a smaller geographical area and collect
more water quality samples from numerous waterbodies within a watershed management unit during
a single sampling season. Using this rotating sampling structure allows DWQ staff to make more
accurate assessments and informed 303(d) listing decisions by having a more robust dataset.
Watershed
Management
Unit
YEAR
2009 2010 2011 2012 2013 2014 2015 2016
Jordan-Utah Lake
Colorado
Sevier, Cedar, Beaver
Great Salt Lake, W. Desert
Bear River
Weber River
Uinta Basin
Targeted Probabilistic Figure 3. Summary of DWQ's 6-year rotating basin monitoring schedule.
Integrating the proposed tiered monitoring framework into current division and programmatic needs and
constraints requires targeted and programmatic monitoring efforts to follow the probabilistic surveys (1–2
years later) and focus on ongoing TMDL needs around the state until the initial round of probabilistic
surveys is assessed.
Chapter 1: Introduction
Final 2016 IR: version 2.1 Page 15
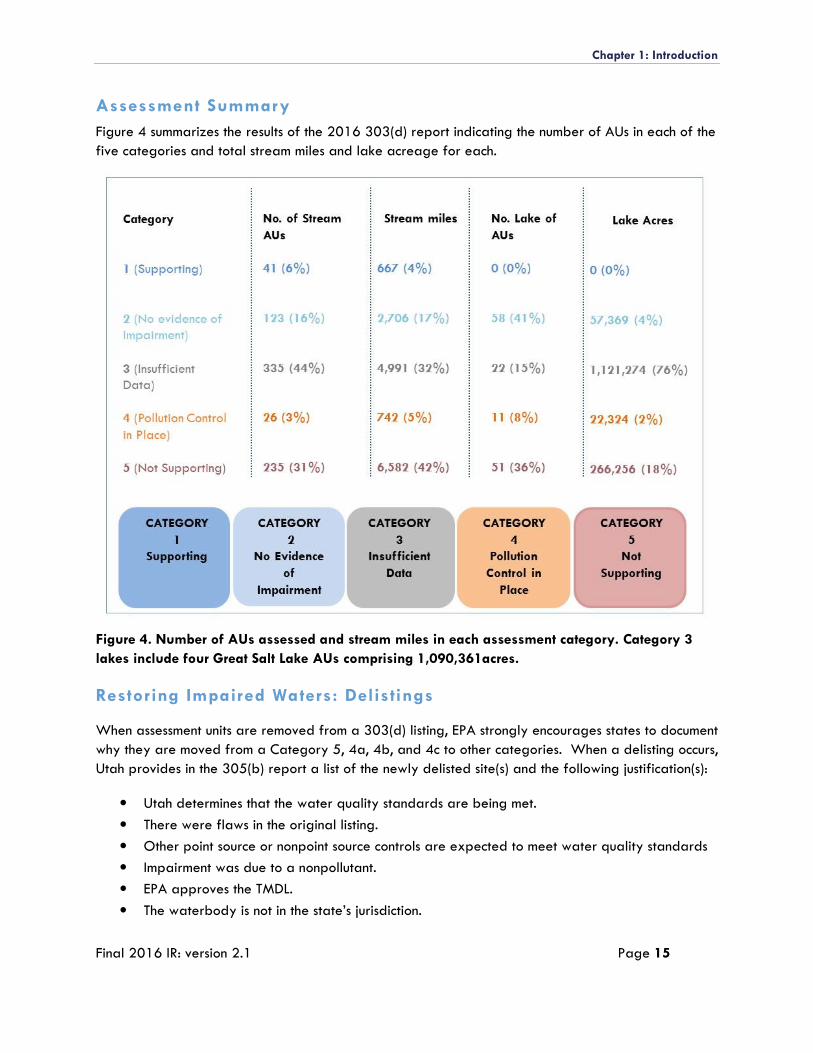
Assessment Summary
Figure 4 summarizes the results of the 2016 303(d) report indicating the number of AUs in each of the
five categories and total stream miles and lake acreage for each.
Figure 4. Number of AUs assessed and stream miles in each assessment category. Category 3
lakes include four Great Salt Lake AUs comprising 1,090,361acres.
Restoring Impaired Waters: Delistings
When assessment units are removed from a 303(d) listing, EPA strongly encourages states to document
why they are moved from a Category 5, 4a, 4b, and 4c to other categories. When a delisting occurs,
Utah provides in the 305(b) report a list of the newly delisted site(s) and the following justification(s):
• Utah determines that the water quality standards are being met.
• There were flaws in the original listing.
• Other point source or nonpoint source controls are expected to meet water quality standards
• Impairment was due to a nonpollutant.
• EPA approves the TMDL.
• The waterbody is not in the state’s jurisdiction.
Chapter 1: Introduction
Final 2016 IR: version 2.1 Page 16
Public Par ticipation Process
As part of DWQ’s ongoing commitment to work with the public to safeguard human health and
protect and enhance Utah’s waters, DWQ engages its stakeholders from the start. Communities and
others affected by the decisions of the 305(b) and 303(d) are asked to participate in the IR process
through two opportunities before DWQ submits the IR to EPA. These two opportunities are described
below:
1. Publicly Submitted Data Notification
Each IR cycle, DWQ makes a formal public notification—through newspaper ads, website
postings, and email list servers—requesting data and information that can be used to inform
designated use assessments. Whenever possible, the aim of DWQ is to obtain all data and
information with sufficient time to compile the information by April of odd years. This allows
DWQ sufficient time to obtain clarification where necessary, ensuring that outside sources of
information are used to the greatest extent possible for IR assessments. Following each public
notice, interested stakeholders have a minimum of 30 days to submit water quality information
to DWQ.
2. Public Comment on the revisions to the Assessment Methods
In preparation for the 2016 IR, DWQ implemented a process of issuing the Assessment
Methods for public comment prior to performing the analysis for the IR. DWQ established a
comment period for the methods in March of 2015 and received a number of comments from
stakeholders. Since issuing the draft methods, DWQ has integrated those comments and
made a number of refinements and changes to improve the assessment process. A complete
summary of the changes can be found in the introduction of Chapter 2.
3. Public Comment on 305(b) and 303(d) Decisions
At the end of the 305(b) and 303(d) report writing process, DWQ again makes a formal
public notification, requesting comments that can be used for considering the placement of AUs
in the five categories. Upon receiving comments from the public, DWQ either revises the IR
(based on the public’s feedback) or addresses the comments in a summary. These comments or
comment summaries are then submitted to EPA along with the 305(b) and 303(d) listing
decisions.
Chapter 1: Introduction
Final 2016 IR: version 2.1 Page 17
CHANGES IN THE 2016 INTEGRATED REPORT Since our last report, DWQ has improved our methods of evaluating and reporting on the status of water quality and included a number of additional data sources to enhance the coverage of our assessments statewide. This section summarizes the additions and changes to DWQ’s assessments since the 2014 IR.
New Data Sources
Federal regulations (40 CFR 130.7(b)(5)) require DWQ to examine all existing and readily available data when making assessment decisions, which includes consideration of data collected by DWQ and others. DWQ has long included data collected by partnering agencies such as the US Forest Service, Bureau of Land Management, and a variety of local and state agencies. These partnerships have been developed over the years as part of DWQ’s Cooperative Monitoring Program, in which participants collect samples in the field in return for an allocation of state lab resources as a way of leveraging additional data collection to mutually support program needs. In the 2016 IR assessment, in addition to our cooperator data, DWQ included data collected in rivers and streams as part of the compliance monitoring for the Division of Oil, Gas, and Mining as well as data collected by a citizen group.
While DWQ analyzed these same data sources in its 2016 assessments, several other sources of data were also included. For the first time, DWQ evaluated applicable data collected between 2008-2014 by the US Geological Survey (USGS) and compiled results from monitoring locations where data indicated impairments for inclusion in the draft 303(d) list. For each monitoring location, DWQ compiled and screened all available water quality data (as outlined in 303(d) methods). For the 2016 IR, observations from the USGS dataset that had numeric values exceeding the Utah’s water quality standard for each beneficial use were used to either conclude impairment or prioritize the AU for follow-up monitoring to obtain the data necessary to make conclusive assessment decisions. Due to time and resource constraints, USGS data was only used for Category 5 (impaired) determinations. In future IR cycles, DWQ plans to fully integrate these data into its assessments for determining all applicable assessment categories.
DWQ performed an evaluation of data related to harmful algal blooms that could pose a health risk to recreational users in Farmington Bay (see Chapter 6). Extensive datasets were submitted to DWQ by two stakeholders, the Central Davis Sewer District and Utah State University, and were aggregated for the purpose of this evaluation. The data were compared to indicators of human health risks for harmful algal blooms (HABs) to provide context to the public about potential risks associated with recreating in Farmington Bay. HABs can adversely affect human health during recreational activities in and on the water. DWQ is obligated to analyze these data and report findings to the public. In Chapter 6, DWQ discusses the recreational uses of Farmington Bay, HAB indicators, and the results of the data evaluation.
In addition, DWQ obtained a significant dataset from the Jordan River/Farmington Bay Water Quality Council, which DWQ used to evaluate methods for high frequency data assessments. These include a high frequency dataset of dissolved oxygen from several sites on the Jordan Rover that were used in a pilot evaluation of proposed assessment methods for high frequency dissolved oxygen data (see Chapter 7).
Chapter 1: Introduction
Final 2016 IR: version 2.1 Page 18
DWQ also assessed a rich dataset including data from DWQ and EPA that was collected in the San Juan River following the Gold King Mine release in Colorado on August 5, 2015. Data collected by EPA in Fall 2015, during monsoonal storm events, caused DWQ to list two segments of the San Juan River as impaired for several metals.
Narrative Standard Assessment of Recreational Use Suppor t
The occurrence of harmful algal blooms (HABs) is a growing water quality concern across the nation. In Utah, HABs usually consist of cyanobacteria (also known as blue green algae) that can produce dangerous toxins and pose a risk to human health through direct contact, inhalation or ingestion. HABs have occurred in some Utah lakes and reservoirs. In 2015, DWQ developed assessment methods that included a new HAB assessment method for recreational uses (Chapter 2) which reflects the potential for “undesirable human health effects” identified in the Narrative Standard and uses a cyanobacteria cell count as the indicator of HAB related impairments for recreational and drinking water uses. A full evaluation of the assessment is contained in Chapter 5.
Credible Data Review
In 2015 as part of it “Call for Data” for the 2016 IR, DWQ implemented a credible data review process. Data quality grades were assigned by the Monitoring and Reporting Section QA Officer using best professional judgment and criteria listed in the Credible Data Quality Matrix for each data type. Data quality grades were assigned generally for the dataset as a whole, acknowledging that individual results are reviewed and may be flagged or rejected during pre-assessment QC checks. For DWQ and DWQ’s Cooperators, and for Western Watersheds, an additional column titled “Areas for Improvement” is populated for the use of the Monitoring and Reporting Section Manager. This column includes suggestions for ways to achieve higher data quality for future IR cycles.
Changes to Assessment Units
With the detailed assessment results provided by the 2012-14 IR, DWQ has performed an evaluation of assessment units that could be redefined to better reflect and isolate the subwatersheds that are impaired from areas meeting water quality standards. With this flexibility, DWQ hopes to improve tracking and dissemination of water quality information and assessment results and highlight areas of focus for developing TMDLs, wasteloads, and other pollution prevention strategies. A summary of the proposed Assessment Unit redefinitions is provided with this report.
303(d) Vision
In 2016, DWQ has adopted a new framework for implementing the Clean Water Act (CWA) Section 303(d) Program. The new Program Vision enhances overall efficiency of the CWA 303(d) Program, encourages focusing on priority waters, and provides States flexibility in using tools in addition to TMDLs to restore and protect water quality. With the recognition that there is not a “one size fits all” approach to restoring and protecting water resources, Utah has developed tailored strategies to implement its CWA 303(d) Program responsibilities in the context of our water quality goals.
Changes to Assessment Methods
In preparation for the 2016 IR, DWQ implemented a process of issuing the Assessment Methods for public comment prior to performing the analysis for the IR. DWQ established a comment period for
Chapter 1: Introduction
Final 2016 IR: version 2.1 Page 19
the methods in March 2015 and received a number of comments from stakeholders. Since issuing the draft methods, DWQ has integrated those comments and made a number of refinements and changes to improve the assessment process. A complete summary of the changes can be found in the introduction of Chapter 2.
Chapter 1: Introduction
Final 2016 IR: version 2.1 Page 20
LITERATURE CITED EPA. 2005. Guidance for 2006 assessment, listing and reporting requirements pursuant to Sections
303(d) and 305(b) of the Clean Water Act. Available at: https://www.epa.gov/sites/production/files/2015-10/documents/2006irg-report.pdf.
CHAPTER 2: 2016 303(D)
ASSESSMENT METHODS
2016 Final Integrated Report

Chapter 2: 2016 303(d) Assessment Methods
Final 2016 IR: version 2.1 Page 2
[This page is intentionally left blank].
Chapter 2: 2016 303(d) Assessment Methods
Final 2016 IR: version 2.1 Page 3
EXECUTIVE SUMMARY
Changes from the March 2015 Draft 303(d) Assessment Methods
Since the development of Utah’s 303(d)Assessment Methods for the 2016 IR which was submitted for
public comment in March 2015, a number of changes and refinements have been made to the
methods that are presented here as Chapter 2 of the Draft 2016 Integrated Report. In addition to
editorial and formatting changes, a number of substantive changes have been made to address
comments and to more accurately reflect the assessment process. UDEQ will only accept comments on
these substantive changes. A responsiveness document to comments received on the original assessment
methods is available on DWQ’s Assessment webpage. A track change version showing all changes to
the assessment methods since public notice of the draft in March 2015 is available upon request
(contact Jim Harris at [email protected]).
The following is a summary of significant changes made to the 2015 draft of the Assessment Methods:
1. Addition of a description for the 5-Alt category which reflects the revised 303(d) Vision.
2. Re-definition of Category 2 waters to better distinguish Category 2 from Category 3
definitions.
3. Clarification of public comment on the assessment methods allowing for comment on interim
changes.
4. Clarification on the elements included in the 305(b) component.
5. Clarification of how DWQ will assess canals and seeps, namely “Canals, springs, and seeps
will all be evaluated in the assessment results, but, with few exceptions, the results at
individual monitoring locations will not be applied to the entire AU, as is the case with stream
and river assessments. The exceptions include canals with specifically identified uses and site-
specific standards in UAC R317-2 or springs or seeps found to accurately represent water
quality in a stream.”
6. Revision of assessment unit delineation to include the process of defining, refining or
establishing new assessment units.
7. Clarification of jurisdictional waters of the state excluding AUs on lands under tribal
jurisdiction.
8. Addition of a provision to allow the evaluation of more recent data outside the period of
record such that DWQ will reserve the discretion to integrate the newer information in the
current cycle.
9. Clarification of E. coli assessment methods with regards to health advisories on rivers and
streams.
10. Additional information on the process of integrating information regarding extreme conditions
such as drought or flood that may come to light during the review of the 303(d) list and its
associated datasets (see section on Representative Data).
Chapter 2: 2016 303(d) Assessment Methods
Final 2016 IR: version 2.1 Page 4
11. Clarification of the minimum data requirements for performing E. coli assessments and
provisions for placing sites with fewer than 5 samples in the index period in category 3
(insufficient data).
12. Description of how assessments of hardness dependent metals were evaluated in situations
where hardness results are missing. Namely a default hardness of 100 milligrams per liter
(mg/l) is used to evaluate the toxic results. Results were reviewed to ensure that a Category 5
(not supporting) decision was not reached using surrogate hardness values.
13. Removal of fluoride data from the assessment until a more appropriate criterion is adopted in
R317.2.
14. Interpretation of the standards for Boron assessments. UAC R317-2 does not specify sample
fraction (total or dissolved) for the boron criterion. All data for boron, both total and
dissolved, were included in the assessment. The intent of the boron standard was for dissolved
fraction. The criterion will be updated in future triennial reviews by the Standards Program.
Until it is adopted in rule, results will be reviewed to ensure that no waterbody is listed based
on total boron results.
15. More detail on supplemental indicators used to confirm harmful algal bloom assessments in
lakes including cyanotoxins, chlorophyll a, phycocyanin, and harmful algal bloom–related
beach closures.
16. Clarification on reporting causes of impairment. EPA requires each impairment to identify a
cause. Added additional language on determining cause and sources for pollutants and
pollution impairments.
17. The following statement was added to the weight of evidence criteria in the lake assessment
section: “The weight of evidence criteria allow DWQ to use key lines of evidence in assessing
a waterbody’s support Utah’s narrative standard that would be ignored by exclusively
focusing on chemical water quality parameters.”
18. Additional clarification and detail on the process for assessing waters for fish tissue
consumption (see section “Beneficial Use Assessment Based on Tissue Consumption Health
Advisories.”)
19. Elaboration on “Good Cause” for delisting a waterbody.
Chapter 2: 2016 303(d) Assessment Methods
Final 2016 IR: version 2.1 Page 5
HOW TO USE THIS DOCUMENT
Utah’s Clean Water Action Section 303(d) Assessment Methods provide a framework for
categorizing and determining whether a waterbody or segment within a waterbody supports or
does not support the assigned water quality standards and designated uses found in Utah
Administrative Code (UAC) R317-2. However, there may be site-specific considerations not
identified in the 303(d) Assessment Methods that are appropriately factored into the final listing
decision.
Generally, DWQ’s decision to list or not list a waterbody will be based on the stringent application
of the policies and procedures outlined in the data assessment sections of this document. As is also
indicated in this document, best professional judgment may be applied when appropriate. If best
professional judgment or any other deviations from the methods defined in this document are
implemented, DWQ tracks these deviations and provides justification and supporting
documentation.
All changes and supporting information will be available to stakeholders and other interested
parties for their review during the IR and 303(d) public comment periods. DWQ encourages
stakeholders and other reviewers to submit their own best professional judgment and mitigating
evidence using the data and information requirements outlined in this methods and the IR Call for
Data. All DWQ and stakeholder-generated data and information will be retained by DWQ and
become part of the process for final consideration and approval of the IR and 303(d) List.
Chapter 2: 2016 303(d) Assessment Methods
Final 2016 IR: version 2.1 Page 6
CONTENTS
EXECUTIVE SUMMARY ............................................................................................................................... 3
Changes from the March 2015 Draft 303(d) Assessment Methods .......................................................................... 3
HOW TO USE THIS DOCUMENT .................................................................................................................. 5
CONTENTS .................................................................................................................................................. 6
ABBREVIATIONS ....................................................................................................................................... 10
FIGURES .................................................................................................................................................... 12
TABLES ...................................................................................................................................................... 13
INTRODUCTION ........................................................................................................................................ 14
The Clean Water Act and the Integrated Report ...................................................................................................... 14
Assessment Categories for Surface Waters ................................................................................................ 14
Utah’s Numeric Criteria and Beneficial Uses............................................................................................................... 18
Prior ity and Assessed Parameters .................................................................................................................... 19
ASSESSMENT PROCESS ............................................................................................................................. 20
Existing and Readily Available Data ........................................................................................................................... 20
Developing the Methods ................................................................................................................................................. 20
Public Review of the Methods ........................................................................................................................................ 21
Developing the Components of the Integrated Report and 303(d) List ................................................................ 22
Executive Summary ............................................................................................................................................... 22
305(b) Summary of Lakes/Reservoirs and Rivers/Streams ............................................................................. 22
303(d) Assessment Results ....................................................................................................................................... 22
303(d) Assessment Metadata ................................................................................................................................ 23
Additional Assessment Metadata .......................................................................................................................... 23
Public Review of the 303(d) List .................................................................................................................................... 23
Finalizing the 303(d) List ................................................................................................................................................. 25
SCOPE OF THE ASSESSMENT .................................................................................................................... 26
Waters of the State ......................................................................................................................................................... 26
Waterbody Types............................................................................................................................................................ 26
Great Salt Lake and Associated Wetlands ........................................................................................................ 28
Assessment Units ................................................................................................................................................................ 28
Assessment Unit Delineation and Identification ................................................................................................... 28
Guidelines for Delineating Stream and River Assessment Units ...................................................................... 28
Refining and Creating New Assessment Units ..................................................................................................... 30
Stream Mileage Calculation for the DWQ 2016 Integrated Report ............................................................ 30
Waters within and Shared with Other States ............................................................................................................. 31
Monitoring and the Rotating Basin ................................................................................................................................ 31
Credible Data: General Requirements ........................................................................................................................ 32
Data Types ................................................................................................................................................................ 32
Period of Record ................................................................................................................................................... 33
Chapter 2: 2016 303(d) Assessment Methods
Final 2016 IR: version 2.1 Page 7
General Credible Data Requirements ................................................................................................................. 34
Assessed Waterbodies .................................................................................................................................................... 36
Parameter Assessment under Development: Evaluation of Indicators ............................................................ 36
Addressing Nitrogen and Phosphorus .................................................................................................................. 37
Screening Values ...................................................................................................................................................... 38
ESCHERICHIA COLI ASSESSMENTS ............................................................................................................. 39
Data Preparation ............................................................................................................................................................. 39
Recreation Season .................................................................................................................................................... 39
Escherichia coli Collection Events and Replicate Samples ................................................................................. 39
Data Substitution for Calculating the Geometric Mean .................................................................................... 39
Use Designation ........................................................................................................................................................ 39
Annual Recreation Season Assessment ................................................................................................................. 40
Summarizing Assessment Results ............................................................................................................................ 43
Not Supporting (Category 5) ............................................................................................................ 43
Insufficient Data or Information Assessment Considerations (Category 3A) ............................ 44
Combinations of Category 3E, 2, and/or 1 ................................................................................... 44
Fully Supporting (Category 1 or 2) ................................................................................................. 44
Combining E. coli with Other Parameter Assessment Results ....................................................... 44
ASSESSMENT OF RIVERS, STREAMS, SPRINGS, SEEPS, AND CANALS ..................................................... 45
Data Preparation ............................................................................................................................................................. 45
Results below Detection Limits ................................................................................................................................ 45
Duplicate and Replicate Results ............................................................................................................................. 45
Initial Assessment: Monitoring Location Site Level .............................................................................................. 45
Conventional Parameters ................................................................................................................................................ 45
Toxic Parameters .............................................................................................................................................................. 47
Equation-Based Toxic Parameters......................................................................................................................... 48
Assessment Process ................................................................................................................................................... 49
Biological Assessments ..................................................................................................................................................... 50
River Invertebrate Prediction and Classification System Models ........................................................ 51
Model Construction and Performance .................................................................................................................. 53
Assessing Biological Use Support .................................................................................................................... 56
ASSESSMENT OF LAKES AND RESERVOIRS ............................................................................................. 59
Monitoring Overview ....................................................................................................................................................... 59
Field Method Overview .......................................................................................................................................... 59
Tier I Assessment ............................................................................................................................................................... 60
Drinking Water Use Support .................................................................................................................................. 60
Harmful Algal Blooms ......................................................................................................................... 60
Recreational Use Support ....................................................................................................................................... 61
Escherichia coli ...................................................................................................................................... 61
Harmful Algal Blooms ......................................................................................................................... 61
Aquatic Life Use Support ........................................................................................................................................ 62
pH ........................................................................................................................................................... 62
Temperature ......................................................................................................................................... 63
Chapter 2: 2016 303(d) Assessment Methods
Final 2016 IR: version 2.1 Page 8
Dissolved Oxygen ............................................................................................................................... 65
Aquatic Life Use Assessment for Stratified Lakes and Reservoirs ................................................................... 65
Toxics: Dissolved Metals .......................................................................................................................................... 67
Agricultural Use Support ......................................................................................................................................... 68
Total Dissolved Solids ......................................................................................................................... 68
Tier II Assessment .............................................................................................................................................................. 69
Weight of Evidence Criteria .................................................................................................................................. 69
Carlson’s Trophic State Index ................................................................................................................................. 70
Fish Kill Observations ............................................................................................................................................... 72
Phytoplankton Community ....................................................................................................................................... 72
Great Salt Lake ................................................................................................................................................................ 73
DETERMINATION OF IMPAIRMENT: ALL ASSESSMENT UNITS ................................................................. 74
Individual Assessment of Water Quality Standards ................................................................................................. 74
Conflicting Assessments of Water Quality Standards .............................................................................................. 74
Narrative Standards ........................................................................................................................................................ 75
Drinking Water Closures .................................................................................................................................... 76
Fish Kills .................................................................................................................................................................... 76
Beneficial Use Assessment Based on Tissue Consumption Health Advisories ................................... 76
Beneficial Use Supported (Category 1) ......................................................................................... 78
Insufficient Data with Exceedances (Category 3A)....................................................................... 78
Beneficial Use Not Supported (Category 5) .................................................................................. 78
Overwhelming Evidence .................................................................................................................................................. 78
Best Professional Judgment ............................................................................................................................................ 78
Categorization of an Assessment Unit .......................................................................................................................... 79
Assessment of “All Tributaries” Segments ............................................................................................................ 79
IDENTIFYING CAUSES OF IMPAIRMENTS ................................................................................................. 81
Pollutants ............................................................................................................................................................................ 81
Pollution .............................................................................................................................................................................. 81
Unknown Sources .............................................................................................................................................................. 82
Natural Conditions ........................................................................................................................................................... 82
REVISING THE 303(D) LIST AND OTHER CATEGORICAL ASSESSMENTS .................................................. 83
Category 4A ..................................................................................................................................................................... 83
Category 4B ...................................................................................................................................................................... 84
Category 4C ..................................................................................................................................................................... 85
Delistings ............................................................................................................................................................................ 85
Delisting Categorical Pollutant Causes ................................................................................................................. 89
Previous Categorical Listings .......................................................................................................................................... 89
303(d) Listings ........................................................................................................................................................... 89
Non-303(d) Categorical Listings ........................................................................................................................... 89
303(D) VISION AND TMDL PRIORITY DEVELOPMENT ............................................................................. 91
REVISION REQUESTS BETWEEN CYCLES ................................................................................................... 93
Chapter 2: 2016 303(d) Assessment Methods
Final 2016 IR: version 2.1 Page 9
LITERATURE CITED .................................................................................................................................... 94
APPENDIX 1: ASSESSMENT UNIT ROLL UP............................................................................................... 97
APPENDIX 2: DELISTING ......................................................................................................................... 100
APPENDIX 3: 4B SUBMISSION POLICIES AND PROCEDURES ................................................................. 102
APPENDIX 4: 2014 IR TMDL PRIORITIZATION PROCESS ....................................................................... 104
APPENDIX 5: APPLICATION OF BEST PROFESSIONAL JUDGEMENT ..................................................... 105
APPENDIX 6. CREDIBLE DATA – DATA QUALITY GRADE LEVEL ASSIGNMENTS .................................. 108
Dataset: Utah DWQ (internally-collected data) and Non-DWQ Cooperators. .............................................. 108
Dataset: USGS ............................................................................................................................................................... 114
Dataset: Western Watersheds ................................................................................................................................... 117
Dataset: DOGM ............................................................................................................................................................ 120
Chapter 2: 2016 303(d) Assessment Methods
Final 2016 IR: version 2.1 Page 10
ABBREVIATIONS
< less than
> greater then
≤ less than or equal to
≥ greater than or equal to
AGRC Automated Geographic Reference Center
AU assessment unit
BPJ best professional judgment
CFR Code of Federal Regulations
CWA Clean Water Act
DO dissolved oxygen
DWQ Division of Water Quality
EPA U.S. Environmental Protection Agency
GIS geographic information systems
GSL Great Salt Lake
HUC hydrologic unit
IR Integrated report
kg kilogram
L liter
mg milligram
mg/kg milligrams per kilogram
mg/l milligram per liter
ml milliliter
MLID monitoring location ID
MPN most probable number
NHD National Hydrologic Dataset
O/E observed/expected
QA/QC quality assurance/quality control
QAPP quality assurance project plan
RIVPACS River Invertebrate Prediction and Classification System
SD standard deviation
TDS total dissolved solids
TMDL total maximum daily load

Chapter 2: 2016 303(d) Assessment Methods
Final 2016 IR: version 2.1 Page 11
TSI trophic state index
UAC Utah Administrative Code
USGS U.S. Geological Survey
WMU watershed management unit
μg/l microgram per liter
Chapter 2: 2016 303(d) Assessment Methods
Final 2016 IR: version 2.1 Page 12
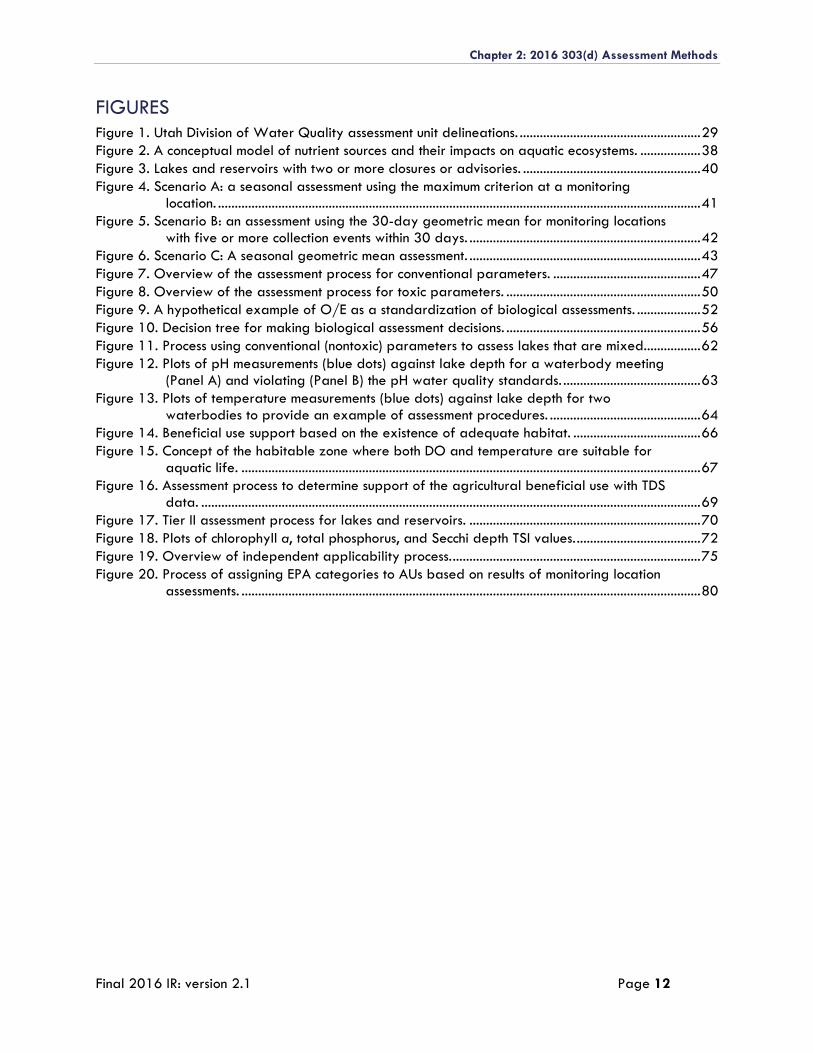
FIGURES
Figure 1. Utah Division of Water Quality assessment unit delineations. ...................................................... 29
Figure 2. A conceptual model of nutrient sources and their impacts on aquatic ecosystems. .................. 38
Figure 3. Lakes and reservoirs with two or more closures or advisories. ..................................................... 40
Figure 4. Scenario A: a seasonal assessment using the maximum criterion at a monitoring location. ................................................................................................................................................ 41
Figure 5. Scenario B: an assessment using the 30-day geometric mean for monitoring locations with five or more collection events within 30 days. ..................................................................... 42
Figure 6. Scenario C: A seasonal geometric mean assessment. ..................................................................... 43
Figure 7. Overview of the assessment process for conventional parameters. ............................................ 47
Figure 8. Overview of the assessment process for toxic parameters. .......................................................... 50
Figure 9. A hypothetical example of O/E as a standardization of biological assessments. ................... 52
Figure 10. Decision tree for making biological assessment decisions. .......................................................... 56
Figure 11. Process using conventional (nontoxic) parameters to assess lakes that are mixed................. 62
Figure 12. Plots of pH measurements (blue dots) against lake depth for a waterbody meeting (Panel A) and violating (Panel B) the pH water quality standards. ......................................... 63
Figure 13. Plots of temperature measurements (blue dots) against lake depth for two waterbodies to provide an example of assessment procedures. ............................................. 64
Figure 14. Beneficial use support based on the existence of adequate habitat. ...................................... 66
Figure 15. Concept of the habitable zone where both DO and temperature are suitable for aquatic life. ......................................................................................................................................... 67
Figure 16. Assessment process to determine support of the agricultural beneficial use with TDS data. ..................................................................................................................................................... 69
Figure 17. Tier II assessment process for lakes and reservoirs. ..................................................................... 70
Figure 18. Plots of chlorophyll a, total phosphorus, and Secchi depth TSI values. ..................................... 72
Figure 19. Overview of independent applicability process. .......................................................................... 75
Figure 20. Process of assigning EPA categories to AUs based on results of monitoring location assessments. ......................................................................................................................................... 80
Chapter 2: 2016 303(d) Assessment Methods
Final 2016 IR: version 2.1 Page 13
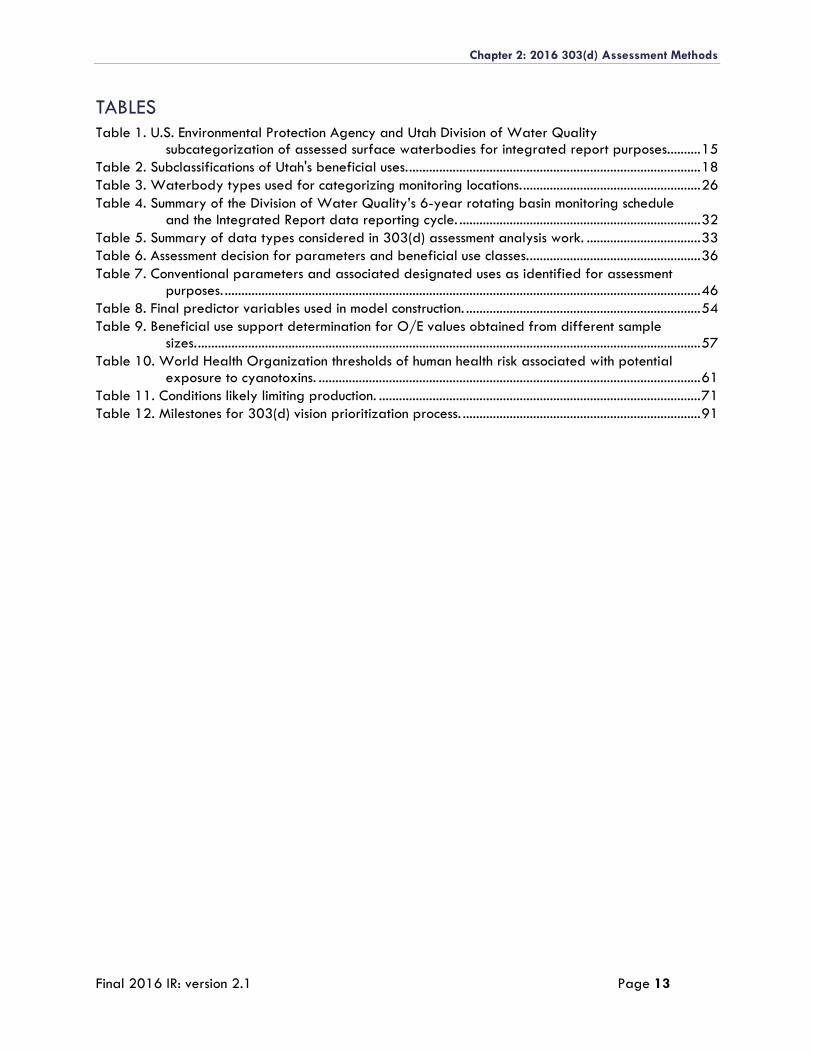
TABLES
Table 1. U.S. Environmental Protection Agency and Utah Division of Water Quality subcategorization of assessed surface waterbodies for integrated report purposes.......... 15
Table 2. Subclassifications of Utah's beneficial uses. ....................................................................................... 18
Table 3. Waterbody types used for categorizing monitoring locations. ..................................................... 26
Table 4. Summary of the Division of Water Quality’s 6-year rotating basin monitoring schedule and the Integrated Report data reporting cycle. ........................................................................ 32
Table 5. Summary of data types considered in 303(d) assessment analysis work. .................................. 33
Table 6. Assessment decision for parameters and beneficial use classes. ................................................... 36
Table 7. Conventional parameters and associated designated uses as identified for assessment purposes. .............................................................................................................................................. 46
Table 8. Final predictor variables used in model construction. ...................................................................... 54
Table 9. Beneficial use support determination for O/E values obtained from different sample sizes. ...................................................................................................................................................... 57
Table 10. World Health Organization thresholds of human health risk associated with potential exposure to cyanotoxins. .................................................................................................................. 61
Table 11. Conditions likely limiting production. ................................................................................................ 71
Table 12. Milestones for 303(d) vision prioritization process. ....................................................................... 91
Chapter 2: 2016 303(d) Assessment Methods
Final 2016 IR: version 2.1 Page 14
INTRODUCTION
The Clean Water Act and the Integrated Repor t
The rules and regulations of the federal Clean Water Act (CWA) require the Utah Division of Water
Quality (DWQ) to report the condition or health of all Utah surface waters to U.S. Congress every
other year. The Integrated Report (IR) contains two key reporting elements defined by the CWA:
1. Statewide reporting under CWA Section 305(b): Section 305(b) reporting summarizes the
overall condition of Utah’s surface waters and estimates the relative importance of key water
quality concerns. These concerns can include pollutants, habitat alteration, and sources of
water quality problems.
2. Water quality assessments under CWA Section 303(d): Section 303(d) requires states to
identify waters that are not attaining beneficial uses according to state water quality
standards (Utah Administrative Code [UAC] R317.2.7.1). The Utah Section 303(d) List
(hereafter the 303(d) List) also prioritizes the total maximum daily loads (TMDL) required for
each listed waterbody and the cause of nonattainment. This list includes waters impaired as a
result of nonpoint sources, point source discharges, natural sources, or a combination of
sources.
In addition to Utah’s 303(d) List, DWQ also identifies waterbodies in the IR that DWQ suspects have
water quality problems but cannot confirm due to uncertainty regarding the nature of the data,
insufficient sample size, or other factors. Waterbodies without sufficient information to make an
assessment determination are given priority by DWQ’s Water Quality Assessment Program for
follow-up monitoring to determine whether the waterbody is attaining water quality standards.
Waters that are not on the 303(d) List or on the Assessment Program’s priority list for follow-up
monitoring are either currently addressed by DWQ through a TMDL or other pollution-control
mechanism or are attaining water quality standards. Full descriptions of these and other U.S.
Environmental Protection Agency (EPA)–identified and state-identified waterbody assessment
classifications are described in the following section.
Assessment Categories for Surface Waters
DWQ used five categories defined by EPA to assess surface waters of the state (EPA, 2005). DWQ
has also developed several state-derived subcategories that are used for internal tracking and
planning purposes in addition to EPA’s categories. These categories and subcategories are described
in Table 1.
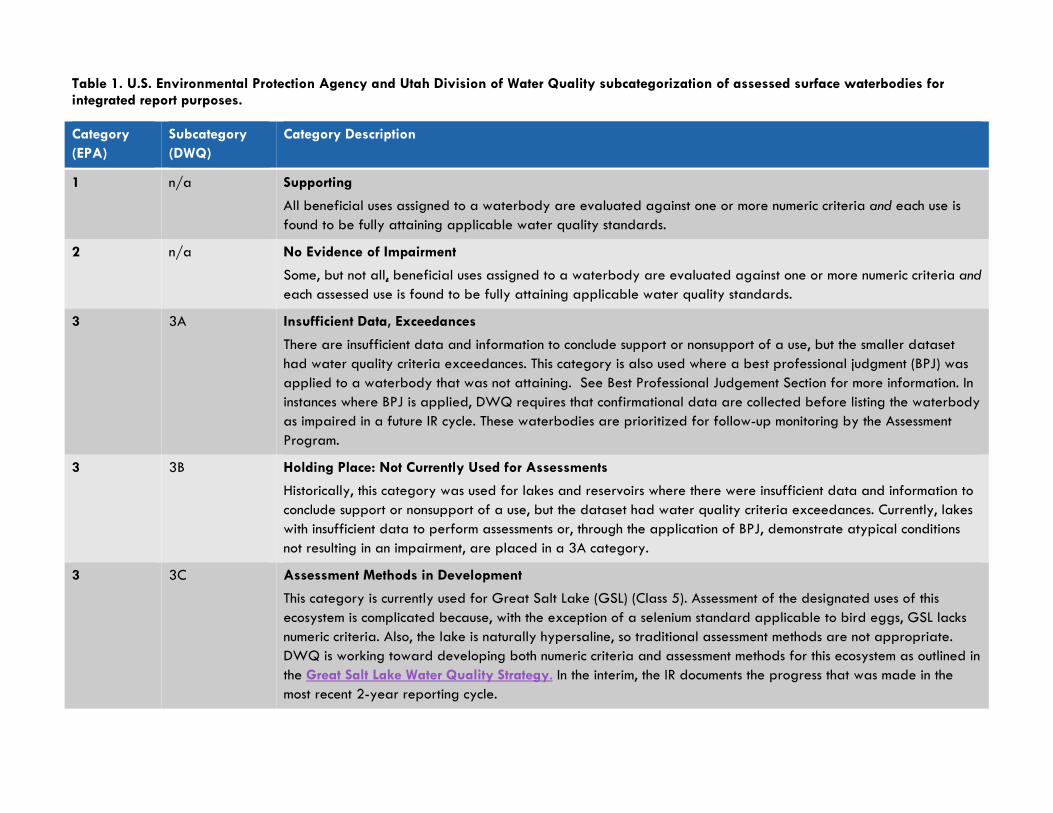
Table 1. U.S. Environmental Protection Agency and Utah Division of Water Quality subcategorization of assessed surface waterbodies for integrated report purposes.
Category
(EPA)
Subcategory
(DWQ)
Category Description
1 n/a Supporting
All beneficial uses assigned to a waterbody are evaluated against one or more numeric criteria and each use is
found to be fully attaining applicable water quality standards.
2 n/a No Evidence of Impairment
Some, but not all, beneficial uses assigned to a waterbody are evaluated against one or more numeric criteria and
each assessed use is found to be fully attaining applicable water quality standards.
3 3A Insufficient Data, Exceedances
There are insufficient data and information to conclude support or nonsupport of a use, but the smaller dataset
had water quality criteria exceedances. This category is also used where a best professional judgment (BPJ) was
applied to a waterbody that was not attaining. See Best Professional Judgement Section for more information. In
instances where BPJ is applied, DWQ requires that confirmational data are collected before listing the waterbody
as impaired in a future IR cycle. These waterbodies are prioritized for follow-up monitoring by the Assessment
Program.
3 3B Holding Place: Not Currently Used for Assessments
Historically, this category was used for lakes and reservoirs where there were insufficient data and information to
conclude support or nonsupport of a use, but the dataset had water quality criteria exceedances. Currently, lakes
with insufficient data to perform assessments or, through the application of BPJ, demonstrate atypical conditions
not resulting in an impairment, are placed in a 3A category.
3 3C Assessment Methods in Development
This category is currently used for Great Salt Lake (GSL) (Class 5). Assessment of the designated uses of this
ecosystem is complicated because, with the exception of a selenium standard applicable to bird eggs, GSL lacks
numeric criteria. Also, the lake is naturally hypersaline, so traditional assessment methods are not appropriate.
DWQ is working toward developing both numeric criteria and assessment methods for this ecosystem as outlined in
the Great Salt Lake Water Quality Strategy. In the interim, the IR documents the progress that was made in the
most recent 2-year reporting cycle.
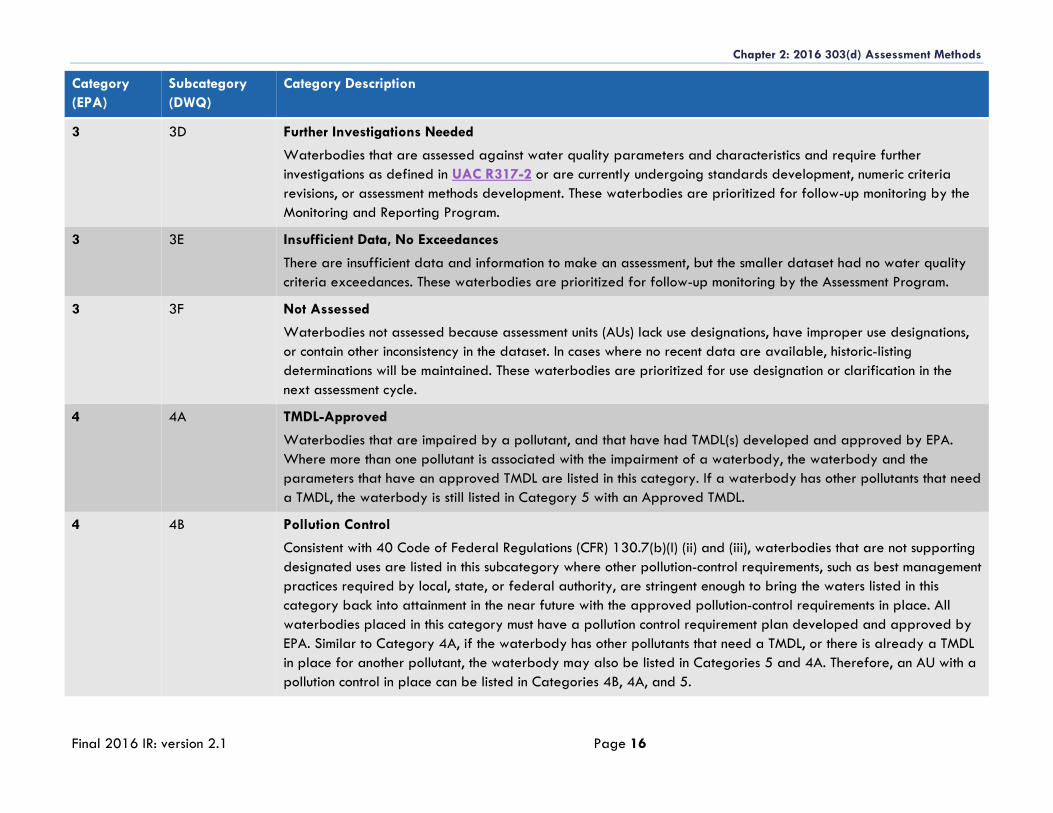
Chapter 2: 2016 303(d) Assessment Methods
Final 2016 IR: version 2.1 Page 16
Category
(EPA)
Subcategory
(DWQ)
Category Description
3 3D Further Investigations Needed
Waterbodies that are assessed against water quality parameters and characteristics and require further
investigations as defined in UAC R317-2 or are currently undergoing standards development, numeric criteria
revisions, or assessment methods development. These waterbodies are prioritized for follow-up monitoring by the
Monitoring and Reporting Program.
3 3E Insufficient Data, No Exceedances
There are insufficient data and information to make an assessment, but the smaller dataset had no water quality
criteria exceedances. These waterbodies are prioritized for follow-up monitoring by the Assessment Program.
3 3F Not Assessed
Waterbodies not assessed because assessment units (AUs) lack use designations, have improper use designations,
or contain other inconsistency in the dataset. In cases where no recent data are available, historic-listing
determinations will be maintained. These waterbodies are prioritized for use designation or clarification in the
next assessment cycle.
4 4A TMDL-Approved
Waterbodies that are impaired by a pollutant, and that have had TMDL(s) developed and approved by EPA.
Where more than one pollutant is associated with the impairment of a waterbody, the waterbody and the
parameters that have an approved TMDL are listed in this category. If a waterbody has other pollutants that need
a TMDL, the waterbody is still listed in Category 5 with an Approved TMDL.
4 4B Pollution Control
Consistent with 40 Code of Federal Regulations (CFR) 130.7(b)(I) (ii) and (iii), waterbodies that are not supporting
designated uses are listed in this subcategory where other pollution-control requirements, such as best management
practices required by local, state, or federal authority, are stringent enough to bring the waters listed in this
category back into attainment in the near future with the approved pollution-control requirements in place. All
waterbodies placed in this category must have a pollution control requirement plan developed and approved by
EPA. Similar to Category 4A, if the waterbody has other pollutants that need a TMDL, or there is already a TMDL
in place for another pollutant, the waterbody may also be listed in Categories 5 and 4A. Therefore, an AU with a
pollution control in place can be listed in Categories 4B, 4A, and 5.
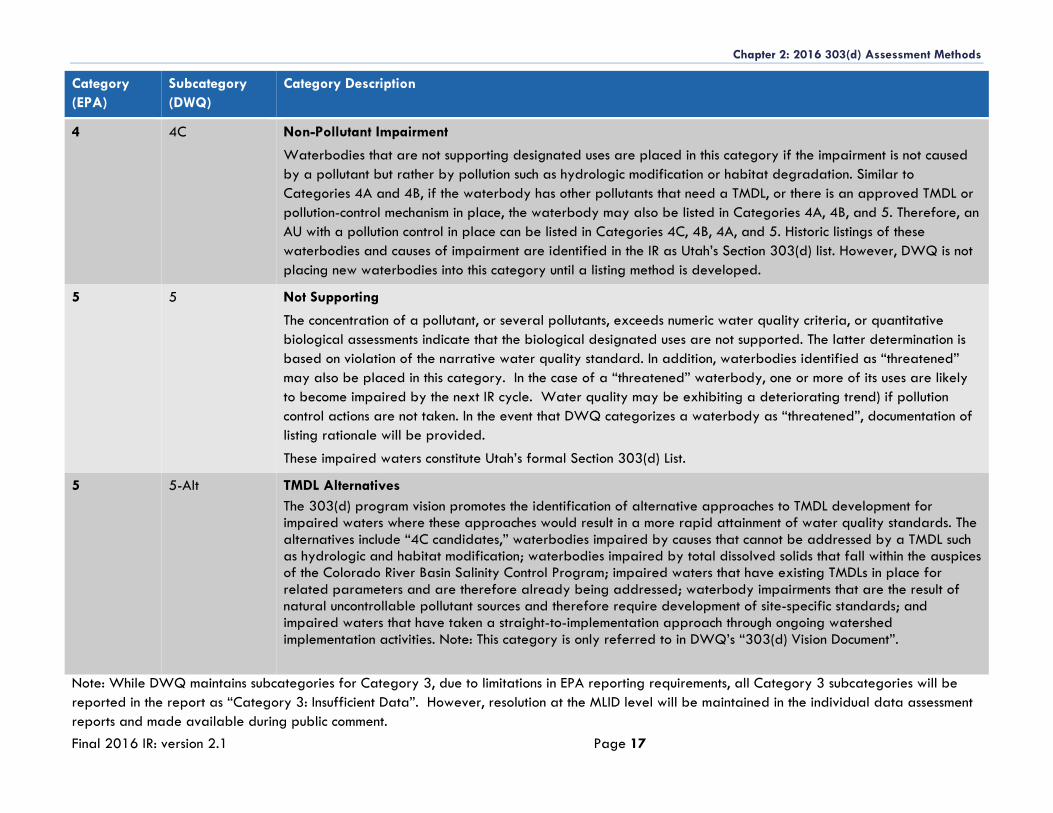
Chapter 2: 2016 303(d) Assessment Methods
Final 2016 IR: version 2.1 Page 17
Category
(EPA)
Subcategory
(DWQ)
Category Description
4 4C Non-Pollutant Impairment
Waterbodies that are not supporting designated uses are placed in this category if the impairment is not caused
by a pollutant but rather by pollution such as hydrologic modification or habitat degradation. Similar to
Categories 4A and 4B, if the waterbody has other pollutants that need a TMDL, or there is an approved TMDL or
pollution-control mechanism in place, the waterbody may also be listed in Categories 4A, 4B, and 5. Therefore, an
AU with a pollution control in place can be listed in Categories 4C, 4B, 4A, and 5. Historic listings of these
waterbodies and causes of impairment are identified in the IR as Utah’s Section 303(d) list. However, DWQ is not
placing new waterbodies into this category until a listing method is developed.
5 5 Not Supporting
The concentration of a pollutant, or several pollutants, exceeds numeric water quality criteria, or quantitative
biological assessments indicate that the biological designated uses are not supported. The latter determination is
based on violation of the narrative water quality standard. In addition, waterbodies identified as “threatened”
may also be placed in this category. In the case of a “threatened” waterbody, one or more of its uses are likely
to become impaired by the next IR cycle. Water quality may be exhibiting a deteriorating trend) if pollution
control actions are not taken. In the event that DWQ categorizes a waterbody as “threatened”, documentation of
listing rationale will be provided.
These impaired waters constitute Utah’s formal Section 303(d) List.
5 5-Alt TMDL Alternatives
The 303(d) program vision promotes the identification of alternative approaches to TMDL development for impaired waters where these approaches would result in a more rapid attainment of water quality standards. The alternatives include “4C candidates,” waterbodies impaired by causes that cannot be addressed by a TMDL such as hydrologic and habitat modification; waterbodies impaired by total dissolved solids that fall within the auspices of the Colorado River Basin Salinity Control Program; impaired waters that have existing TMDLs in place for related parameters and are therefore already being addressed; waterbody impairments that are the result of natural uncontrollable pollutant sources and therefore require development of site-specific standards; and impaired waters that have taken a straight-to-implementation approach through ongoing watershed implementation activities. Note: This category is only referred to in DWQ’s “303(d) Vision Document”.
Note: While DWQ maintains subcategories for Category 3, due to limitations in EPA reporting requirements, all Category 3 subcategories will be
reported in the report as “Category 3: Insufficient Data”. However, resolution at the MLID level will be maintained in the individual data assessment
reports and made available during public comment.
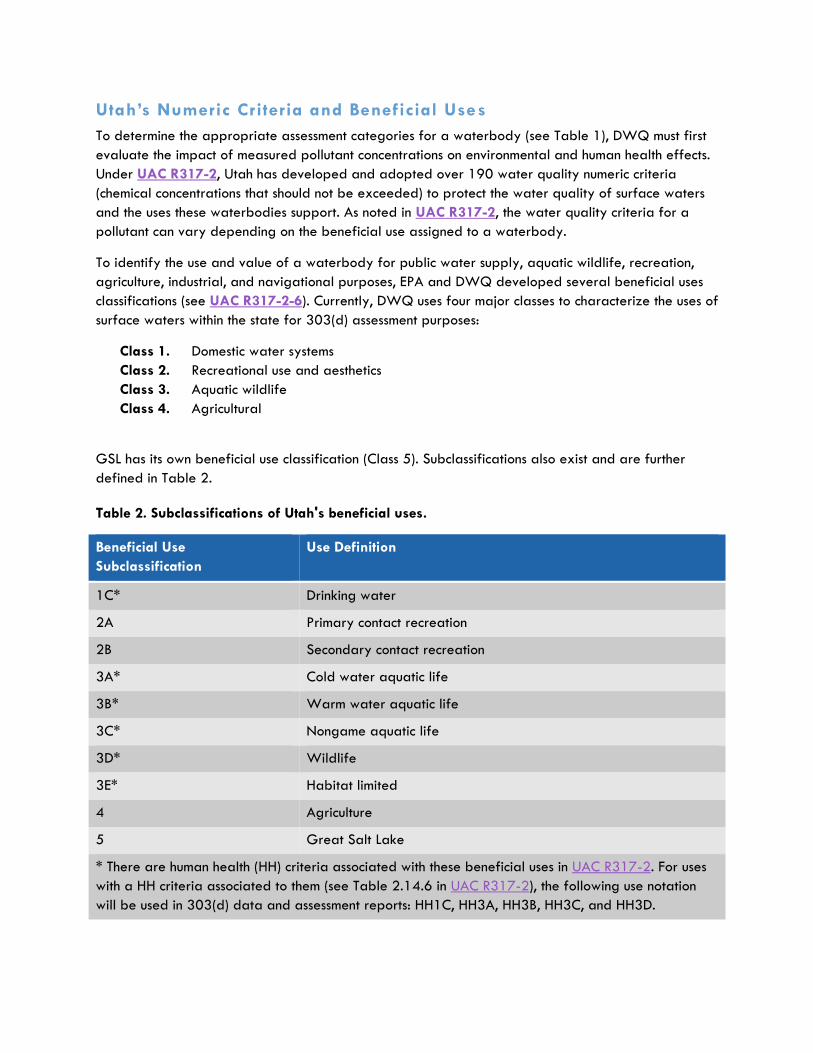
Utah’s Numeric Criteria and Beneficial Uses
To determine the appropriate assessment categories for a waterbody (see Table 1), DWQ must first
evaluate the impact of measured pollutant concentrations on environmental and human health effects.
Under UAC R317-2, Utah has developed and adopted over 190 water quality numeric criteria
(chemical concentrations that should not be exceeded) to protect the water quality of surface waters
and the uses these waterbodies support. As noted in UAC R317-2, the water quality criteria for a
pollutant can vary depending on the beneficial use assigned to a waterbody.
To identify the use and value of a waterbody for public water supply, aquatic wildlife, recreation,
agriculture, industrial, and navigational purposes, EPA and DWQ developed several beneficial uses
classifications (see UAC R317-2-6). Currently, DWQ uses four major classes to characterize the uses of
surface waters within the state for 303(d) assessment purposes:
Class 1. Domestic water systems
Class 2. Recreational use and aesthetics
Class 3. Aquatic wildlife
Class 4. Agricultural
GSL has its own beneficial use classification (Class 5). Subclassifications also exist and are further
defined in Table 2.
Table 2. Subclassifications of Utah's beneficial uses.
Beneficial Use
Subclassification
Use Definition
1C* Drinking water
2A Primary contact recreation
2B Secondary contact recreation
3A* Cold water aquatic life
3B* Warm water aquatic life
3C* Nongame aquatic life
3D* Wildlife
3E* Habitat limited
4 Agriculture
5 Great Salt Lake
* There are human health (HH) criteria associated with these beneficial uses in UAC R317-2. For uses
with a HH criteria associated to them (see Table 2.14.6 in UAC R317-2), the following use notation
will be used in 303(d) data and assessment reports: HH1C, HH3A, HH3B, HH3C, and HH3D.
Chapter 2: 2016 303(d) Assessment Methods
Draft 2016 IR: version 2.0 Page 19
For 303(d) assessment purposes, every beneficial use with numeric criteria and credible data is
assessed and reported. DWQ does not just assess and report on the most environmentally protective
criterion and/or use for a parameter and waterbody. Where waterbodies are unclassified and do
not have assigned beneficial uses in DWQ data records, DWQ may assign default beneficial uses as
articulated in UAC R317-2-13.9, 13.10, 13.11, 13.12, and 13.13. Alternately, these undefined
waterbodies may be classified as Category 3F, and prioritized for assignment of AU definitions and
uses for the next IR cycle.
For more information on how DWQ develops, adopts, and updates the numeric criteria and beneficial uses in UAC R317-2, please refer to DWQ’s Standards website.
Priority and Assessed Parameters
To make the list of pollutants with numeric criteria in UAC R317-2 more manageable for monitoring
for assessment purposes, DWQ developed a priority parameter list that is used in routine water
quality monitoring. This priority list is a subset of the pollutants listed in UAC R317-2 and reflects the
following constraints:
Laboratory resources that limit DWQ’s ability to assess all parameters in UAC R317-2.
Significant monitoring and/or analysis costs associated with processing a sample or measuring
a pollutant.
Logistical constraints due to monitoring location and holding times for certain parameters.
As a result, water quality assessments may not report on all parameters listed in UAC R317-2.
Instead, assessments reflect all parameters with adopted numeric criteria that also have readily
available and credible datasets from the IR period of record against which they can be evaluated.
To view DWQ’s list of priority parameters, please refer to the Parameters Currently Assessed table
located on the IR Call for Data. Please be aware that priority parameters can change from one
reporting cycle to the next if laboratory and financial constraints and monitoring priorities within a
sampling area change.
Chapter 2: 2016 303(d) Assessment Methods
Draft 2016 IR: version 2.0 Page 20
ASSESSMENT PROCESS
Existing and Readily Available Data
To determine whether a waterbody is supporting or not supporting the assigned beneficial uses and
numeric criteria in UAC R317-2, DWQ must compile all existing and readily available data. As part
of the initial data compilation process, DWQ will take into account and consider the following
parameters:
Data and information referenced in 40 CFR 130.7(b)(5)(i), (iii), and (iv), which define readily
available data for inclusion in water quality assessments. In addition to DWQ data collected
for assessment purposes, DWQ also uses the raw data collected for other DWQ programs,
such as waste load allocations, TMDL development, watershed, and use attainability analysis.
Credible data and information that are submitted to or obtained by DWQ during the IR
public Call for Data from October 1 to December 31 of even-numbered years.
Data and information that are independently collected by DWQ and its cooperators
between reporting cycles.
Quantitative data that can be downloaded from publicly available databases from federal,
state, and local agencies.
Additional sources of data included in the Data Types Matrix link on the IR Call for Data
website.
Existing data that are not brought forward through one the above mechanisms or otherwise presented
to DWQ in accordance with the schedule as outlined in this document and on the Water Quality
Assessments Program website will not be treated as “readily available” for the purpose of assessment
decisions during the current assessment cycle.
Existing data that are available and submitted to DWQ or obtained by DWQ during the IR data
compilation process are subject to DWQ’s data management and quality assurance and quality
control (QA/QC) processes. Depending on resource limitations and level of effort required to ensure
compatibility of the data with DWQ’s dataset, some data may be excluded from formal assessment
calculations, although such data may still be used as supporting evidence for assessment decisions. To
help ensure the inclusion of data in DWQ’s assessment process, it is important for data to be submitted
in a form that matches DWQ’s existing data-management capabilities. Required formats and
metadata submissions are provided on the IR Call for Data and will be updated October 1 of even-
numbered years.
Should data not be included in the assessment process because of resource limitations or other
limitations, DWQ will clearly define in the draft and final IR which dataset (or datasets) could not be
included, why, and next steps DWQ will take to ensure future inclusion of these datasets and
information. Updates on datasets that will be targeted by DWQ for the upcoming assessment cycle
will be provided on the Water Quality Assessments Program website.
Developing the Methods
This document describes Utah’s most current assessment methods that will be applied for Utah’s 2016
IR. Although many of the methods described have been applied in past assessment cycles, other
Chapter 2: 2016 303(d) Assessment Methods
Draft 2016 IR: version 2.0 Page 21
methods are new or modified from previous cycles. Some of the assessment method revisions are
simply intended to clarify ongoing DWQ practices. Other more substantive revisions to the methods
are based on concerns that were raised during the public comment periods of the 2014 303(d)
Assessment Methods and draft IR and 303(d) List.
DWQ updates and revises the 303(d) methods when concerns are raised and/or when program
developments are released by DWQ staff. Additional modifications or clarifications to the Assessment
Methods may also be made based on feedback provided by EPA during and after a reporting cycle
or from the EPA’s cycle-specific 303(d) guidance memorandum released to states on odd-numbered
years.
Moving forward, all changes made to the 303(d) Assessment Methods will be reviewed and updated
on odd-numbered years in anticipation of developing the IR and 303(d) List in the following even-
numbered year. This process allows DWQ to consider comments and suggestions on assessment
methods before a formal analysis is conducted which reduces the need to rework analyses from
changes in methods.
Public Review of the Methods
The process for formal consideration and acceptance of the Assessment Methods is driven by a public
review process that follows the following schedule:
1. DWQ released the proposed methods on March 11, 2015, for a 30-day public comment
period. The notice for public comments on the methods was advertised in the Salt Lake Tribune,
Deseret News, DWQ’s News and Announcements and Public Notices website, the IR
Program Information and Current Assessment Methods & Guidance website, and DWQ’s
listserv.
2. At the close of the public comment period on April 12, 2015, DWQ compiled and began
responding to comments that were received within the 30-day public comment period.
3. If substantial revisions to the methods are adopted by DWQ based on comments received in
the first public comment period, DWQ has the discretion to hold a second public comment
period of 30 days or less. Should DWQ proceed with a second public comment period,
notifications will be advertised, at a minimum, on DWQ’s News and Announcements and/or
Public Notices website, the Water Quality Assessments Program website, and DWQ’s
listserv.
4. Following the conclusion of the public comment period(s), DWQ will post responses to
comments on the Assessment Methods webpage. DWQ will release a final version of the
methods that will be used in the upcoming assessment cycle with the results of the draft IR.
5. In the event that DWQ changes elements of the Assessment Methods in the interim between
public comment and the issuing of the subsequent IR for public comment, reviewers will have
the opportunity to make comments on the Assessment Methods during the IR public comment
period only on the changes that were implemented. If stakeholders continue to have concerns
with the final Assessment Methods, the public should submit their comments during future calls
for public comments on 303(d) assessment methodologies that support future IR cycles.
Chapter 2: 2016 303(d) Assessment Methods
Draft 2016 IR: version 2.0 Page 22
Concerns and comments not received through the above processes cannot be guaranteed inclusion in
current and future 303(d) methods updates and modifications. However, in the event that additional
changes or additions to the publicly vetted 303(d) Assessment Methods are made following the close
of the public comment and during the current assessment process, those 303(d) method alterations will
be documented and issued with the draft IR and 303(d) List for additional public comment.
Developing the Components of the Integrated Repor t and 303(d) List
Following the release of a final 303(d) Assessment Methods and compilation of all existing and
readily available data, DWQ reviews all data and assigns a credible data “grade” as defined on
the IR Call for Data website. All non-rejected, credible data are then assessed as defined in this
document for the release of the following IR and associated 303(d) components.
The following minimum report elements will be included in the Integrated Report available for public
review and comment. Please note that additional related program reports or chapters may be issued
along with the Integrated Report.
Executive Summary
This component will include the following:
A summary of report highlights and any deviations from the Assessment Methods contained in
the IR analysis.
305(b) Summary of Lakes/Reservoirs and Rivers/Streams
At a minimum, this summary will address the following elements:
EPA-defined assessment categories for each defined and evaluated Assessment Unit.
Percentage of waters assessed versus not assessed.
o Of those waters that were assessed, the percentage that are impaired versus not
impaired.
o Of those waters that were impaired, the percentage that have approved TMDLs
versus those that do not have approved TMDLs.
Percentage of impaired versus not-impaired waters by beneficial uses.
Miles/acres and number of waterbodies that are impaired for a specific cause.
Update on the miles/acres of causes of impairments.
Number of approved TMDLs by pollutant and the number of causes addressed in the TMDL.
303(d) Assessment Results
At a minimum, the following information will be provided:
303(d) List and other EPA- and state-derived assessment categories by waterbody type. The
two lists will include the following information:
o EPA category 5 waters listed by Assessment Unit and parameter causing impairment.
o Perrenial rivers and stream miles and lake/reservoir acreage.
o Causes of impairment(s), if known.
Chapter 2: 2016 303(d) Assessment Methods
Draft 2016 IR: version 2.0 Page 23
o Cycle first listed and the last cycle the waterbody and cause of impairment were
assessed.
o Impaired uses, if any.
o TMDL priority for Category 5 waters and previous listing decisions (when new data do
not result in delisting and in an update to an assessment category, or no new data
existed and the assessment category from prior 303(d) listing is applied).
o Not-supporting beneficial uses.
Delistings by waterbody and parameter, cycle delisted, and why the waterbody and
parameter were delisted.
303(d) Assessment Metadata
For archiving purposes and to assist with the review of the IR and 303(d) List, DWQ will also provide
the following:
Data reports and summaries of the assessment results by parameter.
Data report reflecting a single categorization at the parameter, sample site location, and AU
level. Also, included is information on the application of BPJ.
Geolocation information on waterbodies that were assessed.
The date and version of UAC R317-2 that were used in the assessment cycle.
The list of approved TMDLs that was used in the assessment cycle.
Note: On January 1 of odd-numbered years, DWQ will “freeze” and establish file versions of several
working files to maintain consistency and data integrity. These files include geographic information system
(GIS) point files of monitoring locations, layers of AUs, beneficial uses, and water quality standards.
Additional Assessment Metadata
For archiving purposes and to assist with the review of the IR, DWQ will also provide the following:
Waters and parameters that were impaired but have an approved TMDL. DWQ will also
indicate if the water and parameter moved from the previous reporting cycle’s 303(d) List to
a Category 4A (approved TMDL) in the current cycle vs. the water and parameter are newly
impaired but are addressed in an approved TMDL and therefore move straight to a
Category 4A.
Summary list of the water and the assessment category.
Public Review of the 303(d) List
Similar to the consideration and final adoption of the 303(d) Assessment Methods, there will be a
formal public review process for the IR and 303(d) List with the following steps:
1. Any person who has a pollution-control mechanism plan for a waterbody and would like to
submit that plan for consideration and EPA approval as a Category 4B must submit that
information to DWQ by July 1 of odd-numbered years (Appendix 3). If approved by DWQ,
this information will then be submitted to EPA for review and final approval. It should be
noted, however, that successful Category 4B determinations typically take a long time to
receive EPA approval and would likely not be received in time to be included in the current IR
cycle.
Chapter 2: 2016 303(d) Assessment Methods
Draft 2016 IR: version 2.0 Page 24
2. Waters and pollutants that are considered for a potential Category 4A (approved TMDLs)
must be approved by DWQ’s Water Quality Board per UAC R317-1-7 and by EPA per 40
CFR 130.7 by September 30 of even-numbered years. TMDLs that are approved by DWQ
and EPA after that date will be considered in future IRs.
3. After October 1 of odd-numbered years and no later than February 1 of even-numbered
years, DWQ will release the proposed IR and 303(d) List for a 30-day public comment
period. At a minimum, the notice for public comments on the IR will be advertised in the Salt
Lake Tribune, Deseret News, DWQ’s News and Announcements and/or Public Notices,
Water Quality Assessments Program website, and DWQ’s listserv.
4. Stakeholders who wish to submit data for listing or delistings considerations are encouraged to
submit that data and information during the Assessment Program’s Call for Data. However,
DWQ will also consider data that are submitted during the public comment period of the
draft IR and 303(d) List when the public commenter can show that their submitted data results
could result in a potential change to a specific waterbody assessment decision. Data that are
submitted during the public comment period for the draft IR must be submitted in the format
articulated in this document and on the IR Call for Data website and be of Grade A or B
quality to be used in an assessment decision (see the Data Quality Matrices at the IR Call for
Data website).
5. During the 30-day public comment period for the draft IR and 303(d) List, the Assessment
Program will present a summary of the draft report and 303(d) List to DWQ’s Water Quality
Board. Concerns raised by the board will be documented and considered part of the public
comment process.
6. At the close of the 30-day public comment period, DWQ will compile and begin responding
to comments that were received within the 30-day public comment period.
7. If substantial revisions to the IR and 303(d) List are adopted by DWQ on the basis of
comments received in the first public comment period, DWQ may grant or withhold its
discretion to offer a second public comment period of 30 days or fewer. Should DWQ
proceed with a second public comment period, notifications will be advertised, at a minimum,
on DWQ’s News and Announcements and/or Public Notices website, Water Quality
Assessments Program website, and DWQ’s listserv.
8. No later than April 1 of even-numbered years, DWQ will submit a response to the public
comments that were received during the 30-day public comment period and a final version of
the IR and 303(d) List to EPA for final approval. DWQ will post a status update on the IR
website, letting stakeholders know that a final IR was submitted to EPA for final approval.
After the submission of the IR to EPA for final approval, any concerns or rebuttals that
stakeholders have with the IR will not be considered for the recently submitted IR. If
stakeholders continue to have concerns with the IR and 303(d) List, they should submit their
comments through future calls for public comments on future IRs.
9. EPA has 30 days to approve or disapprove the 303(d) List after receiving DWQ’s formal
submission letter, IR chapters, 303(d) List, categorization of non-303(d) waterbodies, public
comments received and DWQ’s response to them, delisting tables and justifications, list of
approved TMDLs/pollution-control mechanisms, and GIS files of all assessment results. If EPA
disapproves a state list, EPA has 30 days to develop a new list for the state; although
historically EPA has rarely established an entire list for a state. EPA may also partially
disapprove a list because some waters have been omitted, and EPA may add these waters to
Chapter 2: 2016 303(d) Assessment Methods
Draft 2016 IR: version 2.0 Page 25
the state’s list. If EPA’s final approval of the IR takes longer than the timeframe identified
above, DWQ will post updates on the IR website.
10. Any concerns and comments not received through the above processes cannot be guaranteed
for inclusion in the IR. DWQ will apply discretion with regard to evaluating and responding to
comments received after the ending of the comment period.
Finalizing the 303(d) List
Following EPA’s approval, DWQ will release the following information on DWQ’s Water Quality
Assessments Program website:
Draft and final versions of 303(d) Assessment Methods, including the public comments received
and DWQ’s response to comments
Draft and final IR chapters and 303(d) Lists, including public comments received, DWQ’s
response to comments, all assessment information that was considered and evaluated in the
finalization of the IR and 303(d) List, and a GIS file of the final assessments and 303(d) List
In addition, EPA maintains a database of state IR results and TMDL status. If additional information not
available on the Assessment Methods website is needed, DWQ may require a Government
Records Access and Management Act request to be filed. These requests can be submitted at any
time.
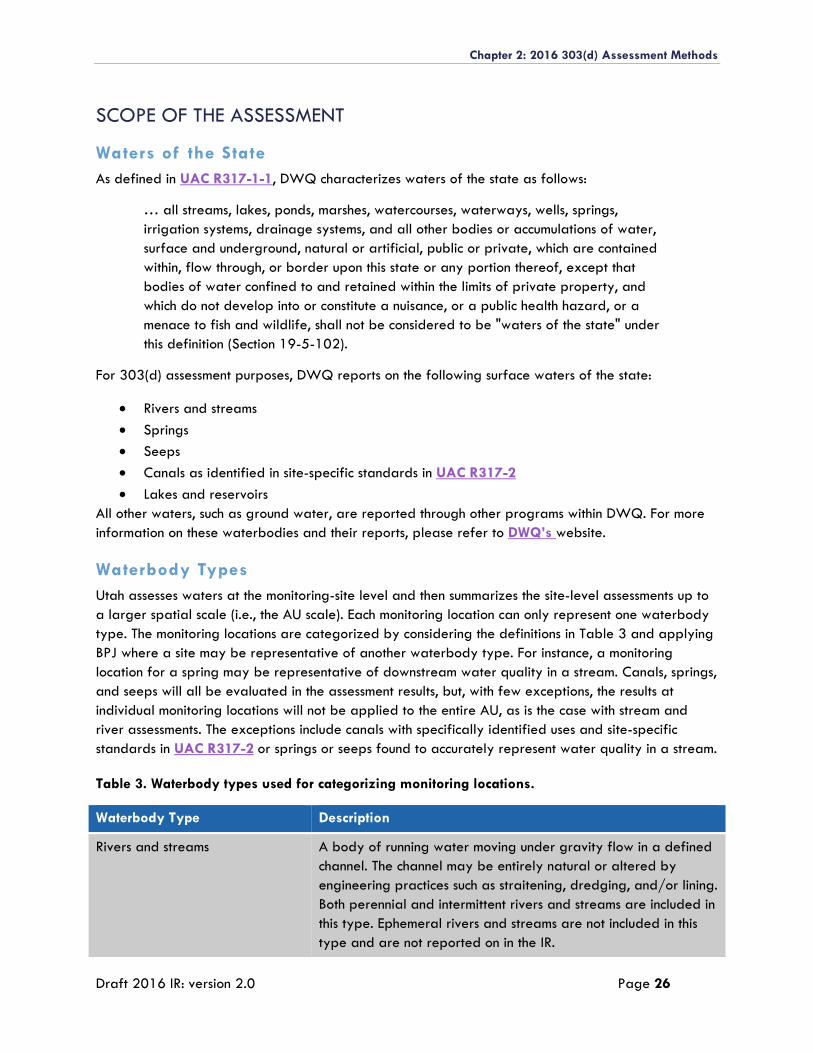
Chapter 2: 2016 303(d) Assessment Methods
Draft 2016 IR: version 2.0 Page 26
SCOPE OF THE ASSESSMENT
Waters of the State
As defined in UAC R317-1-1, DWQ characterizes waters of the state as follows:
… all streams, lakes, ponds, marshes, watercourses, waterways, wells, springs,
irrigation systems, drainage systems, and all other bodies or accumulations of water,
surface and underground, natural or artificial, public or private, which are contained
within, flow through, or border upon this state or any portion thereof, except that
bodies of water confined to and retained within the limits of private property, and
which do not develop into or constitute a nuisance, or a public health hazard, or a
menace to fish and wildlife, shall not be considered to be "waters of the state" under
this definition (Section 19-5-102).
For 303(d) assessment purposes, DWQ reports on the following surface waters of the state:
Rivers and streams
Springs
Seeps
Canals as identified in site-specific standards in UAC R317-2
Lakes and reservoirs
All other waters, such as ground water, are reported through other programs within DWQ. For more
information on these waterbodies and their reports, please refer to DWQ’s website.
Waterbody Types
Utah assesses waters at the monitoring-site level and then summarizes the site-level assessments up to
a larger spatial scale (i.e., the AU scale). Each monitoring location can only represent one waterbody
type. The monitoring locations are categorized by considering the definitions in Table 3 and applying
BPJ where a site may be representative of another waterbody type. For instance, a monitoring
location for a spring may be representative of downstream water quality in a stream. Canals, springs,
and seeps will all be evaluated in the assessment results, but, with few exceptions, the results at
individual monitoring locations will not be applied to the entire AU, as is the case with stream and
river assessments. The exceptions include canals with specifically identified uses and site-specific
standards in UAC R317-2 or springs or seeps found to accurately represent water quality in a stream.
Table 3. Waterbody types used for categorizing monitoring locations.
Waterbody Type Description
Rivers and streams A body of running water moving under gravity flow in a defined
channel. The channel may be entirely natural or altered by
engineering practices such as straitening, dredging, and/or lining.
Both perennial and intermittent rivers and streams are included in
this type. Ephemeral rivers and streams are not included in this
type and are not reported on in the IR.
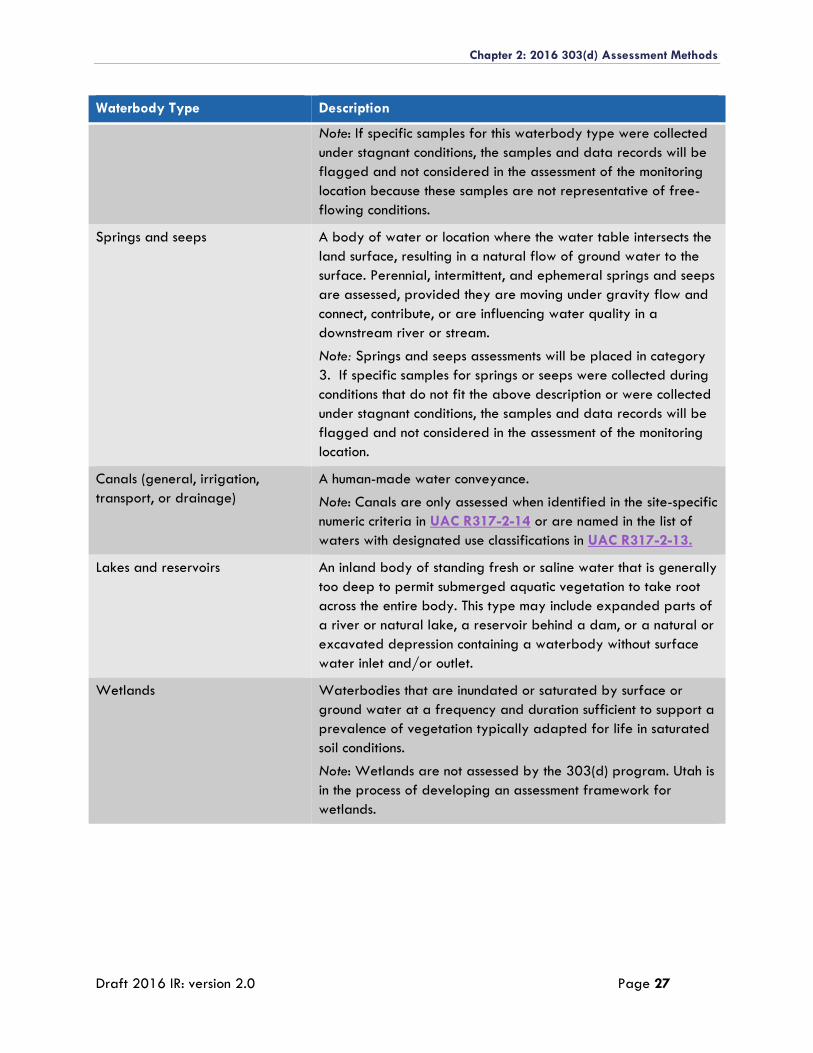
Chapter 2: 2016 303(d) Assessment Methods
Draft 2016 IR: version 2.0 Page 27
Waterbody Type Description
Note: If specific samples for this waterbody type were collected
under stagnant conditions, the samples and data records will be
flagged and not considered in the assessment of the monitoring
location because these samples are not representative of free-
flowing conditions.
Springs and seeps A body of water or location where the water table intersects the
land surface, resulting in a natural flow of ground water to the
surface. Perennial, intermittent, and ephemeral springs and seeps
are assessed, provided they are moving under gravity flow and
connect, contribute, or are influencing water quality in a
downstream river or stream.
Note: Springs and seeps assessments will be placed in category
3. If specific samples for springs or seeps were collected during
conditions that do not fit the above description or were collected
under stagnant conditions, the samples and data records will be
flagged and not considered in the assessment of the monitoring
location.
Canals (general, irrigation,
transport, or drainage)
A human-made water conveyance.
Note: Canals are only assessed when identified in the site-specific
numeric criteria in UAC R317-2-14 or are named in the list of
waters with designated use classifications in UAC R317-2-13.
Lakes and reservoirs An inland body of standing fresh or saline water that is generally
too deep to permit submerged aquatic vegetation to take root
across the entire body. This type may include expanded parts of
a river or natural lake, a reservoir behind a dam, or a natural or
excavated depression containing a waterbody without surface
water inlet and/or outlet.
Wetlands Waterbodies that are inundated or saturated by surface or
ground water at a frequency and duration sufficient to support a
prevalence of vegetation typically adapted for life in saturated
soil conditions.
Note: Wetlands are not assessed by the 303(d) program. Utah is
in the process of developing an assessment framework for
wetlands.
Chapter 2: 2016 303(d) Assessment Methods
Draft 2016 IR: version 2.0 Page 28
Great Salt Lake and Associated Wetlands
DWQ is currently developing criteria and methods for the assessment of GSL as outlined in the Great Salt Lake Water Quality Strategy. In addition, DWQ is actively pursuing projects that continue to develop, test, and refine wetland condition assessment frameworks for GSL wetlands. For 2016, this waterbody will not be assessed for 303(d) reporting purposes.
Assessment Units
Assessment Unit Delineation and Identification
Streams, rivers, lakes, and reservoirs have been delineated into discrete units called assessment units
(AUs). AUs are used in identifying waters of the state that have been assessed to determine if they
are supporting their designated beneficial uses. Lakes and reservoirs have been delineated as
individual AUs and their size is reported in acres. Rivers and streams have been delineated by
specific river, river or stream reach, or several stream reaches in subwatersheds. AU size for streams is
reported in total perennial stream miles. When using subwatersheds to delineate stream AUs, the new
U.S. Geological Survey (USGS) 5th-level (10-digit) and 6th-level (12-digit) hydrologic unit codes
(HUCs) for Utah are used. These HUCs allow for the aggregation of stream reaches into individual
AUs that are hydrologically based watersheds. The 5th- and 6th-level HUCs were developed by
individuals representing state and federal agencies, and have been certified by the Natural
Resources Conservation Service.
Guidelines for Delineating Stream and River Assessment Units
When delineating river and stream AUs, DWQ followed the guidelines listed below with the first two
guideline statements being fixed rules.
The AU is within an 8-digit USGS HUC.
Each river and stream AU comprises stream reaches having identical designated beneficial use classifications (i.e., a stream that has beneficial uses of Class 1C, 2B, and 3A and at another part of the stream has Class 2B and 3B). This stream would have at least two AUs because of the difference in beneficial use classifications.
Large rivers, such as the Green River, Colorado River, and portions of other large rivers (e.g., the Bear River and Weber River) were delineated into "linear" or "ribbon" AUs. Where a major tributary enters these rivers or hydrological features such as dams exist, the river is further delineated into two or more AUs.
Tributary rivers and streams were delineated primarily using the 5th- and 6th-level HUCs to define the AUs.
Additional AUs were defined by combining or splitting 5th- or 6th-level watersheds using tributary streams, stream size, and ecological changes such as geology, vegetation, or land use.
Small tributary streams to larger streams that could not be incorporated into a watershed unit were combined into separate unique AUs.
These AUs have been georeferenced (indexed) to the National Hydrologic Dataset (NHD) using a
reach-indexing tool that provides the capability of using GIS techniques to display information and
data for each AU. Beneficial use classifications and assessments for individual AUs can be mapped or
displayed to provide visual representation of assessment results.
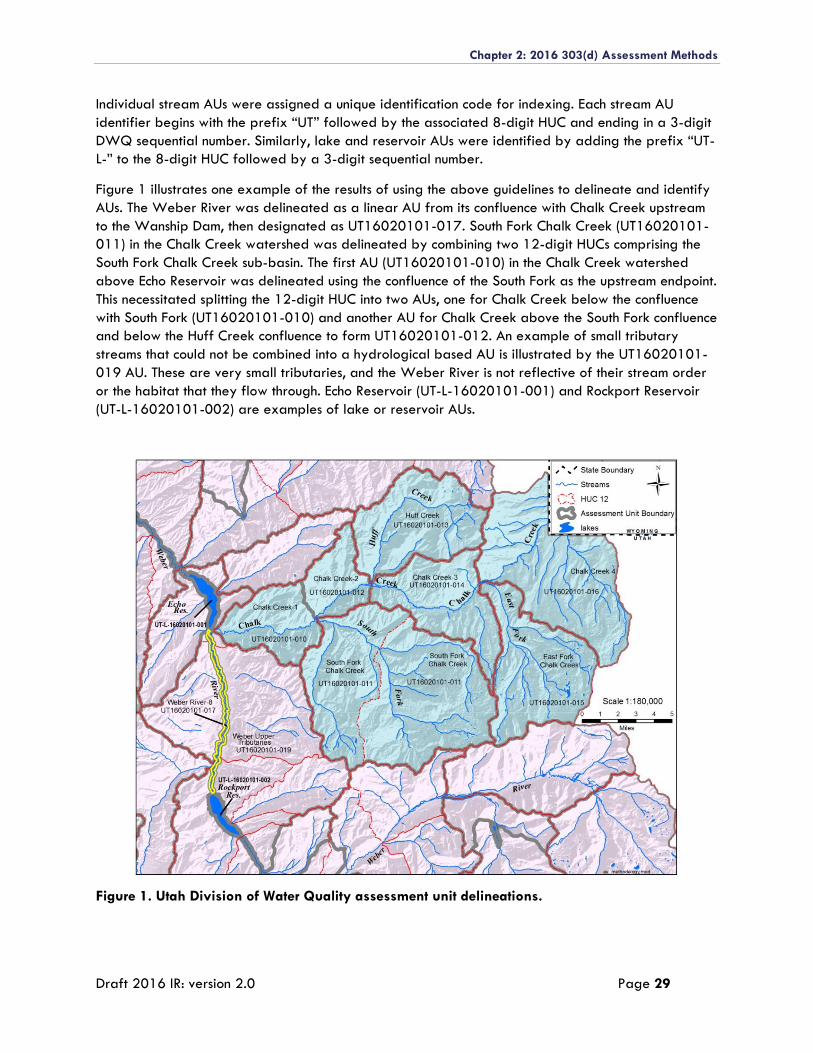
Chapter 2: 2016 303(d) Assessment Methods
Draft 2016 IR: version 2.0 Page 29
Individual stream AUs were assigned a unique identification code for indexing. Each stream AU
identifier begins with the prefix “UT” followed by the associated 8-digit HUC and ending in a 3-digit
DWQ sequential number. Similarly, lake and reservoir AUs were identified by adding the prefix “UT-
L-” to the 8-digit HUC followed by a 3-digit sequential number.
Figure 1 illustrates one example of the results of using the above guidelines to delineate and identify
AUs. The Weber River was delineated as a linear AU from its confluence with Chalk Creek upstream
to the Wanship Dam, then designated as UT16020101-017. South Fork Chalk Creek (UT16020101-
011) in the Chalk Creek watershed was delineated by combining two 12-digit HUCs comprising the
South Fork Chalk Creek sub-basin. The first AU (UT16020101-010) in the Chalk Creek watershed
above Echo Reservoir was delineated using the confluence of the South Fork as the upstream endpoint.
This necessitated splitting the 12-digit HUC into two AUs, one for Chalk Creek below the confluence
with South Fork (UT16020101-010) and another AU for Chalk Creek above the South Fork confluence
and below the Huff Creek confluence to form UT16020101-012. An example of small tributary
streams that could not be combined into a hydrological based AU is illustrated by the UT16020101-
019 AU. These are very small tributaries, and the Weber River is not reflective of their stream order
or the habitat that they flow through. Echo Reservoir (UT-L-16020101-001) and Rockport Reservoir
(UT-L-16020101-002) are examples of lake or reservoir AUs.
Figure 1. Utah Division of Water Quality assessment unit delineations.
Chapter 2: 2016 303(d) Assessment Methods
Draft 2016 IR: version 2.0 Page 30
Digital data representing all established AUs representing Utah’s lakes and streams are stored as
subwatershed polygons in GIS-formatted spatial data files. These data are georeferenced as North
American Datum 1983 in Universal Transverse Mercator (Zone 12 North) projection, and units are in
meters. Maps depicting statewide AUs on letter-sized paper require scales at approximately
1:2,200,000. Digital maps can be shown at various scales depending on the selected zoom
magnification. All perennial streams or lake area represented within a defined AU receive the same
beneficial use assessment category according to assessment results for each AU. Spatial statistics and
assessment summaries are also available for hydrologic basins at various levels of detail.
Refining and Creating New Assessment Units
New AUs can be created based on ecological, geological, and beneficial use assessment information
that provides greater resolution in identifying and delineating rivers and streams into additional AUs
that provide for a more precise assessment of the state’s rivers and streams. A number of
considerations may be used in evaluating whether subdividing an AU is warranted to more accurately
reflect its impairment status (i.e., should the whole AU be listed or just a portion?). A primary
consideration is to identify which monitoring locations result in listing the AU as impaired and which are
supporting uses. In the process, major hydrologic breaks within the AU are identified by viewing the
HUC 12 boundaries. If impaired monitoring locations are located in both upper and lower watershed
HUC 12 subwatersheds, existing AU boundaries are retained. If impaired monitoring locations are
only located in lower subwatersheds but not in upper subwatersheds, the AU is suggested to be split
along the HUC 12 boundary. Finally, if impaired monitoring locations are only located in upper
subwatersheds but not in lower subwatersheds, the existing AU boundaries are also retained.
Stream Mileage Calculation for the DWQ 2016 Integrated Report
The following ArcGIS shapefiles were used to calculate stream miles for each AU in the DWQ 2016
IR:
The Utah Automated Geographic Reference Center (AGRC) State Geographic Information Database
dataset known as “NHD streams” or Water.StreamsNHDHighRes, was derived by AGRC from the
NHD. The derivation and modification process has been performed by AGRC to provide a general-
purpose feature class of streams. Two fields have been added to this feature class (InUtah and
IsMajor), and features have been split at the state boundary (see the AGRC NHD Lakes, Rivers,
Streams, Springs GIS Data Layer website). These vector data are high resolution (1:24,000 scale)
GIS stream features and attribute data used to represent water features across the country (see the
USGS NHD website).
All line features within DWQ’s established and geographically delineated AUs were assigned the
unique AU identifier associated with that AU. The AU designation was completed by GIS overlay
processing (e.g., spatial join) and by splitting line segments at AU boundaries in nearly all cases of AU
boundary intersection.
Using coded NHD attributes describing waterbody characteristics, each waterbody, or segment, was
defined as one of the following waterbody types: Artificial Path (allows for flow though lakes and
reservoirs), Canal/Ditch, Connector, Intermittent Stream, Perennial Stream, or Pipeline (aqueduct).
Total stream mileage for each AU was obtained by the sum of the lengths of all perennial stream
segments within each AU.
Chapter 2: 2016 303(d) Assessment Methods
Draft 2016 IR: version 2.0 Page 31
Waters within and Shared with Other States
Though readily available data may exist from locations near Utah’s state boundaries, DWQ only
assesses, for 303(d) purposes, monitoring location sites that are within the jurisdictional boundaries of
the state. Assessment Units on lands under tribal jurisdiction are not assessed in the IR. Assessments
Assessed surface waters of the state (as defined in Table 3) that flow into Utah but originate outside
of Utah’s borders will be assessed using DWQ monitoring locations residing within state boundaries.
Lakes and reservoirs that overlap with other state jurisdictions (e.g., Lake Powell, Bear Lake, and
Flaming Gorge) will be assessed using the monitoring locations that fall within Utah state jurisdictional
boundaries. For these larger lakes, UAC R317.2 specifies which portions of the lakes are assessed by
Utah's water quality standards.
As resources allow, DWQ will work with neighboring states on any impairments that fall close to
jurisdictional boundaries in other states by notifying the neighboring state of the impairments or
exceedances and available data relevant to the impairment.
Monitoring and the Rotating Basin
To help coordinate and prioritize water quality monitoring and planning throughout the state, DWQ
uses a "rotating basin" approach. Designed to meet the reporting requirements of the 305(b)
component of the IR, DWQ begins monitoring a watershed management unit (WMU) through 50
randomly selected sites to better understand the significant causes of pollution throughout the WMU.
Following the initial probabilistic-monitoring efforts within a WMU, DWQ returns to the watershed 2
years later for more intensive sampling based on the probabilistic-survey results and different
programmatic needs within DWQ.
The following schedule (Table 4) sets out the relationship between the basin reviews and when
assessments generated by those reviews are incorporated in the 303(d) Listing process for the first
time.
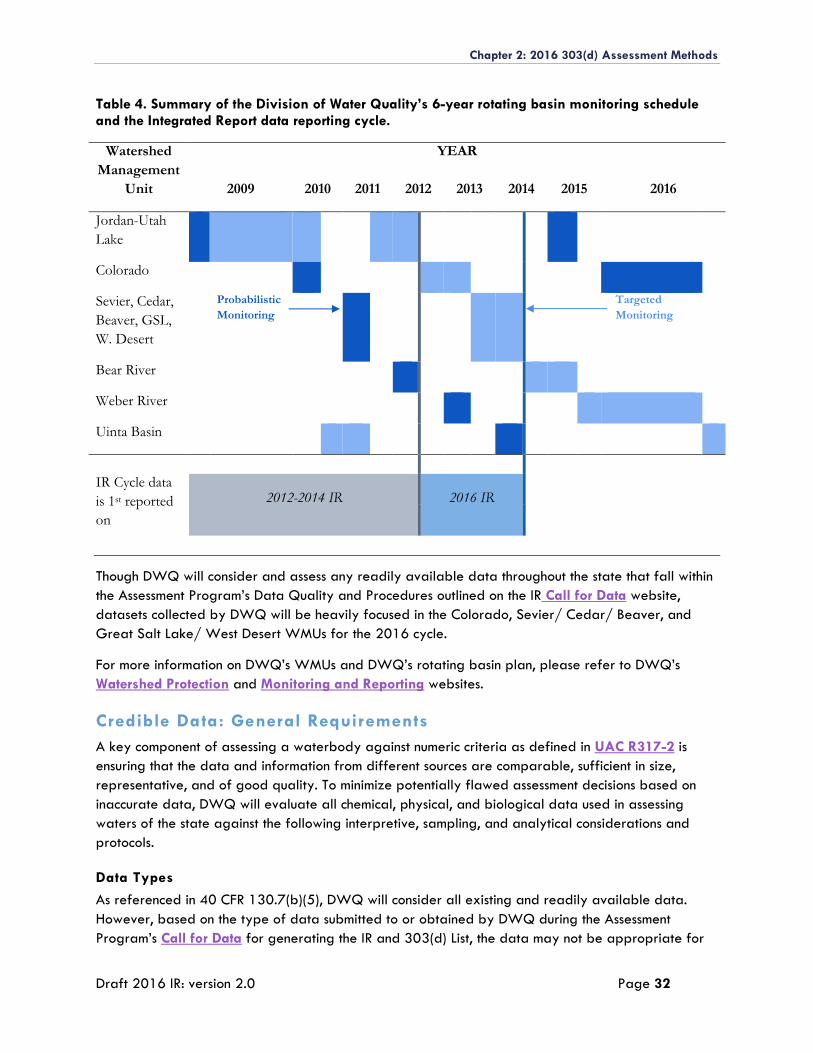
Chapter 2: 2016 303(d) Assessment Methods
Draft 2016 IR: version 2.0 Page 32
Table 4. Summary of the Division of Water Quality’s 6-year rotating basin monitoring schedule and the Integrated Report data reporting cycle.
Watershed
Management
Unit
YEAR
2009 2010 2011 2012 2013 2014 2015 2016
Jordan-Utah
Lake
Colorado
Sevier, Cedar,
Beaver, GSL,
W. Desert
Probabilistic
Monitoring Targeted
Monitoring
Bear River
Weber River
Uinta Basin
IR Cycle data
is 1st reported
on
2012-2014 IR 2016 IR
Though DWQ will consider and assess any readily available data throughout the state that fall within
the Assessment Program’s Data Quality and Procedures outlined on the IR Call for Data website,
datasets collected by DWQ will be heavily focused in the Colorado, Sevier/ Cedar/ Beaver, and
Great Salt Lake/ West Desert WMUs for the 2016 cycle.
For more information on DWQ’s WMUs and DWQ’s rotating basin plan, please refer to DWQ’s
Watershed Protection and Monitoring and Reporting websites.
Credible Data: General Requirements
A key component of assessing a waterbody against numeric criteria as defined in UAC R317-2 is
ensuring that the data and information from different sources are comparable, sufficient in size,
representative, and of good quality. To minimize potentially flawed assessment decisions based on
inaccurate data, DWQ will evaluate all chemical, physical, and biological data used in assessing
waters of the state against the following interpretive, sampling, and analytical considerations and
protocols.
Data Types
As referenced in 40 CFR 130.7(b)(5), DWQ will consider all existing and readily available data.
However, based on the type of data submitted to or obtained by DWQ during the Assessment
Program’s Call for Data for generating the IR and 303(d) List, the data may not be appropriate for
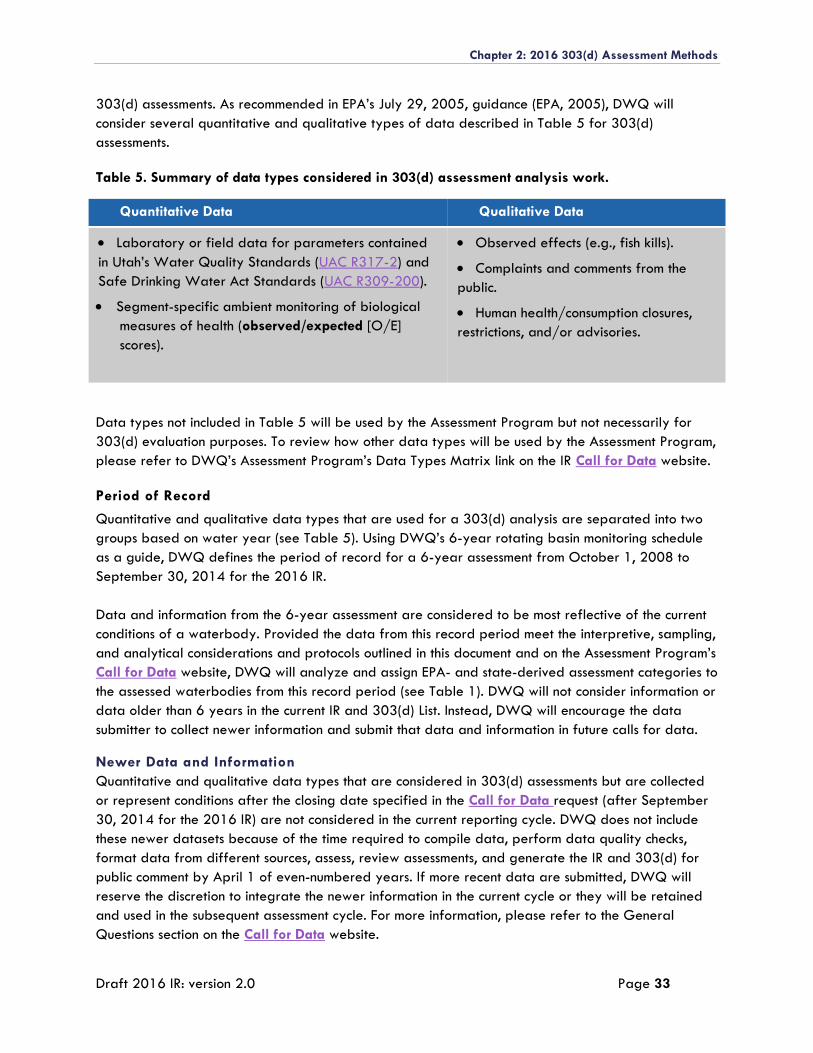
Chapter 2: 2016 303(d) Assessment Methods
Draft 2016 IR: version 2.0 Page 33
303(d) assessments. As recommended in EPA’s July 29, 2005, guidance (EPA, 2005), DWQ will
consider several quantitative and qualitative types of data described in Table 5 for 303(d)
assessments.
Table 5. Summary of data types considered in 303(d) assessment analysis work.
Quantitative Data Qualitative Data
Laboratory or field data for parameters contained
in Utah’s Water Quality Standards (UAC R317-2) and
Safe Drinking Water Act Standards (UAC R309-200).
Segment-specific ambient monitoring of biological
measures of health (observed/expected [O/E]
scores).
Observed effects (e.g., fish kills).
Complaints and comments from the
public.
Human health/consumption closures,
restrictions, and/or advisories.
Data types not included in Table 5 will be used by the Assessment Program but not necessarily for
303(d) evaluation purposes. To review how other data types will be used by the Assessment Program,
please refer to DWQ’s Assessment Program’s Data Types Matrix link on the IR Call for Data website.
Period of Record
Quantitative and qualitative data types that are used for a 303(d) analysis are separated into two
groups based on water year (see Table 5). Using DWQ’s 6-year rotating basin monitoring schedule
as a guide, DWQ defines the period of record for a 6-year assessment from October 1, 2008 to
September 30, 2014 for the 2016 IR.
Data and information from the 6-year assessment are considered to be most reflective of the current
conditions of a waterbody. Provided the data from this record period meet the interpretive, sampling,
and analytical considerations and protocols outlined in this document and on the Assessment Program’s
Call for Data website, DWQ will analyze and assign EPA- and state-derived assessment categories to
the assessed waterbodies from this record period (see Table 1). DWQ will not consider information or
data older than 6 years in the current IR and 303(d) List. Instead, DWQ will encourage the data
submitter to collect newer information and submit that data and information in future calls for data.
Newer Data and Information
Quantitative and qualitative data types that are considered in 303(d) assessments but are collected
or represent conditions after the closing date specified in the Call for Data request (after September
30, 2014 for the 2016 IR) are not considered in the current reporting cycle. DWQ does not include
these newer datasets because of the time required to compile data, perform data quality checks,
format data from different sources, assess, review assessments, and generate the IR and 303(d) for
public comment by April 1 of even-numbered years. If more recent data are submitted, DWQ will
reserve the discretion to integrate the newer information in the current cycle or they will be retained
and used in the subsequent assessment cycle. For more information, please refer to the General
Questions section on the Call for Data website.
Chapter 2: 2016 303(d) Assessment Methods
Draft 2016 IR: version 2.0 Page 34
General Credible Data Requirements
All biological, physical, and chemical data and information that fall within the defined period of
record for an assessment cycle are evaluated against a series of sampling, analytical, and
interpretive protocols. These protocols include an evaluation of sample site geospatial information,
QA/QC of field and laboratory protocols, sampling and laboratory methods, analytical detection
limits, field observations, and variability within a dataset. Data that meet DWQ’s credible data
requirements will be evaluated against the numeric criteria associated with the beneficial uses
assigned to waterbodies in UAC R317-2. Data and information that do not meet DWQ’s credible
data requirements will receive a rejection flag and justification. At no point during the data evaluation
or assessment process will DWQ intentionally delete or remove data from a dataset.
Monitoring Location
To assess a waterbody against the numeric criteria assigned in UAC R317-2 , DWQ must review all
of the monitoring location information associated within the 6-year datasets. This process involves
validating the location’s geospatial information in GIS, assigning beneficial uses to DWQ-validated
locations, and merging monitoring locations and their associated data where locations are
representative of the same waterbody or segment. At a minimum, the information that must be
included with a monitoring location measurement is as follows:
MLID.
Monitoring location name.
Monitoring location description.
Monitoring location waterbody type.
Waterbody type description.
Monitoring location latitude/longitude measurements and associated metadata as defined on
the Assessment Program’s Call for Data website.
Monitoring location elevation measurements and associated metadata as defined on the
Assessment Program’s Call for Data website.
State.
If, during DWQ’s geospatial review of the monitoring location information, a monitoring location has
insufficient or inaccurate information (e.g., it cannot be mapped or is improperly recorded by the
sampler in the field), the monitoring location and its associated data will not be included in the
assessment process of assigning an EPA- and state-derived assessment category (see Table 1).
Stakeholders will be able to review any rejection results from this evaluation process during the draft
IR and 303(d) List public comment period.
Credible Data
Where beneficial uses can be assigned to a DWQ-validated and approved monitoring location,
DWQ will then consider the scientific rigor of the sampling information and measurements associated
with that site. To assess the validity of the sampling and analytical protocols associated with a sample
measurement, DWQ uses a data type–specific credible-data matrix. As noted in the credible-data
matrices on the Assessment’s Call for Data website, each credible-data matrix considers the field and
laboratory QA/QC protocols, sampling and laboratory methods, analytical detection or
Chapter 2: 2016 303(d) Assessment Methods
Draft 2016 IR: version 2.0 Page 35
instrumentation limits, and field observations associated with a sample measurement. Based on the
level of information provided and the strength of the metadata associated with the sample
measurement, DWQ assigned a grade level (A–D) to the associated sample measurement(s) (see
Appendix 6 and the Data Quality Matrices at the IR Call for Data website for more information).
Measurements that receive an A or B grade are considered to be of high quality by DWQ and will
be considered and used by DWQ in the process of assigning an EPA- and state-derived assessment
category to a waterbody (see Table 1). Measurements that receive a C or D grade are considered
by DWQ to be of lower quality and will not be used for assessment and 303(d) listing purposes.
Though DWQ does not use these lower-grade data for generating the IR and 303(d) List, the
Assessment Program still considers some of the lower-quality data for different programmatic
purposes such as targeted/future monitoring for 303(d) Assessment purposes.
Representative Data
To minimize potentially flawed assessment decisions that are driven by extreme events, DWQ screens
all high-quality (Grade A or B) data for representativeness. For IR and 303(d) assessment purposes,
examples of extreme events include the following:
Accidental spills of toxic chemicals.
Scouring storm flows that lead to diminished aquatic-life beneficial uses.
Extreme drought conditions.
Given the scope of these assessments, it is not always possible to identify where such circumstances
may be influencing a specific sample, but DWQ will consider any evidence presented that a sample is
not representative of ambient conditions. Where these conditions are present in a dataset, DWQ will
run the analysis without the extreme events/data record and will apply and document an appropriate
assessment result for the waterbody using the methods outlined below.
Category 1: Supporting: If analyses with and without the extreme events are supporting
(Category 1).
Category 2: No evidence of impairment: If analyses with the extreme events are supporting
(Category 1), but the analyses without the extreme events show no evidence of impairment
(Category 2).
Category 2: No evidence of impairment: If analyses with and without the extreme events do
not indicate evidence of impairment (Category 2).
Category 2: No evidence of impairment: If analyses with the extreme events are evidence of
impairment (Category 3A), but the analyses without the extreme events show no evidence of
impairment (Category 2).
Category 2: No evidence of impairment: If analyses with the extreme events are not
supporting (Category 5), but the analyses without the extreme events show no evidence of
impairment (Category 2).
Category 3A: Isufficient Data, Exceedances: If analyses with and without the extreme events
show evidence of impairment (Category 3A).
Category 3A: Insufficient Data, Exceedances: If analyses with the extreme events are not
supporting (Category 5), but the analyses without the extreme events are supporting
(Category 1).
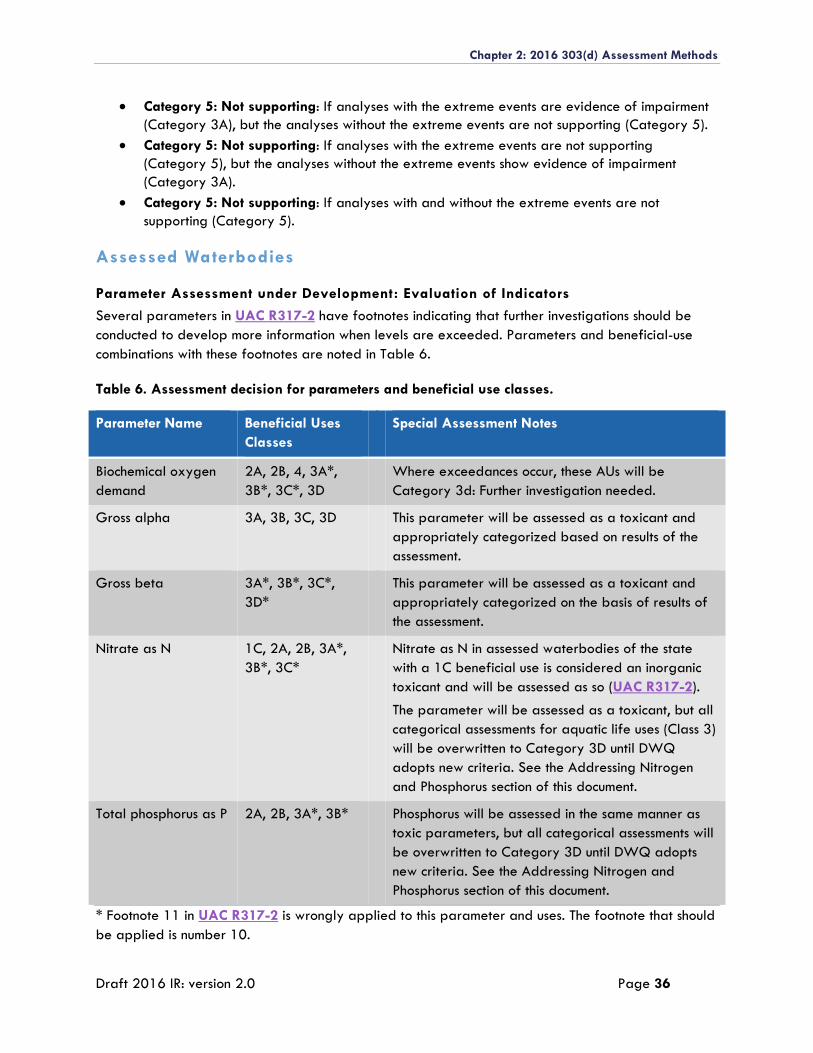
Chapter 2: 2016 303(d) Assessment Methods
Draft 2016 IR: version 2.0 Page 36
Category 5: Not supporting: If analyses with the extreme events are evidence of impairment
(Category 3A), but the analyses without the extreme events are not supporting (Category 5).
Category 5: Not supporting: If analyses with the extreme events are not supporting
(Category 5), but the analyses without the extreme events show evidence of impairment
(Category 3A).
Category 5: Not supporting: If analyses with and without the extreme events are not
supporting (Category 5).
Assessed Waterbodies
Parameter Assessment under Development: Evaluation of Indicators
Several parameters in UAC R317-2 have footnotes indicating that further investigations should be
conducted to develop more information when levels are exceeded. Parameters and beneficial-use
combinations with these footnotes are noted in Table 6.
Table 6. Assessment decision for parameters and beneficial use classes.
Parameter Name Beneficial Uses
Classes
Special Assessment Notes
Biochemical oxygen
demand
2A, 2B, 4, 3A*,
3B*, 3C*, 3D
Where exceedances occur, these AUs will be
Category 3d: Further investigation needed.
Gross alpha 3A, 3B, 3C, 3D This parameter will be assessed as a toxicant and
appropriately categorized based on results of the
assessment.
Gross beta 3A*, 3B*, 3C*,
3D*
This parameter will be assessed as a toxicant and
appropriately categorized on the basis of results of
the assessment.
Nitrate as N 1C, 2A, 2B, 3A*,
3B*, 3C*
Nitrate as N in assessed waterbodies of the state
with a 1C beneficial use is considered an inorganic
toxicant and will be assessed as so (UAC R317-2).
The parameter will be assessed as a toxicant, but all
categorical assessments for aquatic life uses (Class 3)
will be overwritten to Category 3D until DWQ
adopts new criteria. See the Addressing Nitrogen
and Phosphorus section of this document.
Total phosphorus as P 2A, 2B, 3A*, 3B* Phosphorus will be assessed in the same manner as
toxic parameters, but all categorical assessments will
be overwritten to Category 3D until DWQ adopts
new criteria. See the Addressing Nitrogen and
Phosphorus section of this document.
* Footnote 11 in UAC R317-2 is wrongly applied to this parameter and uses. The footnote that should
be applied is number 10.
Chapter 2: 2016 303(d) Assessment Methods
Draft 2016 IR: version 2.0 Page 37
Note: Assessment decisions articulated in the notes section of the table will be applied to all assessed
waterbodies of the state identified in Table 4.
Addressing Nitrogen and Phosphorus
DWQ is currently developing a multifaceted nutrient reduction program to address water quality
problems associated with nitrogen and phosphorus pollution. One important aspect of this program is
the development of assessment methods that accurately identify streams and lakes with nutrient-
related problems.
Development of robust assessments to address nitrogen and phosphorus pollution is important for
several reasons. There are many different nutrient responses with the potential to degrade the
designated uses of aquatic ecosystems (Figure 2). Each causal path needs to be assessed to ensure
that excess nutrients are not resulting in water quality impairments. Moreover, there are several
physical characteristics (shading, temperature) of these systems that both reduce and exacerbate
nutrient responses. Further complications arise because different deleterious responses manifest at
different times of the year. Together, these complications mean that it is not easy to generalize about
the concentration of nitrogen and phosphorus that must be avoided to ensure ongoing support of
designated uses, nor a single, isolated ecological response that can reliably identify nutrient-related
problems.
DWQ is developing comprehensive assessment methods that use multiple lines of evidence to
accurately identify sites with nutrient-related problems. These assessments incorporate both historical
and recently developed (e.g., Ostermiller et al. 2014) water quality indicators to accurately assess
whether excess nutrients have degraded conditions to the extent that the designated uses are
impaired. DWQ will seek ongoing public input on these assessment methods as they are developed
and ultimately integrated into assessments in future IRs.
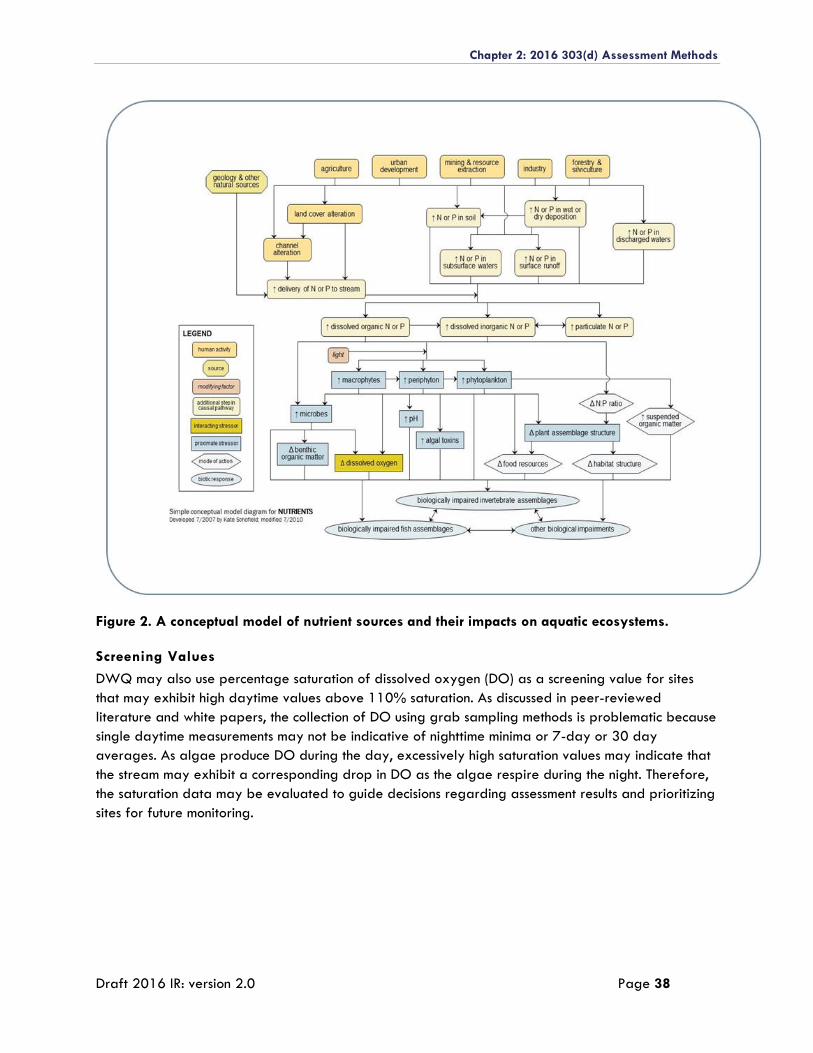
Chapter 2: 2016 303(d) Assessment Methods
Draft 2016 IR: version 2.0 Page 38
Figure 2. A conceptual model of nutrient sources and their impacts on aquatic ecosystems.
Screening Values
DWQ may also use percentage saturation of dissolved oxygen (DO) as a screening value for sites
that may exhibit high daytime values above 110% saturation. As discussed in peer-reviewed
literature and white papers, the collection of DO using grab sampling methods is problematic because
single daytime measurements may not be indicative of nighttime minima or 7-day or 30 day
averages. As algae produce DO during the day, excessively high saturation values may indicate that
the stream may exhibit a corresponding drop in DO as the algae respire during the night. Therefore,
the saturation data may be evaluated to guide decisions regarding assessment results and prioritizing
sites for future monitoring.
Chapter 2: 2016 303(d) Assessment Methods
Draft 2016 IR: version 2.0 Page 39
ESCHERICHIA COLI ASSESSMENTS
Data Preparation
Following a credible data review and additional QA/QC checks as outlined in DWQ’s Quality
Assurance Program Plan For Environmental Data Operations (DWQ, 2014), DWQ compiles all credible
data within the period of record of concern and makes several adjustments based on the reported
limits and sampling frequencies necessary to conduct the assessment. Similar to the other QA/QC and
assessment procedures outlined in this document, the raw data and accompanying metadata values in
Escherichia coli (E. coli) datasets are not altered; instead, a series of database comments and flags is
used.
Recreation Season
To ensure protection of recreation uses, E. coli assessments will be conducted on data collected during
the recreation season from May 1 through October 31. The recreation season may be adjusted either
longer or shorter based on site-specific conditions. Any site-specific adjustments made to the
recreation season will be documented in the IR.
Escherichia coli Collection Events and Replicate Samples
Due to sampling design, datasets at a single monitoring location may contain replicate samples or
multiple samples collected in the same day. For E. coli assessments, single daily values, or collection
events, are required. DWQ defines a collection event as follows:
The daily most probable number (MPN) result value.
A geometric mean of replicates where multiple samples are collected on the same day.
The daily MPN as a quantified value reported as being obtained from a dilution.
In cases where there is a quantified MPN value reported from a dilution and the value reported is
greater-than-detect, the quantified value will be used as the collection event for assessment purposes.
Furthermore, MPNs reported as greater-than-detect are not used to calculate the geometric mean for
the collection event.
Data Substitution for Calculating the Geometric Mean
Attainment of E. coli standards is assessed using the geometric mean of representative samples. E. coli
data that are reported as less than detect (< 1) or 0 will be treated as a value of 1 to allow for the
calculation of a geometric mean. Similarly, E. coli data that are reported as greater than detect (>
2,419.6) will be treated as 2,420 to allow for the calculation of the geometric mean.
Use Designation
Once the data are compiled as described above, DWQ assesses use support for each monitoring
location. All waters of the state are classified for contact recreation (Class 2), and some waters are
classified as drinking water sources (Class 1C). These uses have associated specific E. coli standards
that are used for determining use support. The following default use classifications will be used for
waters that are not designated for specific uses in UAC R317-2:
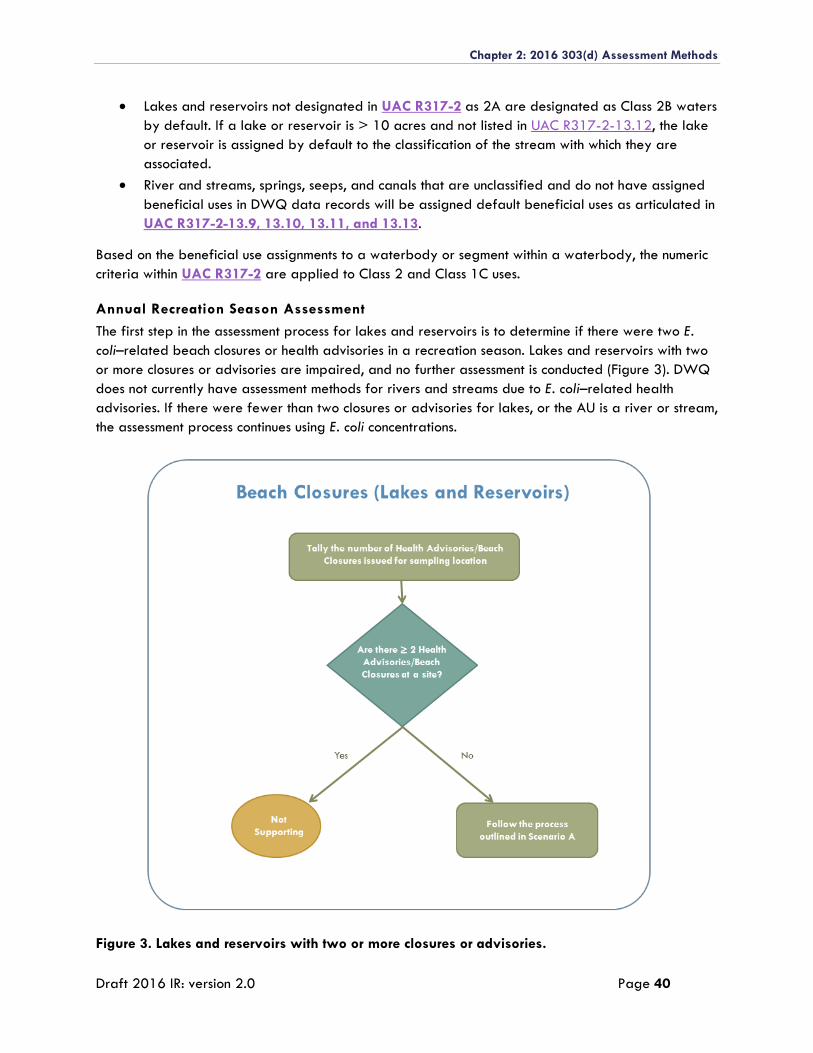
Chapter 2: 2016 303(d) Assessment Methods
Draft 2016 IR: version 2.0 Page 40
Lakes and reservoirs not designated in UAC R317-2 as 2A are designated as Class 2B waters
by default. If a lake or reservoir is > 10 acres and not listed in UAC R317-2-13.12, the lake
or reservoir is assigned by default to the classification of the stream with which they are
associated.
River and streams, springs, seeps, and canals that are unclassified and do not have assigned
beneficial uses in DWQ data records will be assigned default beneficial uses as articulated in
UAC R317-2-13.9, 13.10, 13.11, and 13.13.
Based on the beneficial use assignments to a waterbody or segment within a waterbody, the numeric
criteria within UAC R317-2 are applied to Class 2 and Class 1C uses.
Annual Recreation Season Assessment
The first step in the assessment process for lakes and reservoirs is to determine if there were two E.
coli–related beach closures or health advisories in a recreation season. Lakes and reservoirs with two
or more closures or advisories are impaired, and no further assessment is conducted (Figure 3). DWQ
does not currently have assessment methods for rivers and streams due to E. coli–related health
advisories. If there were fewer than two closures or advisories for lakes, or the AU is a river or stream,
the assessment process continues using E. coli concentrations.
Figure 3. Lakes and reservoirs with two or more closures or advisories.
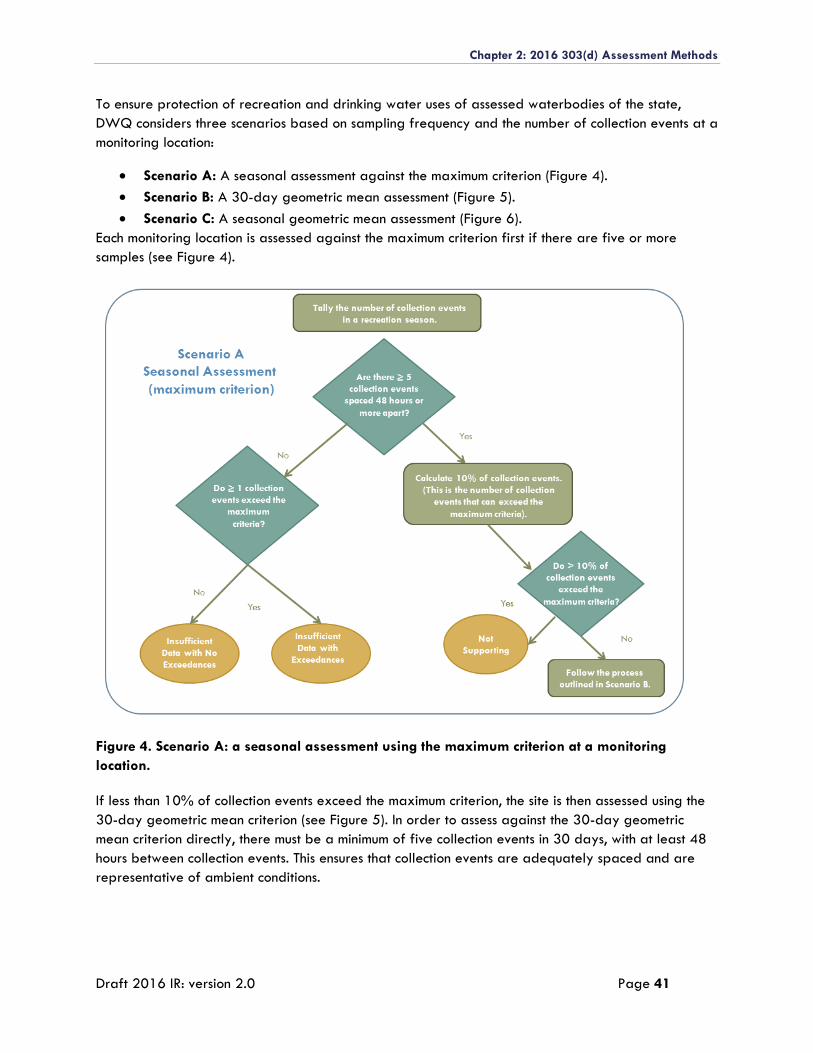
Chapter 2: 2016 303(d) Assessment Methods
Draft 2016 IR: version 2.0 Page 41
To ensure protection of recreation and drinking water uses of assessed waterbodies of the state,
DWQ considers three scenarios based on sampling frequency and the number of collection events at a
monitoring location:
Scenario A: A seasonal assessment against the maximum criterion (Figure 4).
Scenario B: A 30-day geometric mean assessment (Figure 5).
Scenario C: A seasonal geometric mean assessment (Figure 6).
Each monitoring location is assessed against the maximum criterion first if there are five or more
samples (see Figure 4).
Figure 4. Scenario A: a seasonal assessment using the maximum criterion at a monitoring
location.
If less than 10% of collection events exceed the maximum criterion, the site is then assessed using the
30-day geometric mean criterion (see Figure 5). In order to assess against the 30-day geometric
mean criterion directly, there must be a minimum of five collection events in 30 days, with at least 48
hours between collection events. This ensures that collection events are adequately spaced and are
representative of ambient conditions.
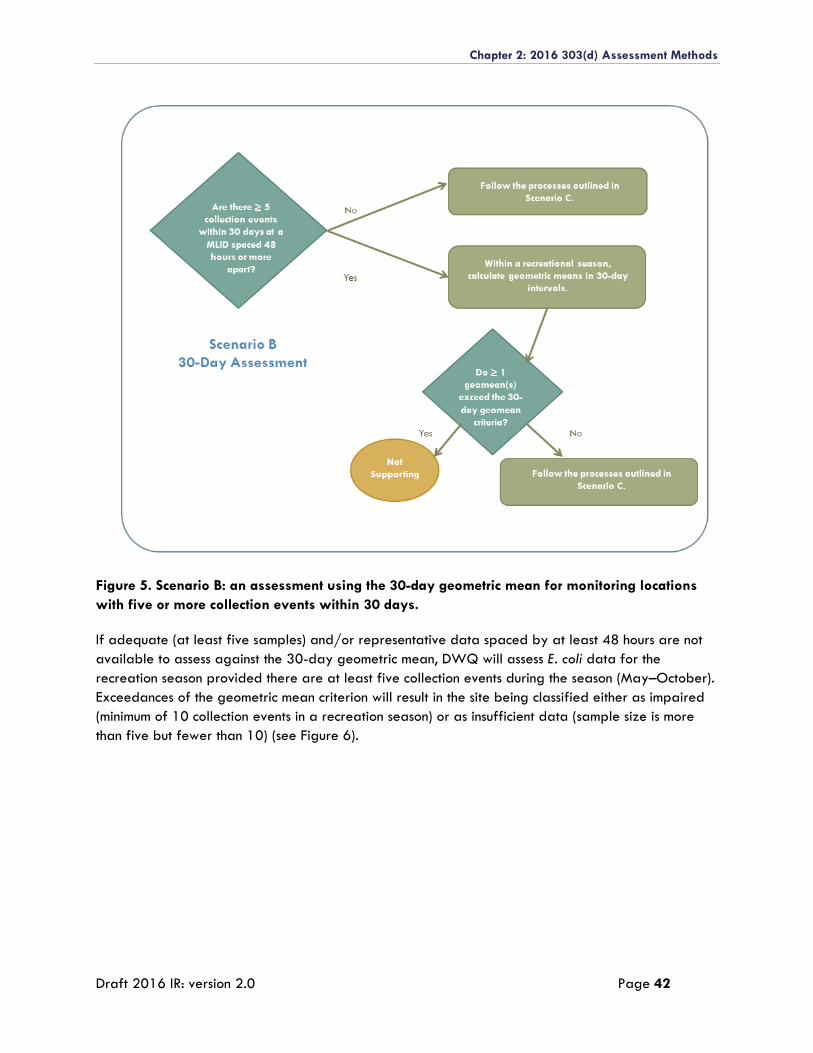
Chapter 2: 2016 303(d) Assessment Methods
Draft 2016 IR: version 2.0 Page 42
Figure 5. Scenario B: an assessment using the 30-day geometric mean for monitoring locations
with five or more collection events within 30 days.
If adequate (at least five samples) and/or representative data spaced by at least 48 hours are not
available to assess against the 30-day geometric mean, DWQ will assess E. coli data for the
recreation season provided there are at least five collection events during the season (May–October).
Exceedances of the geometric mean criterion will result in the site being classified either as impaired
(minimum of 10 collection events in a recreation season) or as insufficient data (sample size is more
than five but fewer than 10) (see Figure 6).
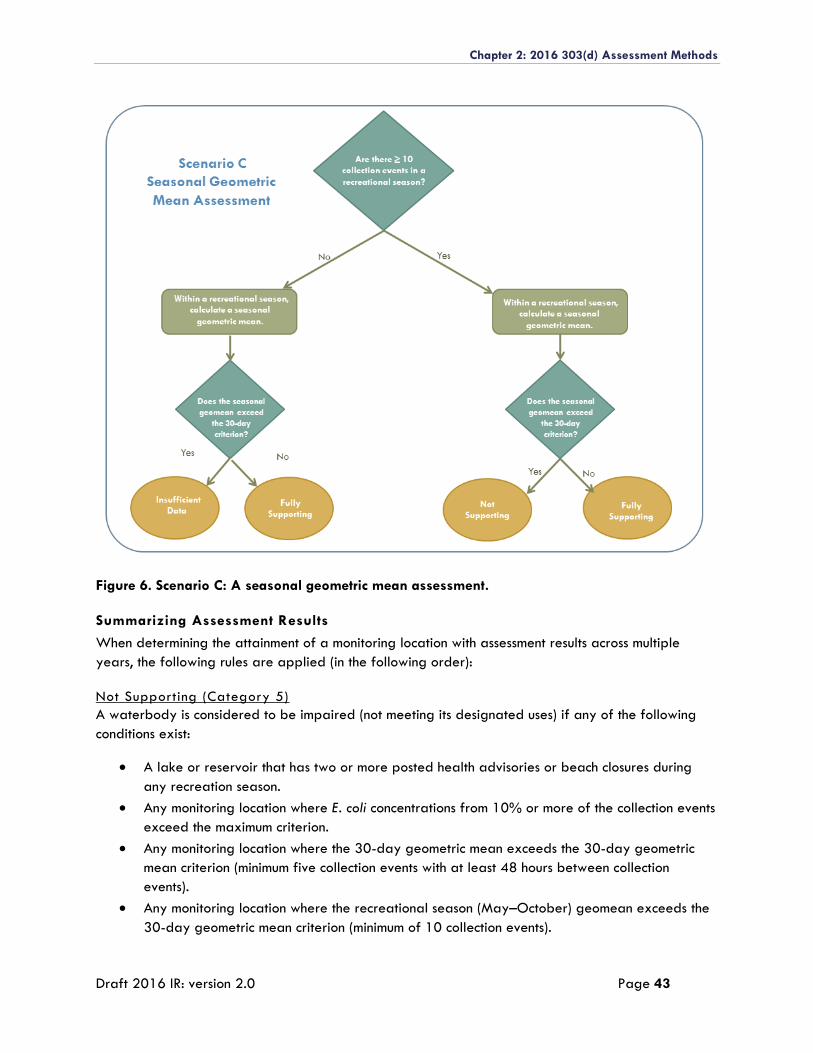
Chapter 2: 2016 303(d) Assessment Methods
Draft 2016 IR: version 2.0 Page 43
Figure 6. Scenario C: A seasonal geometric mean assessment.
Summarizing Assessment Results
When determining the attainment of a monitoring location with assessment results across multiple
years, the following rules are applied (in the following order):
Not Supporting (Category 5)
A waterbody is considered to be impaired (not meeting its designated uses) if any of the following
conditions exist:
A lake or reservoir that has two or more posted health advisories or beach closures during
any recreation season.
Any monitoring location where E. coli concentrations from 10% or more of the collection events
exceed the maximum criterion.
Any monitoring location where the 30-day geometric mean exceeds the 30-day geometric
mean criterion (minimum five collection events with at least 48 hours between collection
events).
Any monitoring location where the recreational season (May–October) geomean exceeds the
30-day geometric mean criterion (minimum of 10 collection events).
Chapter 2: 2016 303(d) Assessment Methods
Draft 2016 IR: version 2.0 Page 44
Insufficient Data or Information Assessment Considerations (Category 3A)
Sites with four or fewer samples in all seasons evaluated will be listed as not assessed,
provided impairment is not suggested by a posted health advisories or beach closure. This
applies at lakes and reservoirs only.
All Category 3A sites will be prioritized for future monitoring, especially if limited data
suggest impairment.
Combinations of Category 3E, 2, and/or 1
When making a final attainment decision of a site after all recreation season assessments are
complete, DWQ uses the approach that if there is no evidence of impairment at a site by any
of the assessment approaches over the period of record of concern, the assessment analysis
from the most recent year outweighs the results from previous years. DWQ has a process for
merging assessment results from multiple locations within an AU (Assessment of Lakes and
Reservoirs section).
Fully Supporting (Category 1 or 2)
No evidence of impairment by any assessment approach for all recreation seasons over the
most recent 6 years. A fully supporting determination can be made with a minimum of five
collection events during the recreational season.
Combining E. coli with Other Parameter Assessment Results
Until the determination of impairment and the review of additional supporting information are
completed by internal reviewers, parameter assessments at an individual monitoring location and
results from multiple monitoring locations within the same AU are not summarized and combined
(Assessment Unit Roll-up; Appendix 1).
Chapter 2: 2016 303(d) Assessment Methods
Draft 2016 IR: version 2.0 Page 45
ASSESSMENT OF RIVERS, STREAMS, SPRINGS, SEEPS, AND CANALS
Data Preparation
DWQ determines attainment or nonattainment of numeric standards for rivers, streams, springs, seep,
and canals by assessing credible data against the numeric criteria in UAC R317-2 through the
protocols outlined below. Though E. coli and biological assessments also are performed on rivers,
streams, springs, seeps, and canals, assessment methods unique to those parameters are described in
separate sections of this document.
Results below Detection Limits
Environmental chemistry laboratories often report sample results as below their detection limit for a
given analytical method. These limits are variously reported as minimum detection limit, minimum
reporting limit, and/or minimum quantitation limit. DWQ first screens and flags laboratory result
values that are empty and that have detection limits higher than the water quality criteria in UAC
R317-2. These flagged data records are not considered for the analysis. For sample results below
detection, the reported result value or a value of 0.5 times the lowest reported detection limit is
applied for purposes of the assessment. However, if one-half of the detection limit is above the water
quality standard, the data will not be used in the assessment.
Duplicate and Replicate Results
Following credible data requirements and additional QA/QC checks as outlined in DWQ’s Quality
Assurance Program Plan For Environmental Data Operations (DWQ, 2014), datasets may contain
duplicate and replicate sample results either due to reporting errors or sampling design. In these
cases, a single daily value is determined by accepting the highest result for parameters with not-to-
exceed criteria in UAC R317-2, or the lowest reported value for parameters with minimum criteria in
UAC R317-2. All data are retained in the assessment dataset and flagged as rejected because of
replicate or duplicate values.
Initial Assessment: Monitoring Location Site Level
Once data records reflect the corrections described above, DWQ analyzes each beneficial use for a
parameter at a single monitoring location. DWQ developed this protocol because individual
assessments offer a more direct measure of supporting or not-supporting water quality standards in
UAC R317-2.
Multiple parameter assessments at an individual monitoring location and results from multiple
monitoring locations within the same AU are not summarized and combined until the determination of
impairment and the additional supporting information are completed by internal reviewers. See the
Determination of Impairment: All Assessment Units section.
Conventional Parameters
Currently, DWQ assesses six parameters within UAC R317-2 as conventional parameters and assesses
them against the beneficial use–specific criteria established in UAC R317-2. Several waterbodies with
conventional numeric criteria have site-specific standards articulated in self-explanatory footnotes
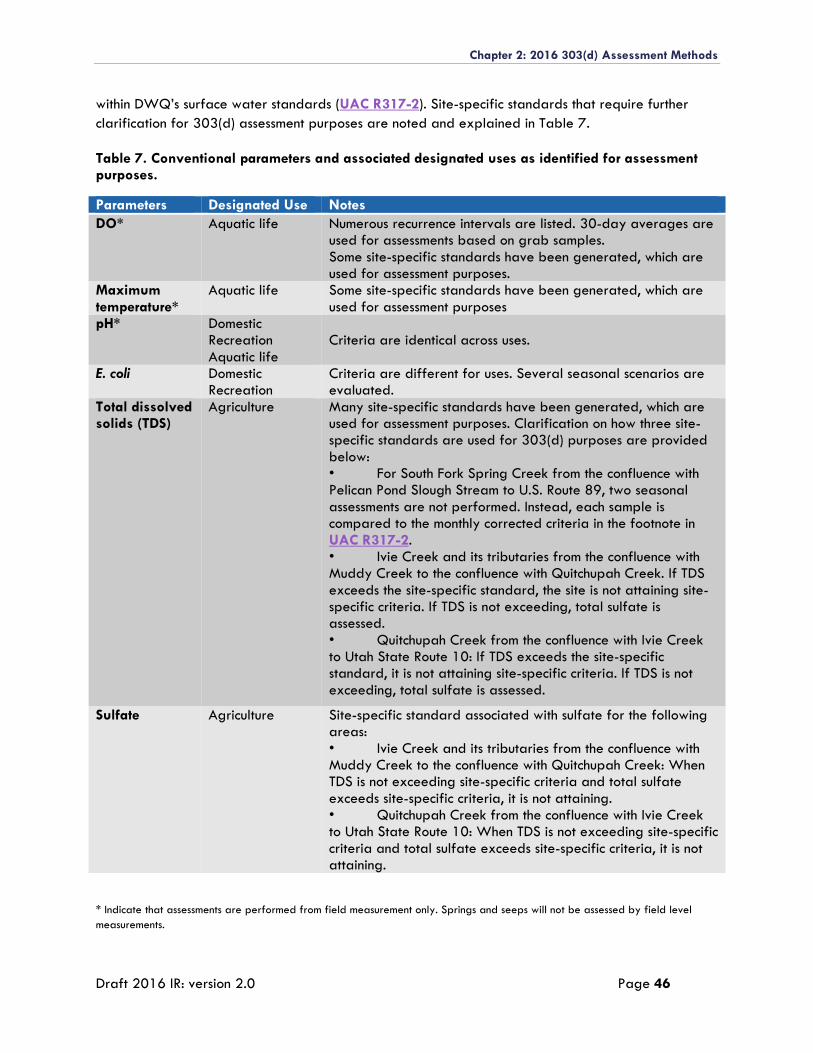
Chapter 2: 2016 303(d) Assessment Methods
Draft 2016 IR: version 2.0 Page 46
within DWQ’s surface water standards (UAC R317-2). Site-specific standards that require further
clarification for 303(d) assessment purposes are noted and explained in Table 7.
Table 7. Conventional parameters and associated designated uses as identified for assessment purposes.
Parameters Designated Use Notes
DO* Aquatic life Numerous recurrence intervals are listed. 30-day averages are used for assessments based on grab samples. Some site-specific standards have been generated, which are used for assessment purposes.
Maximum temperature*
Aquatic life Some site-specific standards have been generated, which are used for assessment purposes
pH* Domestic Recreation Aquatic life
Criteria are identical across uses.
E. coli Domestic Recreation
Criteria are different for uses. Several seasonal scenarios are evaluated.
Total dissolved solids (TDS)
Agriculture Many site-specific standards have been generated, which are used for assessment purposes. Clarification on how three site-specific standards are used for 303(d) purposes are provided below: • For South Fork Spring Creek from the confluence with Pelican Pond Slough Stream to U.S. Route 89, two seasonal assessments are not performed. Instead, each sample is compared to the monthly corrected criteria in the footnote in UAC R317-2. • Ivie Creek and its tributaries from the confluence with Muddy Creek to the confluence with Quitchupah Creek. If TDS exceeds the site-specific standard, the site is not attaining site-specific criteria. If TDS is not exceeding, total sulfate is assessed. • Quitchupah Creek from the confluence with Ivie Creek to Utah State Route 10: If TDS exceeds the site-specific standard, it is not attaining site-specific criteria. If TDS is not exceeding, total sulfate is assessed.
Sulfate Agriculture Site-specific standard associated with sulfate for the following areas: • Ivie Creek and its tributaries from the confluence with Muddy Creek to the confluence with Quitchupah Creek: When TDS is not exceeding site-specific criteria and total sulfate exceeds site-specific criteria, it is not attaining. • Quitchupah Creek from the confluence with Ivie Creek to Utah State Route 10: When TDS is not exceeding site-specific criteria and total sulfate exceeds site-specific criteria, it is not attaining.
* Indicate that assessments are performed from field measurement only. Springs and seeps will not be assessed by field level
measurements.
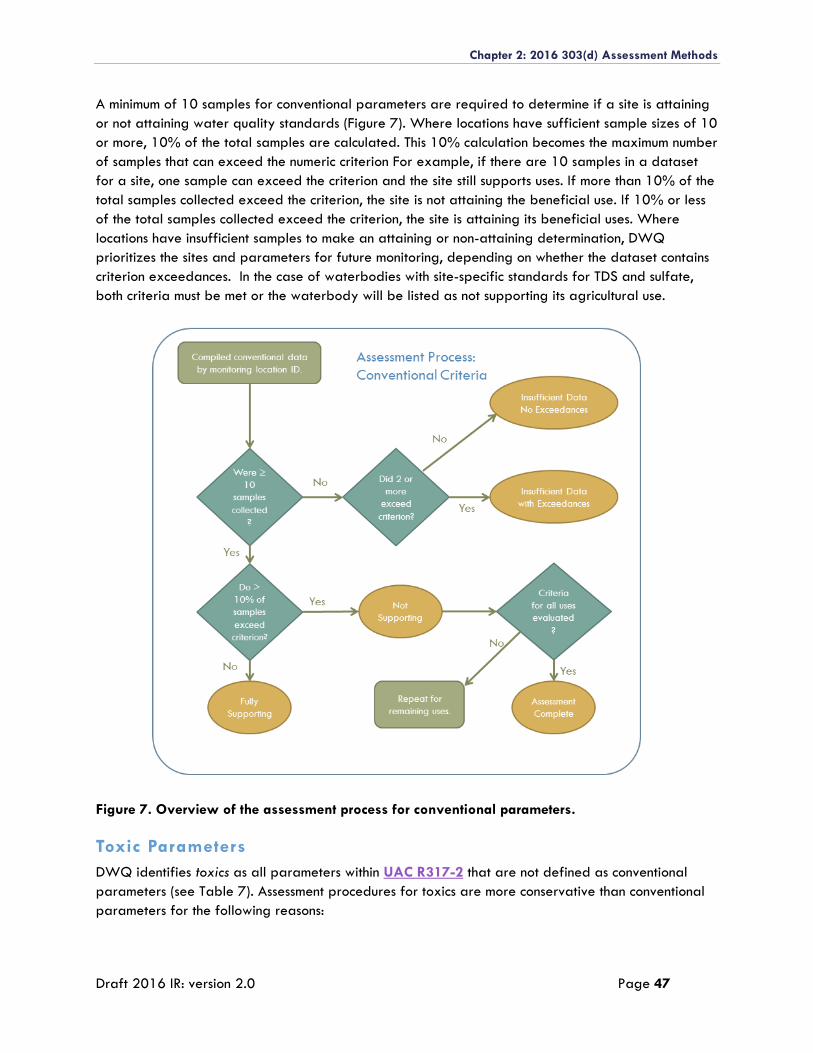
Chapter 2: 2016 303(d) Assessment Methods
Draft 2016 IR: version 2.0 Page 47
A minimum of 10 samples for conventional parameters are required to determine if a site is attaining
or not attaining water quality standards (Figure 7). Where locations have sufficient sample sizes of 10
or more, 10% of the total samples are calculated. This 10% calculation becomes the maximum number
of samples that can exceed the numeric criterion For example, if there are 10 samples in a dataset
for a site, one sample can exceed the criterion and the site still supports uses. If more than 10% of the
total samples collected exceed the criterion, the site is not attaining the beneficial use. If 10% or less
of the total samples collected exceed the criterion, the site is attaining its beneficial uses. Where
locations have insufficient samples to make an attaining or non-attaining determination, DWQ
prioritizes the sites and parameters for future monitoring, depending on whether the dataset contains
criterion exceedances. In the case of waterbodies with site-specific standards for TDS and sulfate,
both criteria must be met or the waterbody will be listed as not supporting its agricultural use.
Figure 7. Overview of the assessment process for conventional parameters.
Toxic Parameters
DWQ identifies toxics as all parameters within UAC R317-2 that are not defined as conventional
parameters (see Table 7). Assessment procedures for toxics are more conservative than conventional
parameters for the following reasons:
Chapter 2: 2016 303(d) Assessment Methods
Draft 2016 IR: version 2.0 Page 48
Many toxic substances accumulate in the tissue of aquatic organisms and become
increasingly toxic with prolonged exposure to high pollutant concentrations.
Toxic substances can biomagnify, or increase, in tissue concentration from lower to higher
trophic levels.
High concentrations of many of these substances can lead to the direct mortality of many
species at various life stages.
To ensure protection of designated uses, data are compared against one or more toxic criteria,
sample size requirements are smaller, and sites are considered degraded with two or more violations
of a criterion.
Multiple toxic parameters can also have multiple criteria for a single beneficial use, depending on the
averaging period: a lower, chronic criterion and a higher, acute criterion (UAC R317-2). For 303(d)
assessment purposes, one daily measurement at each monitoring location is compared to the chronic
and/or acute criteria. Currently, the acute and chronic averaging periods defined in UAC R317-2are
not applied for 303(d) assessment analysis because monitoring and sampling frequencies are
different and more widely spaced than the acute and chronic periods typically defined in UAC R317-
2.
Equation-Based Toxic Parameters
A number of toxic criteria are specified as equations rather than specific values (see footnotes in UAC
R317-2). The equations include variables of other chemical constituents or water properties that either
reduce or magnify the extent to which a toxic is harmful to aquatic life. To properly apply the
correction factor equations, it is necessary to use measured data for the variables in the equation to
calculate the appropriate numeric criteria for the sample. To calculate the correct criterion for a
pollutant-result value, the monitoring location site and date of sample must match between the
pollutant of concern and the additional parameter(s) needed for the equation. In the case where there
are missing supplemental data values to apply the equation, the following rules will be applied:
Only hardness-dependent toxics:
For hardness-dependent criteria where a calcium (Ca) or magnesium (Mg) value is missing and
the hardness cannot be calculated, a hardness value reported from the laboratory will be
used. If a hardness value cannot be calculated from a measured Ca and Mg value and the
laboratory did not provide a hardness value, a default hardness of 100 milligrams per liter
(mg/l) is used to evaluate the toxic results. Results were reviewed to ensure that a Category 5
(not supporting) decision was not reached using surrogate hardness values.
Aluminum, chronic only:
If either a field pH or calculated or laboratory hardness is missing, the aluminum acute default
value of 750 microgram per liter (μg/l) provided in Table 2.14.2 of UAC R317-2 will be
applied. Otherwise, the following pH and hardness combination and numeric criteria are
applied:
o pH ≥ 7.0 and (calculated or laboratory reported) hardness ≥ 50 parts per million
(ppm): 750 μg/l.
o pH < 7.0 and (calculated or laboratory reported) hardness ≥ 50 ppm: 87 μg/l.
Chapter 2: 2016 303(d) Assessment Methods
Draft 2016 IR: version 2.0 Page 49
o pH ≥ 7.0 and (calculated or laboratory reported) hardness < 50 ppm: 87 μg/l.
o pH < 7.0 and (calculated or laboratory reported) hardness < 50 ppm: 87 μg/l.
Ammonia, chronic:
DWQ assumes fish early life stages are present at all monitoring locations and the following
equation is used:
((0.0577/(1+107.688-pH)) + (2.487/(1+ 10pH-7.688))) * MIN (2.85, 1.45*100.028*(25-T))
Where (1.45*100.028*(25-T)) is ≤ 2.85, (1.45*100.028*(25-T)) is applied and if (1.45*100.028*(25-T)) is >
2.85, 2.85 is applied. However, if a field pH or temperature reading is unavailable, a
correction factor cannot be made and the result value for ammonia will be removed from the
assessment.
Ammonia, acute:
If a field pH is missing, a correction factor cannot be made, and the result value for ammonia
will be removed from assessment.
Fluoride:
UAC R317-2 currently provides a range of criteria for fluoride depending on air
temperature. This sliding criterion was determined to be inappropriately applied. Fluoride
data were not assessed in 2016.
Hydrogen sulfide:
DWQ has discovered that the formula in UAC R317-2 used to convert dissolved sulfide to un-
disassociated hydrogen sulfide is not correct. This formula will be updated in the future by
DWQ’s Standards Program. Until the equation and/or criteria are reviewed and corrected by
DWQ’s Standards Program and Triennial Review work group and DWQ’s board, all
hydrogen sulfide data will not be assessed.
Additional Standards Interpretations
Boron:
UAC R317-2 does not specify sample fraction (total or dissolved) for the boron criterion. All
data for boron, both total and dissolved, were included in the assessment. The intent of the
boron standard was for dissolved fraction. The criterion will be updated in future triennial
reviews by the Standards Program. Until it is adopted in rule, results will be reviewed to
ensure that no waterbody is listed based on total boron results.
Assessment Process
Once chronic and acute criteria are calculated, where applicable, toxicant sampling results are
compared to the criteria to determine if the monitoring location is supporting designated uses or is
impaired due to exceedances of the standard. Sites with sufficient data (4 or more samples) with two
or more exceedances of the acute and/or chronic criteria will result in nonattainment of the beneficial
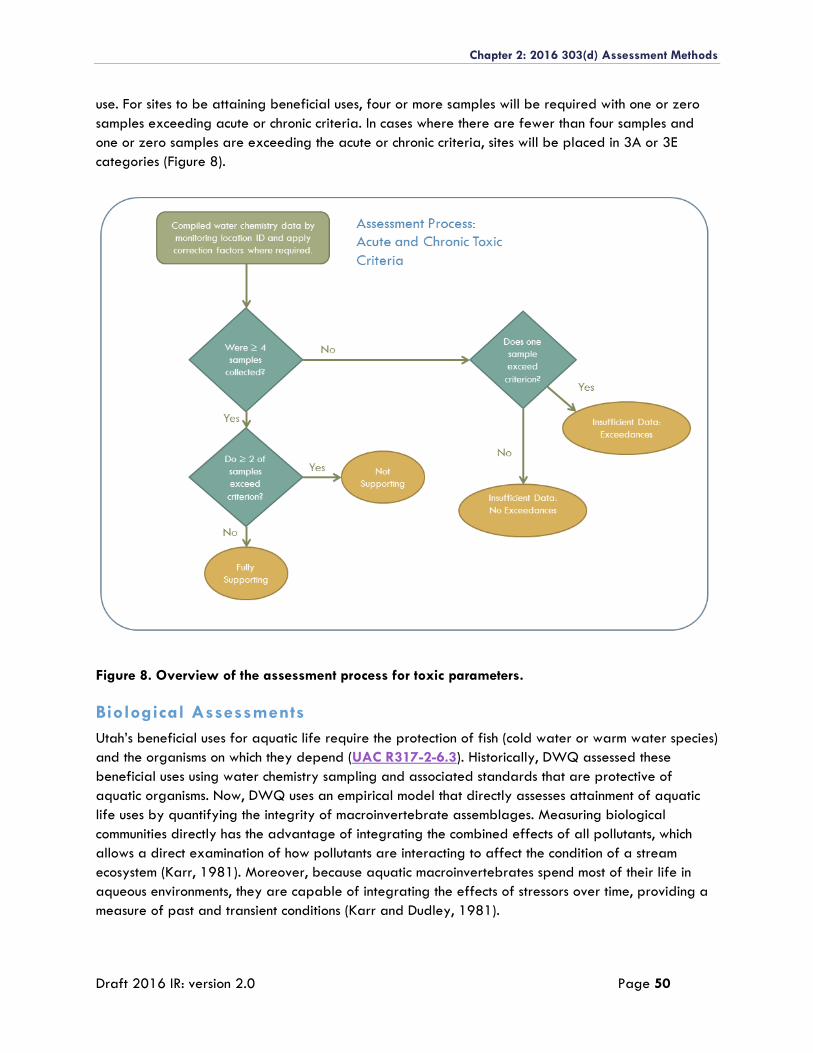
Chapter 2: 2016 303(d) Assessment Methods
Draft 2016 IR: version 2.0 Page 50
use. For sites to be attaining beneficial uses, four or more samples will be required with one or zero
samples exceeding acute or chronic criteria. In cases where there are fewer than four samples and
one or zero samples are exceeding the acute or chronic criteria, sites will be placed in 3A or 3E
categories (Figure 8).
Figure 8. Overview of the assessment process for toxic parameters.
Biological Assessments
Utah’s beneficial uses for aquatic life require the protection of fish (cold water or warm water species)
and the organisms on which they depend (UAC R317-2-6.3). Historically, DWQ assessed these
beneficial uses using water chemistry sampling and associated standards that are protective of
aquatic organisms. Now, DWQ uses an empirical model that directly assesses attainment of aquatic
life uses by quantifying the integrity of macroinvertebrate assemblages. Measuring biological
communities directly has the advantage of integrating the combined effects of all pollutants, which
allows a direct examination of how pollutants are interacting to affect the condition of a stream
ecosystem (Karr, 1981). Moreover, because aquatic macroinvertebrates spend most of their life in
aqueous environments, they are capable of integrating the effects of stressors over time, providing a
measure of past and transient conditions (Karr and Dudley, 1981).
Chapter 2: 2016 303(d) Assessment Methods
Draft 2016 IR: version 2.0 Page 51
Biological assessments are often conducted by comparing the biological assemblage observed at a
site with the expected biological assemblage in the absence of human-caused disturbance. Ideally,
these comparisons are made using historical data to measure changes to the current biological
community. However, in most cases, historical data are not available. As a result, biological conditions
representing an absence of human-caused stress are typically set using reference sites as controls, or
benchmarks, to establish the biological condition expected in the absence of human-caused
disturbance. The biological integrity of sites can be evaluated by comparing the biological
composition observed at a site against a subset of ecologically similar reference sites. Collectively,
such comparisons are referred to as biological assessments.
In aquatic biological assessments, reference sites are selected to represent the best available
condition for waterbodies with similar ecological, physical, and geographical characteristics (Hughes
et al., 1986; Suplee et al., 2005; Western Center for Monitoring and Assessment of Freshwater
Ecosystems website). When reference sites are selected for water quality programs, conditions vary
regionally depending on adjacent historical land use. For example, reference sites in Utah mountains
are generally more pristine than in valleys. As a result, there are more biological benchmarks in areas
of the state that receive less human-made disturbance than those with more disturbances.
A numeric index is a useful tool that quantifies the biological integrity, or biological beneficial use, of
stream and river segments. Data obtained from biological collections are complex, with hundreds of
species found throughout Utah that vary both spatially and temporally. Similarly, the physical
template on which biota depend also varies considerably across streams. A robust index of biological
integrity should simultaneously account for naturally occurring physical and biological variability and
summarize these conditions through a single, easily interpretable number (Hawkins, 2006; Hawkins et
al., 2010).
River Invertebrate Prediction and Classification System Models
DWQ uses the River Invertebrate Prediction and Classification System (RIVPACS) model approach to
quantify biological integrity (Wright, 1995). RIVPACS is a classification of freshwater sites based on
macroinvertebrate fauna. It was first derived in 1977 and has subsequently been used in numerous
biological assessment programs worldwide. In the early 1970s, scientists and water managers
recognized a need to understand the links between the ecology of running waters and
macroinvertebrate communities. This began some of the very early biological assessment work in
Europe. A 4-year project was initiated to create a biological classification of unpolluted running
waters in Great Britain based on the macroinvertebrate fauna (Clarke et al., 1996; Furse et al.,
1984; Moss et al., 1999; Wright, 1995).
Over the past 30 years, equivalent RIVPACS models have been developed for aquatic ecosystems
throughout the world, including Australia (Davies et al., 2000; Marchant and Hehir, 2002; Metzeling
et al., 2002) and Indonesia (Sudaryanti et al., 2001). In the United States, scientists have developed
RIVPACS models to assess the biological integrity of the country’s aquatic habitats (Hawkins et al.,
2000; Hawkins and Carlisle, 2001). Recently, many western states have adopted the RIVPACS model
to determine beneficial uses of aquatic life in the rivers of state’s such as Colorado (Paul et al., 2005),
Montana (Feldman, 2006; Jessup et al., 2006), and Wyoming (Hargett et al., 2005).
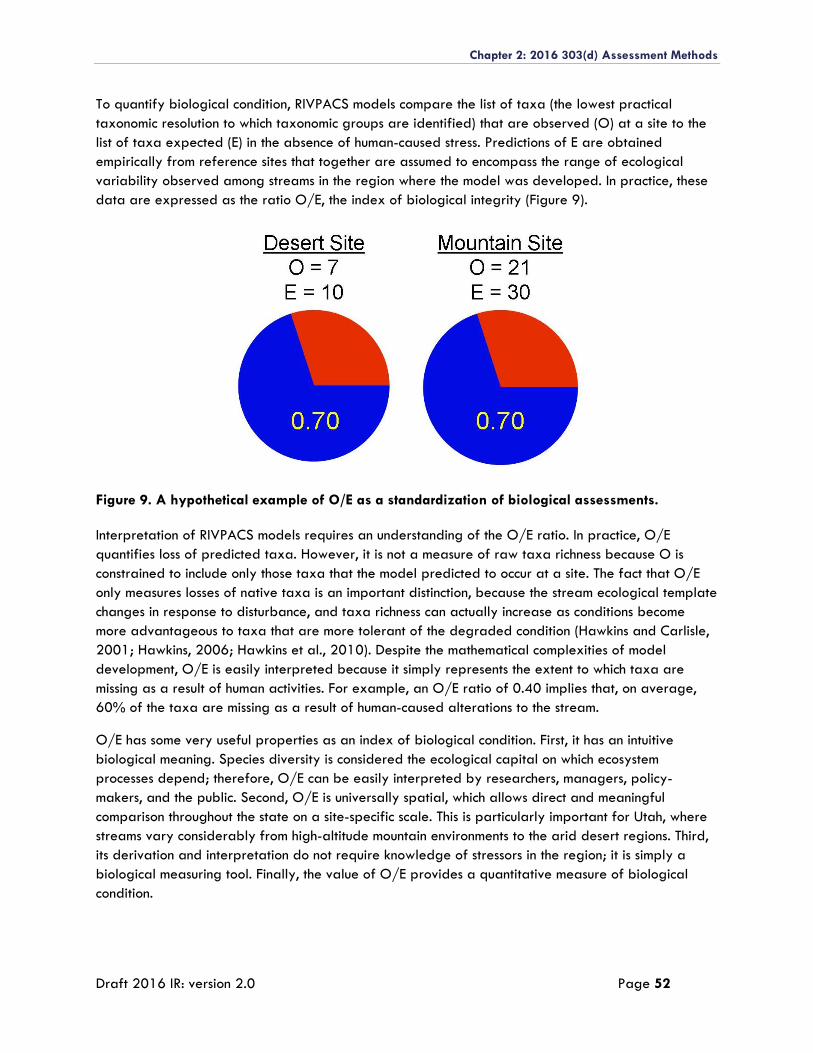
Chapter 2: 2016 303(d) Assessment Methods
Draft 2016 IR: version 2.0 Page 52
To quantify biological condition, RIVPACS models compare the list of taxa (the lowest practical
taxonomic resolution to which taxonomic groups are identified) that are observed (O) at a site to the
list of taxa expected (E) in the absence of human-caused stress. Predictions of E are obtained
empirically from reference sites that together are assumed to encompass the range of ecological
variability observed among streams in the region where the model was developed. In practice, these
data are expressed as the ratio O/E, the index of biological integrity (Figure 9).
Figure 9. A hypothetical example of O/E as a standardization of biological assessments.
Interpretation of RIVPACS models requires an understanding of the O/E ratio. In practice, O/E
quantifies loss of predicted taxa. However, it is not a measure of raw taxa richness because O is
constrained to include only those taxa that the model predicted to occur at a site. The fact that O/E
only measures losses of native taxa is an important distinction, because the stream ecological template
changes in response to disturbance, and taxa richness can actually increase as conditions become
more advantageous to taxa that are more tolerant of the degraded condition (Hawkins and Carlisle,
2001; Hawkins, 2006; Hawkins et al., 2010). Despite the mathematical complexities of model
development, O/E is easily interpreted because it simply represents the extent to which taxa are
missing as a result of human activities. For example, an O/E ratio of 0.40 implies that, on average,
60% of the taxa are missing as a result of human-caused alterations to the stream.
O/E has some very useful properties as an index of biological condition. First, it has an intuitive
biological meaning. Species diversity is considered the ecological capital on which ecosystem
processes depend; therefore, O/E can be easily interpreted by researchers, managers, policy-
makers, and the public. Second, O/E is universally spatial, which allows direct and meaningful
comparison throughout the state on a site-specific scale. This is particularly important for Utah, where
streams vary considerably from high-altitude mountain environments to the arid desert regions. Third,
its derivation and interpretation do not require knowledge of stressors in the region; it is simply a
biological measuring tool. Finally, the value of O/E provides a quantitative measure of biological
condition.
Chapter 2: 2016 303(d) Assessment Methods
Draft 2016 IR: version 2.0 Page 53
Model Construction and Performance
Construction of a RIVPACS model for Utah began in 2002, which involved developing and evaluating
dozens of models. Details of model development procedures can be found elsewhere (Clarke et al.,
1996; Moss et al. 1999; Wright et al., 1993; Wright 1995). Additionally, specific detailed
instructions can be viewed on the Western Center for Monitoring and Assessment of Freshwater
Ecosystems website and the EPA website. A brief summary is provided here to help the reader
better understand Utah’s model results and subsequent assessments.
As mentioned earlier, predictions of expected “E” taxa are obtained empirically from reference site
collections made throughout Utah. Reference sites are those that represent the reference conditions in
different biogeographical settings throughout Utah. The initial list of candidate reference sites is
independently ranked by different scientists familiar with the waterbodies. Only reference sites with a
consensus representing best available conditions are used in model development. Subsequent
reference sites are added using scores from reference scoring metrics developed during site visits and
averaging with independent rankings from field scientists.
Some of the calculations involved in obtaining the list of expected taxa are complex. A heuristic
description of the steps involved in predicting “E” provides some context of the Assessment Methods.
The first step in model development is to classify reference sites into groups of sites with similar
taxonomic composition using a cluster analysis. Next, models are developed based on watershed
descriptors such as climatic setting, soil characteristics, and stream size to generate equations that
predict the probability of a new site falling within each group of reference sites. These equations
account for environmental heterogeneity and ensure that when a new site is assessed, it is compared
against ecologically similar reference sites. When a new site is assessed, predictions of group
membership are then coupled to the distributions of taxa across groups of reference sites to estimate
the probability of capturing (Pc) of each taxon from the regional pool of all taxa found across all
reference sites. E is then calculated as the sum of all taxa Pcs that had a greater than 50% chance of
occurring at a site given the site’s specific environmental characteristics. Using a Pc limit set at greater
than 50% typically results in models that are more sensitive and precise, which results in a better
ability to detect biological stress (Hawkins et al., 2000; Simpson and Norris, 2000; Ostermiller and
Hawkins, 2004; Hawkins, 2006; Van Sickle et al., 2007, Hawkins et al., 2015; Hawkins and Yuan,
2016; Mazor et al., 2016).
The accuracy and precision of RIVPACS models depend in part on the ability of the models to
discriminate among groups of biologically similar reference sites. An extensive list of 74 GIS-based
watershed descriptors is evaluated for potential predictor variables in models that predict the
probability of membership within biological groups for sites not used in model construction. Site-
specific, GIS-based predictor variables, such as soils, meteorology, and geography, instead of field-
derived descriptors, are evaluated for a couple of reasons. First, GIS-based descriptors are unlikely
to be influenced by human disturbance and are therefore unlikely to bias estimates of expected
conditions (Hawkins, 2004). Second, these predictors are easily obtained for any location, on a site-
specific basis, that allows inclusion of additional macroinvertebrate samples collected by others.
Various subsets of potential predictors are evaluated in an iterative, analytical process that explores
different combinations of predictors able to explain the biological variability among reference sites.
The current RIVPACS model used by DWQ includes 15 variables that resulted in the most precisely
predictive model (Table 8).
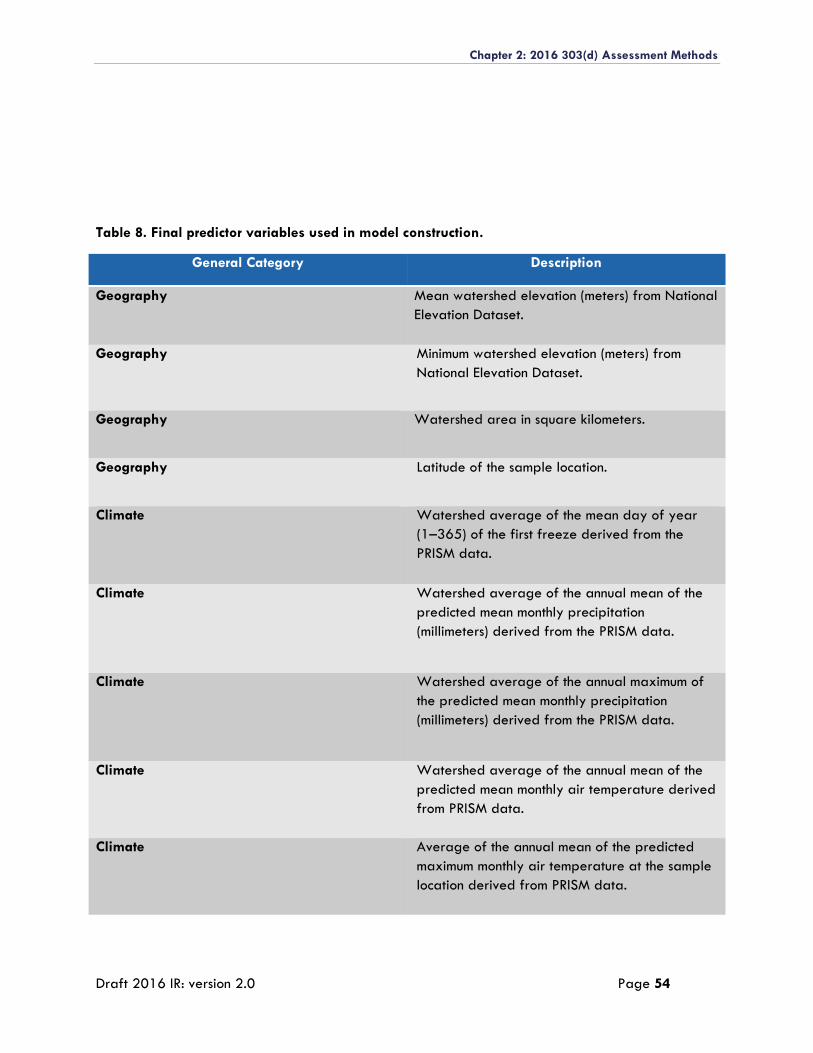
Chapter 2: 2016 303(d) Assessment Methods
Draft 2016 IR: version 2.0 Page 54
Table 8. Final predictor variables used in model construction.
General Category Description
Geography Mean watershed elevation (meters) from National
Elevation Dataset.
Geography Minimum watershed elevation (meters) from
National Elevation Dataset.
Geography Watershed area in square kilometers.
Geography Latitude of the sample location.
Climate Watershed average of the mean day of year
(1–365) of the first freeze derived from the
PRISM data.
Climate Watershed average of the annual mean of the
predicted mean monthly precipitation
(millimeters) derived from the PRISM data.
Climate Watershed average of the annual maximum of
the predicted mean monthly precipitation
(millimeters) derived from the PRISM data.
Climate Watershed average of the annual mean of the
predicted mean monthly air temperature derived
from PRISM data.
Climate Average of the annual mean of the predicted
maximum monthly air temperature at the sample
location derived from PRISM data.
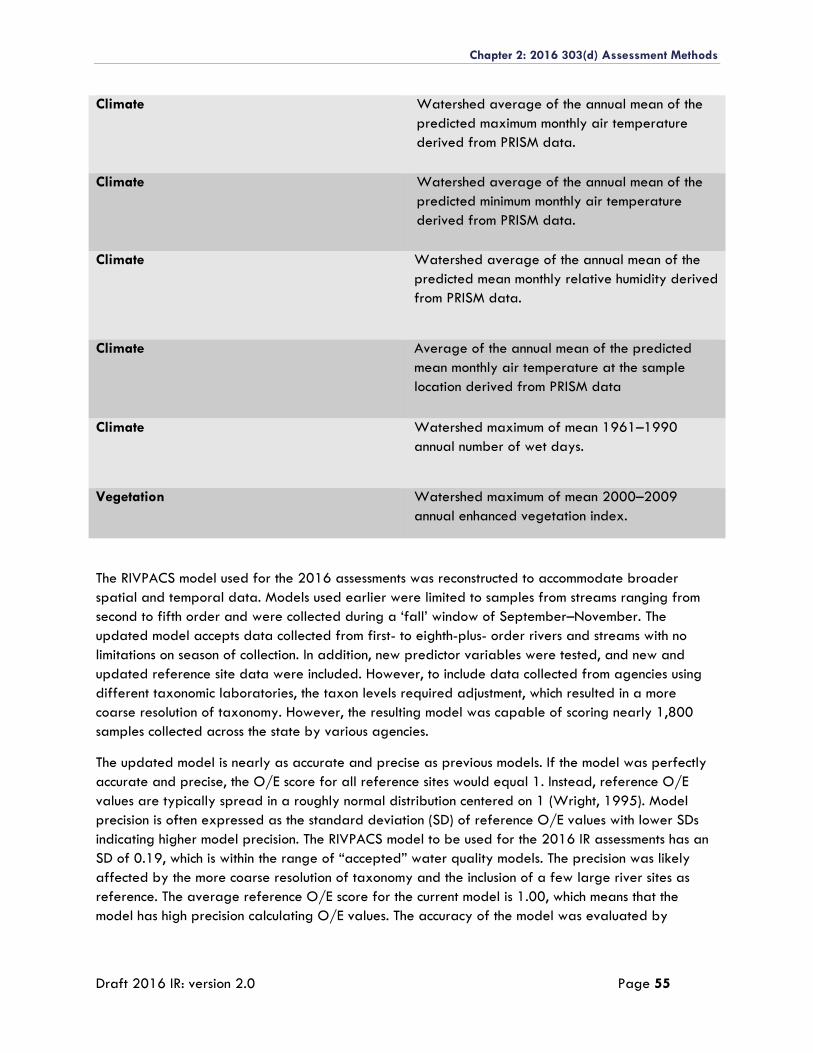
Chapter 2: 2016 303(d) Assessment Methods
Draft 2016 IR: version 2.0 Page 55
Climate Watershed average of the annual mean of the
predicted maximum monthly air temperature
derived from PRISM data.
Climate Watershed average of the annual mean of the
predicted minimum monthly air temperature
derived from PRISM data.
Climate Watershed average of the annual mean of the
predicted mean monthly relative humidity derived
from PRISM data.
Climate Average of the annual mean of the predicted
mean monthly air temperature at the sample
location derived from PRISM data
Climate Watershed maximum of mean 1961–1990
annual number of wet days.
Vegetation Watershed maximum of mean 2000–2009
annual enhanced vegetation index.
The RIVPACS model used for the 2016 assessments was reconstructed to accommodate broader
spatial and temporal data. Models used earlier were limited to samples from streams ranging from
second to fifth order and were collected during a ‘fall’ window of September–November. The
updated model accepts data collected from first- to eighth-plus- order rivers and streams with no
limitations on season of collection. In addition, new predictor variables were tested, and new and
updated reference site data were included. However, to include data collected from agencies using
different taxonomic laboratories, the taxon levels required adjustment, which resulted in a more
coarse resolution of taxonomy. However, the resulting model was capable of scoring nearly 1,800
samples collected across the state by various agencies.
The updated model is nearly as accurate and precise as previous models. If the model was perfectly
accurate and precise, the O/E score for all reference sites would equal 1. Instead, reference O/E
values are typically spread in a roughly normal distribution centered on 1 (Wright, 1995). Model
precision is often expressed as the standard deviation (SD) of reference O/E values with lower SDs
indicating higher model precision. The RIVPACS model to be used for the 2016 IR assessments has an
SD of 0.19, which is within the range of “accepted” water quality models. The precision was likely
affected by the more coarse resolution of taxonomy and the inclusion of a few large river sites as
reference. The average reference O/E score for the current model is 1.00, which means that the
model has high precision calculating O/E values. The accuracy of the model was evaluated by
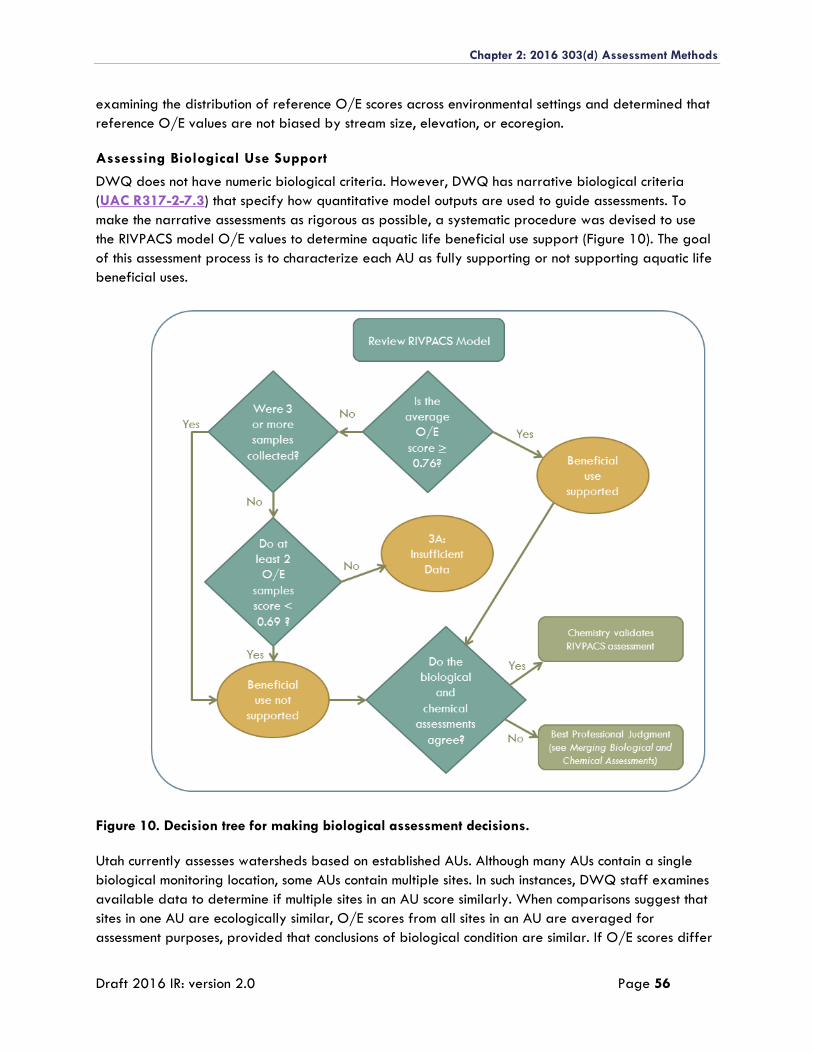
Chapter 2: 2016 303(d) Assessment Methods
Draft 2016 IR: version 2.0 Page 56
examining the distribution of reference O/E scores across environmental settings and determined that
reference O/E values are not biased by stream size, elevation, or ecoregion.
Assessing Biological Use Support
DWQ does not have numeric biological criteria. However, DWQ has narrative biological criteria
(UAC R317-2-7.3) that specify how quantitative model outputs are used to guide assessments. To
make the narrative assessments as rigorous as possible, a systematic procedure was devised to use
the RIVPACS model O/E values to determine aquatic life beneficial use support (Figure 10). The goal
of this assessment process is to characterize each AU as fully supporting or not supporting aquatic life
beneficial uses.
Figure 10. Decision tree for making biological assessment decisions.
Utah currently assesses watersheds based on established AUs. Although many AUs contain a single
biological monitoring location, some AUs contain multiple sites. In such instances, DWQ staff examines
available data to determine if multiple sites in an AU score similarly. When comparisons suggest that
sites in one AU are ecologically similar, O/E scores from all sites in an AU are averaged for
assessment purposes, provided that conclusions of biological condition are similar. If O/E scores differ
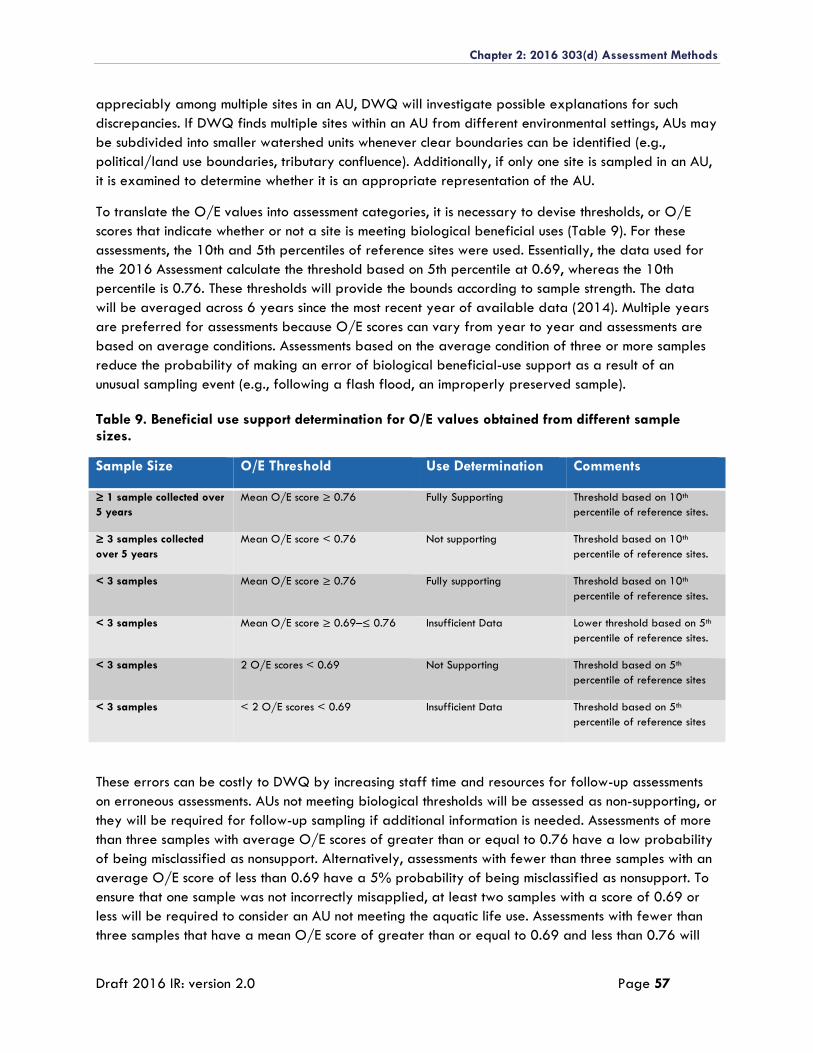
Chapter 2: 2016 303(d) Assessment Methods
Draft 2016 IR: version 2.0 Page 57
appreciably among multiple sites in an AU, DWQ will investigate possible explanations for such
discrepancies. If DWQ finds multiple sites within an AU from different environmental settings, AUs may
be subdivided into smaller watershed units whenever clear boundaries can be identified (e.g.,
political/land use boundaries, tributary confluence). Additionally, if only one site is sampled in an AU,
it is examined to determine whether it is an appropriate representation of the AU.
To translate the O/E values into assessment categories, it is necessary to devise thresholds, or O/E
scores that indicate whether or not a site is meeting biological beneficial uses (Table 9). For these
assessments, the 10th and 5th percentiles of reference sites were used. Essentially, the data used for
the 2016 Assessment calculate the threshold based on 5th percentile at 0.69, whereas the 10th
percentile is 0.76. These thresholds will provide the bounds according to sample strength. The data
will be averaged across 6 years since the most recent year of available data (2014). Multiple years
are preferred for assessments because O/E scores can vary from year to year and assessments are
based on average conditions. Assessments based on the average condition of three or more samples
reduce the probability of making an error of biological beneficial-use support as a result of an
unusual sampling event (e.g., following a flash flood, an improperly preserved sample).
Table 9. Beneficial use support determination for O/E values obtained from different sample sizes.
Sample Size O/E Threshold Use Determination Comments
≥ 1 sample collected over
5 years Mean O/E score ≥ 0.76 Fully Supporting Threshold based on 10th
percentile of reference sites.
≥ 3 samples collected
over 5 years Mean O/E score < 0.76 Not supporting Threshold based on 10th
percentile of reference sites.
< 3 samples Mean O/E score ≥ 0.76 Fully supporting Threshold based on 10th
percentile of reference sites.
< 3 samples Mean O/E score ≥ 0.69–≤ 0.76 Insufficient Data Lower threshold based on 5th
percentile of reference sites.
< 3 samples 2 O/E scores < 0.69 Not Supporting Threshold based on 5th
percentile of reference sites
< 3 samples < 2 O/E scores < 0.69 Insufficient Data Threshold based on 5th
percentile of reference sites
These errors can be costly to DWQ by increasing staff time and resources for follow-up assessments
on erroneous assessments. AUs not meeting biological thresholds will be assessed as non-supporting, or
they will be required for follow-up sampling if additional information is needed. Assessments of more
than three samples with average O/E scores of greater than or equal to 0.76 have a low probability
of being misclassified as nonsupport. Alternatively, assessments with fewer than three samples with an
average O/E score of less than 0.69 have a 5% probability of being misclassified as nonsupport. To
ensure that one sample was not incorrectly misapplied, at least two samples with a score of 0.69 or
less will be required to consider an AU not meeting the aquatic life use. Assessments with fewer than
three samples that have a mean O/E score of greater than or equal to 0.69 and less than 0.76 will

Chapter 2: 2016 303(d) Assessment Methods
Draft 2016 IR: version 2.0 Page 58
be placed in Category 3A, which indicates that there are insufficient data to make an assessment. All
sites listed as 3A will be given a high priority for future biological monitoring.
Chapter 2: 2016 303(d) Assessment Methods
Draft 2016 IR: version 2.0 Page 59
ASSESSMENT OF LAKES AND RESERVOIRS
Lakes and reservoirs are defined in UAC R317-2-13.12 by county along with the designated
beneficial uses for which they are protected. Waterbodies not specifically listed are assigned
beneficial uses by default to the classification(s) of the tributary stream(s). Other than GSL, each
waterbody has been assigned an AU for purposes of assessment. In UAC R317-2-14, numeric water
quality criteria for both toxic and conventional parameters are assigned for each designated use.
Deeper lakes naturally stratify thermally, which will affect how conventional water quality parameters
are assessed (UAC R317-2-14). Therefore, each waterbody will be evaluated for thermal
stratification and assessed appropriately.
Monitoring Overview
DWQ has identified 137 lakes based on size and public interest to receive consistent, programmatic
monitoring. These waterbodies account for 93% of the water surface acres in Utah. Additional lakes
are targeted for monitoring to ensure public health due to potential harmful algal blooms. Waters
that are classified as having a high recreational use or are protected for drinking water are
prioritized. DWQ transitioned to a rotating basin (n = 6) approach where monitoring is focused in a
basin through sampling. Lakes within the focused basin are sampled once during the year, typically
May–September. Waterbodies deemed high priority (Category 3A and 5) will be sampled more
frequently per year regardless of their location. For most lakes, the change to a basin-intensive
approach results in collecting a single sample every 6 years, which necessitated changes to the
Assessment Methods. The 2016 assessments are based on the last 6 years of data (for instance, the
2016 data used data from 2009 to 2014). If data for this time period were unavailable, data from
the previous 4 years (total of 12 years) were assessed. DWQ also participates in the National Lake
Assessment (NLA) component of the National Aquatic Surveys conducted every 5 years by EPA. For
these surveys, Utah adopts a state-intensification approach where 50 probability-based sites are
selected within the state using the NLA design. Data that are compatible with DWQ’s lake assessment
methods are also used for determining beneficial use support.
Field Method Overview
For most waterbodies, data collection occurs in the deepest location of the lake. Although some
waterbodies have multiple locations where data are collected, data used for assessments rely on, but
are not limited to, samples collected from the location with the deepest depth. Water column profile
data are collected at the surface and at every meter of the water column depth. The collection is
completed when the probe is one meter above the bottom. Surface samples are collected from a
depth of 0.5 meter. All water chemistry samples, except dissolved metals and algae, are collected at
the surface, 1 meter above the thermocline, 1 meter below the thermocline, and near the bottom. The
dissolved metals sample is collected 1 meter above the bottom at the deepest site of the waterbody.
The algal sample, which is analyzed for taxonomic composition and primary production (chlorophyll
a), is collected as a composite sample from two times the depth of the Secchi disc reading to the
surface up to a maximum of 2 meters.
The assessment of Utah lakes and reservoirs consists of two tiers:
Chapter 2: 2016 303(d) Assessment Methods
Draft 2016 IR: version 2.0 Page 60
• Tier 1: The tier I assessment is the preliminary determination of support status for
recreational use (Class 2), aquatic life (Class 3), and agricultural (Class 4) classes based on
conventional parameters, such as DO, temperature, pH, toxicants, and E. coli. When Tier I
data are not available, DWQ may rely on Tier II data to make an initial assessment. When
considering Aquatic Life Use attainment within this tier, the waterbody will be classified as
mixed or stratified based on the depth profile information. If it is a stratified waterbody,
the evaluation of conventional parameters will follow the protocol designed to evaluate the
sufficiency of aquatic life habitat. If the waterbody is mixed, it will follow the assessment
protocol that evaluates the entire depth profile.
• Tier II: The tier II assessment looks further into the weight of evidence criteria (trophic state
index [TSI], fish kills, and algal composition) using BPJ. The Tier I preliminary support status
may be modified through an evaluation of the TSI, water quality–related fish kills, and the
composition and abundance of blue-green algae. The Tier II evaluation could adjust the
preliminary support status ranking if at least two of the three criteria indicate a different
support status.
DWQ will prioritize waterbodies that are assessed as Category 3A for subsequent monitoring so that
conclusive beneficial use assessments can be made.
Tier I Assessment
Drinking Water Use Support
Assessing for Drinking Water Use support involves evaluations of E. coli, harmful algal blooms, pH,
and metals. E. coli is collected at waterbodies designated for the Drinking Water Use. For further
information, please review the E. coli Assessment section discussed earlier in this document. The
evaluation process of pH and metals is the same as the requirements for Aquatic Life Uses (other than
criteria thresholds), which are described below.
Harmful Algal Blooms
DWQ is actively developing a monitoring and reporting program for harmful algal blooms. In the
interim, DWQ will use the recommendations by the World Health Organization to guide this
assessment. These recommendations prescribe human health risks associated with aggregated
cyanobacteria cell counts (Table 10). Excessive growth of cyanobacteria can lead to taste and odor
problems, which increase drinking water treatments costs. In some instances, sources of drinking water
may need to be temporarily excluded from the water supply until a cyanobacteria bloom subsides.
Some species of cyanobacteria, particularly Anabaena sp., Aphanizomenon sp., Microcystis sp., and
Planktothrix sp., can produce cyanotoxins that are harmful to people and other animals. Currently,
DWQ prioritizes monitoring for harmful algal blooms in waters designated for drinking water and
those waters that experience significant recreational usage, such as motor boating, water skiing, and
swimming. This monitoring will be in partnership with the Utah Division of Drinking Water and Utah
Division of State Parks, as resources allow. Data and assessments will be shared with the Utah
Department of Health and local health departments.
Beneficial Use Supported
The beneficial use is supported if cyanobacteria cell counts are < 20,000 cells/milliliter (ml).
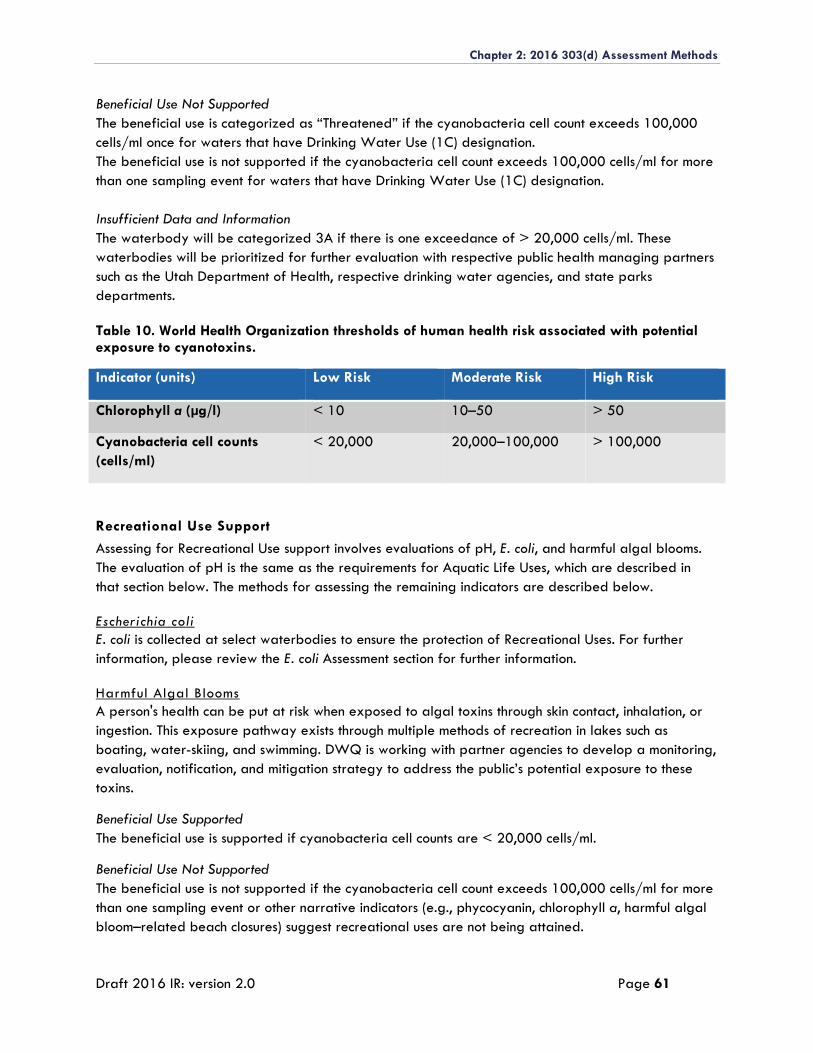
Chapter 2: 2016 303(d) Assessment Methods
Draft 2016 IR: version 2.0 Page 61
Beneficial Use Not Supported
The beneficial use is categorized as “Threatened” if the cyanobacteria cell count exceeds 100,000
cells/ml once for waters that have Drinking Water Use (1C) designation.
The beneficial use is not supported if the cyanobacteria cell count exceeds 100,000 cells/ml for more
than one sampling event for waters that have Drinking Water Use (1C) designation.
Insufficient Data and Information
The waterbody will be categorized 3A if there is one exceedance of > 20,000 cells/ml. These
waterbodies will be prioritized for further evaluation with respective public health managing partners
such as the Utah Department of Health, respective drinking water agencies, and state parks
departments.
Table 10. World Health Organization thresholds of human health risk associated with potential exposure to cyanotoxins.
Indicator (units) Low Risk Moderate Risk High Risk
Chlorophyll a (μg/l) < 10 10–50 > 50
Cyanobacteria cell counts
(cells/ml)
< 20,000 20,000–100,000 > 100,000
Recreational Use Support
Assessing for Recreational Use support involves evaluations of pH, E. coli, and harmful algal blooms.
The evaluation of pH is the same as the requirements for Aquatic Life Uses, which are described in
that section below. The methods for assessing the remaining indicators are described below.
Escherichia coli
E. coli is collected at select waterbodies to ensure the protection of Recreational Uses. For further
information, please review the E. coli Assessment section for further information.
Harmful Algal Blooms
A person's health can be put at risk when exposed to algal toxins through skin contact, inhalation, or
ingestion. This exposure pathway exists through multiple methods of recreation in lakes such as
boating, water-skiing, and swimming. DWQ is working with partner agencies to develop a monitoring,
evaluation, notification, and mitigation strategy to address the public’s potential exposure to these
toxins.
Beneficial Use Supported
The beneficial use is supported if cyanobacteria cell counts are < 20,000 cells/ml.
Beneficial Use Not Supported
The beneficial use is not supported if the cyanobacteria cell count exceeds 100,000 cells/ml for more
than one sampling event or other narrative indicators (e.g., phycocyanin, chlorophyll a, harmful algal
bloom–related beach closures) suggest recreational uses are not being attained.
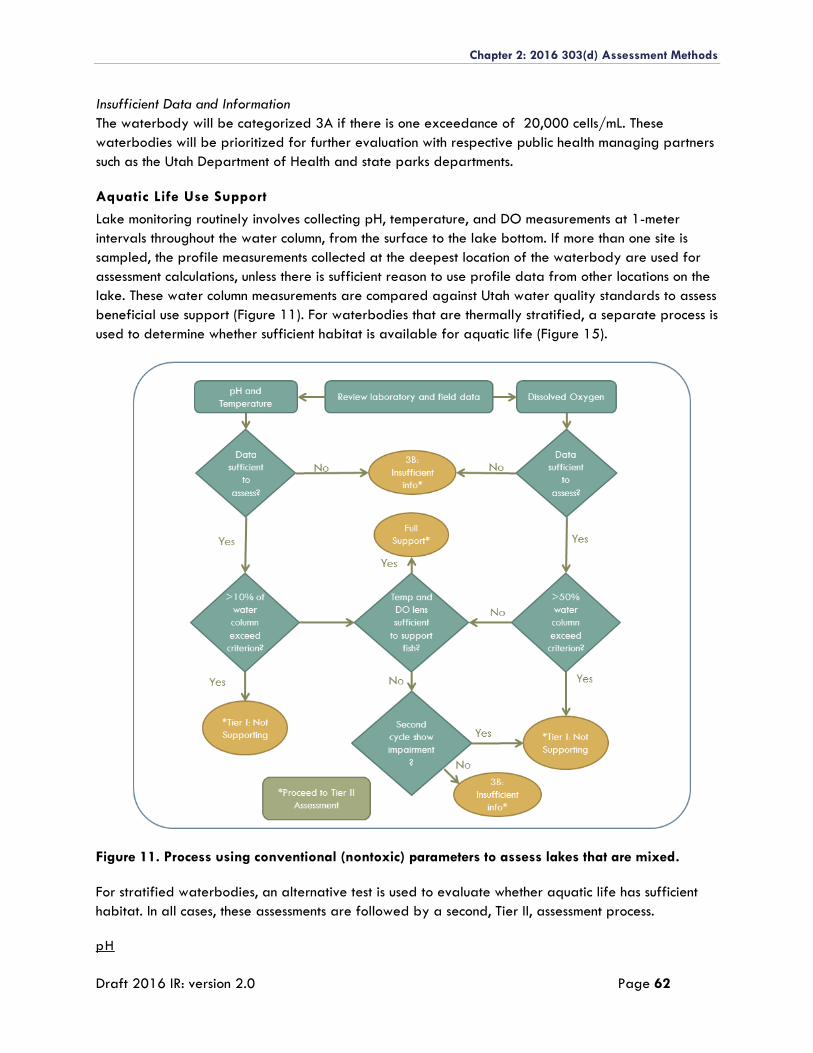
Chapter 2: 2016 303(d) Assessment Methods
Draft 2016 IR: version 2.0 Page 62
Insufficient Data and Information
The waterbody will be categorized 3A if there is one exceedance of 20,000 cells/mL. These
waterbodies will be prioritized for further evaluation with respective public health managing partners
such as the Utah Department of Health and state parks departments.
Aquatic Life Use Support
Lake monitoring routinely involves collecting pH, temperature, and DO measurements at 1-meter
intervals throughout the water column, from the surface to the lake bottom. If more than one site is
sampled, the profile measurements collected at the deepest location of the waterbody are used for
assessment calculations, unless there is sufficient reason to use profile data from other locations on the
lake. These water column measurements are compared against Utah water quality standards to assess
beneficial use support (Figure 11). For waterbodies that are thermally stratified, a separate process is
used to determine whether sufficient habitat is available for aquatic life (Figure 15).
Figure 11. Process using conventional (nontoxic) parameters to assess lakes that are mixed.
For stratified waterbodies, an alternative test is used to evaluate whether aquatic life has sufficient
habitat. In all cases, these assessments are followed by a second, Tier II, assessment process.
pH
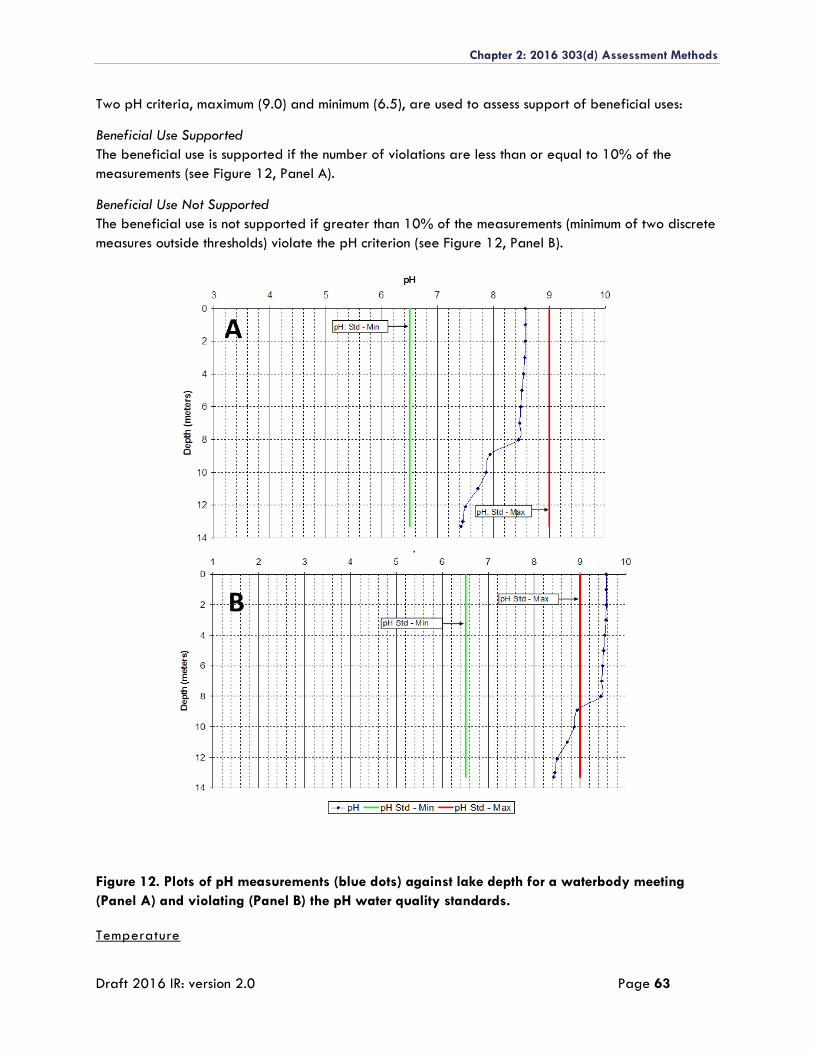
Chapter 2: 2016 303(d) Assessment Methods
Draft 2016 IR: version 2.0 Page 63
Two pH criteria, maximum (9.0) and minimum (6.5), are used to assess support of beneficial uses:
Beneficial Use Supported
The beneficial use is supported if the number of violations are less than or equal to 10% of the
measurements (see Figure 12, Panel A).
Beneficial Use Not Supported
The beneficial use is not supported if greater than 10% of the measurements (minimum of two discrete
measures outside thresholds) violate the pH criterion (see Figure 12, Panel B).
Figure 12. Plots of pH measurements (blue dots) against lake depth for a waterbody meeting
(Panel A) and violating (Panel B) the pH water quality standards.
Temperature
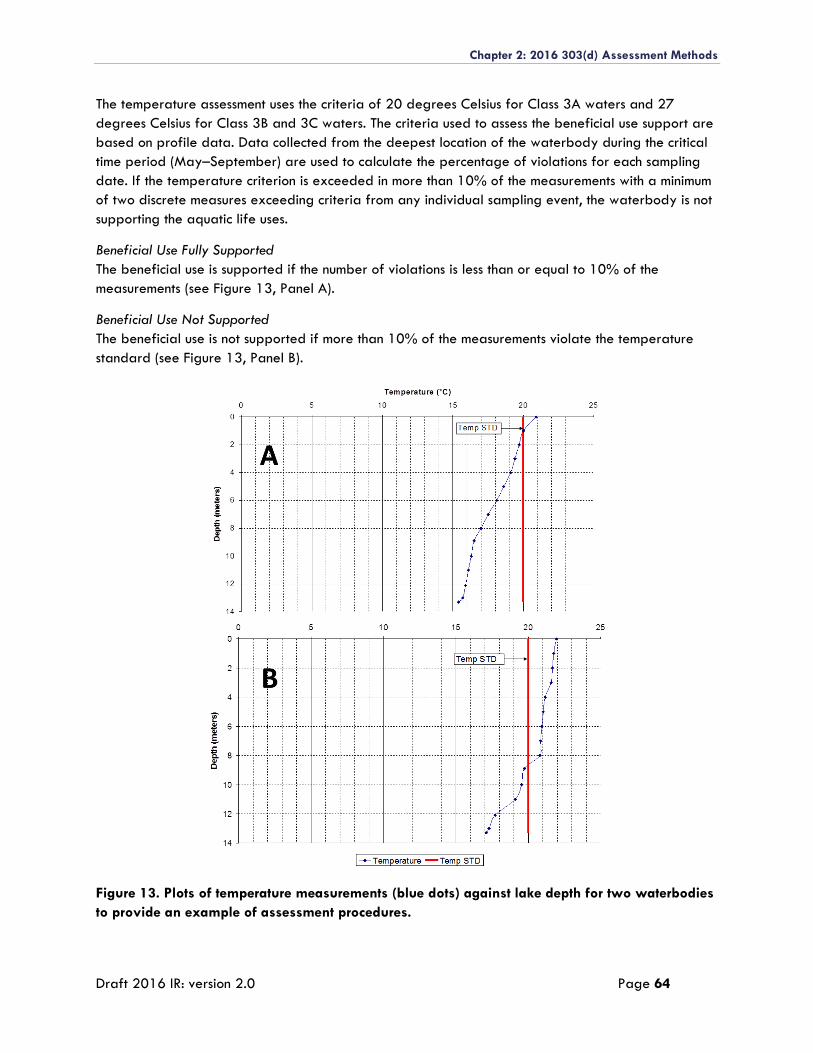
Chapter 2: 2016 303(d) Assessment Methods
Draft 2016 IR: version 2.0 Page 64
The temperature assessment uses the criteria of 20 degrees Celsius for Class 3A waters and 27
degrees Celsius for Class 3B and 3C waters. The criteria used to assess the beneficial use support are
based on profile data. Data collected from the deepest location of the waterbody during the critical
time period (May–September) are used to calculate the percentage of violations for each sampling
date. If the temperature criterion is exceeded in more than 10% of the measurements with a minimum
of two discrete measures exceeding criteria from any individual sampling event, the waterbody is not
supporting the aquatic life uses.
Beneficial Use Fully Supported
The beneficial use is supported if the number of violations is less than or equal to 10% of the
measurements (see Figure 13, Panel A).
Beneficial Use Not Supported
The beneficial use is not supported if more than 10% of the measurements violate the temperature
standard (see Figure 13, Panel B).
Figure 13. Plots of temperature measurements (blue dots) against lake depth for two waterbodies
to provide an example of assessment procedures.
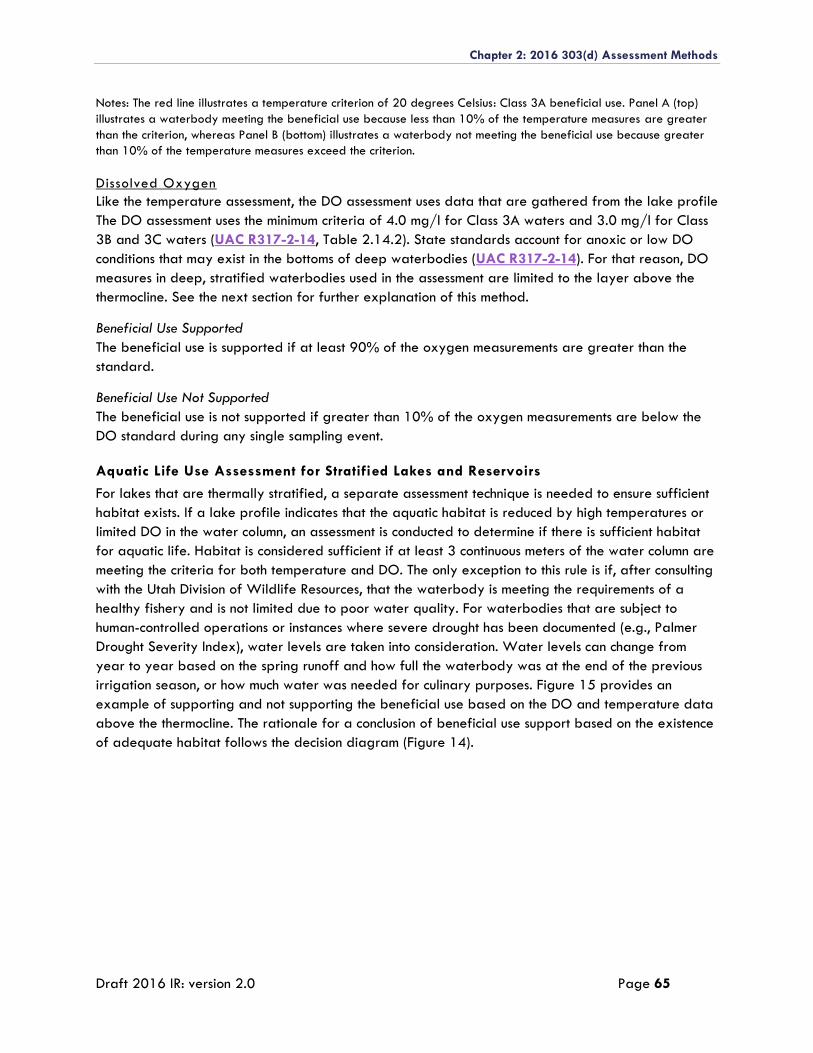
Chapter 2: 2016 303(d) Assessment Methods
Draft 2016 IR: version 2.0 Page 65
Notes: The red line illustrates a temperature criterion of 20 degrees Celsius: Class 3A beneficial use. Panel A (top)
illustrates a waterbody meeting the beneficial use because less than 10% of the temperature measures are greater
than the criterion, whereas Panel B (bottom) illustrates a waterbody not meeting the beneficial use because greater
than 10% of the temperature measures exceed the criterion.
Dissolved Oxygen
Like the temperature assessment, the DO assessment uses data that are gathered from the lake profile
The DO assessment uses the minimum criteria of 4.0 mg/l for Class 3A waters and 3.0 mg/l for Class
3B and 3C waters (UAC R317-2-14, Table 2.14.2). State standards account for anoxic or low DO
conditions that may exist in the bottoms of deep waterbodies (UAC R317-2-14). For that reason, DO
measures in deep, stratified waterbodies used in the assessment are limited to the layer above the
thermocline. See the next section for further explanation of this method.
Beneficial Use Supported
The beneficial use is supported if at least 90% of the oxygen measurements are greater than the
standard.
Beneficial Use Not Supported
The beneficial use is not supported if greater than 10% of the oxygen measurements are below the
DO standard during any single sampling event.
Aquatic Life Use Assessment for Stratified Lakes and Reservoirs
For lakes that are thermally stratified, a separate assessment technique is needed to ensure sufficient
habitat exists. If a lake profile indicates that the aquatic habitat is reduced by high temperatures or
limited DO in the water column, an assessment is conducted to determine if there is sufficient habitat
for aquatic life. Habitat is considered sufficient if at least 3 continuous meters of the water column are
meeting the criteria for both temperature and DO. The only exception to this rule is if, after consulting
with the Utah Division of Wildlife Resources, that the waterbody is meeting the requirements of a
healthy fishery and is not limited due to poor water quality. For waterbodies that are subject to
human-controlled operations or instances where severe drought has been documented (e.g., Palmer
Drought Severity Index), water levels are taken into consideration. Water levels can change from
year to year based on the spring runoff and how full the waterbody was at the end of the previous
irrigation season, or how much water was needed for culinary purposes. Figure 15 provides an
example of supporting and not supporting the beneficial use based on the DO and temperature data
above the thermocline. The rationale for a conclusion of beneficial use support based on the existence
of adequate habitat follows the decision diagram (Figure 14).
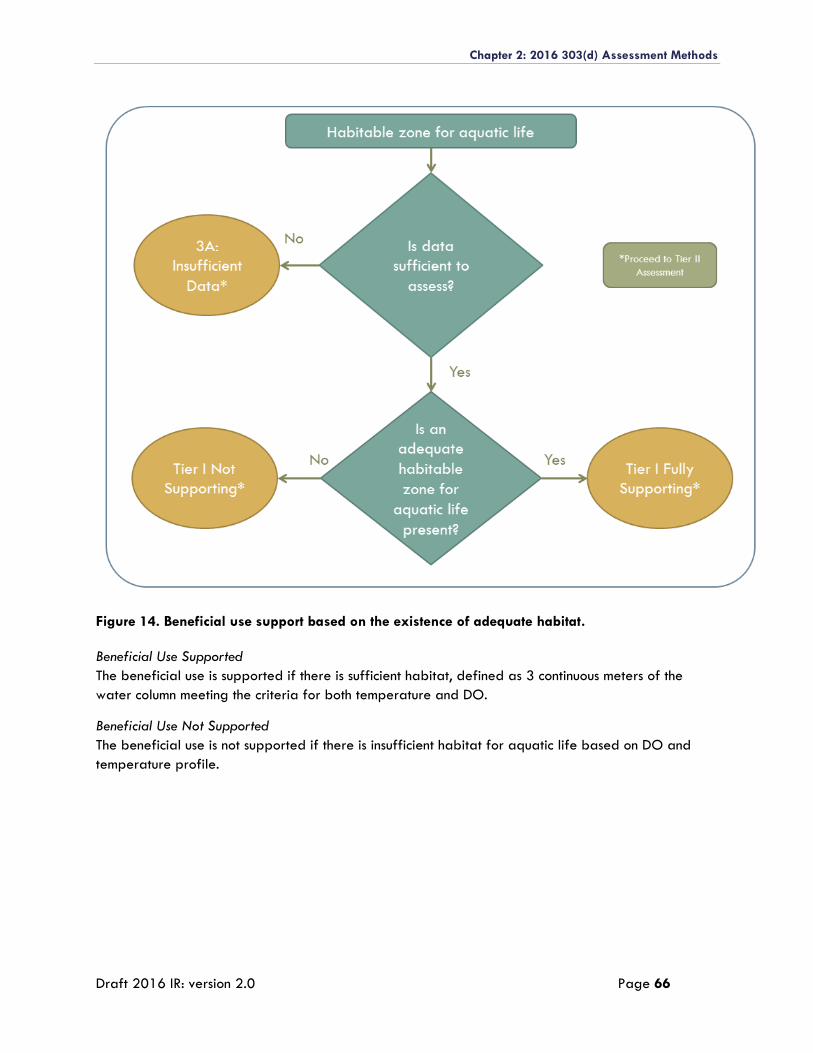
Chapter 2: 2016 303(d) Assessment Methods
Draft 2016 IR: version 2.0 Page 66
Figure 14. Beneficial use support based on the existence of adequate habitat.
Beneficial Use Supported
The beneficial use is supported if there is sufficient habitat, defined as 3 continuous meters of the
water column meeting the criteria for both temperature and DO.
Beneficial Use Not Supported
The beneficial use is not supported if there is insufficient habitat for aquatic life based on DO and
temperature profile.
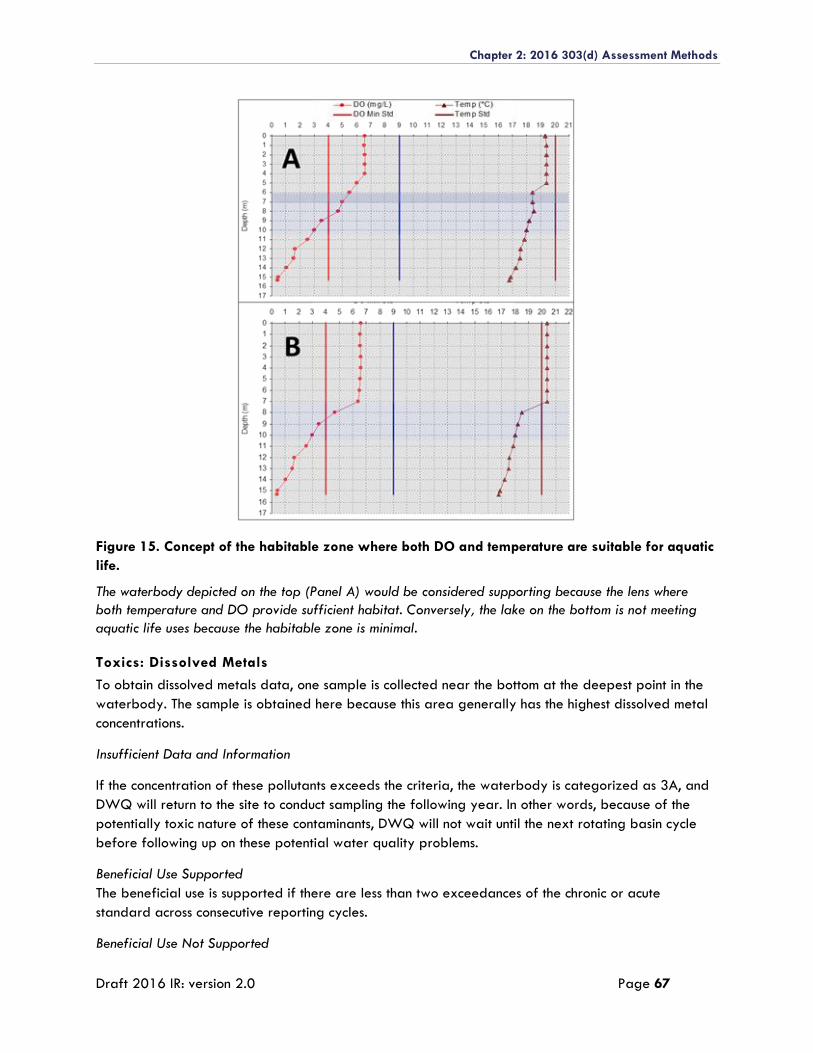
Chapter 2: 2016 303(d) Assessment Methods
Draft 2016 IR: version 2.0 Page 67
Figure 15. Concept of the habitable zone where both DO and temperature are suitable for aquatic
life.
The waterbody depicted on the top (Panel A) would be considered supporting because the lens where
both temperature and DO provide sufficient habitat. Conversely, the lake on the bottom is not meeting
aquatic life uses because the habitable zone is minimal.
Toxics: Dissolved Metals
To obtain dissolved metals data, one sample is collected near the bottom at the deepest point in the
waterbody. The sample is obtained here because this area generally has the highest dissolved metal
concentrations.
Insufficient Data and Information
If the concentration of these pollutants exceeds the criteria, the waterbody is categorized as 3A, and
DWQ will return to the site to conduct sampling the following year. In other words, because of the
potentially toxic nature of these contaminants, DWQ will not wait until the next rotating basin cycle
before following up on these potential water quality problems.
Beneficial Use Supported
The beneficial use is supported if there are less than two exceedances of the chronic or acute
standard across consecutive reporting cycles.
Beneficial Use Not Supported
Chapter 2: 2016 303(d) Assessment Methods
Draft 2016 IR: version 2.0 Page 68
The beneficial use is not supported if the concentration exceeds the chronic or acute standard two or
more times across consecutive reporting cycles.
Agricultural Use Support
Total Dissolved Solids
The TDS criterion is 1,200 mg/l unless a site-specific standard for the waterbody has been
established. If TDS data are unavailable but conductivity data are available, the conductivity data
are used to estimate TDS (USGS, 2006). An exceedance using conductivity as a surrogate will result in
a Category 3A listing, and the waterbody will be targeted for TDS sampling.
The following rules are used to determine whether a lake is supporting its agricultural beneficial use
(Figure 16):
Beneficial Use Supported
The beneficial use is supported if the standard is exceeded in 10% or fewer of TDS samples.
Beneficial Use Not Supported
The beneficial use is not supported if the TDS standard is exceeded in more than 10% of TDS
samples.
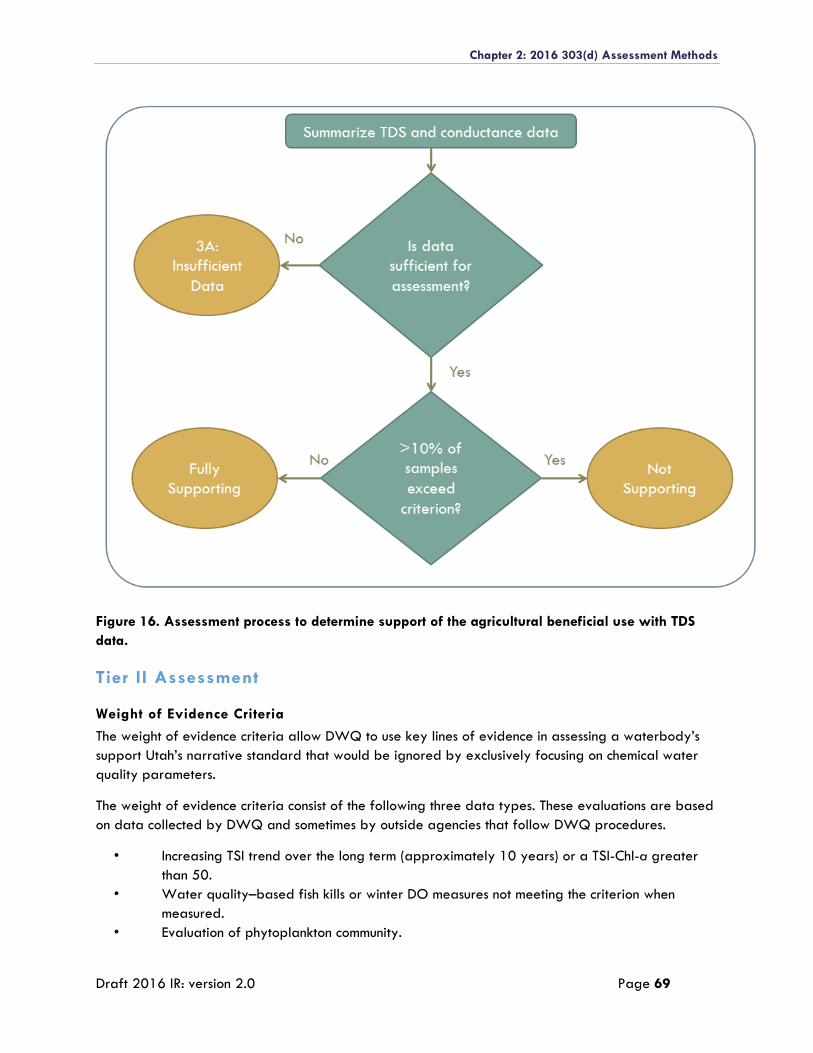
Chapter 2: 2016 303(d) Assessment Methods
Draft 2016 IR: version 2.0 Page 69
Figure 16. Assessment process to determine support of the agricultural beneficial use with TDS
data.
Tier II Assessment
Weight of Evidence Criteria
The weight of evidence criteria allow DWQ to use key lines of evidence in assessing a waterbody’s
support Utah’s narrative standard that would be ignored by exclusively focusing on chemical water
quality parameters.
The weight of evidence criteria consist of the following three data types. These evaluations are based
on data collected by DWQ and sometimes by outside agencies that follow DWQ procedures.
• Increasing TSI trend over the long term (approximately 10 years) or a TSI-Chl-a greater
than 50.
• Water quality–based fish kills or winter DO measures not meeting the criterion when
measured.
• Evaluation of phytoplankton community.
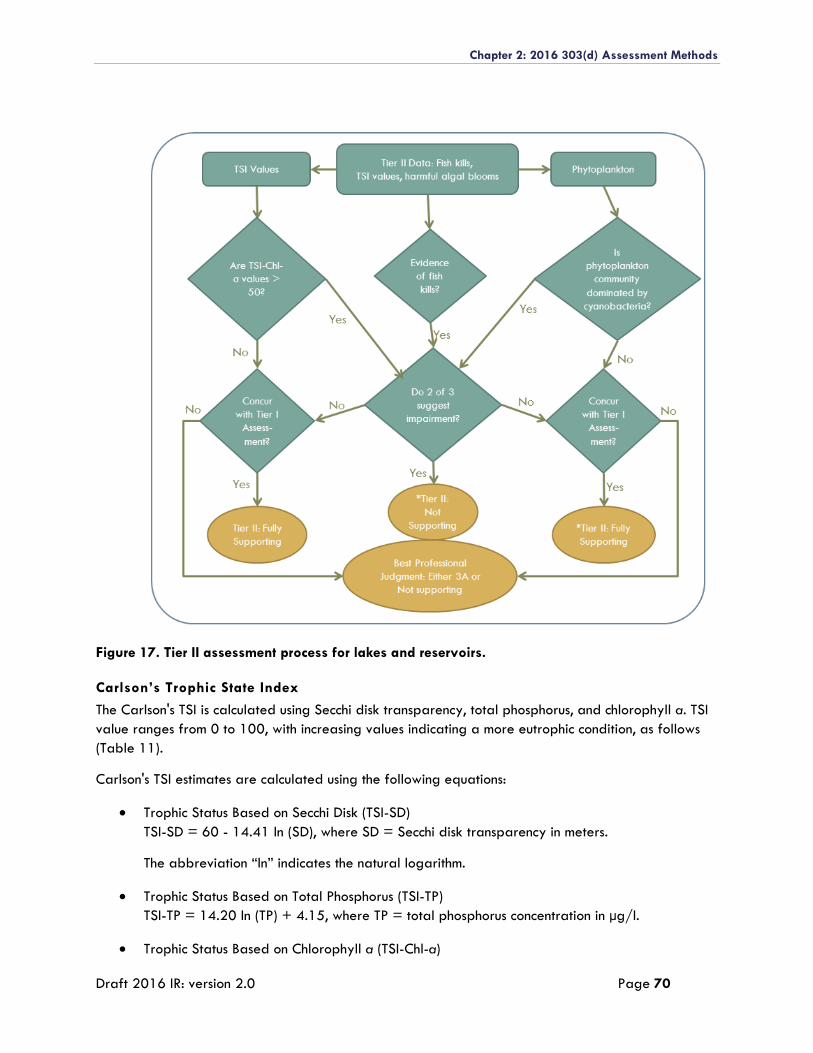
Chapter 2: 2016 303(d) Assessment Methods
Draft 2016 IR: version 2.0 Page 70
Figure 17. Tier II assessment process for lakes and reservoirs.
Carlson’s Trophic State Index
The Carlson's TSI is calculated using Secchi disk transparency, total phosphorus, and chlorophyll a. TSI
value ranges from 0 to 100, with increasing values indicating a more eutrophic condition, as follows
(Table 11).
Carlson's TSI estimates are calculated using the following equations:
Trophic Status Based on Secchi Disk (TSI-SD)
TSI-SD = 60 - 14.41 ln (SD), where SD = Secchi disk transparency in meters.
The abbreviation “ln” indicates the natural logarithm.
Trophic Status Based on Total Phosphorus (TSI-TP)
TSI-TP = 14.20 ln (TP) + 4.15, where TP = total phosphorus concentration in µg/l.
Trophic Status Based on Chlorophyll a (TSI-Chl-a)
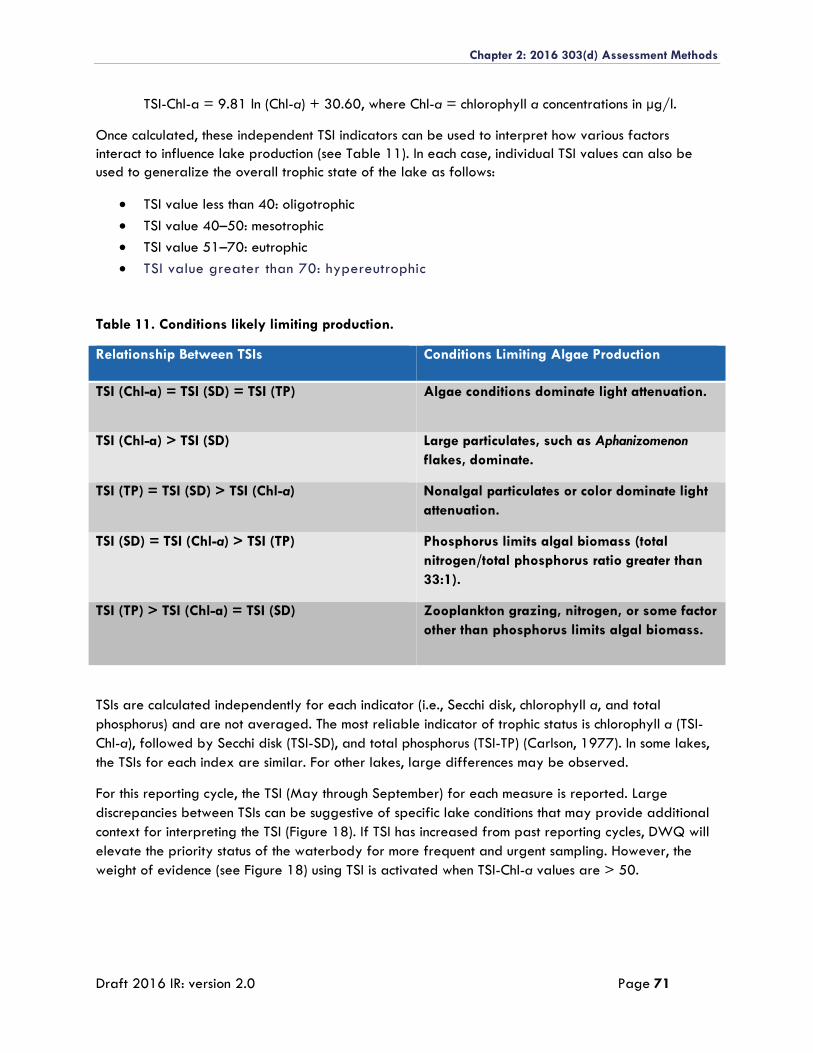
Chapter 2: 2016 303(d) Assessment Methods
Draft 2016 IR: version 2.0 Page 71
TSI-Chl-a = 9.81 ln (Chl-a) + 30.60, where Chl-a = chlorophyll a concentrations in μg/l.
Once calculated, these independent TSI indicators can be used to interpret how various factors
interact to influence lake production (see Table 11). In each case, individual TSI values can also be
used to generalize the overall trophic state of the lake as follows:
TSI value less than 40: oligotrophic
TSI value 40–50: mesotrophic
TSI value 51–70: eutrophic
TSI value greater than 70: hypereutrophic
Table 11. Conditions likely limiting production.
Relationship Between TSIs Conditions Limiting Algae Production
TSI (Chl-a) = TSI (SD) = TSI (TP) Algae conditions dominate light attenuation.
TSI (Chl-a) > TSI (SD) Large particulates, such as Aphanizomenon
flakes, dominate.
TSI (TP) = TSI (SD) > TSI (Chl-a) Nonalgal particulates or color dominate light
attenuation.
TSI (SD) = TSI (Chl-a) > TSI (TP) Phosphorus limits algal biomass (total
nitrogen/total phosphorus ratio greater than
33:1).
TSI (TP) > TSI (Chl-a) = TSI (SD) Zooplankton grazing, nitrogen, or some factor
other than phosphorus limits algal biomass.
TSIs are calculated independently for each indicator (i.e., Secchi disk, chlorophyll a, and total
phosphorus) and are not averaged. The most reliable indicator of trophic status is chlorophyll a (TSI-
Chl-a), followed by Secchi disk (TSI-SD), and total phosphorus (TSI-TP) (Carlson, 1977). In some lakes,
the TSIs for each index are similar. For other lakes, large differences may be observed.
For this reporting cycle, the TSI (May through September) for each measure is reported. Large
discrepancies between TSIs can be suggestive of specific lake conditions that may provide additional
context for interpreting the TSI (Figure 18). If TSI has increased from past reporting cycles, DWQ will
elevate the priority status of the waterbody for more frequent and urgent sampling. However, the
weight of evidence (see Figure 18) using TSI is activated when TSI-Chl-a values are > 50.
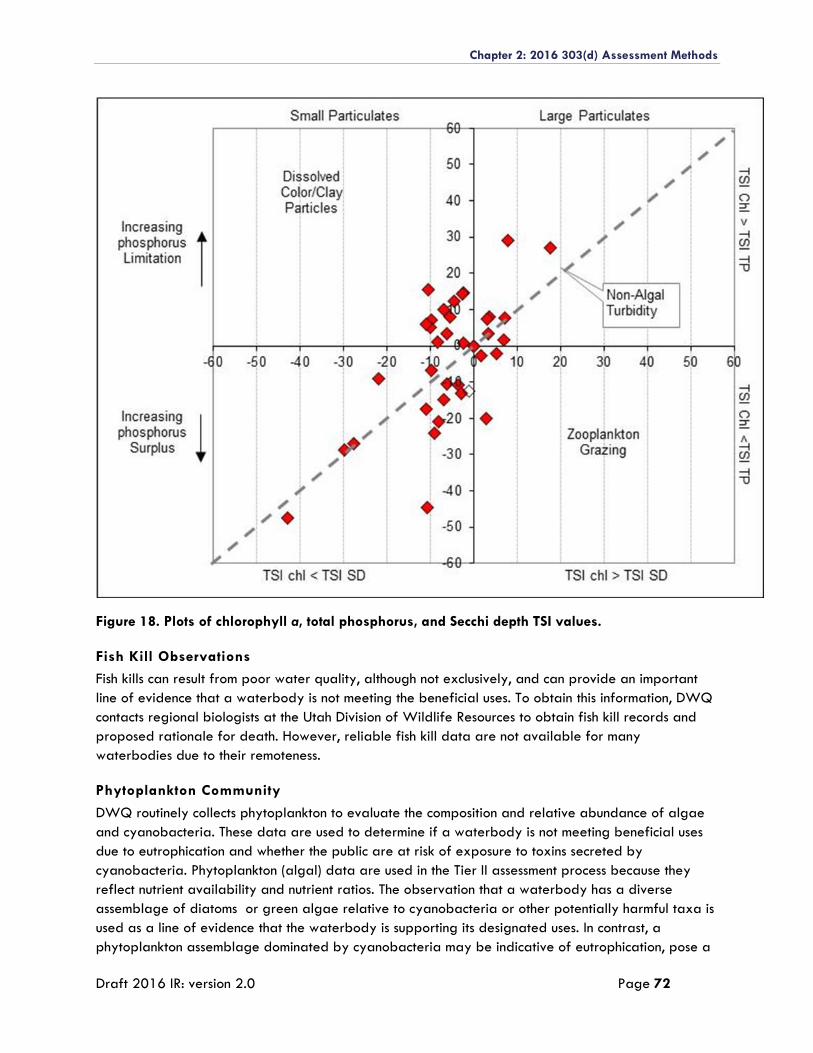
Chapter 2: 2016 303(d) Assessment Methods
Draft 2016 IR: version 2.0 Page 72
Figure 18. Plots of chlorophyll a, total phosphorus, and Secchi depth TSI values.
Fish Kill Observations
Fish kills can result from poor water quality, although not exclusively, and can provide an important
line of evidence that a waterbody is not meeting the beneficial uses. To obtain this information, DWQ
contacts regional biologists at the Utah Division of Wildlife Resources to obtain fish kill records and
proposed rationale for death. However, reliable fish kill data are not available for many
waterbodies due to their remoteness.
Phytoplankton Community
DWQ routinely collects phytoplankton to evaluate the composition and relative abundance of algae
and cyanobacteria. These data are used to determine if a waterbody is not meeting beneficial uses
due to eutrophication and whether the public are at risk of exposure to toxins secreted by
cyanobacteria. Phytoplankton (algal) data are used in the Tier II assessment process because they
reflect nutrient availability and nutrient ratios. The observation that a waterbody has a diverse
assemblage of diatoms or green algae relative to cyanobacteria or other potentially harmful taxa is
used as a line of evidence that the waterbody is supporting its designated uses. In contrast, a
phytoplankton assemblage dominated by cyanobacteria may be indicative of eutrophication, pose a
Chapter 2: 2016 303(d) Assessment Methods
Draft 2016 IR: version 2.0 Page 73
potential risk to human health or aquatic life through the production of cyanotoxins, and may reflect a
loss of aquatic biodiversity.
Great Salt Lake
GSL is assigned its own beneficial use class (Class 5) and is further divided into five subclasses (5A–
5E) that represent the four main bays (Gilbert, Gunnison, Bear River, and Farmington) and transitional
waters (UAC R317-2-6). With the exception of a numeric selenium egg tissue standard for Class 5A
(Gilbert Bay), no other numeric criteria are available to assess GSL. Instead, the beneficial uses of
GSL are protected and assessed by the Narrative Standard (UAC R317-2-7.2). The Great Salt Lake
Water Quality Strategy, finalized and endorsed by the Water Quality Board in 2014, outlines the
process for the future development of numeric criteria for each of the lake’s bays as well as
monitoring and research.
Chapter 2: 2016 303(d) Assessment Methods
Draft 2016 IR: version 2.0 Page 74
DETERMINATION OF IMPAIRMENT: ALL ASSESSMENT UNITS
Following the initial assessment of credible data against the numeric criteria in UAC R317-2, each
parameter within a waterbody is assigned a provisional EPA- and state-derived assessment category.
To verify the parameter-specific assessment results and consolidate the often multiple parameter
assessments into one result per waterbody, DWQ must consider the strength of the quantity of data
and the extent to which such data demonstrate clear and convincing evidence of supporting or not
supporting the beneficial uses assigned to the waterbody in UAC R317-2. In determining the strength
of whether or not a waterbody is supporting or not supporting its beneficial uses, DWQ considers the
following information:
Individual assessment of water quality standards at a single site.
Multiple lines of evidence.
Independent applicability.
DWQ’s narrative criterion, to make a final decision based on the overwhelming evidence.
Several levels of BPJ.
Individual Assessment of Water Quality Standards
In determining whether or not a waterbody or segment within a waterbody is supporting or not
supporting the beneficial uses assigned in UAC R317-2, DWQ first considers the individual
parameter-specific assessment results that were derived from the data assessment protocols described
earlier in this document. Unless noted in the waterbody-specific data assessment protocols, the
assessment policies outlined in this document provide a direct and quantifiable method and
documentation of data supporting or not supporting DWQ’s water quality standards versus data and
information that are developed using surrogate parameters or indicators. Because individual
assessments at a single monitoring location site offer a more direct measure of supporting or not
supporting water quality standards in UAC R317-2, DWQ places a greater weight on individual
assessment decisions that follow the data assessment protocols in this document.
Conflicting Assessments of Water Quality Standards
Following the review of the individual water quality standard assessments, DWQ looks across the
multiple parameter-specific assessment results that exist for a waterbody or segment within a
waterbody and then consolidates the results into a final assessment. That is, DWQ assigns one EPA-
and state-derived assessment decision category as defined in Table 1. To address the possibility of
conflicting results among different types of data (e.g., biological versus conventionals, toxics versus
E.coli), DWQ applies the policy of independent applicability and goes through a series of
considerations to determine if the discrepancies are because of
differences in data quality, or
environmental factors such as the application of the water effects ratio, development of site-
specific criteria, revision to numeric criteria in UAC R317-2, or conducting a use attainability
analysis.
Figure 19 elaborates on DWQ’s use of the independent applicability policy.

Chapter 2: 2016 303(d) Assessment Methods
Draft 2016 IR: version 2.0 Page 75
In cases where concerns about the quality of independent datasets cannot be rectified through an
evaluation and documentation of the QA/QC issues that resulted in accepting one dataset and the
resulting assessment result, sites with conflicting assessment results may be listed as 3A (requiring
additional study or monitoring) to better understand the seemingly conflicting lines of evidence.
Specific assumptions regarding model applicability applied during the biological assessment process
are discussed above. Similarly, if the application of water effects ratio, justifiable site-specific criteria
change, or change in beneficial uses based on a use attainability analysis cannot rectify the
difference in the assessment results, then a 3A categorization may be warranted. All evaluations of
conflicting assessment decisions will be made in consultation with EPA on a case-by-case basis.
Figure 19. Overview of independent applicability process.
Note: These judgment decisions are based in part on EPA’s Consolidated Assessment and Listing Methods
guidance published in 2002.
Narrative Standards
In addition to the numeric criteria used to perform water quality assessments, Utah’s water quality
standards contain provisions for the application of narrative criteria to protect uses. The narrative
criteria state the following:
Chapter 2: 2016 303(d) Assessment Methods
Draft 2016 IR: version 2.0 Page 76
It shall be unlawful, and a violation of these rules, for an person to discharge or place
any waste or other substance in such a way as will be or may become offensive such
as unnatural deposits, floating debris, oil, scum, or other nuisances such as color, odor
to taste; or cause conditions which produce undesirable aquatic life or which produce
objectionable tastes in edible aquatic organisms; or result in concentration or
combinations of substance which produce undesirable human health effect, as
determined by bioassay or other tests performed in accordance with standard
procedures; or determined by biological assessments in (UAC) Subsection R317-2-7.3.
Under circumstances where evidence exists that human-caused actions have produced any of these
undesirable outcomes in a waterbody, DWQ will apply the narrative criteria to protect human health
and aquatic life. Examples where the Narrative Standards may be used to make an impairment
determination include drinking-water closures, fish kills, beach closures for swimming, and health
advisories for the consumption of fish. The assessment of E. coli data and associated beach closures to
protect human health is an additional weight of evidence for defining the impairment of recreational
uses and is addressed in more detail earlier in this document in the E. coli Assessment section. DWQ
will also apply a cyanobacterial cell count threshold for determining impairments due to harmful algal
blooms (see Assessment of Lakes and Reservoirs section).
Drinking Water Closures
If the Utah Division of Drinking Water or a local municipality issues an advisory or closure for a
surface drinking water source, DWQ will assess the site as impaired for 1C uses, unless data show that
the problem has been solved.
Fish Kills
DWQ requests information on reported fish kills from the Utah Division of Wildlife Resources and
other stakeholders. These data are used in concert with water quality data to make final assessment
decisions. For example, sites that would generally not be assessed due to small sample sizes may be
listed as impaired if fish kills have also been observed in the waterbody.
Beneficial Use Assessment Based on Tissue Consumption Health Advisories
DWQ has collected fish tissue samples for mercury analysis in waterbodies throughout the state
since 2000. Since that time, consumption advisories have been issued for 24 waterbodies (16
reservoir and 8 river sites).
DWQ staff develop an annual fish sampling plan. Sampling criteria currently include the
following:
Sampling when a current consumption advisory is greater than 5 years old.
Sampling when there is no advisory but the existing data are greater than 5 years old.
Sampling to address uncertainties from previous years’ data.
Sampling waterbodies that have no mercury data.
Regional Utah Division of Wildlife Resources staff collect fish from locations that are both
identified in the sampling plan and that they will already be visiting for their own purposes. All
Chapter 2: 2016 303(d) Assessment Methods
Draft 2016 IR: version 2.0 Page 77
fish are submitted to DWQ by December 1, at which time DWQ staff process samples from fillets
and submit them to the EPA Region 8 Laboratory for total mercury analysis.
DWQ performs basic statistical analyses on the results, including minimum concentration, maximum
concentration, mean, standard deviation, p-value, and 95% confidence intervals.
DWQ currently uses the EPA-published ambient water quality criterion for methylmercury for the
protection of people who eat fish and shellfish. This criterion is 0.3 milligram (mg) methylmercury
per kilogram (kg) fish tissue wet weight. If all fish (small and large) of the same species at a
monitoring location have a mean mercury concentration of > 0.3 mg/kg, additional statistical tests
are used to determine if a consumption advisory is necessary. If the mean is < 0.3 mg/kg, no
advisory is issued. In several instances, size class advisories have been issued when it is apparent
that only the larger size class exceeds the safe consumption criterion.
For locations with a mean mercury concentration of > 0.3 mg/kg, the p-value is considered. The
p-value refers to the probability of obtaining a result equal to or greater than those that were
measured at that location. DWQ uses a p-value of 0.05 to be 95% certain an advisory is not
unnecessarily issued. Therefore, if a species has a mean of > 0.3 mg/kg and a p-value < 0.05,
then a consumption advisory is issued. If a species has a mean of > 0.3 mg/kg but a p-value of >
0.05, then an advisory is not issued. The consumption advisories are based on long-term
consumption; therefore, the mean is the most appropriate and commonly used parameter to
estimate exposure.
In an effort to control for false negatives, DWQ calculates 95% confidence limits of the mean
mercury concentration. If the upper confidence limit is above 0.3 mg/kg, that site is targeted for
additional sampling.
When an advisory is warranted, DWQ sends the data to the Utah Department of Health
toxicologist who uses the mean mercury concentration to calculate the actual consumption
recommendations. Those calculations are based on the following:
Average Adult Weight: 70 kg (154 pounds) | Average Adult Meal Size: 227 grams (8
ounces)/meal
Average Child Weight: 16 kg (35 pounds) | Average Child Meal Size: 113 grams (4
ounces)/meal
Consumption amounts are calculated for three target populations: Pregnant Women and Children
< 6, Women of Child Bearing Age and Children 6–16, and Adult Women Past Child Bearing Age
and Men >16.
Mercury Assessment Process
The current approach for making assessments of aquatic life use support for mercury is different
than the consumption advisory process. The assessment is based on the U.S. Food and Drug
Administration recommended value of 1.0 mg/kg. The U.S. Food and Drug Administration set the
consumption concentration at 1.0 mg/kg, which correlates to the water column mercury
concentration of 0.012 µg/l in previous studies by EPA (EPA, 1985). Utah’s water quality standard
Chapter 2: 2016 303(d) Assessment Methods
Draft 2016 IR: version 2.0 Page 78
for mercury is 0.012 µg/l as a 4-day average. Therefore, the corresponding fish tissue
concentration of 1.0 mg/kg is used for assessment.
Beneficial Use Supported (Category 1)
No fish consumption advisories for mercury are in place.
Mean fish tissue mercury concentration for all individuals of the same species at a location
is less than 0.3 mg/kg and p-value is < 0.5.
Insufficient Data with Exceedances (Category 3A)
Fish consumption advisories for mercury are in place, but the mean fish tissue mercury
concentration for all individuals of the same species at a location is less than or equal to
1.0 mg/kg.
Beneficial Use Not Supported (Category 5)
Fish consumption advisory for mercury is in place.
Mean fish tissue mercury concentration is greater than 1.0 mg/kg.
For additional information and the most up-to-date list of consumption advisories, please visit
fishadvisories.utah.gov.
Overwhelming Evidence
Following the consolidation of all of the individual assessment results and data information that exist
for a waterbody or segment within a waterbody, DWQ may review individual listing decisions if
there is overwhelming evidence of a waterbody or segment of a waterbody supporting or not
supporting its associated beneficial uses and numeric criteria in UAC R317-2.
Where there is a lack of overwhelming evidence of a waterbody or segment within a waterbody
supporting or not supporting its beneficial uses, BPJ can be used to verify a preliminary assessment.
Where this is overwhelming evidence for credible data as defined earlier in this document, assessment
decision are considered confirmed.
Best Professional Judgment
DWQ recognizes that BPJ from internal and external reviewers during the public comment periods
may provide useful feedback on determining the strength of the quantity of data and the extent to
which such data demonstrate clear and convincing evidence of a waterbody or segment of a
waterbody supporting or not supporting its beneficial uses and numeric criteria. To ensure consistency
in when and how BPJ is used among different professionals, DWQ will use BPJ in a select number of
scenarios using a standard set of guidelines. Appendix 5 elaborates on when and how DWQ’s
assessment and 303(d) BPJ policy will be implemented.
Where BPJ documentation for overriding a preliminary assessment decision is insufficient in strength,
vague, or cannot be provided, the preliminary assessment decision based on the data assessment
procedures outlined in this document will carry forward.
Chapter 2: 2016 303(d) Assessment Methods
Draft 2016 IR: version 2.0 Page 79
Where BPJ documentation for overriding a preliminary assessment decision is sufficient in
strength and can be provided, the preliminary assessment decision based on the data
assessment procedures outlined in this document will be overwritten. Preliminary listings for
Category 5 or Category 1 and Category 2 waters could be re-assigned as Category 3A,
insufficient data with exceedances or Category 3E, insufficient data with no exceedances,
respectively.
For tracking and transparency to the public, DWQ will retain the original category assignment and a
justification for the BPJ in the data files.
Categorization of an Assessment Unit
To summarize the water quality of a waterbody or segment of a waterbody, DWQ compiles and
aggregates all credible and representative water quality data from multiple data sources and
monitoring locations into one EPA- and state-derived assessment category for the AU (see Table 1).
Appendix 5 elaborates on the processes and procedures DWQ goes through when rolling up the
individual assessments that have undergone the reviews and considerations outlined earlier in this
document into one category for each defined AU within the state. For a brief summary on how DWQ
summarizes the individual assessments at a monitoring location site to an AU, see Figure 20.
Assessment of “All Tributaries” Segments
If after aggregating all of the assessments into one EPA- and state-derived assessment category for
an AU, DWQ believes that there is some reason that the supporting or not supporting assessment
result decision is not representative of the entire AU, DWQ will investigate further to determine
whether the supporting or not supporting decision is widespread or limited to individual portions of the
waterbody, such as specific tributaries or reaches. Results from the above analysis will be categorized
as follows:
Whole AU is Not Supporting (Category 5)
If all of the data from multiple tributaries within a segment indicate only (or a combination of)
not supports (Category 5) and insufficient data with exceedances (Category 3A) , DWQ will
recommend that the entire AU be listed as not supporting.
Only Not Supporting Tributaries are listed as Not Supporting (Category 5)
If data from one or more tributaries indicate a combination of any of the following, DWQ
may recommend that only the tributaries with data indicating an impairment be listed as not
supporting.
Supporting (Category 1)
No Evidence of Impairments (Category 2)
Insufficient Data with Exceedances (Category 3A)
Insufficient Data with No Exceedances (Category 3E)
Needs Further Investigations (Category 3D)
Not Assessed (Category 3F)
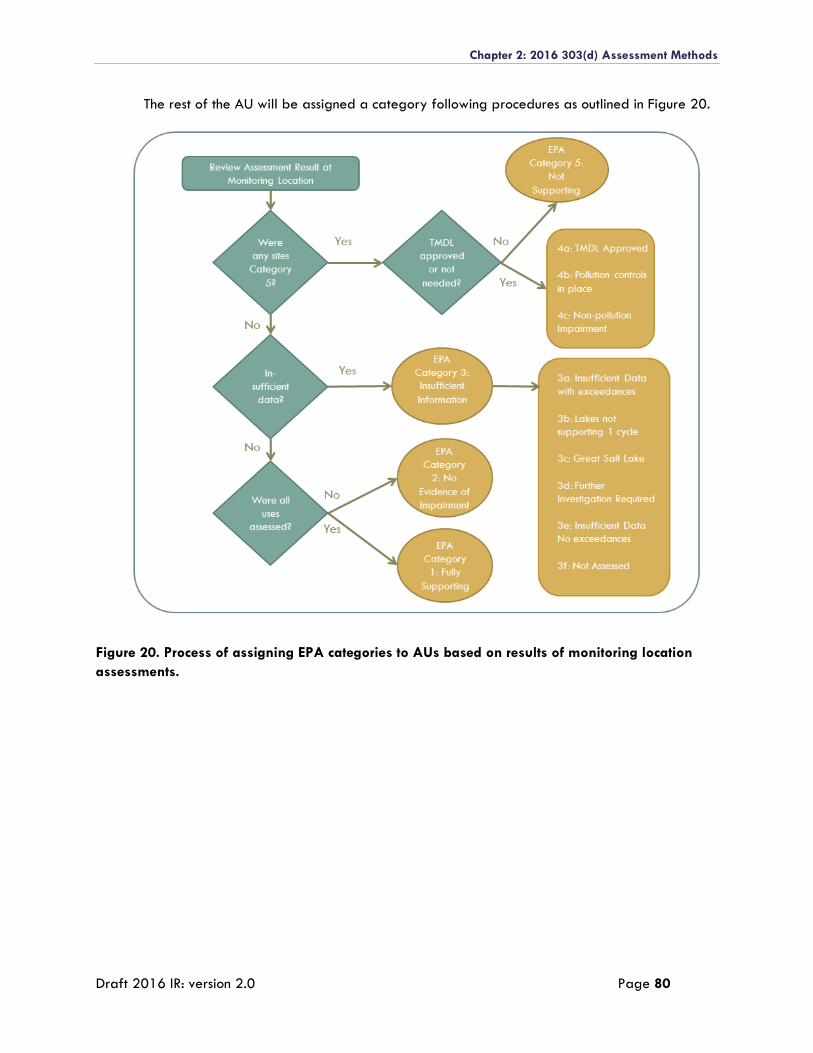
Chapter 2: 2016 303(d) Assessment Methods
Draft 2016 IR: version 2.0 Page 80
The rest of the AU will be assigned a category following procedures as outlined in Figure 20.
Figure 20. Process of assigning EPA categories to AUs based on results of monitoring location
assessments.
Chapter 2: 2016 303(d) Assessment Methods
Draft 2016 IR: version 2.0 Page 81
IDENTIFYING CAUSES OF IMPAIRMENTS
Once an AU is assigned an EPA- and state-derived assessment category that is representative of
conditions with the AU, DWQ will determine if the impairment or impairments are driven by pollutants,
pollution, unknown, or natural causes (see Table 1). DWQ will identify causes of impairment defined
by a pollutant that has specific numeric water quality criteria identified in R317-2. Pollution is a
generalized term for causes of water quality impairment that can include multiple pollutants and other
factors such as the absence or lack of water, riparian vegetation, and other modifications that affect
a waterbody’s ability to support aquatic habitat and other designated uses. With the exception of
naturally occurring causes, only one cause will be applied to a not-supporting waterbody and
parameter. Procedures on how DWQ identifies the cause of impairments are described in more detail
below.
Pollutants
Using the CWA’s definition of a pollutant as a guide, DWQ defines pollutant-driven impairments
(Category 5) as those resulting from the following:
… dredged spoil, solid waste, incinerator residue, sewage, garbage, sewage sludge,
munitions, chemical wastes, biological materials, radioactive materials (except those
regulated under Atomic Energy Act of 1954, as amended), heat, wrecked or
discarded equipment, rock, sand, cellar dirt, and industrial, municipal, and agricultural
waste discharged into water. (UAC R317-2)
Notwithstanding the federal definition cited above, DWQ will also identify certain radiological
constituents that are regulated under the state’s Water Quality Control Act. For the purpose of the
303(d) List, causes for impairments due to toxic parameters will be identified as the parameter for
which there is an impairment. In the case of conventional parameters such as DO, temperature, pH,
and biological scores, the cause will be assigned as the parameter that was assessed until such time
as a TMDL or pollution prevention plan identifies an alternative cause of the impairment.
Once an impairment for a waterbody or segment within a waterbody is identified as pollutant-driven,
DWQ will list the waterbody and the not-supporting parameter(s) as impaired for that pollutant
(cadmium, iron, etc.). Waterbodies that are not supporting their beneficial uses due to pollutant
impairments require future development of a TMDL or application of a TMDL alternative. Information
on DWQ’s process of prioritizing and developing a TMDL, and TMDL alternatives, is described later in
this document and on DWQ’s website.
Pollution
Where DWQ can identify that an impairment was not driven by a pollutant, DWQ may consider if
the not-supporting assessment was driven solely by pollution versus a pollutant or by an unknown
cause. Using the CWA’s definition of pollution as a guide, DWQ will go through an evaluation to
determine if an impairment resulted from “the man-made or man-induced alteration of the chemical,
physical, biological, and radiological integrity of water.” Waterbodies with not-supporting
parameters that are driven solely by pollution problems do not require the future development of a
Chapter 2: 2016 303(d) Assessment Methods
Draft 2016 IR: version 2.0 Page 82
TMDL and are candidates for a non-pollutant impairment (4C) assessment category. Details on
DWQ’s process for using EPA’s 4C assessment category are described later in this document.
Unknown Sources
For the purpose of the IR, sources of pollution contributing to an impairment will be reported in the
303(d) list to EPA as “unknown” until such time as a TMDL or special study identifies the sources and
any additional causes of impairment.
Natural Conditions
In cases where DWQ or a stakeholder can demonstrate that the natural conditions of the waterbody
or segment within a waterbody are the key factor for an impairment(s), DWQ will still retain the not-
supporting assessment decision. However, DWQ’s response to such exceedances differs unless a site-
specific standard has been promulgated. Site-specific standards require documentation that
demonstrates the extent to which the violations were due to natural conditions. Once this
documentation is developed, the proposed changes to standards will be developed. For more
information on the review and approval process for developing standards and numeric criteria
surrounding exceedances caused by naturally occurring conditions, please review DWQ’s Standards
website.
Chapter 2: 2016 303(d) Assessment Methods
Draft 2016 IR: version 2.0 Page 83
REVISING THE 303(D) LIST AND OTHER CATEGORICAL ASSESSMENTS
Upon validating the strength and extent of the impairments within a waterbody or segment within a
waterbody, DWQ will include newly proposed and previously listed not supporting (Category 5)
waterbodies on the updated 303(d) List unless the waterbody or waterbody segment(s) is currently
included in the IR’s TMDL-approved (Category 4A), pollution control (Category 4B), non-pollutant
impairment (Category 4C), or delisting lists. Details on how and when DWQ will not apply or carry an
impaired listing (not supporting, Category 5) forward on DWQ’s 303(d) List are described below.
Category 4A
The first alternative DWQ has available for not listing or removing an impaired waterbody or
segment within a waterbody on the state’s 303(d) List is to calculate the maximum amount of a
pollutant that a waterbody can receive while still meeting the state’s water quality standards. This
calculation and analysis work must be formalized in a TMDL and go through a thorough internal and
external review process. This calculation and analysis work must be formalized in a TMDL and
submitted for approval from the Natural Resource Committee (for implementation costs exceeding
$10 million), the state legislature (for implementation costs over $100 million), and EPA. Information on
DWQ’s process for developing and implementing a TMDL can be found on DWQ’s Watershed
Management Program website and EPA’s TMDL 303(d) website. Where DWQ has documentation of
a DWQ Water Quality Board- and EPA-approved TMDL for an impaired parameter within a not-
supporting waterbody or segment within a waterbody, DWQ will override a current or previous not
supporting Category 5 listing decision at the AU level as follows:
Whole AU Category 4A, TMDL-approved if:
The only impairments within the waterbody or segment within the waterbody are included in the
approved TMDL.
There are additional impairments within the waterbody or segments within the waterbody that are
addressed in a Category 4B demonstration plan (described below in this document) and are not
included in the approved TMDL. If the parameters included in the approved Category 4B
demonstration plan are still not supporting or are insufficient data with exceedances in the current
assessment cycle, DWQ will indicate that those parameters have an approved Category 4B
demonstration plan in place.
There are additional impairments within the waterbody or segments within the waterbody that are
pollution-driven (Category 4C) and not included in the approved TMDL. If the pollution-driven
parameters are still not supporting or are insufficient data with exceedances in the current
assessment cycle, DWQ will indicate that those parameters are pollution- versus pollutant-driven.
Whole AU Category 5, Not Supporting if:
There are any additional pollutant impairments within the waterbody or segments within the
waterbody that are not included in the approved TMDL. If the parameters included in the
approved TMDL are still not supporting or are insufficient data with exceedances in the current
assessment cycle, DWQ will indicate that those parameters have an approved TMDL in place.
Chapter 2: 2016 303(d) Assessment Methods
Draft 2016 IR: version 2.0 Page 84
Category 4B
DWQ’s second alternative to not listing or removing an impaired waterbody or segment within a
waterbody on the state’s 303(d) List is to develop a plan that ensures upon implementation that the
waterbody will meet state water quality standards within a reasonable time period and through
state- and EPA-approved pollution-control mechanisms. Similar to a TMDL, a Category 4B
demonstration plan must go through a robust internal and external review process. For example, once
DWQ or a stakeholder develops a plan for consideration, DWQ will present the plan to DWQ’s
Water Quality Board and submit the board-approved plan to EPA for final approval. More
information on the Category 4B demonstration plan process can be found in Appendix 7 and in EPA’s
Guidance for 2006 Assessment, Listing and Reporting Requirements Pursuant to Sections 303(d),
305(b) and 314 of the Clean Water Act and Information Concerning 2008 Clean Water Act
Sections 303(d), 305(b), and 314 Integrated Reporting and Listing Decisions.
Where DWQ has documentation of an EPA-approved Category 4B demonstration plan for an
impaired parameter within a not-supporting waterbody or segment within a waterbody, DWQ will
override a current (or previous) not-supporting Category 5 listing decision at the AU level as follows:
Whole AU Category 4A, TMDL-approved if:
There are any additional impairments within the waterbody or segments within the waterbody that
are addressed in an approved TMDL (Category 4A) and are not included in the approved
Category 4B demonstration plan. If the parameters included in the approved Category 4B
demonstration plan are still not supporting or are insufficient data with exceedances in the current
assessment cycle, DWQ will indicate that those parameters have an approved Category 4B
demonstration plan in place.
Whole AU Category 4B, Pollution Control if:
The only impairments within the waterbody or segment within the waterbody are included in the
approved Category 4B demonstration plan.
There are additional impairments within the waterbody or segments within the waterbody that are
pollution-driven (Category 4C) and are not included in the approved Category 4B demonstration
plan. If the pollution-driven parameter impairments are still not supporting or are insufficient data
with exceedances in the current assessment cycle, DWQ will indicate that those parameters are
pollution- rather than pollutant-driven.
Whole AU Category 5, Not Supporting if:
There are any additional pollutant impairments within the waterbody or segments within the
waterbody that are not included in the approved Category 4B demonstration plan. If the
parameters included in the approved Category 4B demonstration plan are still not supporting or
are insufficient data with exceedances in the current assessment cycle, DWQ will indicate that
those parameters have an approved Category 4B demonstration plan in place.
Chapter 2: 2016 303(d) Assessment Methods
Draft 2016 IR: version 2.0 Page 85
Category 4C
The third alternative for not listing or removing an impaired waterbody or segment within a
waterbody on the state’s 303(d) List is to demonstrate that the parameter-specific impairment (or
impairments) is driven by pollution and not by a pollutant or pollutant that causes pollution. Unlike a
TMDL or Category 4B demonstration plan, the analysis works to determine if the cause of impairment
is driven by pollution and does not require formal approval from DWQ’s Water Quality Board or
EPA. Pollution analysis work is instead reviewed internally by DWQ and by stakeholders during the
public comment period of the draft IR and 303(d) List.
For the draft IR and 303(d) List, DWQ will temporarily assume “approval” of any pollution-driven
analysis work and supersede a current or previous not supporting Category 5 listing decision at the
AU level as follows:
Whole AU Category 4A, TMDL-approved if:
All impairments within the waterbody or segments within the waterbody are addressed in an
approved TMDL (Category 4A). For pollution-driven impairments that are still not supporting or
are insufficient data with exceedances in the current assessment cycle, DWQ will indicate that
those parameters are pollution- rather than pollutant-driven.
Whole AU Category 4B, Pollution Control if:
All impairments within the waterbody or segments within the waterbody that are addressed in an
approved Category 4B demonstration plan. For pollution-driven impairments that are still not
supporting or are insufficient data with exceedances in the current assessment cycle, DWQ will
indicate that those parameters are pollution-driven.
Whole AU Category 4C, Non-Pollutant Impairment if:
The only impairments within the waterbody or segment within the waterbody are included in the
approved Category 4B demonstration plan.
Whole AU Category 5, Not Supporting if:
There are any additional pollutant impairments within the waterbody or segments within the
waterbody. The pollution-driven impairments that are still not supporting or are insufficient data
with exceedances in the current assessment cycle, DWQ will indicate that those parameters are
pollution-driven.
DWQ will provide to stakeholders during the public comment period of the draft IR and 303(d) List
documentation as to why the impaired parameter within the waterbody or segment within the
waterbody is pollution- and not pollutant-driven and will not require the future development of a
TMDL.
Delistings
The fourth and final alternative DWQ has at its disposal is to demonstrate good cause to
stakeholders and EPA that the previously impaired parameter and waterbody or segment within a
Chapter 2: 2016 303(d) Assessment Methods
Draft 2016 IR: version 2.0 Page 86
waterbody are now meeting water quality standards in UAC R317-2. Good cause occurs when DWQ
can demonstrate one or more of the following categories and scenarios:
Improvements in Watershed Conditions:
Because of the implementation of nonpoint source projects and/or revised effluent limits, the
waterbody has improved such that post-implementation data indicate that the impairment
has been resolved. This assessment may be based on additional data, beyond that which is
typically used in assessments, including before and after project implementation monitoring.
In some cases, demonstration of improvement may be based on a different time period for
data collection that corresponds with known watershed improvements.
Changes to Water Quality Standards:
Adoption of revised water quality standards and/or uses such that the water is now in
attainment of the revised standards and/or uses.
Changes to the 303(d) Assessment Methods:
Development of a new listing method consistent with the state water quality standards and
classifications and federal listing requirements. This includes all information contained in this
document and credible data requirements posted on DWQ’s Call for Data website.
Reassessment (new data and information):
Assessment and interpretation of older data that were not originally included in the
previous assessment and/or more recent or more accurate data that demonstrate that the
applicable classified uses and numeric and narrative standards are being met.
Geo-location Information Error:
Inappropriate listing of a water that is located within Indian lands as defined in 18 United
States Code 1151.
Analysis Errors:
Flaws in the original analysis of data and information that led to the waterbody-pollutant
combination being incorrectly listed. Such flaws may include the following:
o Calculation errors in the data assessment methods outlined in the 303(d) Assessment
Methods from that Assessment cycle.
o Errors produced when reviewing credible and representative data information.
o Mapping errors generated during the validation of monitoring location information
and assigning AU designations.
Chapter 2: 2016 303(d) Assessment Methods
Draft 2016 IR: version 2.0 Page 87
o Discrepancies between the beneficial use assignments in UAC R317-2 and the IR
geo-location information files for internal and external data.
o Wrong identification and assessment of a waterbody type.
o Application of the wrong numeric criteria to a beneficial use.
New Modeling:
Results of more sophisticated water quality modeling that demonstrate that the applicable
classified uses and numeric and narrative standards are being met.
Effluent Limitations:
Demonstration pursuant to 40 CFR 130.7(b)(1)(ii) that there are effluent limitations required
by state or local authorities that are more stringent than technology-based effluent
limitations, required by the CWA, and that these more stringent effluent limitations will
result in attainment of classified uses and numeric and narrative standards for the pollutant
causing the impairment.
Other:
There is other relevant information that supports the decision not to include the segment on
the Section 303(d) List.
In order to first justify a delisting of an AU for a given parameter based on new data, the dataset
must be of sufficient quantity and quality to make an assessment based on methods outlined earlier in
this document. There are two mechanisms for justifying a delisting based on assessment results:
Delisting an AU for all parameters.
Delisting individual parameters for an AU.
To demonstrate good cause, DWQ will compare the previous IR cycle’s final assessment categories
and 303(d) List to the current IR’s assessment categories and 303(d) List. Where differences in
categorical assignments exist, DWQ will only further investigate the following scenarios for good
cause:
The AU/waterbody or segment within the waterbody was previously not supporting
(Category 5) and is now supporting (Category 1), shows no evidence of impairment
(Category 2), or has insufficient data with no exceedances (Category 3E).
The AU/waterbody or segment within the waterbody was previously not supporting but had
an approved TMDL (Category 4A) and is now supporting (Category 1), shows no evidence of
impairment (Category 2), or has insufficient data with no exceedances (Category 3E).
The AU/waterbody or segment within the waterbody was previously not supporting but had
an approved Category 4B demonstration plan and is now supporting (Category 1), shows no
Chapter 2: 2016 303(d) Assessment Methods
Draft 2016 IR: version 2.0 Page 88
evidence of impairment (Category 2), or has insufficient data with no exceedances (Category
3E).
The AU/waterbody or segment within the waterbody was previously not supporting but had
pollution-driven impairment (Category 4C) and is now supporting (Category 1), shows no
evidence of impairment (Category 2), or has insufficient data with no exceedances (Category
3E).
Note: The next set of scenarios describes the methods that apply to delisting individual parameters
rather than entire AUs.
A parameter within an AU/waterbody (or segment within the waterbody) was previously
not supporting (Category 5) and is now supporting (Category 1), shows no evidence of
impairment (Category 2), or has insufficient data with no exceedances (Category 3E).
A parameter within an AU/waterbody (or segment within the waterbody) was previously
not supporting but had an approved TMDL (Category 4A) and is now supporting
(Category 1), shows no evidence of impairment (Category 2), or has insufficient data with
no exceedances (Category 3E).
A parameter within an AU/waterbody (or segment within the waterbody) was previously
not supporting but had an approved Category 4B demonstration plan and is now
supporting (Category 1), shows no evidence of impairment (Category 2), or has
insufficient data with no exceedances (Category 3E).
A parameter within an AU/waterbody (or segment within the waterbody) was previously
not supporting but had pollution-driven impairment (Category 4C) and is now supporting
(Category 1), shows no evidence of impairment (Category 2), or has insufficient data with
no exceedances (Category 3E).
Where assessment category assignments at the AU- and parameter-level warrant a further
investigation for good cause as articulated above, DWQ will reevaluate the data from the following:
The period of record from when the AU and/or parameter was first listed.
The period of record in the current assessment cycle.
The data that were collected between when the AU and/or parameter were first listed and
the period of record considered in the current assessment cycle.
As part of the demonstration of good cause process, DWQ will review the data from all assessed
sample locations (as defined in Table 3) in the three above scenarios to confirm whether or not there
were exceedances at the sample sites. Where exceedances occur, DWQ must demonstrate that the
exceedances no longer exist, no longer are of concern, or that water quality has improved. If a
sample site had exceedances (and newer data do not exist), DWQ will provide documentation and a
justification as to why the site was not re-sampled and/or whether water quality conditions have
improved. If documentation cannot be provided, the AU and parameter will not be delisted, and the
previous categorical assignment will carry forward.
Chapter 2: 2016 303(d) Assessment Methods
Draft 2016 IR: version 2.0 Page 89
Delisting Categorical Pollutant Causes
In the case of TMDLs or special studies which identify parameters contributing to a cause of
impairment, but are not the original cause for listing on the 303(d) list, there may be good cause
justification for delisting the categorical cause if the original impaired parameter is no longer
impaired and a linkage of the additional causes can be documented in a TMDL or other study. For
instance, in some circumstances DWQ has identified phosphorus as a contributing cause of impairment
to an existing dissolved oxygen listing and subsequently made a categorical listing for phosphorus as
a cause on subsequent 303(d) lists. Since DWQ does not have assessment methods for phosphorus, a
delisting based on process outlined here is not feasible. Therefore, if the assessment results for the
original DO listing can justify a delisting (as outlined above), any additional parameters associated
with that cause may also be delisted with proper documentation of a direct linkage.
Appendix 6 elaborates on the process DWQ will follow when evaluating good cause at the AU-level,
and also describes, in more detail, the process DWQ will go through when evaluating good cause at
the parameter-level. For EPA review and approval, DWQ applies several delisting codes (also
included in Appendix 2).
If a waterbody or parameter is shown to have good cause for not being listed or removed as an
impaired waterbody or segment within a waterbody on the state’s 303(d) List, DWQ will state the
good cause as defined earlier in this document and provide a more detailed description of the good
cause. Details of the good-cause evaluation process such as the data-analysis work will not be posted
online during the draft public comment period or after the final approval and publication of the final
IR and 303(d) List. DWQ will, however, summarize the data analysis work in the description of the
good cause. The analyses will be available to the public upon request through Utah’s Government
Records Access and Management Act (GRAMA) requirements.
Previous Categorical Listings
303(d) Listings
Without the proper documentation, as described above, to support changing a previous not-
supporting (Category 5) listing decision to a TMDL-approved (Category 4A), pollution control
(Category 4B), non-pollutant impairment (Category 4C), or delisting (demonstration of good cause),
DWQ must continue to list all previous impairments. At a minimum, this includes carrying forward all
waterbodies or segments within a waterbody that were previously not supporting (Category 5),
indicating the cause of impairment, listing the beneficial use (or uses) that is failing to meet water
quality standards, providing the priority of developing a TMDL, and indicating the assessment cycle
the waterbody or segment within the waterbody were first listed.
Non-303(d) Categorical Listings
Where DWQ has the proper documentation to support changing a previous not supporting (Category
5) listing decision to a TMDL-approved (Category 4A), pollution control (Category 4B), non-pollutant
impairment (Category 4C), or delisting (demonstration of good cause), DWQ will do so as outlined by
the policies and procedure described earlier in this document.
Chapter 2: 2016 303(d) Assessment Methods
Draft 2016 IR: version 2.0 Page 90
DWQ will also carry forward all previous categorizations of waterbodies or segments within a
waterbody if the waterbody does not have any credible or representative data from the period of
record of the current assessment cycle (a 6-year period of record). This includes carrying forward the
following:
Previous TMDL-approved (Category 4A), pollution control (Category 4B), and non-pollutant
impairment (Category 4C) categorizations that do not demonstrate good cause as defined
earlier in this document.
Previous categorizations that have insufficient data with exceedances (Category 3A), require
further investigations (Category 3D), have insufficient data with no exceedances (3E), are not
assessed (Category 3F), show no evidence of impairment (Category 2), or are supporting
(Category 1).
Historical Category 3A waters will remain in that category unless there is new data for
assessment.
Waterbodies or segments within a waterbody that are supporting or show no evidence of impairment
(Categories 1 and 2, respectively) may carry forward for six consecutive assessment (or two rotating
basin) cycles. On the seventh consecutive assessment cycle, DWQ will not continue to carry forward a
supporting or no evidence of impairment categorization for waterbodies or segment within a
waterbody that do not have any new data collected in the last 12 years. As noted earlier in this
document, data older than a 12-year period of record may not be reflective of current condition, and
will not be used for assessment purposes unless there is information or a rationale with supporting
documentation that shows the data are reflective of current conditions.
If there is evidence that the data are reflective of current conditions, the previous supporting
(Category 1) or no evidence of impairment (Category 2) categorization will carry forward for one
more assessment cycle (the current one) and be re-evaluated in the next cycle. If there is no or not
enough supporting evidence that the data are reflective of current conditions, DWQ will not carry
forward the supporting or no evidence of impairment categorization for a seventh consecutive
assessment cycle. Instead, DWQ will change the categorization to insufficient data no exceedances
(Category 3E) to prioritize and encourage DWQ and stakeholders to collect newer information and submit
that data and information in future calls for data.
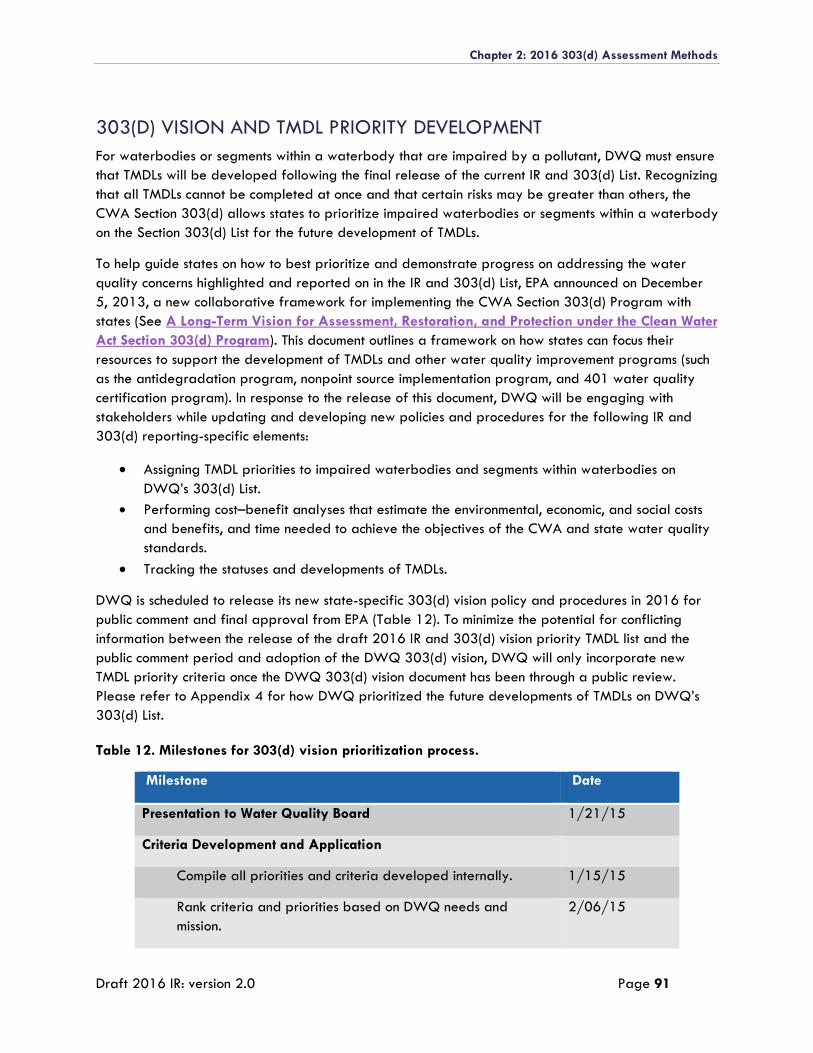
Chapter 2: 2016 303(d) Assessment Methods
Draft 2016 IR: version 2.0 Page 91
303(D) VISION AND TMDL PRIORITY DEVELOPMENT
For waterbodies or segments within a waterbody that are impaired by a pollutant, DWQ must ensure
that TMDLs will be developed following the final release of the current IR and 303(d) List. Recognizing
that all TMDLs cannot be completed at once and that certain risks may be greater than others, the
CWA Section 303(d) allows states to prioritize impaired waterbodies or segments within a waterbody
on the Section 303(d) List for the future development of TMDLs.
To help guide states on how to best prioritize and demonstrate progress on addressing the water
quality concerns highlighted and reported on in the IR and 303(d) List, EPA announced on December
5, 2013, a new collaborative framework for implementing the CWA Section 303(d) Program with
states (See A Long-Term Vision for Assessment, Restoration, and Protection under the Clean Water
Act Section 303(d) Program). This document outlines a framework on how states can focus their
resources to support the development of TMDLs and other water quality improvement programs (such
as the antidegradation program, nonpoint source implementation program, and 401 water quality
certification program). In response to the release of this document, DWQ will be engaging with
stakeholders while updating and developing new policies and procedures for the following IR and
303(d) reporting-specific elements:
Assigning TMDL priorities to impaired waterbodies and segments within waterbodies on
DWQ’s 303(d) List.
Performing cost–benefit analyses that estimate the environmental, economic, and social costs
and benefits, and time needed to achieve the objectives of the CWA and state water quality
standards.
Tracking the statuses and developments of TMDLs.
DWQ is scheduled to release its new state-specific 303(d) vision policy and procedures in 2016 for
public comment and final approval from EPA (Table 12). To minimize the potential for conflicting
information between the release of the draft 2016 IR and 303(d) vision priority TMDL list and the
public comment period and adoption of the DWQ 303(d) vision, DWQ will only incorporate new
TMDL priority criteria once the DWQ 303(d) vision document has been through a public review.
Please refer to Appendix 4 for how DWQ prioritized the future developments of TMDLs on DWQ’s
303(d) List.
Table 12. Milestones for 303(d) vision prioritization process.
Milestone Date
Presentation to Water Quality Board 1/21/15
Criteria Development and Application
Compile all priorities and criteria developed internally. 1/15/15
Rank criteria and priorities based on DWQ needs and
mission.
2/06/15
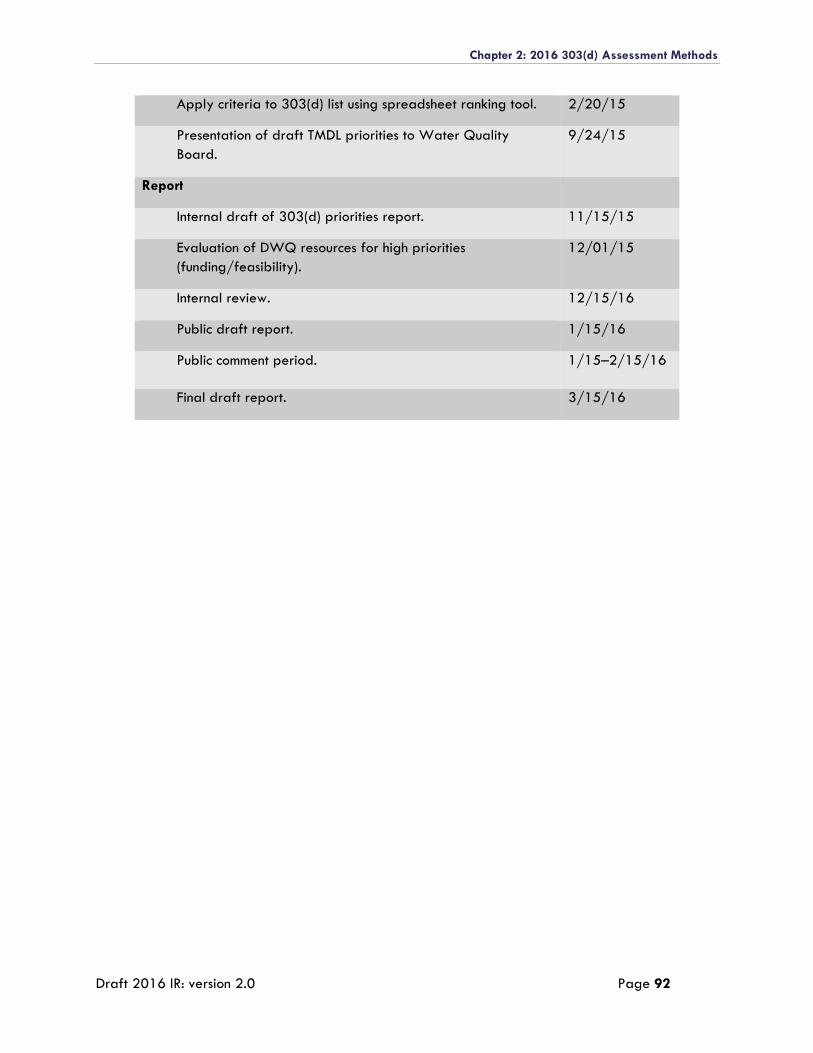
Chapter 2: 2016 303(d) Assessment Methods
Draft 2016 IR: version 2.0 Page 92
Apply criteria to 303(d) list using spreadsheet ranking tool. 2/20/15
Presentation of draft TMDL priorities to Water Quality
Board.
9/24/15
Report
Internal draft of 303(d) priorities report. 11/15/15
Evaluation of DWQ resources for high priorities
(funding/feasibility).
12/01/15
Internal review. 12/15/16
Public draft report. 1/15/16
Public comment period. 1/15–2/15/16
Final draft report. 3/15/16
Chapter 2: 2016 303(d) Assessment Methods
Draft 2016 IR: version 2.0 Page 93
REVISION REQUESTS BETWEEN CYCLES
Barring unforeseen circumstances, DWQ will only propose to revise the IR and 303(d) List during the
regularly scheduled reviews, which are currently biennially and on even-numbered years. Interested
persons may petition DWQ at any time to request a revision to the IR and 303(d) List, whether it is
an addition or deletion to the final 303(d) List. However, such revisions may only be considered if
failing to either add a segment to the list or delete a segment from the list before the next scheduled
review will result in a substantial hardship to the party or parties requesting the revision(s). If such
hardship is shown, DWQ will take the potential revision under strong consideration and begin a
dialogue with the interested party or parties and EPA.
Chapter 2: 2016 303(d) Assessment Methods
Draft 2016 IR: version 2.0 Page 94
LITERATURE CITED
Carlson, R.E. 1977. A Trophic Status Index for Lakes. Limnology and Oceanography 22:361–364.
Clarke, R.T., M.T. Furse, J.F. Wright, and D. Moss. 1996. Derivation of a biological quality index for river sites: comparison of the observed with the expected fauna. Journal of Applied Statistics 23:311–332.
Davies, N.M, R.H. Norris, and M.C. Thoms. 2000. Prediction and assessment of local stream habitat features using large-scale catchment characteristics. Freshwater Biology 45:343–369.
Feldman, D. 2006. A Report to the DEQ Water Quality Planning Bureau on the Proper Interpretation of Two Recently Developed Bioassessment Models. Helena, Montana: Montana Department of Environmental Quality.
Furse, M.T., D. Moss, J.F. Wright, and P.D. Armitage. 1984. The influence of seasonal and taxonomic factors on the ordination and classification of running-water sites in Great Britain and on the prediction of their macro-invertebrate communities. Freshwater Biology 14:257–280.
Hargett, E.G., J.R. ZumBerge, and C.P. Hawkins. 2005. Development of a RIVPACS Model for Wadable Streams of Wyoming. Wyoming Department of Environmental Quality, Water Quality Division.
Hawkins, C.P. 2004. Predictive Model Assessments: A Primer. The Western Center for Monitoring and Assessment of Freshwater Ecosystems, Utah State University, 29 September 2004. Available at: https://qcnr.usu.edu/wmc/predictive_models/model_primer.
Hawkins, C.P., 2006. Quantifying biological integrity by taxonomic completeness: its utility in regional and global assessments. Ecological Applications, 16(4), pp.1277-1294.
Hawkins, C.P., and D.M. Carlisle. 2001. Use of Predictive Models for Assessing the Biological Integrity of Wetlands and Other Aquatic Habitats. In Bioassessment and Management of North American Freshwater Wetlands, edited by Russell B. Rader, Darold P. Batzer, and Scott A. Wissinger. Hoboken, New Jersey: John Wiley & Sons, Inc.
Hawkins, C.P., Cao, Y. and Roper, B., 2010. Method of predicting reference condition biota affects the performance and interpretation of ecological indices. Freshwater Biology, 55(5), pp.1066-1085.
Hawkins, C.P., Mykrä, H., Oksanen, J. and Vander Laan, J.J., 2015. Environmental disturbance can increase beta diversity of stream macroinvertebrate assemblages. Global Ecology and Biogeography, 24(4), pp.483-494.
Hawkins, C.P, R.H. Norris, J.N. Hogue, and J.W. Feminella. 2000. Development and evaluation of predictive models for measuring the biological integrity of streams. Ecological Applications 10:1456–1477.
Hawkins, C.P., Olson, J.R. and Hill, R.A., 2010. The reference condition: predicting benchmarks for ecological and water-quality assessments. Journal of the North American Benthological Society, 29(1), pp.312-343.
Hawkins, C.P. and Yuan, L.L., 2016. Multitaxon distribution models reveal severe alteration in the regional biodiversity of freshwater invertebrates. Freshwater Science, 35(4), pp.000-000.
Chapter 2: 2016 303(d) Assessment Methods
Draft 2016 IR: version 2.0 Page 95
Hughes, R.M., D.P. Larsen, and J.M. Omernik. 1986. Regional reference sites: a method for assessing stream potential. Environmental Management 5:629–635.
Jessup, B., C.P. Hawkins, and J. Stribling. 2006. Biological Indicators of Stream Condition in Montana Using Benthic Macroinvertebrates. Tetra Tech. Technical report prepared for the Montana Department of Environmental Quality, Helena, Montana.
Karr, J.R. 1981. Assessment of biotic integrity using fish communities. Fisheries 6:21–27.
Karr, J.R., and D.R. Dudley. 1981. Ecological perspectives on water quality goals. Environmental Management 5(1):55–68.
Marchant, R., and G. Hehir. 2002. The use of AUSRIVAS predictive models to assess the response of lotic macroinvertebrates to dams in south-east Australia. Freshwater Biology 43:1022–1050.
Mazor, R.D., Rehn, A.C., Ode, P.R., Engeln, M., Schiff, K.C., Stein, E.D., Gillett, D.J., Herbst, D.B. and Hawkins, C.P., 2016. Bioassessment in complex environments: designing an index for consistent meaning in different settings. Freshwater Science, 35(1), pp.249-271.
Metzeling, L., D. Robinson, S. Perris, and R. Marchant. 2002. Temporal persistence of benthic invertebrate communities in south-eastern Australian streams: taxonomic resolution and implications for the use of predictive models. Marine and Freshwater Research 53:1223–1234.
Moss, D. J.F. Wright, M.T. Furse, and R.T. Clarke. 1999. A comparison of alternative techniques for prediction of the fauna of running-water sites in Great Britain. Freshwater Biology 41:167–181.
Ostermiller, J. D., M. Shupryt, M. A. Baker, B. Neilson, E. B. Gaddis, A. J. Hobson, B. Marshall, T Miller, D. Richards, N. vonStackelberg. 2014. Technical Basis for Utah’s Nutrient Strategy, Draft Report. Utah Division of Water Quality.
Paul, M. J., J. Gerritsen, C.P. Hawkins, and E. Leppo. 2005. Development of Biological Assessment Tools for Colorado. Tetra Tech. Technical report prepared for the Colorado Department of Public Health and Environment, Water Quality Control Division – Monitoring Unit, Denver, Colorado.
Simpson, J.C., and R.H. Norris. 2000. Biological assessment of river quality: development of AusRivAS models and outputs. In Assessing the Biological Quality of Fresh Waters, edited by J.F. Wright, D.W. Sutcliffe, and M.T. Furse, pp. 125–142. Ambleside, United Kingdom: Freshwater Biological Association.
Sudaryanti, S., Y. Trihadiningrum, B.T. Hart, P.E. Davies, C. Humphrey, R.H. Norris, J. Simpson, and L. Thurtell. 2001. Assessment of the biological health of the Brantas River, East Java, Indonesia using the Australian River Assessment System (AUSRIVAS) methodology. Aquatic Ecology 35(2):135–146.
Suplee, M., R. Sada de Suplee, D. Feldman, and T. Laidlaw. 2005. Identification and Assessment of Montana Reference Streams: A Follow-Up and Expansion of the 1992 Benchmark Biology Study. Helena, Montana: Montana Department of Environmental Quality.
U.S. Environmental Protection Agency (EPA). 1985. Guidelines for Deriving Numerical National Water Quality Criteria for the Protection of Aquatic Organisms and their Uses. EPA-PB85-227049.
Chapter 2: 2016 303(d) Assessment Methods
Draft 2016 IR: version 2.0 Page 96
———. 2005. Guidance for 2006 assessment, listing and reporting requirements pursuant to Sections 303(d) and 305(b) of the Clean Water Act. Available at: http://www.epa.gov/owow/tmdl/2006IRG/report/2006irg-report.pdf. Accessed September 19, 2014.
U.S. Geological Survey (USGS). 2006. Guidelines and Standard Procedures for Continuous Water-Quality Monitors: Station Operation, Record Computation, and Data Reporting. Available at: http://pubs.usgs.gov/tm/2006/tm1D3/pdf/TM1D3.pdf. Accessed September 19, 2014.
Utah Division of Water Quality (DWQ). 2014. Quality Assurance Program Plan For Environmental Data Operations. Final Plan. Available at: http://www.deq.utah.gov/Compliance/monitoring/water/docs/2014/05May/DWQ_QAPP_5.1.14_Rev0.pdf. Accessed September 19, 2014.
Van Sickle, J., Larsen, D.P. and Hawkins, C.P., 2007. Exclusion of rare taxa affects performance of the O/E index in bioassessments. Journal of the North American Benthological Society, 26(2), pp.319-331.
Wright, J.F. 1995. Development and use of a system for predicting the macroinvertebrate fauna in flowing waters. Australian Journal of Ecology 20:181–197.
Wright, J.F., M.T. Furse, and P.D. Armitage. 1993. RIVPACS: a technique for evaluating the biological water quality of rivers in the UK. European Water Pollution Control 3:15–25.
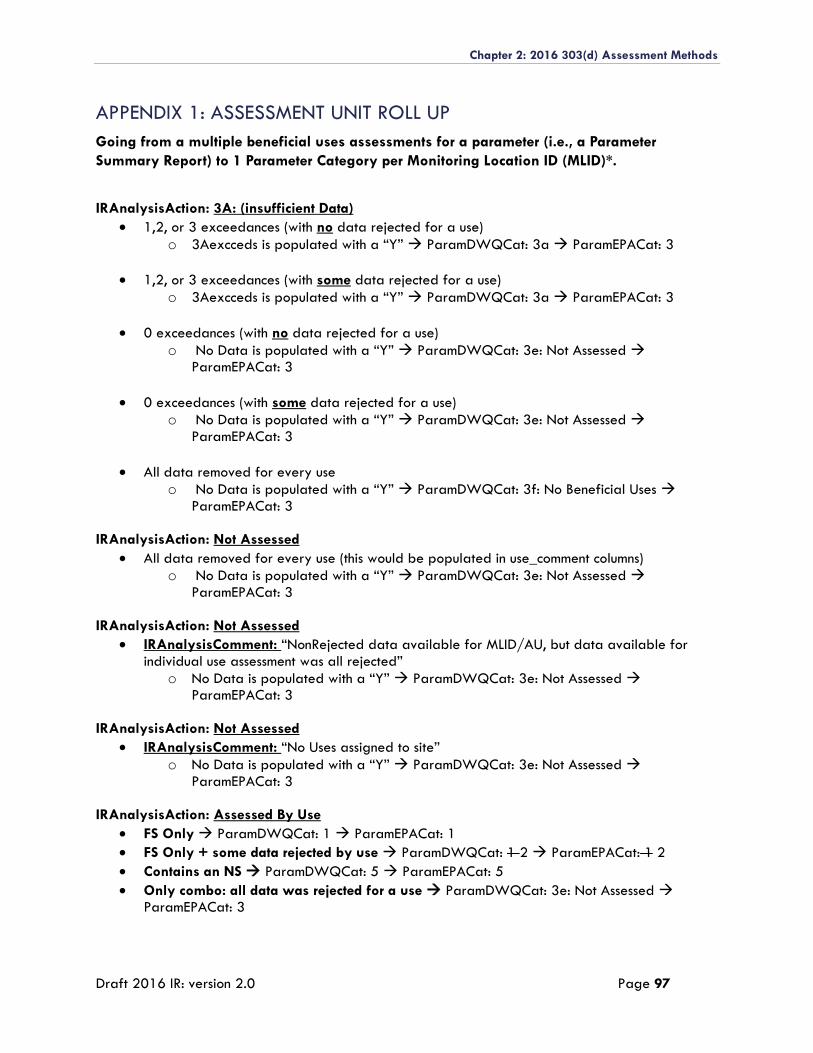
Chapter 2: 2016 303(d) Assessment Methods
Draft 2016 IR: version 2.0 Page 97
APPENDIX 1: ASSESSMENT UNIT ROLL UP
Going from a multiple beneficial uses assessments for a parameter (i.e., a Parameter
Summary Report) to 1 Parameter Category per Monitoring Location ID (MLID)*.
IRAnalysisAction: 3A: (insufficient Data)
1,2, or 3 exceedances (with no data rejected for a use)
o 3Aexcceds is populated with a “Y” ParamDWQCat: 3a ParamEPACat: 3
1,2, or 3 exceedances (with some data rejected for a use)
o 3Aexcceds is populated with a “Y” ParamDWQCat: 3a ParamEPACat: 3
0 exceedances (with no data rejected for a use)
o No Data is populated with a “Y” ParamDWQCat: 3e: Not Assessed ParamEPACat: 3
0 exceedances (with some data rejected for a use)
o No Data is populated with a “Y” ParamDWQCat: 3e: Not Assessed ParamEPACat: 3
All data removed for every use
o No Data is populated with a “Y” ParamDWQCat: 3f: No Beneficial Uses ParamEPACat: 3
IRAnalysisAction: Not Assessed
All data removed for every use (this would be populated in use_comment columns)
o No Data is populated with a “Y” ParamDWQCat: 3e: Not Assessed ParamEPACat: 3
IRAnalysisAction: Not Assessed
IRAnalysisComment: “NonRejected data available for MLID/AU, but data available for individual use assessment was all rejected”
o No Data is populated with a “Y” ParamDWQCat: 3e: Not Assessed ParamEPACat: 3
IRAnalysisAction: Not Assessed
IRAnalysisComment: “No Uses assigned to site”
o No Data is populated with a “Y” ParamDWQCat: 3e: Not Assessed ParamEPACat: 3
IRAnalysisAction: Assessed By Use
FS Only ParamDWQCat: 1 ParamEPACat: 1
FS Only + some data rejected by use ParamDWQCat: 1 2 ParamEPACat: 1 2
Contains an NS ParamDWQCat: 5 ParamEPACat: 5
Only combo: all data was rejected for a use ParamDWQCat: 3e: Not Assessed ParamEPACat: 3
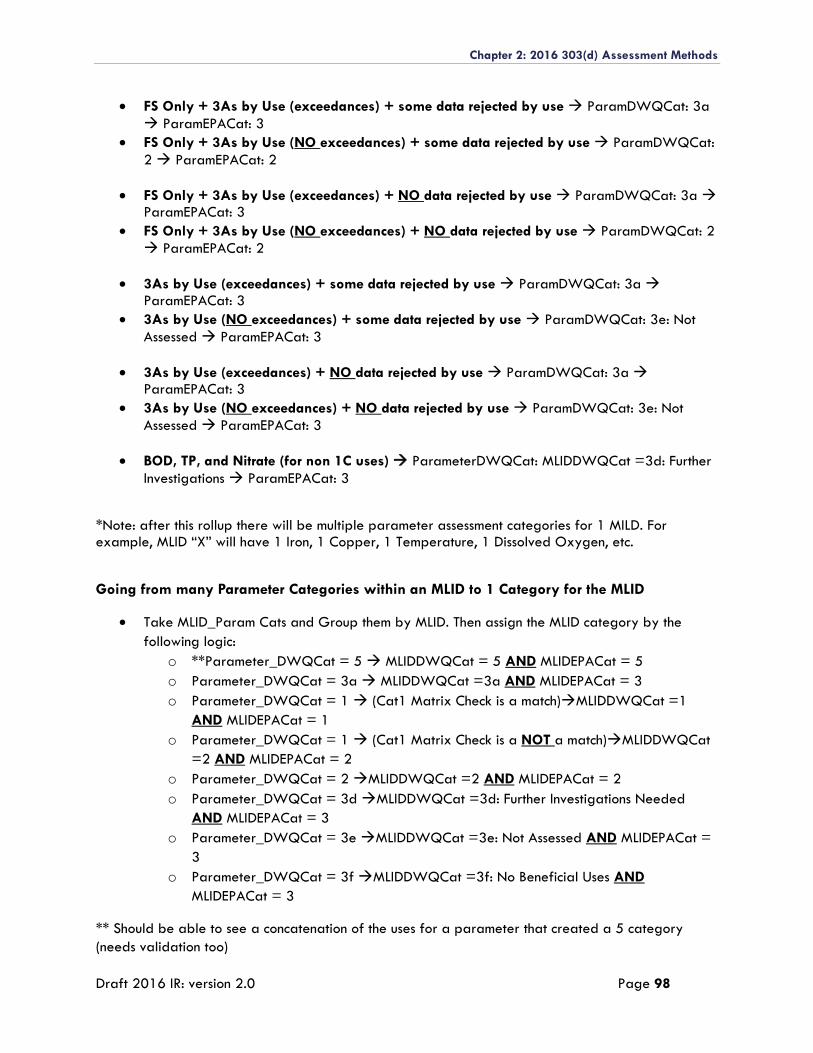
Chapter 2: 2016 303(d) Assessment Methods
Draft 2016 IR: version 2.0 Page 98
FS Only + 3As by Use (exceedances) + some data rejected by use ParamDWQCat: 3a
ParamEPACat: 3
FS Only + 3As by Use (NO exceedances) + some data rejected by use ParamDWQCat:
2 ParamEPACat: 2
FS Only + 3As by Use (exceedances) + NO data rejected by use ParamDWQCat: 3a ParamEPACat: 3
FS Only + 3As by Use (NO exceedances) + NO data rejected by use ParamDWQCat: 2
ParamEPACat: 2
3As by Use (exceedances) + some data rejected by use ParamDWQCat: 3a ParamEPACat: 3
3As by Use (NO exceedances) + some data rejected by use ParamDWQCat: 3e: Not
Assessed ParamEPACat: 3
3As by Use (exceedances) + NO data rejected by use ParamDWQCat: 3a ParamEPACat: 3
3As by Use (NO exceedances) + NO data rejected by use ParamDWQCat: 3e: Not
Assessed ParamEPACat: 3
BOD, TP, and Nitrate (for non 1C uses) ParameterDWQCat: MLIDDWQCat =3d: Further
Investigations ParamEPACat: 3
*Note: after this rollup there will be multiple parameter assessment categories for 1 MILD. For example, MLID “X” will have 1 Iron, 1 Copper, 1 Temperature, 1 Dissolved Oxygen, etc.
Going from many Parameter Categories within an MLID to 1 Category for the MLID
Take MLID_Param Cats and Group them by MLID. Then assign the MLID category by the
following logic:
o **Parameter_DWQCat = 5 MLIDDWQCat = 5 AND MLIDEPACat = 5
o Parameter_DWQCat = 3a MLIDDWQCat =3a AND MLIDEPACat = 3
o Parameter_DWQCat = 1 (Cat1 Matrix Check is a match)MLIDDWQCat =1
AND MLIDEPACat = 1
o Parameter_DWQCat = 1 (Cat1 Matrix Check is a NOT a match)MLIDDWQCat
=2 AND MLIDEPACat = 2
o Parameter_DWQCat = 2 MLIDDWQCat =2 AND MLIDEPACat = 2
o Parameter_DWQCat = 3d MLIDDWQCat =3d: Further Investigations Needed
AND MLIDEPACat = 3
o Parameter_DWQCat = 3e MLIDDWQCat =3e: Not Assessed AND MLIDEPACat =
3
o Parameter_DWQCat = 3f MLIDDWQCat =3f: No Beneficial Uses AND
MLIDEPACat = 3
** Should be able to see a concatenation of the uses for a parameter that created a 5 category
(needs validation too)
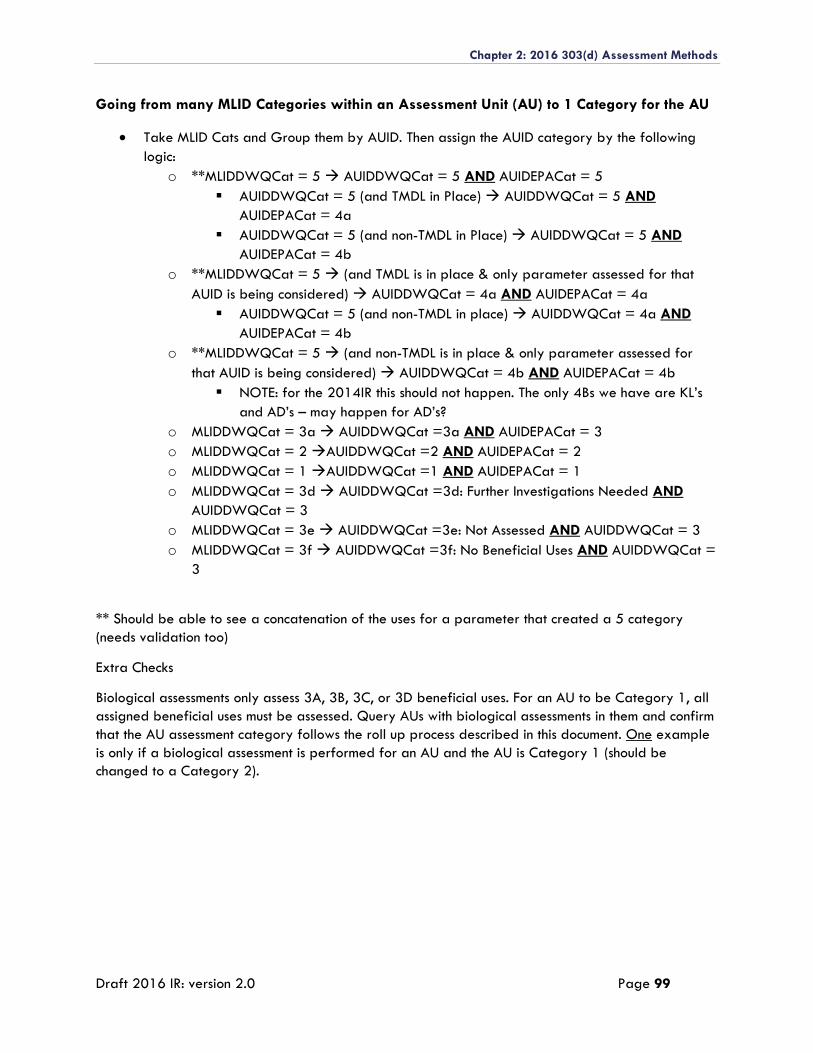
Chapter 2: 2016 303(d) Assessment Methods
Draft 2016 IR: version 2.0 Page 99
Going from many MLID Categories within an Assessment Unit (AU) to 1 Category for the AU
Take MLID Cats and Group them by AUID. Then assign the AUID category by the following
logic:
o **MLIDDWQCat = 5 AUIDDWQCat = 5 AND AUIDEPACat = 5
AUIDDWQCat = 5 (and TMDL in Place) AUIDDWQCat = 5 AND
AUIDEPACat = 4a
AUIDDWQCat = 5 (and non-TMDL in Place) AUIDDWQCat = 5 AND
AUIDEPACat = 4b
o **MLIDDWQCat = 5 (and TMDL is in place & only parameter assessed for that
AUID is being considered) AUIDDWQCat = 4a AND AUIDEPACat = 4a
AUIDDWQCat = 5 (and non-TMDL in place) AUIDDWQCat = 4a AND
AUIDEPACat = 4b
o **MLIDDWQCat = 5 (and non-TMDL is in place & only parameter assessed for
that AUID is being considered) AUIDDWQCat = 4b AND AUIDEPACat = 4b
NOTE: for the 2014IR this should not happen. The only 4Bs we have are KL’s
and AD’s – may happen for AD’s?
o MLIDDWQCat = 3a AUIDDWQCat =3a AND AUIDEPACat = 3
o MLIDDWQCat = 2 AUIDDWQCat =2 AND AUIDEPACat = 2
o MLIDDWQCat = 1 AUIDDWQCat =1 AND AUIDEPACat = 1
o MLIDDWQCat = 3d AUIDDWQCat =3d: Further Investigations Needed AND
AUIDDWQCat = 3
o MLIDDWQCat = 3e AUIDDWQCat =3e: Not Assessed AND AUIDDWQCat = 3
o MLIDDWQCat = 3f AUIDDWQCat =3f: No Beneficial Uses AND AUIDDWQCat =
3
** Should be able to see a concatenation of the uses for a parameter that created a 5 category
(needs validation too)
Extra Checks
Biological assessments only assess 3A, 3B, 3C, or 3D beneficial uses. For an AU to be Category 1, all
assigned beneficial uses must be assessed. Query AUs with biological assessments in them and confirm
that the AU assessment category follows the roll up process described in this document. One example
is only if a biological assessment is performed for an AU and the AU is Category 1 (should be
changed to a Category 2).
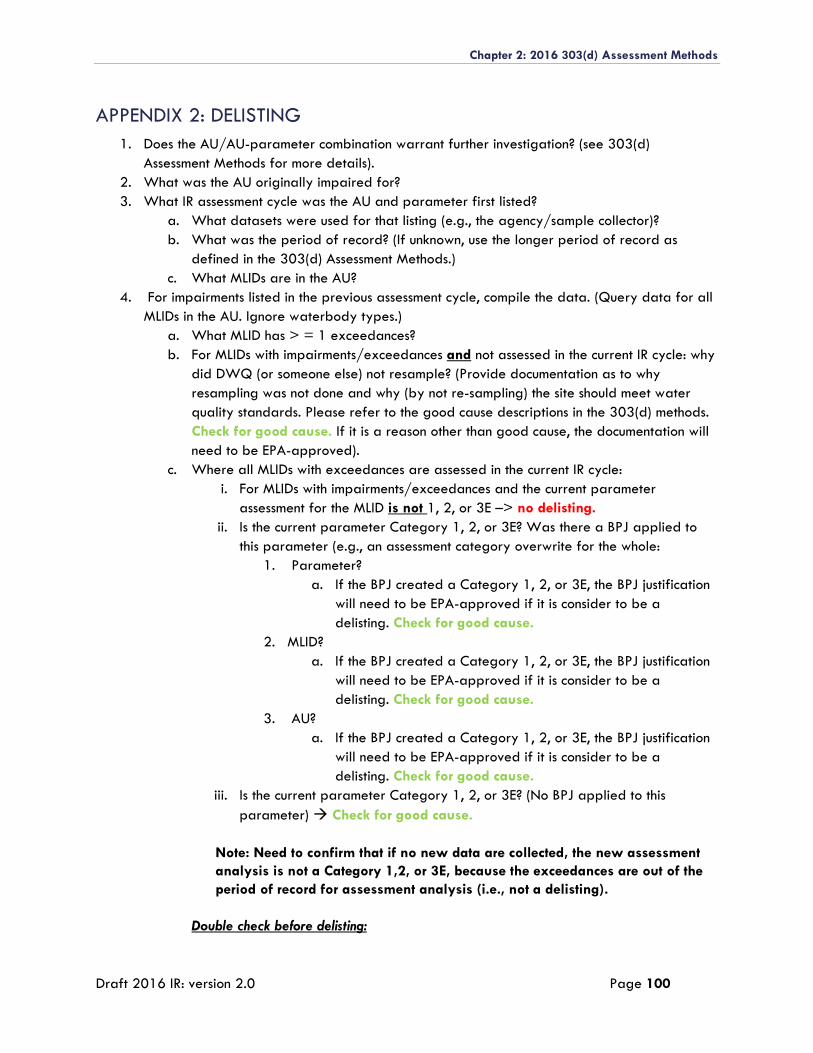
Chapter 2: 2016 303(d) Assessment Methods
Draft 2016 IR: version 2.0 Page 100
APPENDIX 2: DELISTING
1. Does the AU/AU-parameter combination warrant further investigation? (see 303(d)
Assessment Methods for more details).
2. What was the AU originally impaired for?
3. What IR assessment cycle was the AU and parameter first listed?
a. What datasets were used for that listing (e.g., the agency/sample collector)?
b. What was the period of record? (If unknown, use the longer period of record as
defined in the 303(d) Assessment Methods.)
c. What MLIDs are in the AU?
4. For impairments listed in the previous assessment cycle, compile the data. (Query data for all
MLIDs in the AU. Ignore waterbody types.)
a. What MLID has > = 1 exceedances?
b. For MLIDs with impairments/exceedances and not assessed in the current IR cycle: why
did DWQ (or someone else) not resample? (Provide documentation as to why
resampling was not done and why (by not re-sampling) the site should meet water
quality standards. Please refer to the good cause descriptions in the 303(d) methods.
Check for good cause. If it is a reason other than good cause, the documentation will
need to be EPA-approved).
c. Where all MLIDs with exceedances are assessed in the current IR cycle:
i. For MLIDs with impairments/exceedances and the current parameter
assessment for the MLID is not 1, 2, or 3E –> no delisting.
ii. Is the current parameter Category 1, 2, or 3E? Was there a BPJ applied to
this parameter (e.g., an assessment category overwrite for the whole:
1. Parameter?
a. If the BPJ created a Category 1, 2, or 3E, the BPJ justification
will need to be EPA-approved if it is consider to be a
delisting. Check for good cause.
2. MLID?
a. If the BPJ created a Category 1, 2, or 3E, the BPJ justification
will need to be EPA-approved if it is consider to be a
delisting. Check for good cause.
3. AU?
a. If the BPJ created a Category 1, 2, or 3E, the BPJ justification
will need to be EPA-approved if it is consider to be a
delisting. Check for good cause.
iii. Is the current parameter Category 1, 2, or 3E? (No BPJ applied to this
parameter) Check for good cause.
Note: Need to confirm that if no new data are collected, the new assessment
analysis is not a Category 1,2, or 3E, because the exceedances are out of the
period of record for assessment analysis (i.e., not a delisting).
Double check before delisting:
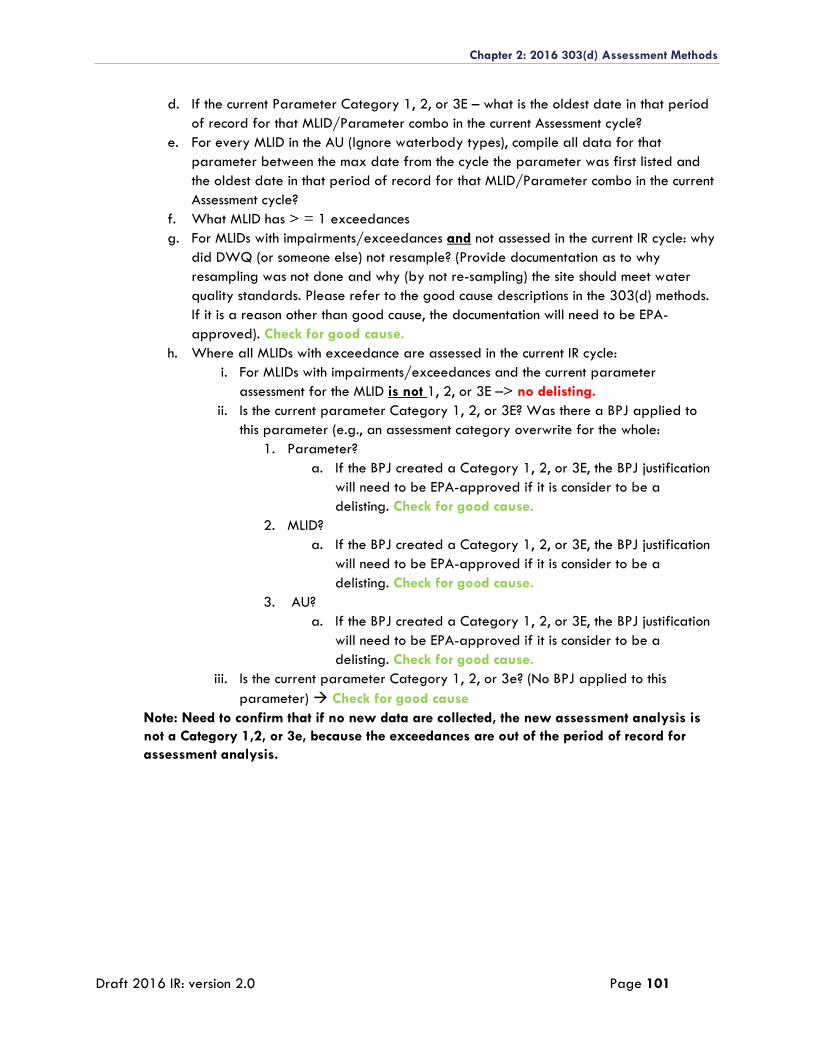
Chapter 2: 2016 303(d) Assessment Methods
Draft 2016 IR: version 2.0 Page 101
d. If the current Parameter Category 1, 2, or 3E – what is the oldest date in that period
of record for that MLID/Parameter combo in the current Assessment cycle?
e. For every MLID in the AU (Ignore waterbody types), compile all data for that
parameter between the max date from the cycle the parameter was first listed and
the oldest date in that period of record for that MLID/Parameter combo in the current
Assessment cycle?
f. What MLID has > = 1 exceedances
g. For MLIDs with impairments/exceedances and not assessed in the current IR cycle: why
did DWQ (or someone else) not resample? (Provide documentation as to why
resampling was not done and why (by not re-sampling) the site should meet water
quality standards. Please refer to the good cause descriptions in the 303(d) methods.
If it is a reason other than good cause, the documentation will need to be EPA-
approved). Check for good cause.
h. Where all MLIDs with exceedance are assessed in the current IR cycle:
i. For MLIDs with impairments/exceedances and the current parameter
assessment for the MLID is not 1, 2, or 3E –> no delisting.
ii. Is the current parameter Category 1, 2, or 3E? Was there a BPJ applied to
this parameter (e.g., an assessment category overwrite for the whole:
1. Parameter?
a. If the BPJ created a Category 1, 2, or 3E, the BPJ justification
will need to be EPA-approved if it is consider to be a
delisting. Check for good cause.
2. MLID?
a. If the BPJ created a Category 1, 2, or 3E, the BPJ justification
will need to be EPA-approved if it is consider to be a
delisting. Check for good cause.
3. AU?
a. If the BPJ created a Category 1, 2, or 3E, the BPJ justification
will need to be EPA-approved if it is consider to be a
delisting. Check for good cause.
iii. Is the current parameter Category 1, 2, or 3e? (No BPJ applied to this
parameter) Check for good cause
Note: Need to confirm that if no new data are collected, the new assessment analysis is
not a Category 1,2, or 3e, because the exceedances are out of the period of record for
assessment analysis.
Chapter 2: 2016 303(d) Assessment Methods
Draft 2016 IR: version 2.0 Page 102
APPENDIX 3: 4B SUBMISSION POLICIES AND PROCEDURES
Process for Determining Category 4B Classification
An alternative to listing an impaired segment on the state’s 303(d) List is an approved Category 4B
demonstration plan. A Category 4B demonstration plan, when implemented, must ensure attainment
with all applicable water quality standards through agreed-upon pollution-control mechanisms
within a reasonable time period. These pollution-control mechanisms can include approved
compliance schedules for capital improvements or plans enforceable under other environmental
statutes (such as Comprehensive Environmental Response, Compensation, and Liability Act) and their
associated regulations. A Category 4B demonstration can be used for segments impaired by point
sources and/or nonpoint sources. Both DWQ and EPA must accept a Category 4B demonstration
plan for the affected segment to be placed in Category 4B. In the event that the Category 4B
demonstration plan is not accepted, the segment at issue will be included on the 303(d) List,
Category 5.
Generally speaking, the following factors will be considered necessary for Category 4B
demonstration plan acceptance: 1) appropriate voluntary, regulatory, or legal authority to
implement the proposed control mechanisms (through permits, grants, compliance orders for Utah
Pollutant Discharge Elimination System permits, etc.); 2) existing commitments by the proponent(s) to
implement the controls; 3) adequate funding; and 4) other relevant factors appropriate to the
segment.
The following evidence must be provided as a rationale for a Category 4B demonstration plan:
1) A statement of the problem causing the impairment. 2) A description of
a. the pollution controls to be used, b. how these pollution controls will achieve attainment with all applicable water quality standards, and c. requirements under which those pollution controls will be implemented.
3) An estimate of the time needed to meet all applicable water quality standards. 4) A schedule for implementation of the necessary pollution controls. 5) A schedule for tracking progress, including a description of milestones. 6) A commitment from the demonstration plan proponent to revise the implementation strategy and pollution controls if progress toward meeting all applicable water quality standards is not shown.
Timing for Proposal Submittal and Acceptance by DWQ and EPA
• Category 4B demonstration plans should be submitted to DWQ by August 30, 2015, in order for
DWQ to submit the plan to EPA by September 6, 2015. Parties are encouraged to work with
DWQ before this date as states are the entity required to submit these plans to EPA.
• Acceptance from EPA must be obtained by October 31, 2015; otherwise, DWQ will continue to
propose that the segment in question is included on the 2016 303(d) List.
Chapter 2: 2016 303(d) Assessment Methods
Draft 2016 IR: version 2.0 Page 103
• If EPA and DWQ accept the Category 4B plan, DWQ will notify the Utah Water Quality Board
and the public through proposed statement of basis and purpose language in its proposal that a
Category 4B demonstration plan is accepted and is appropriate for this segment.
EPA has several documents that contain additional information on Category 4B demonstration
requirements, including: “2006 Integrated Report Guidance,” available at
http://www.epa.gov/OWOW/tmdl/2006IRG/#documents; and “Information Concerning 2008
Clean Water Act Sections 303(d), 305(b), and 314 Integrated Reporting and Listing Decisions,”
available at: http://yosemite.epa.gov/R10/WATER.NSF/TMDLs/CWA+303d+List/.
Chapter 2: 2016 303(d) Assessment Methods
Draft 2016 IR: version 2.0 Page 104
APPENDIX 4: 2014 IR TMDL PRIORITIZATION PROCESS
The Clean Water Act (CWA) requires total maximum daily loads (TMDLs) be developed for all
impaired waterbodies on the 303(d) List. Recognizing the many limitations in data, time, and staff
resources to accomplish this, the CWA also requires states to prioritize where they will dedicate
resources toward TMDL development. However, defining an impaired waterbody as high priority
does not necessarily mean that a TMDL will be developed before lower priority segments. For
some high-priority TMDLs, the development may take considerably longer due to data collection,
stakeholder involvement, and other factors.
The Utah Division of Water Quality (DWQ) prioritizes impairments to human and ecological
health. These priorities translate into the protection and restoration of waters designated for
culinary, recreational, and aquatic wildlife uses. Considerations for TMDL prioritization in Utah
also include the level of partner agency and stakeholder involvement and potential for restoration
as defined by the Recovery Potential Screening tool. Other factors considered in setting TMDL
priorities include programmatic needs such as permitting and addressing watershed-wide water
quality issues.
DWQ is currently engaged in an effort to solicit stakeholder input into the prioritization process as
part of putting the 303(d) vision into action. This effort is related but separate from the
Integrated Report. Public input is critical for the success of the 303(d) vision because it will
promote support for protecting and restoring water quality and define the values that best serve
the public interest.
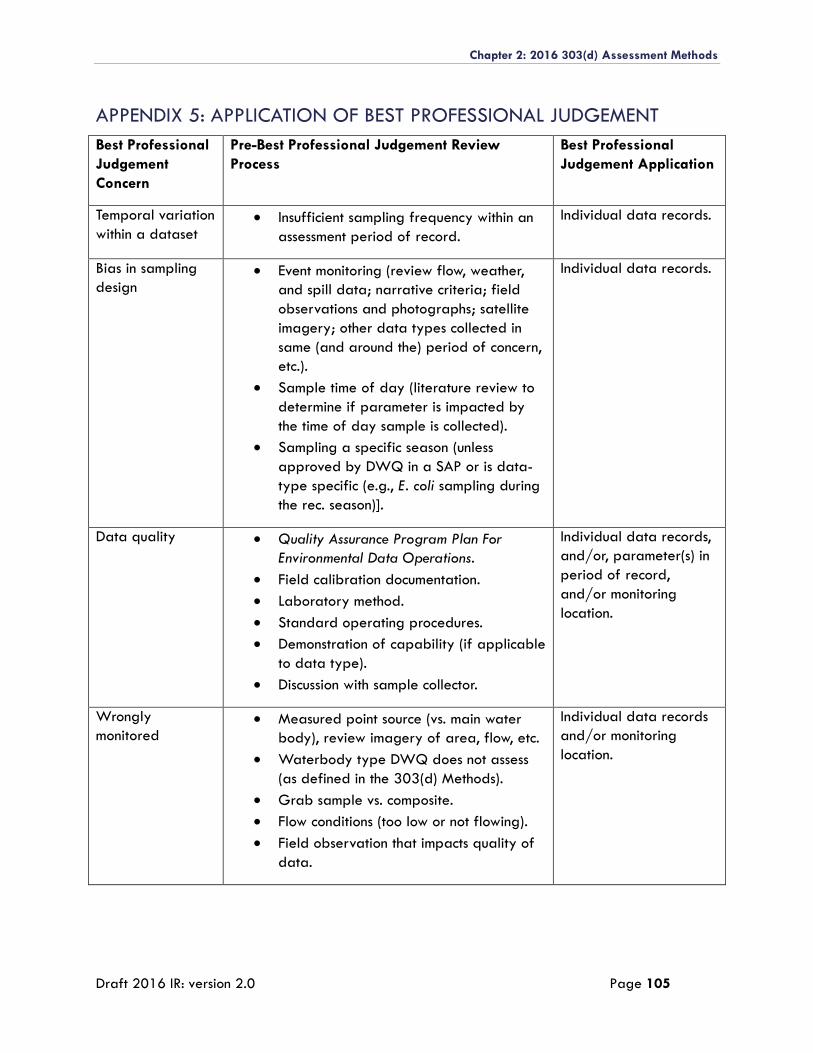
Chapter 2: 2016 303(d) Assessment Methods
Draft 2016 IR: version 2.0 Page 105
APPENDIX 5: APPLICATION OF BEST PROFESSIONAL JUDGEMENT
Best Professional
Judgement
Concern
Pre-Best Professional Judgement Review
Process
Best Professional
Judgement Application
Temporal variation
within a dataset Insufficient sampling frequency within an
assessment period of record.
Individual data records.
Bias in sampling
design Event monitoring (review flow, weather,
and spill data; narrative criteria; field
observations and photographs; satellite
imagery; other data types collected in
same (and around the) period of concern,
etc.).
Sample time of day (literature review to
determine if parameter is impacted by
the time of day sample is collected).
Sampling a specific season (unless
approved by DWQ in a SAP or is data-
type specific (e.g., E. coli sampling during
the rec. season)].
Individual data records.
Data quality Quality Assurance Program Plan For
Environmental Data Operations.
Field calibration documentation.
Laboratory method.
Standard operating procedures.
Demonstration of capability (if applicable
to data type).
Discussion with sample collector.
Individual data records,
and/or, parameter(s) in
period of record,
and/or monitoring
location.
Wrongly
monitored Measured point source (vs. main water
body), review imagery of area, flow, etc.
Waterbody type DWQ does not assess
(as defined in the 303(d) Methods).
Grab sample vs. composite.
Flow conditions (too low or not flowing).
Field observation that impacts quality of
data.
Individual data records
and/or monitoring
location.
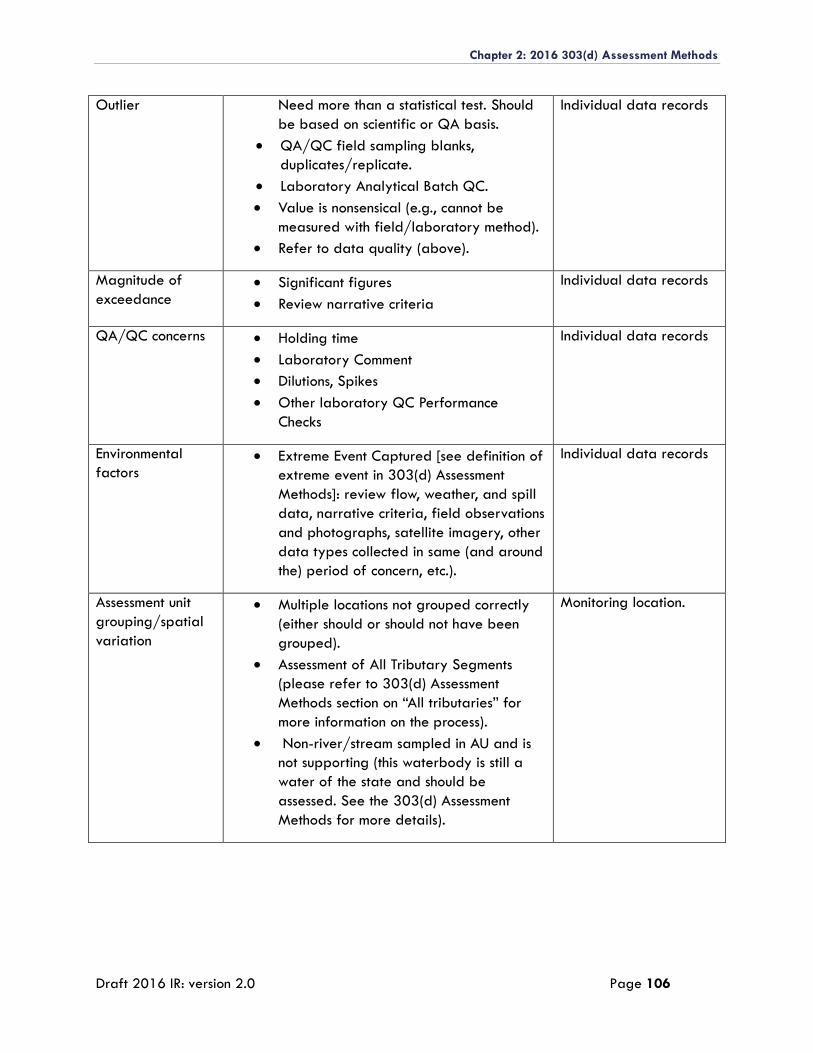
Chapter 2: 2016 303(d) Assessment Methods
Draft 2016 IR: version 2.0 Page 106
Outlier Need more than a statistical test. Should
be based on scientific or QA basis.
QA/QC field sampling blanks,
duplicates/replicate.
Laboratory Analytical Batch QC.
Value is nonsensical (e.g., cannot be
measured with field/laboratory method).
Refer to data quality (above).
Individual data records
Magnitude of
exceedance Significant figures
Review narrative criteria
Individual data records
QA/QC concerns Holding time
Laboratory Comment
Dilutions, Spikes
Other laboratory QC Performance
Checks
Individual data records
Environmental
factors Extreme Event Captured [see definition of
extreme event in 303(d) Assessment
Methods]: review flow, weather, and spill
data, narrative criteria, field observations
and photographs, satellite imagery, other
data types collected in same (and around
the) period of concern, etc.).
Individual data records
Assessment unit
grouping/spatial
variation
Multiple locations not grouped correctly
(either should or should not have been
grouped).
Assessment of All Tributary Segments
(please refer to 303(d) Assessment
Methods section on “All tributaries” for
more information on the process).
Non-river/stream sampled in AU and is
not supporting (this waterbody is still a
water of the state and should be
assessed. See the 303(d) Assessment
Methods for more details).
Monitoring location.
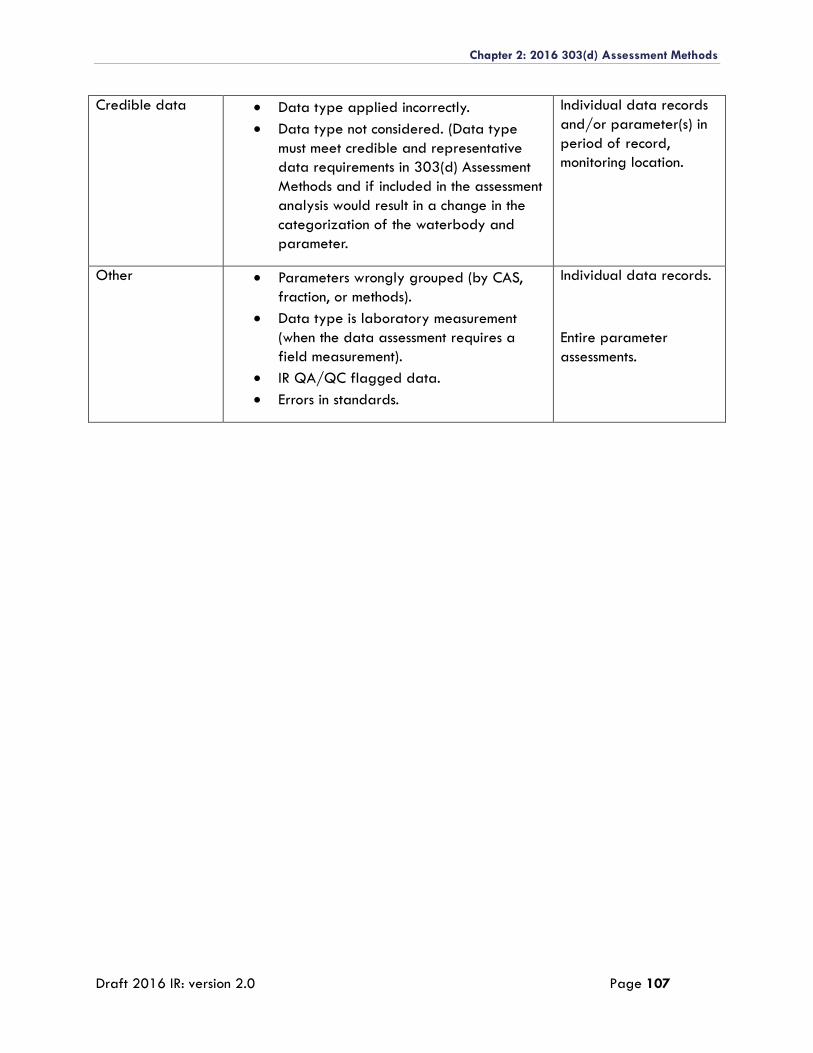
Chapter 2: 2016 303(d) Assessment Methods
Draft 2016 IR: version 2.0 Page 107
Credible data Data type applied incorrectly.
Data type not considered. (Data type
must meet credible and representative
data requirements in 303(d) Assessment
Methods and if included in the assessment
analysis would result in a change in the
categorization of the waterbody and
parameter.
Individual data records
and/or parameter(s) in
period of record,
monitoring location.
Other Parameters wrongly grouped (by CAS,
fraction, or methods).
Data type is laboratory measurement
(when the data assessment requires a
field measurement).
IR QA/QC flagged data.
Errors in standards.
Individual data records.
Entire parameter
assessments.
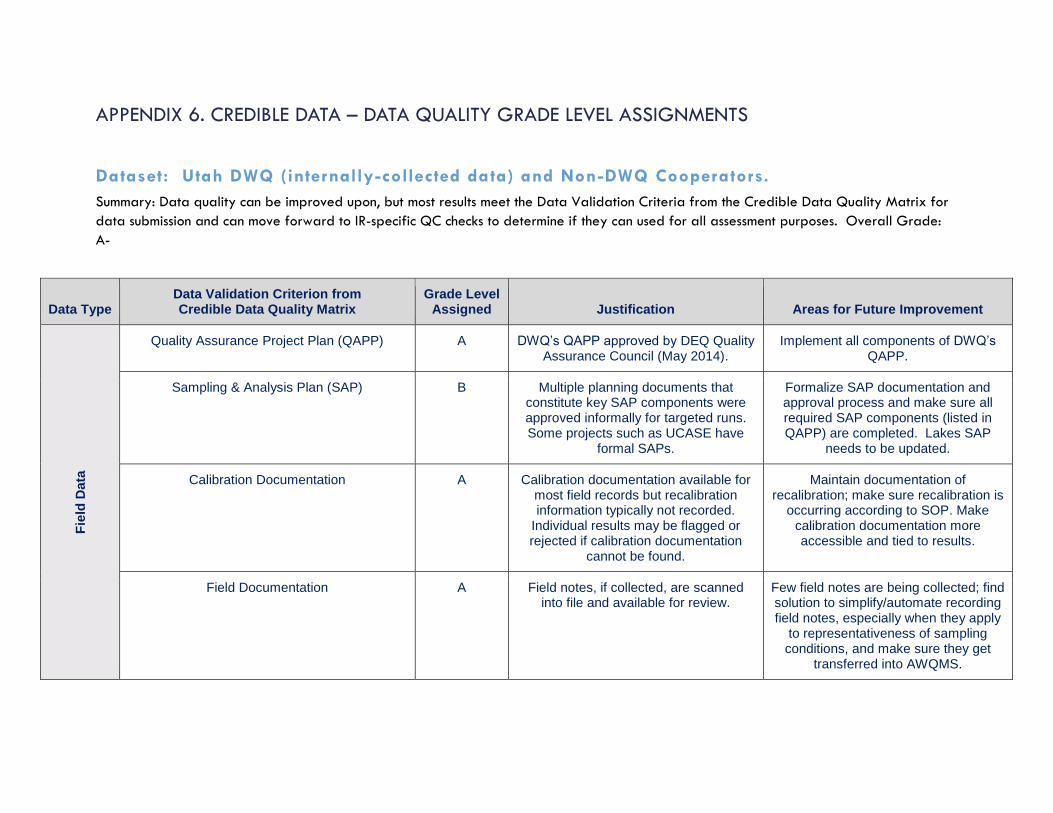
APPENDIX 6. CREDIBLE DATA – DATA QUALITY GRADE LEVEL ASSIGNMENTS
Dataset: Utah DWQ (internally-collected data) and Non-DWQ Cooperators.
Summary: Data quality can be improved upon, but most results meet the Data Validation Criteria from the Credible Data Quality Matrix for
data submission and can move forward to IR-specific QC checks to determine if they can used for all assessment purposes. Overall Grade:
A-
Data Type Data Validation Criterion from Credible Data Quality Matrix
Grade Level Assigned Justification Areas for Future Improvement
Fie
ld D
ata
Quality Assurance Project Plan (QAPP) A DWQ’s QAPP approved by DEQ Quality Assurance Council (May 2014).
Implement all components of DWQ’s QAPP.
Sampling & Analysis Plan (SAP) B Multiple planning documents that constitute key SAP components were approved informally for targeted runs. Some projects such as UCASE have
formal SAPs.
Formalize SAP documentation and approval process and make sure all required SAP components (listed in QAPP) are completed. Lakes SAP
needs to be updated.
Calibration Documentation A Calibration documentation available for most field records but recalibration information typically not recorded.
Individual results may be flagged or rejected if calibration documentation
cannot be found.
Maintain documentation of recalibration; make sure recalibration is
occurring according to SOP. Make calibration documentation more accessible and tied to results.
Field Documentation A Field notes, if collected, are scanned into file and available for review.
Few field notes are being collected; find solution to simplify/automate recording field notes, especially when they apply
to representativeness of sampling conditions, and make sure they get
transferred into AWQMS.
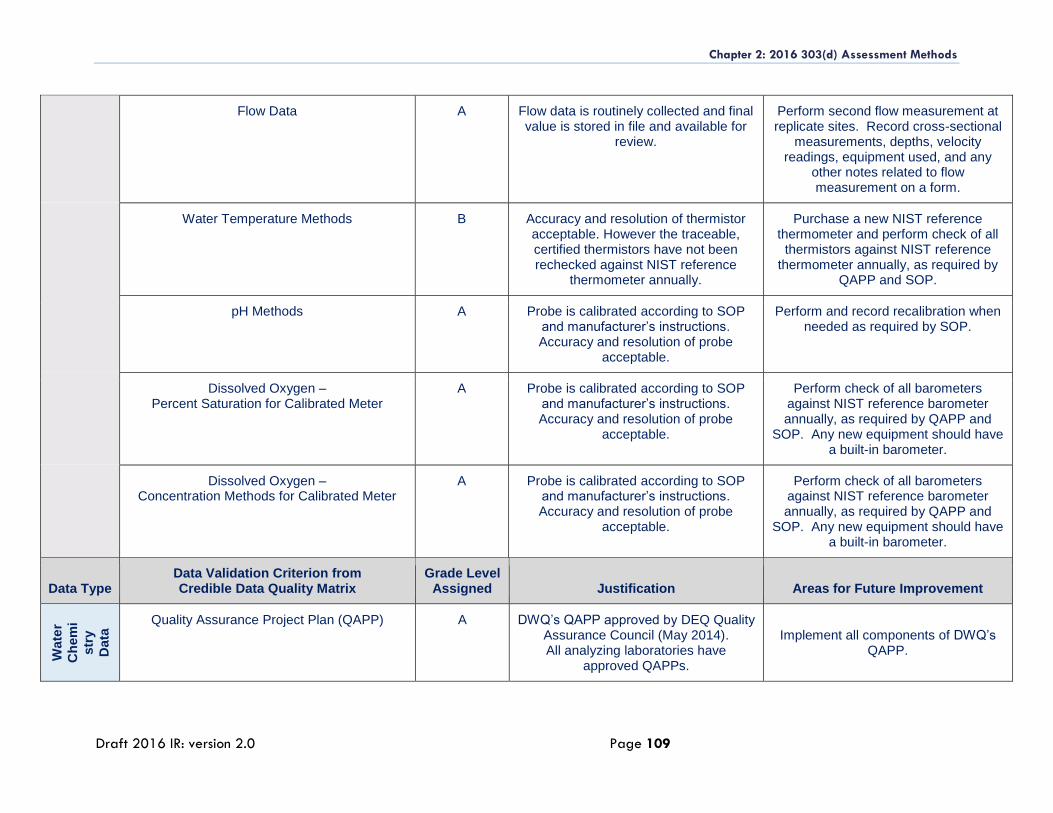
Chapter 2: 2016 303(d) Assessment Methods
Draft 2016 IR: version 2.0 Page 109
Flow Data A Flow data is routinely collected and final value is stored in file and available for
review.
Perform second flow measurement at replicate sites. Record cross-sectional
measurements, depths, velocity readings, equipment used, and any
other notes related to flow measurement on a form.
Water Temperature Methods B Accuracy and resolution of thermistor acceptable. However the traceable, certified thermistors have not been rechecked against NIST reference
thermometer annually.
Purchase a new NIST reference thermometer and perform check of all
thermistors against NIST reference thermometer annually, as required by
QAPP and SOP.
pH Methods A Probe is calibrated according to SOP and manufacturer’s instructions. Accuracy and resolution of probe
acceptable.
Perform and record recalibration when needed as required by SOP.
Dissolved Oxygen – Percent Saturation for Calibrated Meter
A Probe is calibrated according to SOP and manufacturer’s instructions. Accuracy and resolution of probe
acceptable.
Perform check of all barometers against NIST reference barometer annually, as required by QAPP and
SOP. Any new equipment should have a built-in barometer.
Dissolved Oxygen – Concentration Methods for Calibrated Meter
A Probe is calibrated according to SOP and manufacturer’s instructions. Accuracy and resolution of probe
acceptable.
Perform check of all barometers against NIST reference barometer annually, as required by QAPP and
SOP. Any new equipment should have a built-in barometer.
Data Type Data Validation Criterion from Credible Data Quality Matrix
Grade Level Assigned Justification Areas for Future Improvement
Wate
r
Ch
em
i
str
y
Data
Quality Assurance Project Plan (QAPP) A DWQ’s QAPP approved by DEQ Quality Assurance Council (May 2014). All analyzing laboratories have
approved QAPPs.
Implement all components of DWQ’s
QAPP.
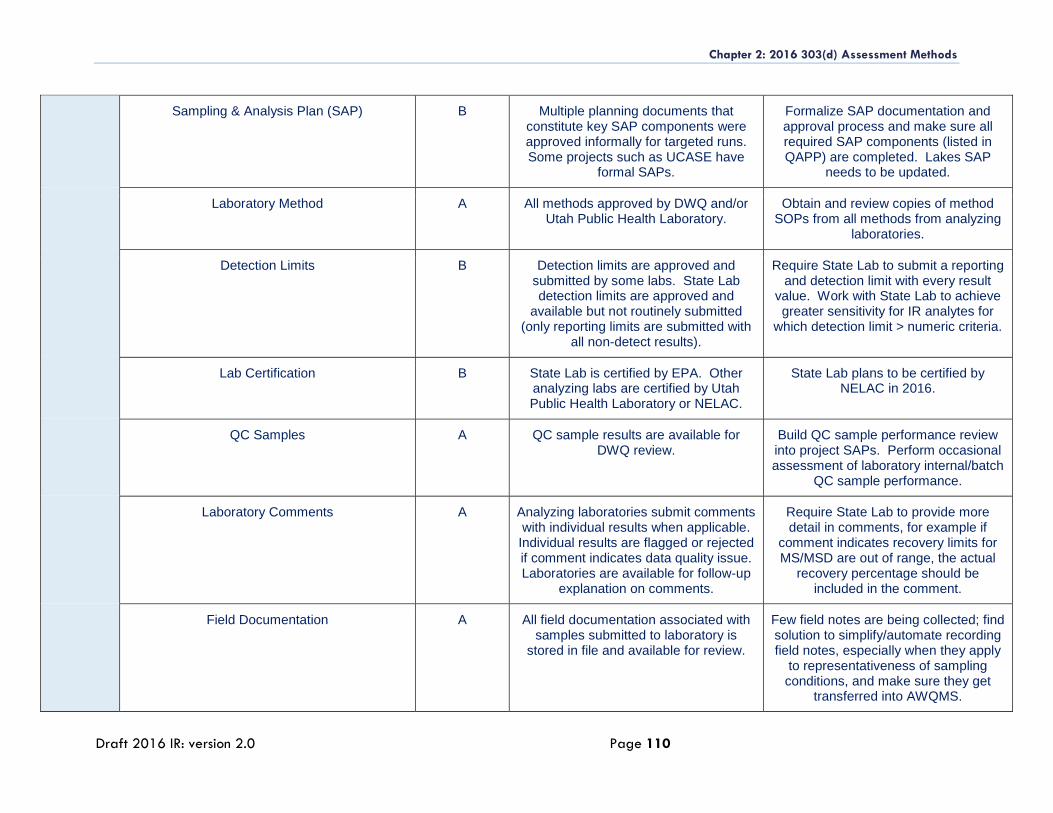
Chapter 2: 2016 303(d) Assessment Methods
Draft 2016 IR: version 2.0 Page 110
Sampling & Analysis Plan (SAP) B Multiple planning documents that constitute key SAP components were approved informally for targeted runs. Some projects such as UCASE have
formal SAPs.
Formalize SAP documentation and approval process and make sure all required SAP components (listed in QAPP) are completed. Lakes SAP
needs to be updated.
Laboratory Method A All methods approved by DWQ and/or Utah Public Health Laboratory.
Obtain and review copies of method SOPs from all methods from analyzing
laboratories.
Detection Limits B Detection limits are approved and submitted by some labs. State Lab detection limits are approved and
available but not routinely submitted (only reporting limits are submitted with
all non-detect results).
Require State Lab to submit a reporting and detection limit with every result
value. Work with State Lab to achieve greater sensitivity for IR analytes for
which detection limit > numeric criteria.
Lab Certification B State Lab is certified by EPA. Other analyzing labs are certified by Utah Public Health Laboratory or NELAC.
State Lab plans to be certified by NELAC in 2016.
QC Samples A QC sample results are available for DWQ review.
Build QC sample performance review into project SAPs. Perform occasional assessment of laboratory internal/batch
QC sample performance.
Laboratory Comments A Analyzing laboratories submit comments with individual results when applicable. Individual results are flagged or rejected if comment indicates data quality issue. Laboratories are available for follow-up
explanation on comments.
Require State Lab to provide more detail in comments, for example if
comment indicates recovery limits for MS/MSD are out of range, the actual
recovery percentage should be included in the comment.
Field Documentation A All field documentation associated with samples submitted to laboratory is
stored in file and available for review.
Few field notes are being collected; find solution to simplify/automate recording field notes, especially when they apply
to representativeness of sampling conditions, and make sure they get
transferred into AWQMS.
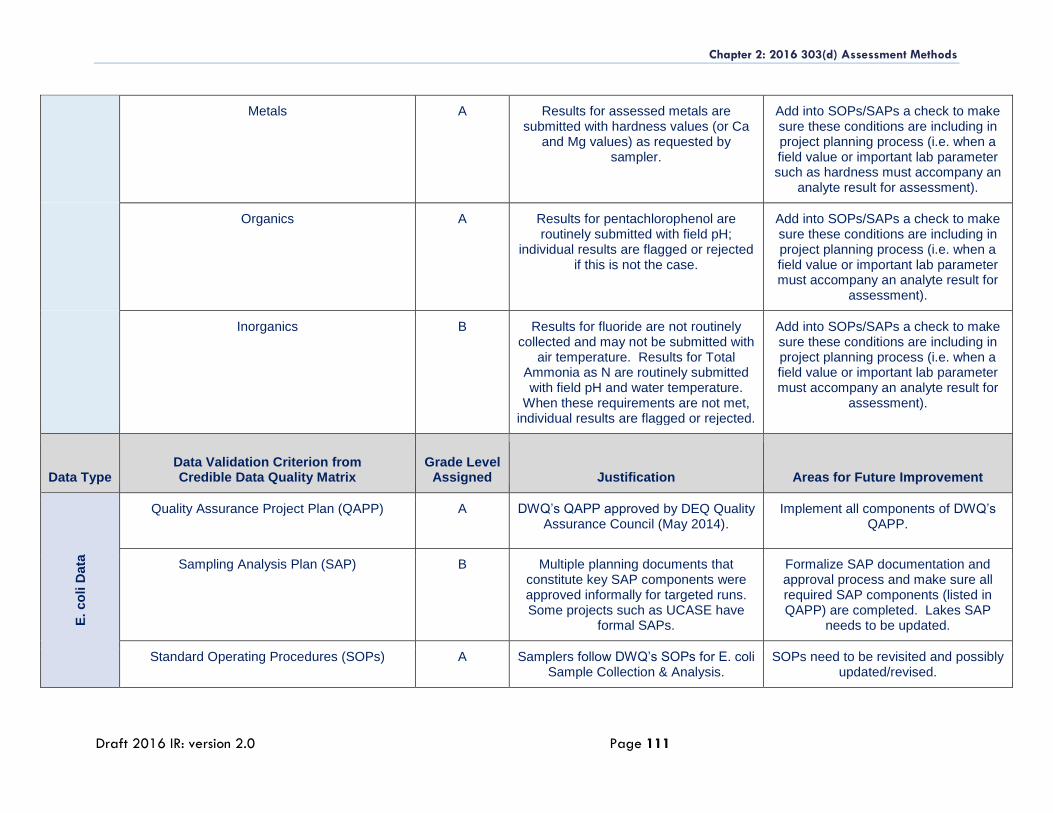
Chapter 2: 2016 303(d) Assessment Methods
Draft 2016 IR: version 2.0 Page 111
Metals A Results for assessed metals are submitted with hardness values (or Ca
and Mg values) as requested by sampler.
Add into SOPs/SAPs a check to make sure these conditions are including in project planning process (i.e. when a field value or important lab parameter such as hardness must accompany an
analyte result for assessment).
Organics A Results for pentachlorophenol are routinely submitted with field pH;
individual results are flagged or rejected if this is not the case.
Add into SOPs/SAPs a check to make sure these conditions are including in project planning process (i.e. when a field value or important lab parameter must accompany an analyte result for
assessment).
Inorganics B Results for fluoride are not routinely collected and may not be submitted with
air temperature. Results for Total Ammonia as N are routinely submitted with field pH and water temperature.
When these requirements are not met, individual results are flagged or rejected.
Add into SOPs/SAPs a check to make sure these conditions are including in project planning process (i.e. when a field value or important lab parameter must accompany an analyte result for
assessment).
Data Type Data Validation Criterion from Credible Data Quality Matrix
Grade Level Assigned Justification Areas for Future Improvement
E. co
li D
ata
Quality Assurance Project Plan (QAPP) A DWQ’s QAPP approved by DEQ Quality Assurance Council (May 2014).
Implement all components of DWQ’s QAPP.
Sampling Analysis Plan (SAP) B Multiple planning documents that constitute key SAP components were approved informally for targeted runs. Some projects such as UCASE have
formal SAPs.
Formalize SAP documentation and approval process and make sure all required SAP components (listed in QAPP) are completed. Lakes SAP
needs to be updated.
Standard Operating Procedures (SOPs) A Samplers follow DWQ’s SOPs for E. coli Sample Collection & Analysis.
SOPs need to be revisited and possibly updated/revised.
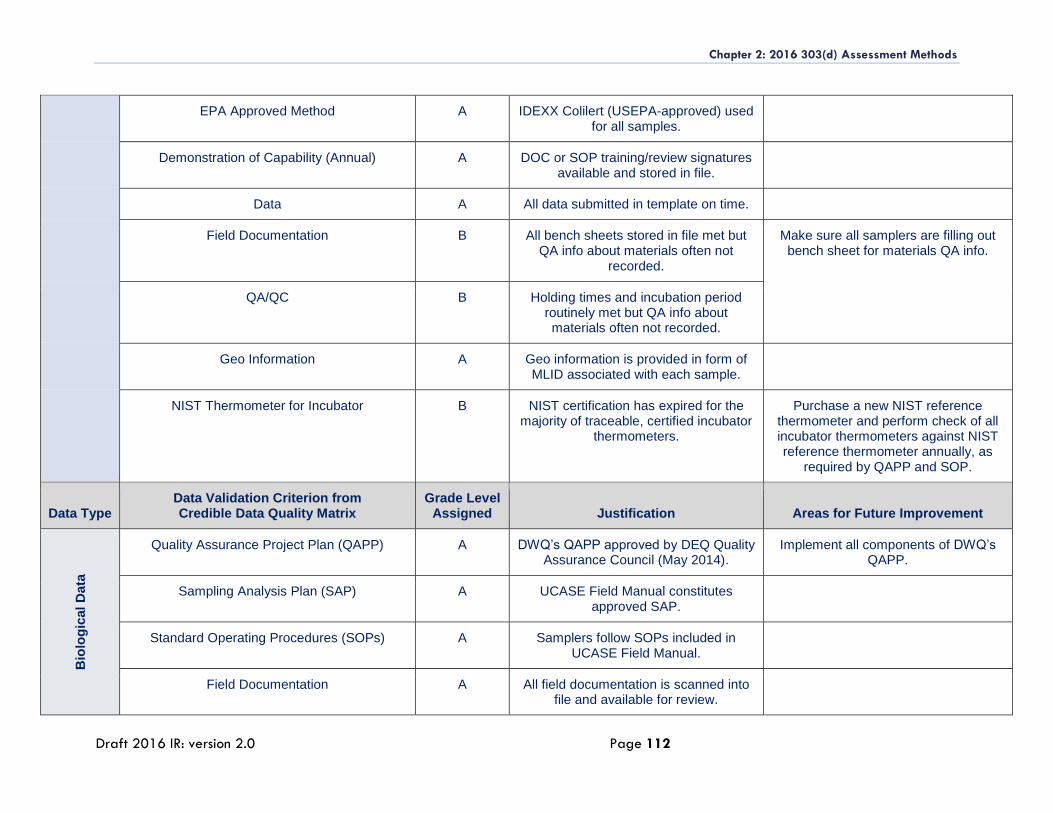
Chapter 2: 2016 303(d) Assessment Methods
Draft 2016 IR: version 2.0 Page 112
EPA Approved Method A IDEXX Colilert (USEPA-approved) used for all samples.
Demonstration of Capability (Annual) A DOC or SOP training/review signatures available and stored in file.
Data A All data submitted in template on time.
Field Documentation B All bench sheets stored in file met but QA info about materials often not
recorded.
Make sure all samplers are filling out bench sheet for materials QA info.
QA/QC B Holding times and incubation period routinely met but QA info about materials often not recorded.
Geo Information A Geo information is provided in form of MLID associated with each sample.
NIST Thermometer for Incubator B NIST certification has expired for the majority of traceable, certified incubator
thermometers.
Purchase a new NIST reference thermometer and perform check of all incubator thermometers against NIST reference thermometer annually, as
required by QAPP and SOP.
Data Type Data Validation Criterion from Credible Data Quality Matrix
Grade Level Assigned Justification Areas for Future Improvement
Bio
log
ical
Data
Quality Assurance Project Plan (QAPP) A DWQ’s QAPP approved by DEQ Quality Assurance Council (May 2014).
Implement all components of DWQ’s QAPP.
Sampling Analysis Plan (SAP) A UCASE Field Manual constitutes approved SAP.
Standard Operating Procedures (SOPs) A Samplers follow SOPs included in UCASE Field Manual.
Field Documentation A All field documentation is scanned into file and available for review.
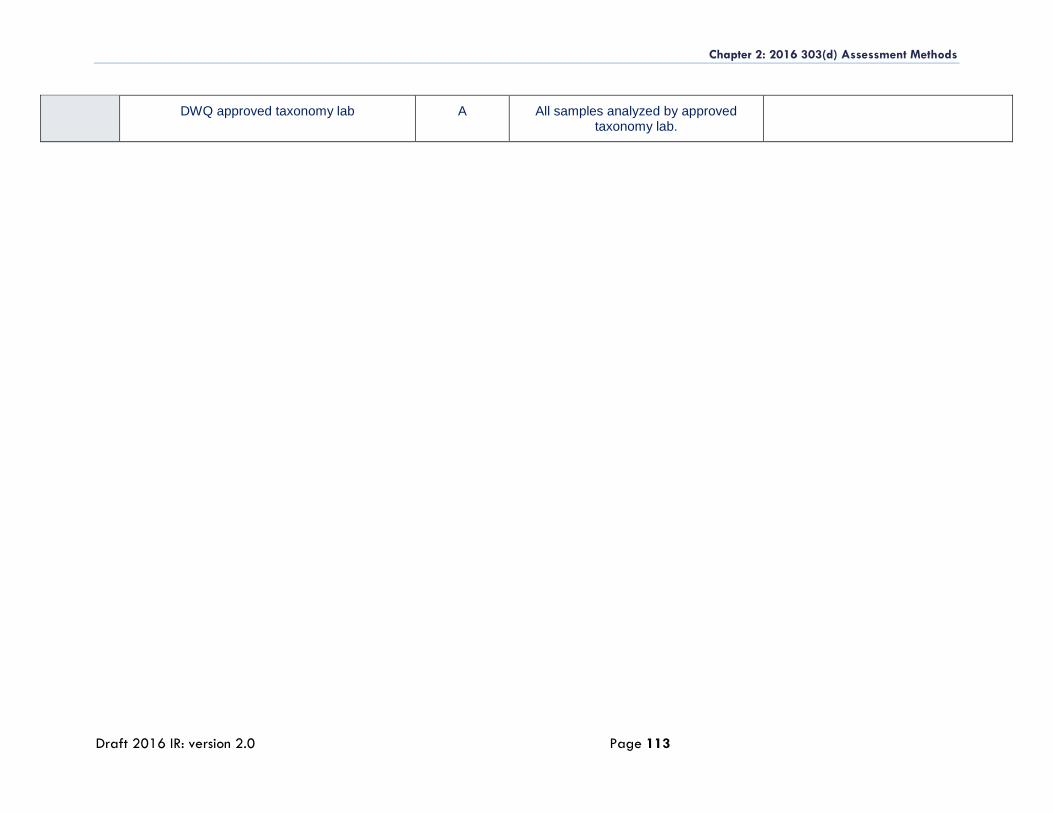
Chapter 2: 2016 303(d) Assessment Methods
Draft 2016 IR: version 2.0 Page 113
DWQ approved taxonomy lab A All samples analyzed by approved taxonomy lab.
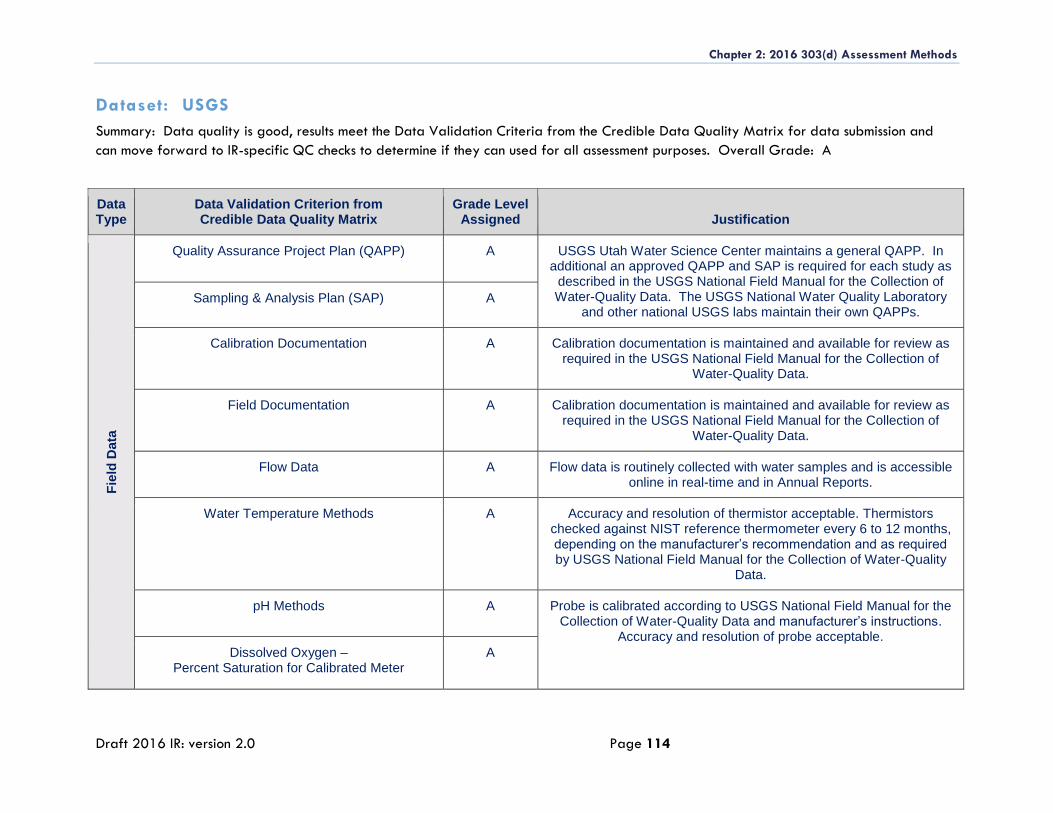
Chapter 2: 2016 303(d) Assessment Methods
Draft 2016 IR: version 2.0 Page 114
Dataset: USGS
Summary: Data quality is good, results meet the Data Validation Criteria from the Credible Data Quality Matrix for data submission and
can move forward to IR-specific QC checks to determine if they can used for all assessment purposes. Overall Grade: A
Data Type
Data Validation Criterion from Credible Data Quality Matrix
Grade Level Assigned Justification
Fie
ld D
ata
Quality Assurance Project Plan (QAPP) A USGS Utah Water Science Center maintains a general QAPP. In additional an approved QAPP and SAP is required for each study as
described in the USGS National Field Manual for the Collection of Water-Quality Data. The USGS National Water Quality Laboratory
and other national USGS labs maintain their own QAPPs. Sampling & Analysis Plan (SAP) A
Calibration Documentation A Calibration documentation is maintained and available for review as required in the USGS National Field Manual for the Collection of
Water-Quality Data.
Field Documentation A Calibration documentation is maintained and available for review as required in the USGS National Field Manual for the Collection of
Water-Quality Data.
Flow Data A Flow data is routinely collected with water samples and is accessible online in real-time and in Annual Reports.
Water Temperature Methods A Accuracy and resolution of thermistor acceptable. Thermistors checked against NIST reference thermometer every 6 to 12 months, depending on the manufacturer’s recommendation and as required by USGS National Field Manual for the Collection of Water-Quality
Data.
pH Methods A Probe is calibrated according to USGS National Field Manual for the Collection of Water-Quality Data and manufacturer’s instructions.
Accuracy and resolution of probe acceptable.
Dissolved Oxygen – Percent Saturation for Calibrated Meter
A
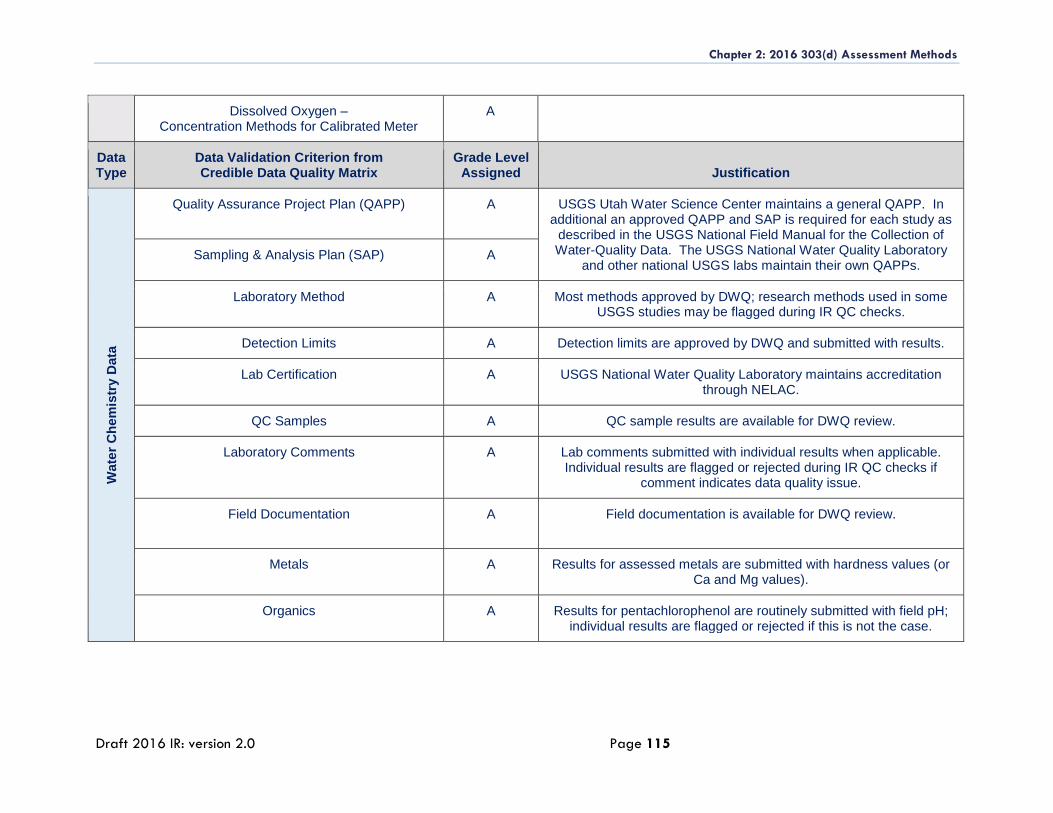
Chapter 2: 2016 303(d) Assessment Methods
Draft 2016 IR: version 2.0 Page 115
Dissolved Oxygen – Concentration Methods for Calibrated Meter
A
Data Type
Data Validation Criterion from Credible Data Quality Matrix
Grade Level Assigned Justification
Wate
r C
hem
istr
y D
ata
Quality Assurance Project Plan (QAPP) A USGS Utah Water Science Center maintains a general QAPP. In additional an approved QAPP and SAP is required for each study as
described in the USGS National Field Manual for the Collection of Water-Quality Data. The USGS National Water Quality Laboratory
and other national USGS labs maintain their own QAPPs. Sampling & Analysis Plan (SAP) A
Laboratory Method A Most methods approved by DWQ; research methods used in some USGS studies may be flagged during IR QC checks.
Detection Limits A Detection limits are approved by DWQ and submitted with results.
Lab Certification A USGS National Water Quality Laboratory maintains accreditation through NELAC.
QC Samples A QC sample results are available for DWQ review.
Laboratory Comments A Lab comments submitted with individual results when applicable. Individual results are flagged or rejected during IR QC checks if
comment indicates data quality issue.
Field Documentation A Field documentation is available for DWQ review.
Metals A Results for assessed metals are submitted with hardness values (or Ca and Mg values).
Organics A Results for pentachlorophenol are routinely submitted with field pH; individual results are flagged or rejected if this is not the case.
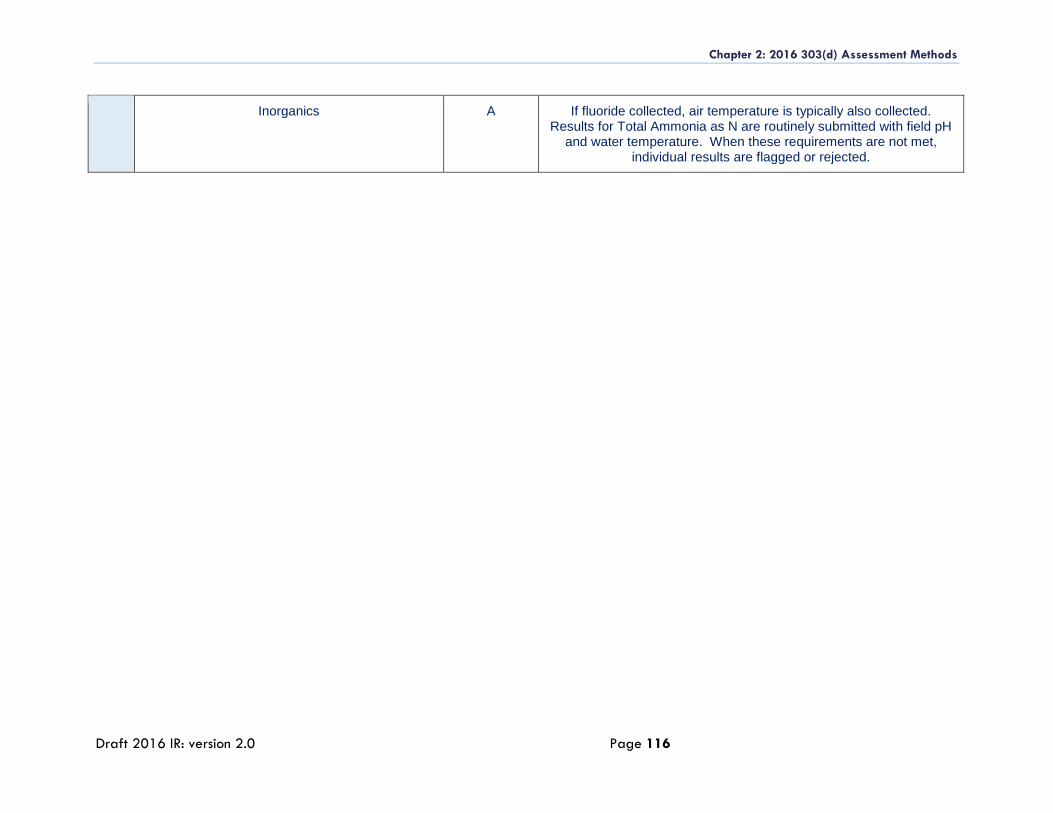
Chapter 2: 2016 303(d) Assessment Methods
Draft 2016 IR: version 2.0 Page 116
Inorganics A If fluoride collected, air temperature is typically also collected. Results for Total Ammonia as N are routinely submitted with field pH
and water temperature. When these requirements are not met, individual results are flagged or rejected.
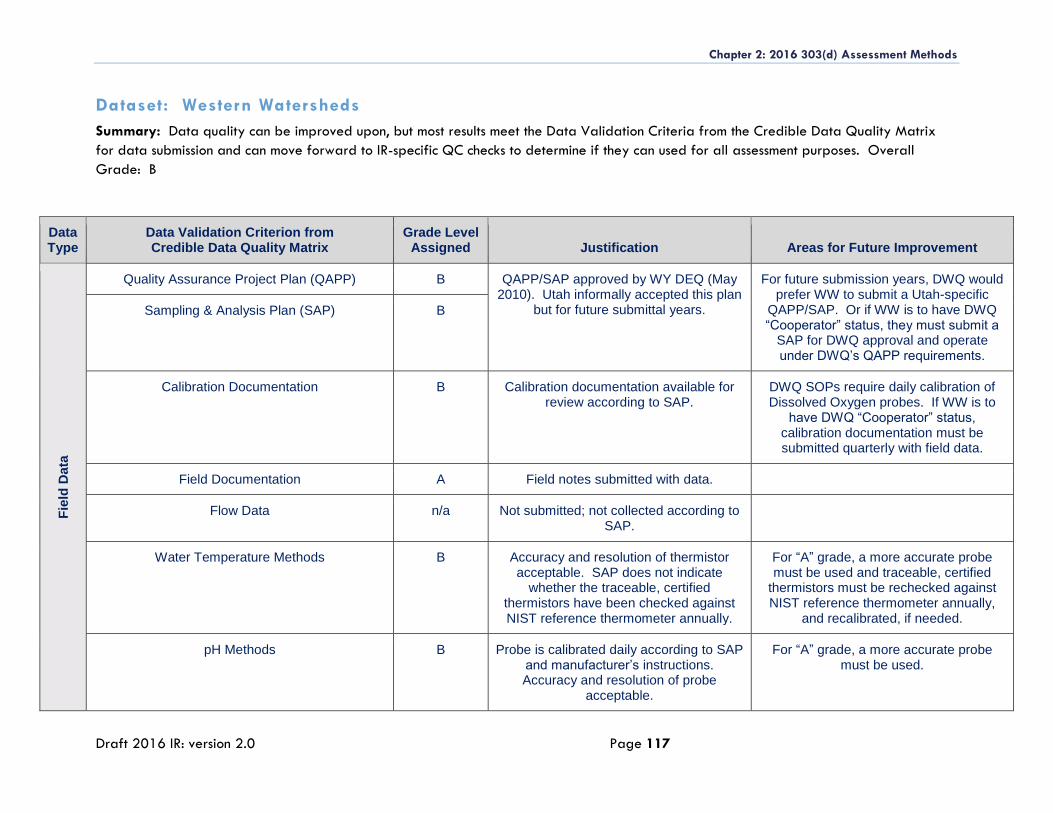
Chapter 2: 2016 303(d) Assessment Methods
Draft 2016 IR: version 2.0 Page 117
Dataset: Western Watersheds
Summary: Data quality can be improved upon, but most results meet the Data Validation Criteria from the Credible Data Quality Matrix
for data submission and can move forward to IR-specific QC checks to determine if they can used for all assessment purposes. Overall
Grade: B
Data Type
Data Validation Criterion from Credible Data Quality Matrix
Grade Level Assigned Justification Areas for Future Improvement
Fie
ld D
ata
Quality Assurance Project Plan (QAPP) B QAPP/SAP approved by WY DEQ (May 2010). Utah informally accepted this plan
but for future submittal years.
For future submission years, DWQ would prefer WW to submit a Utah-specific
QAPP/SAP. Or if WW is to have DWQ “Cooperator” status, they must submit a
SAP for DWQ approval and operate under DWQ’s QAPP requirements.
Sampling & Analysis Plan (SAP) B
Calibration Documentation B Calibration documentation available for review according to SAP.
DWQ SOPs require daily calibration of Dissolved Oxygen probes. If WW is to
have DWQ “Cooperator” status, calibration documentation must be submitted quarterly with field data.
Field Documentation A Field notes submitted with data.
Flow Data n/a Not submitted; not collected according to SAP.
Water Temperature Methods B Accuracy and resolution of thermistor acceptable. SAP does not indicate
whether the traceable, certified thermistors have been checked against NIST reference thermometer annually.
For “A” grade, a more accurate probe must be used and traceable, certified
thermistors must be rechecked against NIST reference thermometer annually,
and recalibrated, if needed.
pH Methods B Probe is calibrated daily according to SAP and manufacturer’s instructions. Accuracy and resolution of probe
acceptable.
For “A” grade, a more accurate probe must be used.
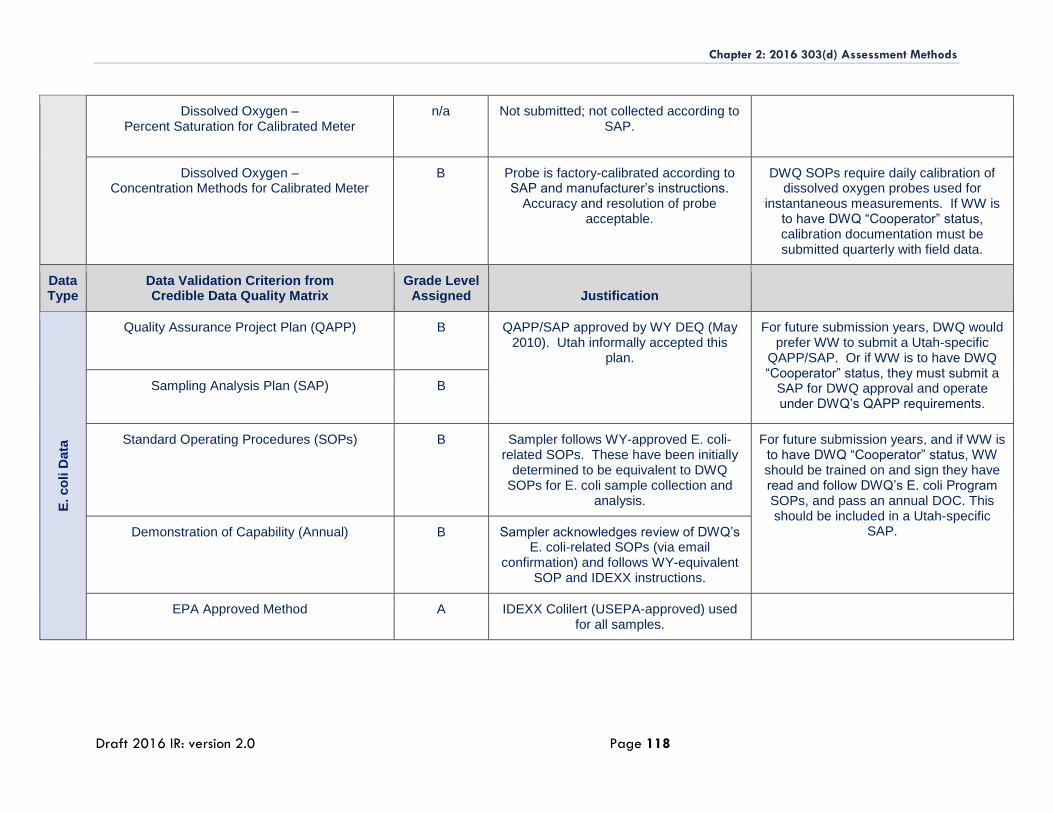
Chapter 2: 2016 303(d) Assessment Methods
Draft 2016 IR: version 2.0 Page 118
Dissolved Oxygen – Percent Saturation for Calibrated Meter
n/a Not submitted; not collected according to SAP.
Dissolved Oxygen – Concentration Methods for Calibrated Meter
B Probe is factory-calibrated according to SAP and manufacturer’s instructions.
Accuracy and resolution of probe acceptable.
DWQ SOPs require daily calibration of dissolved oxygen probes used for
instantaneous measurements. If WW is to have DWQ “Cooperator” status, calibration documentation must be submitted quarterly with field data.
Data Type
Data Validation Criterion from Credible Data Quality Matrix
Grade Level Assigned Justification
E. co
li D
ata
Quality Assurance Project Plan (QAPP) B QAPP/SAP approved by WY DEQ (May 2010). Utah informally accepted this
plan.
For future submission years, DWQ would prefer WW to submit a Utah-specific
QAPP/SAP. Or if WW is to have DWQ “Cooperator” status, they must submit a
SAP for DWQ approval and operate under DWQ’s QAPP requirements.
Sampling Analysis Plan (SAP) B
Standard Operating Procedures (SOPs) B Sampler follows WY-approved E. coli-related SOPs. These have been initially
determined to be equivalent to DWQ SOPs for E. coli sample collection and
analysis.
For future submission years, and if WW is to have DWQ “Cooperator” status, WW should be trained on and sign they have read and follow DWQ’s E. coli Program SOPs, and pass an annual DOC. This should be included in a Utah-specific
SAP. Demonstration of Capability (Annual) B Sampler acknowledges review of DWQ’s E. coli-related SOPs (via email
confirmation) and follows WY-equivalent SOP and IDEXX instructions.
EPA Approved Method A IDEXX Colilert (USEPA-approved) used for all samples.
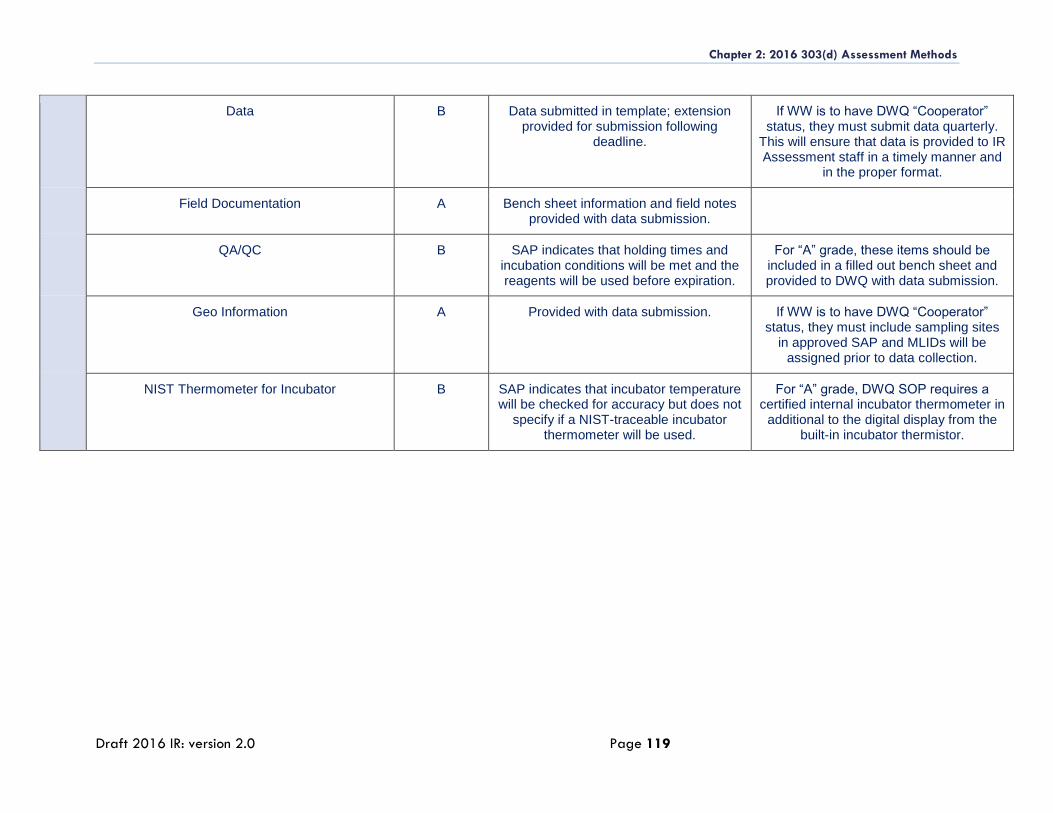
Chapter 2: 2016 303(d) Assessment Methods
Draft 2016 IR: version 2.0 Page 119
Data B Data submitted in template; extension provided for submission following
deadline.
If WW is to have DWQ “Cooperator” status, they must submit data quarterly.
This will ensure that data is provided to IR Assessment staff in a timely manner and
in the proper format.
Field Documentation A Bench sheet information and field notes provided with data submission.
QA/QC B SAP indicates that holding times and incubation conditions will be met and the reagents will be used before expiration.
For “A” grade, these items should be included in a filled out bench sheet and provided to DWQ with data submission.
Geo Information A Provided with data submission. If WW is to have DWQ “Cooperator” status, they must include sampling sites
in approved SAP and MLIDs will be assigned prior to data collection.
NIST Thermometer for Incubator B SAP indicates that incubator temperature will be checked for accuracy but does not
specify if a NIST-traceable incubator thermometer will be used.
For “A” grade, DWQ SOP requires a certified internal incubator thermometer in
additional to the digital display from the built-in incubator thermistor.
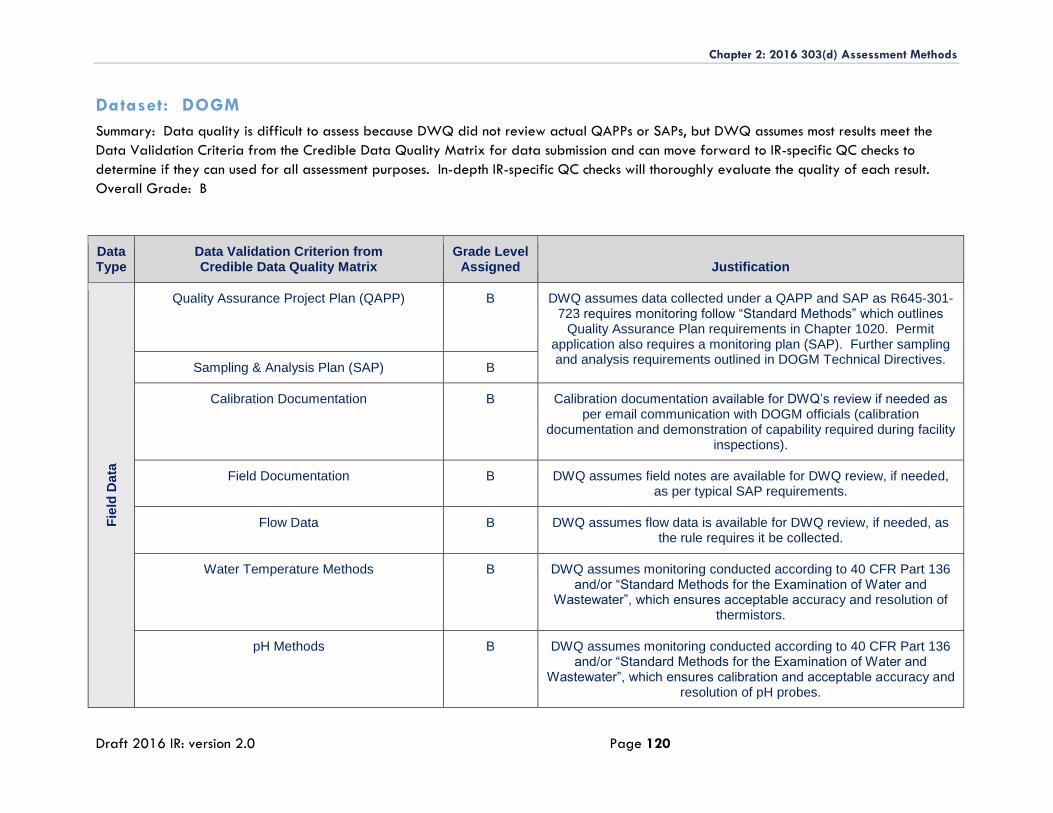
Chapter 2: 2016 303(d) Assessment Methods
Draft 2016 IR: version 2.0 Page 120
Dataset: DOGM
Summary: Data quality is difficult to assess because DWQ did not review actual QAPPs or SAPs, but DWQ assumes most results meet the
Data Validation Criteria from the Credible Data Quality Matrix for data submission and can move forward to IR-specific QC checks to
determine if they can used for all assessment purposes. In-depth IR-specific QC checks will thoroughly evaluate the quality of each result.
Overall Grade: B
Data Type
Data Validation Criterion from Credible Data Quality Matrix
Grade Level Assigned Justification
Fie
ld D
ata
Quality Assurance Project Plan (QAPP) B DWQ assumes data collected under a QAPP and SAP as R645-301-723 requires monitoring follow “Standard Methods” which outlines
Quality Assurance Plan requirements in Chapter 1020. Permit application also requires a monitoring plan (SAP). Further sampling and analysis requirements outlined in DOGM Technical Directives.
Sampling & Analysis Plan (SAP) B
Calibration Documentation B Calibration documentation available for DWQ’s review if needed as per email communication with DOGM officials (calibration
documentation and demonstration of capability required during facility inspections).
Field Documentation B DWQ assumes field notes are available for DWQ review, if needed, as per typical SAP requirements.
Flow Data B DWQ assumes flow data is available for DWQ review, if needed, as the rule requires it be collected.
Water Temperature Methods B DWQ assumes monitoring conducted according to 40 CFR Part 136 and/or “Standard Methods for the Examination of Water and
Wastewater”, which ensures acceptable accuracy and resolution of thermistors.
pH Methods B DWQ assumes monitoring conducted according to 40 CFR Part 136 and/or “Standard Methods for the Examination of Water and
Wastewater”, which ensures calibration and acceptable accuracy and resolution of pH probes.
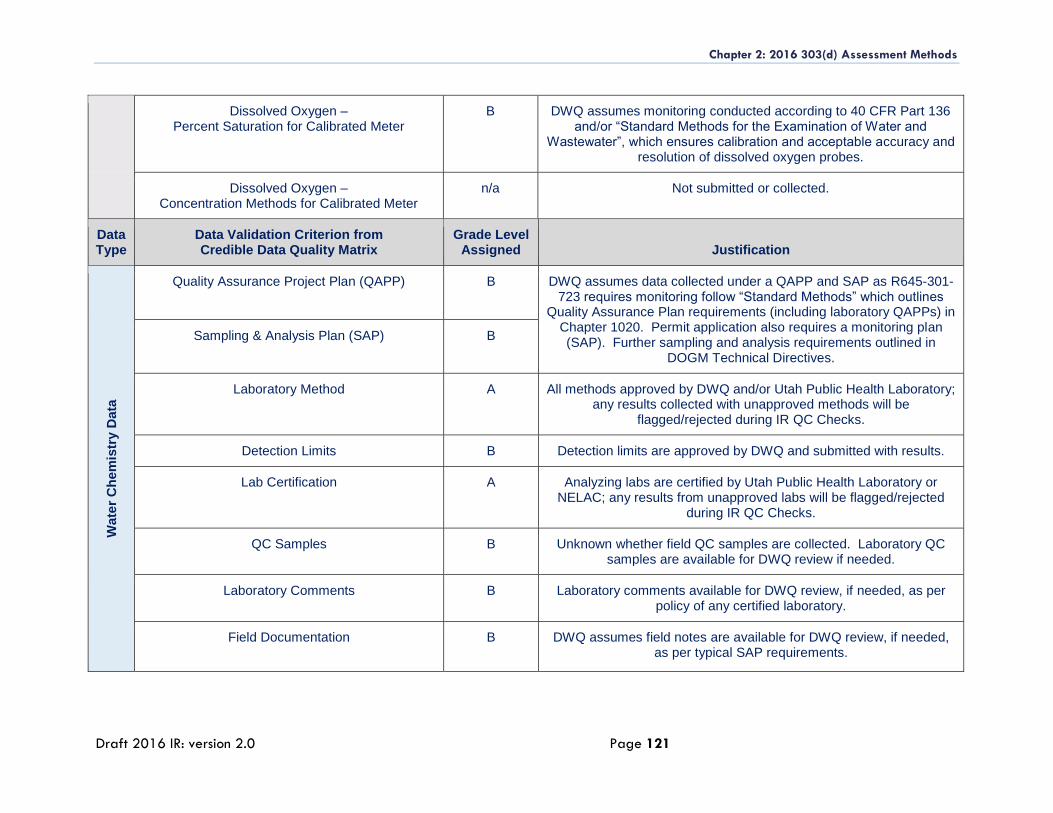
Chapter 2: 2016 303(d) Assessment Methods
Draft 2016 IR: version 2.0 Page 121
Dissolved Oxygen – Percent Saturation for Calibrated Meter
B DWQ assumes monitoring conducted according to 40 CFR Part 136 and/or “Standard Methods for the Examination of Water and
Wastewater”, which ensures calibration and acceptable accuracy and resolution of dissolved oxygen probes.
Dissolved Oxygen – Concentration Methods for Calibrated Meter
n/a Not submitted or collected.
Data Type
Data Validation Criterion from Credible Data Quality Matrix
Grade Level Assigned Justification
Wate
r C
hem
istr
y D
ata
Quality Assurance Project Plan (QAPP) B DWQ assumes data collected under a QAPP and SAP as R645-301-723 requires monitoring follow “Standard Methods” which outlines
Quality Assurance Plan requirements (including laboratory QAPPs) in Chapter 1020. Permit application also requires a monitoring plan (SAP). Further sampling and analysis requirements outlined in
DOGM Technical Directives.
Sampling & Analysis Plan (SAP) B
Laboratory Method A All methods approved by DWQ and/or Utah Public Health Laboratory; any results collected with unapproved methods will be
flagged/rejected during IR QC Checks.
Detection Limits B Detection limits are approved by DWQ and submitted with results.
Lab Certification A Analyzing labs are certified by Utah Public Health Laboratory or NELAC; any results from unapproved labs will be flagged/rejected
during IR QC Checks.
QC Samples B Unknown whether field QC samples are collected. Laboratory QC samples are available for DWQ review if needed.
Laboratory Comments B Laboratory comments available for DWQ review, if needed, as per policy of any certified laboratory.
Field Documentation B DWQ assumes field notes are available for DWQ review, if needed, as per typical SAP requirements.
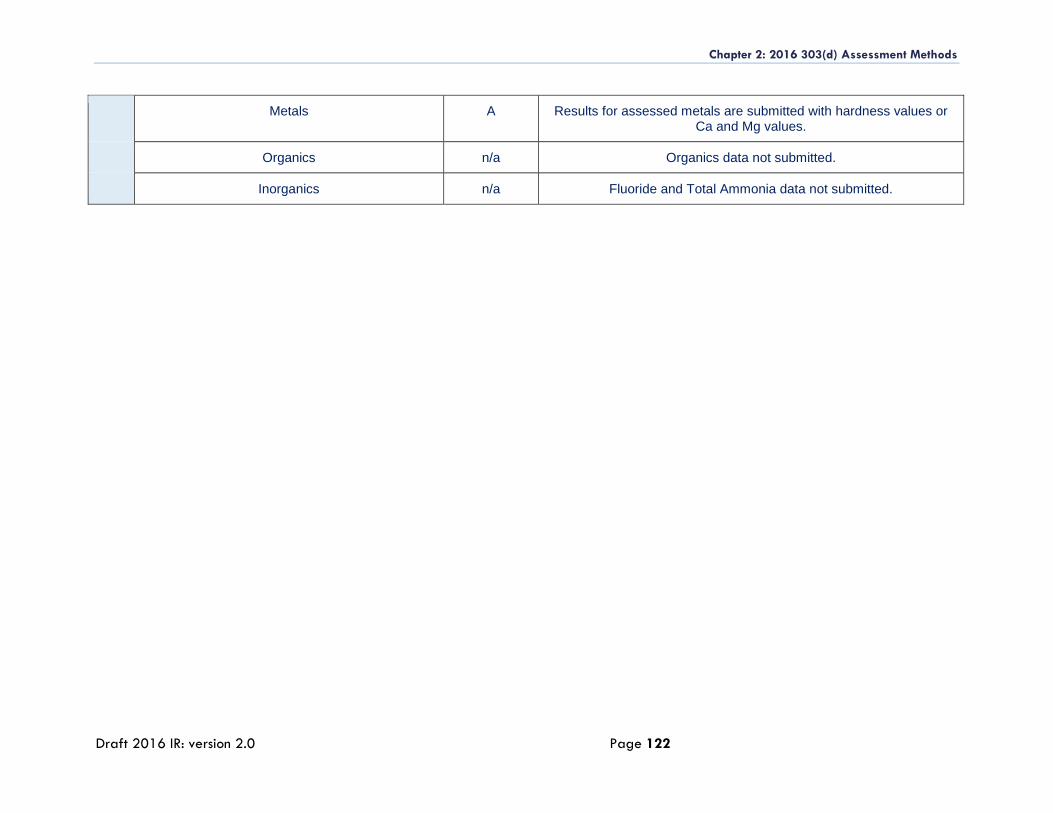
Chapter 2: 2016 303(d) Assessment Methods
Draft 2016 IR: version 2.0 Page 122
Metals A Results for assessed metals are submitted with hardness values or Ca and Mg values.
Organics n/a Organics data not submitted.
Inorganics n/a Fluoride and Total Ammonia data not submitted.
CHAPTER 3: RIVERS AND
STREAM ASSESSMENTS
2016 Final Integrated Report

Chapter 3: Rivers and Stream Assessments
Final 2016 IR: version 2.1 Page 2
[This page is intentionally left blank].
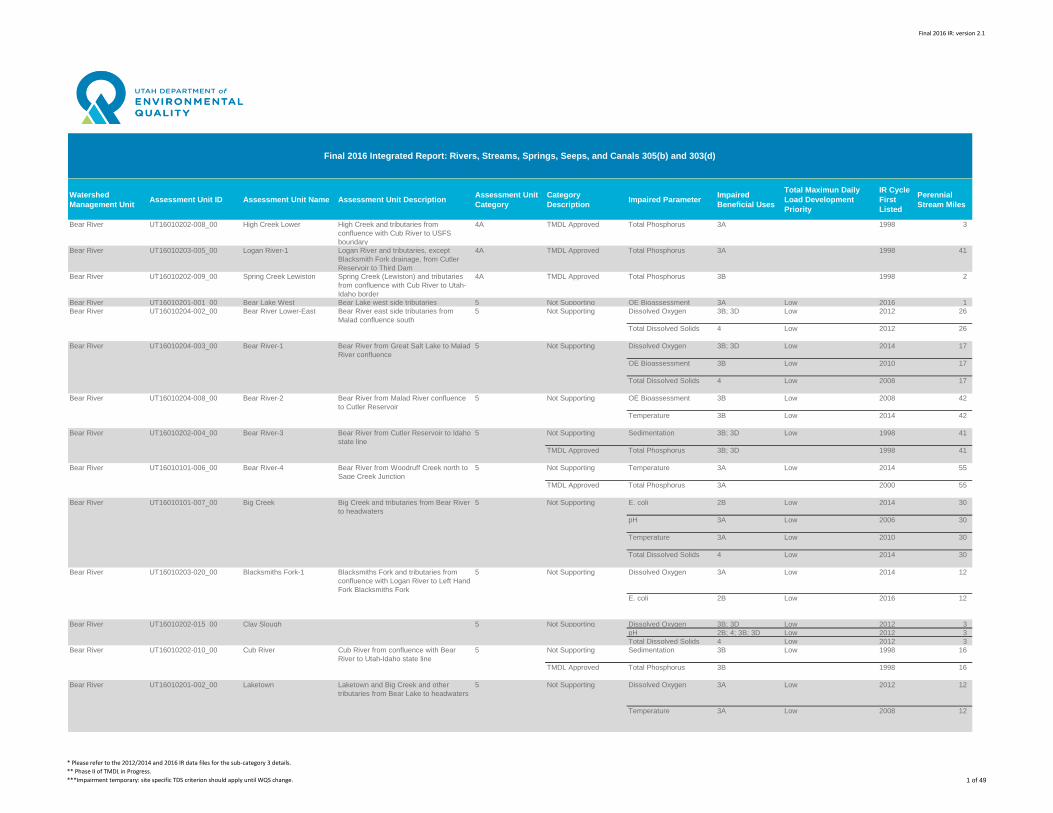
Final 2016 IR: version 2.1
Watershed
Management UnitAssessment Unit ID Assessment Unit Name Assessment Unit Description
Assessment Unit
Category
Category
DescriptionImpaired Parameter
Impaired
Beneficial Uses
Total Maximun Daily
Load Development
Priority
IR Cycle
First
Listed
Perennial
Stream Miles
Bear River UT16010202-008_00 High Creek Lower High Creek and tributaries from
confluence with Cub River to USFS
boundary
4A TMDL Approved Total Phosphorus 3A 1998 3
Bear River UT16010203-005_00 Logan River-1 Logan River and tributaries, except
Blacksmith Fork drainage, from Cutler
Reservoir to Third Dam
4A TMDL Approved Total Phosphorus 3A 1998 41
Bear River UT16010202-009_00 Spring Creek Lewiston Spring Creek (Lewiston) and tributaries
from confluence with Cub River to Utah-
Idaho border
4A TMDL Approved Total Phosphorus 3B 1998 2
Bear River UT16010201-001_00 Bear Lake West Bear Lake west side tributaries 5 Not Supporting OE Bioassessment 3A Low 2016 1
Bear River UT16010204-002_00 Bear River Lower-East Bear River east side tributaries from
Malad confluence south
5 Not Supporting Dissolved Oxygen 3B; 3D Low 2012 26
Total Dissolved Solids 4 Low 2012 26
Bear River UT16010204-003_00 Bear River-1 Bear River from Great Salt Lake to Malad
River confluence
5 Not Supporting Dissolved Oxygen 3B; 3D Low 2014 17
OE Bioassessment 3B Low 2010 17
Total Dissolved Solids 4 Low 2008 17
Bear River UT16010204-008_00 Bear River-2 Bear River from Malad River confluence
to Cutler Reservoir
5 Not Supporting OE Bioassessment 3B Low 2008 42
Temperature 3B Low 2014 42
Bear River UT16010202-004_00 Bear River-3 Bear River from Cutler Reservoir to Idaho
state line
5 Not Supporting Sedimentation 3B; 3D Low 1998 41
TMDL Approved Total Phosphorus 3B; 3D 1998 41
Bear River UT16010101-006_00 Bear River-4 Bear River from Woodruff Creek north to
Sage Creek Junction
5 Not Supporting Temperature 3A Low 2014 55
TMDL Approved Total Phosphorus 3A 2000 55
Bear River UT16010101-007_00 Big Creek Big Creek and tributaries from Bear River
to headwaters
5 Not Supporting E. coli 2B Low 2014 30
pH 3A Low 2006 30
Temperature 3A Low 2010 30
Total Dissolved Solids 4 Low 2014 30
Bear River UT16010203-020_00 Blacksmiths Fork-1 Blacksmiths Fork and tributaries from
confluence with Logan River to Left Hand
Fork Blacksmiths Fork
5 Not Supporting Dissolved Oxygen 3A Low 2014 12
E. coli 2B Low 2016 12
Bear River UT16010202-015_00 Clay Slough 5 Not Supporting Dissolved Oxygen 3B; 3D Low 2012 3
pH 2B; 4; 3B; 3D Low 2012 3
Total Dissolved Solids 4 Low 2012 3
Bear River UT16010202-010_00 Cub River Cub River from confluence with Bear
River to Utah-Idaho state line
5 Not Supporting Sedimentation 3B Low 1998 16
TMDL Approved Total Phosphorus 3B 1998 16
Bear River UT16010201-002_00 Laketown Laketown and Big Creek and other
tributaries from Bear Lake to headwaters
5 Not Supporting Dissolved Oxygen 3A Low 2012 12
Temperature 3A Low 2008 12
Final 2016 Integrated Report: Rivers, Streams, Springs, Seeps, and Canals 305(b) and 303(d)
* Please refer to the 2012/2014 and 2016 IR data files for the sub-category 3 details.
** Phase II of TMDL in Progress.
***Impairment temporary: site specific TDS criterion should apply until WQS change. 1 of 49
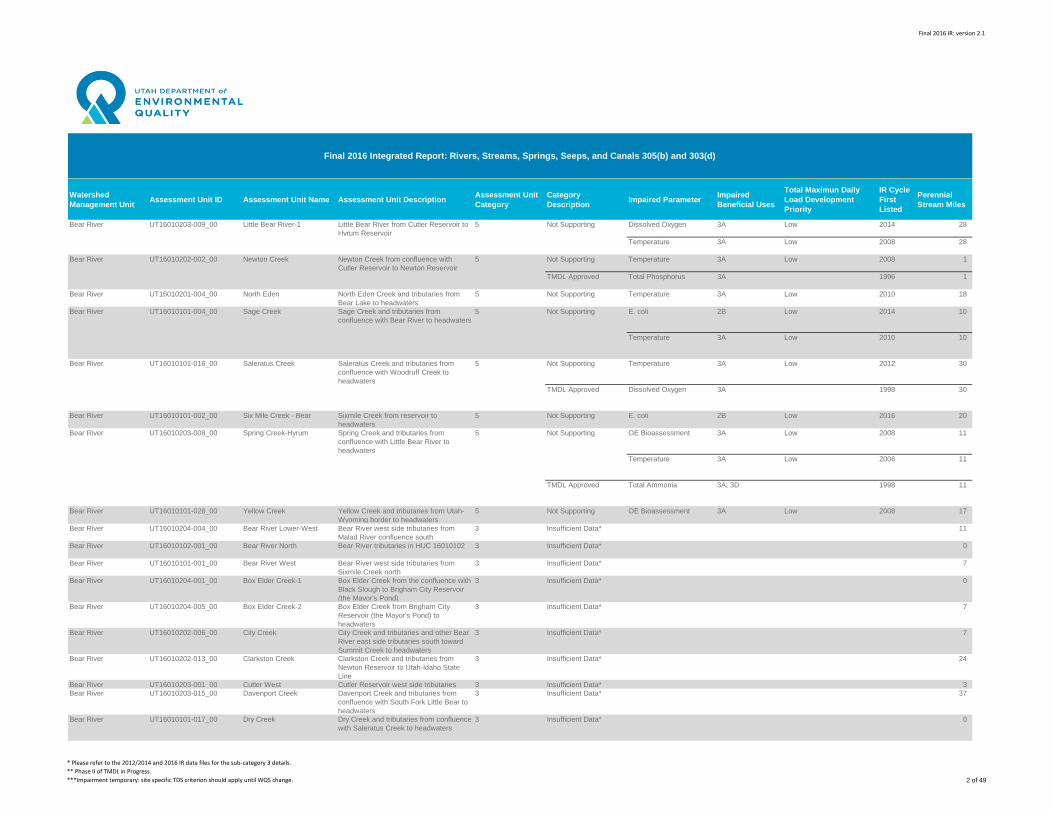
Final 2016 IR: version 2.1
Watershed
Management UnitAssessment Unit ID Assessment Unit Name Assessment Unit Description
Assessment Unit
Category
Category
DescriptionImpaired Parameter
Impaired
Beneficial Uses
Total Maximun Daily
Load Development
Priority
IR Cycle
First
Listed
Perennial
Stream Miles
Final 2016 Integrated Report: Rivers, Streams, Springs, Seeps, and Canals 305(b) and 303(d)
Bear River UT16010203-009_00 Little Bear River-1 Little Bear River from Cutler Reservoir to
Hyrum Reservoir
5 Not Supporting Dissolved Oxygen 3A Low 2014 28
Temperature 3A Low 2008 28
Bear River UT16010202-002_00 Newton Creek Newton Creek from confluence with
Cutler Reservoir to Newton Reservoir
5 Not Supporting Temperature 3A Low 2008 1
TMDL Approved Total Phosphorus 3A 1996 1
Bear River UT16010201-004_00 North Eden North Eden Creek and tributaries from
Bear Lake to headwaters
5 Not Supporting Temperature 3A Low 2010 18
Bear River UT16010101-004_00 Sage Creek Sage Creek and tributaries from
confluence with Bear River to headwaters
5 Not Supporting E. coli 2B Low 2014 10
Temperature 3A Low 2010 10
Bear River UT16010101-016_00 Saleratus Creek Saleratus Creek and tributaries from
confluence with Woodruff Creek to
headwaters
5 Not Supporting Temperature 3A Low 2012 30
TMDL Approved Dissolved Oxygen 3A 1998 30
Bear River UT16010101-002_00 Six Mile Creek - Bear Sixmile Creek from reservoir to
headwaters
5 Not Supporting E. coli 2B Low 2016 20
Bear River UT16010203-008_00 Spring Creek-Hyrum Spring Creek and tributaries from
confluence with Little Bear River to
headwaters
5 Not Supporting OE Bioassessment 3A Low 2008 11
Temperature 3A Low 2006 11
TMDL Approved Total Ammonia 3A; 3D 1998 11
Bear River UT16010101-028_00 Yellow Creek Yellow Creek and tributaries from Utah-
Wyoming border to headwaters
5 Not Supporting OE Bioassessment 3A Low 2008 17
Bear River UT16010204-004_00 Bear River Lower-West Bear River west side tributaries from
Malad River confluence south
3 Insufficient Data* 11
Bear River UT16010102-001_00 Bear River North Bear River tributaries in HUC 16010102 3 Insufficient Data* 0
Bear River UT16010101-001_00 Bear River West Bear River west side tributaries from
Sixmile Creek north
3 Insufficient Data* 7
Bear River UT16010204-001_00 Box Elder Creek-1 Box Elder Creek from the confluence with
Black Slough to Brigham City Reservoir
(the Mayor's Pond)
3 Insufficient Data* 0
Bear River UT16010204-005_00 Box Elder Creek-2 Box Elder Creek from Brigham City
Reservoir (the Mayor's Pond) to
headwaters
3 Insufficient Data* 7
Bear River UT16010202-006_00 City Creek City Creek and tributaries and other Bear
River east side tributaries south toward
Summit Creek to headwaters
3 Insufficient Data* 7
Bear River UT16010202-013_00 Clarkston Creek Clarkston Creek and tributaries from
Newton Reservoir to Utah-Idaho State
Line
3 Insufficient Data* 24
Bear River UT16010203-001_00 Cutler West Cutler Reservoir west side tributaries 3 Insufficient Data* 3
Bear River UT16010203-015_00 Davenport Creek Davenport Creek and tributaries from
confluence with South Fork Little Bear to
headwaters
3 Insufficient Data* 37
Bear River UT16010101-017_00 Dry Creek Dry Creek and tributaries from confluence
with Saleratus Creek to headwaters
3 Insufficient Data* 0
* Please refer to the 2012/2014 and 2016 IR data files for the sub-category 3 details.
** Phase II of TMDL in Progress.
***Impairment temporary: site specific TDS criterion should apply until WQS change. 2 of 49
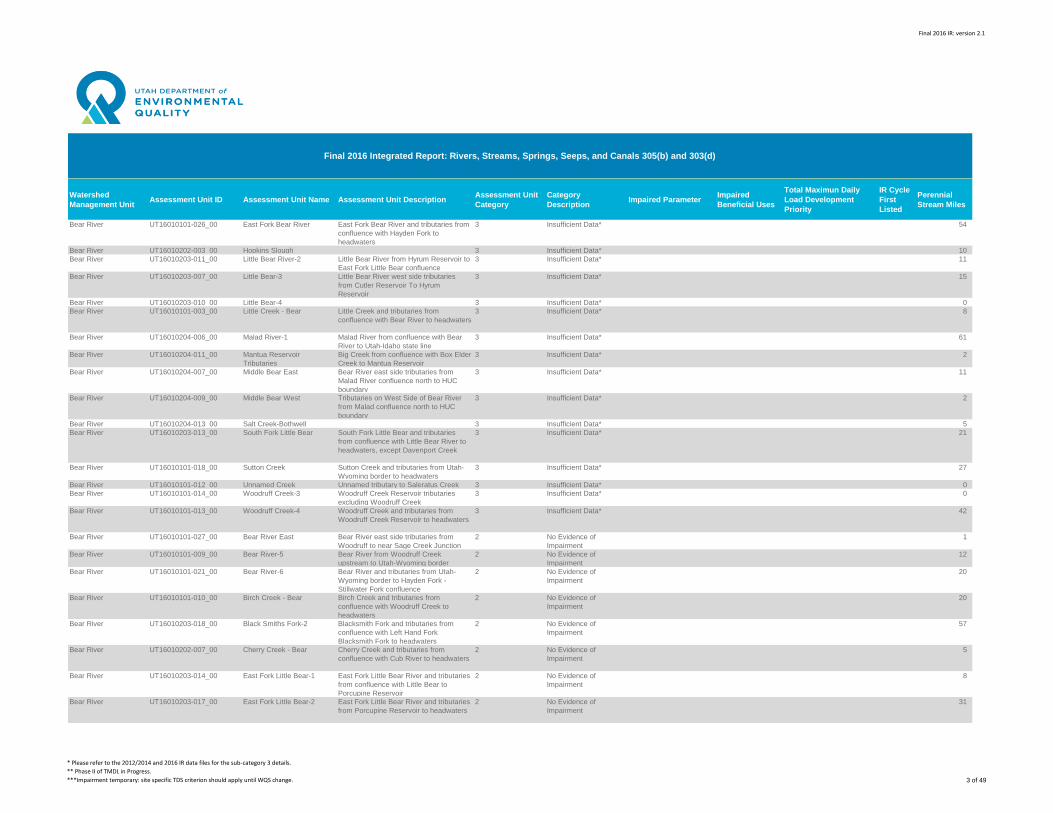
Final 2016 IR: version 2.1
Watershed
Management UnitAssessment Unit ID Assessment Unit Name Assessment Unit Description
Assessment Unit
Category
Category
DescriptionImpaired Parameter
Impaired
Beneficial Uses
Total Maximun Daily
Load Development
Priority
IR Cycle
First
Listed
Perennial
Stream Miles
Final 2016 Integrated Report: Rivers, Streams, Springs, Seeps, and Canals 305(b) and 303(d)
Bear River UT16010101-026_00 East Fork Bear River East Fork Bear River and tributaries from
confluence with Hayden Fork to
headwaters
3 Insufficient Data* 54
Bear River UT16010202-003_00 Hopkins Slough 3 Insufficient Data* 10
Bear River UT16010203-011_00 Little Bear River-2 Little Bear River from Hyrum Reservoir to
East Fork Little Bear confluence
3 Insufficient Data* 11
Bear River UT16010203-007_00 Little Bear-3 Little Bear River west side tributaries
from Cutler Reservoir To Hyrum
Reservoir
3 Insufficient Data* 15
Bear River UT16010203-010_00 Little Bear-4 3 Insufficient Data* 0
Bear River UT16010101-003_00 Little Creek - Bear Little Creek and tributaries from
confluence with Bear River to headwaters
3 Insufficient Data* 8
Bear River UT16010204-006_00 Malad River-1 Malad River from confluence with Bear
River to Utah-Idaho state line
3 Insufficient Data* 61
Bear River UT16010204-011_00 Mantua Reservoir
Tributaries
Big Creek from confluence with Box Elder
Creek to Mantua Reservoir
3 Insufficient Data* 2
Bear River UT16010204-007_00 Middle Bear East Bear River east side tributaries from
Malad River confluence north to HUC
boundary
3 Insufficient Data* 11
Bear River UT16010204-009_00 Middle Bear West Tributaries on West Side of Bear River
from Malad confluence north to HUC
boundary
3 Insufficient Data* 2
Bear River UT16010204-013_00 Salt Creek-Bothwell 3 Insufficient Data* 5
Bear River UT16010203-013_00 South Fork Little Bear South Fork Little Bear and tributaries
from confluence with Little Bear River to
headwaters, except Davenport Creek
3 Insufficient Data* 21
Bear River UT16010101-018_00 Sutton Creek Sutton Creek and tributaries from Utah-
Wyoming border to headwaters
3 Insufficient Data* 27
Bear River UT16010101-012_00 Unnamed Creek Unnamed tributary to Saleratus Creek 3 Insufficient Data* 0
Bear River UT16010101-014_00 Woodruff Creek-3 Woodruff Creek Reservoir tributaries
excluding Woodruff Creek
3 Insufficient Data* 0
Bear River UT16010101-013_00 Woodruff Creek-4 Woodruff Creek and tributaries from
Woodruff Creek Reservoir to headwaters
3 Insufficient Data* 42
Bear River UT16010101-027_00 Bear River East Bear River east side tributaries from
Woodruff to near Sage Creek Junction
2 No Evidence of
Impairment
1
Bear River UT16010101-009_00 Bear River-5 Bear River from Woodruff Creek
upstream to Utah-Wyoming border
2 No Evidence of
Impairment
12
Bear River UT16010101-021_00 Bear River-6 Bear River and tributaries from Utah-
Wyoming border to Hayden Fork -
Stillwater Fork confluence
2 No Evidence of
Impairment
20
Bear River UT16010101-010_00 Birch Creek - Bear Birch Creek and tributaries from
confluence with Woodruff Creek to
headwaters
2 No Evidence of
Impairment
20
Bear River UT16010203-018_00 Black Smiths Fork-2 Blacksmith Fork and tributaries from
confluence with Left Hand Fork
Blacksmith Fork to headwaters
2 No Evidence of
Impairment
57
Bear River UT16010202-007_00 Cherry Creek - Bear Cherry Creek and tributaries from
confluence with Cub River to headwaters
2 No Evidence of
Impairment
5
Bear River UT16010203-014_00 East Fork Little Bear-1 East Fork Little Bear River and tributaries
from confluence with Little Bear to
Porcupine Reservoir
2 No Evidence of
Impairment
8
Bear River UT16010203-017_00 East Fork Little Bear-2 East Fork Little Bear River and tributaries
from Porcupine Reservoir to headwaters
2 No Evidence of
Impairment
31
* Please refer to the 2012/2014 and 2016 IR data files for the sub-category 3 details.
** Phase II of TMDL in Progress.
***Impairment temporary: site specific TDS criterion should apply until WQS change. 3 of 49

Final 2016 IR: version 2.1
Watershed
Management UnitAssessment Unit ID Assessment Unit Name Assessment Unit Description
Assessment Unit
Category
Category
DescriptionImpaired Parameter
Impaired
Beneficial Uses
Total Maximun Daily
Load Development
Priority
IR Cycle
First
Listed
Perennial
Stream Miles
Final 2016 Integrated Report: Rivers, Streams, Springs, Seeps, and Canals 305(b) and 303(d)
Bear River UT16010202-012_00 High Creek Upper High Creek and tributaries from U.S.
Forest Service boundary to headwaters
2 No Evidence of
Impairment
10
Bear River UT16010203-019_00 Left Hand Fork Blacksmiths
For
Left Hand Fork Blacksmiths Fork and
tributaries from confluence with
Blacksmiths Fork to headwaters
2 No Evidence of
Impairment
26
Bear River UT16010203-012_00 Little Bear River Tributaries West side tributaries to Little Bear River
above Hyrum Reservoir
2 No Evidence of
Impairment
0
Bear River UT16010203-006_00 Logan River-2 Logan River and tributaries from Third
Dam to headwaters
2 No Evidence of
Impairment
72
Bear River UT16010204-010_00 Malad River-2 Malad River tributaries 2 No Evidence of
Impairment
18
Bear River UT16010101-022_00 Mill Creek Mill Creek and tributaries from Utah-
Wyoming border to headwaters
2 No Evidence of
Impairment
59
Bear River UT16010101-008_00 North Woodruff Bear River west side tributaries between
Woodruff and Big Creek
2 No Evidence of
Impairment
2
Bear River UT16010101-005_00 Otter Creek Otter Creek and tributaries from Bear
River to headwaters
2 No Evidence of
Impairment
26
Bear River UT16010203-016_00 Porcupine Creek Porcupine Creek and tributaries from
Porcupine Reservoir to headwaters
2 No Evidence of
Impairment
1
Bear River UT16010201-003_00 South Eden South Eden Creek from Bear Lake to
headwaters
2 No Evidence of
Impairment
4
Bear River UT16010202-005_00 Summit Creek Lower Summit Creek and tributaries from
confluence with Bear River to USFS
boundary
2 No Evidence of
Impairment
8
Bear River UT16010203-002_00 Swift Slough Swift Slough and tributaries from Cutler
Reservoir to headwaters
2 No Evidence of
Impairment
11
Bear River UT16010202-014_00 The Slough 2 No Evidence of
Impairment
3
Bear River UT16010101-023_00 West Fork Bear River West Fork Bear River and tributaries from
confluence with Bear River to headwaters
2 No Evidence of
Impairment
72
Bear River UT16010101-011_00 Woodruff Creek-1 Woodruff Creek from mouth to Birch
Creek confluence
2 No Evidence of
Impairment
8
Bear River UT16010101-015_00 Woodruff Creek-2 Woodruff Creek and tributaries from Birch
Creek confluence to Woodruff Creek
Reservoir
2 No Evidence of
Impairment
6
Bear River UT16010202-001_00 Worm Creek Worm Creek from confluence with Cub
River to Utah-Idaho state line
2 No Evidence of
Impairment
0
Bear River UT16010101-019_00 Yellow Creek Tributaries Yellow Creek tributaries (e.g. Thief,
Chicken, Spring Creeks) above Barker
Reservoir and Yellow Creek below Barker
Reservoir
2 No Evidence of
Impairment
23
Bear River UT16010101-024_00 Hayden Fork Hayden Fork and tributaries from
confluence with Stillwater Creek to
headwaters
1 Supporting 18
Bear River UT16010101-025_00 Stillwater Fork Stillwater Fork and tributaries from
confluence with Hayden Fork to
headwaters
1 Supporting 35
Bear River UT16010202-011_00 Summit Creek Upper Summit Creek and tributaries from USFS
boundary to headwaters
1 Supporting 10
* Please refer to the 2012/2014 and 2016 IR data files for the sub-category 3 details.
** Phase II of TMDL in Progress.
***Impairment temporary: site specific TDS criterion should apply until WQS change. 4 of 49
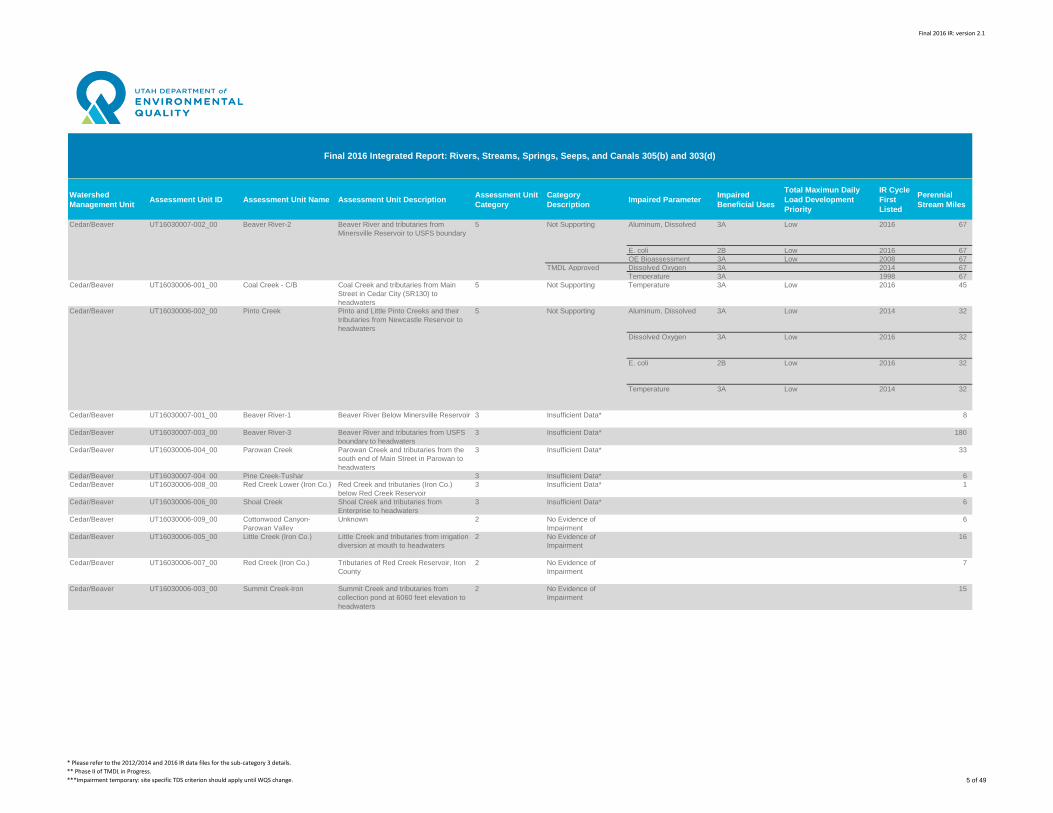
Final 2016 IR: version 2.1
Watershed
Management UnitAssessment Unit ID Assessment Unit Name Assessment Unit Description
Assessment Unit
Category
Category
DescriptionImpaired Parameter
Impaired
Beneficial Uses
Total Maximun Daily
Load Development
Priority
IR Cycle
First
Listed
Perennial
Stream Miles
Final 2016 Integrated Report: Rivers, Streams, Springs, Seeps, and Canals 305(b) and 303(d)
Cedar/Beaver UT16030007-002_00 Beaver River-2 Beaver River and tributaries from
Minersville Reservoir to USFS boundary
5 Not Supporting Aluminum, Dissolved 3A Low 2016 67
E. coli 2B Low 2016 67
OE Bioassessment 3A Low 2008 67
TMDL Approved Dissolved Oxygen 3A 2014 67
Temperature 3A 1998 67
Cedar/Beaver UT16030006-001_00 Coal Creek - C/B Coal Creek and tributaries from Main
Street in Cedar City (SR130) to
headwaters
5 Not Supporting Temperature 3A Low 2016 45
Cedar/Beaver UT16030006-002_00 Pinto Creek Pinto and Little Pinto Creeks and their
tributaries from Newcastle Reservoir to
headwaters
5 Not Supporting Aluminum, Dissolved 3A Low 2014 32
Dissolved Oxygen 3A Low 2016 32
E. coli 2B Low 2016 32
Temperature 3A Low 2014 32
Cedar/Beaver UT16030007-001_00 Beaver River-1 Beaver River Below Minersville Reservoir 3 Insufficient Data* 8
Cedar/Beaver UT16030007-003_00 Beaver River-3 Beaver River and tributaries from USFS
boundary to headwaters
3 Insufficient Data* 180
Cedar/Beaver UT16030006-004_00 Parowan Creek Parowan Creek and tributaries from the
south end of Main Street in Parowan to
headwaters
3 Insufficient Data* 33
Cedar/Beaver UT16030007-004_00 Pine Creek-Tushar 3 Insufficient Data* 6
Cedar/Beaver UT16030006-008_00 Red Creek Lower (Iron Co.) Red Creek and tributaries (Iron Co.)
below Red Creek Reservoir
3 Insufficient Data* 1
Cedar/Beaver UT16030006-006_00 Shoal Creek Shoal Creek and tributaries from
Enterprise to headwaters
3 Insufficient Data* 6
Cedar/Beaver UT16030006-009_00 Cottonwood Canyon-
Parowan Valley
Unknown 2 No Evidence of
Impairment
6
Cedar/Beaver UT16030006-005_00 Little Creek (Iron Co.) Little Creek and tributaries from irrigation
diversion at mouth to headwaters
2 No Evidence of
Impairment
16
Cedar/Beaver UT16030006-007_00 Red Creek (Iron Co.) Tributaries of Red Creek Reservoir, Iron
County
2 No Evidence of
Impairment
7
Cedar/Beaver UT16030006-003_00 Summit Creek-Iron Summit Creek and tributaries from
collection pond at 6060 feet elevation to
headwaters
2 No Evidence of
Impairment
15
* Please refer to the 2012/2014 and 2016 IR data files for the sub-category 3 details.
** Phase II of TMDL in Progress.
***Impairment temporary: site specific TDS criterion should apply until WQS change. 5 of 49
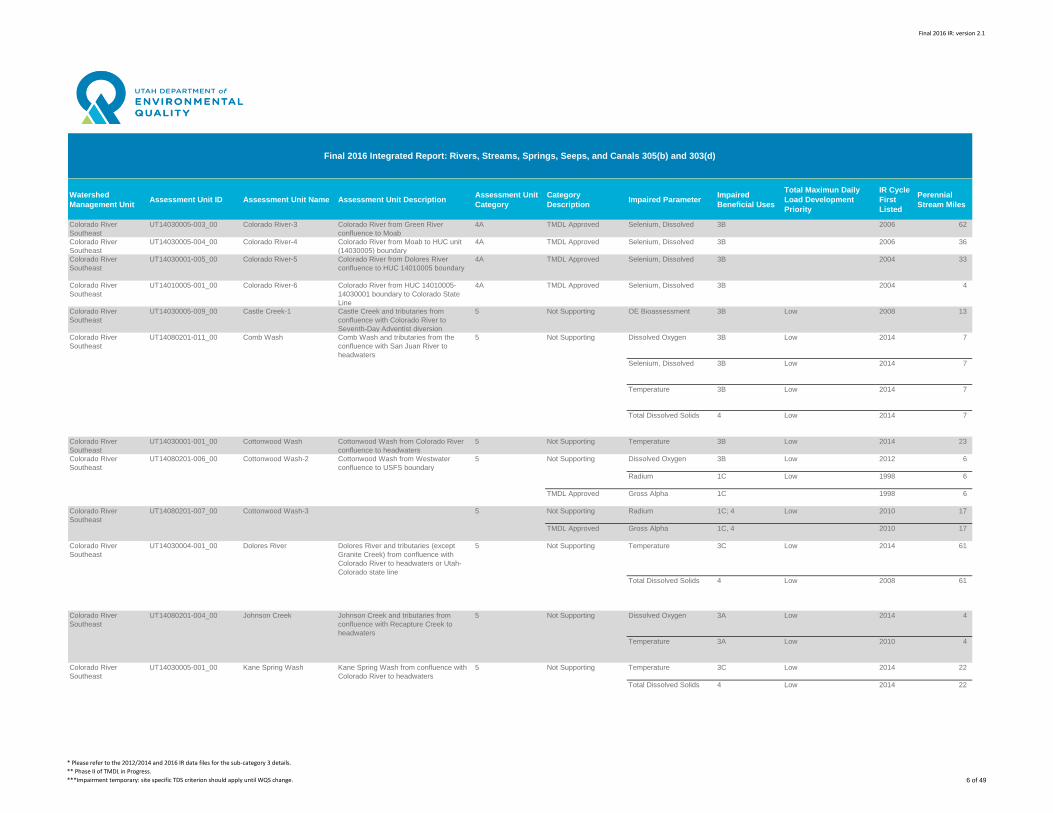
Final 2016 IR: version 2.1
Watershed
Management UnitAssessment Unit ID Assessment Unit Name Assessment Unit Description
Assessment Unit
Category
Category
DescriptionImpaired Parameter
Impaired
Beneficial Uses
Total Maximun Daily
Load Development
Priority
IR Cycle
First
Listed
Perennial
Stream Miles
Final 2016 Integrated Report: Rivers, Streams, Springs, Seeps, and Canals 305(b) and 303(d)
Colorado River
Southeast
UT14030005-003_00 Colorado River-3 Colorado River from Green River
confluence to Moab
4A TMDL Approved Selenium, Dissolved 3B 2006 62
Colorado River
Southeast
UT14030005-004_00 Colorado River-4 Colorado River from Moab to HUC unit
(14030005) boundary
4A TMDL Approved Selenium, Dissolved 3B 2006 36
Colorado River
Southeast
UT14030001-005_00 Colorado River-5 Colorado River from Dolores River
confluence to HUC 14010005 boundary
4A TMDL Approved Selenium, Dissolved 3B 2004 33
Colorado River
Southeast
UT14010005-001_00 Colorado River-6 Colorado River from HUC 14010005-
14030001 boundary to Colorado State
Line
4A TMDL Approved Selenium, Dissolved 3B 2004 4
Colorado River
Southeast
UT14030005-009_00 Castle Creek-1 Castle Creek and tributaries from
confluence with Colorado River to
Seventh-Day Adventist diversion
5 Not Supporting OE Bioassessment 3B Low 2008 13
Colorado River
Southeast
UT14080201-011_00 Comb Wash Comb Wash and tributaries from the
confluence with San Juan River to
headwaters
5 Not Supporting Dissolved Oxygen 3B Low 2014 7
Selenium, Dissolved 3B Low 2014 7
Temperature 3B Low 2014 7
Total Dissolved Solids 4 Low 2014 7
Colorado River
Southeast
UT14030001-001_00 Cottonwood Wash Cottonwood Wash from Colorado River
confluence to headwaters
5 Not Supporting Temperature 3B Low 2014 23
Colorado River
Southeast
UT14080201-006_00 Cottonwood Wash-2 Cottonwood Wash from Westwater
confluence to USFS boundary
5 Not Supporting Dissolved Oxygen 3B Low 2012 6
Radium 1C Low 1998 6
TMDL Approved Gross Alpha 1C 1998 6
Colorado River
Southeast
UT14080201-007_00 Cottonwood Wash-3 5 Not Supporting Radium 1C; 4 Low 2010 17
TMDL Approved Gross Alpha 1C, 4 2010 17
Colorado River
Southeast
UT14030004-001_00 Dolores River Dolores River and tributaries (except
Granite Creek) from confluence with
Colorado River to headwaters or Utah-
Colorado state line
5 Not Supporting Temperature 3C Low 2014 61
Total Dissolved Solids 4 Low 2008 61
Colorado River
Southeast
UT14080201-004_00 Johnson Creek Johnson Creek and tributaries from
confluence with Recapture Creek to
headwaters
5 Not Supporting Dissolved Oxygen 3A Low 2014 4
Temperature 3A Low 2010 4
Colorado River
Southeast
UT14030005-001_00 Kane Spring Wash Kane Spring Wash from confluence with
Colorado River to headwaters
5 Not Supporting Temperature 3C Low 2014 22
Total Dissolved Solids 4 Low 2014 22
* Please refer to the 2012/2014 and 2016 IR data files for the sub-category 3 details.
** Phase II of TMDL in Progress.
***Impairment temporary: site specific TDS criterion should apply until WQS change. 6 of 49
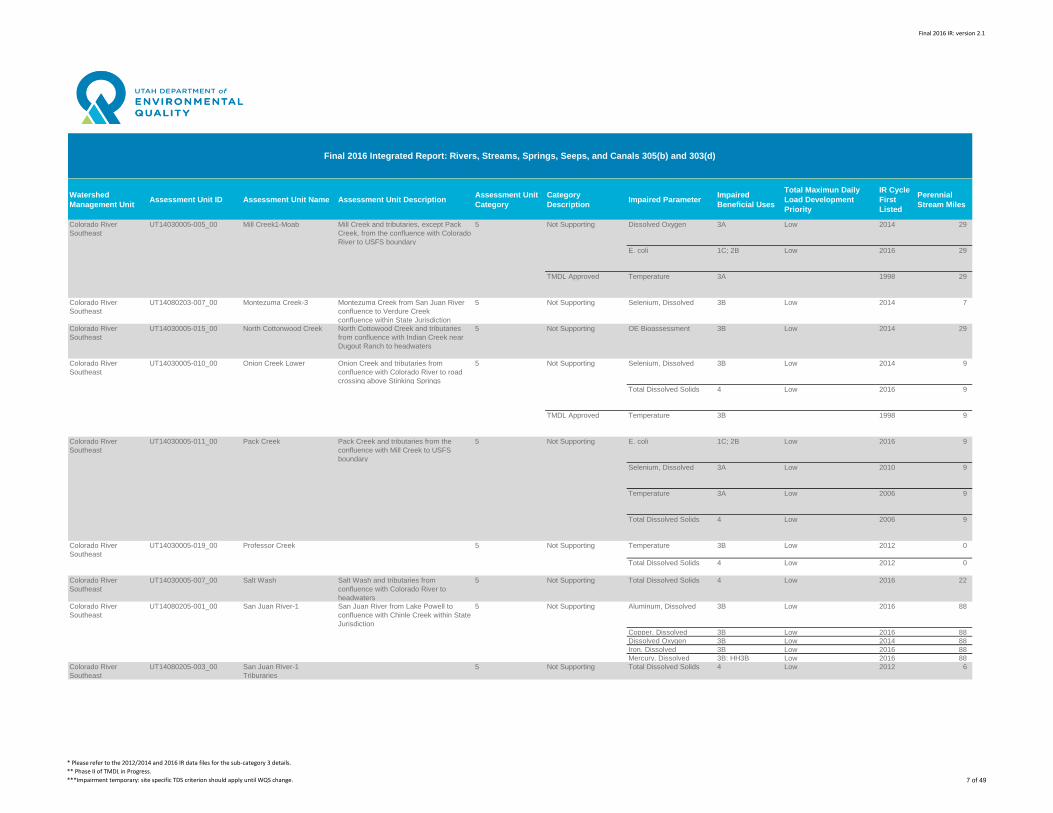
Final 2016 IR: version 2.1
Watershed
Management UnitAssessment Unit ID Assessment Unit Name Assessment Unit Description
Assessment Unit
Category
Category
DescriptionImpaired Parameter
Impaired
Beneficial Uses
Total Maximun Daily
Load Development
Priority
IR Cycle
First
Listed
Perennial
Stream Miles
Final 2016 Integrated Report: Rivers, Streams, Springs, Seeps, and Canals 305(b) and 303(d)
Colorado River
Southeast
UT14030005-005_00 Mill Creek1-Moab Mill Creek and tributaries, except Pack
Creek, from the confluence with Colorado
River to USFS boundary
5 Not Supporting Dissolved Oxygen 3A Low 2014 29
E. coli 1C; 2B Low 2016 29
TMDL Approved Temperature 3A 1998 29
Colorado River
Southeast
UT14080203-007_00 Montezuma Creek-3 Montezuma Creek from San Juan River
confluence to Verdure Creek
confluence within State Jurisdiction
5 Not Supporting Selenium, Dissolved 3B Low 2014 7
Colorado River
Southeast
UT14030005-015_00 North Cottonwood Creek North Cottowood Creek and tributaries
from confluence with Indian Creek near
Dugout Ranch to headwaters
5 Not Supporting OE Bioassessment 3B Low 2014 29
Colorado River
Southeast
UT14030005-010_00 Onion Creek Lower Onion Creek and tributaries from
confluence with Colorado River to road
crossing above Stinking Springs
5 Not Supporting Selenium, Dissolved 3B Low 2014 9
Total Dissolved Solids 4 Low 2016 9
TMDL Approved Temperature 3B 1998 9
Colorado River
Southeast
UT14030005-011_00 Pack Creek Pack Creek and tributaries from the
confluence with Mill Creek to USFS
boundary
5 Not Supporting E. coli 1C; 2B Low 2016 9
Selenium, Dissolved 3A Low 2010 9
Temperature 3A Low 2006 9
Total Dissolved Solids 4 Low 2006 9
Colorado River
Southeast
UT14030005-019_00 Professor Creek 5 Not Supporting Temperature 3B Low 2012 0
Total Dissolved Solids 4 Low 2012 0
Colorado River
Southeast
UT14030005-007_00 Salt Wash Salt Wash and tributaries from
confluence with Colorado River to
headwaters
5 Not Supporting Total Dissolved Solids 4 Low 2016 22
Colorado River
Southeast
UT14080205-001_00 San Juan River-1 San Juan River from Lake Powell to
confluence with Chinle Creek within State
Jurisdiction
5 Not Supporting Aluminum, Dissolved 3B Low 2016 88
Copper, Dissolved 3B Low 2016 88
Dissolved Oxygen 3B Low 2014 88
Iron, Dissolved 3B Low 2016 88
Mercury, Dissolved 3B; HH3B Low 2016 88
Colorado River
Southeast
UT14080205-003_00 San Juan River-1
Triburaries
5 Not Supporting Total Dissolved Solids 4 Low 2012 6
* Please refer to the 2012/2014 and 2016 IR data files for the sub-category 3 details.
** Phase II of TMDL in Progress.
***Impairment temporary: site specific TDS criterion should apply until WQS change. 7 of 49
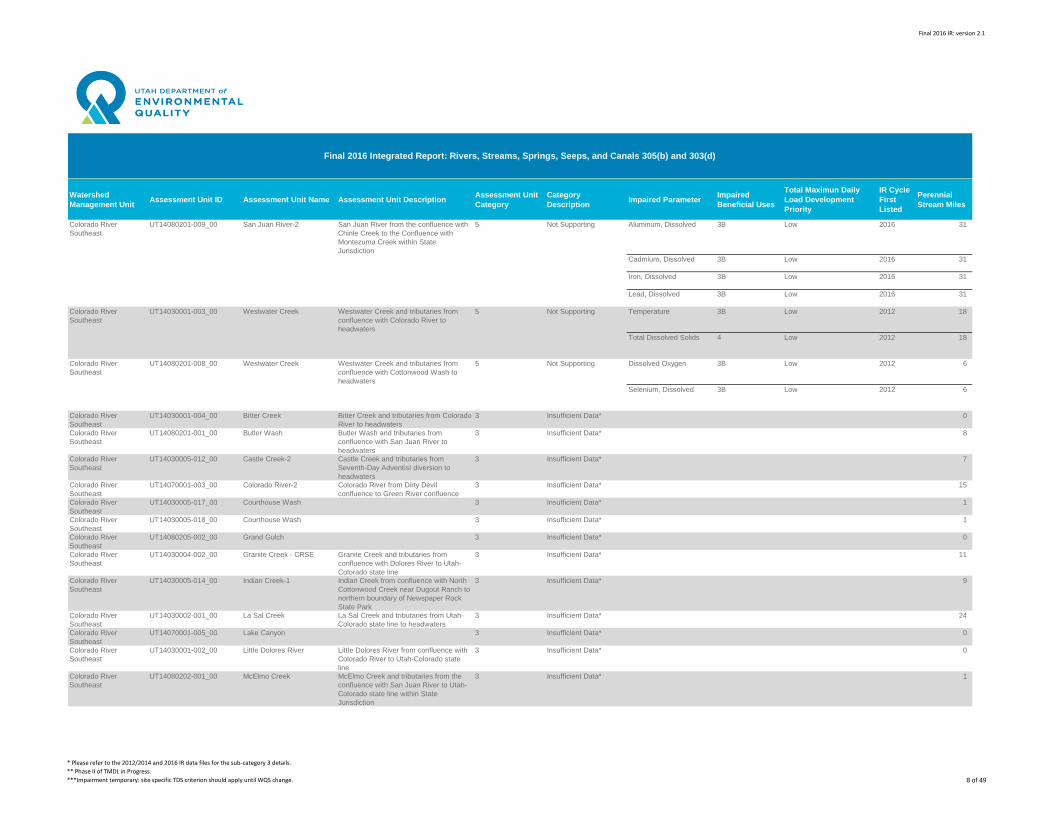
Final 2016 IR: version 2.1
Watershed
Management UnitAssessment Unit ID Assessment Unit Name Assessment Unit Description
Assessment Unit
Category
Category
DescriptionImpaired Parameter
Impaired
Beneficial Uses
Total Maximun Daily
Load Development
Priority
IR Cycle
First
Listed
Perennial
Stream Miles
Final 2016 Integrated Report: Rivers, Streams, Springs, Seeps, and Canals 305(b) and 303(d)
Colorado River
Southeast
UT14080201-009_00 San Juan River-2 San Juan River from the confluence with
Chinle Creek to the Confluence with
Montezuma Creek within State
Jurisdiction
5 Not Supporting Aluminum, Dissolved 3B Low 2016 31
Cadmium, Dissolved 3B Low 2016 31
Iron, Dissolved 3B Low 2016 31
Lead, Dissolved 3B Low 2016 31
Colorado River
Southeast
UT14030001-003_00 Westwater Creek Westwater Creek and tributaries from
confluence with Colorado River to
headwaters
5 Not Supporting Temperature 3B Low 2012 18
Total Dissolved Solids 4 Low 2012 18
Colorado River
Southeast
UT14080201-008_00 Westwater Creek Westwater Creek and tributaries from
confluence with Cottonwood Wash to
headwaters
5 Not Supporting Dissolved Oxygen 3B Low 2012 6
Selenium, Dissolved 3B Low 2012 6
Colorado River
Southeast
UT14030001-004_00 Bitter Creek Bitter Creek and tributaries from Colorado
River to headwaters
3 Insufficient Data* 0
Colorado River
Southeast
UT14080201-001_00 Butler Wash Butler Wash and tributaries from
confluence with San Juan River to
headwaters
3 Insufficient Data* 8
Colorado River
Southeast
UT14030005-012_00 Castle Creek-2 Castle Creek and tributaries from
Seventh-Day Adventist diversion to
headwaters
3 Insufficient Data* 7
Colorado River
Southeast
UT14070001-003_00 Colorado River-2 Colorado River from Dirty Devil
confluence to Green River confluence
3 Insufficient Data* 15
Colorado River
Southeast
UT14030005-017_00 Courthouse Wash 3 Insufficient Data* 1
Colorado River
Southeast
UT14030005-018_00 Courthouse Wash 3 Insufficient Data* 1
Colorado River
Southeast
UT14080205-002_00 Grand Gulch 3 Insufficient Data* 0
Colorado River
Southeast
UT14030004-002_00 Granite Creek - CRSE Granite Creek and tributaries from
confluence with Dolores River to Utah-
Colorado state line
3 Insufficient Data* 11
Colorado River
Southeast
UT14030005-014_00 Indian Creek-1 Indian Creek from confluence with North
Cottonwood Creek near Dugout Ranch to
northern boundary of Newspaper Rock
State Park
3 Insufficient Data* 9
Colorado River
Southeast
UT14030002-001_00 La Sal Creek La Sal Creek and tributaries from Utah-
Colorado state line to headwaters
3 Insufficient Data* 24
Colorado River
Southeast
UT14070001-005_00 Lake Canyon 3 Insufficient Data* 0
Colorado River
Southeast
UT14030001-002_00 Little Dolores River Little Dolores River from confluence with
Colorado River to Utah-Colorado state
line
3 Insufficient Data* 0
Colorado River
Southeast
UT14080202-001_00 McElmo Creek McElmo Creek and tributaries from the
confluence with San Juan River to Utah-
Colorado state line within State
Jurisdiction
3 Insufficient Data* 1
* Please refer to the 2012/2014 and 2016 IR data files for the sub-category 3 details.
** Phase II of TMDL in Progress.
***Impairment temporary: site specific TDS criterion should apply until WQS change. 8 of 49
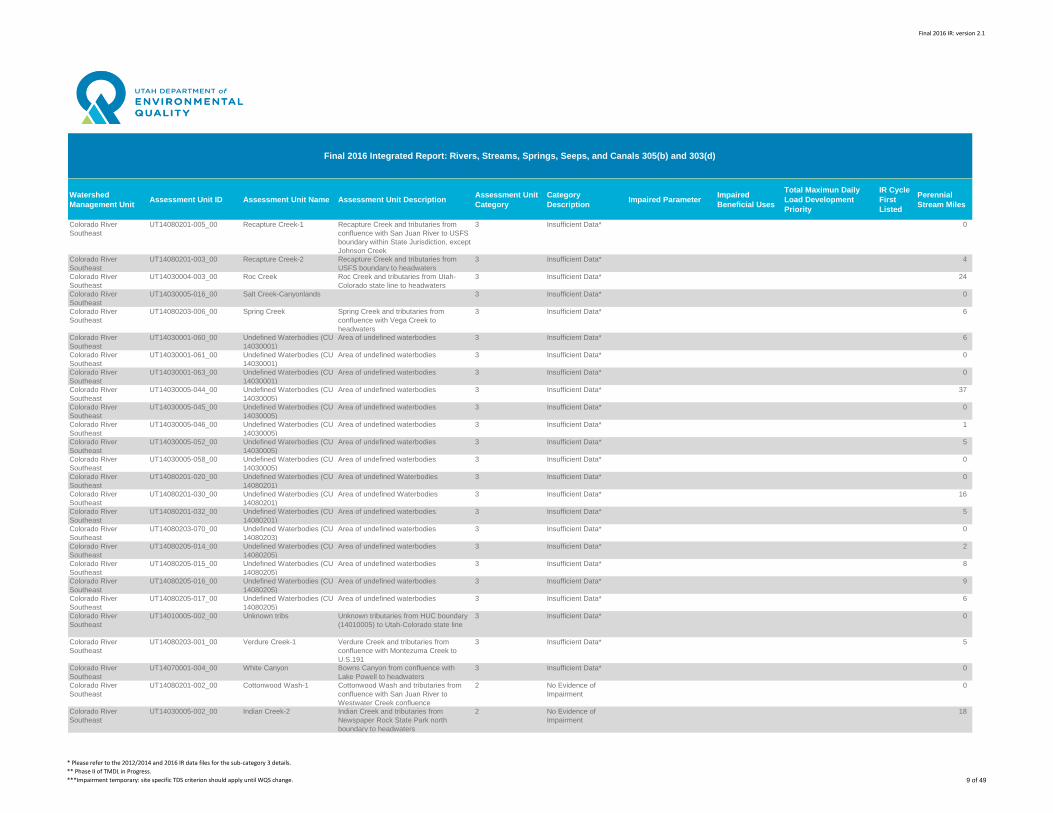
Final 2016 IR: version 2.1
Watershed
Management UnitAssessment Unit ID Assessment Unit Name Assessment Unit Description
Assessment Unit
Category
Category
DescriptionImpaired Parameter
Impaired
Beneficial Uses
Total Maximun Daily
Load Development
Priority
IR Cycle
First
Listed
Perennial
Stream Miles
Final 2016 Integrated Report: Rivers, Streams, Springs, Seeps, and Canals 305(b) and 303(d)
Colorado River
Southeast
UT14080201-005_00 Recapture Creek-1 Recapture Creek and tributaries from
confluence with San Juan River to USFS
boundary within State Jurisdiction, except
Johnson Creek
3 Insufficient Data* 0
Colorado River
Southeast
UT14080201-003_00 Recapture Creek-2 Recapture Creek and tributaries from
USFS boundary to headwaters
3 Insufficient Data* 4
Colorado River
Southeast
UT14030004-003_00 Roc Creek Roc Creek and tributaries from Utah-
Colorado state line to headwaters
3 Insufficient Data* 24
Colorado River
Southeast
UT14030005-016_00 Salt Creek-Canyonlands 3 Insufficient Data* 0
Colorado River
Southeast
UT14080203-006_00 Spring Creek Spring Creek and tributaries from
confluence with Vega Creek to
headwaters
3 Insufficient Data* 6
Colorado River
Southeast
UT14030001-060_00 Undefined Waterbodies (CU
14030001)
Area of undefined waterbodies 3 Insufficient Data* 6
Colorado River
Southeast
UT14030001-061_00 Undefined Waterbodies (CU
14030001)
Area of undefined waterbodies 3 Insufficient Data* 0
Colorado River
Southeast
UT14030001-063_00 Undefined Waterbodies (CU
14030001)
Area of undefined waterbodies 3 Insufficient Data* 0
Colorado River
Southeast
UT14030005-044_00 Undefined Waterbodies (CU
14030005)
Area of undefined waterbodies 3 Insufficient Data* 37
Colorado River
Southeast
UT14030005-045_00 Undefined Waterbodies (CU
14030005)
Area of undefined waterbodies 3 Insufficient Data* 0
Colorado River
Southeast
UT14030005-046_00 Undefined Waterbodies (CU
14030005)
Area of undefined waterbodies 3 Insufficient Data* 1
Colorado River
Southeast
UT14030005-052_00 Undefined Waterbodies (CU
14030005)
Area of undefined waterbodies 3 Insufficient Data* 5
Colorado River
Southeast
UT14030005-058_00 Undefined Waterbodies (CU
14030005)
Area of undefined waterbodies 3 Insufficient Data* 0
Colorado River
Southeast
UT14080201-020_00 Undefined Waterbodies (CU
14080201)
Area of undefined Waterbodies 3 Insufficient Data* 0
Colorado River
Southeast
UT14080201-030_00 Undefined Waterbodies (CU
14080201)
Area of undefined Waterbodies 3 Insufficient Data* 16
Colorado River
Southeast
UT14080201-032_00 Undefined Waterbodies (CU
14080201)
Area of undefined waterbodies 3 Insufficient Data* 5
Colorado River
Southeast
UT14080203-070_00 Undefined Waterbodies (CU
14080203)
Area of undefined waterbodies 3 Insufficient Data* 0
Colorado River
Southeast
UT14080205-014_00 Undefined Waterbodies (CU
14080205)
Area of undefined waterbodies 3 Insufficient Data* 2
Colorado River
Southeast
UT14080205-015_00 Undefined Waterbodies (CU
14080205)
Area of undefined waterbodies 3 Insufficient Data* 8
Colorado River
Southeast
UT14080205-016_00 Undefined Waterbodies (CU
14080205)
Area of undefined waterbodies 3 Insufficient Data* 9
Colorado River
Southeast
UT14080205-017_00 Undefined Waterbodies (CU
14080205)
Area of undefined waterbodies 3 Insufficient Data* 6
Colorado River
Southeast
UT14010005-002_00 Unknown tribs Unknown tributaries from HUC boundary
(14010005) to Utah-Colorado state line
3 Insufficient Data* 0
Colorado River
Southeast
UT14080203-001_00 Verdure Creek-1 Verdure Creek and tributaries from
confluence with Montezuma Creek to
U.S.191
3 Insufficient Data* 5
Colorado River
Southeast
UT14070001-004_00 White Canyon Bowns Canyon from confluence with
Lake Powell to headwaters
3 Insufficient Data* 0
Colorado River
Southeast
UT14080201-002_00 Cottonwood Wash-1 Cottonwood Wash and tributaries from
confluence with San Juan River to
Westwater Creek confluence
2 No Evidence of
Impairment
0
Colorado River
Southeast
UT14030005-002_00 Indian Creek-2 Indian Creek and tributaries from
Newspaper Rock State Park north
boundary to headwaters
2 No Evidence of
Impairment
18
* Please refer to the 2012/2014 and 2016 IR data files for the sub-category 3 details.
** Phase II of TMDL in Progress.
***Impairment temporary: site specific TDS criterion should apply until WQS change. 9 of 49
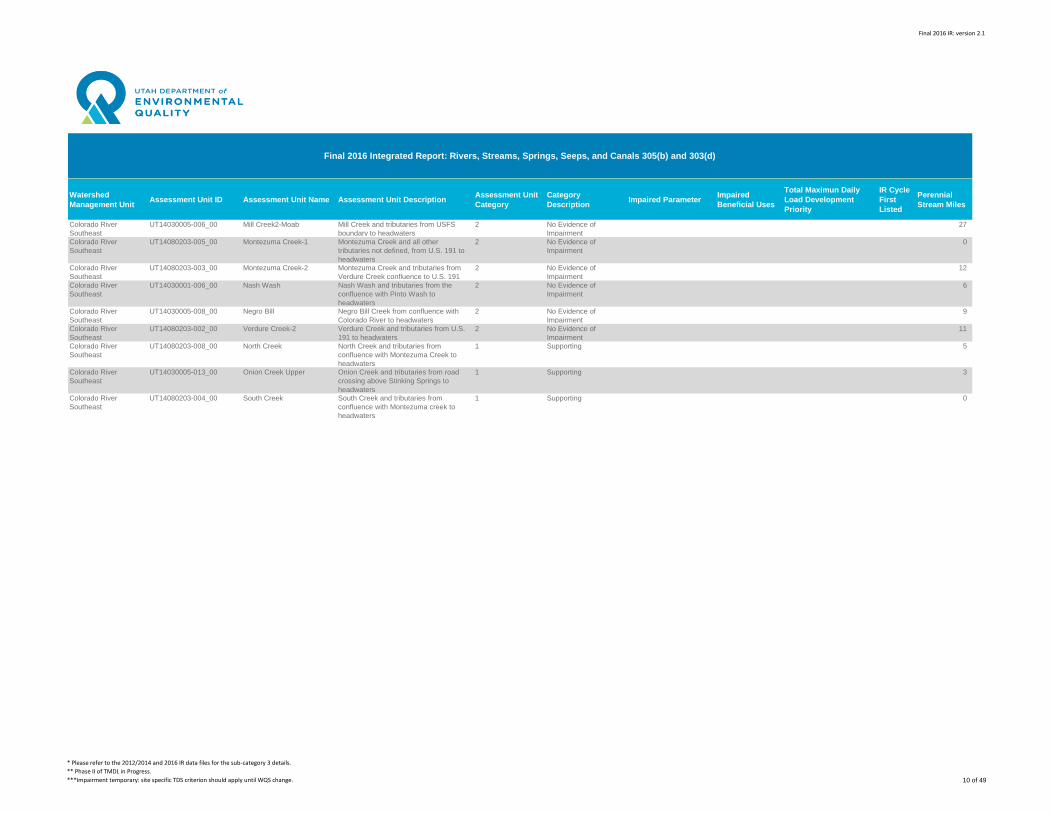
Final 2016 IR: version 2.1
Watershed
Management UnitAssessment Unit ID Assessment Unit Name Assessment Unit Description
Assessment Unit
Category
Category
DescriptionImpaired Parameter
Impaired
Beneficial Uses
Total Maximun Daily
Load Development
Priority
IR Cycle
First
Listed
Perennial
Stream Miles
Final 2016 Integrated Report: Rivers, Streams, Springs, Seeps, and Canals 305(b) and 303(d)
Colorado River
Southeast
UT14030005-006_00 Mill Creek2-Moab Mill Creek and tributaries from USFS
boundary to headwaters
2 No Evidence of
Impairment
27
Colorado River
Southeast
UT14080203-005_00 Montezuma Creek-1 Montezuma Creek and all other
tributaries not defined, from U.S. 191 to
headwaters
2 No Evidence of
Impairment
0
Colorado River
Southeast
UT14080203-003_00 Montezuma Creek-2 Montezuma Creek and tributaries from
Verdure Creek confluence to U.S. 191
2 No Evidence of
Impairment
12
Colorado River
Southeast
UT14030001-006_00 Nash Wash Nash Wash and tributaries from the
confluence with Pinto Wash to
headwaters
2 No Evidence of
Impairment
6
Colorado River
Southeast
UT14030005-008_00 Negro Bill Negro Bill Creek from confluence with
Colorado River to headwaters
2 No Evidence of
Impairment
9
Colorado River
Southeast
UT14080203-002_00 Verdure Creek-2 Verdure Creek and tributaries from U.S.
191 to headwaters
2 No Evidence of
Impairment
11
Colorado River
Southeast
UT14080203-008_00 North Creek North Creek and tributaries from
confluence with Montezuma Creek to
headwaters
1 Supporting 5
Colorado River
Southeast
UT14030005-013_00 Onion Creek Upper Onion Creek and tributaries from road
crossing above Stinking Springs to
headwaters
1 Supporting 3
Colorado River
Southeast
UT14080203-004_00 South Creek South Creek and tributaries from
confluence with Montezuma creek to
headwaters
1 Supporting 0
* Please refer to the 2012/2014 and 2016 IR data files for the sub-category 3 details.
** Phase II of TMDL in Progress.
***Impairment temporary: site specific TDS criterion should apply until WQS change. 10 of 49
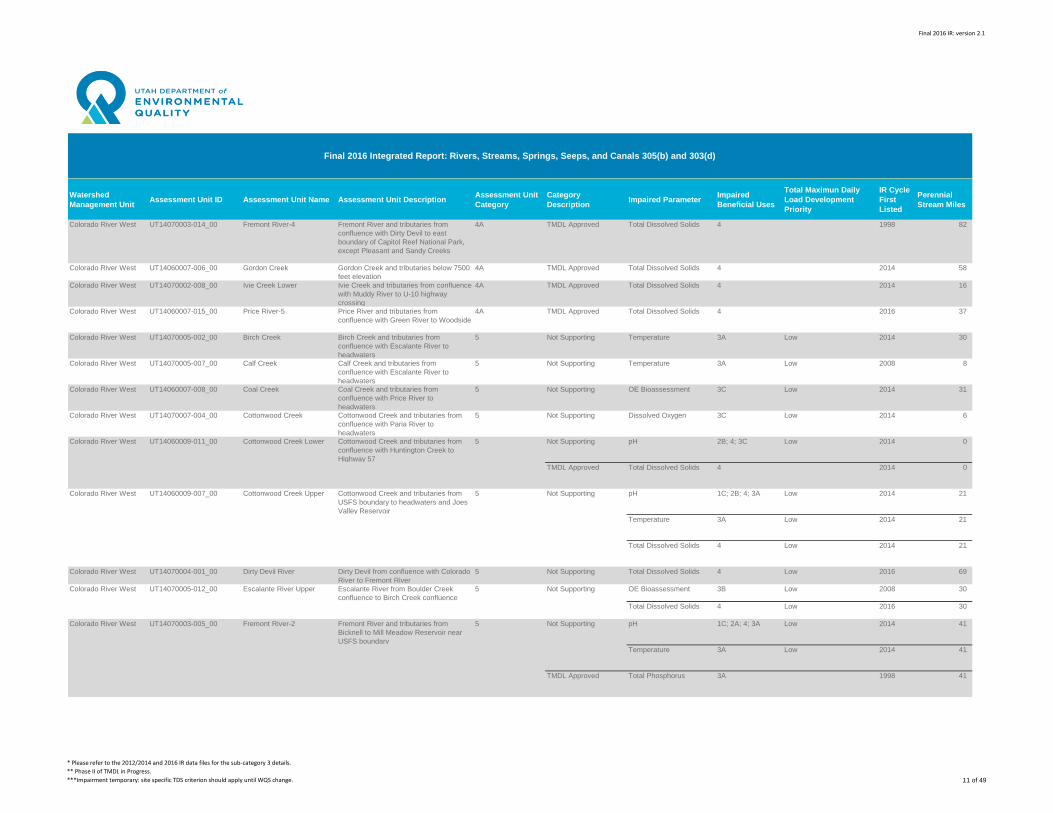
Final 2016 IR: version 2.1
Watershed
Management UnitAssessment Unit ID Assessment Unit Name Assessment Unit Description
Assessment Unit
Category
Category
DescriptionImpaired Parameter
Impaired
Beneficial Uses
Total Maximun Daily
Load Development
Priority
IR Cycle
First
Listed
Perennial
Stream Miles
Final 2016 Integrated Report: Rivers, Streams, Springs, Seeps, and Canals 305(b) and 303(d)
Colorado River West UT14070003-014_00 Fremont River-4 Fremont River and tributaries from
confluence with Dirty Devil to east
boundary of Capitol Reef National Park,
except Pleasant and Sandy Creeks
4A TMDL Approved Total Dissolved Solids 4 1998 82
Colorado River West UT14060007-006_00 Gordon Creek Gordon Creek and tributaries below 7500
feet elevation
4A TMDL Approved Total Dissolved Solids 4 2014 58
Colorado River West UT14070002-008_00 Ivie Creek Lower Ivie Creek and tributaries from confluence
with Muddy River to U-10 highway
crossing
4A TMDL Approved Total Dissolved Solids 4 2014 16
Colorado River West UT14060007-015_00 Price River-5 Price River and tributaries from
confluence with Green River to Woodside
4A TMDL Approved Total Dissolved Solids 4 2016 37
Colorado River West UT14070005-002_00 Birch Creek Birch Creek and tributaries from
confluence with Escalante River to
headwaters
5 Not Supporting Temperature 3A Low 2014 30
Colorado River West UT14070005-007_00 Calf Creek Calf Creek and tributaries from
confluence with Escalante River to
headwaters
5 Not Supporting Temperature 3A Low 2008 8
Colorado River West UT14060007-008_00 Coal Creek Coal Creek and tributaries from
confluence with Price River to
headwaters
5 Not Supporting OE Bioassessment 3C Low 2014 31
Colorado River West UT14070007-004_00 Cottonwood Creek Cottonwood Creek and tributaries from
confluence with Paria River to
headwaters
5 Not Supporting Dissolved Oxygen 3C Low 2014 6
Colorado River West UT14060009-011_00 Cottonwood Creek Lower Cottonwood Creek and tributaries from
confluence with Huntington Creek to
Highway 57
5 Not Supporting pH 2B; 4; 3C Low 2014 0
TMDL Approved Total Dissolved Solids 4 2014 0
Colorado River West UT14060009-007_00 Cottonwood Creek Upper Cottonwood Creek and tributaries from
USFS boundary to headwaters and Joes
Valley Reservoir
5 Not Supporting pH 1C; 2B; 4; 3A Low 2014 21
Temperature 3A Low 2014 21
Total Dissolved Solids 4 Low 2014 21
Colorado River West UT14070004-001_00 Dirty Devil River Dirty Devil from confluence with Colorado
River to Fremont River
5 Not Supporting Total Dissolved Solids 4 Low 2016 69
Colorado River West UT14070005-012_00 Escalante River Upper Escalante River from Boulder Creek
confluence to Birch Creek confluence
5 Not Supporting OE Bioassessment 3B Low 2008 30
Total Dissolved Solids 4 Low 2016 30
Colorado River West UT14070003-005_00 Fremont River-2 Fremont River and tributaries from
Bicknell to Mill Meadow Reservoir near
USFS boundary
5 Not Supporting pH 1C; 2A; 4; 3A Low 2014 41
Temperature 3A Low 2014 41
TMDL Approved Total Phosphorus 3A 1998 41
* Please refer to the 2012/2014 and 2016 IR data files for the sub-category 3 details.
** Phase II of TMDL in Progress.
***Impairment temporary: site specific TDS criterion should apply until WQS change. 11 of 49
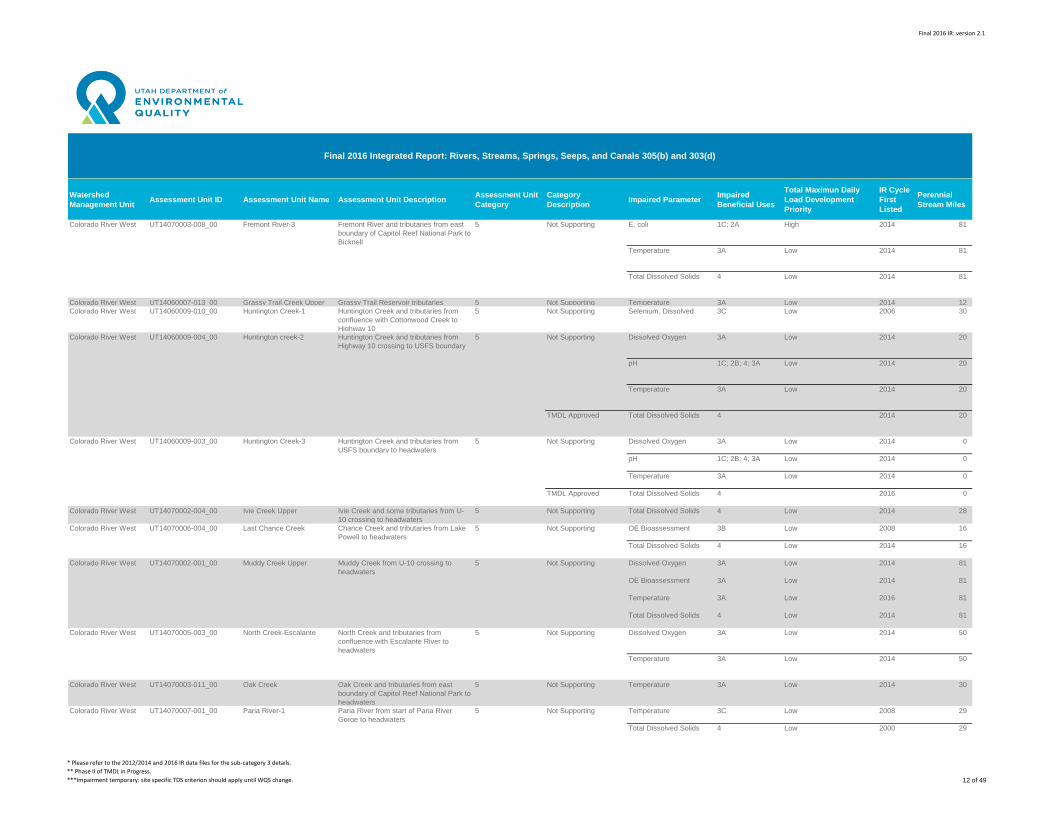
Final 2016 IR: version 2.1
Watershed
Management UnitAssessment Unit ID Assessment Unit Name Assessment Unit Description
Assessment Unit
Category
Category
DescriptionImpaired Parameter
Impaired
Beneficial Uses
Total Maximun Daily
Load Development
Priority
IR Cycle
First
Listed
Perennial
Stream Miles
Final 2016 Integrated Report: Rivers, Streams, Springs, Seeps, and Canals 305(b) and 303(d)
Colorado River West UT14070003-008_00 Fremont River-3 Fremont River and tributaries from east
boundary of Capitol Reef National Park to
Bicknell
5 Not Supporting E. coli 1C; 2A High 2014 81
Temperature 3A Low 2014 81
Total Dissolved Solids 4 Low 2014 81
Colorado River West UT14060007-013_00 Grassy Trail Creek Upper Grassy Trail Reservoir tributaries 5 Not Supporting Temperature 3A Low 2014 12
Colorado River West UT14060009-010_00 Huntington Creek-1 Huntington Creek and tributaries from
confluence with Cottonwood Creek to
Highway 10
5 Not Supporting Selenium, Dissolved 3C Low 2006 30
Colorado River West UT14060009-004_00 Huntington creek-2 Huntington Creek and tributaries from
Highway 10 crossing to USFS boundary
5 Not Supporting Dissolved Oxygen 3A Low 2014 20
pH 1C; 2B; 4; 3A Low 2014 20
Temperature 3A Low 2014 20
TMDL Approved Total Dissolved Solids 4 2014 20
Colorado River West UT14060009-003_00 Huntington Creek-3 Huntington Creek and tributaries from
USFS boundary to headwaters
5 Not Supporting Dissolved Oxygen 3A Low 2014 0
pH 1C; 2B; 4; 3A Low 2014 0
Temperature 3A Low 2014 0
TMDL Approved Total Dissolved Solids 4 2016 0
Colorado River West UT14070002-004_00 Ivie Creek Upper Ivie Creek and some tributaries from U-
10 crossing to headwaters
5 Not Supporting Total Dissolved Solids 4 Low 2014 28
Colorado River West UT14070006-004_00 Last Chance Creek Chance Creek and tributaries from Lake
Powell to headwaters
5 Not Supporting OE Bioassessment 3B Low 2008 16
Total Dissolved Solids 4 Low 2014 16
Colorado River West UT14070002-001_00 Muddy Creek Upper Muddy Creek from U-10 crossing to
headwaters
5 Not Supporting Dissolved Oxygen 3A Low 2014 81
OE Bioassessment 3A Low 2014 81
Temperature 3A Low 2016 81
Total Dissolved Solids 4 Low 2014 81
Colorado River West UT14070005-003_00 North Creek-Escalante North Creek and tributaries from
confluence with Escalante River to
headwaters
5 Not Supporting Dissolved Oxygen 3A Low 2014 50
Temperature 3A Low 2014 50
Colorado River West UT14070003-011_00 Oak Creek Oak Creek and tributaries from east
boundary of Capitol Reef National Park to
headwaters
5 Not Supporting Temperature 3A Low 2014 30
Colorado River West UT14070007-001_00 Paria River-1 Paria River from start of Paria River
Gorge to headwaters
5 Not Supporting Temperature 3C Low 2008 29
Total Dissolved Solids 4 Low 2000 29
* Please refer to the 2012/2014 and 2016 IR data files for the sub-category 3 details.
** Phase II of TMDL in Progress.
***Impairment temporary: site specific TDS criterion should apply until WQS change. 12 of 49
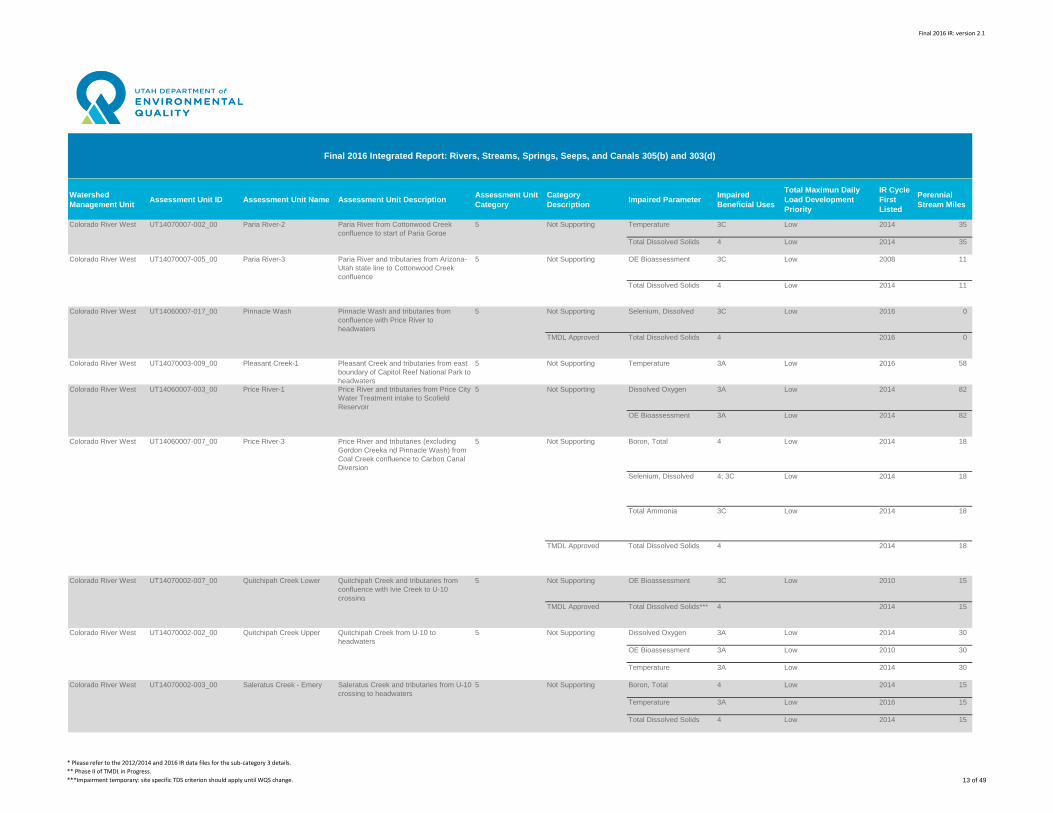
Final 2016 IR: version 2.1
Watershed
Management UnitAssessment Unit ID Assessment Unit Name Assessment Unit Description
Assessment Unit
Category
Category
DescriptionImpaired Parameter
Impaired
Beneficial Uses
Total Maximun Daily
Load Development
Priority
IR Cycle
First
Listed
Perennial
Stream Miles
Final 2016 Integrated Report: Rivers, Streams, Springs, Seeps, and Canals 305(b) and 303(d)
Colorado River West UT14070007-002_00 Paria River-2 Paria River from Cottonwood Creek
confluence to start of Paria Gorge
5 Not Supporting Temperature 3C Low 2014 35
Total Dissolved Solids 4 Low 2014 35
Colorado River West UT14070007-005_00 Paria River-3 Paria River and tributaries from Arizona-
Utah state line to Cottonwood Creek
confluence
5 Not Supporting OE Bioassessment 3C Low 2008 11
Total Dissolved Solids 4 Low 2014 11
Colorado River West UT14060007-017_00 Pinnacle Wash Pinnacle Wash and tributaries from
confluence with Price River to
headwaters
5 Not Supporting Selenium, Dissolved 3C Low 2016 0
TMDL Approved Total Dissolved Solids 4 2016 0
Colorado River West UT14070003-009_00 Pleasant Creek-1 Pleasant Creek and tributaries from east
boundary of Capitol Reef National Park to
headwaters
5 Not Supporting Temperature 3A Low 2016 58
Colorado River West UT14060007-003_00 Price River-1 Price River and tributaries from Price City
Water Treatment intake to Scofield
Reservoir
5 Not Supporting Dissolved Oxygen 3A Low 2014 82
OE Bioassessment 3A Low 2014 82
Colorado River West UT14060007-007_00 Price River-3 Price River and tributaries (excluding
Gordon Creeka nd Pinnacle Wash) from
Coal Creek confluence to Carbon Canal
Diversion
5 Not Supporting Boron, Total 4 Low 2014 18
Selenium, Dissolved 4; 3C Low 2014 18
Total Ammonia 3C Low 2014 18
TMDL Approved Total Dissolved Solids 4 2014 18
Colorado River West UT14070002-007_00 Quitchipah Creek Lower Quitchipah Creek and tributaries from
confluence with Ivie Creek to U-10
crossing
5 Not Supporting OE Bioassessment 3C Low 2010 15
TMDL Approved Total Dissolved Solids*** 4 2014 15
Colorado River West UT14070002-002_00 Quitchipah Creek Upper Quitchipah Creek from U-10 to
headwaters
5 Not Supporting Dissolved Oxygen 3A Low 2014 30
OE Bioassessment 3A Low 2010 30
Temperature 3A Low 2014 30
Colorado River West UT14070002-003_00 Saleratus Creek - Emery Saleratus Creek and tributaries from U-10
crossing to headwaters
5 Not Supporting Boron, Total 4 Low 2014 15
Temperature 3A Low 2016 15
Total Dissolved Solids 4 Low 2014 15
* Please refer to the 2012/2014 and 2016 IR data files for the sub-category 3 details.
** Phase II of TMDL in Progress.
***Impairment temporary: site specific TDS criterion should apply until WQS change. 13 of 49
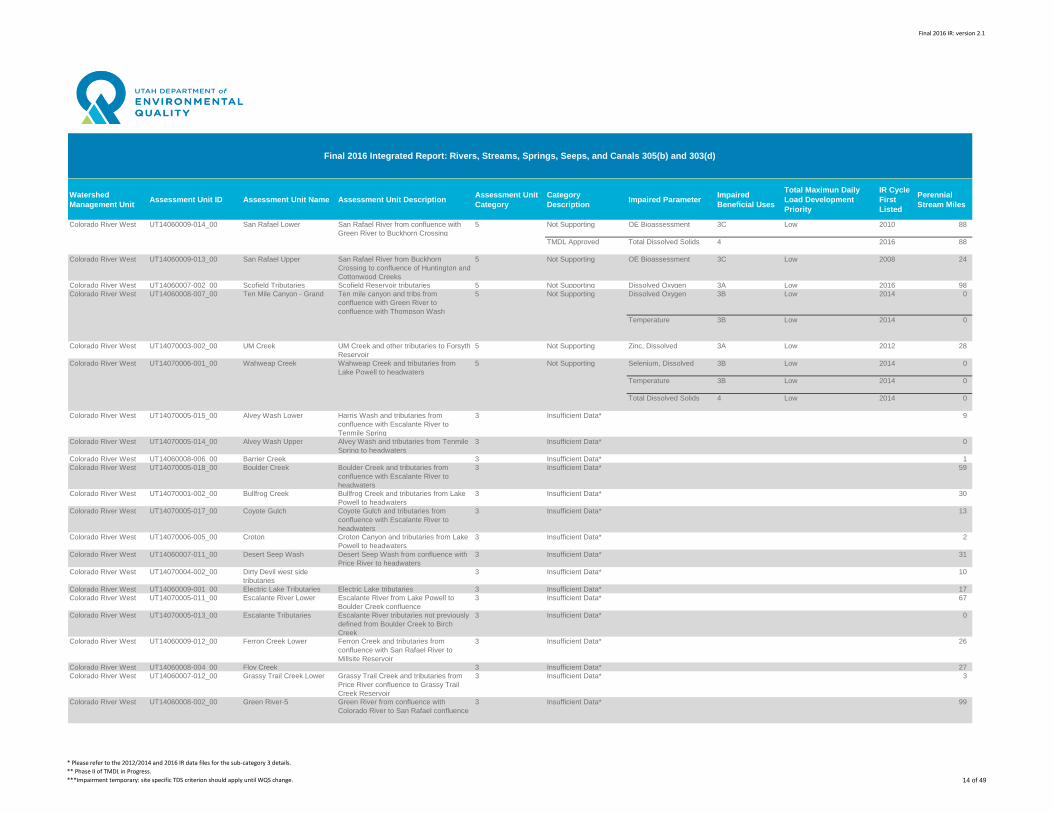
Final 2016 IR: version 2.1
Watershed
Management UnitAssessment Unit ID Assessment Unit Name Assessment Unit Description
Assessment Unit
Category
Category
DescriptionImpaired Parameter
Impaired
Beneficial Uses
Total Maximun Daily
Load Development
Priority
IR Cycle
First
Listed
Perennial
Stream Miles
Final 2016 Integrated Report: Rivers, Streams, Springs, Seeps, and Canals 305(b) and 303(d)
Colorado River West UT14060009-014_00 San Rafael Lower San Rafael River from confluence with
Green River to Buckhorn Crossing
5 Not Supporting OE Bioassessment 3C Low 2010 88
TMDL Approved Total Dissolved Solids 4 2016 88
Colorado River West UT14060009-013_00 San Rafael Upper San Rafael River from Buckhorn
Crossing to confluence of Huntington and
Cottonwood Creeks
5 Not Supporting OE Bioassessment 3C Low 2008 24
Colorado River West UT14060007-002_00 Scofield Tributaries Scofield Reservoir tributaries 5 Not Supporting Dissolved Oxygen 3A Low 2016 98
Colorado River West UT14060008-007_00 Ten Mile Canyon - Grand Ten mile canyon and tribs from
confluence with Green River to
confluence with Thompson Wash
5 Not Supporting Dissolved Oxygen 3B Low 2014 0
Temperature 3B Low 2014 0
Colorado River West UT14070003-002_00 UM Creek UM Creek and other tributaries to Forsyth
Reservoir
5 Not Supporting Zinc, Dissolved 3A Low 2012 28
Colorado River West UT14070006-001_00 Wahweap Creek Wahweap Creek and tributaries from
Lake Powell to headwaters
5 Not Supporting Selenium, Dissolved 3B Low 2014 0
Temperature 3B Low 2014 0
Total Dissolved Solids 4 Low 2014 0
Colorado River West UT14070005-015_00 Alvey Wash Lower Harris Wash and tributaries from
confluence with Escalante River to
Tenmile Spring
3 Insufficient Data* 9
Colorado River West UT14070005-014_00 Alvey Wash Upper Alvey Wash and tributaries from Tenmile
Spring to headwaters
3 Insufficient Data* 0
Colorado River West UT14060008-006_00 Barrier Creek 3 Insufficient Data* 1
Colorado River West UT14070005-018_00 Boulder Creek Boulder Creek and tributaries from
confluence with Escalante River to
headwaters
3 Insufficient Data* 59
Colorado River West UT14070001-002_00 Bullfrog Creek Bullfrog Creek and tributaries from Lake
Powell to headwaters
3 Insufficient Data* 30
Colorado River West UT14070005-017_00 Coyote Gulch Coyote Gulch and tributaries from
confluence with Escalante River to
headwaters
3 Insufficient Data* 13
Colorado River West UT14070006-005_00 Croton Croton Canyon and tributaries from Lake
Powell to headwaters
3 Insufficient Data* 2
Colorado River West UT14060007-011_00 Desert Seep Wash Desert Seep Wash from confluence with
Price River to headwaters
3 Insufficient Data* 31
Colorado River West UT14070004-002_00 Dirty Devil west side
tributaries
3 Insufficient Data* 10
Colorado River West UT14060009-001_00 Electric Lake Tributaries Electric Lake tributaries 3 Insufficient Data* 17
Colorado River West UT14070005-011_00 Escalante River Lower Escalante River from Lake Powell to
Boulder Creek confluence
3 Insufficient Data* 67
Colorado River West UT14070005-013_00 Escalante Tributaries Escalante River tributaries not previously
defined from Boulder Creek to Birch
Creek
3 Insufficient Data* 0
Colorado River West UT14060009-012_00 Ferron Creek Lower Ferron Creek and tributaries from
confluence with San Rafael River to
Millsite Reservoir
3 Insufficient Data* 26
Colorado River West UT14060008-004_00 Floy Creek 3 Insufficient Data* 27
Colorado River West UT14060007-012_00 Grassy Trail Creek Lower Grassy Trail Creek and tributaries from
Price River confluence to Grassy Trail
Creek Reservoir
3 Insufficient Data* 3
Colorado River West UT14060008-002_00 Green River-5 Green River from confluence with
Colorado River to San Rafael confluence
3 Insufficient Data* 99
* Please refer to the 2012/2014 and 2016 IR data files for the sub-category 3 details.
** Phase II of TMDL in Progress.
***Impairment temporary: site specific TDS criterion should apply until WQS change. 14 of 49

Final 2016 IR: version 2.1
Watershed
Management UnitAssessment Unit ID Assessment Unit Name Assessment Unit Description
Assessment Unit
Category
Category
DescriptionImpaired Parameter
Impaired
Beneficial Uses
Total Maximun Daily
Load Development
Priority
IR Cycle
First
Listed
Perennial
Stream Miles
Final 2016 Integrated Report: Rivers, Streams, Springs, Seeps, and Canals 305(b) and 303(d)
Colorado River West UT14070003-013_00 Henry Mountains Henry Mountain streams in Garfield
County whicih flow west and north as
Fremont River tributaries
3 Insufficient Data* 31
Colorado River West UT14060008-005_00 Horse Canyon-Canyonlands 3 Insufficient Data* 0
Colorado River West UT14070003-001_00 Johnson Valley Johnson Valley Reservoir tributaries 3 Insufficient Data* 18
Colorado River West UT14070006-003_00 Lake Powell Tribs-1 Lake Powell north side tributaries
between Wahweap and Warm Creek
3 Insufficient Data* 0
Colorado River West UT14070006-008_00 Lake Powell Tribs-2 Lake Powell north side tributaries
between Warm and Chance Creeks
3 Insufficient Data* 0
Colorado River West UT14070006-006_00 Lake Powell Tribs-3 Lake Powell tributaries from Croton
Canyon to HUC boundary
3 Insufficient Data* 0
Colorado River West UT14070006-007_00 Lake Powell Tributaries-4 Lake Powell south side tributaries from
Utah-Arizona state line to HUC
(14070006) boundary
3 Insufficient Data* 3
Colorado River West UT14070002-005_00 Last Chance Creek Last Chance Creek and tributaries from
Ivie Creek confluence to headwaters
3 Insufficient Data* 4
Colorado River West UT14060009-002_00 LF Huntington Creek Left Fork Huntington Creek and
tributaries from confluence with
Huntington Creek to headwaters
3 Insufficient Data* 41
Colorado River West UT14070005-019_00 Lower Escalante River
trbiutaries
3 Insufficient Data* 0
Colorado River West UT14060009-005_00 Lowery Water Lowery Water and tributaries from Joes
Valley Reservoir to headwaters
3 Insufficient Data* 51
Colorado River West UT14070005-005_00 Mamie Creek Mamie Creek and tributaries from
confluence with Escalante River to
headwaters
3 Insufficient Data* 0
Colorado River West UT14060007-010_00 Miller Creek Miller Creek and tributaries below 7500
feet elevation
3 Insufficient Data* 28
Colorado River West UT14070002-009_00 Muddy Creek Lower Muddy Creek from confluence with
Freemont River to Ivie Creek confluence
3 Insufficient Data* 85
Colorado River West UT14070002-006_00 Muddy Creek Middle Muddy Creek and tributaries from Ivie
Creek confluence to U-10 crossing
3 Insufficient Data* 20
Colorado River West UT14070001-006_00 Navajo Long Creek 3 Insufficient Data* 0
Colorado River West UT14070001-093_00 North Wash North Wash from Lake Powell to
headwaters
3 Insufficient Data* 9
Colorado River West UT14070005-004_00 Pine Creek Pine Creek and tributaries from
confluence with Escalante River to
headwaters
3 Insufficient Data* 33
Colorado River West UT14070003-006_00 Pine Creek (Wayne Co) Pine Creek and tributaries from
confluence with Fremont River to
headwaters
3 Insufficient Data* 21
Colorado River West UT14070003-010_00 Pleasant Creek-2 Pleasant Creek and tributaries from
confluence with Fremont River to east
boundary of Capitol Reef National Park
3 Insufficient Data* 10
Colorado River West UT14060007-005_00 Price River-2 Price River and tributaries from Carbon
Canal Diversion to Price City Water
Treatment intake
3 Insufficient Data* 9
Colorado River West UT14060007-014_00 Price River-4 Price River and tributaries (except Desert
Seep Wash, Miller Creek, and Grassy
Trail Creek) from Woodside to Soldier
Creek confluence
3 Insufficient Data* 70
Colorado River West UT14060007-009_00 Soldier Creek Soldier Creek and tributaries from
confluence with Price River to
headwaters
3 Insufficient Data* 23
Colorado River West UT14070001-094_00 Trachyte Creek Trachyte Creek and tributaries from Lake
Powell to headwaters
3 Insufficient Data* 8
* Please refer to the 2012/2014 and 2016 IR data files for the sub-category 3 details.
** Phase II of TMDL in Progress.
***Impairment temporary: site specific TDS criterion should apply until WQS change. 15 of 49
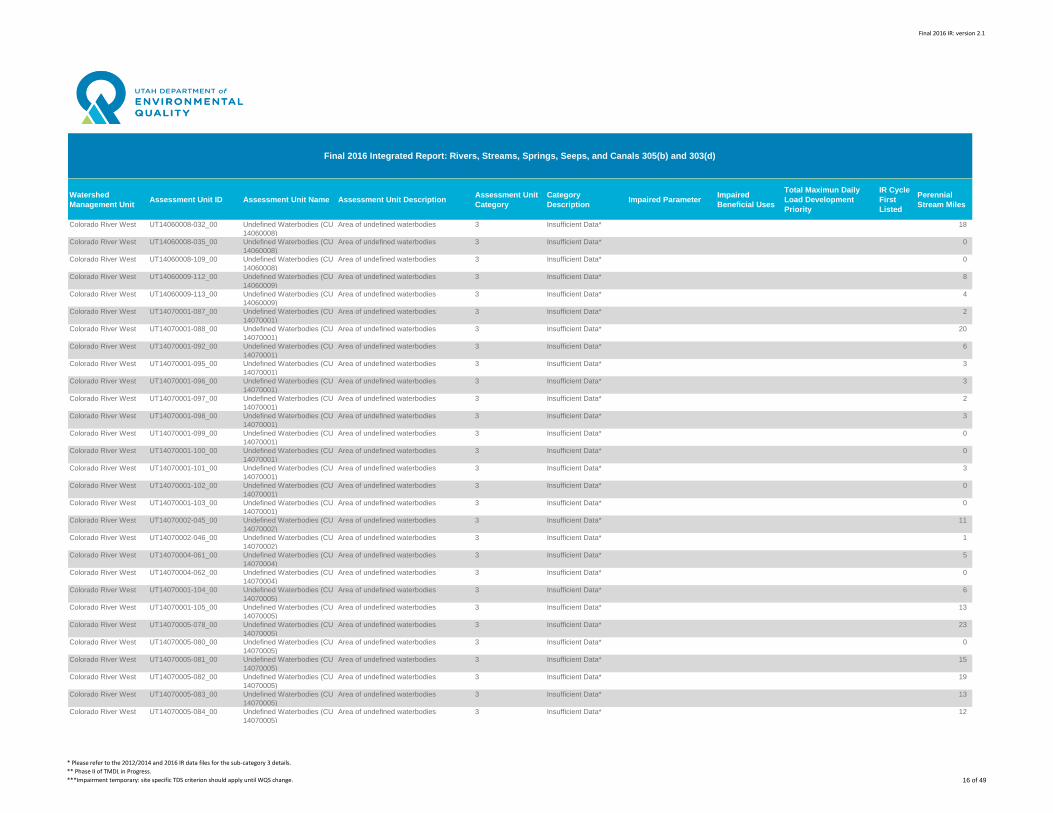
Final 2016 IR: version 2.1
Watershed
Management UnitAssessment Unit ID Assessment Unit Name Assessment Unit Description
Assessment Unit
Category
Category
DescriptionImpaired Parameter
Impaired
Beneficial Uses
Total Maximun Daily
Load Development
Priority
IR Cycle
First
Listed
Perennial
Stream Miles
Final 2016 Integrated Report: Rivers, Streams, Springs, Seeps, and Canals 305(b) and 303(d)
Colorado River West UT14060008-032_00 Undefined Waterbodies (CU
14060008)
Area of undefined waterbodies 3 Insufficient Data* 18
Colorado River West UT14060008-035_00 Undefined Waterbodies (CU
14060008)
Area of undefined waterbodies 3 Insufficient Data* 0
Colorado River West UT14060008-109_00 Undefined Waterbodies (CU
14060008)
Area of undefined waterbodies 3 Insufficient Data* 0
Colorado River West UT14060009-112_00 Undefined Waterbodies (CU
14060009)
Area of undefined waterbodies 3 Insufficient Data* 8
Colorado River West UT14060009-113_00 Undefined Waterbodies (CU
14060009)
Area of undefined waterbodies 3 Insufficient Data* 4
Colorado River West UT14070001-087_00 Undefined Waterbodies (CU
14070001)
Area of undefined waterbodies 3 Insufficient Data* 2
Colorado River West UT14070001-088_00 Undefined Waterbodies (CU
14070001)
Area of undefined waterbodies 3 Insufficient Data* 20
Colorado River West UT14070001-092_00 Undefined Waterbodies (CU
14070001)
Area of undefined waterbodies 3 Insufficient Data* 6
Colorado River West UT14070001-095_00 Undefined Waterbodies (CU
14070001)
Area of undefined waterbodies 3 Insufficient Data* 3
Colorado River West UT14070001-096_00 Undefined Waterbodies (CU
14070001)
Area of undefined waterbodies 3 Insufficient Data* 3
Colorado River West UT14070001-097_00 Undefined Waterbodies (CU
14070001)
Area of undefined waterbodies 3 Insufficient Data* 2
Colorado River West UT14070001-098_00 Undefined Waterbodies (CU
14070001)
Area of undefined waterbodies 3 Insufficient Data* 3
Colorado River West UT14070001-099_00 Undefined Waterbodies (CU
14070001)
Area of undefined waterbodies 3 Insufficient Data* 0
Colorado River West UT14070001-100_00 Undefined Waterbodies (CU
14070001)
Area of undefined waterbodies 3 Insufficient Data* 0
Colorado River West UT14070001-101_00 Undefined Waterbodies (CU
14070001)
Area of undefined waterbodies 3 Insufficient Data* 3
Colorado River West UT14070001-102_00 Undefined Waterbodies (CU
14070001)
Area of undefined waterbodies 3 Insufficient Data* 0
Colorado River West UT14070001-103_00 Undefined Waterbodies (CU
14070001)
Area of undefined waterbodies 3 Insufficient Data* 0
Colorado River West UT14070002-045_00 Undefined Waterbodies (CU
14070002)
Area of undefined waterbodies 3 Insufficient Data* 11
Colorado River West UT14070002-046_00 Undefined Waterbodies (CU
14070002)
Area of undefined waterbodies 3 Insufficient Data* 1
Colorado River West UT14070004-061_00 Undefined Waterbodies (CU
14070004)
Area of undefined waterbodies 3 Insufficient Data* 5
Colorado River West UT14070004-062_00 Undefined Waterbodies (CU
14070004)
Area of undefined waterbodies 3 Insufficient Data* 0
Colorado River West UT14070001-104_00 Undefined Waterbodies (CU
14070005)
Area of undefined waterbodies 3 Insufficient Data* 6
Colorado River West UT14070001-105_00 Undefined Waterbodies (CU
14070005)
Area of undefined waterbodies 3 Insufficient Data* 13
Colorado River West UT14070005-078_00 Undefined Waterbodies (CU
14070005)
Area of undefined waterbodies 3 Insufficient Data* 23
Colorado River West UT14070005-080_00 Undefined Waterbodies (CU
14070005)
Area of undefined waterbodies 3 Insufficient Data* 0
Colorado River West UT14070005-081_00 Undefined Waterbodies (CU
14070005)
Area of undefined waterbodies 3 Insufficient Data* 15
Colorado River West UT14070005-082_00 Undefined Waterbodies (CU
14070005)
Area of undefined waterbodies 3 Insufficient Data* 19
Colorado River West UT14070005-083_00 Undefined Waterbodies (CU
14070005)
Area of undefined waterbodies 3 Insufficient Data* 13
Colorado River West UT14070005-084_00 Undefined Waterbodies (CU
14070005)
Area of undefined waterbodies 3 Insufficient Data* 12
* Please refer to the 2012/2014 and 2016 IR data files for the sub-category 3 details.
** Phase II of TMDL in Progress.
***Impairment temporary: site specific TDS criterion should apply until WQS change. 16 of 49
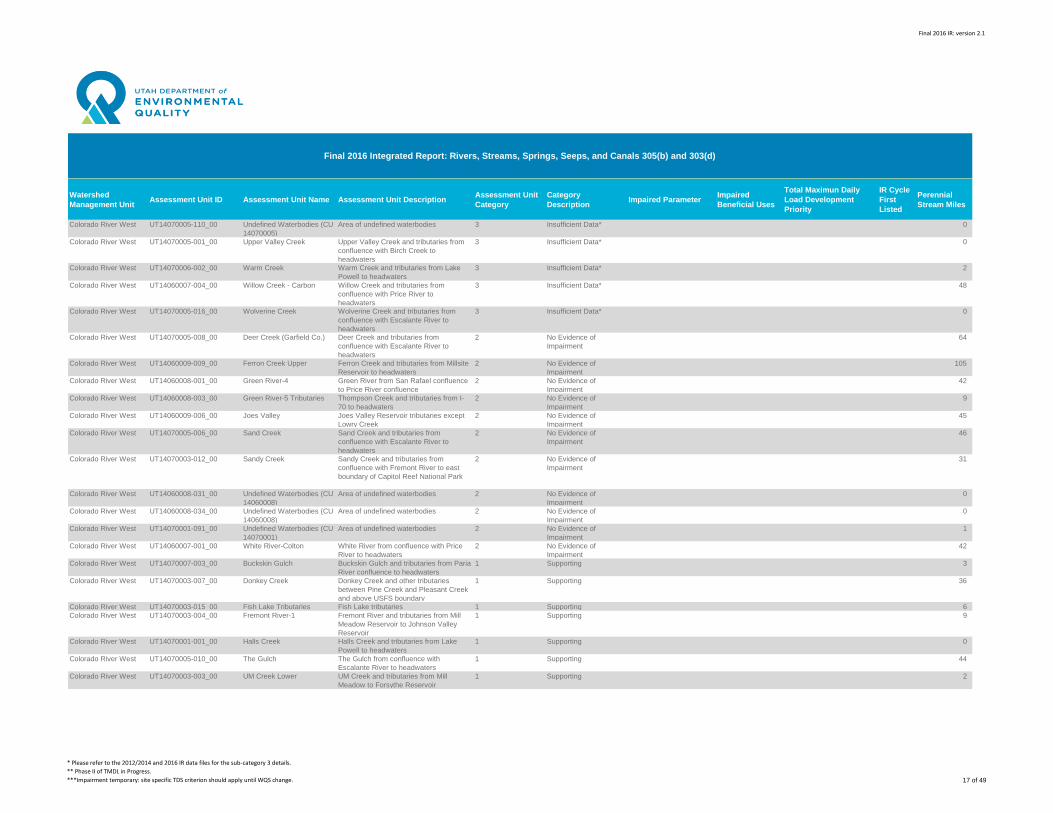
Final 2016 IR: version 2.1
Watershed
Management UnitAssessment Unit ID Assessment Unit Name Assessment Unit Description
Assessment Unit
Category
Category
DescriptionImpaired Parameter
Impaired
Beneficial Uses
Total Maximun Daily
Load Development
Priority
IR Cycle
First
Listed
Perennial
Stream Miles
Final 2016 Integrated Report: Rivers, Streams, Springs, Seeps, and Canals 305(b) and 303(d)
Colorado River West UT14070005-110_00 Undefined Waterbodies (CU
14070005)
Area of undefined waterbodies 3 Insufficient Data* 0
Colorado River West UT14070005-001_00 Upper Valley Creek Upper Valley Creek and tributaries from
confluence with Birch Creek to
headwaters
3 Insufficient Data* 0
Colorado River West UT14070006-002_00 Warm Creek Warm Creek and tributaries from Lake
Powell to headwaters
3 Insufficient Data* 2
Colorado River West UT14060007-004_00 Willow Creek - Carbon Willow Creek and tributaries from
confluence with Price River to
headwaters
3 Insufficient Data* 48
Colorado River West UT14070005-016_00 Wolverine Creek Wolverine Creek and tributaries from
confluence with Escalante River to
headwaters
3 Insufficient Data* 0
Colorado River West UT14070005-008_00 Deer Creek (Garfield Co.) Deer Creek and tributaries from
confluence with Escalante River to
headwaters
2 No Evidence of
Impairment
64
Colorado River West UT14060009-009_00 Ferron Creek Upper Ferron Creek and tributaries from Millsite
Reservoir to headwaters
2 No Evidence of
Impairment
105
Colorado River West UT14060008-001_00 Green River-4 Green River from San Rafael confluence
to Price River confluence
2 No Evidence of
Impairment
42
Colorado River West UT14060008-003_00 Green River-5 Tributaries Thompson Creek and tributaries from I-
70 to headwaters
2 No Evidence of
Impairment
9
Colorado River West UT14060009-006_00 Joes Valley Joes Valley Reservoir tributaries except
Lowry Creek
2 No Evidence of
Impairment
45
Colorado River West UT14070005-006_00 Sand Creek Sand Creek and tributaries from
confluence with Escalante River to
headwaters
2 No Evidence of
Impairment
46
Colorado River West UT14070003-012_00 Sandy Creek Sandy Creek and tributaries from
confluence with Fremont River to east
boundary of Capitol Reef National Park
2 No Evidence of
Impairment
31
Colorado River West UT14060008-031_00 Undefined Waterbodies (CU
14060008)
Area of undefined waterbodies 2 No Evidence of
Impairment
0
Colorado River West UT14060008-034_00 Undefined Waterbodies (CU
14060008)
Area of undefined waterbodies 2 No Evidence of
Impairment
0
Colorado River West UT14070001-091_00 Undefined Waterbodies (CU
14070001)
Area of undefined waterbodies 2 No Evidence of
Impairment
1
Colorado River West UT14060007-001_00 White River-Colton White River from confluence with Price
River to headwaters
2 No Evidence of
Impairment
42
Colorado River West UT14070007-003_00 Buckskin Gulch Buckskin Gulch and tributaries from Paria
River confluence to headwaters
1 Supporting 3
Colorado River West UT14070003-007_00 Donkey Creek Donkey Creek and other tributaries
between Pine Creek and Pleasant Creek
and above USFS boundary
1 Supporting 36
Colorado River West UT14070003-015_00 Fish Lake Tributaries Fish Lake tributaries 1 Supporting 6
Colorado River West UT14070003-004_00 Fremont River-1 Fremont River and tributaries from Mill
Meadow Reservoir to Johnson Valley
Reservoir
1 Supporting 9
Colorado River West UT14070001-001_00 Halls Creek Halls Creek and tributaries from Lake
Powell to headwaters
1 Supporting 0
Colorado River West UT14070005-010_00 The Gulch The Gulch from confluence with
Escalante River to headwaters
1 Supporting 44
Colorado River West UT14070003-003_00 UM Creek Lower UM Creek and tributaries from Mill
Meadow to Forsythe Reservoir
1 Supporting 2
* Please refer to the 2012/2014 and 2016 IR data files for the sub-category 3 details.
** Phase II of TMDL in Progress.
***Impairment temporary: site specific TDS criterion should apply until WQS change. 17 of 49
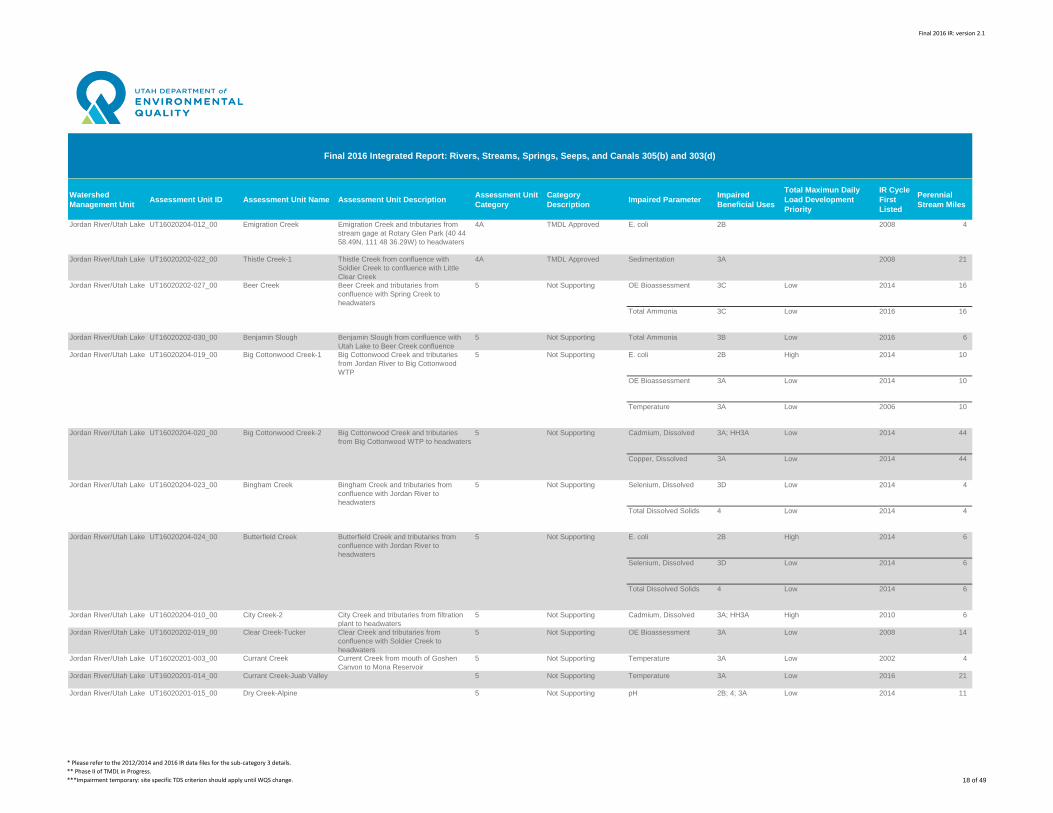
Final 2016 IR: version 2.1
Watershed
Management UnitAssessment Unit ID Assessment Unit Name Assessment Unit Description
Assessment Unit
Category
Category
DescriptionImpaired Parameter
Impaired
Beneficial Uses
Total Maximun Daily
Load Development
Priority
IR Cycle
First
Listed
Perennial
Stream Miles
Final 2016 Integrated Report: Rivers, Streams, Springs, Seeps, and Canals 305(b) and 303(d)
Jordan River/Utah Lake UT16020204-012_00 Emigration Creek Emigration Creek and tributaries from
stream gage at Rotary Glen Park (40 44
58.49N, 111 48 36.29W) to headwaters
4A TMDL Approved E. coli 2B 2008 4
Jordan River/Utah Lake UT16020202-022_00 Thistle Creek-1 Thistle Creek from confluence with
Soldier Creek to confluence with Little
Clear Creek
4A TMDL Approved Sedimentation 3A 2008 21
Jordan River/Utah Lake UT16020202-027_00 Beer Creek Beer Creek and tributaries from
confluence with Spring Creek to
headwaters
5 Not Supporting OE Bioassessment 3C Low 2014 16
Total Ammonia 3C Low 2016 16
Jordan River/Utah Lake UT16020202-030_00 Benjamin Slough Benjamin Slough from confluence with
Utah Lake to Beer Creek confluence
5 Not Supporting Total Ammonia 3B Low 2016 6
Jordan River/Utah Lake UT16020204-019_00 Big Cottonwood Creek-1 Big Cottonwood Creek and tributaries
from Jordan River to Big Cottonwood
WTP
5 Not Supporting E. coli 2B High 2014 10
OE Bioassessment 3A Low 2014 10
Temperature 3A Low 2006 10
Jordan River/Utah Lake UT16020204-020_00 Big Cottonwood Creek-2 Big Cottonwood Creek and tributaries
from Big Cottonwood WTP to headwaters
5 Not Supporting Cadmium, Dissolved 3A; HH3A Low 2014 44
Copper, Dissolved 3A Low 2014 44
Jordan River/Utah Lake UT16020204-023_00 Bingham Creek Bingham Creek and tributaries from
confluence with Jordan River to
headwaters
5 Not Supporting Selenium, Dissolved 3D Low 2014 4
Total Dissolved Solids 4 Low 2014 4
Jordan River/Utah Lake UT16020204-024_00 Butterfield Creek Butterfield Creek and tributaries from
confluence with Jordan River to
headwaters
5 Not Supporting E. coli 2B High 2014 6
Selenium, Dissolved 3D Low 2014 6
Total Dissolved Solids 4 Low 2014 6
Jordan River/Utah Lake UT16020204-010_00 City Creek-2 City Creek and tributaries from filtration
plant to headwaters
5 Not Supporting Cadmium, Dissolved 3A; HH3A High 2010 6
Jordan River/Utah Lake UT16020202-019_00 Clear Creek-Tucker Clear Creek and tributaries from
confluence with Soldier Creek to
headwaters
5 Not Supporting OE Bioassessment 3A Low 2008 14
Jordan River/Utah Lake UT16020201-003_00 Currant Creek Current Creek from mouth of Goshen
Canyon to Mona Reservoir
5 Not Supporting Temperature 3A Low 2002 4
Jordan River/Utah Lake UT16020201-014_00 Currant Creek-Juab Valley 5 Not Supporting Temperature 3A Low 2016 21
Jordan River/Utah Lake UT16020201-015_00 Dry Creek-Alpine 5 Not Supporting pH 2B; 4; 3A Low 2014 11
* Please refer to the 2012/2014 and 2016 IR data files for the sub-category 3 details.
** Phase II of TMDL in Progress.
***Impairment temporary: site specific TDS criterion should apply until WQS change. 18 of 49
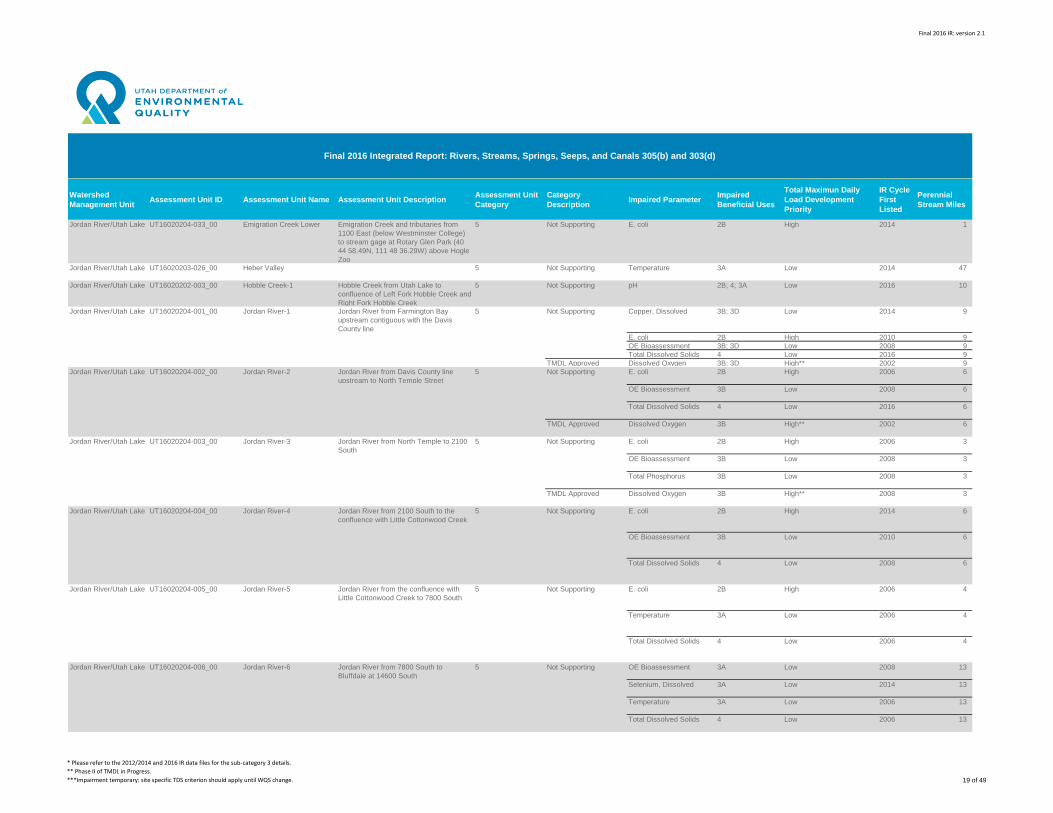
Final 2016 IR: version 2.1
Watershed
Management UnitAssessment Unit ID Assessment Unit Name Assessment Unit Description
Assessment Unit
Category
Category
DescriptionImpaired Parameter
Impaired
Beneficial Uses
Total Maximun Daily
Load Development
Priority
IR Cycle
First
Listed
Perennial
Stream Miles
Final 2016 Integrated Report: Rivers, Streams, Springs, Seeps, and Canals 305(b) and 303(d)
Jordan River/Utah Lake UT16020204-033_00 Emigration Creek Lower Emigration Creek and tributaries from
1100 East (below Westminster College)
to stream gage at Rotary Glen Park (40
44 58.49N, 111 48 36.29W) above Hogle
Zoo
5 Not Supporting E. coli 2B High 2014 1
Jordan River/Utah Lake UT16020203-026_00 Heber Valley 5 Not Supporting Temperature 3A Low 2014 47
Jordan River/Utah Lake UT16020202-003_00 Hobble Creek-1 Hobble Creek from Utah Lake to
confluence of Left Fork Hobble Creek and
Right Fork Hobble Creek
5 Not Supporting pH 2B; 4; 3A Low 2016 10
Jordan River/Utah Lake UT16020204-001_00 Jordan River-1 Jordan River from Farmington Bay
upstream contiguous with the Davis
County line
5 Not Supporting Copper, Dissolved 3B; 3D Low 2014 9
E. coli 2B High 2010 9
OE Bioassessment 3B; 3D Low 2008 9
Total Dissolved Solids 4 Low 2016 9
TMDL Approved Dissolved Oxygen 3B; 3D High** 2002 9
Jordan River/Utah Lake UT16020204-002_00 Jordan River-2 Jordan River from Davis County line
upstream to North Temple Street
5 Not Supporting E. coli 2B High 2006 6
OE Bioassessment 3B Low 2008 6
Total Dissolved Solids 4 Low 2016 6
TMDL Approved Dissolved Oxygen 3B High** 2002 6
Jordan River/Utah Lake UT16020204-003_00 Jordan River-3 Jordan River from North Temple to 2100
South
5 Not Supporting E. coli 2B High 2006 3
OE Bioassessment 3B Low 2008 3
Total Phosphorus 3B Low 2008 3
TMDL Approved Dissolved Oxygen 3B High** 2008 3
Jordan River/Utah Lake UT16020204-004_00 Jordan River-4 Jordan River from 2100 South to the
confluence with Little Cottonwood Creek
5 Not Supporting E. coli 2B High 2014 6
OE Bioassessment 3B Low 2010 6
Total Dissolved Solids 4 Low 2008 6
Jordan River/Utah Lake UT16020204-005_00 Jordan River-5 Jordan River from the confluence with
Little Cottonwood Creek to 7800 South
5 Not Supporting E. coli 2B High 2006 4
Temperature 3A Low 2006 4
Total Dissolved Solids 4 Low 2006 4
Jordan River/Utah Lake UT16020204-006_00 Jordan River-6 Jordan River from 7800 South to
Bluffdale at 14600 South
5 Not Supporting OE Bioassessment 3A Low 2008 13
Selenium, Dissolved 3A Low 2014 13
Temperature 3A Low 2006 13
Total Dissolved Solids 4 Low 2006 13
* Please refer to the 2012/2014 and 2016 IR data files for the sub-category 3 details.
** Phase II of TMDL in Progress.
***Impairment temporary: site specific TDS criterion should apply until WQS change. 19 of 49
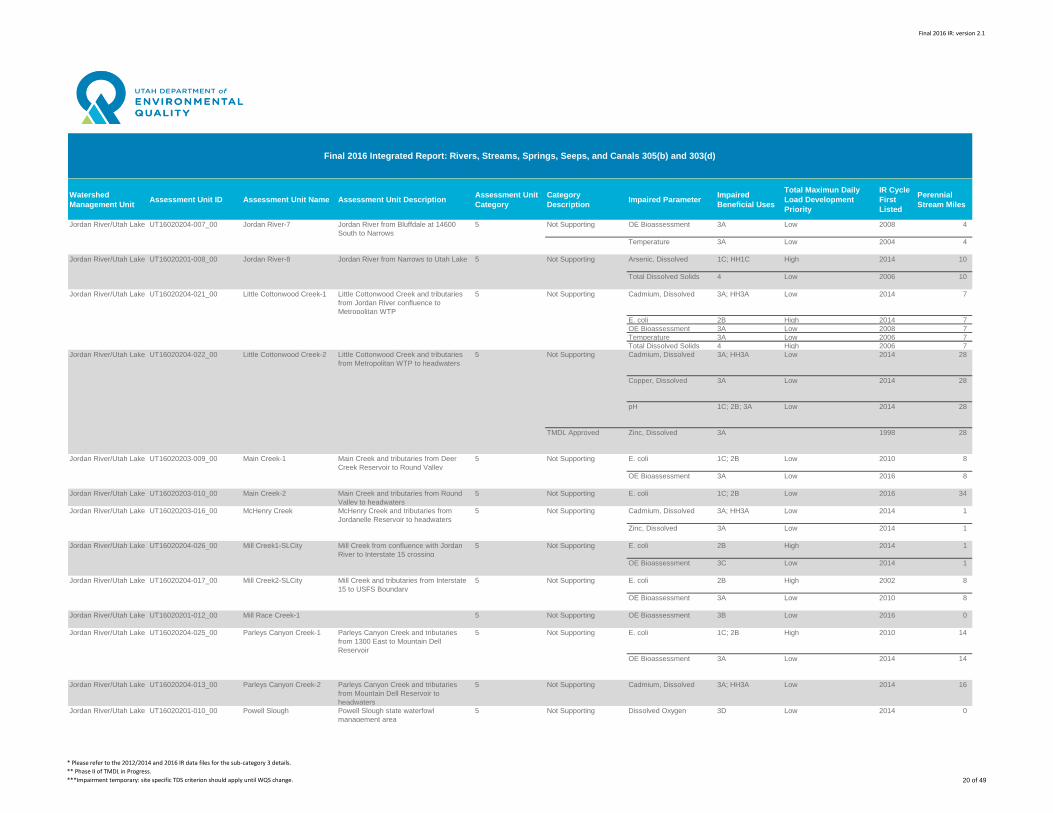
Final 2016 IR: version 2.1
Watershed
Management UnitAssessment Unit ID Assessment Unit Name Assessment Unit Description
Assessment Unit
Category
Category
DescriptionImpaired Parameter
Impaired
Beneficial Uses
Total Maximun Daily
Load Development
Priority
IR Cycle
First
Listed
Perennial
Stream Miles
Final 2016 Integrated Report: Rivers, Streams, Springs, Seeps, and Canals 305(b) and 303(d)
Jordan River/Utah Lake UT16020204-007_00 Jordan River-7 Jordan River from Bluffdale at 14600
South to Narrows
5 Not Supporting OE Bioassessment 3A Low 2008 4
Temperature 3A Low 2004 4
Jordan River/Utah Lake UT16020201-008_00 Jordan River-8 Jordan River from Narrows to Utah Lake 5 Not Supporting Arsenic, Dissolved 1C; HH1C High 2014 10
Total Dissolved Solids 4 Low 2006 10
Jordan River/Utah Lake UT16020204-021_00 Little Cottonwood Creek-1 Little Cottonwood Creek and tributaries
from Jordan River confluence to
Metropolitan WTP
5 Not Supporting Cadmium, Dissolved 3A; HH3A Low 2014 7
E. coli 2B High 2014 7
OE Bioassessment 3A Low 2008 7
Temperature 3A Low 2006 7
Total Dissolved Solids 4 High 2006 7
Jordan River/Utah Lake UT16020204-022_00 Little Cottonwood Creek-2 Little Cottonwood Creek and tributaries
from Metropolitan WTP to headwaters
5 Not Supporting Cadmium, Dissolved 3A; HH3A Low 2014 28
Copper, Dissolved 3A Low 2014 28
pH 1C; 2B; 3A Low 2014 28
TMDL Approved Zinc, Dissolved 3A 1998 28
Jordan River/Utah Lake UT16020203-009_00 Main Creek-1 Main Creek and tributaries from Deer
Creek Reservoir to Round Valley
5 Not Supporting E. coli 1C; 2B Low 2010 8
OE Bioassessment 3A Low 2016 8
Jordan River/Utah Lake UT16020203-010_00 Main Creek-2 Main Creek and tributaries from Round
Valley to headwaters
5 Not Supporting E. coli 1C; 2B Low 2016 34
Jordan River/Utah Lake UT16020203-016_00 McHenry Creek McHenry Creek and tributaries from
Jordanelle Reservoir to headwaters
5 Not Supporting Cadmium, Dissolved 3A; HH3A Low 2014 1
Zinc, Dissolved 3A Low 2014 1
Jordan River/Utah Lake UT16020204-026_00 Mill Creek1-SLCity Mill Creek from confluence with Jordan
River to Interstate 15 crossing
5 Not Supporting E. coli 2B High 2014 1
OE Bioassessment 3C Low 2014 1
Jordan River/Utah Lake UT16020204-017_00 Mill Creek2-SLCity Mill Creek and tributaries from Interstate
15 to USFS Boundary
5 Not Supporting E. coli 2B High 2002 8
OE Bioassessment 3A Low 2010 8
Jordan River/Utah Lake UT16020201-012_00 Mill Race Creek-1 5 Not Supporting OE Bioassessment 3B Low 2016 0
Jordan River/Utah Lake UT16020204-025_00 Parleys Canyon Creek-1 Parleys Canyon Creek and tributaries
from 1300 East to Mountain Dell
Reservoir
5 Not Supporting E. coli 1C; 2B High 2010 14
OE Bioassessment 3A Low 2014 14
Jordan River/Utah Lake UT16020204-013_00 Parleys Canyon Creek-2 Parleys Canyon Creek and tributaries
from Mountain Dell Reservoir to
headwaters
5 Not Supporting Cadmium, Dissolved 3A; HH3A Low 2014 16
Jordan River/Utah Lake UT16020201-010_00 Powell Slough Powell Slough state waterfowl
management area
5 Not Supporting Dissolved Oxygen 3D Low 2014 0
* Please refer to the 2012/2014 and 2016 IR data files for the sub-category 3 details.
** Phase II of TMDL in Progress.
***Impairment temporary: site specific TDS criterion should apply until WQS change. 20 of 49
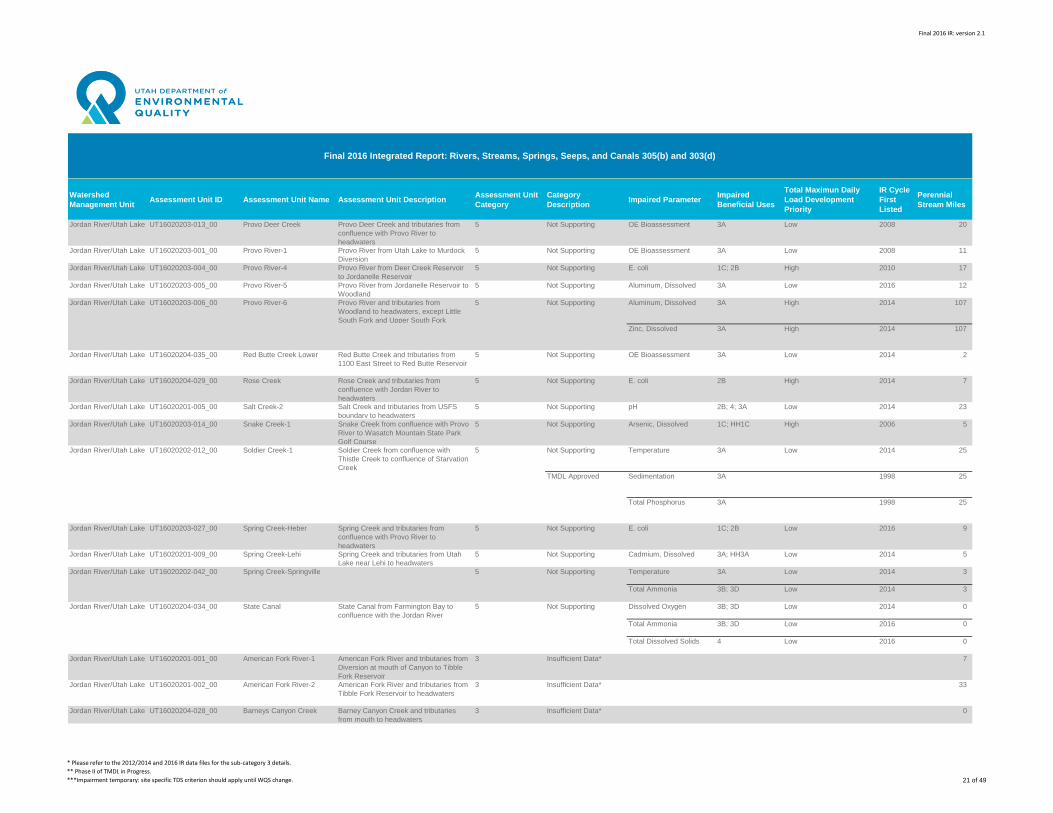
Final 2016 IR: version 2.1
Watershed
Management UnitAssessment Unit ID Assessment Unit Name Assessment Unit Description
Assessment Unit
Category
Category
DescriptionImpaired Parameter
Impaired
Beneficial Uses
Total Maximun Daily
Load Development
Priority
IR Cycle
First
Listed
Perennial
Stream Miles
Final 2016 Integrated Report: Rivers, Streams, Springs, Seeps, and Canals 305(b) and 303(d)
Jordan River/Utah Lake UT16020203-013_00 Provo Deer Creek Provo Deer Creek and tributaries from
confluence with Provo River to
headwaters
5 Not Supporting OE Bioassessment 3A Low 2008 20
Jordan River/Utah Lake UT16020203-001_00 Provo River-1 Provo River from Utah Lake to Murdock
Diversion
5 Not Supporting OE Bioassessment 3A Low 2008 11
Jordan River/Utah Lake UT16020203-004_00 Provo River-4 Provo River from Deer Creek Reservoir
to Jordanelle Reservoir
5 Not Supporting E. coli 1C; 2B High 2010 17
Jordan River/Utah Lake UT16020203-005_00 Provo River-5 Provo River from Jordanelle Reservoir to
Woodland
5 Not Supporting Aluminum, Dissolved 3A Low 2016 12
Jordan River/Utah Lake UT16020203-006_00 Provo River-6 Provo River and tributaries from
Woodland to headwaters, except Little
South Fork and Upper South Fork
5 Not Supporting Aluminum, Dissolved 3A High 2014 107
Zinc, Dissolved 3A High 2014 107
Jordan River/Utah Lake UT16020204-035_00 Red Butte Creek Lower Red Butte Creek and tributaries from
1100 East Street to Red Butte Reservoir
5 Not Supporting OE Bioassessment 3A Low 2014 2
Jordan River/Utah Lake UT16020204-029_00 Rose Creek Rose Creek and tributaries from
confluence with Jordan River to
headwaters
5 Not Supporting E. coli 2B High 2014 7
Jordan River/Utah Lake UT16020201-005_00 Salt Creek-2 Salt Creek and tributaries from USFS
boundary to headwaters
5 Not Supporting pH 2B; 4; 3A Low 2014 23
Jordan River/Utah Lake UT16020203-014_00 Snake Creek-1 Snake Creek from confluence with Provo
River to Wasatch Mountain State Park
Golf Course
5 Not Supporting Arsenic, Dissolved 1C; HH1C High 2006 5
Jordan River/Utah Lake UT16020202-012_00 Soldier Creek-1 Soldier Creek from confluence with
Thistle Creek to confluence of Starvation
Creek
5 Not Supporting Temperature 3A Low 2014 25
TMDL Approved Sedimentation 3A 1998 25
Total Phosphorus 3A 1998 25
Jordan River/Utah Lake UT16020203-027_00 Spring Creek-Heber Spring Creek and tributaries from
confluence with Provo River to
headwaters
5 Not Supporting E. coli 1C; 2B Low 2016 9
Jordan River/Utah Lake UT16020201-009_00 Spring Creek-Lehi Spring Creek and tributaries from Utah
Lake near Lehi to headwaters
5 Not Supporting Cadmium, Dissolved 3A; HH3A Low 2014 5
Jordan River/Utah Lake UT16020202-042_00 Spring Creek-Springville 5 Not Supporting Temperature 3A Low 2014 3
Total Ammonia 3B; 3D Low 2014 3
Jordan River/Utah Lake UT16020204-034_00 State Canal State Canal from Farmington Bay to
confluence with the Jordan River
5 Not Supporting Dissolved Oxygen 3B; 3D Low 2014 0
Total Ammonia 3B; 3D Low 2016 0
Total Dissolved Solids 4 Low 2016 0
Jordan River/Utah Lake UT16020201-001_00 American Fork River-1 American Fork River and tributaries from
Diversion at mouth of Canyon to Tibble
Fork Reservoir
3 Insufficient Data* 7
Jordan River/Utah Lake UT16020201-002_00 American Fork River-2 American Fork River and tributaries from
Tibble Fork Reservoir to headwaters
3 Insufficient Data* 33
Jordan River/Utah Lake UT16020204-028_00 Barneys Canyon Creek Barney Canyon Creek and tributaries
from mouth to headwaters
3 Insufficient Data* 0
* Please refer to the 2012/2014 and 2016 IR data files for the sub-category 3 details.
** Phase II of TMDL in Progress.
***Impairment temporary: site specific TDS criterion should apply until WQS change. 21 of 49
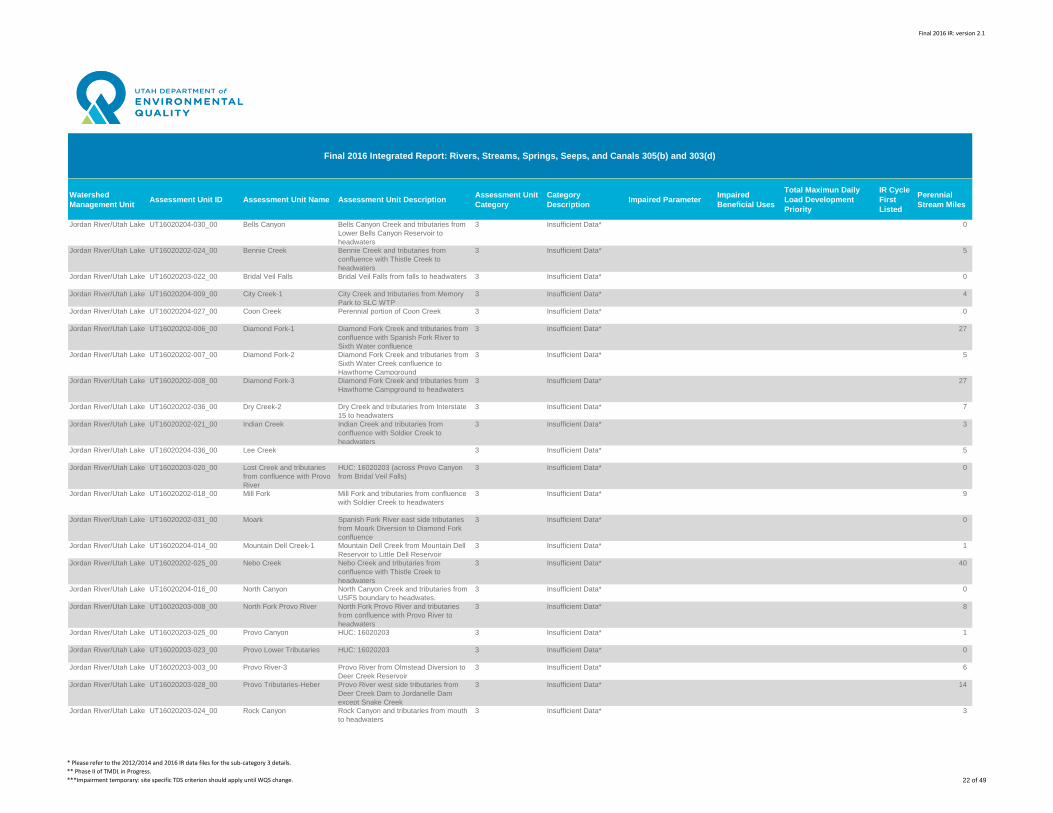
Final 2016 IR: version 2.1
Watershed
Management UnitAssessment Unit ID Assessment Unit Name Assessment Unit Description
Assessment Unit
Category
Category
DescriptionImpaired Parameter
Impaired
Beneficial Uses
Total Maximun Daily
Load Development
Priority
IR Cycle
First
Listed
Perennial
Stream Miles
Final 2016 Integrated Report: Rivers, Streams, Springs, Seeps, and Canals 305(b) and 303(d)
Jordan River/Utah Lake UT16020204-030_00 Bells Canyon Bells Canyon Creek and tributaries from
Lower Bells Canyon Reservoir to
headwaters
3 Insufficient Data* 0
Jordan River/Utah Lake UT16020202-024_00 Bennie Creek Bennie Creek and tributaries from
confluence with Thistle Creek to
headwaters
3 Insufficient Data* 5
Jordan River/Utah Lake UT16020203-022_00 Bridal Veil Falls Bridal Veil Falls from falls to headwaters 3 Insufficient Data* 0
Jordan River/Utah Lake UT16020204-009_00 City Creek-1 City Creek and tributaries from Memory
Park to SLC WTP
3 Insufficient Data* 4
Jordan River/Utah Lake UT16020204-027_00 Coon Creek Perennial portion of Coon Creek 3 Insufficient Data* 0
Jordan River/Utah Lake UT16020202-006_00 Diamond Fork-1 Diamond Fork Creek and tributaries from
confluence with Spanish Fork River to
Sixth Water confluence
3 Insufficient Data* 27
Jordan River/Utah Lake UT16020202-007_00 Diamond Fork-2 Diamond Fork Creek and tributaries from
Sixth Water Creek confluence to
Hawthorne Campground
3 Insufficient Data* 5
Jordan River/Utah Lake UT16020202-008_00 Diamond Fork-3 Diamond Fork Creek and tributaries from
Hawthorne Campground to headwaters
3 Insufficient Data* 27
Jordan River/Utah Lake UT16020202-036_00 Dry Creek-2 Dry Creek and tributaries from Interstate
15 to headwaters
3 Insufficient Data* 7
Jordan River/Utah Lake UT16020202-021_00 Indian Creek Indian Creek and tributaries from
confluence with Soldier Creek to
headwaters
3 Insufficient Data* 3
Jordan River/Utah Lake UT16020204-036_00 Lee Creek 3 Insufficient Data* 5
Jordan River/Utah Lake UT16020203-020_00 Lost Creek and tributaries
from confluence with Provo
River
HUC: 16020203 (across Provo Canyon
from Bridal Veil Falls)
3 Insufficient Data* 0
Jordan River/Utah Lake UT16020202-018_00 Mill Fork Mill Fork and tributaries from confluence
with Soldier Creek to headwaters
3 Insufficient Data* 9
Jordan River/Utah Lake UT16020202-031_00 Moark Spanish Fork River east side tributaries
from Moark Diversion to Diamond Fork
confluence
3 Insufficient Data* 0
Jordan River/Utah Lake UT16020204-014_00 Mountain Dell Creek-1 Mountain Dell Creek from Mountain Dell
Reservoir to Little Dell Reservoir
3 Insufficient Data* 1
Jordan River/Utah Lake UT16020202-025_00 Nebo Creek Nebo Creek and tributaries from
confluence with Thistle Creek to
headwaters
3 Insufficient Data* 40
Jordan River/Utah Lake UT16020204-016_00 North Canyon North Canyon Creek and tributaries from
USFS boundary to headwates.
3 Insufficient Data* 0
Jordan River/Utah Lake UT16020203-008_00 North Fork Provo River North Fork Provo River and tributaries
from confluence with Provo River to
headwaters
3 Insufficient Data* 8
Jordan River/Utah Lake UT16020203-025_00 Provo Canyon HUC: 16020203 3 Insufficient Data* 1
Jordan River/Utah Lake UT16020203-023_00 Provo Lower Tributaries HUC: 16020203 3 Insufficient Data* 0
Jordan River/Utah Lake UT16020203-003_00 Provo River-3 Provo River from Olmstead Diversion to
Deer Creek Reservoir
3 Insufficient Data* 6
Jordan River/Utah Lake UT16020203-028_00 Provo Tributaries-Heber Provo River west side tributaries from
Deer Creek Dam to Jordanelle Dam
except Snake Creek
3 Insufficient Data* 14
Jordan River/Utah Lake UT16020203-024_00 Rock Canyon Rock Canyon and tributaries from mouth
to headwaters
3 Insufficient Data* 3
* Please refer to the 2012/2014 and 2016 IR data files for the sub-category 3 details.
** Phase II of TMDL in Progress.
***Impairment temporary: site specific TDS criterion should apply until WQS change. 22 of 49

Final 2016 IR: version 2.1
Watershed
Management UnitAssessment Unit ID Assessment Unit Name Assessment Unit Description
Assessment Unit
Category
Category
DescriptionImpaired Parameter
Impaired
Beneficial Uses
Total Maximun Daily
Load Development
Priority
IR Cycle
First
Listed
Perennial
Stream Miles
Final 2016 Integrated Report: Rivers, Streams, Springs, Seeps, and Canals 305(b) and 303(d)
Jordan River/Utah Lake UT16020202-014_00 Sheep Creek Sheep Creek and tributaries from
confluence with Soldier Creek to
headwaters
3 Insufficient Data* 6
Jordan River/Utah Lake UT16020202-009_00 Sixth Water Creek Sixth Water Creek and tributaries except
Fifth Water and First Water Creeks and
tributaries from confluence with Diamond
Fork Creek to headwaters
3 Insufficient Data* 20
Jordan River/Utah Lake UT16020202-033_00 Soldier Creek-3 Soldier Creek north side perennial
tributaries between Tie Fork and Sheep
Creek confluence
3 Insufficient Data* 0
Jordan River/Utah Lake UT16020202-034_00 Soldier Creek-4 Soldier Creek south side tributaries from
confluence with Thistle Creek to Dairy
Fork confluence, excluding Lake Fork
above USFS boundary
3 Insufficient Data* 4
Jordan River/Utah Lake UT16020202-039_00 Soldier Creek-5 Soldier Creek south side tributaries
between Mill Fork confluence and Clear
Creek confluence
3 Insufficient Data* 0
Jordan River/Utah Lake UT16020203-018_00 South Fork Provo Upper South Fork Provo River and
tributaries from confluence with Provo
River to headwaters
3 Insufficient Data* 31
Jordan River/Utah Lake UT16020203-007_00 South Fork Provo River Lower South Fork Provo River and
tributaries from confluence with Provo
River to headwaters
3 Insufficient Data* 11
Jordan River/Utah Lake UT16020202-001_00 Spanish Fork River-1 Spanish Fork River from Utah Lake to
Moark Diversion
3 Insufficient Data* 17
Jordan River/Utah Lake UT16020204-032_00 Surplus Canal 3 Insufficient Data* 0
Jordan River/Utah Lake UT16020202-010_00 Third Water Creek Third Water Creek and tributaries from
confluence with Sixth Water Creek to
headwaters
3 Insufficient Data* 25
Jordan River/Utah Lake UT16020202-037_00 Thistle Creek-3 Thistle Creek east side tributaries from
confluence with Soldier Creek upstream
to confluence with Little Clear Creek
3 Insufficient Data* 11
Jordan River/Utah Lake UT16020202-038_00 Thistle Creek-4 Thistle Creek west and south side
tributaries from Nebo Creek to Little Clear
Creek
3 Insufficient Data* 0
Jordan River/Utah Lake UT16020202-032_00 Thistle Creek-5 Thistle Creek tributaries between Bennie
Creek and Nebo Creek confluences
3 Insufficient Data* 0
Jordan River/Utah Lake UT16020203-029_00 Unknown Mill Race Creek and tributaries from HUC
boundary (16020203) to headwaters
3 Insufficient Data* 0
Jordan River/Utah Lake UT16020203-021_00 Upper Falls Drainage Upper Falls above Bridal Veil Falls 3 Insufficient Data* 1
Jordan River/Utah Lake UT16020202-011_00 Cottonwood Creek Cottonwood Creek and tributaries from
confluence with Sixth Water Creek to
headwaters
2 No Evidence of
Impairment
14
Jordan River/Utah Lake UT16020202-017_00 Dairy Fork Dairy Fork and tributaries from
confluence with Soldier Creek to
headwaters
2 No Evidence of
Impairment
6
Jordan River/Utah Lake UT16020203-011_00 Daniels Creek-1 Daniels Creek and tributaries from
confluence with Deer Creek Reservoir to
Whiskey Springs
2 No Evidence of
Impairment
11
Jordan River/Utah Lake UT16020203-012_00 Daniels Creek-2 Daniels Creek and tributaries from
Whiskey Springs to headwaters
2 No Evidence of
Impairment
16
Jordan River/Utah Lake UT16020202-004_00 Hobble Creek-2 Left Fork Hobble Creek and tributaries
from confluence with Right Fork to
headwaters
2 No Evidence of
Impairment
25
* Please refer to the 2012/2014 and 2016 IR data files for the sub-category 3 details.
** Phase II of TMDL in Progress.
***Impairment temporary: site specific TDS criterion should apply until WQS change. 23 of 49
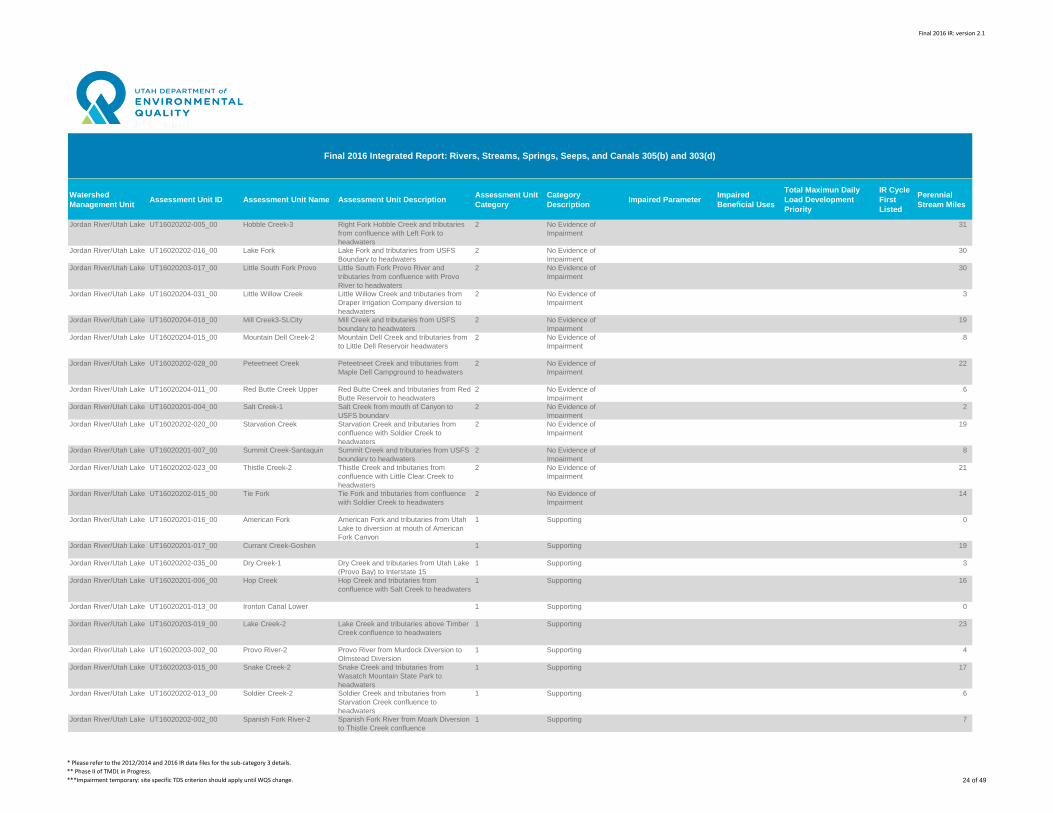
Final 2016 IR: version 2.1
Watershed
Management UnitAssessment Unit ID Assessment Unit Name Assessment Unit Description
Assessment Unit
Category
Category
DescriptionImpaired Parameter
Impaired
Beneficial Uses
Total Maximun Daily
Load Development
Priority
IR Cycle
First
Listed
Perennial
Stream Miles
Final 2016 Integrated Report: Rivers, Streams, Springs, Seeps, and Canals 305(b) and 303(d)
Jordan River/Utah Lake UT16020202-005_00 Hobble Creek-3 Right Fork Hobble Creek and tributaries
from confluence with Left Fork to
headwaters
2 No Evidence of
Impairment
31
Jordan River/Utah Lake UT16020202-016_00 Lake Fork Lake Fork and tributaries from USFS
Boundary to headwaters
2 No Evidence of
Impairment
30
Jordan River/Utah Lake UT16020203-017_00 Little South Fork Provo Little South Fork Provo River and
tributaries from confluence with Provo
River to headwaters
2 No Evidence of
Impairment
30
Jordan River/Utah Lake UT16020204-031_00 Little Willow Creek Little Willow Creek and tributaries from
Draper Irrigation Company diversion to
headwaters
2 No Evidence of
Impairment
3
Jordan River/Utah Lake UT16020204-018_00 Mill Creek3-SLCity Mill Creek and tributaries from USFS
boundary to headwaters
2 No Evidence of
Impairment
19
Jordan River/Utah Lake UT16020204-015_00 Mountain Dell Creek-2 Mountain Dell Creek and tributaries from
to Little Dell Reservoir headwaters
2 No Evidence of
Impairment
8
Jordan River/Utah Lake UT16020202-028_00 Peteetneet Creek Peteetneet Creek and tributaries from
Maple Dell Campground to headwaters
2 No Evidence of
Impairment
22
Jordan River/Utah Lake UT16020204-011_00 Red Butte Creek Upper Red Butte Creek and tributaries from Red
Butte Reservoir to headwaters
2 No Evidence of
Impairment
6
Jordan River/Utah Lake UT16020201-004_00 Salt Creek-1 Salt Creek from mouth of Canyon to
USFS boundary
2 No Evidence of
Impairment
2
Jordan River/Utah Lake UT16020202-020_00 Starvation Creek Starvation Creek and tributaries from
confluence with Soldier Creek to
headwaters
2 No Evidence of
Impairment
19
Jordan River/Utah Lake UT16020201-007_00 Summit Creek-Santaquin Summit Creek and tributaries from USFS
boundary to headwaters
2 No Evidence of
Impairment
8
Jordan River/Utah Lake UT16020202-023_00 Thistle Creek-2 Thistle Creek and tributaries from
confluence with Little Clear Creek to
headwaters
2 No Evidence of
Impairment
21
Jordan River/Utah Lake UT16020202-015_00 Tie Fork Tie Fork and tributaries from confluence
with Soldier Creek to headwaters
2 No Evidence of
Impairment
14
Jordan River/Utah Lake UT16020201-016_00 American Fork American Fork and tributaries from Utah
Lake to diversion at mouth of American
Fork Canyon
1 Supporting 0
Jordan River/Utah Lake UT16020201-017_00 Currant Creek-Goshen 1 Supporting 19
Jordan River/Utah Lake UT16020202-035_00 Dry Creek-1 Dry Creek and tributaries from Utah Lake
(Provo Bay) to Interstate 15
1 Supporting 3
Jordan River/Utah Lake UT16020201-006_00 Hop Creek Hop Creek and tributaries from
confluence with Salt Creek to headwaters
1 Supporting 16
Jordan River/Utah Lake UT16020201-013_00 Ironton Canal Lower 1 Supporting 0
Jordan River/Utah Lake UT16020203-019_00 Lake Creek-2 Lake Creek and tributaries above Timber
Creek confluence to headwaters
1 Supporting 23
Jordan River/Utah Lake UT16020203-002_00 Provo River-2 Provo River from Murdock Diversion to
Olmstead Diversion
1 Supporting 4
Jordan River/Utah Lake UT16020203-015_00 Snake Creek-2 Snake Creek and tributaries from
Wasatch Mountain State Park to
headwaters
1 Supporting 17
Jordan River/Utah Lake UT16020202-013_00 Soldier Creek-2 Soldier Creek and tributaries from
Starvation Creek confluence to
headwaters
1 Supporting 6
Jordan River/Utah Lake UT16020202-002_00 Spanish Fork River-2 Spanish Fork River from Moark Diversion
to Thistle Creek confluence
1 Supporting 7
* Please refer to the 2012/2014 and 2016 IR data files for the sub-category 3 details.
** Phase II of TMDL in Progress.
***Impairment temporary: site specific TDS criterion should apply until WQS change. 24 of 49
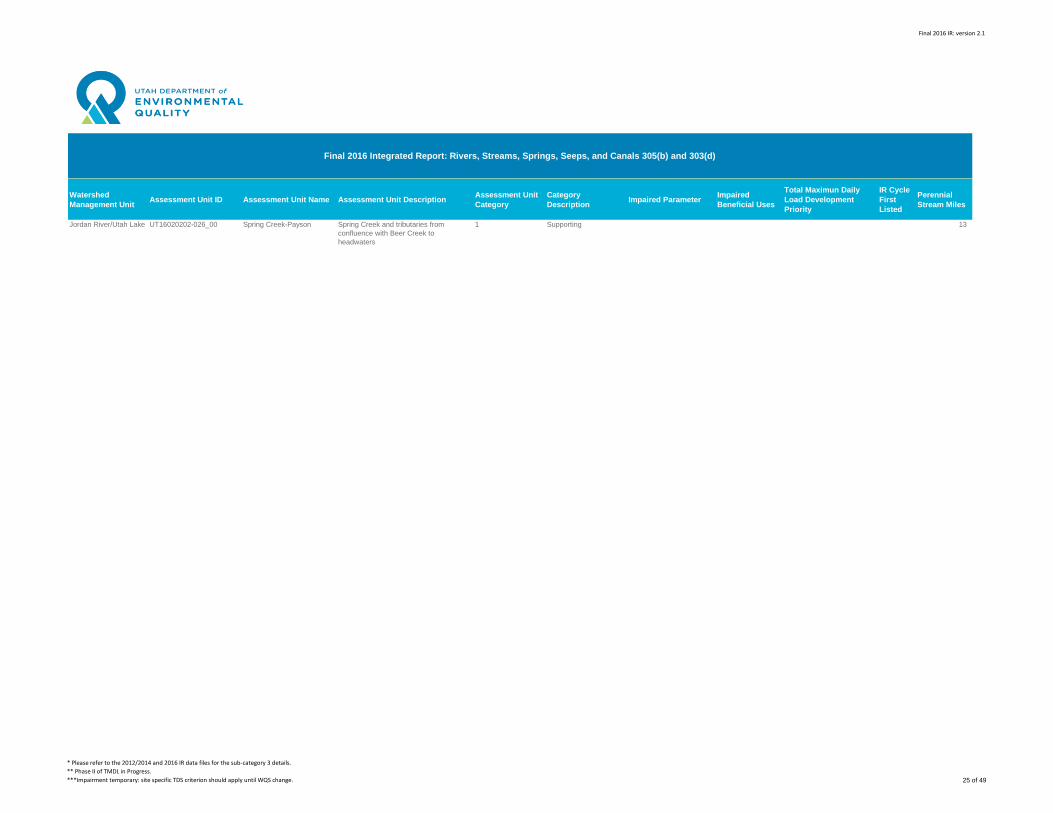
Final 2016 IR: version 2.1
Watershed
Management UnitAssessment Unit ID Assessment Unit Name Assessment Unit Description
Assessment Unit
Category
Category
DescriptionImpaired Parameter
Impaired
Beneficial Uses
Total Maximun Daily
Load Development
Priority
IR Cycle
First
Listed
Perennial
Stream Miles
Final 2016 Integrated Report: Rivers, Streams, Springs, Seeps, and Canals 305(b) and 303(d)
Jordan River/Utah Lake UT16020202-026_00 Spring Creek-Payson Spring Creek and tributaries from
confluence with Beer Creek to
headwaters
1 Supporting 13
* Please refer to the 2012/2014 and 2016 IR data files for the sub-category 3 details.
** Phase II of TMDL in Progress.
***Impairment temporary: site specific TDS criterion should apply until WQS change. 25 of 49
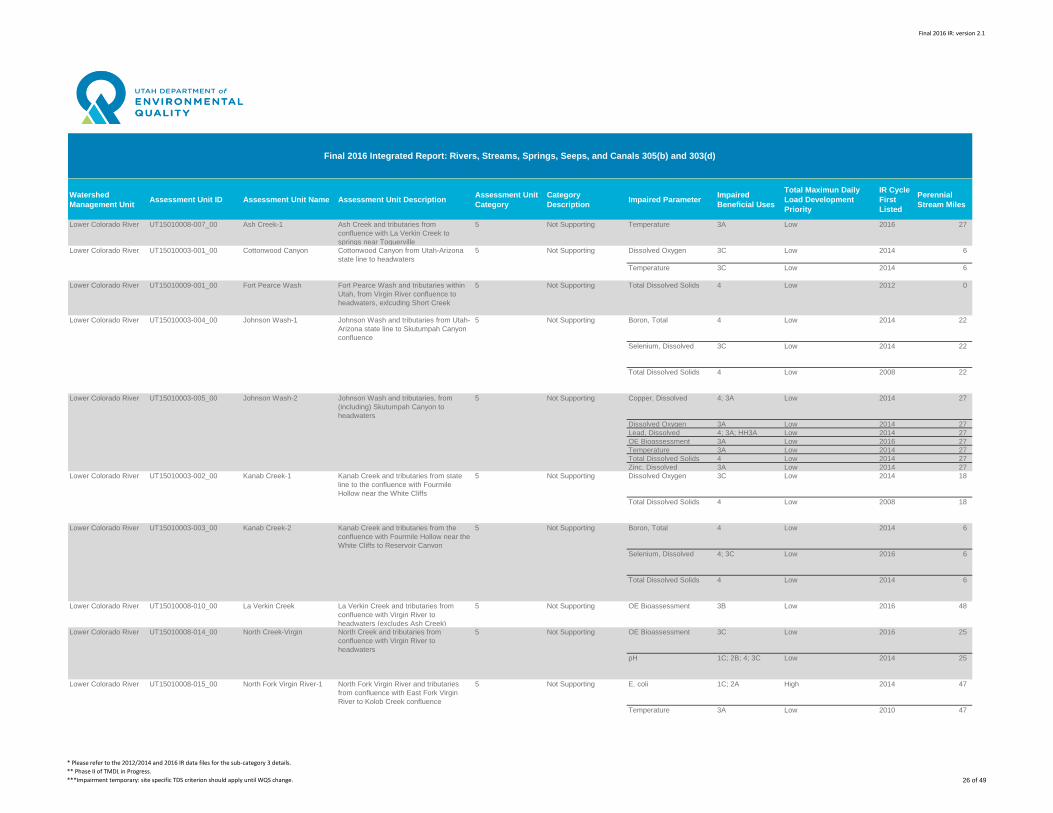
Final 2016 IR: version 2.1
Watershed
Management UnitAssessment Unit ID Assessment Unit Name Assessment Unit Description
Assessment Unit
Category
Category
DescriptionImpaired Parameter
Impaired
Beneficial Uses
Total Maximun Daily
Load Development
Priority
IR Cycle
First
Listed
Perennial
Stream Miles
Final 2016 Integrated Report: Rivers, Streams, Springs, Seeps, and Canals 305(b) and 303(d)
Lower Colorado River UT15010008-007_00 Ash Creek-1 Ash Creek and tributaries from
confluence with La Verkin Creek to
springs near Toquerville
5 Not Supporting Temperature 3A Low 2016 27
Lower Colorado River UT15010003-001_00 Cottonwood Canyon Cottonwood Canyon from Utah-Arizona
state line to headwaters
5 Not Supporting Dissolved Oxygen 3C Low 2014 6
Temperature 3C Low 2014 6
Lower Colorado River UT15010009-001_00 Fort Pearce Wash Fort Pearce Wash and tributaries within
Utah, from Virgin River confluence to
headwaters, exlcuding Short Creek
5 Not Supporting Total Dissolved Solids 4 Low 2012 0
Lower Colorado River UT15010003-004_00 Johnson Wash-1 Johnson Wash and tributaries from Utah-
Arizona state line to Skutumpah Canyon
confluence
5 Not Supporting Boron, Total 4 Low 2014 22
Selenium, Dissolved 3C Low 2014 22
Total Dissolved Solids 4 Low 2008 22
Lower Colorado River UT15010003-005_00 Johnson Wash-2 Johnson Wash and tributaries, from
(including) Skutumpah Canyon to
headwaters
5 Not Supporting Copper, Dissolved 4; 3A Low 2014 27
Dissolved Oxygen 3A Low 2014 27
Lead, Dissolved 4; 3A; HH3A Low 2014 27
OE Bioassessment 3A Low 2016 27
Temperature 3A Low 2014 27
Total Dissolved Solids 4 Low 2014 27
Zinc, Dissolved 3A Low 2014 27
Lower Colorado River UT15010003-002_00 Kanab Creek-1 Kanab Creek and tributaries from state
line to the confluence with Fourmile
Hollow near the White Cliffs
5 Not Supporting Dissolved Oxygen 3C Low 2014 18
Total Dissolved Solids 4 Low 2008 18
Lower Colorado River UT15010003-003_00 Kanab Creek-2 Kanab Creek and tributaries from the
confluence with Fourmile Hollow near the
White Cliffs to Reservoir Canyon
5 Not Supporting Boron, Total 4 Low 2014 6
Selenium, Dissolved 4; 3C Low 2016 6
Total Dissolved Solids 4 Low 2014 6
Lower Colorado River UT15010008-010_00 La Verkin Creek La Verkin Creek and tributaries from
confluence with Virgin River to
headwaters (excludes Ash Creek)
5 Not Supporting OE Bioassessment 3B Low 2016 48
Lower Colorado River UT15010008-014_00 North Creek-Virgin North Creek and tributaries from
confluence with Virgin River to
headwaters
5 Not Supporting OE Bioassessment 3C Low 2016 25
pH 1C; 2B; 4; 3C Low 2014 25
Lower Colorado River UT15010008-015_00 North Fork Virgin River-1 North Fork Virgin River and tributaries
from confluence with East Fork Virgin
River to Kolob Creek confluence
5 Not Supporting E. coli 1C; 2A High 2014 47
Temperature 3A Low 2010 47
* Please refer to the 2012/2014 and 2016 IR data files for the sub-category 3 details.
** Phase II of TMDL in Progress.
***Impairment temporary: site specific TDS criterion should apply until WQS change. 26 of 49
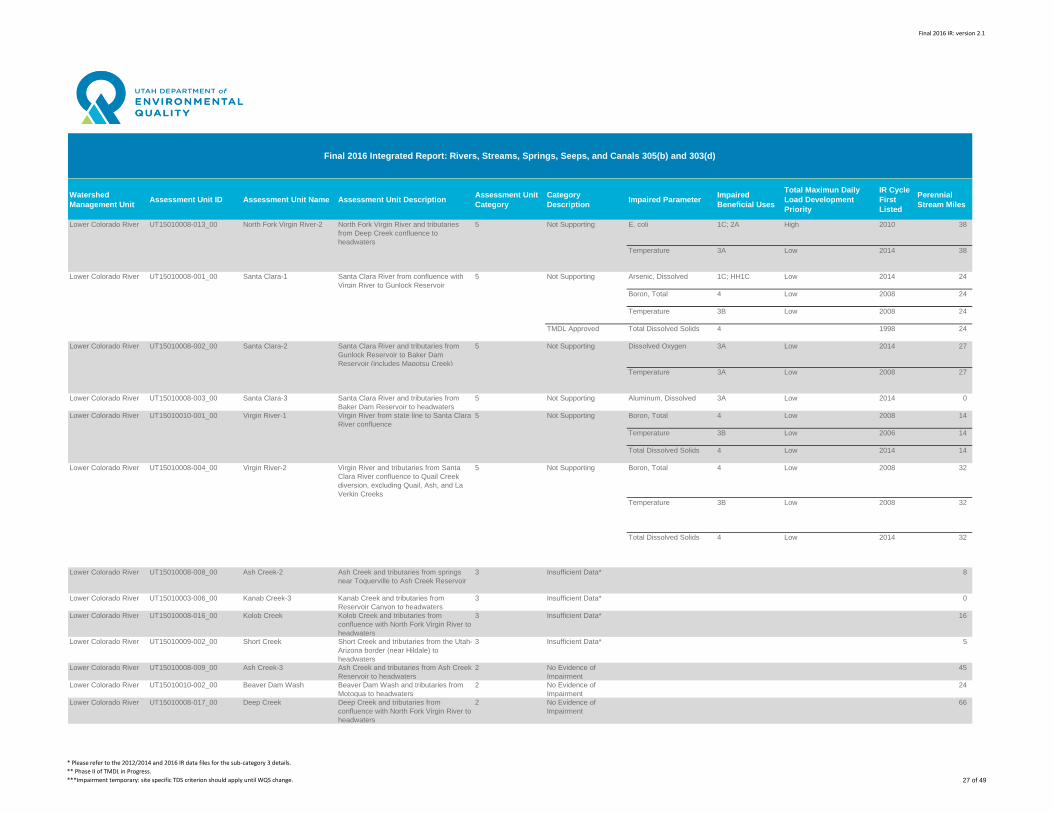
Final 2016 IR: version 2.1
Watershed
Management UnitAssessment Unit ID Assessment Unit Name Assessment Unit Description
Assessment Unit
Category
Category
DescriptionImpaired Parameter
Impaired
Beneficial Uses
Total Maximun Daily
Load Development
Priority
IR Cycle
First
Listed
Perennial
Stream Miles
Final 2016 Integrated Report: Rivers, Streams, Springs, Seeps, and Canals 305(b) and 303(d)
Lower Colorado River UT15010008-013_00 North Fork Virgin River-2 North Fork Virgin River and tributaries
from Deep Creek confluence to
headwaters
5 Not Supporting E. coli 1C; 2A High 2010 38
Temperature 3A Low 2014 38
Lower Colorado River UT15010008-001_00 Santa Clara-1 Santa Clara River from confluence with
Virgin River to Gunlock Reservoir
5 Not Supporting Arsenic, Dissolved 1C; HH1C Low 2014 24
Boron, Total 4 Low 2008 24
Temperature 3B Low 2008 24
TMDL Approved Total Dissolved Solids 4 1998 24
Lower Colorado River UT15010008-002_00 Santa Clara-2 Santa Clara River and tributaries from
Gunlock Reservoir to Baker Dam
Reservoir (includes Magotsu Creek)
5 Not Supporting Dissolved Oxygen 3A Low 2014 27
Temperature 3A Low 2008 27
Lower Colorado River UT15010008-003_00 Santa Clara-3 Santa Clara River and tributaries from
Baker Dam Reservoir to headwaters
5 Not Supporting Aluminum, Dissolved 3A Low 2014 0
Lower Colorado River UT15010010-001_00 Virgin River-1 Virgin River from state line to Santa Clara
River confluence
5 Not Supporting Boron, Total 4 Low 2008 14
Temperature 3B Low 2006 14
Total Dissolved Solids 4 Low 2014 14
Lower Colorado River UT15010008-004_00 Virgin River-2 Virgin River and tributaries from Santa
Clara River confluence to Quail Creek
diversion, excluding Quail, Ash, and La
Verkin Creeks
5 Not Supporting Boron, Total 4 Low 2008 32
Temperature 3B Low 2008 32
Total Dissolved Solids 4 Low 2014 32
Lower Colorado River UT15010008-008_00 Ash Creek-2 Ash Creek and tributaries from springs
near Toquerville to Ash Creek Reservoir
3 Insufficient Data* 8
Lower Colorado River UT15010003-006_00 Kanab Creek-3 Kanab Creek and tributaries from
Reservoir Canyon to headwaters
3 Insufficient Data* 0
Lower Colorado River UT15010008-016_00 Kolob Creek Kolob Creek and tributaries from
confluence with North Fork Virgin River to
headwaters
3 Insufficient Data* 16
Lower Colorado River UT15010009-002_00 Short Creek Short Creek and tributaries from the Utah-
Arizona border (near Hildale) to
headwaters
3 Insufficient Data* 5
Lower Colorado River UT15010008-009_00 Ash Creek-3 Ash Creek and tributaries from Ash Creek
Reservoir to headwaters
2 No Evidence of
Impairment
45
Lower Colorado River UT15010010-002_00 Beaver Dam Wash Beaver Dam Wash and tributaries from
Motoqua to headwaters
2 No Evidence of
Impairment
24
Lower Colorado River UT15010008-017_00 Deep Creek Deep Creek and tributaries from
confluence with North Fork Virgin River to
headwaters
2 No Evidence of
Impairment
66
* Please refer to the 2012/2014 and 2016 IR data files for the sub-category 3 details.
** Phase II of TMDL in Progress.
***Impairment temporary: site specific TDS criterion should apply until WQS change. 27 of 49
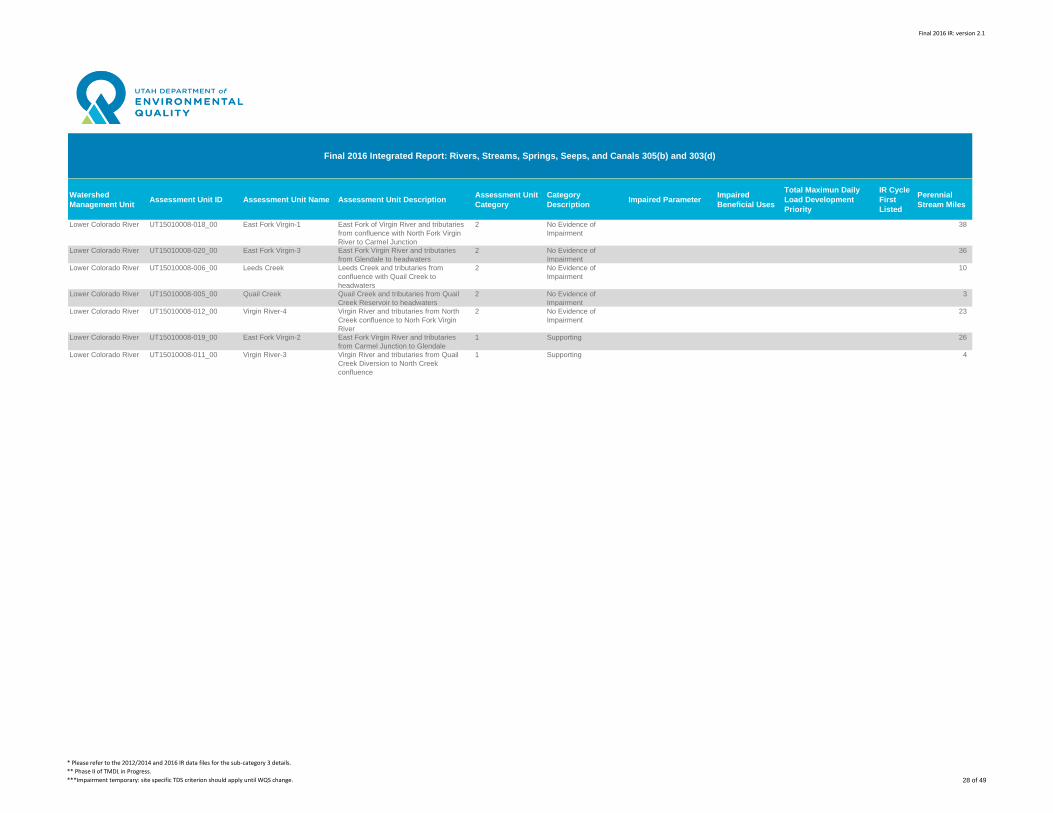
Final 2016 IR: version 2.1
Watershed
Management UnitAssessment Unit ID Assessment Unit Name Assessment Unit Description
Assessment Unit
Category
Category
DescriptionImpaired Parameter
Impaired
Beneficial Uses
Total Maximun Daily
Load Development
Priority
IR Cycle
First
Listed
Perennial
Stream Miles
Final 2016 Integrated Report: Rivers, Streams, Springs, Seeps, and Canals 305(b) and 303(d)
Lower Colorado River UT15010008-018_00 East Fork Virgin-1 East Fork of Virgin River and tributaries
from confluence with North Fork Virgin
River to Carmel Junction
2 No Evidence of
Impairment
38
Lower Colorado River UT15010008-020_00 East Fork Virgin-3 East Fork Virgin River and tributaries
from Glendale to headwaters
2 No Evidence of
Impairment
36
Lower Colorado River UT15010008-006_00 Leeds Creek Leeds Creek and tributaries from
confluence with Quail Creek to
headwaters
2 No Evidence of
Impairment
10
Lower Colorado River UT15010008-005_00 Quail Creek Quail Creek and tributaries from Quail
Creek Reservoir to headwaters
2 No Evidence of
Impairment
3
Lower Colorado River UT15010008-012_00 Virgin River-4 Virgin River and tributaries from North
Creek confluence to Norh Fork Virgin
River
2 No Evidence of
Impairment
23
Lower Colorado River UT15010008-019_00 East Fork Virgin-2 East Fork Virgin River and tributaries
from Carmel Junction to Glendale
1 Supporting 26
Lower Colorado River UT15010008-011_00 Virgin River-3 Virgin River and tributaries from Quail
Creek Diversion to North Creek
confluence
1 Supporting 4
* Please refer to the 2012/2014 and 2016 IR data files for the sub-category 3 details.
** Phase II of TMDL in Progress.
***Impairment temporary: site specific TDS criterion should apply until WQS change. 28 of 49
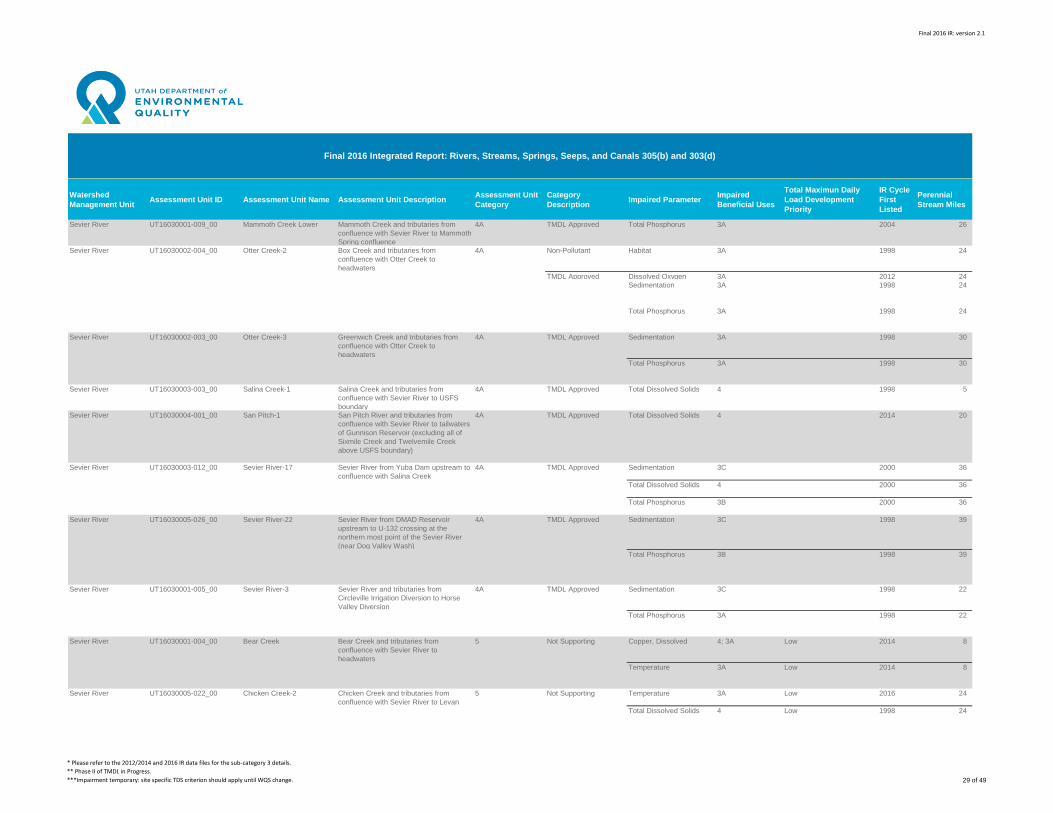
Final 2016 IR: version 2.1
Watershed
Management UnitAssessment Unit ID Assessment Unit Name Assessment Unit Description
Assessment Unit
Category
Category
DescriptionImpaired Parameter
Impaired
Beneficial Uses
Total Maximun Daily
Load Development
Priority
IR Cycle
First
Listed
Perennial
Stream Miles
Final 2016 Integrated Report: Rivers, Streams, Springs, Seeps, and Canals 305(b) and 303(d)
Sevier River UT16030001-009_00 Mammoth Creek Lower Mammoth Creek and tributaries from
confluence with Sevier River to Mammoth
Spring confluence
4A TMDL Approved Total Phosphorus 3A 2004 26
Sevier River UT16030002-004_00 Otter Creek-2 Box Creek and tributaries from
confluence with Otter Creek to
headwaters
4A Non-Pollutant Habitat 3A 1998 24
TMDL Approved Dissolved Oxygen 3A 2012 24
Sedimentation 3A 1998 24
Total Phosphorus 3A 1998 24
Sevier River UT16030002-003_00 Otter Creek-3 Greenwich Creek and tributaries from
confluence with Otter Creek to
headwaters
4A TMDL Approved Sedimentation 3A 1998 30
Total Phosphorus 3A 1998 30
Sevier River UT16030003-003_00 Salina Creek-1 Salina Creek and tributaries from
confluence with Sevier River to USFS
boundary
4A TMDL Approved Total Dissolved Solids 4 1998 5
Sevier River UT16030004-001_00 San Pitch-1 San Pitch River and tributaries from
confluence with Sevier River to tailwaters
of Gunnison Reservoir (excluding all of
Sixmile Creek and Twelvemile Creek
above USFS boundary)
4A TMDL Approved Total Dissolved Solids 4 2014 20
Sevier River UT16030003-012_00 Sevier River-17 Sevier River from Yuba Dam upstream to
confluence with Salina Creek
4A TMDL Approved Sedimentation 3C 2000 36
Total Dissolved Solids 4 2000 36
Total Phosphorus 3B 2000 36
Sevier River UT16030005-026_00 Sevier River-22 Sevier River from DMAD Reservoir
upstream to U-132 crossing at the
northern most point of the Sevier River
(near Dog Valley Wash)
4A TMDL Approved Sedimentation 3C 1998 39
Total Phosphorus 3B 1998 39
Sevier River UT16030001-005_00 Sevier River-3 Sevier River and tributaries from
Circleville Irrigation Diversion to Horse
Valley Diversion
4A TMDL Approved Sedimentation 3C 1998 22
Total Phosphorus 3A 1998 22
Sevier River UT16030001-004_00 Bear Creek Bear Creek and tributaries from
confluence with Sevier River to
headwaters
5 Not Supporting Copper, Dissolved 4; 3A Low 2014 8
Temperature 3A Low 2014 8
Sevier River UT16030005-022_00 Chicken Creek-2 Chicken Creek and tributaries from
confluence with Sevier River to Levan
5 Not Supporting Temperature 3A Low 2016 24
Total Dissolved Solids 4 Low 1998 24
* Please refer to the 2012/2014 and 2016 IR data files for the sub-category 3 details.
** Phase II of TMDL in Progress.
***Impairment temporary: site specific TDS criterion should apply until WQS change. 29 of 49
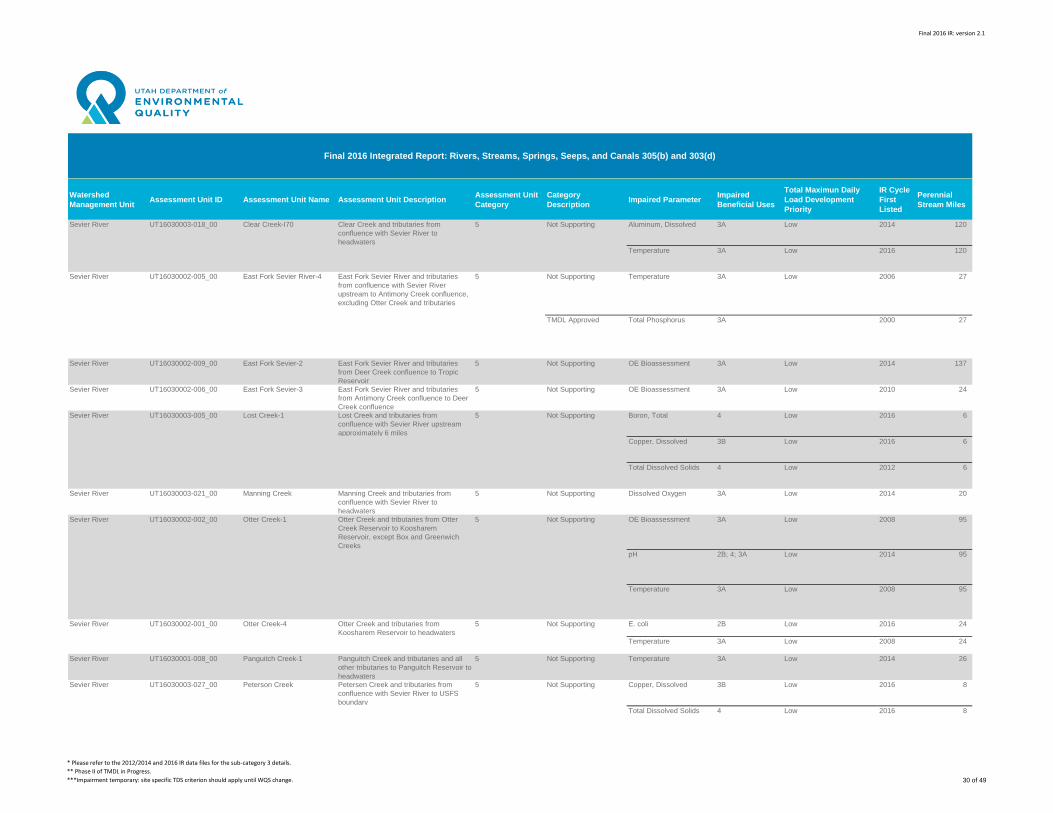
Final 2016 IR: version 2.1
Watershed
Management UnitAssessment Unit ID Assessment Unit Name Assessment Unit Description
Assessment Unit
Category
Category
DescriptionImpaired Parameter
Impaired
Beneficial Uses
Total Maximun Daily
Load Development
Priority
IR Cycle
First
Listed
Perennial
Stream Miles
Final 2016 Integrated Report: Rivers, Streams, Springs, Seeps, and Canals 305(b) and 303(d)
Sevier River UT16030003-018_00 Clear Creek-I70 Clear Creek and tributaries from
confluence with Sevier River to
headwaters
5 Not Supporting Aluminum, Dissolved 3A Low 2014 120
Temperature 3A Low 2016 120
Sevier River UT16030002-005_00 East Fork Sevier River-4 East Fork Sevier River and tributaries
from confluence with Sevier River
upstream to Antimony Creek confluence,
excluding Otter Creek and tributaries
5 Not Supporting Temperature 3A Low 2006 27
TMDL Approved Total Phosphorus 3A 2000 27
Sevier River UT16030002-009_00 East Fork Sevier-2 East Fork Sevier River and tributaries
from Deer Creek confluence to Tropic
Reservoir
5 Not Supporting OE Bioassessment 3A Low 2014 137
Sevier River UT16030002-006_00 East Fork Sevier-3 East Fork Sevier River and tributaries
from Antimony Creek confluence to Deer
Creek confluence
5 Not Supporting OE Bioassessment 3A Low 2010 24
Sevier River UT16030003-005_00 Lost Creek-1 Lost Creek and tributaries from
confluence with Sevier River upstream
approximately 6 miles
5 Not Supporting Boron, Total 4 Low 2016 6
Copper, Dissolved 3B Low 2016 6
Total Dissolved Solids 4 Low 2012 6
Sevier River UT16030003-021_00 Manning Creek Manning Creek and tributaries from
confluence with Sevier River to
headwaters
5 Not Supporting Dissolved Oxygen 3A Low 2014 20
Sevier River UT16030002-002_00 Otter Creek-1 Otter Creek and tributaries from Otter
Creek Reservoir to Koosharem
Reservoir, except Box and Greenwich
Creeks
5 Not Supporting OE Bioassessment 3A Low 2008 95
pH 2B; 4; 3A Low 2014 95
Temperature 3A Low 2008 95
Sevier River UT16030002-001_00 Otter Creek-4 Otter Creek and tributaries from
Koosharem Reservoir to headwaters
5 Not Supporting E. coli 2B Low 2016 24
Temperature 3A Low 2008 24
Sevier River UT16030001-008_00 Panguitch Creek-1 Panguitch Creek and tributaries and all
other tributaries to Panguitch Reservoir to
headwaters
5 Not Supporting Temperature 3A Low 2014 26
Sevier River UT16030003-027_00 Peterson Creek Petersen Creek and tributaries from
confluence with Sevier River to USFS
boundary
5 Not Supporting Copper, Dissolved 3B Low 2016 8
Total Dissolved Solids 4 Low 2016 8
* Please refer to the 2012/2014 and 2016 IR data files for the sub-category 3 details.
** Phase II of TMDL in Progress.
***Impairment temporary: site specific TDS criterion should apply until WQS change. 30 of 49
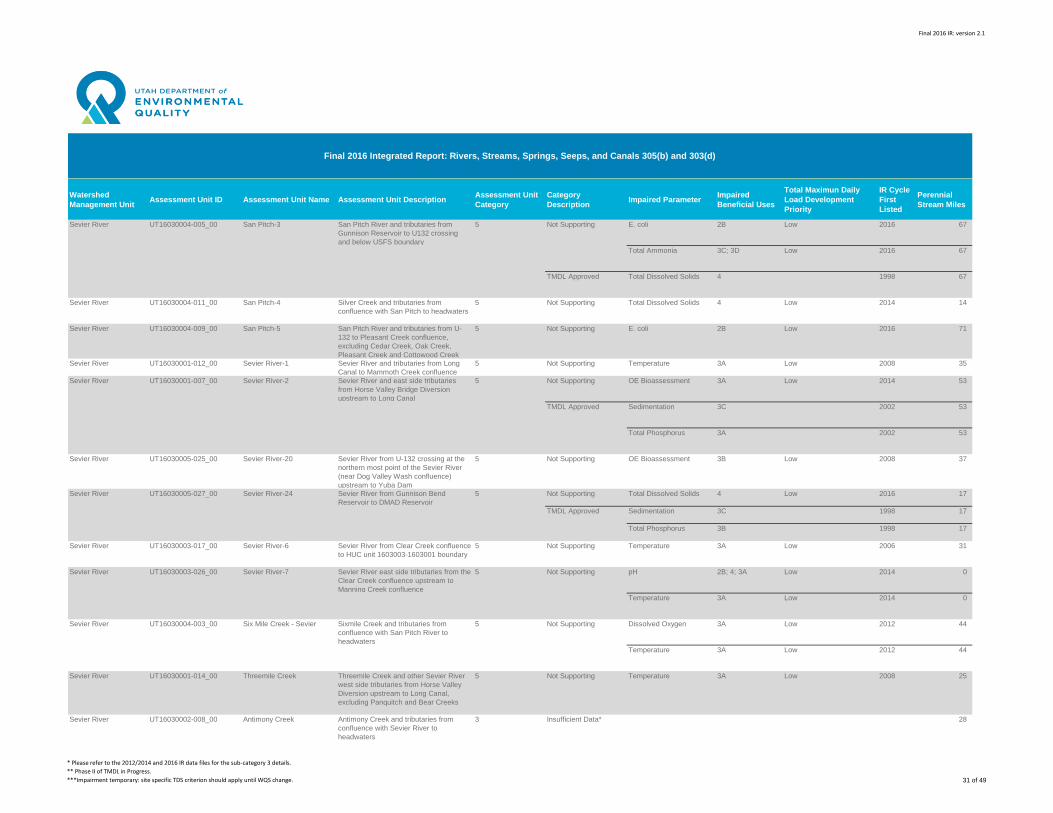
Final 2016 IR: version 2.1
Watershed
Management UnitAssessment Unit ID Assessment Unit Name Assessment Unit Description
Assessment Unit
Category
Category
DescriptionImpaired Parameter
Impaired
Beneficial Uses
Total Maximun Daily
Load Development
Priority
IR Cycle
First
Listed
Perennial
Stream Miles
Final 2016 Integrated Report: Rivers, Streams, Springs, Seeps, and Canals 305(b) and 303(d)
Sevier River UT16030004-005_00 San Pitch-3 San Pitch River and tributaries from
Gunnison Reservoir to U132 crossing
and below USFS boundary
5 Not Supporting E. coli 2B Low 2016 67
Total Ammonia 3C; 3D Low 2016 67
TMDL Approved Total Dissolved Solids 4 1998 67
Sevier River UT16030004-011_00 San Pitch-4 Silver Creek and tributaries from
confluence with San Pitch to headwaters
5 Not Supporting Total Dissolved Solids 4 Low 2014 14
Sevier River UT16030004-009_00 San Pitch-5 San Pitch River and tributaries from U-
132 to Pleasant Creek confluence,
excluding Cedar Creek, Oak Creek,
Pleasant Creek and Cottowood Creek
5 Not Supporting E. coli 2B Low 2016 71
Sevier River UT16030001-012_00 Sevier River-1 Sevier River and tributaries from Long
Canal to Mammoth Creek confluence
5 Not Supporting Temperature 3A Low 2008 35
Sevier River UT16030001-007_00 Sevier River-2 Sevier River and east side tributaries
from Horse Valley Bridge Diversion
upstream to Long Canal
5 Not Supporting OE Bioassessment 3A Low 2014 53
TMDL Approved Sedimentation 3C 2002 53
Total Phosphorus 3A 2002 53
Sevier River UT16030005-025_00 Sevier River-20 Sevier River from U-132 crossing at the
northern most point of the Sevier River
(near Dog Valley Wash confluence)
upstream to Yuba Dam
5 Not Supporting OE Bioassessment 3B Low 2008 37
Sevier River UT16030005-027_00 Sevier River-24 Sevier River from Gunnison Bend
Reservoir to DMAD Reservoir
5 Not Supporting Total Dissolved Solids 4 Low 2016 17
TMDL Approved Sedimentation 3C 1998 17
Total Phosphorus 3B 1998 17
Sevier River UT16030003-017_00 Sevier River-6 Sevier River from Clear Creek confluence
to HUC unit 1603003-1603001 boundary
5 Not Supporting Temperature 3A Low 2006 31
Sevier River UT16030003-026_00 Sevier River-7 Sevier River east side tributaries from the
Clear Creek confluence upstream to
Manning Creek confluence
5 Not Supporting pH 2B; 4; 3A Low 2014 0
Temperature 3A Low 2014 0
Sevier River UT16030004-003_00 Six Mile Creek - Sevier Sixmile Creek and tributaries from
confluence with San Pitch River to
headwaters
5 Not Supporting Dissolved Oxygen 3A Low 2012 44
Temperature 3A Low 2012 44
Sevier River UT16030001-014_00 Threemile Creek Threemile Creek and other Sevier River
west side tributaries from Horse Valley
Diversion upstream to Long Canal,
excluding Panquitch and Bear Creeks
5 Not Supporting Temperature 3A Low 2008 25
Sevier River UT16030002-008_00 Antimony Creek Antimony Creek and tributaries from
confluence with Sevier River to
headwaters
3 Insufficient Data* 28
* Please refer to the 2012/2014 and 2016 IR data files for the sub-category 3 details.
** Phase II of TMDL in Progress.
***Impairment temporary: site specific TDS criterion should apply until WQS change. 31 of 49
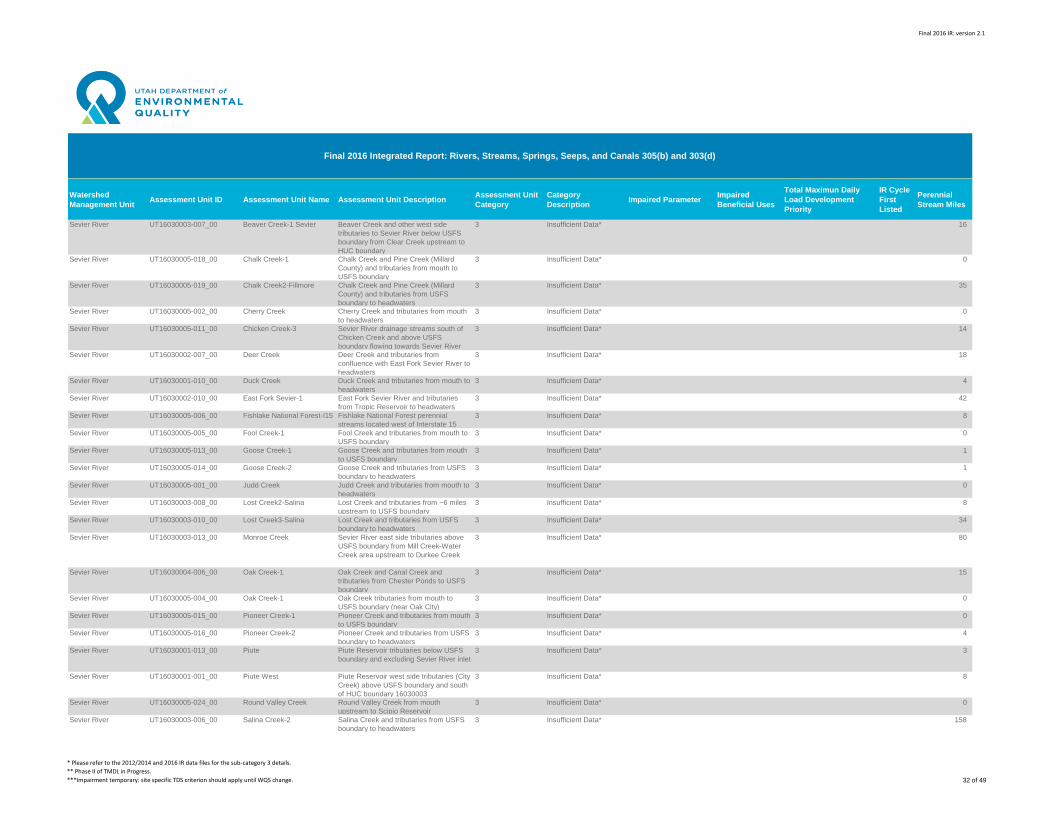
Final 2016 IR: version 2.1
Watershed
Management UnitAssessment Unit ID Assessment Unit Name Assessment Unit Description
Assessment Unit
Category
Category
DescriptionImpaired Parameter
Impaired
Beneficial Uses
Total Maximun Daily
Load Development
Priority
IR Cycle
First
Listed
Perennial
Stream Miles
Final 2016 Integrated Report: Rivers, Streams, Springs, Seeps, and Canals 305(b) and 303(d)
Sevier River UT16030003-007_00 Beaver Creek-1 Sevier Beaver Creek and other west side
tributaries to Sevier River below USFS
boundary from Clear Creek upstream to
HUC boundary
3 Insufficient Data* 16
Sevier River UT16030005-018_00 Chalk Creek-1 Chalk Creek and Pine Creek (Millard
County) and tributaries from mouth to
USFS boundary
3 Insufficient Data* 0
Sevier River UT16030005-019_00 Chalk Creek2-Fillmore Chalk Creek and Pine Creek (Millard
County) and tributaries from USFS
boundary to headwaters
3 Insufficient Data* 35
Sevier River UT16030005-002_00 Cherry Creek Cherry Creek and tributaries from mouth
to headwaters
3 Insufficient Data* 0
Sevier River UT16030005-011_00 Chicken Creek-3 Sevier River drainage streams south of
Chicken Creek and above USFS
boundary flowing towards Sevier River
3 Insufficient Data* 14
Sevier River UT16030002-007_00 Deer Creek Deer Creek and tributaries from
confluence with East Fork Sevier River to
headwaters
3 Insufficient Data* 18
Sevier River UT16030001-010_00 Duck Creek Duck Creek and tributaries from mouth to
headwaters
3 Insufficient Data* 4
Sevier River UT16030002-010_00 East Fork Sevier-1 East Fork Sevier River and tributaries
from Tropic Reservoir to headwaters
3 Insufficient Data* 42
Sevier River UT16030005-006_00 Fishlake National Forest-I15 Fishlake National Forest perennial
streams located west of Interstate 15
3 Insufficient Data* 8
Sevier River UT16030005-005_00 Fool Creek-1 Fool Creek and tributaries from mouth to
USFS boundary
3 Insufficient Data* 0
Sevier River UT16030005-013_00 Goose Creek-1 Goose Creek and tributaries from mouth
to USFS boundary
3 Insufficient Data* 1
Sevier River UT16030005-014_00 Goose Creek-2 Goose Creek and tributaries from USFS
boundary to headwaters
3 Insufficient Data* 1
Sevier River UT16030005-001_00 Judd Creek Judd Creek and tributaries from mouth to
headwaters
3 Insufficient Data* 0
Sevier River UT16030003-008_00 Lost Creek2-Salina Lost Creek and tributaries from ~6 miles
upstream to USFS boundary
3 Insufficient Data* 8
Sevier River UT16030003-010_00 Lost Creek3-Salina Lost Creek and tributaries from USFS
boundary to headwaters
3 Insufficient Data* 34
Sevier River UT16030003-013_00 Monroe Creek Sevier River east side tributaries above
USFS boundary from Mill Creek-Water
Creek area upstream to Durkee Creek
3 Insufficient Data* 80
Sevier River UT16030004-006_00 Oak Creek-1 Oak Creek and Canal Creek and
tributaries from Chester Ponds to USFS
boundary
3 Insufficient Data* 15
Sevier River UT16030005-004_00 Oak Creek-1 Oak Creek tributaries from mouth to
USFS boundary (near Oak City)
3 Insufficient Data* 0
Sevier River UT16030005-015_00 Pioneer Creek-1 Pioneer Creek and tributaries from mouth
to USFS boundary
3 Insufficient Data* 0
Sevier River UT16030005-016_00 Pioneer Creek-2 Pioneer Creek and tributaries from USFS
boundary to headwaters
3 Insufficient Data* 4
Sevier River UT16030001-013_00 Piute Piute Reservoir tributaries below USFS
boundary and excluding Sevier River inlet
3 Insufficient Data* 3
Sevier River UT16030001-001_00 Piute West Piute Reservoir west side tributaries (City
Creek) above USFS boundary and south
of HUC boundary 16030003
3 Insufficient Data* 8
Sevier River UT16030005-024_00 Round Valley Creek Round Valley Creek from mouth
upstream to Scipio Reservoir
3 Insufficient Data* 0
Sevier River UT16030003-006_00 Salina Creek-2 Salina Creek and tributaries from USFS
boundary to headwaters
3 Insufficient Data* 158
* Please refer to the 2012/2014 and 2016 IR data files for the sub-category 3 details.
** Phase II of TMDL in Progress.
***Impairment temporary: site specific TDS criterion should apply until WQS change. 32 of 49
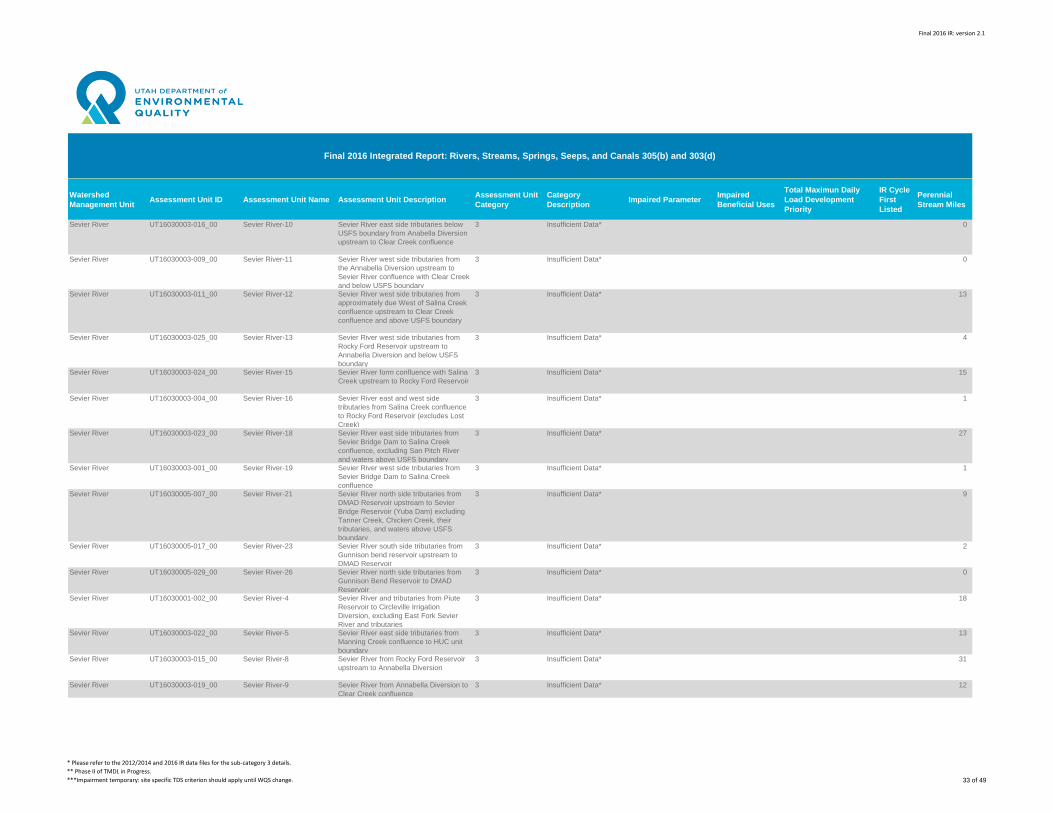
Final 2016 IR: version 2.1
Watershed
Management UnitAssessment Unit ID Assessment Unit Name Assessment Unit Description
Assessment Unit
Category
Category
DescriptionImpaired Parameter
Impaired
Beneficial Uses
Total Maximun Daily
Load Development
Priority
IR Cycle
First
Listed
Perennial
Stream Miles
Final 2016 Integrated Report: Rivers, Streams, Springs, Seeps, and Canals 305(b) and 303(d)
Sevier River UT16030003-016_00 Sevier River-10 Sevier River east side tributaries below
USFS boundary from Anabella Diversion
upstream to Clear Creek confluence
3 Insufficient Data* 0
Sevier River UT16030003-009_00 Sevier River-11 Sevier River west side tributaries from
the Annabella Diversion upstream to
Sevier River confluence with Clear Creek
and below USFS boundary
3 Insufficient Data* 0
Sevier River UT16030003-011_00 Sevier River-12 Sevier River west side tributaries from
approximately due West of Salina Creek
confluence upstream to Clear Creek
confluence and above USFS boundary
3 Insufficient Data* 13
Sevier River UT16030003-025_00 Sevier River-13 Sevier River west side tributaries from
Rocky Ford Reservoir upstream to
Annabella Diversion and below USFS
boundary
3 Insufficient Data* 4
Sevier River UT16030003-024_00 Sevier River-15 Sevier River form confluence with Salina
Creek upstream to Rocky Ford Reservoir
3 Insufficient Data* 15
Sevier River UT16030003-004_00 Sevier River-16 Sevier River east and west side
tributaries from Salina Creek confluence
to Rocky Ford Reservoir (excludes Lost
Creek)
3 Insufficient Data* 1
Sevier River UT16030003-023_00 Sevier River-18 Sevier River east side tributaries from
Sevier Bridge Dam to Salina Creek
confluence, excluding San Pitch River
and waters above USFS boundary
3 Insufficient Data* 27
Sevier River UT16030003-001_00 Sevier River-19 Sevier River west side tributaries from
Sevier Bridge Dam to Salina Creek
confluence
3 Insufficient Data* 1
Sevier River UT16030005-007_00 Sevier River-21 Sevier River north side tributaries from
DMAD Reservoir upstream to Sevier
Bridge Reservoir (Yuba Dam) excluding
Tanner Creek, Chicken Creek, their
tributaries, and waters above USFS
boundary
3 Insufficient Data* 9
Sevier River UT16030005-017_00 Sevier River-23 Sevier River south side tributaries from
Gunnison bend reservoir upstream to
DMAD Reservoir
3 Insufficient Data* 2
Sevier River UT16030005-029_00 Sevier River-26 Sevier River north side tributaries from
Gunnison Bend Reservoir to DMAD
Reservoir
3 Insufficient Data* 0
Sevier River UT16030001-002_00 Sevier River-4 Sevier River and tributaries from Piute
Reservoir to Circleville Irrigation
Diversion, excluding East Fork Sevier
River and tributaries
3 Insufficient Data* 18
Sevier River UT16030003-022_00 Sevier River-5 Sevier River east side tributaries from
Manning Creek confluence to HUC unit
boundary
3 Insufficient Data* 13
Sevier River UT16030003-015_00 Sevier River-8 Sevier River from Rocky Ford Reservoir
upstream to Annabella Diversion
3 Insufficient Data* 31
Sevier River UT16030003-019_00 Sevier River-9 Sevier River from Annabella Diversion to
Clear Creek confluence
3 Insufficient Data* 12
* Please refer to the 2012/2014 and 2016 IR data files for the sub-category 3 details.
** Phase II of TMDL in Progress.
***Impairment temporary: site specific TDS criterion should apply until WQS change. 33 of 49
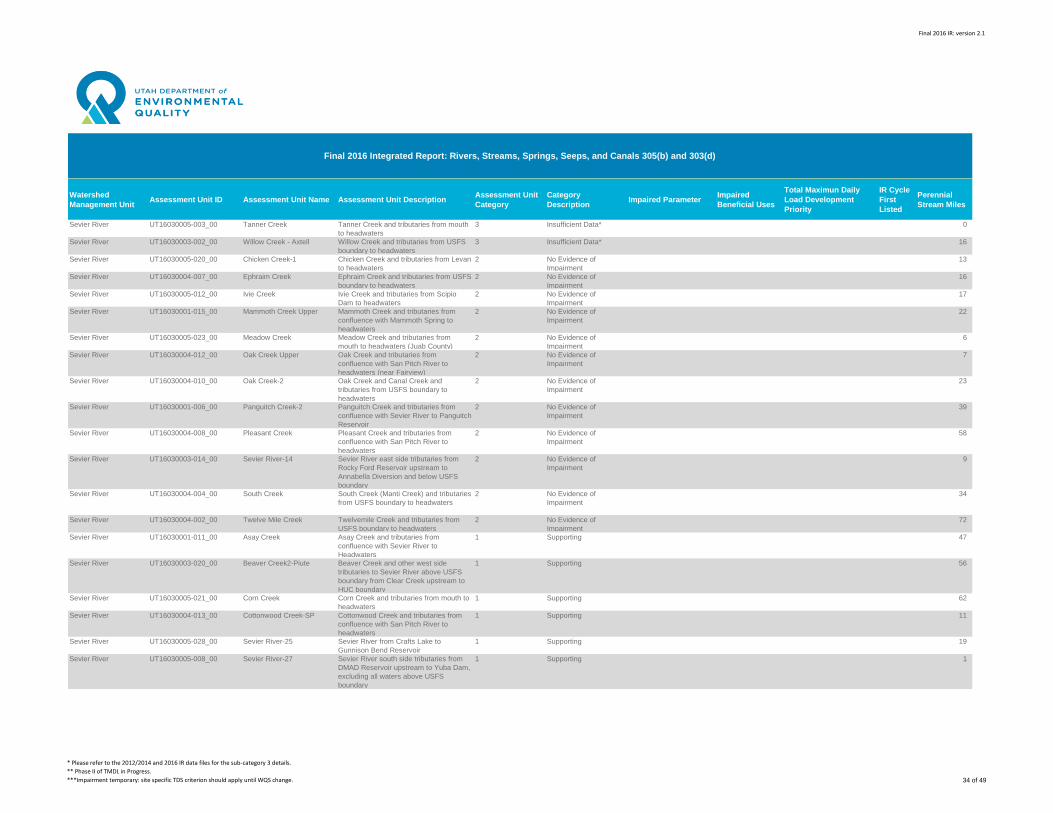
Final 2016 IR: version 2.1
Watershed
Management UnitAssessment Unit ID Assessment Unit Name Assessment Unit Description
Assessment Unit
Category
Category
DescriptionImpaired Parameter
Impaired
Beneficial Uses
Total Maximun Daily
Load Development
Priority
IR Cycle
First
Listed
Perennial
Stream Miles
Final 2016 Integrated Report: Rivers, Streams, Springs, Seeps, and Canals 305(b) and 303(d)
Sevier River UT16030005-003_00 Tanner Creek Tanner Creek and tributaries from mouth
to headwaters
3 Insufficient Data* 0
Sevier River UT16030003-002_00 Willow Creek - Axtell Willow Creek and tributaries from USFS
boundary to headwaters
3 Insufficient Data* 16
Sevier River UT16030005-020_00 Chicken Creek-1 Chicken Creek and tributaries from Levan
to headwaters
2 No Evidence of
Impairment
13
Sevier River UT16030004-007_00 Ephraim Creek Ephraim Creek and tributaries from USFS
boundary to headwaters
2 No Evidence of
Impairment
16
Sevier River UT16030005-012_00 Ivie Creek Ivie Creek and tributaries from Scipio
Dam to headwaters
2 No Evidence of
Impairment
17
Sevier River UT16030001-015_00 Mammoth Creek Upper Mammoth Creek and tributaries from
confluence with Mammoth Spring to
headwaters
2 No Evidence of
Impairment
22
Sevier River UT16030005-023_00 Meadow Creek Meadow Creek and tributaries from
mouth to headwaters (Juab County)
2 No Evidence of
Impairment
6
Sevier River UT16030004-012_00 Oak Creek Upper Oak Creek and tributaries from
confluence with San Pitch River to
headwaters (near Fairview)
2 No Evidence of
Impairment
7
Sevier River UT16030004-010_00 Oak Creek-2 Oak Creek and Canal Creek and
tributaries from USFS boundary to
headwaters
2 No Evidence of
Impairment
23
Sevier River UT16030001-006_00 Panguitch Creek-2 Panguitch Creek and tributaries from
confluence with Sevier River to Panguitch
Reservoir
2 No Evidence of
Impairment
39
Sevier River UT16030004-008_00 Pleasant Creek Pleasant Creek and tributaries from
confluence with San Pitch River to
headwaters
2 No Evidence of
Impairment
58
Sevier River UT16030003-014_00 Sevier River-14 Sevier River east side tributaries from
Rocky Ford Reservoir upstream to
Annabella Diversion and below USFS
boundary
2 No Evidence of
Impairment
9
Sevier River UT16030004-004_00 South Creek South Creek (Manti Creek) and tributaries
from USFS boundary to headwaters
2 No Evidence of
Impairment
34
Sevier River UT16030004-002_00 Twelve Mile Creek Twelvemile Creek and tributaries from
USFS boundary to headwaters
2 No Evidence of
Impairment
72
Sevier River UT16030001-011_00 Asay Creek Asay Creek and tributaries from
confluence with Sevier River to
Headwaters
1 Supporting 47
Sevier River UT16030003-020_00 Beaver Creek2-Piute Beaver Creek and other west side
tributaries to Sevier River above USFS
boundary from Clear Creek upstream to
HUC boundary
1 Supporting 56
Sevier River UT16030005-021_00 Corn Creek Corn Creek and tributaries from mouth to
headwaters
1 Supporting 62
Sevier River UT16030004-013_00 Cottonwood Creek-SP Cottonwood Creek and tributaries from
confluence with San Pitch River to
headwaters
1 Supporting 11
Sevier River UT16030005-028_00 Sevier River-25 Sevier River from Crafts Lake to
Gunnison Bend Reservoir
1 Supporting 19
Sevier River UT16030005-008_00 Sevier River-27 Sevier River south side tributaries from
DMAD Reservoir upstream to Yuba Dam,
excluding all waters above USFS
boundary
1 Supporting 1
* Please refer to the 2012/2014 and 2016 IR data files for the sub-category 3 details.
** Phase II of TMDL in Progress.
***Impairment temporary: site specific TDS criterion should apply until WQS change. 34 of 49
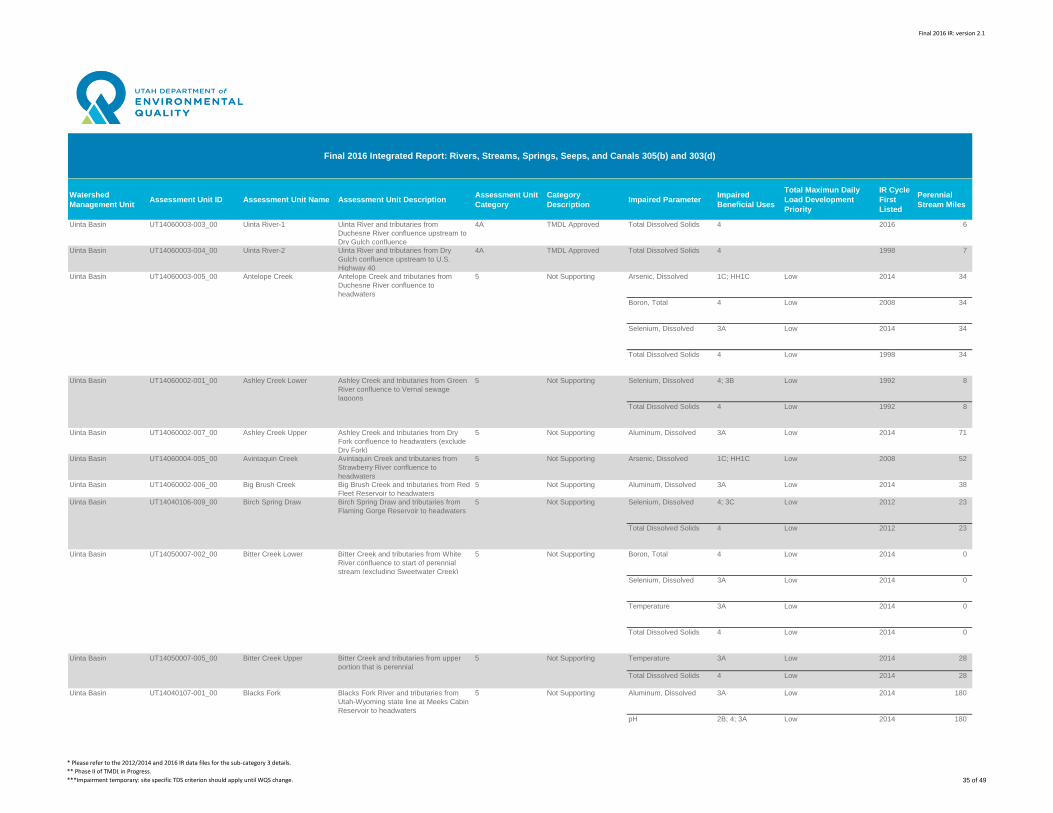
Final 2016 IR: version 2.1
Watershed
Management UnitAssessment Unit ID Assessment Unit Name Assessment Unit Description
Assessment Unit
Category
Category
DescriptionImpaired Parameter
Impaired
Beneficial Uses
Total Maximun Daily
Load Development
Priority
IR Cycle
First
Listed
Perennial
Stream Miles
Final 2016 Integrated Report: Rivers, Streams, Springs, Seeps, and Canals 305(b) and 303(d)
Uinta Basin UT14060003-003_00 Uinta River-1 Uinta River and tributaries from
Duchesne River confluence upstream to
Dry Gulch confluence
4A TMDL Approved Total Dissolved Solids 4 2016 6
Uinta Basin UT14060003-004_00 Uinta River-2 Uinta River and tributaries from Dry
Gulch confluence upstream to U.S.
Highway 40
4A TMDL Approved Total Dissolved Solids 4 1998 7
Uinta Basin UT14060003-005_00 Antelope Creek Antelope Creek and tributaries from
Duchesne River confluence to
headwaters
5 Not Supporting Arsenic, Dissolved 1C; HH1C Low 2014 34
Boron, Total 4 Low 2008 34
Selenium, Dissolved 3A Low 2014 34
Total Dissolved Solids 4 Low 1998 34
Uinta Basin UT14060002-001_00 Ashley Creek Lower Ashley Creek and tributaries from Green
River confluence to Vernal sewage
lagoons
5 Not Supporting Selenium, Dissolved 4; 3B Low 1992 8
Total Dissolved Solids 4 Low 1992 8
Uinta Basin UT14060002-007_00 Ashley Creek Upper Ashley Creek and tributaries from Dry
Fork confluence to headwaters (exclude
Dry Fork)
5 Not Supporting Aluminum, Dissolved 3A Low 2014 71
Uinta Basin UT14060004-005_00 Avintaquin Creek Avintaquin Creek and tributaries from
Strawberry River confluence to
headwaters
5 Not Supporting Arsenic, Dissolved 1C; HH1C Low 2008 52
Uinta Basin UT14060002-006_00 Big Brush Creek Big Brush Creek and tributaries from Red
Fleet Reservoir to headwaters
5 Not Supporting Aluminum, Dissolved 3A Low 2014 38
Uinta Basin UT14040106-009_00 Birch Spring Draw Birch Spring Draw and tributaries from
Flaming Gorge Reservoir to headwaters
5 Not Supporting Selenium, Dissolved 4; 3C Low 2012 23
Total Dissolved Solids 4 Low 2012 23
Uinta Basin UT14050007-002_00 Bitter Creek Lower Bitter Creek and tributaries from White
River confluence to start of perennial
stream (excluding Sweetwater Creek)
5 Not Supporting Boron, Total 4 Low 2014 0
Selenium, Dissolved 3A Low 2014 0
Temperature 3A Low 2014 0
Total Dissolved Solids 4 Low 2014 0
Uinta Basin UT14050007-005_00 Bitter Creek Upper Bitter Creek and tributaries from upper
portion that is perennial
5 Not Supporting Temperature 3A Low 2014 28
Total Dissolved Solids 4 Low 2014 28
Uinta Basin UT14040107-001_00 Blacks Fork Blacks Fork River and tributaries from
Utah-Wyoming state line at Meeks Cabin
Reservoir to headwaters
5 Not Supporting Aluminum, Dissolved 3A Low 2014 180
pH 2B; 4; 3A Low 2014 180
* Please refer to the 2012/2014 and 2016 IR data files for the sub-category 3 details.
** Phase II of TMDL in Progress.
***Impairment temporary: site specific TDS criterion should apply until WQS change. 35 of 49
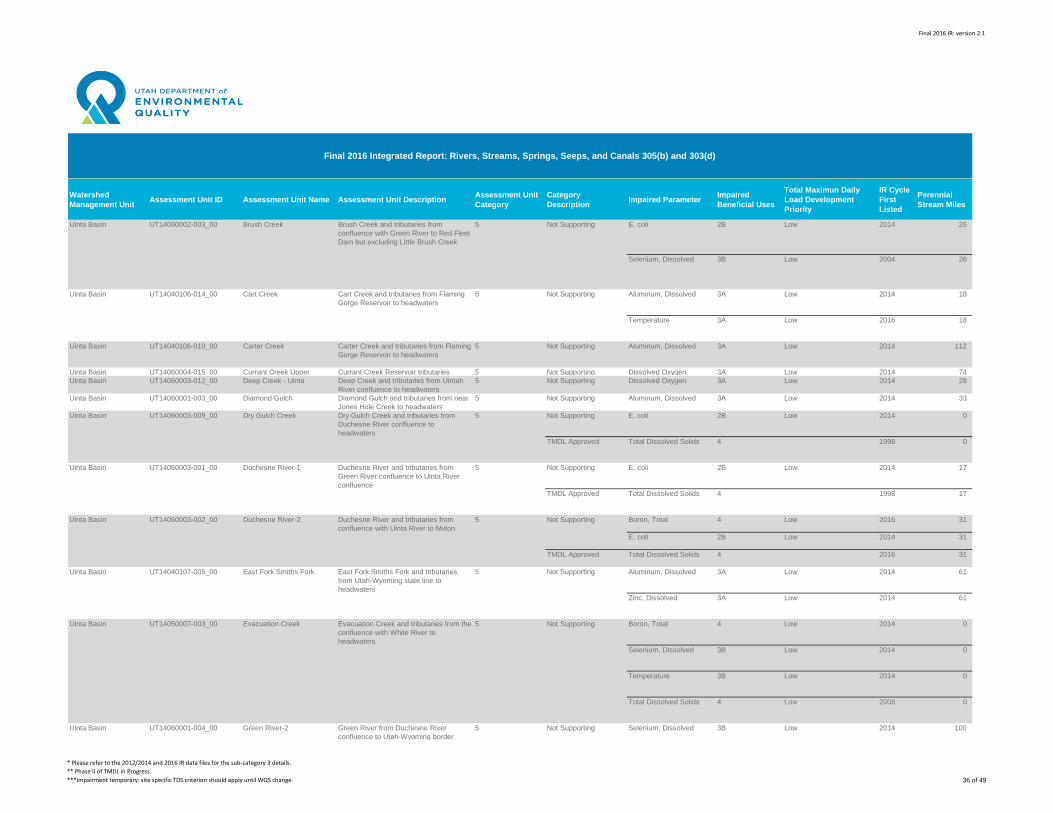
Final 2016 IR: version 2.1
Watershed
Management UnitAssessment Unit ID Assessment Unit Name Assessment Unit Description
Assessment Unit
Category
Category
DescriptionImpaired Parameter
Impaired
Beneficial Uses
Total Maximun Daily
Load Development
Priority
IR Cycle
First
Listed
Perennial
Stream Miles
Final 2016 Integrated Report: Rivers, Streams, Springs, Seeps, and Canals 305(b) and 303(d)
Uinta Basin UT14060002-003_00 Brush Creek Brush Creek and tributaries from
confluence with Green River to Red Fleet
Dam but excluding Little Brush Creek
5 Not Supporting E. coli 2B Low 2014 26
Selenium, Dissolved 3B Low 2004 26
Uinta Basin UT14040106-014_00 Cart Creek Cart Creek and tributaries from Flaming
Gorge Reservoir to headwaters
5 Not Supporting Aluminum, Dissolved 3A Low 2014 18
Temperature 3A Low 2016 18
Uinta Basin UT14040106-010_00 Carter Creek Carter Creek and tributaries from Flaming
Gorge Reservoir to headwaters
5 Not Supporting Aluminum, Dissolved 3A Low 2014 112
Uinta Basin UT14060004-015_00 Currant Creek Upper Currant Creek Reservoir tributaries 5 Not Supporting Dissolved Oxygen 3A Low 2014 74
Uinta Basin UT14060003-012_00 Deep Creek - Uinta Deep Creek and tributaries from Uintah
River confluence to headwaters
5 Not Supporting Dissolved Oxygen 3A Low 2014 28
Uinta Basin UT14060001-003_00 Diamond Gulch Diamond Gulch and tributaries from near
Jones Hole Creek to headwaters
5 Not Supporting Aluminum, Dissolved 3A Low 2014 33
Uinta Basin UT14060003-009_00 Dry Gulch Creek Dry Gulch Creek and tributaries from
Duchesne River confluence to
headwaters
5 Not Supporting E. coli 2B Low 2014 0
TMDL Approved Total Dissolved Solids 4 1998 0
Uinta Basin UT14060003-001_00 Duchesne River-1 Duchesne River and tributaries from
Green River confluence to Uinta River
confluence
5 Not Supporting E. coli 2B Low 2014 17
TMDL Approved Total Dissolved Solids 4 1998 17
Uinta Basin UT14060003-002_00 Duchesne River-2 Duchesne River and tributaries from
confluence with Uinta River to Myton
5 Not Supporting Boron, Total 4 Low 2016 31
E. coli 2B Low 2014 31
TMDL Approved Total Dissolved Solids 4 2016 31
Uinta Basin UT14040107-005_00 East Fork Smiths Fork East Fork Smiths Fork and tributaries
from Utah-Wyoming state line to
headwaters
5 Not Supporting Aluminum, Dissolved 3A Low 2014 61
Zinc, Dissolved 3A Low 2014 61
Uinta Basin UT14050007-003_00 Evacuation Creek Evacuation Creek and tributaries from the
confluence with White River to
headwaters
5 Not Supporting Boron, Total 4 Low 2014 0
Selenium, Dissolved 3B Low 2014 0
Temperature 3B Low 2014 0
Total Dissolved Solids 4 Low 2008 0
Uinta Basin UT14060001-004_00 Green River-2 Green River from Duchesne River
confluence to Utah-Wyoming border
5 Not Supporting Selenium, Dissolved 3B Low 2014 100
* Please refer to the 2012/2014 and 2016 IR data files for the sub-category 3 details.
** Phase II of TMDL in Progress.
***Impairment temporary: site specific TDS criterion should apply until WQS change. 36 of 49
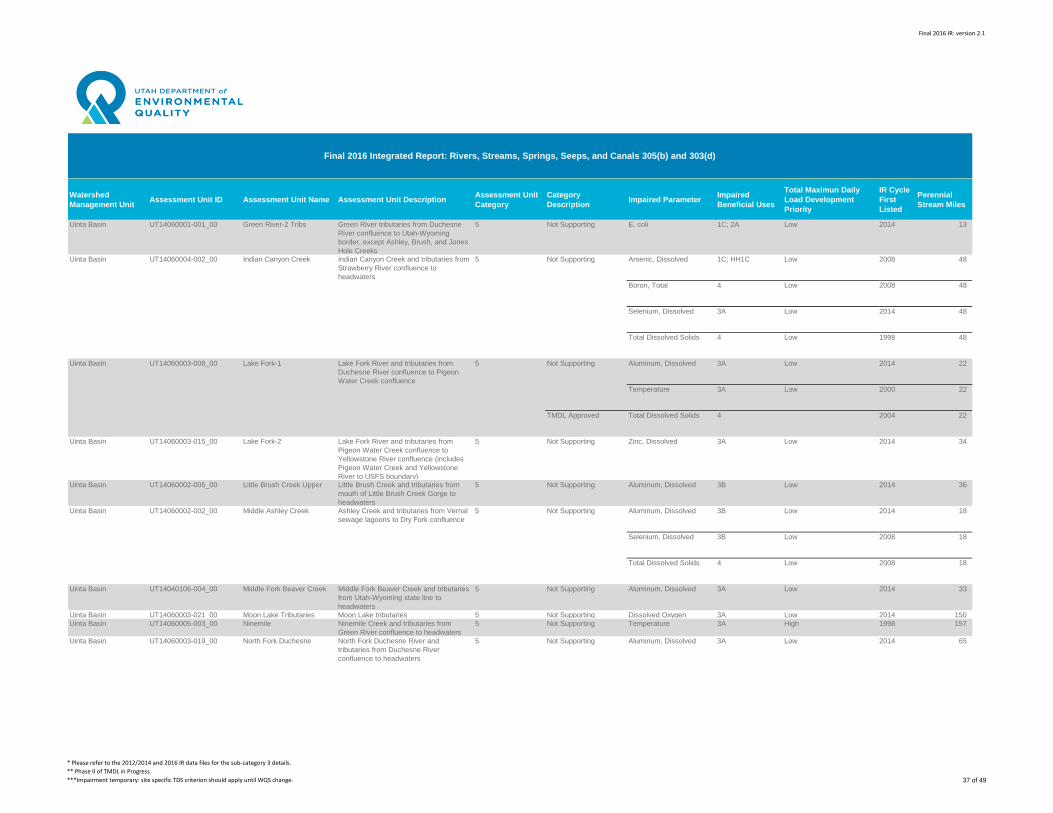
Final 2016 IR: version 2.1
Watershed
Management UnitAssessment Unit ID Assessment Unit Name Assessment Unit Description
Assessment Unit
Category
Category
DescriptionImpaired Parameter
Impaired
Beneficial Uses
Total Maximun Daily
Load Development
Priority
IR Cycle
First
Listed
Perennial
Stream Miles
Final 2016 Integrated Report: Rivers, Streams, Springs, Seeps, and Canals 305(b) and 303(d)
Uinta Basin UT14060001-001_00 Green River-2 Tribs Green River tributaries from Duchesne
River confluence to Utah-Wyoming
border, except Ashley, Brush, and Jones
Hole Creeks
5 Not Supporting E. coli 1C; 2A Low 2014 13
Uinta Basin UT14060004-002_00 Indian Canyon Creek Indian Canyon Creek and tributaries from
Strawberry River confluence to
headwaters
5 Not Supporting Arsenic, Dissolved 1C; HH1C Low 2008 48
Boron, Total 4 Low 2008 48
Selenium, Dissolved 3A Low 2014 48
Total Dissolved Solids 4 Low 1998 48
Uinta Basin UT14060003-008_00 Lake Fork-1 Lake Fork River and tributaries from
Duchesne River confluence to Pigeon
Water Creek confluence
5 Not Supporting Aluminum, Dissolved 3A Low 2014 22
Temperature 3A Low 2000 22
TMDL Approved Total Dissolved Solids 4 2004 22
Uinta Basin UT14060003-015_00 Lake Fork-2 Lake Fork River and tributaries from
Pigeon Water Creek confluence to
Yellowstone River confluence (includes
Pigeon Water Creek and Yellowstone
River to USFS boundary)
5 Not Supporting Zinc, Dissolved 3A Low 2014 34
Uinta Basin UT14060002-005_00 Little Brush Creek Upper Little Brush Creek and tributaries from
mouth of Little Brush Creek Gorge to
headwaters
5 Not Supporting Aluminum, Dissolved 3B Low 2014 36
Uinta Basin UT14060002-002_00 Middle Ashley Creek Ashley Creek and tributaries from Vernal
sewage lagoons to Dry Fork confluence
5 Not Supporting Aluminum, Dissolved 3B Low 2014 18
Selenium, Dissolved 3B Low 2008 18
Total Dissolved Solids 4 Low 2008 18
Uinta Basin UT14040106-004_00 Middle Fork Beaver Creek Middle Fork Beaver Creek and tributaries
from Utah-Wyoming state line to
headwaters
5 Not Supporting Aluminum, Dissolved 3A Low 2014 33
Uinta Basin UT14060003-021_00 Moon Lake Tributaries Moon Lake tributaries 5 Not Supporting Dissolved Oxygen 3A Low 2014 150
Uinta Basin UT14060005-003_00 Ninemile Ninemile Creek and tributaries from
Green River confluence to headwaters
5 Not Supporting Temperature 3A High 1998 157
Uinta Basin UT14060003-019_00 North Fork Duchesne North Fork Duchesne River and
tributaries from Duchesne River
confluence to headwaters
5 Not Supporting Aluminum, Dissolved 3A Low 2014 65
* Please refer to the 2012/2014 and 2016 IR data files for the sub-category 3 details.
** Phase II of TMDL in Progress.
***Impairment temporary: site specific TDS criterion should apply until WQS change. 37 of 49
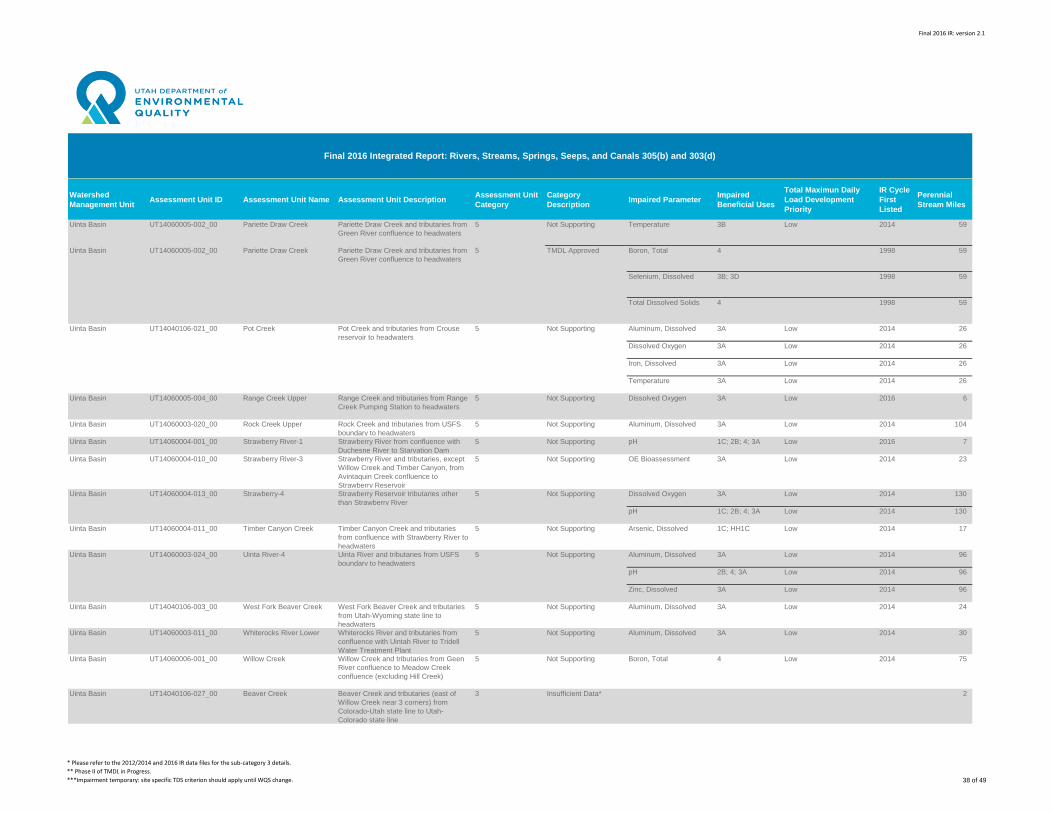
Final 2016 IR: version 2.1
Watershed
Management UnitAssessment Unit ID Assessment Unit Name Assessment Unit Description
Assessment Unit
Category
Category
DescriptionImpaired Parameter
Impaired
Beneficial Uses
Total Maximun Daily
Load Development
Priority
IR Cycle
First
Listed
Perennial
Stream Miles
Final 2016 Integrated Report: Rivers, Streams, Springs, Seeps, and Canals 305(b) and 303(d)
Uinta Basin UT14060005-002_00 Pariette Draw Creek Pariette Draw Creek and tributaries from
Green River confluence to headwaters
5 Not Supporting Temperature 3B Low 2014 59
Uinta Basin UT14060005-002_00 Pariette Draw Creek Pariette Draw Creek and tributaries from
Green River confluence to headwaters
5 TMDL Approved Boron, Total 4 1998 59
Selenium, Dissolved 3B; 3D 1998 59
Total Dissolved Solids 4 1998 59
Uinta Basin UT14040106-021_00 Pot Creek Pot Creek and tributaries from Crouse
reservoir to headwaters
5 Not Supporting Aluminum, Dissolved 3A Low 2014 26
Dissolved Oxygen 3A Low 2014 26
Iron, Dissolved 3A Low 2014 26
Temperature 3A Low 2014 26
Uinta Basin UT14060005-004_00 Range Creek Upper Range Creek and tributaries from Range
Creek Pumping Station to headwaters
5 Not Supporting Dissolved Oxygen 3A Low 2016 6
Uinta Basin UT14060003-020_00 Rock Creek Upper Rock Creek and tributaries from USFS
boundary to headwaters
5 Not Supporting Aluminum, Dissolved 3A Low 2014 104
Uinta Basin UT14060004-001_00 Strawberry River-1 Strawberry River from confluence with
Duchesne River to Starvation Dam
5 Not Supporting pH 1C; 2B; 4; 3A Low 2016 7
Uinta Basin UT14060004-010_00 Strawberry River-3 Strawberry River and tributaries, except
Willow Creek and Timber Canyon, from
Avintaquin Creek confluence to
Strawberry Reservoir
5 Not Supporting OE Bioassessment 3A Low 2014 23
Uinta Basin UT14060004-013_00 Strawberry-4 Strawberry Reservoir tributaries other
than Strawberry River
5 Not Supporting Dissolved Oxygen 3A Low 2014 130
pH 1C; 2B; 4; 3A Low 2014 130
Uinta Basin UT14060004-011_00 Timber Canyon Creek Timber Canyon Creek and tributaries
from confluence with Strawberry River to
headwaters
5 Not Supporting Arsenic, Dissolved 1C; HH1C Low 2014 17
Uinta Basin UT14060003-024_00 Uinta River-4 Uinta River and tributaries from USFS
boundary to headwaters
5 Not Supporting Aluminum, Dissolved 3A Low 2014 96
pH 2B; 4; 3A Low 2014 96
Zinc, Dissolved 3A Low 2014 96
Uinta Basin UT14040106-003_00 West Fork Beaver Creek West Fork Beaver Creek and tributaries
from Utah-Wyoming state line to
headwaters
5 Not Supporting Aluminum, Dissolved 3A Low 2014 24
Uinta Basin UT14060003-011_00 Whiterocks River Lower Whiterocks River and tributaries from
confluence with Uintah River to Tridell
Water Treatment Plant
5 Not Supporting Aluminum, Dissolved 3A Low 2014 30
Uinta Basin UT14060006-001_00 Willow Creek Willow Creek and tributaries from Geen
River confluence to Meadow Creek
confluence (excluding Hill Creek)
5 Not Supporting Boron, Total 4 Low 2014 75
Uinta Basin UT14040106-027_00 Beaver Creek Beaver Creek and tributaries (east of
Willow Creek near 3 corners) from
Colorado-Utah state line to Utah-
Colorado state line
3 Insufficient Data* 2
* Please refer to the 2012/2014 and 2016 IR data files for the sub-category 3 details.
** Phase II of TMDL in Progress.
***Impairment temporary: site specific TDS criterion should apply until WQS change. 38 of 49
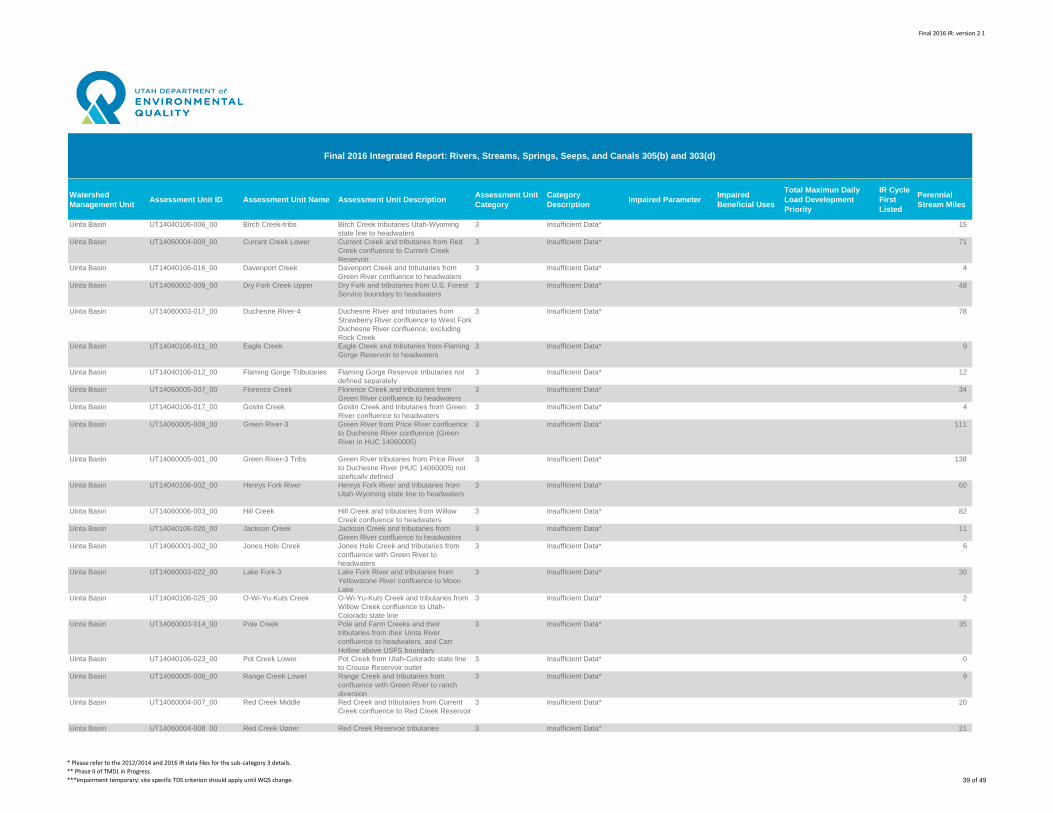
Final 2016 IR: version 2.1
Watershed
Management UnitAssessment Unit ID Assessment Unit Name Assessment Unit Description
Assessment Unit
Category
Category
DescriptionImpaired Parameter
Impaired
Beneficial Uses
Total Maximun Daily
Load Development
Priority
IR Cycle
First
Listed
Perennial
Stream Miles
Final 2016 Integrated Report: Rivers, Streams, Springs, Seeps, and Canals 305(b) and 303(d)
Uinta Basin UT14040106-006_00 Birch Creek-tribs Birch Creek tributaries Utah-Wyoming
state line to headwaters
3 Insufficient Data* 15
Uinta Basin UT14060004-009_00 Currant Creek Lower Current Creek and tributaries from Red
Creek confluence to Current Creek
Reservoir
3 Insufficient Data* 71
Uinta Basin UT14040106-016_00 Davenport Creek Davenport Creek and tributaries from
Green River confluence to headwaters
3 Insufficient Data* 4
Uinta Basin UT14060002-009_00 Dry Fork Creek Upper Dry Fork and tributaries from U.S. Forest
Service boundary to headwaters
3 Insufficient Data* 48
Uinta Basin UT14060003-017_00 Duchesne River-4 Duchesne River and tributaries from
Strawberry River confluence to West Fork
Duchesne River confluence, excluding
Rock Creek
3 Insufficient Data* 78
Uinta Basin UT14040106-011_00 Eagle Creek Eagle Creek and tributaries from Flaming
Gorge Reservoir to headwaters
3 Insufficient Data* 9
Uinta Basin UT14040106-012_00 Flaming Gorge Tributaries Flaming Gorge Reservoir tributaries not
defined separately
3 Insufficient Data* 12
Uinta Basin UT14060005-007_00 Florence Creek Florence Creek and tributaries from
Green River confluence to headwaters
3 Insufficient Data* 34
Uinta Basin UT14040106-017_00 Goslin Creek Goslin Creek and tributaries from Green
River confluence to headwaters
3 Insufficient Data* 4
Uinta Basin UT14060005-009_00 Green River-3 Green River from Price River confluence
to Duchesne River confluence (Green
River in HUC 14060005)
3 Insufficient Data* 111
Uinta Basin UT14060005-001_00 Green River-3 Tribs Green River tributaries from Price River
to Duchesne River (HUC 14060005) not
spefically defined
3 Insufficient Data* 138
Uinta Basin UT14040106-002_00 Henrys Fork River Henrys Fork River and tributaries from
Utah-Wyoming state line to headwaters
3 Insufficient Data* 60
Uinta Basin UT14060006-003_00 Hill Creek Hill Creek and tributaries from Willow
Creek confluence to headwaters
3 Insufficient Data* 82
Uinta Basin UT14040106-020_00 Jackson Creek Jackson Creek and tributaries from
Green River confluence to headwaters
3 Insufficient Data* 11
Uinta Basin UT14060001-002_00 Jones Hole Creek Jones Hole Creek and tributaries from
confluence with Green River to
headwaters
3 Insufficient Data* 6
Uinta Basin UT14060003-022_00 Lake Fork-3 Lake Fork River and tributaries from
Yellowstone River confluence to Moon
Lake
3 Insufficient Data* 30
Uinta Basin UT14040106-025_00 O-Wi-Yu-Kuts Creek O-Wi-Yu-Kuts Creek and tributaries from
Willow Creek confluence to Utah-
Colorado state line
3 Insufficient Data* 2
Uinta Basin UT14060003-014_00 Pole Creek Pole and Farm Creeks and their
tributaries from their Uinta River
confluence to headwaters, and Cart
Hollow above USFS boundary
3 Insufficient Data* 35
Uinta Basin UT14040106-023_00 Pot Creek Lower Pot Creek from Utah-Colorado state line
to Crouse Reservoir outlet
3 Insufficient Data* 0
Uinta Basin UT14060005-006_00 Range Creek Lower Range Creek and tributaries from
confluence with Green River to ranch
diversion
3 Insufficient Data* 9
Uinta Basin UT14060004-007_00 Red Creek Middle Red Creek and tributaries from Current
Creek confluence to Red Creek Reservoir
3 Insufficient Data* 20
Uinta Basin UT14060004-008_00 Red Creek Upper Red Creek Reservoir tributaries 3 Insufficient Data* 21
* Please refer to the 2012/2014 and 2016 IR data files for the sub-category 3 details.
** Phase II of TMDL in Progress.
***Impairment temporary: site specific TDS criterion should apply until WQS change. 39 of 49
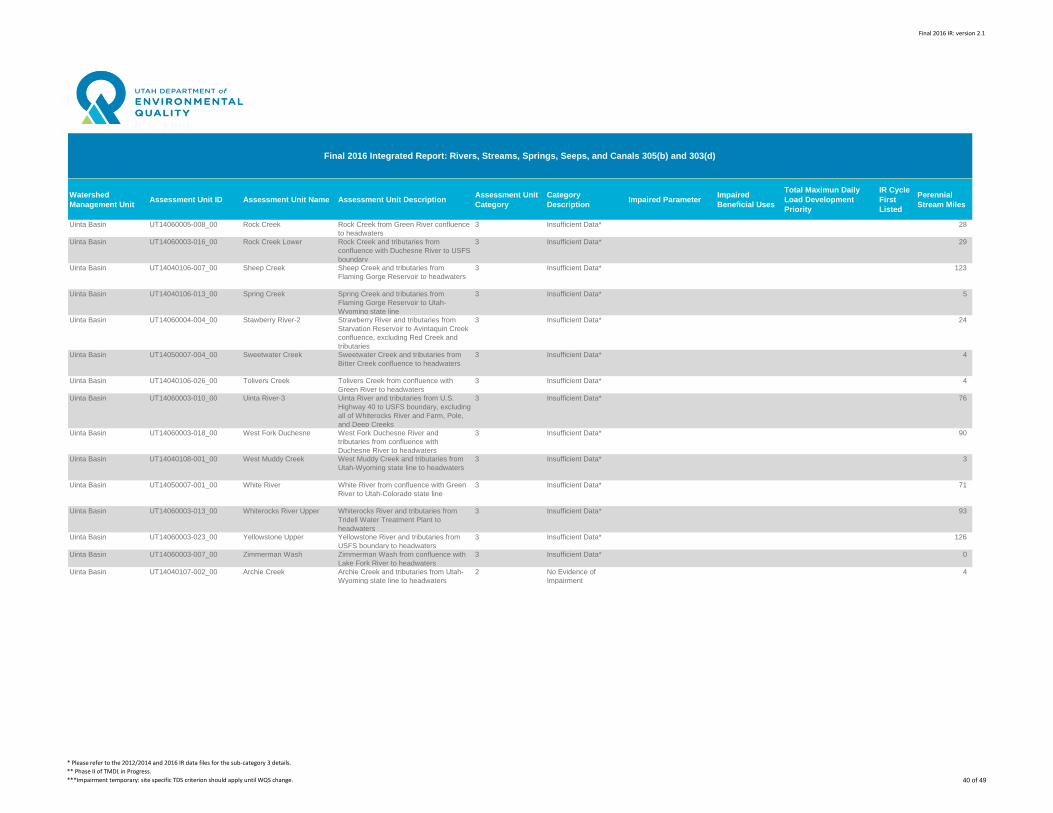
Final 2016 IR: version 2.1
Watershed
Management UnitAssessment Unit ID Assessment Unit Name Assessment Unit Description
Assessment Unit
Category
Category
DescriptionImpaired Parameter
Impaired
Beneficial Uses
Total Maximun Daily
Load Development
Priority
IR Cycle
First
Listed
Perennial
Stream Miles
Final 2016 Integrated Report: Rivers, Streams, Springs, Seeps, and Canals 305(b) and 303(d)
Uinta Basin UT14060005-008_00 Rock Creek Rock Creek from Green River confluence
to headwaters
3 Insufficient Data* 28
Uinta Basin UT14060003-016_00 Rock Creek Lower Rock Creek and tributaries from
confluence with Duchesne River to USFS
boundary
3 Insufficient Data* 29
Uinta Basin UT14040106-007_00 Sheep Creek Sheep Creek and tributaries from
Flaming Gorge Reservoir to headwaters
3 Insufficient Data* 123
Uinta Basin UT14040106-013_00 Spring Creek Spring Creek and tributaries from
Flaming Gorge Reservoir to Utah-
Wyoming state line
3 Insufficient Data* 5
Uinta Basin UT14060004-004_00 Stawberry River-2 Strawberry River and tributaries from
Starvation Reservoir to Avintaquin Creek
confluence, excluding Red Creek and
tributaries
3 Insufficient Data* 24
Uinta Basin UT14050007-004_00 Sweetwater Creek Sweetwater Creek and tributaries from
Bitter Creek confluence to headwaters
3 Insufficient Data* 4
Uinta Basin UT14040106-026_00 Tolivers Creek Tolivers Creek from confluence with
Green River to headwaters
3 Insufficient Data* 4
Uinta Basin UT14060003-010_00 Uinta River-3 Uinta River and tributaries from U.S.
Highway 40 to USFS boundary, excluding
all of Whiterocks River and Farm, Pole,
and Deep Creeks
3 Insufficient Data* 76
Uinta Basin UT14060003-018_00 West Fork Duchesne West Fork Duchesne River and
tributaries from confluence with
Duchesne River to headwaters
3 Insufficient Data* 90
Uinta Basin UT14040108-001_00 West Muddy Creek West Muddy Creek and tributaries from
Utah-Wyoming state line to headwaters
3 Insufficient Data* 3
Uinta Basin UT14050007-001_00 White River White River from confluence with Green
River to Utah-Colorado state line
3 Insufficient Data* 71
Uinta Basin UT14060003-013_00 Whiterocks River Upper Whiterocks River and tributaries from
Tridell Water Treatment Plant to
headwaters
3 Insufficient Data* 93
Uinta Basin UT14060003-023_00 Yellowstone Upper Yellowstone River and tributaries from
USFS boundary to headwaters
3 Insufficient Data* 126
Uinta Basin UT14060003-007_00 Zimmerman Wash Zimmerman Wash from confluence with
Lake Fork River to headwaters
3 Insufficient Data* 0
Uinta Basin UT14040107-002_00 Archie Creek Archie Creek and tributaries from Utah-
Wyoming state line to headwaters
2 No Evidence of
Impairment
4
* Please refer to the 2012/2014 and 2016 IR data files for the sub-category 3 details.
** Phase II of TMDL in Progress.
***Impairment temporary: site specific TDS criterion should apply until WQS change. 40 of 49
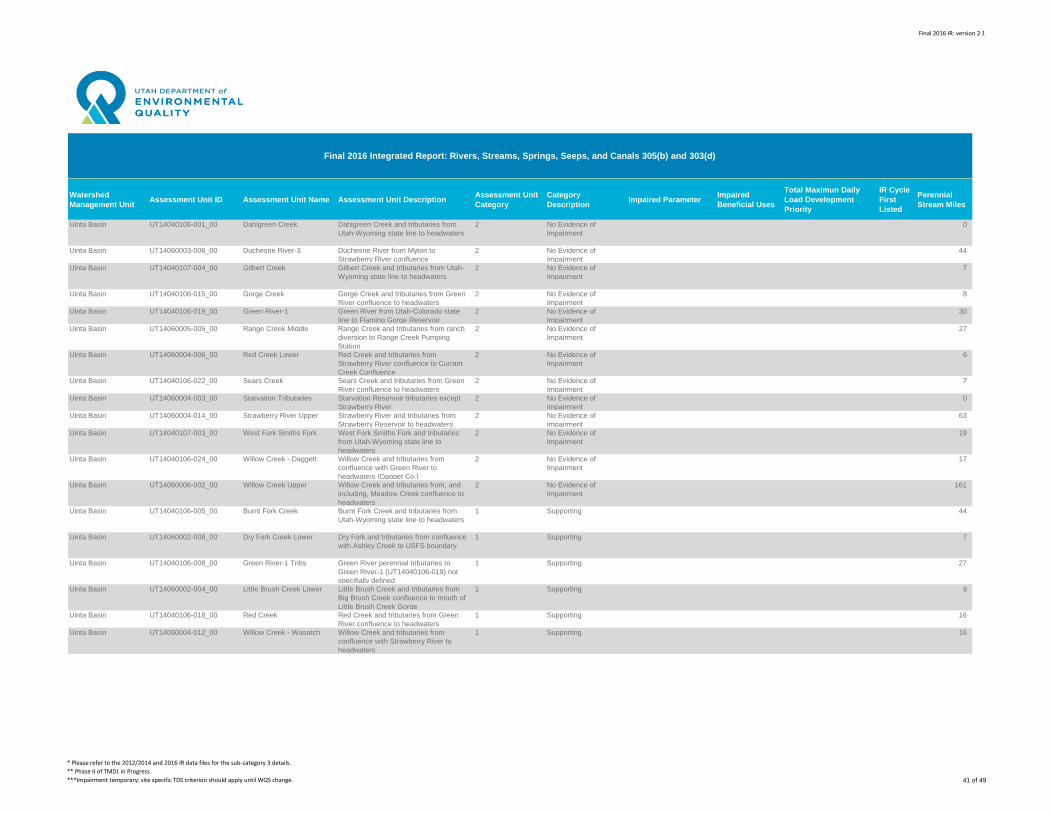
Final 2016 IR: version 2.1
Watershed
Management UnitAssessment Unit ID Assessment Unit Name Assessment Unit Description
Assessment Unit
Category
Category
DescriptionImpaired Parameter
Impaired
Beneficial Uses
Total Maximun Daily
Load Development
Priority
IR Cycle
First
Listed
Perennial
Stream Miles
Final 2016 Integrated Report: Rivers, Streams, Springs, Seeps, and Canals 305(b) and 303(d)
Uinta Basin UT14040106-001_00 Dahlgreen Creek Dahlgreen Creek and tributaries from
Utah-Wyoming state line to headwaters
2 No Evidence of
Impairment
0
Uinta Basin UT14060003-006_00 Duchesne River-3 Duchesne River from Myton to
Strawberry River confluence
2 No Evidence of
Impairment
44
Uinta Basin UT14040107-004_00 Gilbert Creek Gilbert Creek and tributaries from Utah-
Wyoming state line to headwaters
2 No Evidence of
Impairment
7
Uinta Basin UT14040106-015_00 Gorge Creek Gorge Creek and tributaries from Green
River confluence to headwaters
2 No Evidence of
Impairment
8
Uinta Basin UT14040106-019_00 Green River-1 Green River from Utah-Colorado state
line to Flaming Gorge Reservoir
2 No Evidence of
Impairment
30
Uinta Basin UT14060005-005_00 Range Creek Middle Range Creek and tributaries from ranch
diversion to Range Creek Pumping
Station
2 No Evidence of
Impairment
27
Uinta Basin UT14060004-006_00 Red Creek Lower Red Creek and tributaries from
Strawberry River confluence to Currant
Creek Confluence
2 No Evidence of
Impairment
6
Uinta Basin UT14040106-022_00 Sears Creek Sears Creek and tributaries from Green
River confluence to headwaters
2 No Evidence of
Impairment
7
Uinta Basin UT14060004-003_00 Starvation Tributaries Starvation Reservoir tributaries except
Strawberry River
2 No Evidence of
Impairment
0
Uinta Basin UT14060004-014_00 Strawberry River Upper Strawberry River and tributaries from
Strawberry Reservoir to headwaters
2 No Evidence of
Impairment
63
Uinta Basin UT14040107-003_00 West Fork Smiths Fork West Fork Smiths Fork and tributaries
from Utah-Wyoming state line to
headwaters
2 No Evidence of
Impairment
19
Uinta Basin UT14040106-024_00 Willow Creek - Daggett Willow Creek and tributaries from
confluence with Green River to
headwaters (Dagget Co.)
2 No Evidence of
Impairment
17
Uinta Basin UT14060006-002_00 Willow Creek Upper Willow Creek and tributaries from, and
including, Meadow Creek confluence to
headwaters
2 No Evidence of
Impairment
161
Uinta Basin UT14040106-005_00 Burnt Fork Creek Burnt Fork Creek and tributaries from
Utah-Wyoming state line to headwaters
1 Supporting 44
Uinta Basin UT14060002-008_00 Dry Fork Creek Lower Dry Fork and tributaries from confluence
with Ashley Creek to USFS boundary
1 Supporting 7
Uinta Basin UT14040106-008_00 Green River-1 Tribs Green River perennial tributaries to
Green River-1 (UT14040106-019) not
specifially defined
1 Supporting 27
Uinta Basin UT14060002-004_00 Little Brush Creek Lower Little Brush Creek and tributaries from
Big Brush Creek confluence to mouth of
Little Brush Creek Gorge
1 Supporting 8
Uinta Basin UT14040106-018_00 Red Creek Red Creek and tributaries from Green
River confluence to headwaters
1 Supporting 16
Uinta Basin UT14060004-012_00 Willow Creek - Wasatch Willow Creek and tributaries from
confluence with Strawberry River to
headwaters
1 Supporting 16
* Please refer to the 2012/2014 and 2016 IR data files for the sub-category 3 details.
** Phase II of TMDL in Progress.
***Impairment temporary: site specific TDS criterion should apply until WQS change. 41 of 49
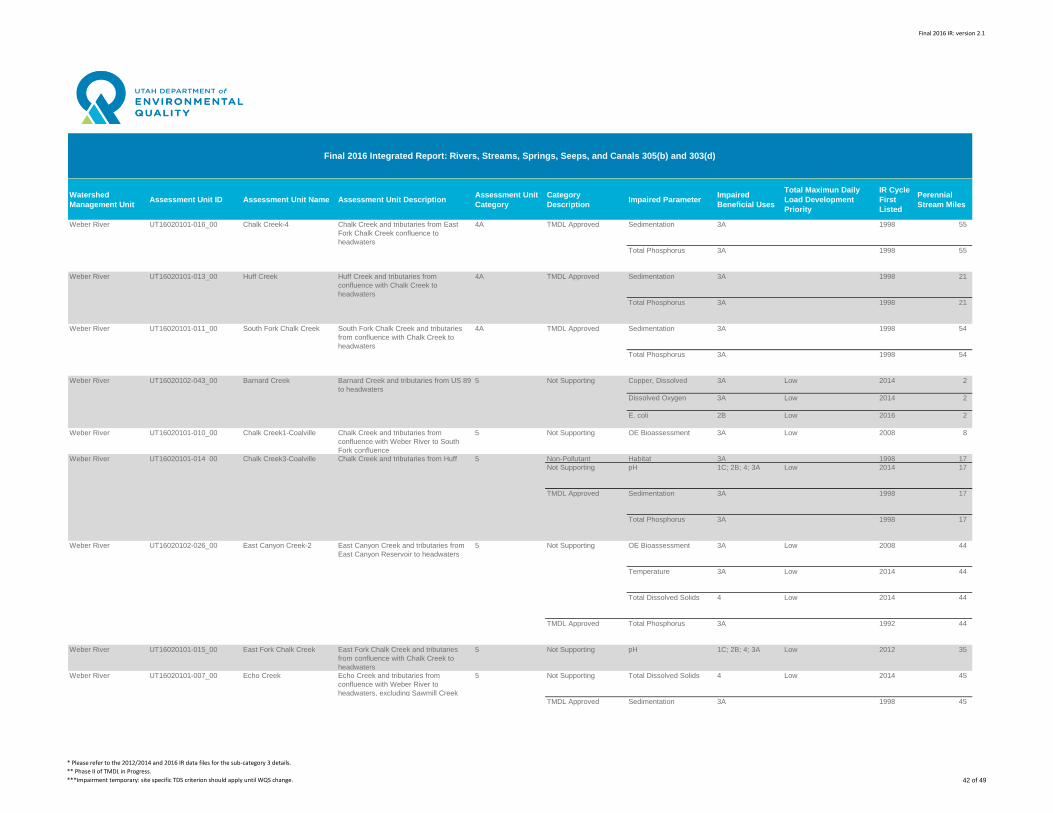
Final 2016 IR: version 2.1
Watershed
Management UnitAssessment Unit ID Assessment Unit Name Assessment Unit Description
Assessment Unit
Category
Category
DescriptionImpaired Parameter
Impaired
Beneficial Uses
Total Maximun Daily
Load Development
Priority
IR Cycle
First
Listed
Perennial
Stream Miles
Final 2016 Integrated Report: Rivers, Streams, Springs, Seeps, and Canals 305(b) and 303(d)
Weber River UT16020101-016_00 Chalk Creek-4 Chalk Creek and tributaries from East
Fork Chalk Creek confluence to
headwaters
4A TMDL Approved Sedimentation 3A 1998 55
Total Phosphorus 3A 1998 55
Weber River UT16020101-013_00 Huff Creek Huff Creek and tributaries from
confluence with Chalk Creek to
headwaters
4A TMDL Approved Sedimentation 3A 1998 21
Total Phosphorus 3A 1998 21
Weber River UT16020101-011_00 South Fork Chalk Creek South Fork Chalk Creek and tributaries
from confluence with Chalk Creek to
headwaters
4A TMDL Approved Sedimentation 3A 1998 54
Total Phosphorus 3A 1998 54
Weber River UT16020102-043_00 Barnard Creek Barnard Creek and tributaries from US 89
to headwaters
5 Not Supporting Copper, Dissolved 3A Low 2014 2
Dissolved Oxygen 3A Low 2014 2
E. coli 2B Low 2016 2
Weber River UT16020101-010_00 Chalk Creek1-Coalville Chalk Creek and tributaries from
confluence with Weber River to South
Fork confluence
5 Not Supporting OE Bioassessment 3A Low 2008 8
Weber River UT16020101-014_00 Chalk Creek3-Coalville Chalk Creek and tributaries from Huff 5 Non-Pollutant Habitat 3A 1998 17
Not Supporting pH 1C; 2B; 4; 3A Low 2014 17
TMDL Approved Sedimentation 3A 1998 17
Total Phosphorus 3A 1998 17
Weber River UT16020102-026_00 East Canyon Creek-2 East Canyon Creek and tributaries from
East Canyon Reservoir to headwaters
5 Not Supporting OE Bioassessment 3A Low 2008 44
Temperature 3A Low 2014 44
Total Dissolved Solids 4 Low 2014 44
TMDL Approved Total Phosphorus 3A 1992 44
Weber River UT16020101-015_00 East Fork Chalk Creek East Fork Chalk Creek and tributaries
from confluence with Chalk Creek to
headwaters
5 Not Supporting pH 1C; 2B; 4; 3A Low 2012 35
Weber River UT16020101-007_00 Echo Creek Echo Creek and tributaries from
confluence with Weber River to
headwaters, excluding Sawmill Creek
5 Not Supporting Total Dissolved Solids 4 Low 2014 45
TMDL Approved Sedimentation 3A 1998 45
* Please refer to the 2012/2014 and 2016 IR data files for the sub-category 3 details.
** Phase II of TMDL in Progress.
***Impairment temporary: site specific TDS criterion should apply until WQS change. 42 of 49
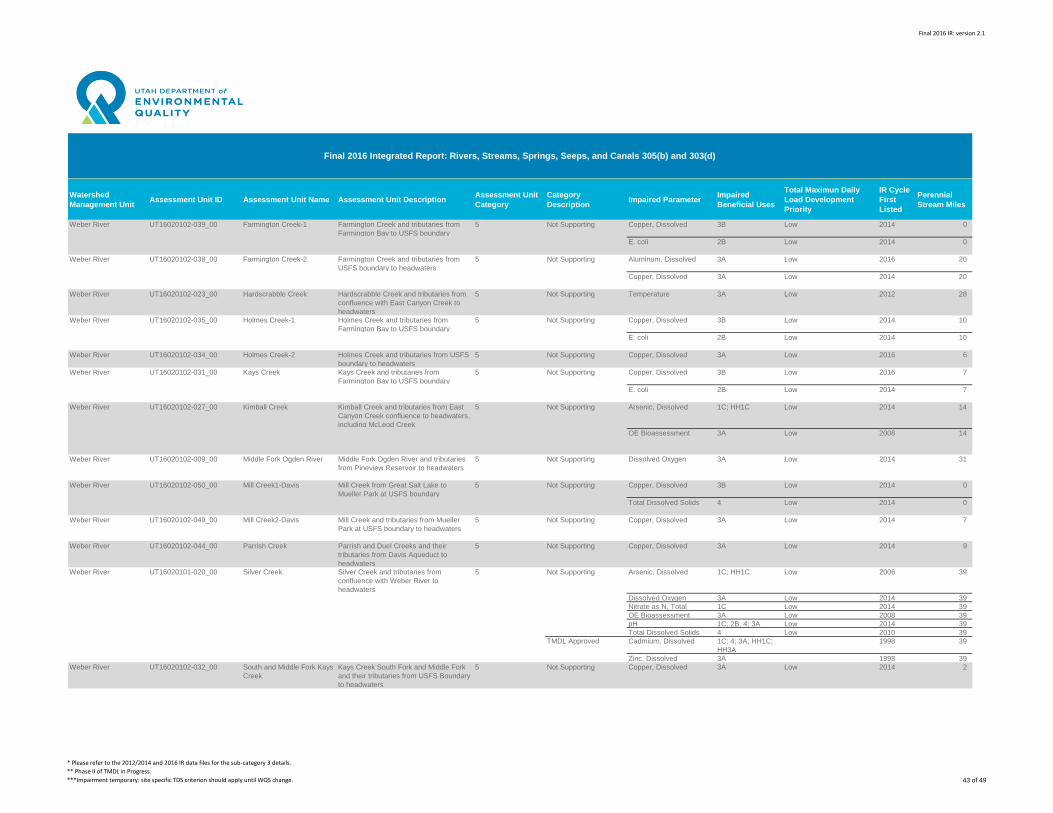
Final 2016 IR: version 2.1
Watershed
Management UnitAssessment Unit ID Assessment Unit Name Assessment Unit Description
Assessment Unit
Category
Category
DescriptionImpaired Parameter
Impaired
Beneficial Uses
Total Maximun Daily
Load Development
Priority
IR Cycle
First
Listed
Perennial
Stream Miles
Final 2016 Integrated Report: Rivers, Streams, Springs, Seeps, and Canals 305(b) and 303(d)
Weber River UT16020102-039_00 Farmington Creek-1 Farmington Creek and tributaries from
Farmington Bay to USFS boundary
5 Not Supporting Copper, Dissolved 3B Low 2014 0
E. coli 2B Low 2014 0
Weber River UT16020102-038_00 Farmington Creek-2 Farmington Creek and tributaries from
USFS boundary to headwaters
5 Not Supporting Aluminum, Dissolved 3A Low 2016 20
Copper, Dissolved 3A Low 2014 20
Weber River UT16020102-023_00 Hardscrabble Creek Hardscrabble Creek and tributaries from
confluence with East Canyon Creek to
headwaters
5 Not Supporting Temperature 3A Low 2012 28
Weber River UT16020102-035_00 Holmes Creek-1 Holmes Creek and tributaries from
Farmington Bay to USFS boundary
5 Not Supporting Copper, Dissolved 3B Low 2014 10
E. coli 2B Low 2014 10
Weber River UT16020102-034_00 Holmes Creek-2 Holmes Creek and tributaries from USFS
boundary to headwaters
5 Not Supporting Copper, Dissolved 3A Low 2016 6
Weber River UT16020102-031_00 Kays Creek Kays Creek and tributaries from
Farmington Bay to USFS boundary
5 Not Supporting Copper, Dissolved 3B Low 2016 7
E. coli 2B Low 2014 7
Weber River UT16020102-027_00 Kimball Creek Kimball Creek and tributaries from East
Canyon Creek confluence to headwaters,
including McLeod Creek
5 Not Supporting Arsenic, Dissolved 1C; HH1C Low 2014 14
OE Bioassessment 3A Low 2008 14
Weber River UT16020102-009_00 Middle Fork Ogden River Middle Fork Ogden River and tributaries
from Pineview Reservoir to headwaters
5 Not Supporting Dissolved Oxygen 3A Low 2014 31
Weber River UT16020102-050_00 Mill Creek1-Davis Mill Creek from Great Salt Lake to
Mueller Park at USFS boundary
5 Not Supporting Copper, Dissolved 3B Low 2014 0
Total Dissolved Solids 4 Low 2014 0
Weber River UT16020102-049_00 Mill Creek2-Davis Mill Creek and tributaries from Mueller
Park at USFS boundary to headwaters
5 Not Supporting Copper, Dissolved 3A Low 2014 7
Weber River UT16020102-044_00 Parrish Creek Parrish and Duel Creeks and their
tributaries from Davis Aqueduct to
headwaters
5 Not Supporting Copper, Dissolved 3A Low 2014 9
Weber River UT16020101-020_00 Silver Creek Silver Creek and tributaries from
confluence with Weber River to
headwaters
5 Not Supporting Arsenic, Dissolved 1C; HH1C Low 2006 39
Dissolved Oxygen 3A Low 2014 39
Nitrate as N, Total 1C Low 2014 39
OE Bioassessment 3A Low 2008 39
pH 1C; 2B; 4; 3A Low 2014 39
Total Dissolved Solids 4 Low 2010 39
TMDL Approved Cadmium, Dissolved 1C; 4; 3A; HH1C;
HH3A
1998 39
Zinc, Dissolved 3A 1998 39
Weber River UT16020102-032_00 South and Middle Fork Kays
Creek
Kays Creek South Fork and Middle Fork
and their tributaries from USFS Boundary
to headwaters
5 Not Supporting Copper, Dissolved 3A Low 2014 2
* Please refer to the 2012/2014 and 2016 IR data files for the sub-category 3 details.
** Phase II of TMDL in Progress.
***Impairment temporary: site specific TDS criterion should apply until WQS change. 43 of 49
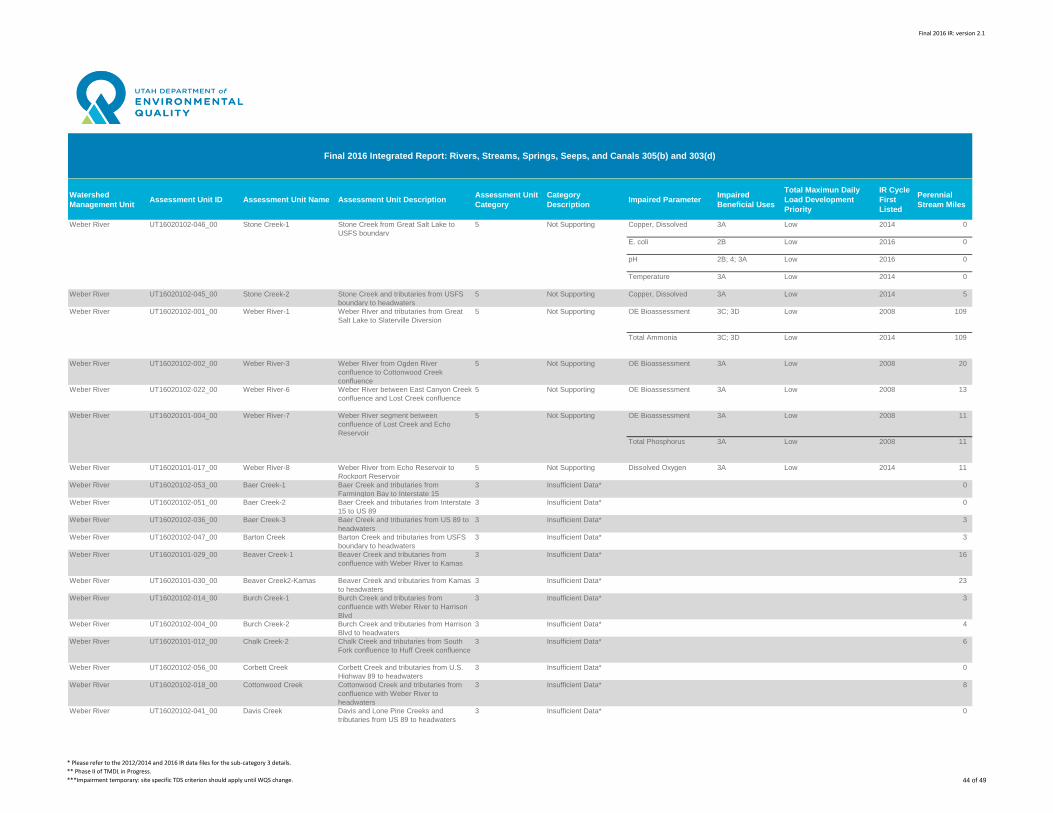
Final 2016 IR: version 2.1
Watershed
Management UnitAssessment Unit ID Assessment Unit Name Assessment Unit Description
Assessment Unit
Category
Category
DescriptionImpaired Parameter
Impaired
Beneficial Uses
Total Maximun Daily
Load Development
Priority
IR Cycle
First
Listed
Perennial
Stream Miles
Final 2016 Integrated Report: Rivers, Streams, Springs, Seeps, and Canals 305(b) and 303(d)
Weber River UT16020102-046_00 Stone Creek-1 Stone Creek from Great Salt Lake to
USFS boundary
5 Not Supporting Copper, Dissolved 3A Low 2014 0
E. coli 2B Low 2016 0
pH 2B; 4; 3A Low 2016 0
Temperature 3A Low 2014 0
Weber River UT16020102-045_00 Stone Creek-2 Stone Creek and tributaries from USFS
boundary to headwaters
5 Not Supporting Copper, Dissolved 3A Low 2014 5
Weber River UT16020102-001_00 Weber River-1 Weber River and tributaries from Great
Salt Lake to Slaterville Diversion
5 Not Supporting OE Bioassessment 3C; 3D Low 2008 109
Total Ammonia 3C; 3D Low 2014 109
Weber River UT16020102-002_00 Weber River-3 Weber River from Ogden River
confluence to Cottonwood Creek
confluence
5 Not Supporting OE Bioassessment 3A Low 2008 20
Weber River UT16020102-022_00 Weber River-6 Weber River between East Canyon Creek
confluence and Lost Creek confluence
5 Not Supporting OE Bioassessment 3A Low 2008 13
Weber River UT16020101-004_00 Weber River-7 Weber River segment between
confluence of Lost Creek and Echo
Reservoir
5 Not Supporting OE Bioassessment 3A Low 2008 11
Total Phosphorus 3A Low 2008 11
Weber River UT16020101-017_00 Weber River-8 Weber River from Echo Reservoir to
Rockport Reservoir
5 Not Supporting Dissolved Oxygen 3A Low 2014 11
Weber River UT16020102-053_00 Baer Creek-1 Baer Creek and tributaries from
Farmington Bay to Interstate 15
3 Insufficient Data* 0
Weber River UT16020102-051_00 Baer Creek-2 Baer Creek and tributaries from Interstate
15 to US 89
3 Insufficient Data* 0
Weber River UT16020102-036_00 Baer Creek-3 Baer Creek and tributaries from US 89 to
headwaters
3 Insufficient Data* 3
Weber River UT16020102-047_00 Barton Creek Barton Creek and tributaries from USFS
boundary to headwaters
3 Insufficient Data* 3
Weber River UT16020101-029_00 Beaver Creek-1 Beaver Creek and tributaries from
confluence with Weber River to Kamas
3 Insufficient Data* 16
Weber River UT16020101-030_00 Beaver Creek2-Kamas Beaver Creek and tributaries from Kamas
to headwaters
3 Insufficient Data* 23
Weber River UT16020102-014_00 Burch Creek-1 Burch Creek and tributaries from
confluence with Weber River to Harrison
Blvd
3 Insufficient Data* 3
Weber River UT16020102-004_00 Burch Creek-2 Burch Creek and tributaries from Harrison
Blvd to headwaters
3 Insufficient Data* 4
Weber River UT16020101-012_00 Chalk Creek-2 Chalk Creek and tributaries from South
Fork confluence to Huff Creek confluence
3 Insufficient Data* 6
Weber River UT16020102-056_00 Corbett Creek Corbett Creek and tributaries from U.S.
Highway 89 to headwaters
3 Insufficient Data* 0
Weber River UT16020102-018_00 Cottonwood Creek Cottonwood Creek and tributaries from
confluence with Weber River to
headwaters
3 Insufficient Data* 8
Weber River UT16020102-041_00 Davis Creek Davis and Lone Pine Creeks and
tributaries from US 89 to headwaters
3 Insufficient Data* 0
* Please refer to the 2012/2014 and 2016 IR data files for the sub-category 3 details.
** Phase II of TMDL in Progress.
***Impairment temporary: site specific TDS criterion should apply until WQS change. 44 of 49
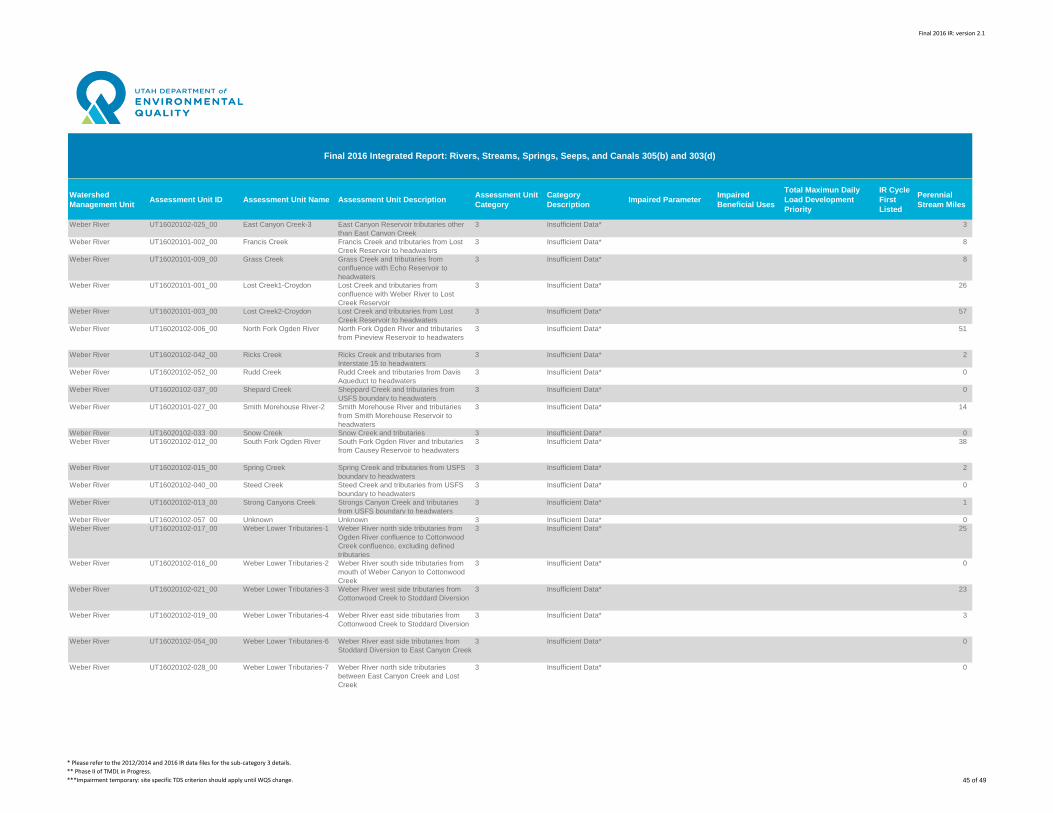
Final 2016 IR: version 2.1
Watershed
Management UnitAssessment Unit ID Assessment Unit Name Assessment Unit Description
Assessment Unit
Category
Category
DescriptionImpaired Parameter
Impaired
Beneficial Uses
Total Maximun Daily
Load Development
Priority
IR Cycle
First
Listed
Perennial
Stream Miles
Final 2016 Integrated Report: Rivers, Streams, Springs, Seeps, and Canals 305(b) and 303(d)
Weber River UT16020102-025_00 East Canyon Creek-3 East Canyon Reservoir tributaries other
than East Canyon Creek
3 Insufficient Data* 3
Weber River UT16020101-002_00 Francis Creek Francis Creek and tributaries from Lost
Creek Reservoir to headwaters
3 Insufficient Data* 8
Weber River UT16020101-009_00 Grass Creek Grass Creek and tributaries from
confluence with Echo Reservoir to
headwaters
3 Insufficient Data* 8
Weber River UT16020101-001_00 Lost Creek1-Croydon Lost Creek and tributaries from
confluence with Weber River to Lost
Creek Reservoir
3 Insufficient Data* 26
Weber River UT16020101-003_00 Lost Creek2-Croydon Lost Creek and tributaries from Lost
Creek Reservoir to headwaters
3 Insufficient Data* 57
Weber River UT16020102-006_00 North Fork Ogden River North Fork Ogden River and tributaries
from Pineview Reservoir to headwaters
3 Insufficient Data* 51
Weber River UT16020102-042_00 Ricks Creek Ricks Creek and tributaries from
Interstate 15 to headwaters
3 Insufficient Data* 2
Weber River UT16020102-052_00 Rudd Creek Rudd Creek and tributaries from Davis
Aqueduct to headwaters
3 Insufficient Data* 0
Weber River UT16020102-037_00 Shepard Creek Sheppard Creek and tributaries from
USFS boundary to headwaters
3 Insufficient Data* 0
Weber River UT16020101-027_00 Smith Morehouse River-2 Smith Morehouse River and tributaries
from Smith Morehouse Reservoir to
headwaters
3 Insufficient Data* 14
Weber River UT16020102-033_00 Snow Creek Snow Creek and tributaries 3 Insufficient Data* 0
Weber River UT16020102-012_00 South Fork Ogden River South Fork Ogden River and tributaries
from Causey Reservoir to headwaters
3 Insufficient Data* 38
Weber River UT16020102-015_00 Spring Creek Spring Creek and tributaries from USFS
boundary to headwaters
3 Insufficient Data* 2
Weber River UT16020102-040_00 Steed Creek Steed Creek and tributaries from USFS
boundary to headwaters
3 Insufficient Data* 0
Weber River UT16020102-013_00 Strong Canyons Creek Strongs Canyon Creek and tributaries
from USFS boundary to headwaters
3 Insufficient Data* 1
Weber River UT16020102-057_00 Unknown Unknown 3 Insufficient Data* 0
Weber River UT16020102-017_00 Weber Lower Tributaries-1 Weber River north side tributaries from
Ogden River confluence to Cottonwood
Creek confluence, excluding defined
tributaries
3 Insufficient Data* 25
Weber River UT16020102-016_00 Weber Lower Tributaries-2 Weber River south side tributaries from
mouth of Weber Canyon to Cottonwood
Creek
3 Insufficient Data* 0
Weber River UT16020102-021_00 Weber Lower Tributaries-3 Weber River west side tributaries from
Cottonwood Creek to Stoddard Diversion
3 Insufficient Data* 23
Weber River UT16020102-019_00 Weber Lower Tributaries-4 Weber River east side tributaries from
Cottonwood Creek to Stoddard Diversion
3 Insufficient Data* 3
Weber River UT16020102-054_00 Weber Lower Tributaries-6 Weber River east side tributaries from
Stoddard Diversion to East Canyon Creek
3 Insufficient Data* 0
Weber River UT16020102-028_00 Weber Lower Tributaries-7 Weber River north side tributaries
between East Canyon Creek and Lost
Creek
3 Insufficient Data* 0
* Please refer to the 2012/2014 and 2016 IR data files for the sub-category 3 details.
** Phase II of TMDL in Progress.
***Impairment temporary: site specific TDS criterion should apply until WQS change. 45 of 49
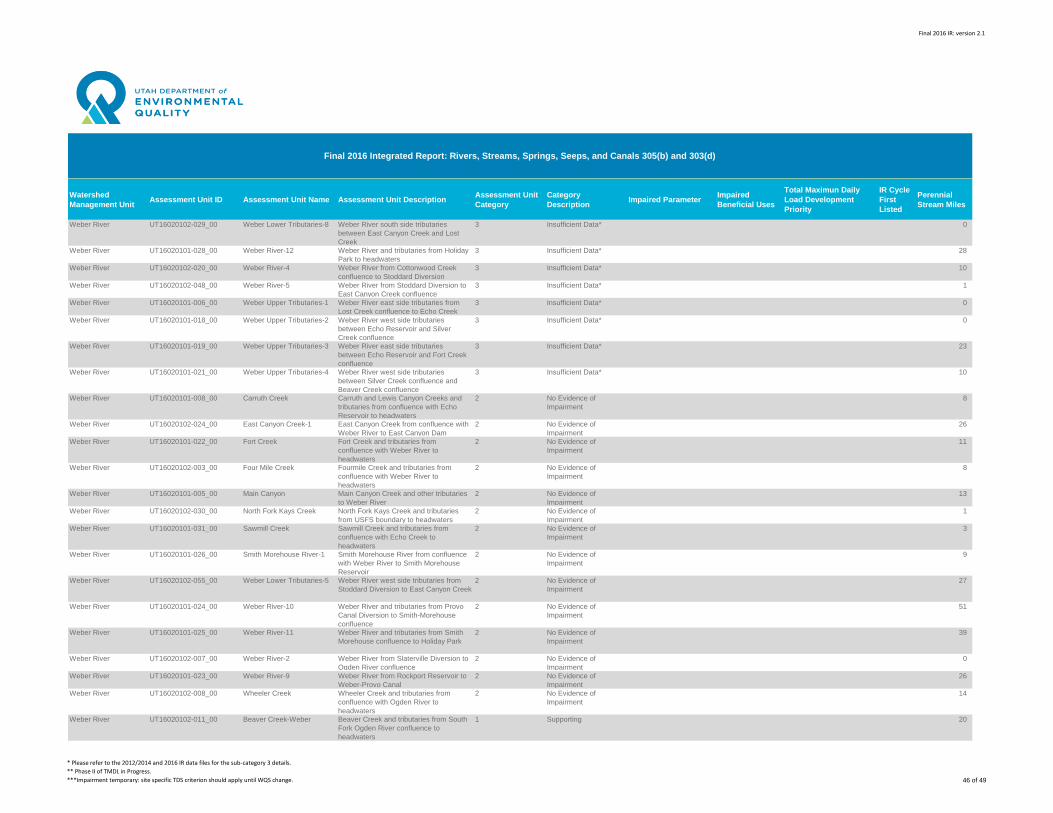
Final 2016 IR: version 2.1
Watershed
Management UnitAssessment Unit ID Assessment Unit Name Assessment Unit Description
Assessment Unit
Category
Category
DescriptionImpaired Parameter
Impaired
Beneficial Uses
Total Maximun Daily
Load Development
Priority
IR Cycle
First
Listed
Perennial
Stream Miles
Final 2016 Integrated Report: Rivers, Streams, Springs, Seeps, and Canals 305(b) and 303(d)
Weber River UT16020102-029_00 Weber Lower Tributaries-8 Weber River south side tributaries
between East Canyon Creek and Lost
Creek
3 Insufficient Data* 0
Weber River UT16020101-028_00 Weber River-12 Weber River and tributaries from Holiday
Park to headwaters
3 Insufficient Data* 28
Weber River UT16020102-020_00 Weber River-4 Weber River from Cottonwood Creek
confluence to Stoddard Diversion
3 Insufficient Data* 10
Weber River UT16020102-048_00 Weber River-5 Weber River from Stoddard Diversion to
East Canyon Creek confluence
3 Insufficient Data* 1
Weber River UT16020101-006_00 Weber Upper Tributaries-1 Weber River east side tributaries from
Lost Creek confluence to Echo Creek
3 Insufficient Data* 0
Weber River UT16020101-018_00 Weber Upper Tributaries-2 Weber River west side tributaries
between Echo Reservoir and Silver
Creek confluence
3 Insufficient Data* 0
Weber River UT16020101-019_00 Weber Upper Tributaries-3 Weber River east side tributaries
between Echo Reservoir and Fort Creek
confluence
3 Insufficient Data* 23
Weber River UT16020101-021_00 Weber Upper Tributaries-4 Weber River west side tributaries
between Silver Creek confluence and
Beaver Creek confluence
3 Insufficient Data* 10
Weber River UT16020101-008_00 Carruth Creek Carruth and Lewis Canyon Creeks and
tributaries from confluence with Echo
Reservoir to headwaters
2 No Evidence of
Impairment
8
Weber River UT16020102-024_00 East Canyon Creek-1 East Canyon Creek from confluence with
Weber River to East Canyon Dam
2 No Evidence of
Impairment
26
Weber River UT16020101-022_00 Fort Creek Fort Creek and tributaries from
confluence with Weber River to
headwaters
2 No Evidence of
Impairment
11
Weber River UT16020102-003_00 Four Mile Creek Fourmile Creek and tributaries from
confluence with Weber River to
headwaters
2 No Evidence of
Impairment
8
Weber River UT16020101-005_00 Main Canyon Main Canyon Creek and other tributaries
to Weber River
2 No Evidence of
Impairment
13
Weber River UT16020102-030_00 North Fork Kays Creek North Fork Kays Creek and tributaries
from USFS boundary to headwaters
2 No Evidence of
Impairment
1
Weber River UT16020101-031_00 Sawmill Creek Sawmill Creek and tributaries from
confluence with Echo Creek to
headwaters
2 No Evidence of
Impairment
3
Weber River UT16020101-026_00 Smith Morehouse River-1 Smith Morehouse River from confluence
with Weber River to Smith Morehouse
Reservoir
2 No Evidence of
Impairment
9
Weber River UT16020102-055_00 Weber Lower Tributaries-5 Weber River west side tributaries from
Stoddard Diversion to East Canyon Creek
2 No Evidence of
Impairment
27
Weber River UT16020101-024_00 Weber River-10 Weber River and tributaries from Provo
Canal Diversion to Smith-Morehouse
confluence
2 No Evidence of
Impairment
51
Weber River UT16020101-025_00 Weber River-11 Weber River and tributaries from Smith
Morehouse confluence to Holiday Park
2 No Evidence of
Impairment
39
Weber River UT16020102-007_00 Weber River-2 Weber River from Slaterville Diversion to
Ogden River confluence
2 No Evidence of
Impairment
0
Weber River UT16020101-023_00 Weber River-9 Weber River from Rockport Reservoir to
Weber-Provo Canal
2 No Evidence of
Impairment
26
Weber River UT16020102-008_00 Wheeler Creek Wheeler Creek and tributaries from
confluence with Ogden River to
headwaters
2 No Evidence of
Impairment
14
Weber River UT16020102-011_00 Beaver Creek-Weber Beaver Creek and tributaries from South
Fork Ogden River confluence to
headwaters
1 Supporting 20
* Please refer to the 2012/2014 and 2016 IR data files for the sub-category 3 details.
** Phase II of TMDL in Progress.
***Impairment temporary: site specific TDS criterion should apply until WQS change. 46 of 49
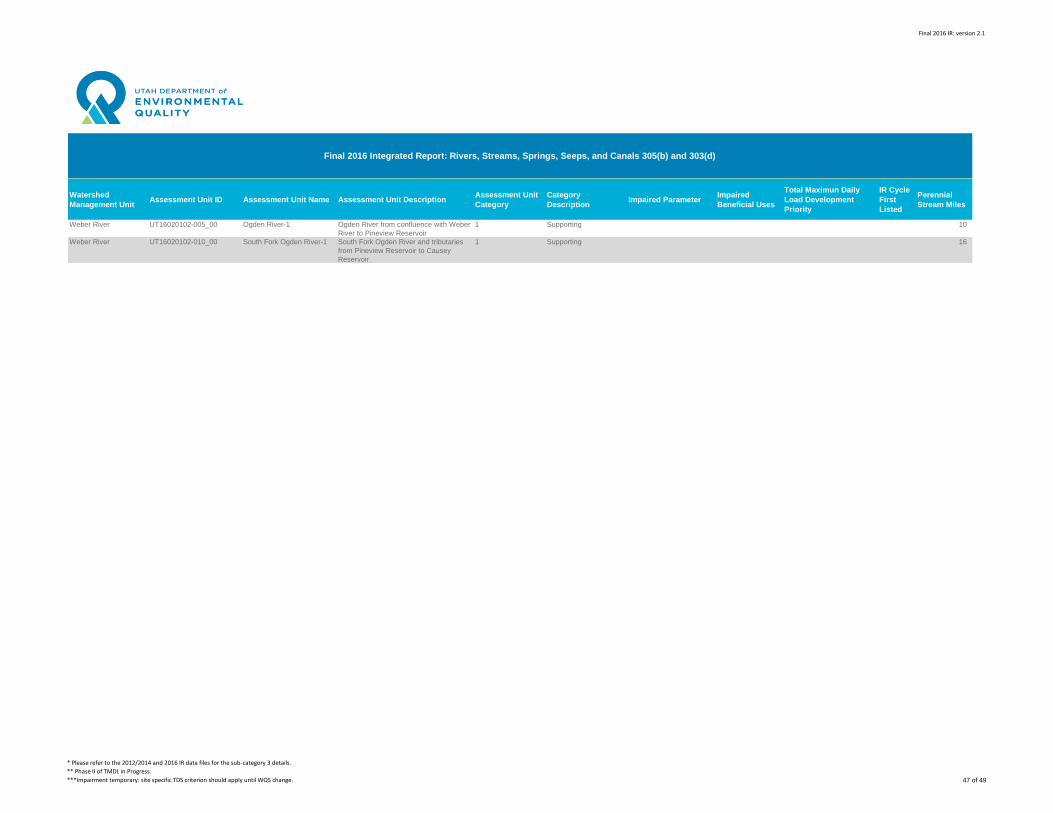
Final 2016 IR: version 2.1
Watershed
Management UnitAssessment Unit ID Assessment Unit Name Assessment Unit Description
Assessment Unit
Category
Category
DescriptionImpaired Parameter
Impaired
Beneficial Uses
Total Maximun Daily
Load Development
Priority
IR Cycle
First
Listed
Perennial
Stream Miles
Final 2016 Integrated Report: Rivers, Streams, Springs, Seeps, and Canals 305(b) and 303(d)
Weber River UT16020102-005_00 Ogden River-1 Ogden River from confluence with Weber
River to Pineview Reservoir
1 Supporting 10
Weber River UT16020102-010_00 South Fork Ogden River-1 South Fork Ogden River and tributaries
from Pineview Reservoir to Causey
Reservoir
1 Supporting 16
* Please refer to the 2012/2014 and 2016 IR data files for the sub-category 3 details.
** Phase II of TMDL in Progress.
***Impairment temporary: site specific TDS criterion should apply until WQS change. 47 of 49
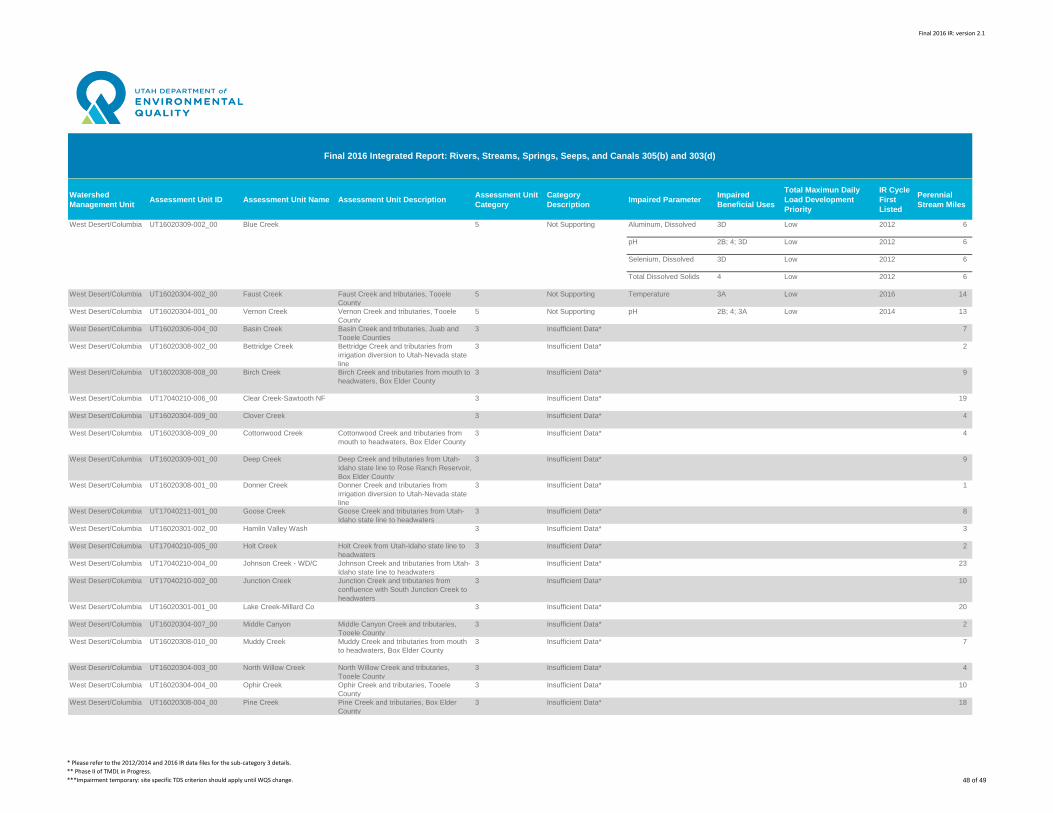
Final 2016 IR: version 2.1
Watershed
Management UnitAssessment Unit ID Assessment Unit Name Assessment Unit Description
Assessment Unit
Category
Category
DescriptionImpaired Parameter
Impaired
Beneficial Uses
Total Maximun Daily
Load Development
Priority
IR Cycle
First
Listed
Perennial
Stream Miles
Final 2016 Integrated Report: Rivers, Streams, Springs, Seeps, and Canals 305(b) and 303(d)
West Desert/Columbia UT16020309-002_00 Blue Creek 5 Not Supporting Aluminum, Dissolved 3D Low 2012 6
pH 2B; 4; 3D Low 2012 6
Selenium, Dissolved 3D Low 2012 6
Total Dissolved Solids 4 Low 2012 6
West Desert/Columbia UT16020304-002_00 Faust Creek Faust Creek and tributaries, Tooele
County
5 Not Supporting Temperature 3A Low 2016 14
West Desert/Columbia UT16020304-001_00 Vernon Creek Vernon Creek and tributaries, Tooele
County
5 Not Supporting pH 2B; 4; 3A Low 2014 13
West Desert/Columbia UT16020306-004_00 Basin Creek Basin Creek and tributaries, Juab and
Tooele Counties
3 Insufficient Data* 7
West Desert/Columbia UT16020308-002_00 Bettridge Creek Bettridge Creek and tributaries from
irrigation diversion to Utah-Nevada state
line
3 Insufficient Data* 2
West Desert/Columbia UT16020308-008_00 Birch Creek Birch Creek and tributaries from mouth to
headwaters, Box Elder County
3 Insufficient Data* 9
West Desert/Columbia UT17040210-006_00 Clear Creek-Sawtooth NF 3 Insufficient Data* 19
West Desert/Columbia UT16020304-009_00 Clover Creek 3 Insufficient Data* 4
West Desert/Columbia UT16020308-009_00 Cottonwood Creek Cottonwood Creek and tributaries from
mouth to headwaters, Box Elder County
3 Insufficient Data* 4
West Desert/Columbia UT16020309-001_00 Deep Creek Deep Creek and tributaries from Utah-
Idaho state line to Rose Ranch Reservoir,
Box Elder County
3 Insufficient Data* 9
West Desert/Columbia UT16020308-001_00 Donner Creek Donner Creek and tributaries from
irrigation diversion to Utah-Nevada state
line
3 Insufficient Data* 1
West Desert/Columbia UT17040211-001_00 Goose Creek Goose Creek and tributaries from Utah-
Idaho state line to headwaters
3 Insufficient Data* 8
West Desert/Columbia UT16020301-002_00 Hamlin Valley Wash 3 Insufficient Data* 3
West Desert/Columbia UT17040210-005_00 Holt Creek Holt Creek from Utah-Idaho state line to
headwaters
3 Insufficient Data* 2
West Desert/Columbia UT17040210-004_00 Johnson Creek - WD/C Johnson Creek and tributaries from Utah-
Idaho state line to headwaters
3 Insufficient Data* 23
West Desert/Columbia UT17040210-002_00 Junction Creek Junction Creek and tributaries from
confluence with South Junction Creek to
headwaters
3 Insufficient Data* 10
West Desert/Columbia UT16020301-001_00 Lake Creek-Millard Co 3 Insufficient Data* 20
West Desert/Columbia UT16020304-007_00 Middle Canyon Middle Canyon Creek and tributaries,
Tooele County
3 Insufficient Data* 2
West Desert/Columbia UT16020308-010_00 Muddy Creek Muddy Creek and tributaries from mouth
to headwaters, Box Elder County
3 Insufficient Data* 7
West Desert/Columbia UT16020304-003_00 North Willow Creek North Willow Creek and tributaries,
Tooele County
3 Insufficient Data* 4
West Desert/Columbia UT16020304-004_00 Ophir Creek Ophir Creek and tributaries, Tooele
County
3 Insufficient Data* 10
West Desert/Columbia UT16020308-004_00 Pine Creek Pine Creek and tributaries, Box Elder
County
3 Insufficient Data* 18
* Please refer to the 2012/2014 and 2016 IR data files for the sub-category 3 details.
** Phase II of TMDL in Progress.
***Impairment temporary: site specific TDS criterion should apply until WQS change. 48 of 49
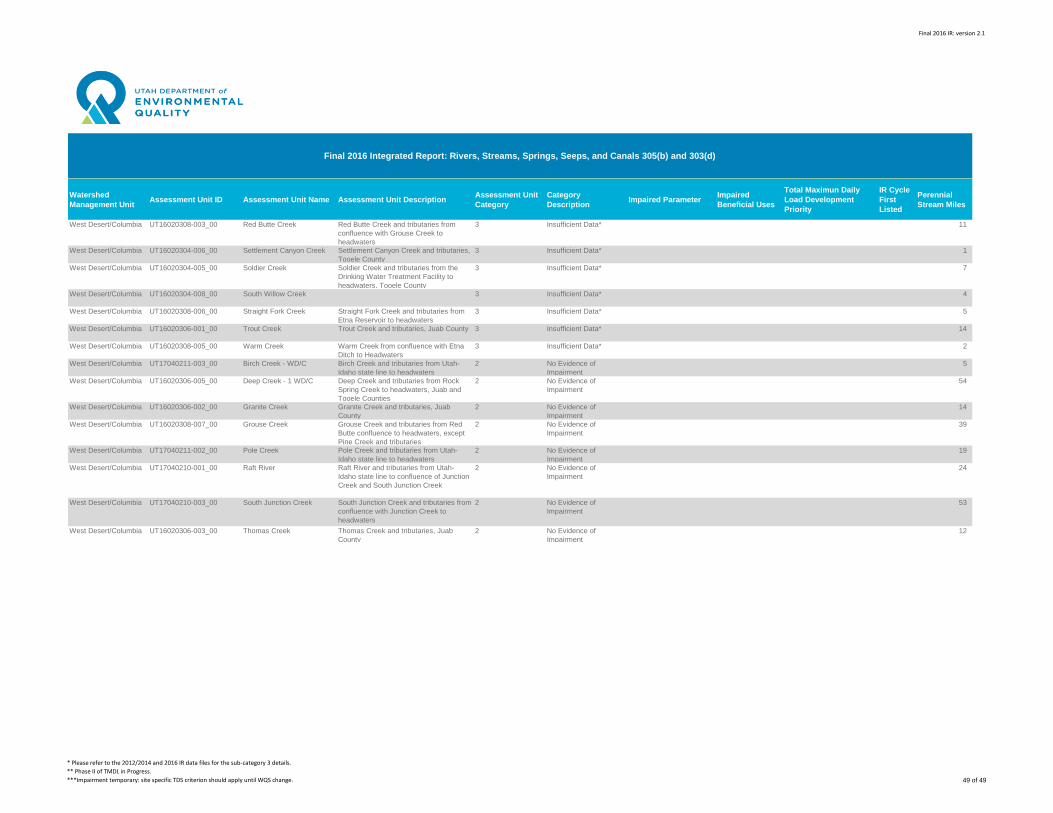
Final 2016 IR: version 2.1
Watershed
Management UnitAssessment Unit ID Assessment Unit Name Assessment Unit Description
Assessment Unit
Category
Category
DescriptionImpaired Parameter
Impaired
Beneficial Uses
Total Maximun Daily
Load Development
Priority
IR Cycle
First
Listed
Perennial
Stream Miles
Final 2016 Integrated Report: Rivers, Streams, Springs, Seeps, and Canals 305(b) and 303(d)
West Desert/Columbia UT16020308-003_00 Red Butte Creek Red Butte Creek and tributaries from
confluence with Grouse Creek to
headwaters
3 Insufficient Data* 11
West Desert/Columbia UT16020304-006_00 Settlement Canyon Creek Settlement Canyon Creek and tributaries,
Tooele County
3 Insufficient Data* 1
West Desert/Columbia UT16020304-005_00 Soldier Creek Soldier Creek and tributaries from the
Drinking Water Treatment Facility to
headwaters, Tooele County
3 Insufficient Data* 7
West Desert/Columbia UT16020304-008_00 South Willow Creek 3 Insufficient Data* 4
West Desert/Columbia UT16020308-006_00 Straight Fork Creek Straight Fork Creek and tributaries from
Etna Reservoir to headwaters
3 Insufficient Data* 5
West Desert/Columbia UT16020306-001_00 Trout Creek Trout Creek and tributaries, Juab County 3 Insufficient Data* 14
West Desert/Columbia UT16020308-005_00 Warm Creek Warm Creek from confluence with Etna
Ditch to Headwaters
3 Insufficient Data* 2
West Desert/Columbia UT17040211-003_00 Birch Creek - WD/C Birch Creek and tributaries from Utah-
Idaho state line to headwaters
2 No Evidence of
Impairment
5
West Desert/Columbia UT16020306-005_00 Deep Creek - 1 WD/C Deep Creek and tributaries from Rock
Spring Creek to headwaters, Juab and
Tooele Counties
2 No Evidence of
Impairment
54
West Desert/Columbia UT16020306-002_00 Granite Creek Granite Creek and tributaries, Juab
County
2 No Evidence of
Impairment
14
West Desert/Columbia UT16020308-007_00 Grouse Creek Grouse Creek and tributaries from Red
Butte confluence to headwaters, except
Pine Creek and tributaries
2 No Evidence of
Impairment
39
West Desert/Columbia UT17040211-002_00 Pole Creek Pole Creek and tributaries from Utah-
Idaho state line to headwaters
2 No Evidence of
Impairment
19
West Desert/Columbia UT17040210-001_00 Raft River Raft River and tributaries from Utah-
Idaho state line to confluence of Junction
Creek and South Junction Creek
2 No Evidence of
Impairment
24
West Desert/Columbia UT17040210-003_00 South Junction Creek South Junction Creek and tributaries from
confluence with Junction Creek to
headwaters
2 No Evidence of
Impairment
53
West Desert/Columbia UT16020306-003_00 Thomas Creek Thomas Creek and tributaries, Juab
County
2 No Evidence of
Impairment
12
* Please refer to the 2012/2014 and 2016 IR data files for the sub-category 3 details.
** Phase II of TMDL in Progress.
***Impairment temporary: site specific TDS criterion should apply until WQS change. 49 of 49
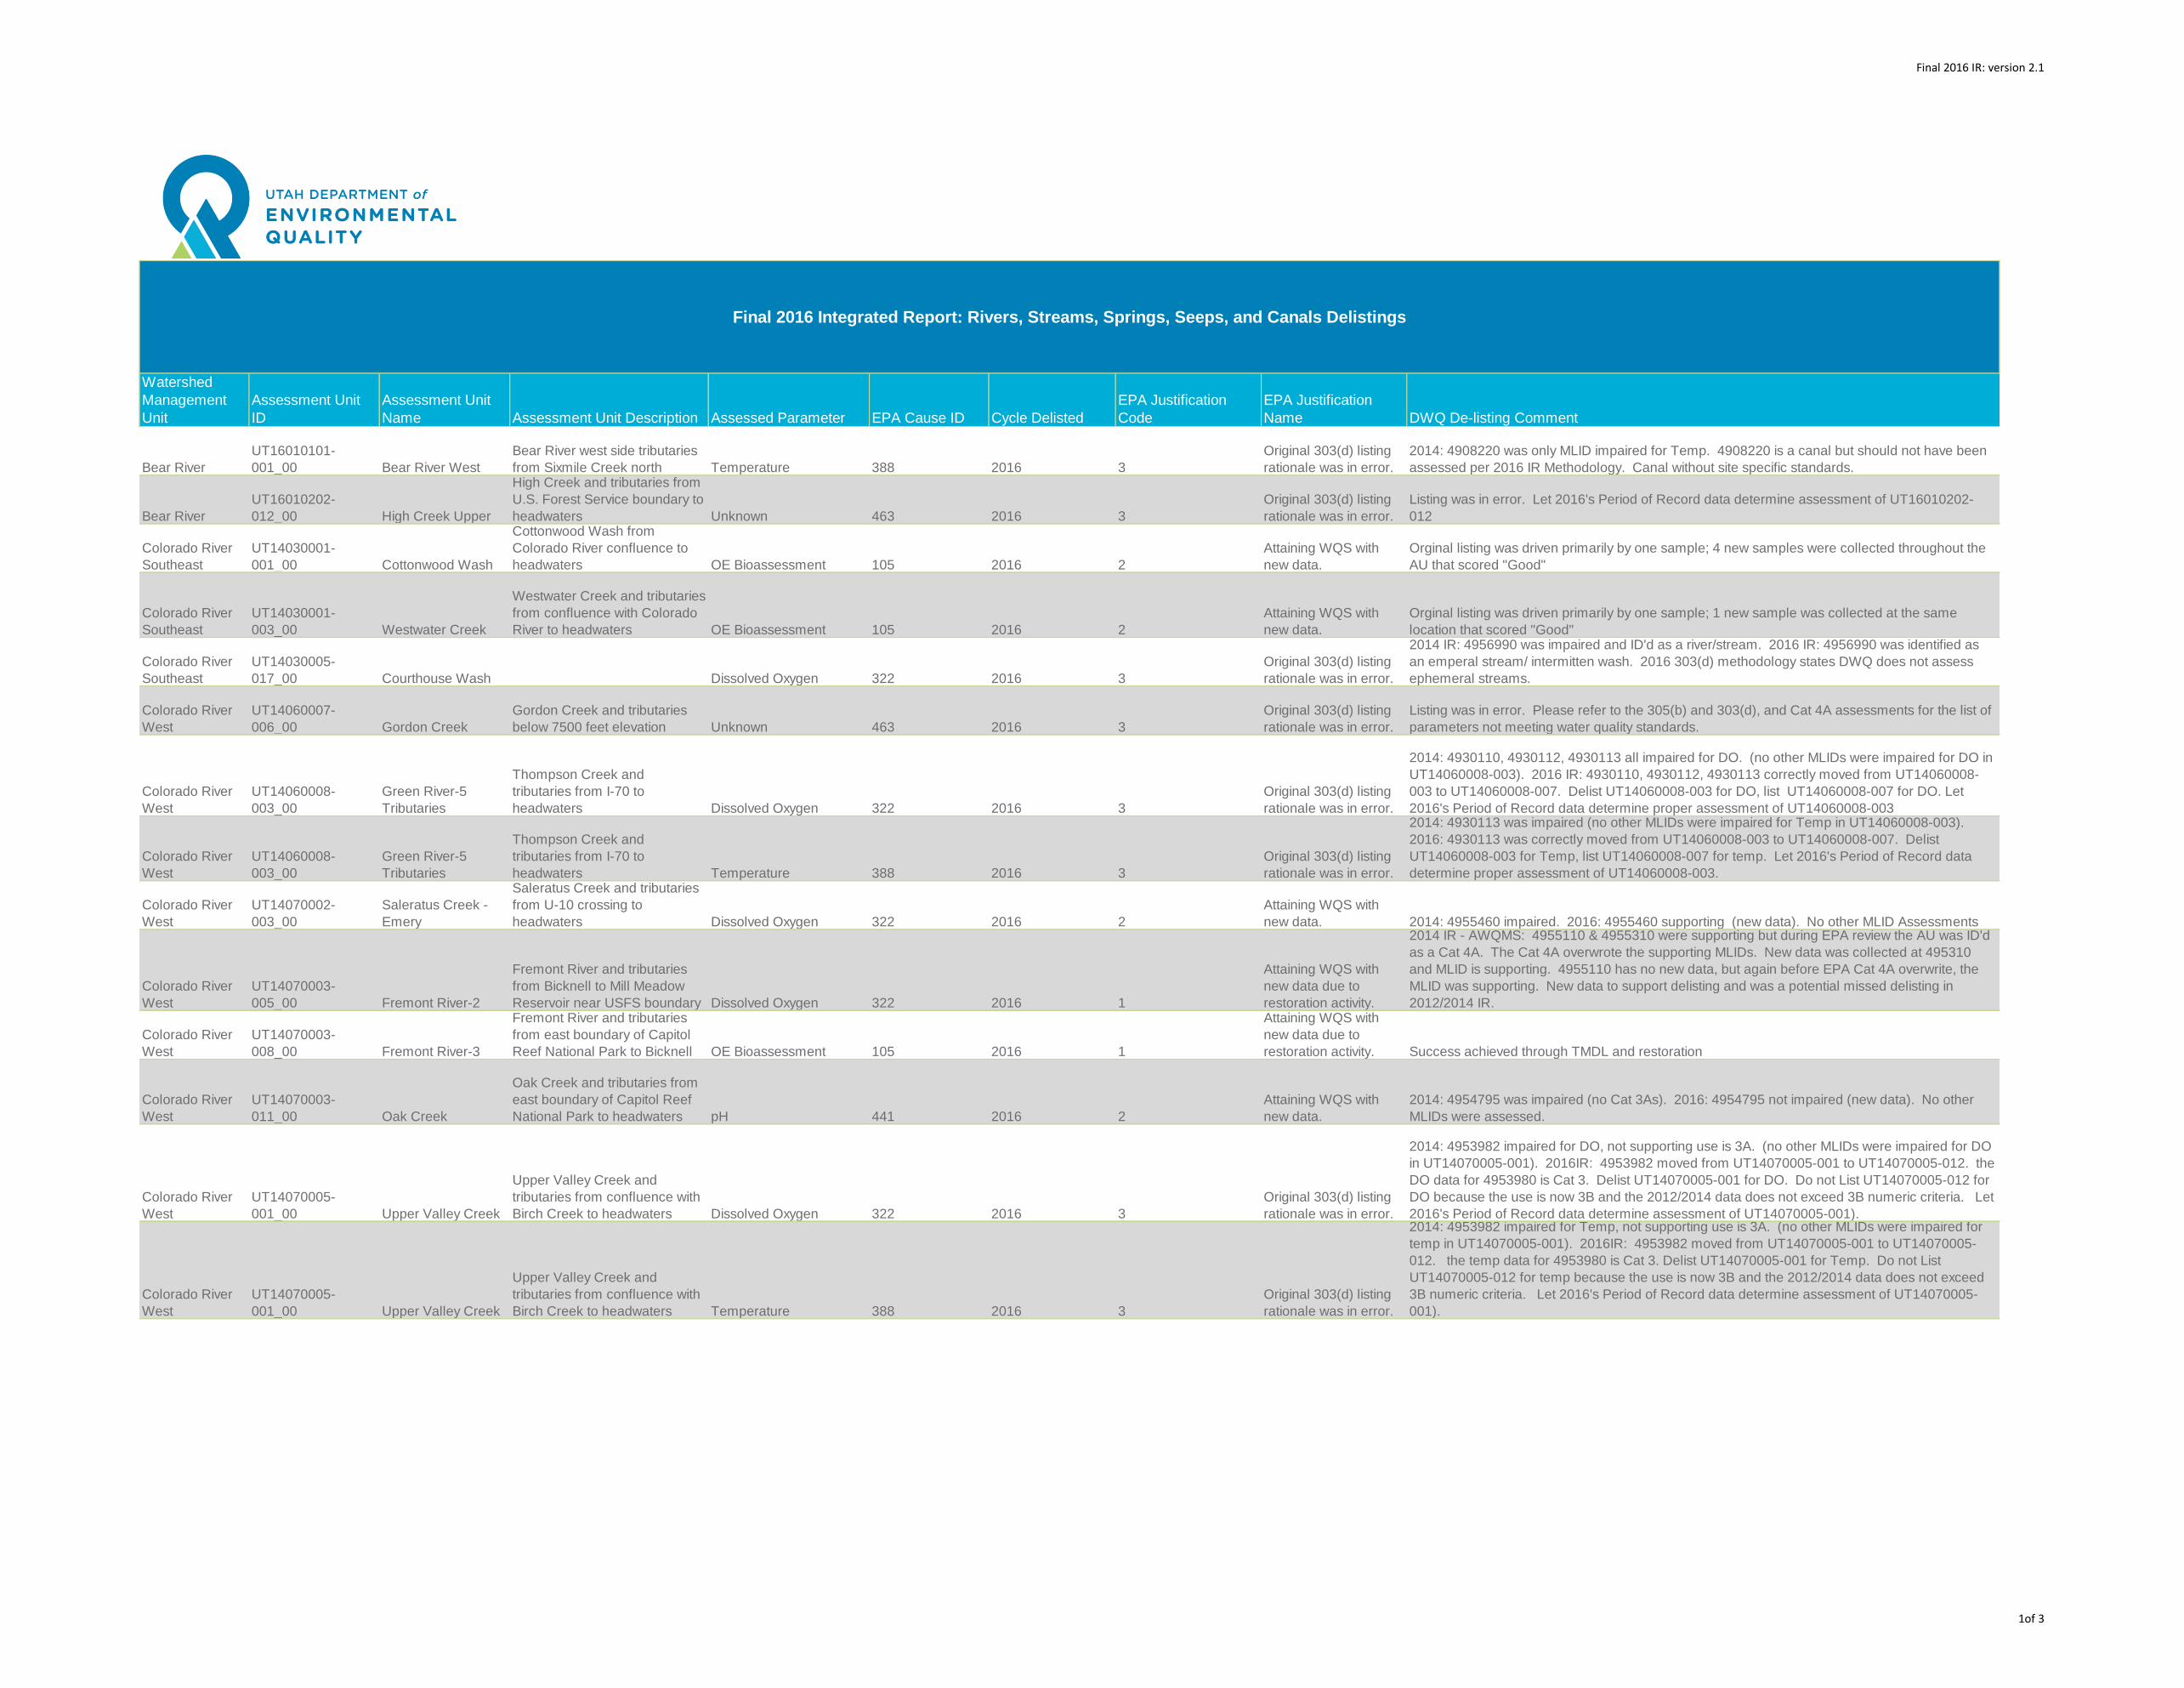
Final 2016 IR: version 2.1
Watershed
Management
Unit
Assessment Unit
ID
Assessment Unit
Name Assessment Unit Description Assessed Parameter EPA Cause ID Cycle Delisted
EPA Justification
Code
EPA Justification
Name DWQ De-listing Comment
Bear River
UT16010101-
001_00 Bear River West
Bear River west side tributaries
from Sixmile Creek north Temperature 388 2016 3
Original 303(d) listing
rationale was in error.
2014: 4908220 was only MLID impaired for Temp. 4908220 is a canal but should not have been
assessed per 2016 IR Methodology. Canal without site specific standards.
Bear River
UT16010202-
012_00 High Creek Upper
High Creek and tributaries from
U.S. Forest Service boundary to
headwaters Unknown 463 2016 3
Original 303(d) listing
rationale was in error.
Listing was in error. Let 2016's Period of Record data determine assessment of UT16010202-
012
Colorado River
Southeast
UT14030001-
001_00 Cottonwood Wash
Cottonwood Wash from
Colorado River confluence to
headwaters OE Bioassessment 105 2016 2
Attaining WQS with
new data.
Orginal listing was driven primarily by one sample; 4 new samples were collected throughout the
AU that scored "Good"
Colorado River
Southeast
UT14030001-
003_00 Westwater Creek
Westwater Creek and tributaries
from confluence with Colorado
River to headwaters OE Bioassessment 105 2016 2
Attaining WQS with
new data.
Orginal listing was driven primarily by one sample; 1 new sample was collected at the same
location that scored "Good"
Colorado River
Southeast
UT14030005-
017_00 Courthouse Wash Dissolved Oxygen 322 2016 3
Original 303(d) listing
rationale was in error.
2014 IR: 4956990 was impaired and ID'd as a river/stream. 2016 IR: 4956990 was identified as
an emperal stream/ intermitten wash. 2016 303(d) methodology states DWQ does not assess
ephemeral streams.
Colorado River
West
UT14060007-
006_00 Gordon Creek
Gordon Creek and tributaries
below 7500 feet elevation Unknown 463 2016 3
Original 303(d) listing
rationale was in error.
Listing was in error. Please refer to the 305(b) and 303(d), and Cat 4A assessments for the list of
parameters not meeting water quality standards.
Colorado River
West
UT14060008-
003_00
Green River-5
Tributaries
Thompson Creek and
tributaries from I-70 to
headwaters Dissolved Oxygen 322 2016 3
Original 303(d) listing
rationale was in error.
2014: 4930110, 4930112, 4930113 all impaired for DO. (no other MLIDs were impaired for DO in
UT14060008-003). 2016 IR: 4930110, 4930112, 4930113 correctly moved from UT14060008-
003 to UT14060008-007. Delist UT14060008-003 for DO, list UT14060008-007 for DO. Let
2016's Period of Record data determine proper assessment of UT14060008-003
Colorado River
West
UT14060008-
003_00
Green River-5
Tributaries
Thompson Creek and
tributaries from I-70 to
headwaters Temperature 388 2016 3
Original 303(d) listing
rationale was in error.
2014: 4930113 was impaired (no other MLIDs were impaired for Temp in UT14060008-003).
2016: 4930113 was correctly moved from UT14060008-003 to UT14060008-007. Delist
UT14060008-003 for Temp, list UT14060008-007 for temp. Let 2016's Period of Record data
determine proper assessment of UT14060008-003.
Colorado River
West
UT14070002-
003_00
Saleratus Creek -
Emery
Saleratus Creek and tributaries
from U-10 crossing to
headwaters Dissolved Oxygen 322 2016 2
Attaining WQS with
new data. 2014: 4955460 impaired. 2016: 4955460 supporting (new data). No other MLID Assessments
Colorado River
West
UT14070003-
005_00 Fremont River-2
Fremont River and tributaries
from Bicknell to Mill Meadow
Reservoir near USFS boundary Dissolved Oxygen 322 2016 1
Attaining WQS with
new data due to
restoration activity.
2014 IR - AWQMS: 4955110 & 4955310 were supporting but during EPA review the AU was ID'd
as a Cat 4A. The Cat 4A overwrote the supporting MLIDs. New data was collected at 495310
and MLID is supporting. 4955110 has no new data, but again before EPA Cat 4A overwrite, the
MLID was supporting. New data to support delisting and was a potential missed delisting in
2012/2014 IR.
Colorado River
West
UT14070003-
008_00 Fremont River-3
Fremont River and tributaries
from east boundary of Capitol
Reef National Park to Bicknell OE Bioassessment 105 2016 1
Attaining WQS with
new data due to
restoration activity. Success achieved through TMDL and restoration
Colorado River
West
UT14070003-
011_00 Oak Creek
Oak Creek and tributaries from
east boundary of Capitol Reef
National Park to headwaters pH 441 2016 2
Attaining WQS with
new data.
2014: 4954795 was impaired (no Cat 3As). 2016: 4954795 not impaired (new data). No other
MLIDs were assessed.
Colorado River
West
UT14070005-
001_00 Upper Valley Creek
Upper Valley Creek and
tributaries from confluence with
Birch Creek to headwaters Dissolved Oxygen 322 2016 3
Original 303(d) listing
rationale was in error.
2014: 4953982 impaired for DO, not supporting use is 3A. (no other MLIDs were impaired for DO
in UT14070005-001). 2016IR: 4953982 moved from UT14070005-001 to UT14070005-012. the
DO data for 4953980 is Cat 3. Delist UT14070005-001 for DO. Do not List UT14070005-012 for
DO because the use is now 3B and the 2012/2014 data does not exceed 3B numeric criteria. Let
2016's Period of Record data determine assessment of UT14070005-001).
Colorado River
West
UT14070005-
001_00 Upper Valley Creek
Upper Valley Creek and
tributaries from confluence with
Birch Creek to headwaters Temperature 388 2016 3
Original 303(d) listing
rationale was in error.
2014: 4953982 impaired for Temp, not supporting use is 3A. (no other MLIDs were impaired for
temp in UT14070005-001). 2016IR: 4953982 moved from UT14070005-001 to UT14070005-
012. the temp data for 4953980 is Cat 3. Delist UT14070005-001 for Temp. Do not List
UT14070005-012 for temp because the use is now 3B and the 2012/2014 data does not exceed
3B numeric criteria. Let 2016's Period of Record data determine assessment of UT14070005-
001).
Final 2016 Integrated Report: Rivers, Streams, Springs, Seeps, and Canals Delistings
1of 3
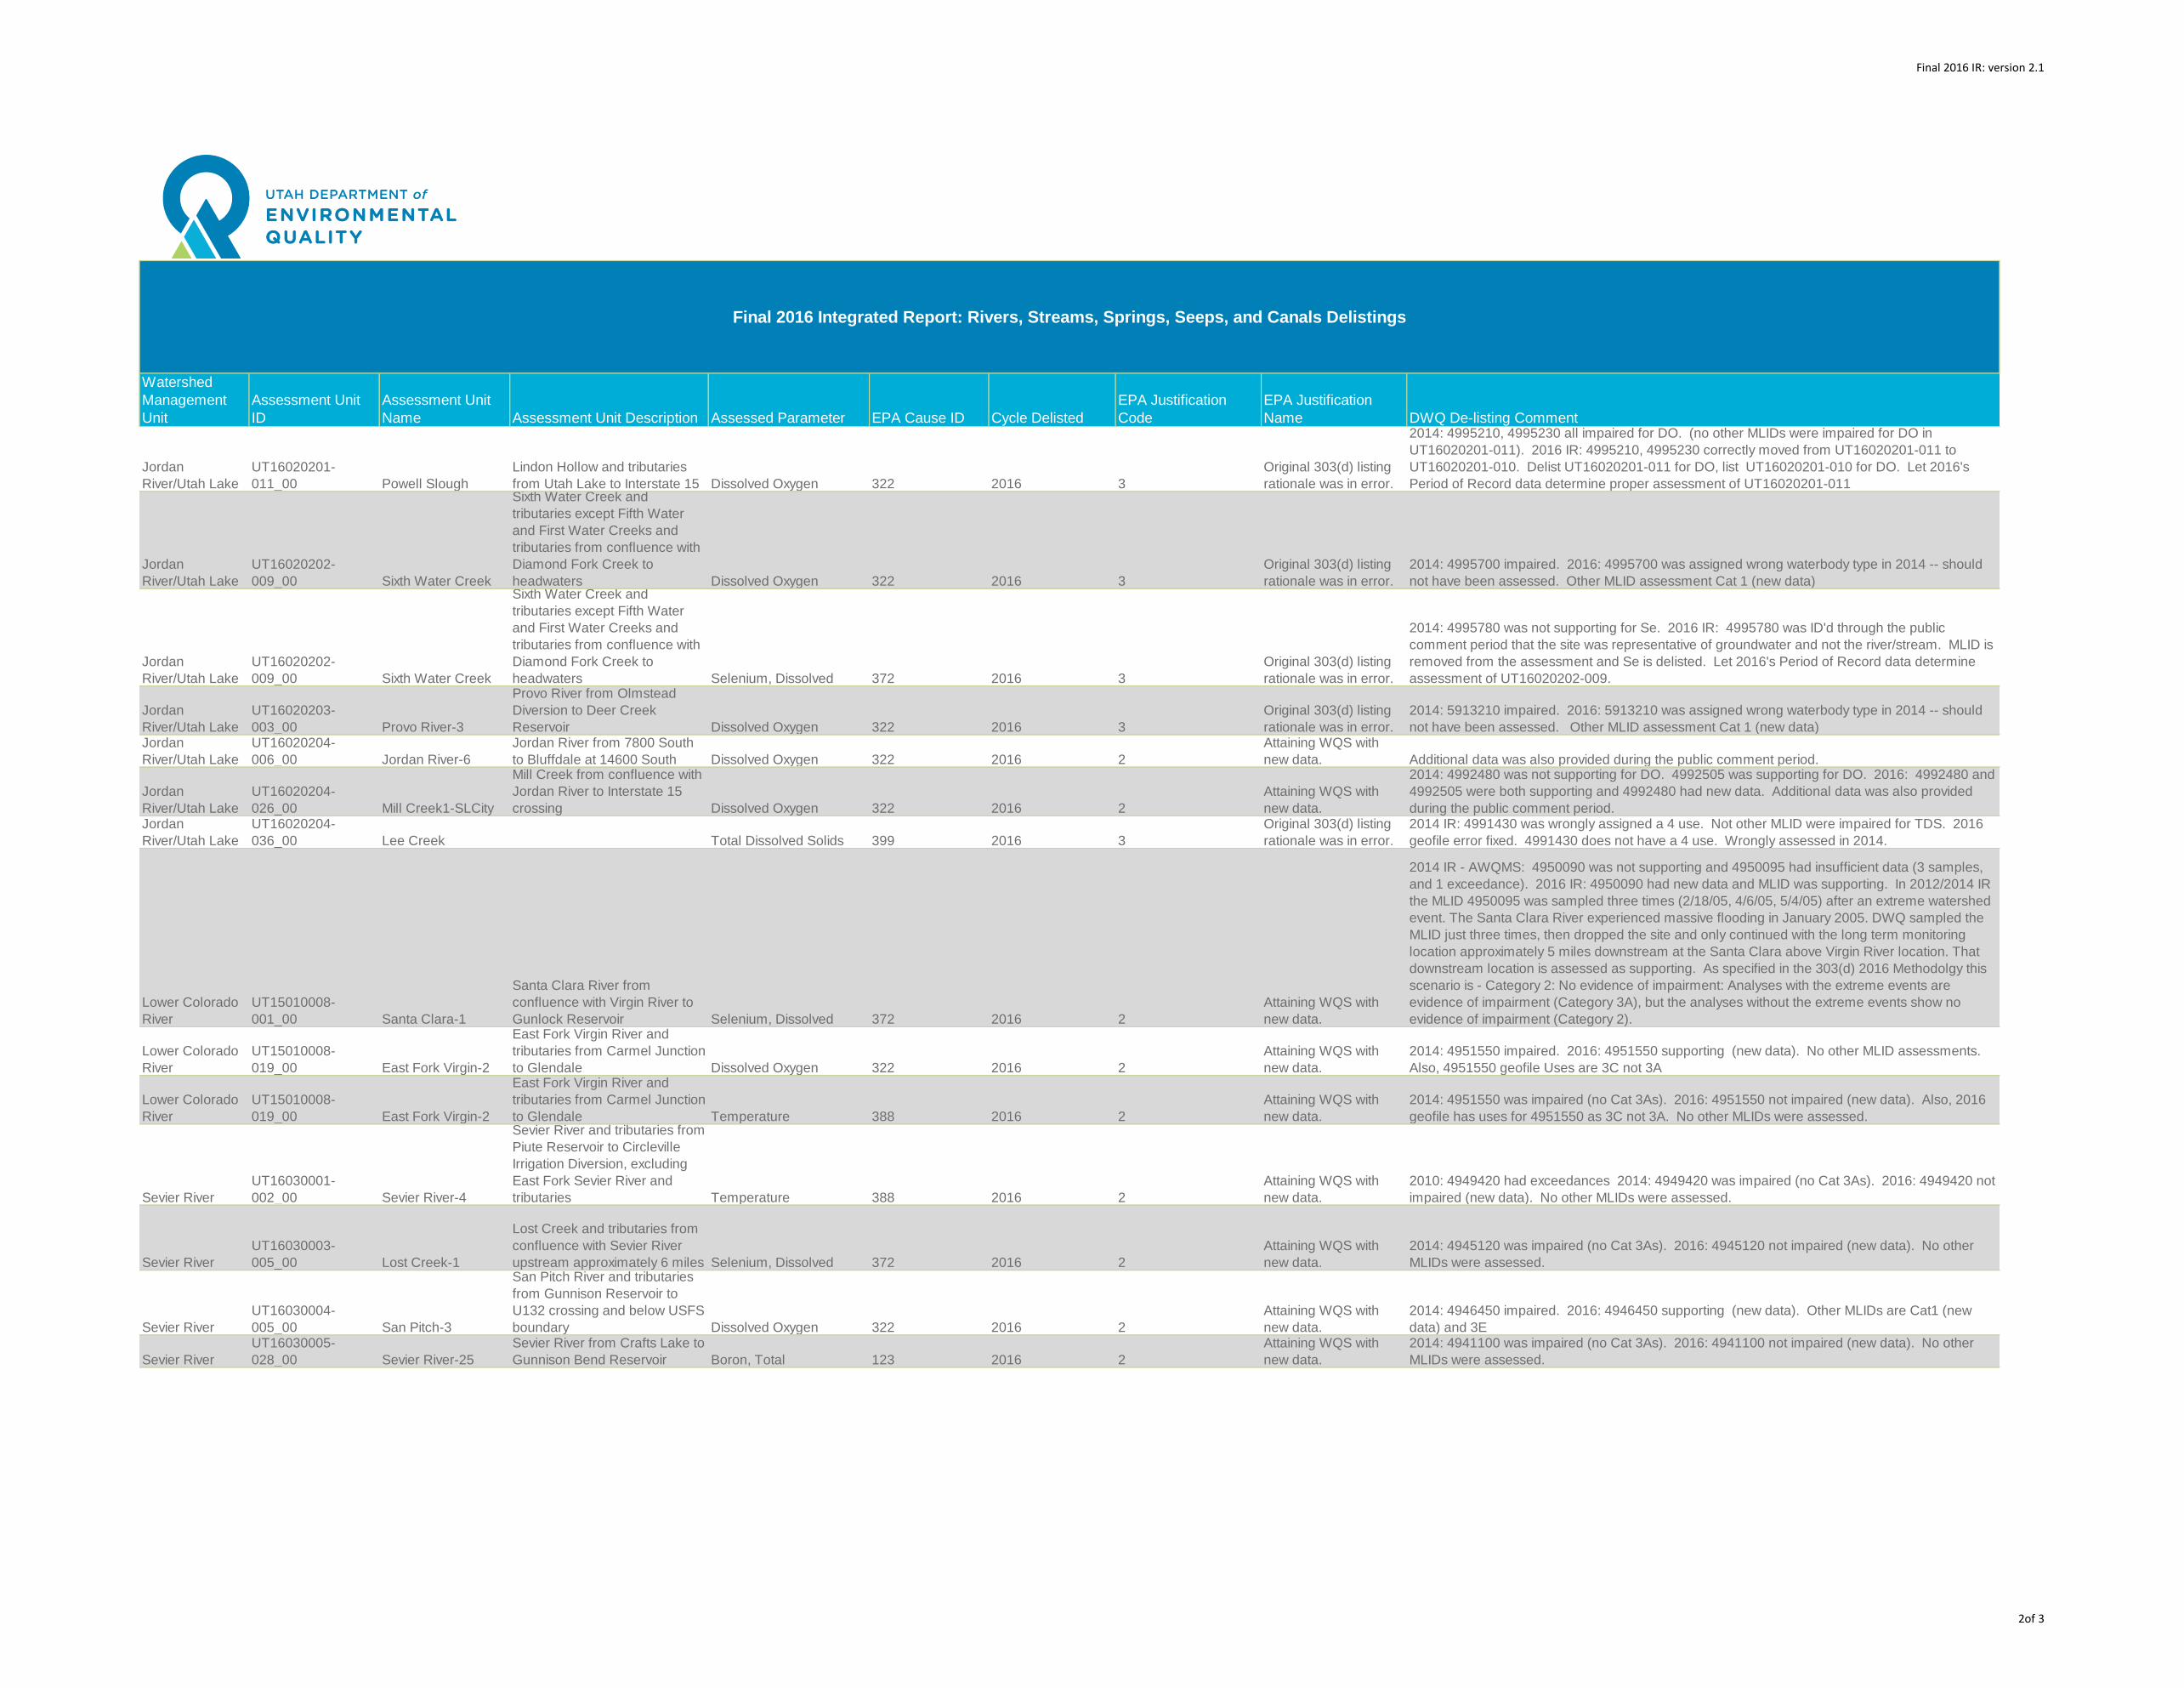
Final 2016 IR: version 2.1
Watershed
Management
Unit
Assessment Unit
ID
Assessment Unit
Name Assessment Unit Description Assessed Parameter EPA Cause ID Cycle Delisted
EPA Justification
Code
EPA Justification
Name DWQ De-listing Comment
Final 2016 Integrated Report: Rivers, Streams, Springs, Seeps, and Canals Delistings
Jordan
River/Utah Lake
UT16020201-
011_00 Powell Slough
Lindon Hollow and tributaries
from Utah Lake to Interstate 15 Dissolved Oxygen 322 2016 3
Original 303(d) listing
rationale was in error.
2014: 4995210, 4995230 all impaired for DO. (no other MLIDs were impaired for DO in
UT16020201-011). 2016 IR: 4995210, 4995230 correctly moved from UT16020201-011 to
UT16020201-010. Delist UT16020201-011 for DO, list UT16020201-010 for DO. Let 2016's
Period of Record data determine proper assessment of UT16020201-011
Jordan
River/Utah Lake
UT16020202-
009_00 Sixth Water Creek
Sixth Water Creek and
tributaries except Fifth Water
and First Water Creeks and
tributaries from confluence with
Diamond Fork Creek to
headwaters Dissolved Oxygen 322 2016 3
Original 303(d) listing
rationale was in error.
2014: 4995700 impaired. 2016: 4995700 was assigned wrong waterbody type in 2014 -- should
not have been assessed. Other MLID assessment Cat 1 (new data)
Jordan
River/Utah Lake
UT16020202-
009_00 Sixth Water Creek
Sixth Water Creek and
tributaries except Fifth Water
and First Water Creeks and
tributaries from confluence with
Diamond Fork Creek to
headwaters Selenium, Dissolved 372 2016 3
Original 303(d) listing
rationale was in error.
2014: 4995780 was not supporting for Se. 2016 IR: 4995780 was ID'd through the public
comment period that the site was representative of groundwater and not the river/stream. MLID is
removed from the assessment and Se is delisted. Let 2016's Period of Record data determine
assessment of UT16020202-009.
Jordan
River/Utah Lake
UT16020203-
003_00 Provo River-3
Provo River from Olmstead
Diversion to Deer Creek
Reservoir Dissolved Oxygen 322 2016 3
Original 303(d) listing
rationale was in error.
2014: 5913210 impaired. 2016: 5913210 was assigned wrong waterbody type in 2014 -- should
not have been assessed. Other MLID assessment Cat 1 (new data)Jordan
River/Utah Lake
UT16020204-
006_00 Jordan River-6
Jordan River from 7800 South
to Bluffdale at 14600 South Dissolved Oxygen 322 2016 2
Attaining WQS with
new data. Additional data was also provided during the public comment period.
Jordan
River/Utah Lake
UT16020204-
026_00 Mill Creek1-SLCity
Mill Creek from confluence with
Jordan River to Interstate 15
crossing Dissolved Oxygen 322 2016 2
Attaining WQS with
new data.
2014: 4992480 was not supporting for DO. 4992505 was supporting for DO. 2016: 4992480 and
4992505 were both supporting and 4992480 had new data. Additional data was also provided
during the public comment period. Jordan
River/Utah Lake
UT16020204-
036_00 Lee Creek Total Dissolved Solids 399 2016 3
Original 303(d) listing
rationale was in error.
2014 IR: 4991430 was wrongly assigned a 4 use. Not other MLID were impaired for TDS. 2016
geofile error fixed. 4991430 does not have a 4 use. Wrongly assessed in 2014.
Lower Colorado
River
UT15010008-
001_00 Santa Clara-1
Santa Clara River from
confluence with Virgin River to
Gunlock Reservoir Selenium, Dissolved 372 2016 2
Attaining WQS with
new data.
2014 IR - AWQMS: 4950090 was not supporting and 4950095 had insufficient data (3 samples,
and 1 exceedance). 2016 IR: 4950090 had new data and MLID was supporting. In 2012/2014 IR
the MLID 4950095 was sampled three times (2/18/05, 4/6/05, 5/4/05) after an extreme watershed
event. The Santa Clara River experienced massive flooding in January 2005. DWQ sampled the
MLID just three times, then dropped the site and only continued with the long term monitoring
location approximately 5 miles downstream at the Santa Clara above Virgin River location. That
downstream location is assessed as supporting. As specified in the 303(d) 2016 Methodolgy this
scenario is - Category 2: No evidence of impairment: Analyses with the extreme events are
evidence of impairment (Category 3A), but the analyses without the extreme events show no
evidence of impairment (Category 2).
Lower Colorado
River
UT15010008-
019_00 East Fork Virgin-2
East Fork Virgin River and
tributaries from Carmel Junction
to Glendale Dissolved Oxygen 322 2016 2
Attaining WQS with
new data.
2014: 4951550 impaired. 2016: 4951550 supporting (new data). No other MLID assessments.
Also, 4951550 geofile Uses are 3C not 3A
Lower Colorado
River
UT15010008-
019_00 East Fork Virgin-2
East Fork Virgin River and
tributaries from Carmel Junction
to Glendale Temperature 388 2016 2
Attaining WQS with
new data.
2014: 4951550 was impaired (no Cat 3As). 2016: 4951550 not impaired (new data). Also, 2016
geofile has uses for 4951550 as 3C not 3A. No other MLIDs were assessed.
Sevier River
UT16030001-
002_00 Sevier River-4
Sevier River and tributaries from
Piute Reservoir to Circleville
Irrigation Diversion, excluding
East Fork Sevier River and
tributaries Temperature 388 2016 2
Attaining WQS with
new data.
2010: 4949420 had exceedances 2014: 4949420 was impaired (no Cat 3As). 2016: 4949420 not
impaired (new data). No other MLIDs were assessed.
Sevier River
UT16030003-
005_00 Lost Creek-1
Lost Creek and tributaries from
confluence with Sevier River
upstream approximately 6 miles Selenium, Dissolved 372 2016 2
Attaining WQS with
new data.
2014: 4945120 was impaired (no Cat 3As). 2016: 4945120 not impaired (new data). No other
MLIDs were assessed.
Sevier River
UT16030004-
005_00 San Pitch-3
San Pitch River and tributaries
from Gunnison Reservoir to
U132 crossing and below USFS
boundary Dissolved Oxygen 322 2016 2
Attaining WQS with
new data.
2014: 4946450 impaired. 2016: 4946450 supporting (new data). Other MLIDs are Cat1 (new
data) and 3E
Sevier River
UT16030005-
028_00 Sevier River-25
Sevier River from Crafts Lake to
Gunnison Bend Reservoir Boron, Total 123 2016 2
Attaining WQS with
new data.
2014: 4941100 was impaired (no Cat 3As). 2016: 4941100 not impaired (new data). No other
MLIDs were assessed.
2of 3
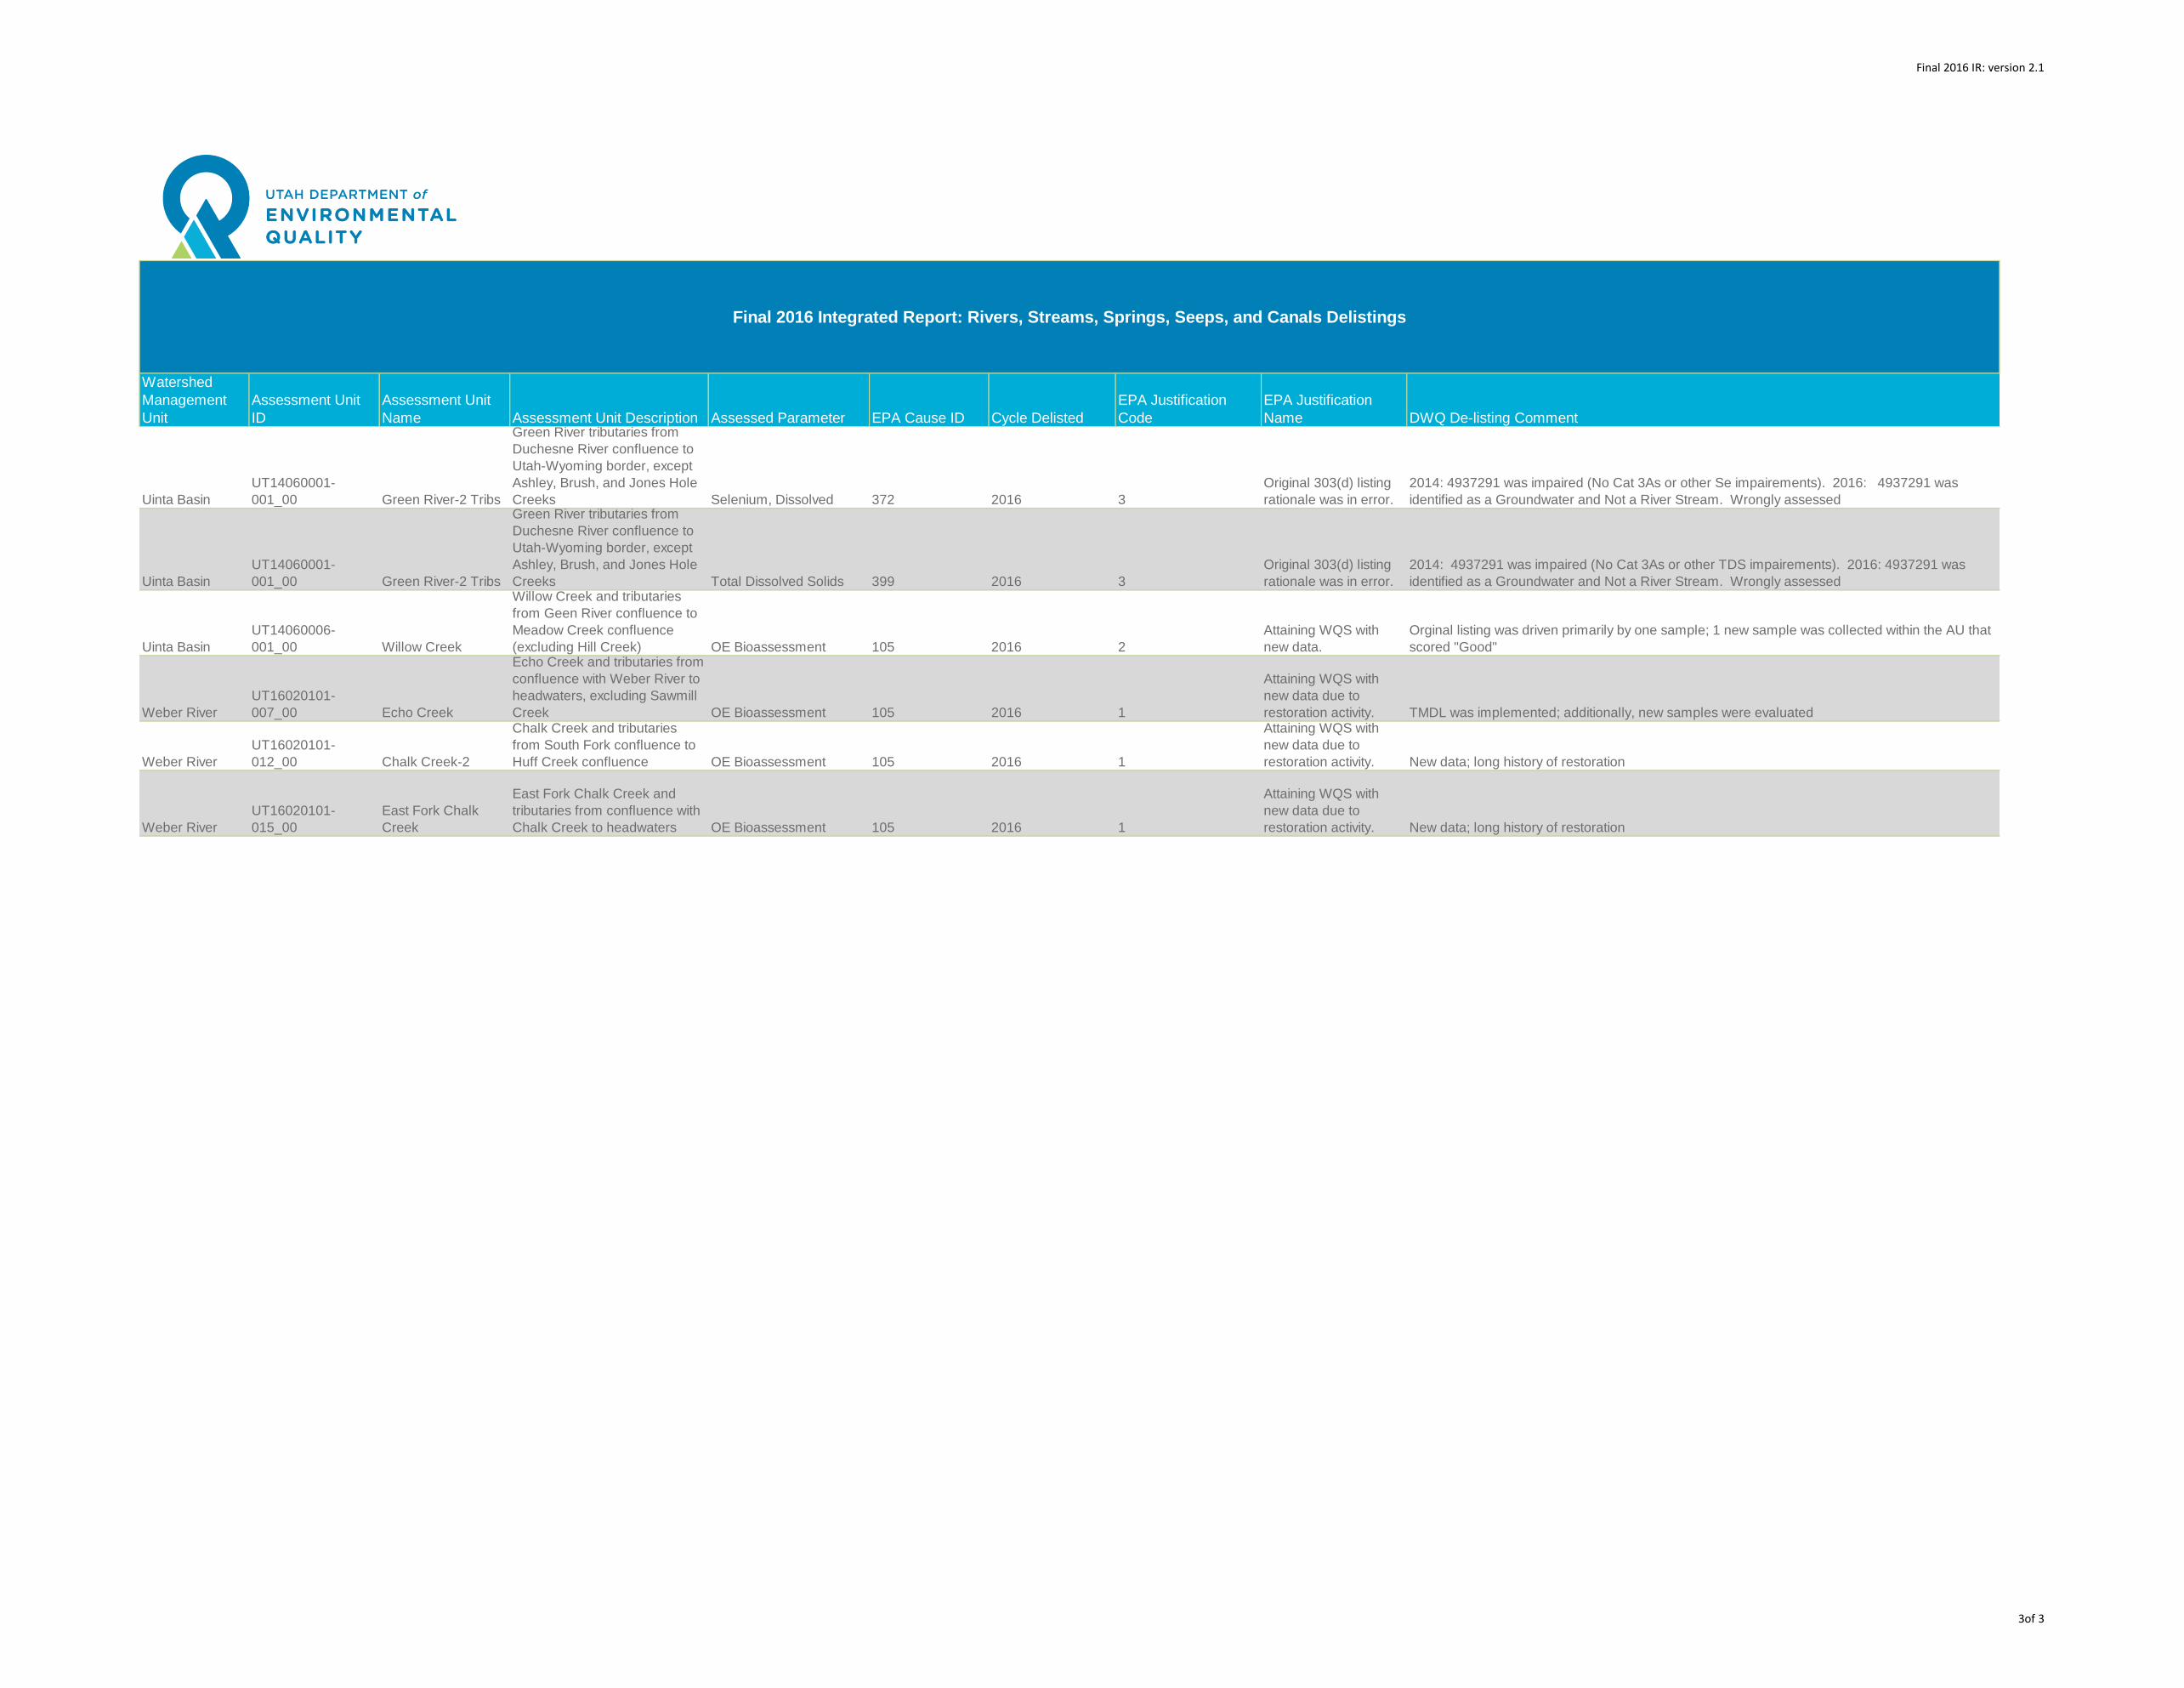
Final 2016 IR: version 2.1
Watershed
Management
Unit
Assessment Unit
ID
Assessment Unit
Name Assessment Unit Description Assessed Parameter EPA Cause ID Cycle Delisted
EPA Justification
Code
EPA Justification
Name DWQ De-listing Comment
Final 2016 Integrated Report: Rivers, Streams, Springs, Seeps, and Canals Delistings
Uinta Basin
UT14060001-
001_00 Green River-2 Tribs
Green River tributaries from
Duchesne River confluence to
Utah-Wyoming border, except
Ashley, Brush, and Jones Hole
Creeks Selenium, Dissolved 372 2016 3
Original 303(d) listing
rationale was in error.
2014: 4937291 was impaired (No Cat 3As or other Se impairements). 2016: 4937291 was
identified as a Groundwater and Not a River Stream. Wrongly assessed
Uinta Basin
UT14060001-
001_00 Green River-2 Tribs
Green River tributaries from
Duchesne River confluence to
Utah-Wyoming border, except
Ashley, Brush, and Jones Hole
Creeks Total Dissolved Solids 399 2016 3
Original 303(d) listing
rationale was in error.
2014: 4937291 was impaired (No Cat 3As or other TDS impairements). 2016: 4937291 was
identified as a Groundwater and Not a River Stream. Wrongly assessed
Uinta Basin
UT14060006-
001_00 Willow Creek
Willow Creek and tributaries
from Geen River confluence to
Meadow Creek confluence
(excluding Hill Creek) OE Bioassessment 105 2016 2
Attaining WQS with
new data.
Orginal listing was driven primarily by one sample; 1 new sample was collected within the AU that
scored "Good"
Weber River
UT16020101-
007_00 Echo Creek
Echo Creek and tributaries from
confluence with Weber River to
headwaters, excluding Sawmill
Creek OE Bioassessment 105 2016 1
Attaining WQS with
new data due to
restoration activity. TMDL was implemented; additionally, new samples were evaluated
Weber River
UT16020101-
012_00 Chalk Creek-2
Chalk Creek and tributaries
from South Fork confluence to
Huff Creek confluence OE Bioassessment 105 2016 1
Attaining WQS with
new data due to
restoration activity. New data; long history of restoration
Weber River
UT16020101-
015_00
East Fork Chalk
Creek
East Fork Chalk Creek and
tributaries from confluence with
Chalk Creek to headwaters OE Bioassessment 105 2016 1
Attaining WQS with
new data due to
restoration activity. New data; long history of restoration
3of 3
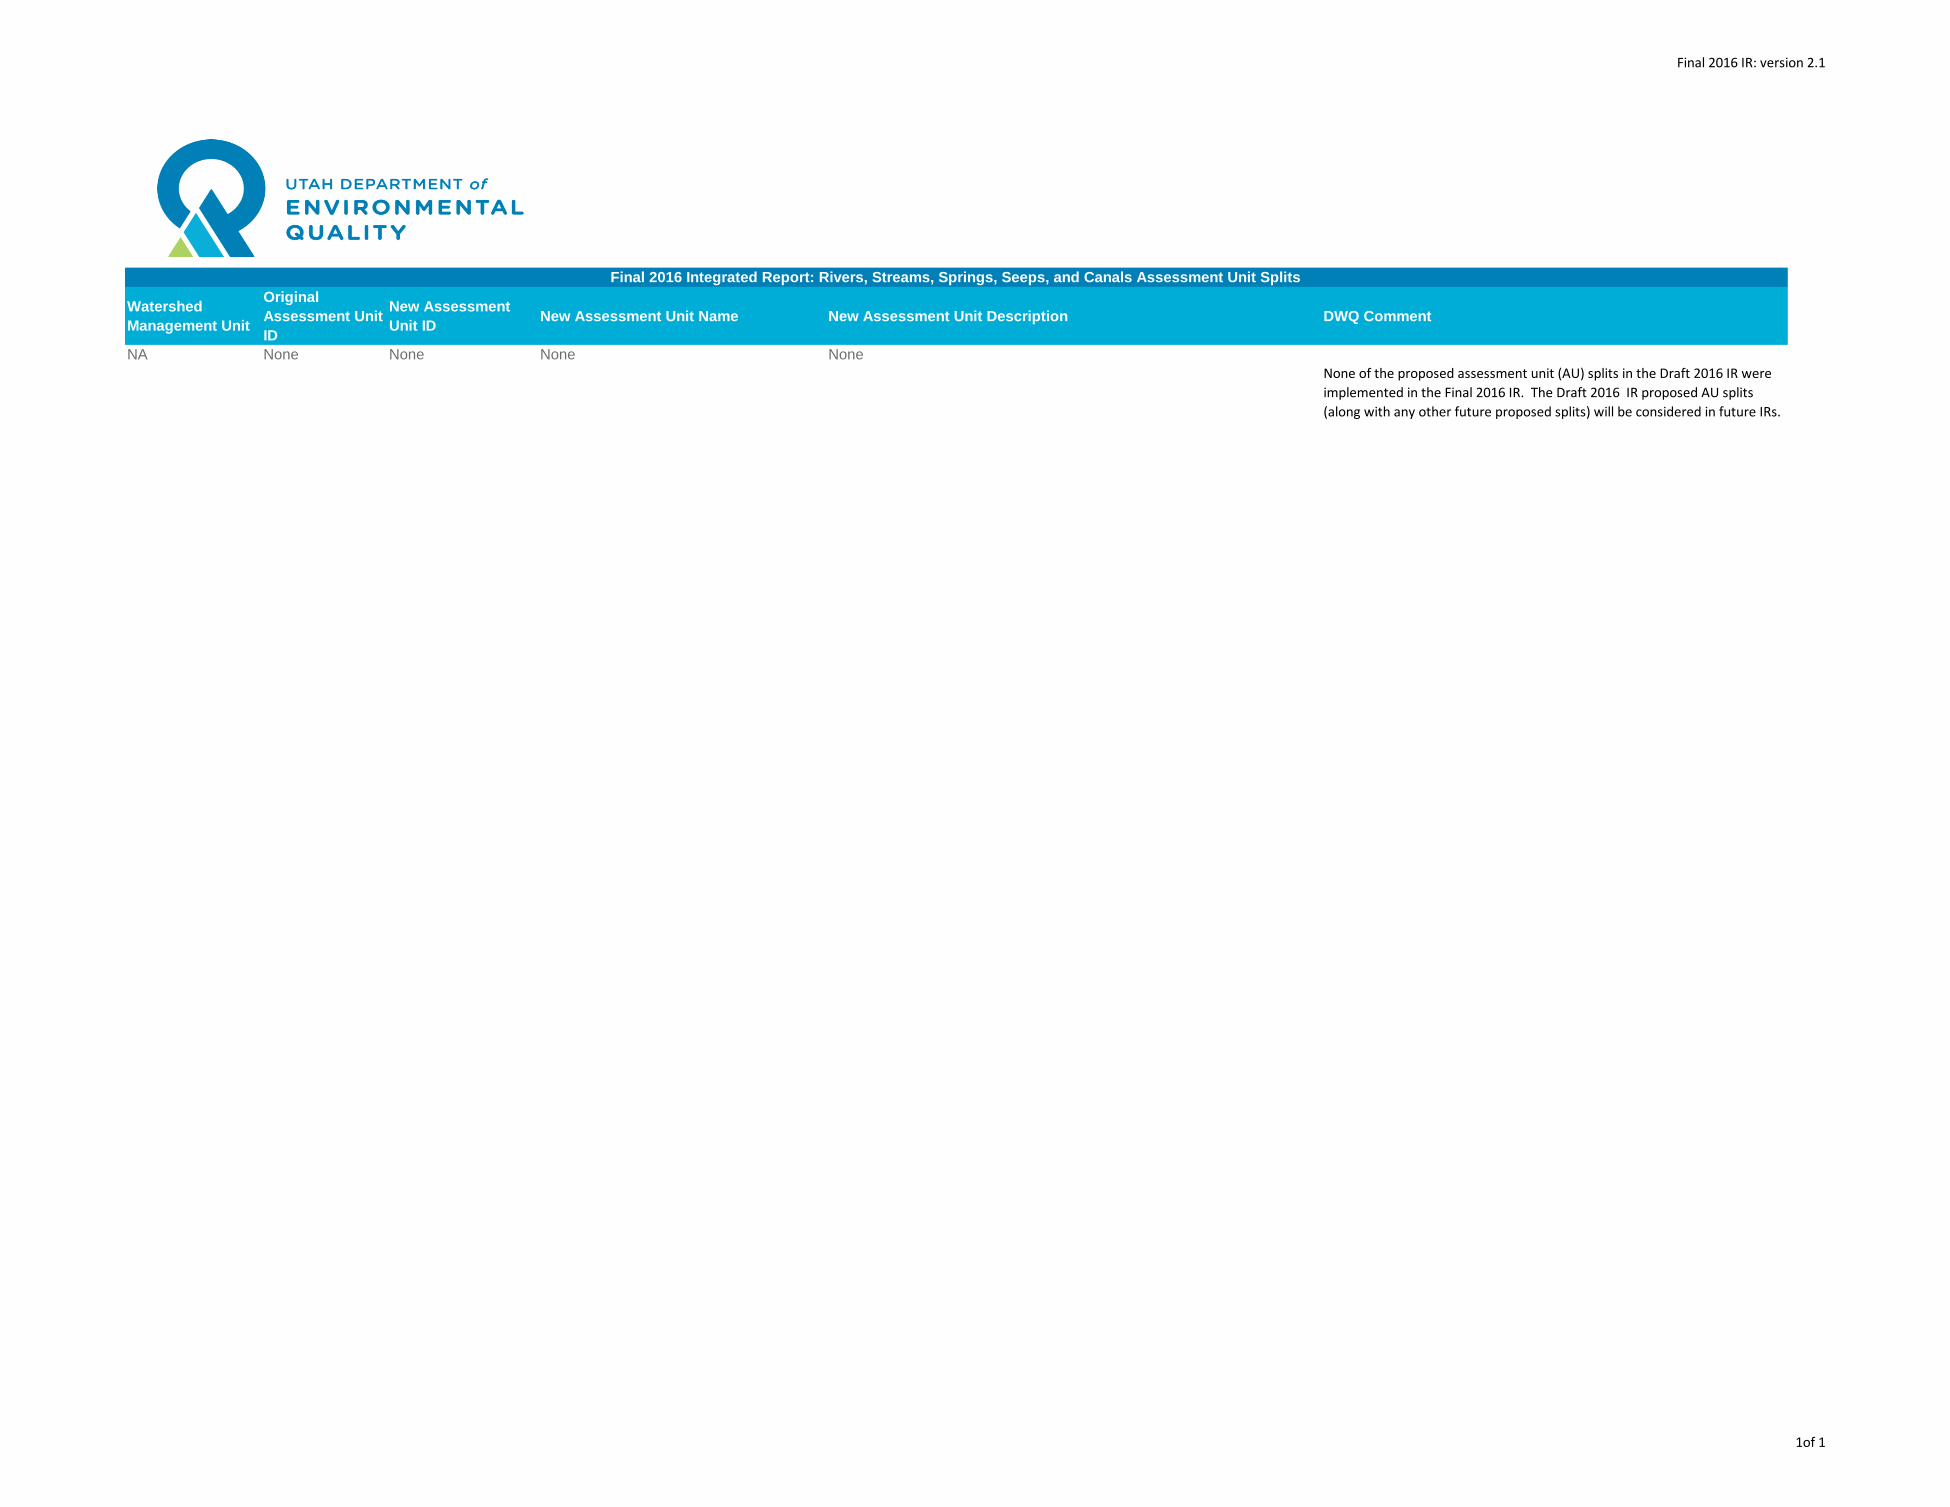
Final 2016 IR: version 2.1
Watershed
Management Unit
Original
Assessment Unit
ID
New Assessment
Unit IDNew Assessment Unit Name New Assessment Unit Description DWQ Comment
NA None None None None
None of the proposed assessment unit (AU) splits in the Draft 2016 IR were
implemented in the Final 2016 IR. The Draft 2016 IR proposed AU splits
(along with any other future proposed splits) will be considered in future IRs.
Final 2016 Integrated Report: Rivers, Streams, Springs, Seeps, and Canals Assessment Unit Splits
1of 1
CHAPTER 4: LAKE AND
RESERVOIR
ASSESSMENTS
2016 Final Integrated Report

Chapter 4: Lake And reservoir Assessments
Final 2016 IR: version 2.1 Page 2
[This page is intentionally left blank].
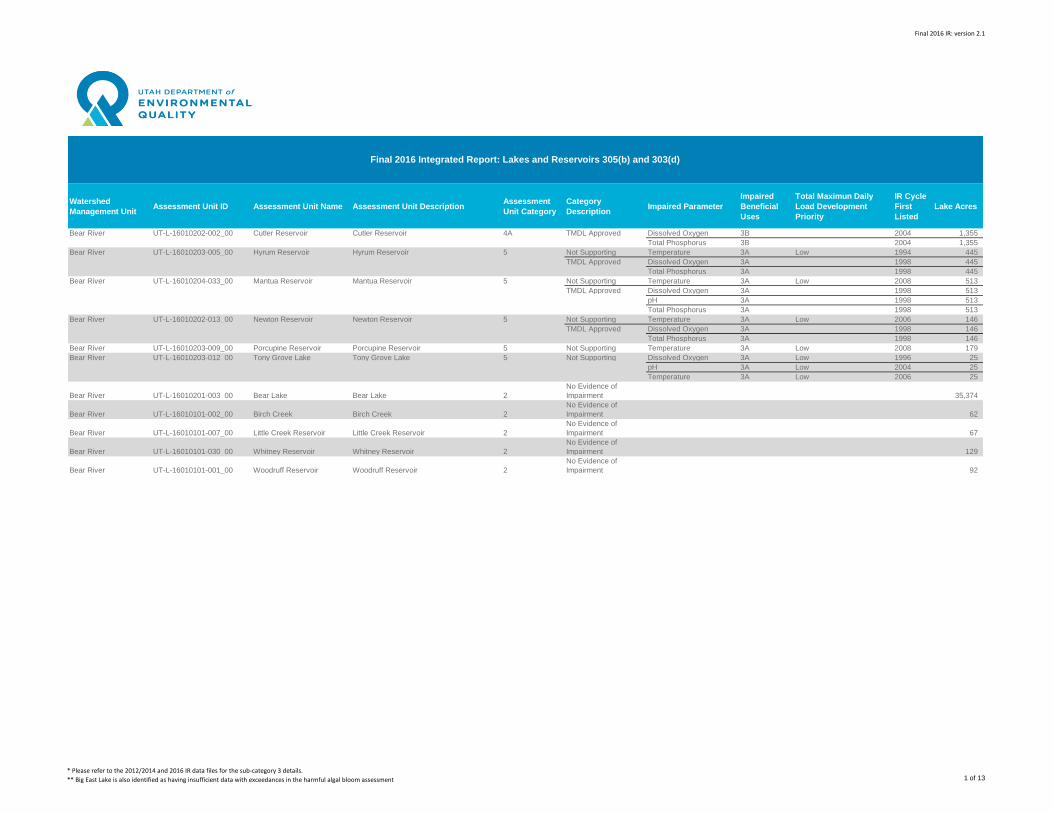
Final 2016 IR: version 2.1
Watershed
Management UnitAssessment Unit ID Assessment Unit Name Assessment Unit Description
Assessment
Unit Category
Category
DescriptionImpaired Parameter
Impaired
Beneficial
Uses
Total Maximun Daily
Load Development
Priority
IR Cycle
First
Listed
Lake Acres
Bear River UT-L-16010202-002_00 Cutler Reservoir Cutler Reservoir 4A TMDL Approved Dissolved Oxygen 3B 2004 1,355
Total Phosphorus 3B 2004 1,355
Bear River UT-L-16010203-005_00 Hyrum Reservoir Hyrum Reservoir 5 Not Supporting Temperature 3A Low 1994 445
TMDL Approved Dissolved Oxygen 3A 1998 445
Total Phosphorus 3A 1998 445
Bear River UT-L-16010204-033_00 Mantua Reservoir Mantua Reservoir 5 Not Supporting Temperature 3A Low 2008 513
TMDL Approved Dissolved Oxygen 3A 1998 513
pH 3A 1998 513
Total Phosphorus 3A 1998 513
Bear River UT-L-16010202-013_00 Newton Reservoir Newton Reservoir 5 Not Supporting Temperature 3A Low 2006 146
TMDL Approved Dissolved Oxygen 3A 1998 146
Total Phosphorus 3A 1998 146
Bear River UT-L-16010203-009_00 Porcupine Reservoir Porcupine Reservoir 5 Not Supporting Temperature 3A Low 2008 179
Bear River UT-L-16010203-012_00 Tony Grove Lake Tony Grove Lake 5 Not Supporting Dissolved Oxygen 3A Low 1996 25
pH 3A Low 2004 25
Temperature 3A Low 2006 25
Bear River UT-L-16010201-003_00 Bear Lake Bear Lake 2
No Evidence of
Impairment 35,374
Bear River UT-L-16010101-002_00 Birch Creek Birch Creek 2
No Evidence of
Impairment 62
Bear River UT-L-16010101-007_00 Little Creek Reservoir Little Creek Reservoir 2
No Evidence of
Impairment 67
Bear River UT-L-16010101-030_00 Whitney Reservoir Whitney Reservoir 2
No Evidence of
Impairment 129
Bear River UT-L-16010101-001_00 Woodruff Reservoir Woodruff Reservoir 2
No Evidence of
Impairment 92
Final 2016 Integrated Report: Lakes and Reservoirs 305(b) and 303(d)
* Please refer to the 2012/2014 and 2016 IR data files for the sub-category 3 details.
** Big East Lake is also identified as having insufficient data with exceedances in the harmful algal bloom assessment 1 of 13
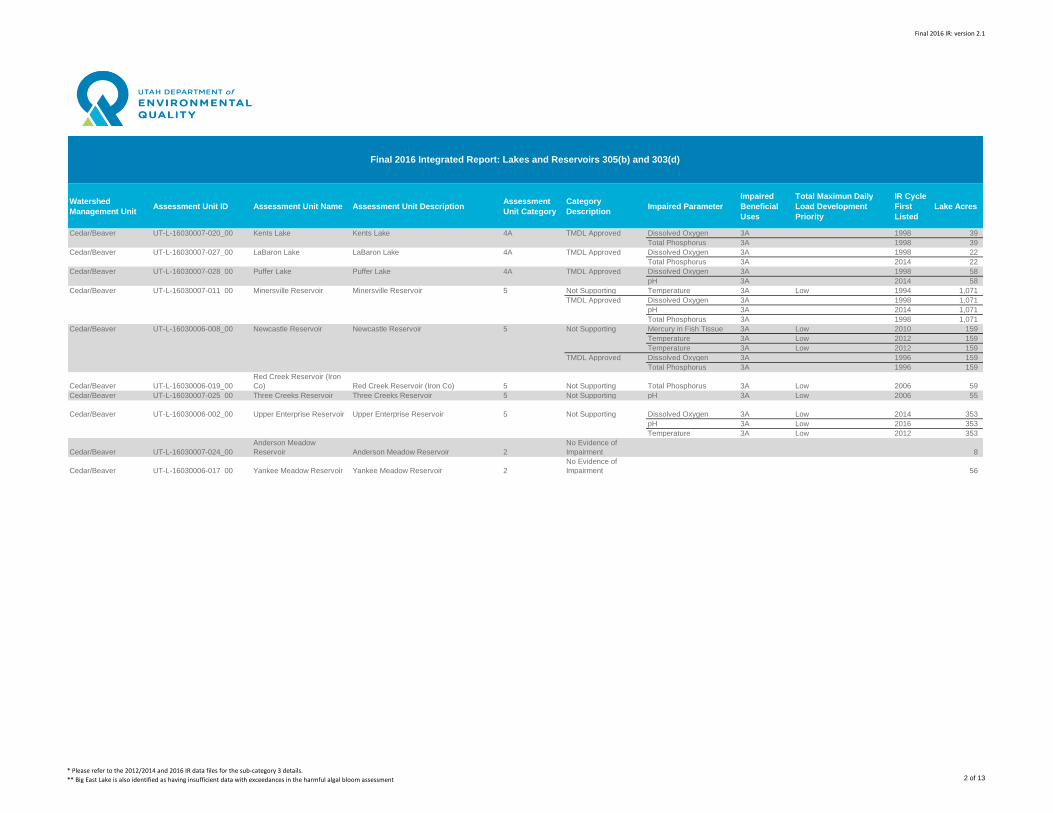
Final 2016 IR: version 2.1
Watershed
Management UnitAssessment Unit ID Assessment Unit Name Assessment Unit Description
Assessment
Unit Category
Category
DescriptionImpaired Parameter
Impaired
Beneficial
Uses
Total Maximun Daily
Load Development
Priority
IR Cycle
First
Listed
Lake Acres
Final 2016 Integrated Report: Lakes and Reservoirs 305(b) and 303(d)
Cedar/Beaver UT-L-16030007-020_00 Kents Lake Kents Lake 4A TMDL Approved Dissolved Oxygen 3A 1998 39
Total Phosphorus 3A 1998 39
Cedar/Beaver UT-L-16030007-027_00 LaBaron Lake LaBaron Lake 4A TMDL Approved Dissolved Oxygen 3A 1998 22
Total Phosphorus 3A 2014 22
Cedar/Beaver UT-L-16030007-028_00 Puffer Lake Puffer Lake 4A TMDL Approved Dissolved Oxygen 3A 1998 58
pH 3A 2014 58
Cedar/Beaver UT-L-16030007-011_00 Minersville Reservoir Minersville Reservoir 5 Not Supporting Temperature 3A Low 1994 1,071
TMDL Approved Dissolved Oxygen 3A 1998 1,071
pH 3A 2014 1,071
Total Phosphorus 3A 1998 1,071
Cedar/Beaver UT-L-16030006-008_00 Newcastle Reservoir Newcastle Reservoir 5 Not Supporting Mercury in Fish Tissue 3A Low 2010 159
Temperature 3A Low 2012 159
Temperature 3A Low 2012 159
TMDL Approved Dissolved Oxygen 3A 1996 159
Total Phosphorus 3A 1996 159
Cedar/Beaver UT-L-16030006-019_00
Red Creek Reservoir (Iron
Co) Red Creek Reservoir (Iron Co) 5 Not Supporting Total Phosphorus 3A Low 2006 59
Cedar/Beaver UT-L-16030007-025_00 Three Creeks Reservoir Three Creeks Reservoir 5 Not Supporting pH 3A Low 2006 55
Cedar/Beaver UT-L-16030006-002_00 Upper Enterprise Reservoir Upper Enterprise Reservoir 5 Not Supporting Dissolved Oxygen 3A Low 2014 353
pH 3A Low 2016 353
Temperature 3A Low 2012 353
Cedar/Beaver UT-L-16030007-024_00
Anderson Meadow
Reservoir Anderson Meadow Reservoir 2
No Evidence of
Impairment 8
Cedar/Beaver UT-L-16030006-017_00 Yankee Meadow Reservoir Yankee Meadow Reservoir 2
No Evidence of
Impairment 56
* Please refer to the 2012/2014 and 2016 IR data files for the sub-category 3 details.
** Big East Lake is also identified as having insufficient data with exceedances in the harmful algal bloom assessment 2 of 13
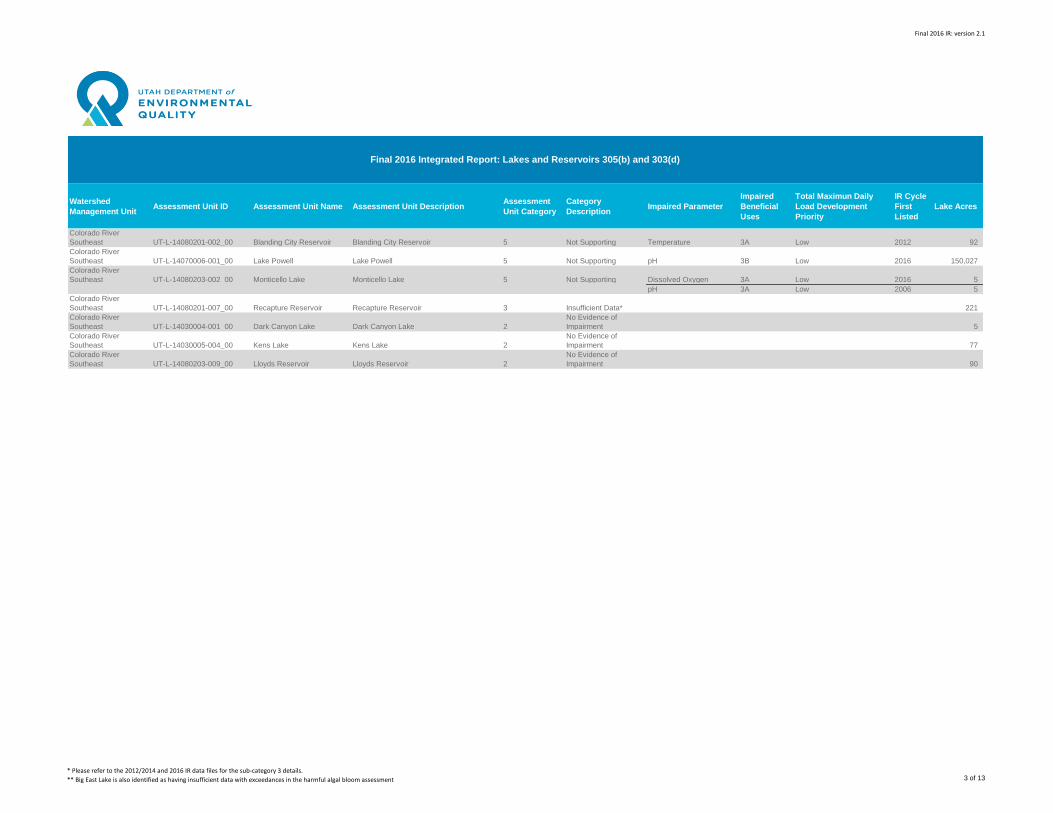
Final 2016 IR: version 2.1
Watershed
Management UnitAssessment Unit ID Assessment Unit Name Assessment Unit Description
Assessment
Unit Category
Category
DescriptionImpaired Parameter
Impaired
Beneficial
Uses
Total Maximun Daily
Load Development
Priority
IR Cycle
First
Listed
Lake Acres
Final 2016 Integrated Report: Lakes and Reservoirs 305(b) and 303(d)
Colorado River
Southeast UT-L-14080201-002_00 Blanding City Reservoir Blanding City Reservoir 5 Not Supporting Temperature 3A Low 2012 92
Colorado River
Southeast UT-L-14070006-001_00 Lake Powell Lake Powell 5 Not Supporting pH 3B Low 2016 150,027
Colorado River
Southeast UT-L-14080203-002_00 Monticello Lake Monticello Lake 5 Not Supporting Dissolved Oxygen 3A Low 2016 5
pH 3A Low 2006 5
Colorado River
Southeast UT-L-14080201-007_00 Recapture Reservoir Recapture Reservoir 3 Insufficient Data* 221
Colorado River
Southeast UT-L-14030004-001_00 Dark Canyon Lake Dark Canyon Lake 2
No Evidence of
Impairment 5
Colorado River
Southeast UT-L-14030005-004_00 Kens Lake Kens Lake 2
No Evidence of
Impairment 77
Colorado River
Southeast UT-L-14080203-009_00 Lloyds Reservoir Lloyds Reservoir 2
No Evidence of
Impairment 90
* Please refer to the 2012/2014 and 2016 IR data files for the sub-category 3 details.
** Big East Lake is also identified as having insufficient data with exceedances in the harmful algal bloom assessment 3 of 13
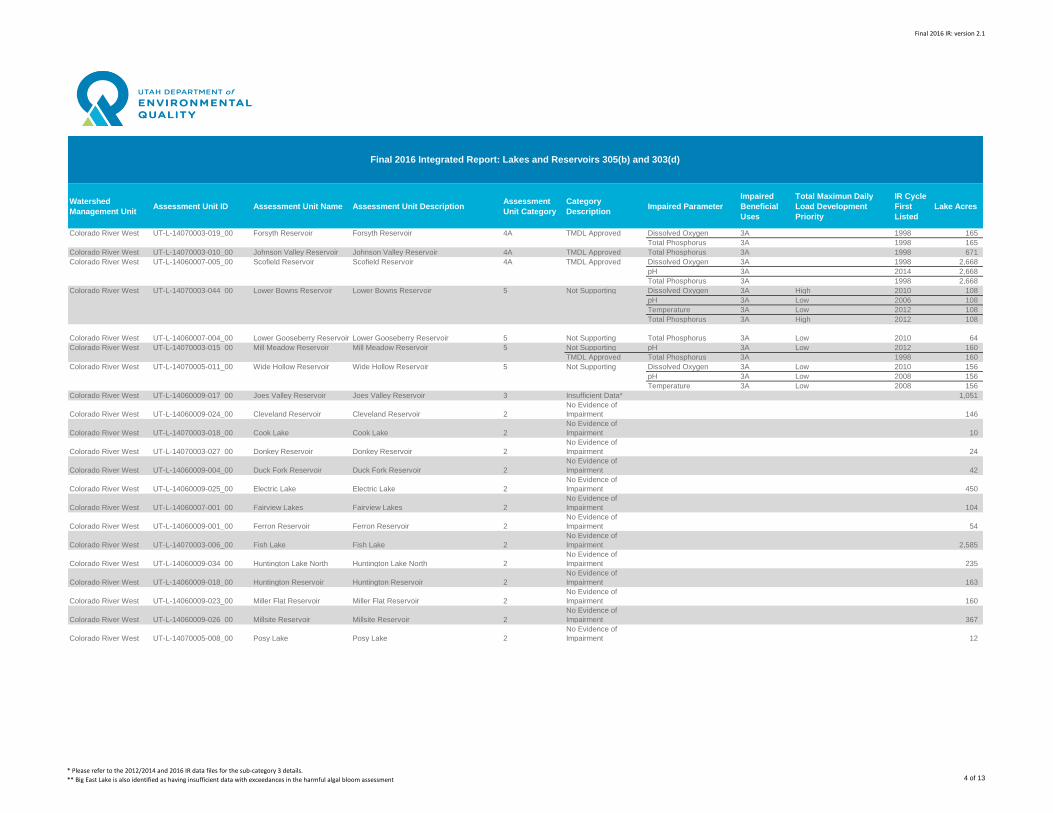
Final 2016 IR: version 2.1
Watershed
Management UnitAssessment Unit ID Assessment Unit Name Assessment Unit Description
Assessment
Unit Category
Category
DescriptionImpaired Parameter
Impaired
Beneficial
Uses
Total Maximun Daily
Load Development
Priority
IR Cycle
First
Listed
Lake Acres
Final 2016 Integrated Report: Lakes and Reservoirs 305(b) and 303(d)
Colorado River West UT-L-14070003-019_00 Forsyth Reservoir Forsyth Reservoir 4A TMDL Approved Dissolved Oxygen 3A 1998 165
Total Phosphorus 3A 1998 165
Colorado River West UT-L-14070003-010_00 Johnson Valley Reservoir Johnson Valley Reservoir 4A TMDL Approved Total Phosphorus 3A 1998 671
Colorado River West UT-L-14060007-005_00 Scofield Reservoir Scofield Reservoir 4A TMDL Approved Dissolved Oxygen 3A 1998 2,668
pH 3A 2014 2,668
Total Phosphorus 3A 1998 2,668
Colorado River West UT-L-14070003-044_00 Lower Bowns Reservoir Lower Bowns Reservoir 5 Not Supporting Dissolved Oxygen 3A High 2010 108
pH 3A Low 2006 108
Temperature 3A Low 2012 108
Total Phosphorus 3A High 2012 108
Colorado River West UT-L-14060007-004_00 Lower Gooseberry Reservoir Lower Gooseberry Reservoir 5 Not Supporting Total Phosphorus 3A Low 2010 64
Colorado River West UT-L-14070003-015_00 Mill Meadow Reservoir Mill Meadow Reservoir 5 Not Supporting pH 3A Low 2012 160
TMDL Approved Total Phosphorus 3A 1998 160
Colorado River West UT-L-14070005-011_00 Wide Hollow Reservoir Wide Hollow Reservoir 5 Not Supporting Dissolved Oxygen 3A Low 2010 156
pH 3A Low 2008 156
Temperature 3A Low 2008 156
Colorado River West UT-L-14060009-017_00 Joes Valley Reservoir Joes Valley Reservoir 3 Insufficient Data* 1,051
Colorado River West UT-L-14060009-024_00 Cleveland Reservoir Cleveland Reservoir 2
No Evidence of
Impairment 146
Colorado River West UT-L-14070003-018_00 Cook Lake Cook Lake 2
No Evidence of
Impairment 10
Colorado River West UT-L-14070003-027_00 Donkey Reservoir Donkey Reservoir 2
No Evidence of
Impairment 24
Colorado River West UT-L-14060009-004_00 Duck Fork Reservoir Duck Fork Reservoir 2
No Evidence of
Impairment 42
Colorado River West UT-L-14060009-025_00 Electric Lake Electric Lake 2
No Evidence of
Impairment 450
Colorado River West UT-L-14060007-001_00 Fairview Lakes Fairview Lakes 2
No Evidence of
Impairment 104
Colorado River West UT-L-14060009-001_00 Ferron Reservoir Ferron Reservoir 2
No Evidence of
Impairment 54
Colorado River West UT-L-14070003-006_00 Fish Lake Fish Lake 2
No Evidence of
Impairment 2,585
Colorado River West UT-L-14060009-034_00 Huntington Lake North Huntington Lake North 2
No Evidence of
Impairment 235
Colorado River West UT-L-14060009-018_00 Huntington Reservoir Huntington Reservoir 2
No Evidence of
Impairment 163
Colorado River West UT-L-14060009-023_00 Miller Flat Reservoir Miller Flat Reservoir 2
No Evidence of
Impairment 160
Colorado River West UT-L-14060009-026_00 Millsite Reservoir Millsite Reservoir 2
No Evidence of
Impairment 367
Colorado River West UT-L-14070005-008_00 Posy Lake Posy Lake 2
No Evidence of
Impairment 12
* Please refer to the 2012/2014 and 2016 IR data files for the sub-category 3 details.
** Big East Lake is also identified as having insufficient data with exceedances in the harmful algal bloom assessment 4 of 13
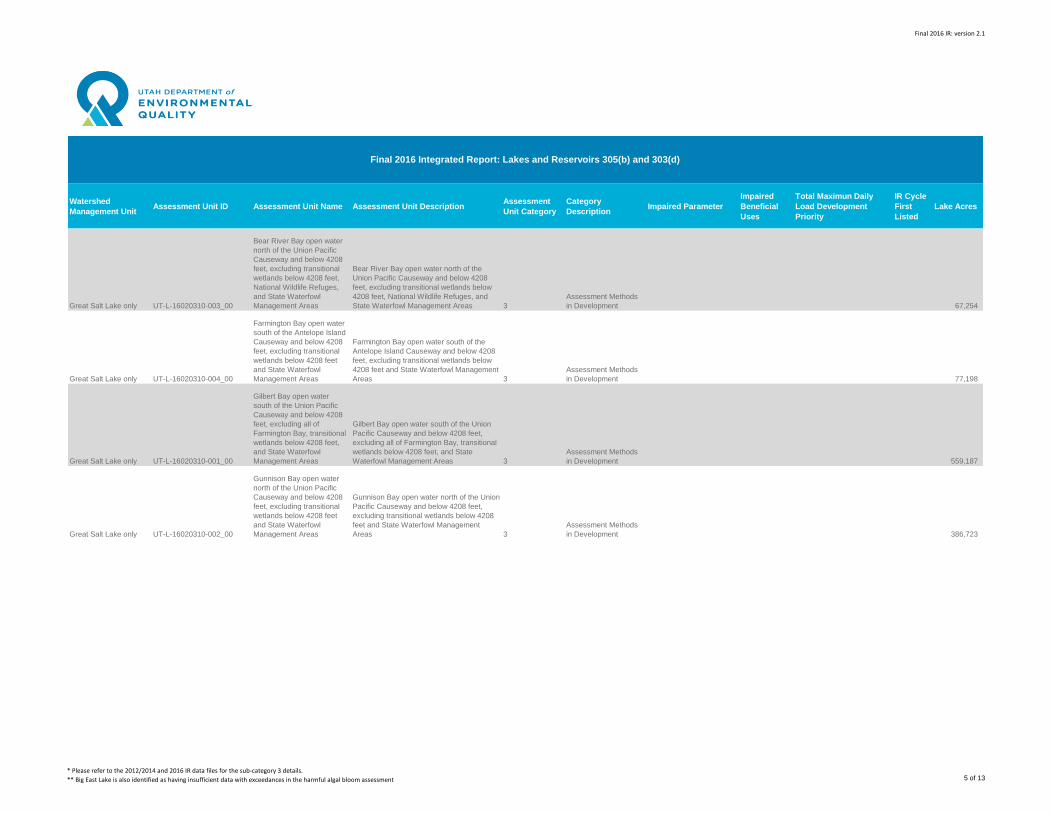
Final 2016 IR: version 2.1
Watershed
Management UnitAssessment Unit ID Assessment Unit Name Assessment Unit Description
Assessment
Unit Category
Category
DescriptionImpaired Parameter
Impaired
Beneficial
Uses
Total Maximun Daily
Load Development
Priority
IR Cycle
First
Listed
Lake Acres
Final 2016 Integrated Report: Lakes and Reservoirs 305(b) and 303(d)
Great Salt Lake only UT-L-16020310-003_00
Bear River Bay open water
north of the Union Pacific
Causeway and below 4208
feet, excluding transitional
wetlands below 4208 feet,
National Wildlife Refuges,
and State Waterfowl
Management Areas
Bear River Bay open water north of the
Union Pacific Causeway and below 4208
feet, excluding transitional wetlands below
4208 feet, National Wildlife Refuges, and
State Waterfowl Management Areas 3
Assessment Methods
in Development 67,254
Great Salt Lake only UT-L-16020310-004_00
Farmington Bay open water
south of the Antelope Island
Causeway and below 4208
feet, excluding transitional
wetlands below 4208 feet
and State Waterfowl
Management Areas
Farmington Bay open water south of the
Antelope Island Causeway and below 4208
feet, excluding transitional wetlands below
4208 feet and State Waterfowl Management
Areas 3
Assessment Methods
in Development 77,198
Great Salt Lake only UT-L-16020310-001_00
Gilbert Bay open water
south of the Union Pacific
Causeway and below 4208
feet, excluding all of
Farmington Bay, transitional
wetlands below 4208 feet,
and State Waterfowl
Management Areas
Gilbert Bay open water south of the Union
Pacific Causeway and below 4208 feet,
excluding all of Farmington Bay, transitional
wetlands below 4208 feet, and State
Waterfowl Management Areas 3
Assessment Methods
in Development 559,187
Great Salt Lake only UT-L-16020310-002_00
Gunnison Bay open water
north of the Union Pacific
Causeway and below 4208
feet, excluding transitional
wetlands below 4208 feet
and State Waterfowl
Management Areas
Gunnison Bay open water north of the Union
Pacific Causeway and below 4208 feet,
excluding transitional wetlands below 4208
feet and State Waterfowl Management
Areas 3
Assessment Methods
in Development 386,723
* Please refer to the 2012/2014 and 2016 IR data files for the sub-category 3 details.
** Big East Lake is also identified as having insufficient data with exceedances in the harmful algal bloom assessment 5 of 13
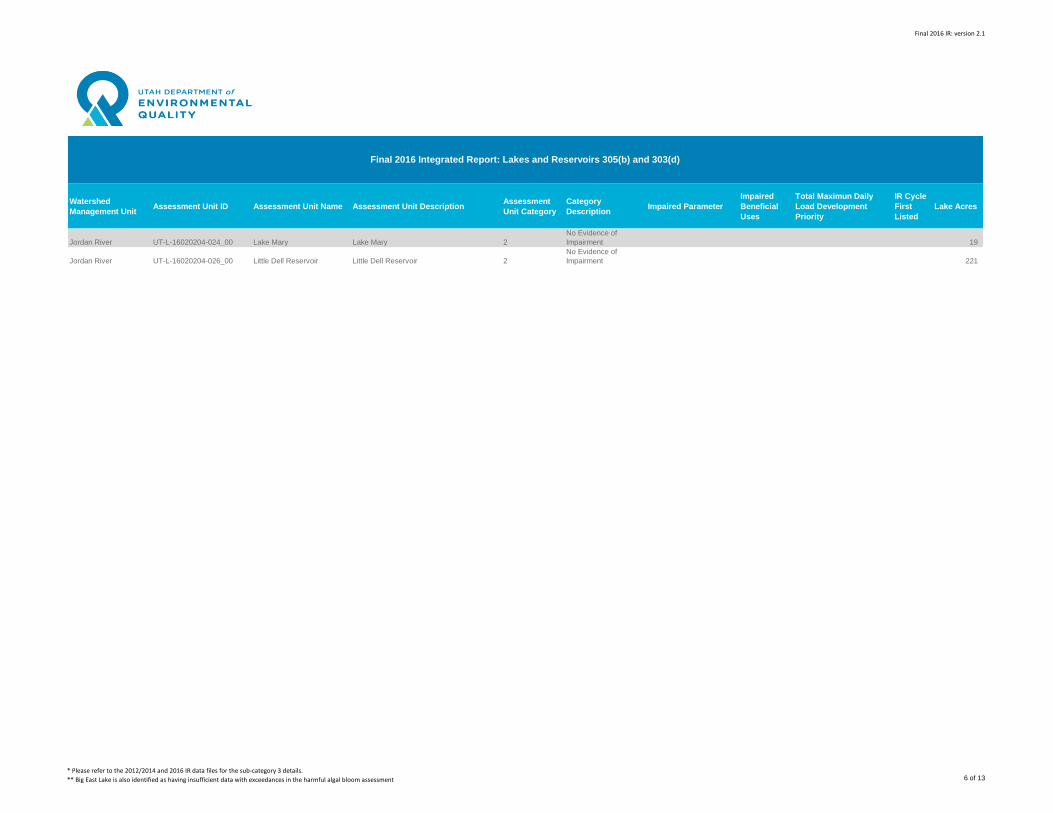
Final 2016 IR: version 2.1
Watershed
Management UnitAssessment Unit ID Assessment Unit Name Assessment Unit Description
Assessment
Unit Category
Category
DescriptionImpaired Parameter
Impaired
Beneficial
Uses
Total Maximun Daily
Load Development
Priority
IR Cycle
First
Listed
Lake Acres
Final 2016 Integrated Report: Lakes and Reservoirs 305(b) and 303(d)
Jordan River UT-L-16020204-024_00 Lake Mary Lake Mary 2
No Evidence of
Impairment 19
Jordan River UT-L-16020204-026_00 Little Dell Reservoir Little Dell Reservoir 2
No Evidence of
Impairment 221
* Please refer to the 2012/2014 and 2016 IR data files for the sub-category 3 details.
** Big East Lake is also identified as having insufficient data with exceedances in the harmful algal bloom assessment 6 of 13
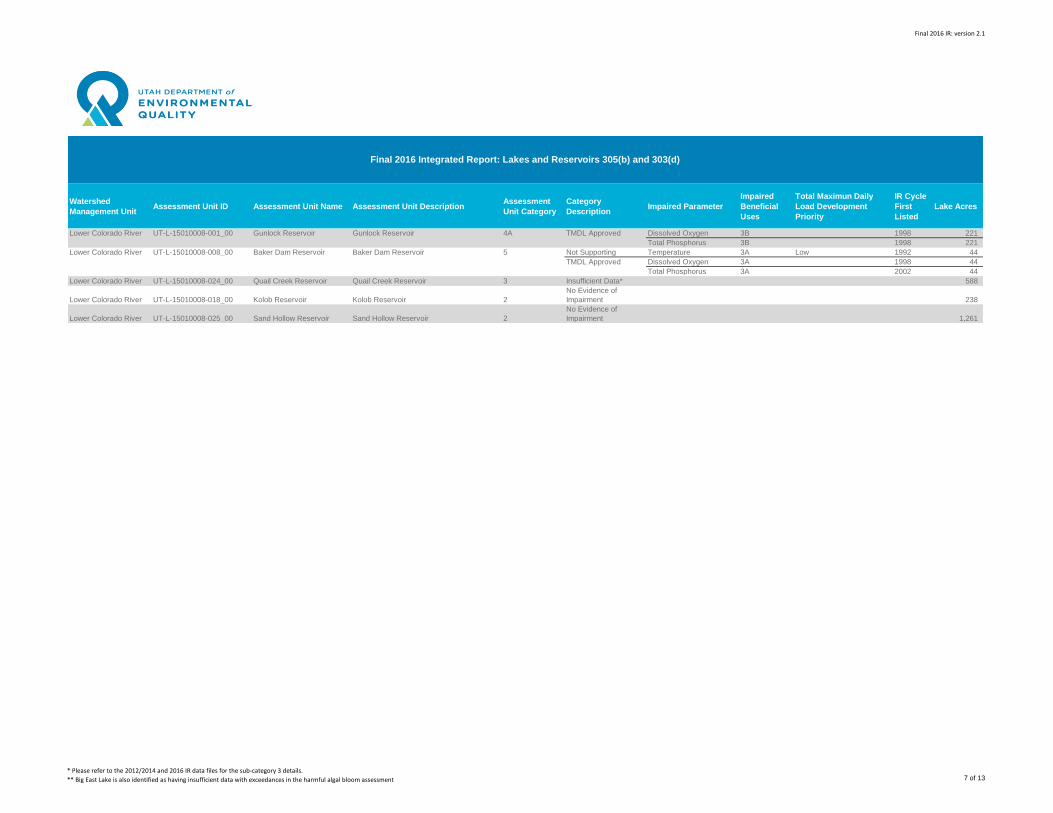
Final 2016 IR: version 2.1
Watershed
Management UnitAssessment Unit ID Assessment Unit Name Assessment Unit Description
Assessment
Unit Category
Category
DescriptionImpaired Parameter
Impaired
Beneficial
Uses
Total Maximun Daily
Load Development
Priority
IR Cycle
First
Listed
Lake Acres
Final 2016 Integrated Report: Lakes and Reservoirs 305(b) and 303(d)
Lower Colorado River UT-L-15010008-001_00 Gunlock Reservoir Gunlock Reservoir 4A TMDL Approved Dissolved Oxygen 3B 1998 221
Total Phosphorus 3B 1998 221
Lower Colorado River UT-L-15010008-008_00 Baker Dam Reservoir Baker Dam Reservoir 5 Not Supporting Temperature 3A Low 1992 44
TMDL Approved Dissolved Oxygen 3A 1998 44
Total Phosphorus 3A 2002 44
Lower Colorado River UT-L-15010008-024_00 Quail Creek Reservoir Quail Creek Reservoir 3 Insufficient Data* 588
Lower Colorado River UT-L-15010008-018_00 Kolob Reservoir Kolob Reservoir 2
No Evidence of
Impairment 238
Lower Colorado River UT-L-15010008-025_00 Sand Hollow Reservoir Sand Hollow Reservoir 2
No Evidence of
Impairment 1,261
* Please refer to the 2012/2014 and 2016 IR data files for the sub-category 3 details.
** Big East Lake is also identified as having insufficient data with exceedances in the harmful algal bloom assessment 7 of 13
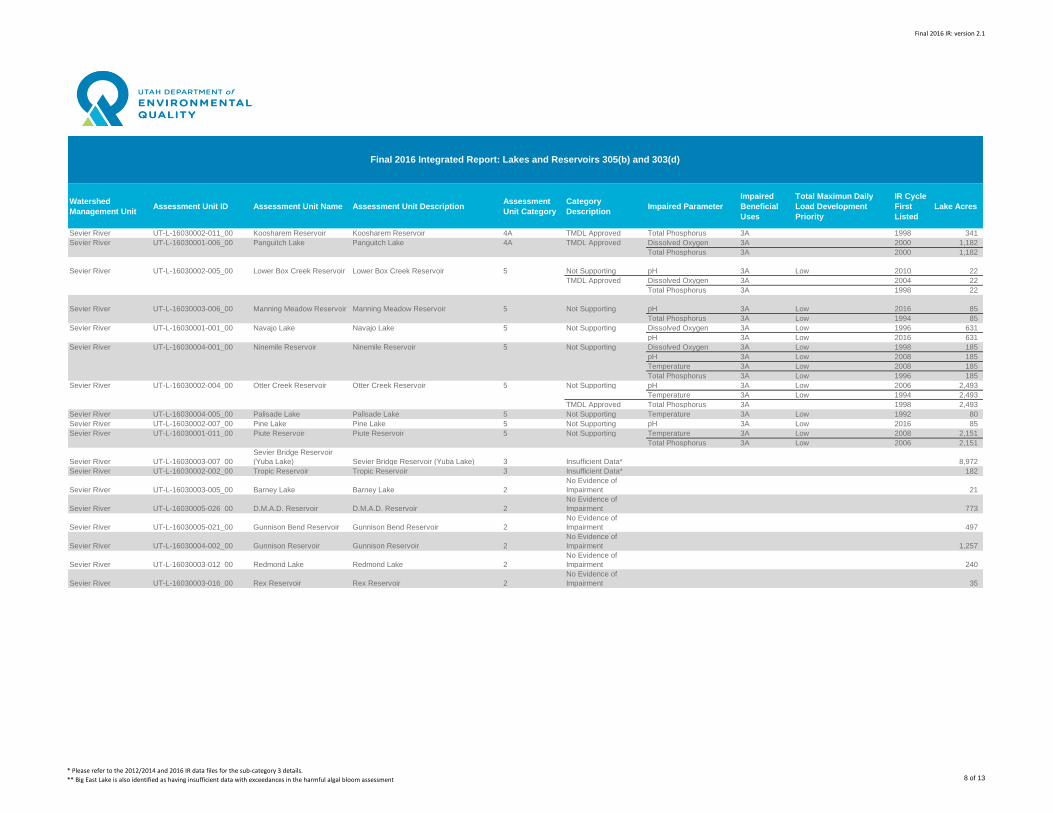
Final 2016 IR: version 2.1
Watershed
Management UnitAssessment Unit ID Assessment Unit Name Assessment Unit Description
Assessment
Unit Category
Category
DescriptionImpaired Parameter
Impaired
Beneficial
Uses
Total Maximun Daily
Load Development
Priority
IR Cycle
First
Listed
Lake Acres
Final 2016 Integrated Report: Lakes and Reservoirs 305(b) and 303(d)
Sevier River UT-L-16030002-011_00 Koosharem Reservoir Koosharem Reservoir 4A TMDL Approved Total Phosphorus 3A 1998 341
Sevier River UT-L-16030001-006_00 Panguitch Lake Panguitch Lake 4A TMDL Approved Dissolved Oxygen 3A 2000 1,182
Total Phosphorus 3A 2000 1,182
Sevier River UT-L-16030002-005_00 Lower Box Creek Reservoir Lower Box Creek Reservoir 5 Not Supporting pH 3A Low 2010 22
TMDL Approved Dissolved Oxygen 3A 2004 22
Total Phosphorus 3A 1998 22
Sevier River UT-L-16030003-006_00 Manning Meadow Reservoir Manning Meadow Reservoir 5 Not Supporting pH 3A Low 2016 85
Total Phosphorus 3A Low 1994 85
Sevier River UT-L-16030001-001_00 Navajo Lake Navajo Lake 5 Not Supporting Dissolved Oxygen 3A Low 1996 631
pH 3A Low 2016 631
Sevier River UT-L-16030004-001_00 Ninemile Reservoir Ninemile Reservoir 5 Not Supporting Dissolved Oxygen 3A Low 1998 185
pH 3A Low 2008 185
Temperature 3A Low 2008 185
Total Phosphorus 3A Low 1996 185
Sevier River UT-L-16030002-004_00 Otter Creek Reservoir Otter Creek Reservoir 5 Not Supporting pH 3A Low 2006 2,493
Temperature 3A Low 1994 2,493
TMDL Approved Total Phosphorus 3A 1998 2,493
Sevier River UT-L-16030004-005_00 Palisade Lake Palisade Lake 5 Not Supporting Temperature 3A Low 1992 80
Sevier River UT-L-16030002-007_00 Pine Lake Pine Lake 5 Not Supporting pH 3A Low 2016 85
Sevier River UT-L-16030001-011_00 Piute Reservoir Piute Reservoir 5 Not Supporting Temperature 3A Low 2008 2,151
Total Phosphorus 3A Low 2006 2,151
Sevier River UT-L-16030003-007_00
Sevier Bridge Reservoir
(Yuba Lake) Sevier Bridge Reservoir (Yuba Lake) 3 Insufficient Data* 8,972
Sevier River UT-L-16030002-002_00 Tropic Reservoir Tropic Reservoir 3 Insufficient Data* 182
Sevier River UT-L-16030003-005_00 Barney Lake Barney Lake 2
No Evidence of
Impairment 21
Sevier River UT-L-16030005-026_00 D.M.A.D. Reservoir D.M.A.D. Reservoir 2
No Evidence of
Impairment 773
Sevier River UT-L-16030005-021_00 Gunnison Bend Reservoir Gunnison Bend Reservoir 2
No Evidence of
Impairment 497
Sevier River UT-L-16030004-002_00 Gunnison Reservoir Gunnison Reservoir 2
No Evidence of
Impairment 1,257
Sevier River UT-L-16030003-012_00 Redmond Lake Redmond Lake 2
No Evidence of
Impairment 240
Sevier River UT-L-16030003-016_00 Rex Reservoir Rex Reservoir 2
No Evidence of
Impairment 35
* Please refer to the 2012/2014 and 2016 IR data files for the sub-category 3 details.
** Big East Lake is also identified as having insufficient data with exceedances in the harmful algal bloom assessment 8 of 13
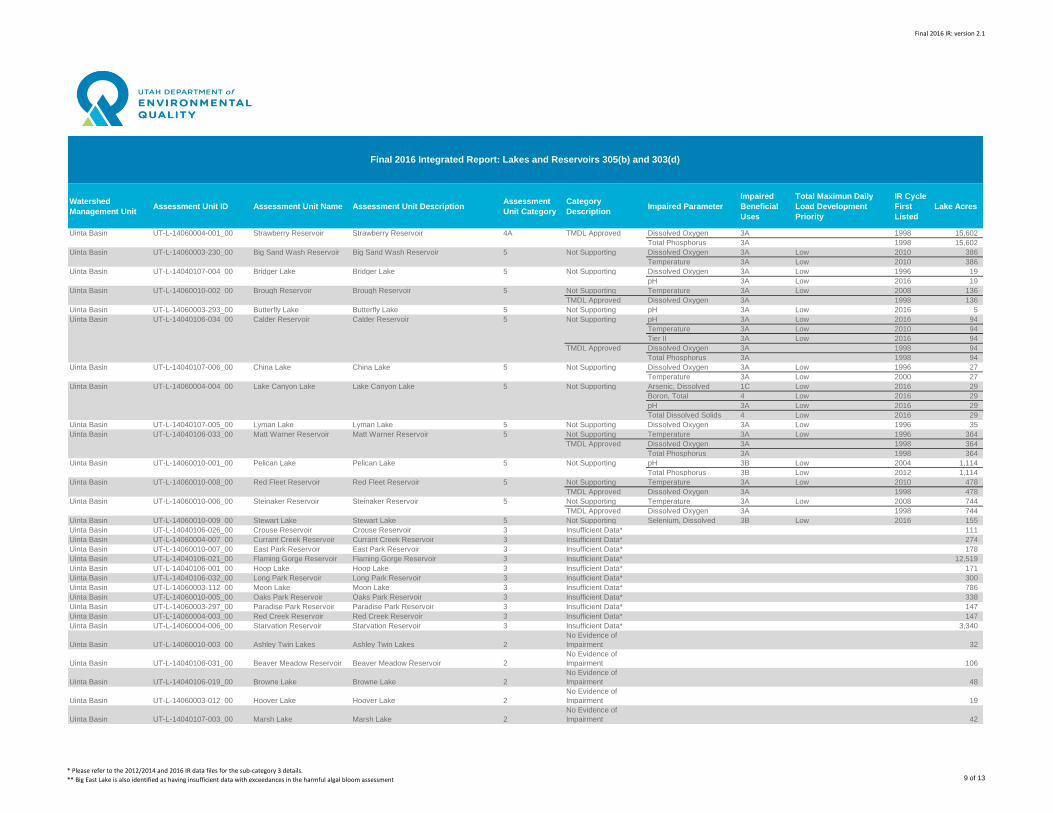
Final 2016 IR: version 2.1
Watershed
Management UnitAssessment Unit ID Assessment Unit Name Assessment Unit Description
Assessment
Unit Category
Category
DescriptionImpaired Parameter
Impaired
Beneficial
Uses
Total Maximun Daily
Load Development
Priority
IR Cycle
First
Listed
Lake Acres
Final 2016 Integrated Report: Lakes and Reservoirs 305(b) and 303(d)
Uinta Basin UT-L-14060004-001_00 Strawberry Reservoir Strawberry Reservoir 4A TMDL Approved Dissolved Oxygen 3A 1998 15,602
Total Phosphorus 3A 1998 15,602
Uinta Basin UT-L-14060003-230_00 Big Sand Wash Reservoir Big Sand Wash Reservoir 5 Not Supporting Dissolved Oxygen 3A Low 2010 386
Temperature 3A Low 2010 386
Uinta Basin UT-L-14040107-004_00 Bridger Lake Bridger Lake 5 Not Supporting Dissolved Oxygen 3A Low 1996 19
pH 3A Low 2016 19
Uinta Basin UT-L-14060010-002_00 Brough Reservoir Brough Reservoir 5 Not Supporting Temperature 3A Low 2008 136
TMDL Approved Dissolved Oxygen 3A 1998 136
Uinta Basin UT-L-14060003-293_00 Butterfly Lake Butterfly Lake 5 Not Supporting pH 3A Low 2016 5
Uinta Basin UT-L-14040106-034_00 Calder Reservoir Calder Reservoir 5 Not Supporting pH 3A Low 2016 94
Temperature 3A Low 2010 94
Tier II 3A Low 2016 94
TMDL Approved Dissolved Oxygen 3A 1998 94
Total Phosphorus 3A 1998 94
Uinta Basin UT-L-14040107-006_00 China Lake China Lake 5 Not Supporting Dissolved Oxygen 3A Low 1996 27
Temperature 3A Low 2000 27
Uinta Basin UT-L-14060004-004_00 Lake Canyon Lake Lake Canyon Lake 5 Not Supporting Arsenic, Dissolved 1C Low 2016 29
Boron, Total 4 Low 2016 29
pH 3A Low 2016 29
Total Dissolved Solids 4 Low 2016 29
Uinta Basin UT-L-14040107-005_00 Lyman Lake Lyman Lake 5 Not Supporting Dissolved Oxygen 3A Low 1996 35
Uinta Basin UT-L-14040106-033_00 Matt Warner Reservoir Matt Warner Reservoir 5 Not Supporting Temperature 3A Low 1996 364
TMDL Approved Dissolved Oxygen 3A 1998 364
Total Phosphorus 3A 1998 364
Uinta Basin UT-L-14060010-001_00 Pelican Lake Pelican Lake 5 Not Supporting pH 3B Low 2004 1,114
Total Phosphorus 3B Low 2012 1,114
Uinta Basin UT-L-14060010-008_00 Red Fleet Reservoir Red Fleet Reservoir 5 Not Supporting Temperature 3A Low 2010 478
TMDL Approved Dissolved Oxygen 3A 1998 478
Uinta Basin UT-L-14060010-006_00 Steinaker Reservoir Steinaker Reservoir 5 Not Supporting Temperature 3A Low 2008 744
TMDL Approved Dissolved Oxygen 3A 1998 744
Uinta Basin UT-L-14060010-009_00 Stewart Lake Stewart Lake 5 Not Supporting Selenium, Dissolved 3B Low 2016 155
Uinta Basin UT-L-14040106-026_00 Crouse Reservoir Crouse Reservoir 3 Insufficient Data* 111
Uinta Basin UT-L-14060004-007_00 Currant Creek Reservoir Currant Creek Reservoir 3 Insufficient Data* 274
Uinta Basin UT-L-14060010-007_00 East Park Reservoir East Park Reservoir 3 Insufficient Data* 178
Uinta Basin UT-L-14040106-021_00 Flaming Gorge Reservoir Flaming Gorge Reservoir 3 Insufficient Data* 12,519
Uinta Basin UT-L-14040106-001_00 Hoop Lake Hoop Lake 3 Insufficient Data* 171
Uinta Basin UT-L-14040106-032_00 Long Park Reservoir Long Park Reservoir 3 Insufficient Data* 300
Uinta Basin UT-L-14060003-112_00 Moon Lake Moon Lake 3 Insufficient Data* 786
Uinta Basin UT-L-14060010-005_00 Oaks Park Reservoir Oaks Park Reservoir 3 Insufficient Data* 338
Uinta Basin UT-L-14060003-297_00 Paradise Park Reservoir Paradise Park Reservoir 3 Insufficient Data* 147
Uinta Basin UT-L-14060004-003_00 Red Creek Reservoir Red Creek Reservoir 3 Insufficient Data* 147
Uinta Basin UT-L-14060004-006_00 Starvation Reservoir Starvation Reservoir 3 Insufficient Data* 3,340
Uinta Basin UT-L-14060010-003_00 Ashley Twin Lakes Ashley Twin Lakes 2
No Evidence of
Impairment 32
Uinta Basin UT-L-14040106-031_00 Beaver Meadow Reservoir Beaver Meadow Reservoir 2
No Evidence of
Impairment 106
Uinta Basin UT-L-14040106-019_00 Browne Lake Browne Lake 2
No Evidence of
Impairment 48
Uinta Basin UT-L-14060003-012_00 Hoover Lake Hoover Lake 2
No Evidence of
Impairment 19
Uinta Basin UT-L-14040107-003_00 Marsh Lake Marsh Lake 2
No Evidence of
Impairment 42
* Please refer to the 2012/2014 and 2016 IR data files for the sub-category 3 details.
** Big East Lake is also identified as having insufficient data with exceedances in the harmful algal bloom assessment 9 of 13
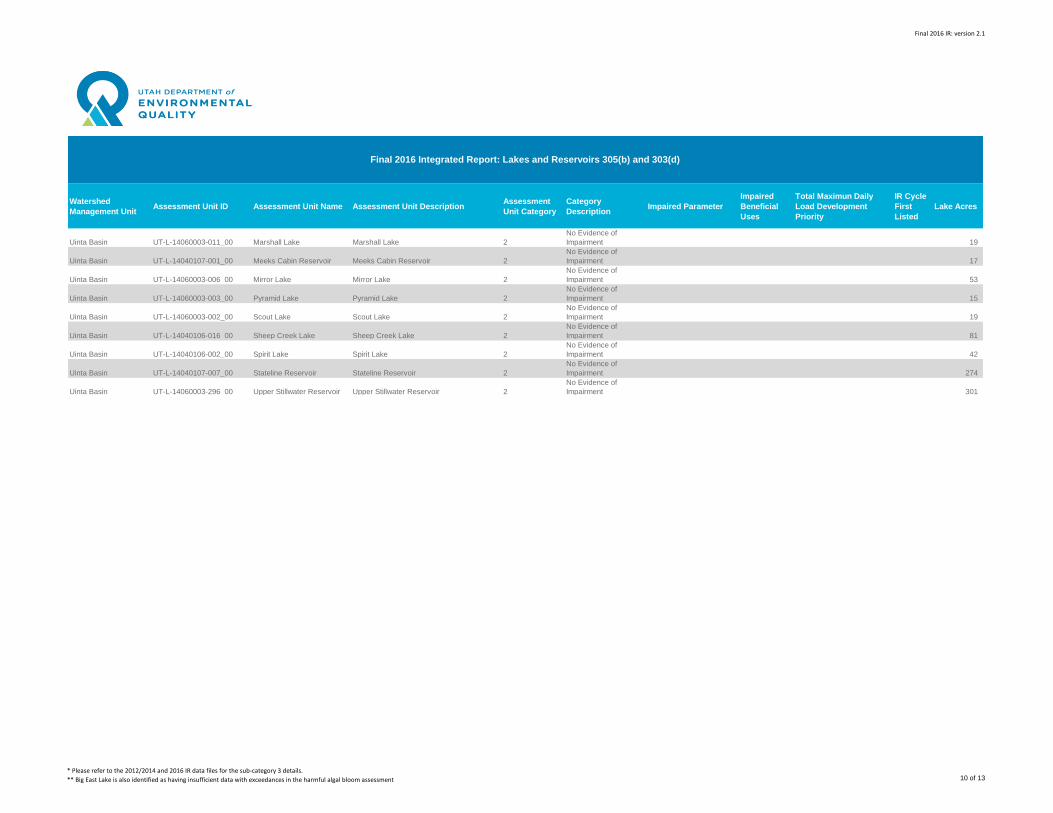
Final 2016 IR: version 2.1
Watershed
Management UnitAssessment Unit ID Assessment Unit Name Assessment Unit Description
Assessment
Unit Category
Category
DescriptionImpaired Parameter
Impaired
Beneficial
Uses
Total Maximun Daily
Load Development
Priority
IR Cycle
First
Listed
Lake Acres
Final 2016 Integrated Report: Lakes and Reservoirs 305(b) and 303(d)
Uinta Basin UT-L-14060003-011_00 Marshall Lake Marshall Lake 2
No Evidence of
Impairment 19
Uinta Basin UT-L-14040107-001_00 Meeks Cabin Reservoir Meeks Cabin Reservoir 2
No Evidence of
Impairment 17
Uinta Basin UT-L-14060003-006_00 Mirror Lake Mirror Lake 2
No Evidence of
Impairment 53
Uinta Basin UT-L-14060003-003_00 Pyramid Lake Pyramid Lake 2
No Evidence of
Impairment 15
Uinta Basin UT-L-14060003-002_00 Scout Lake Scout Lake 2
No Evidence of
Impairment 19
Uinta Basin UT-L-14040106-016_00 Sheep Creek Lake Sheep Creek Lake 2
No Evidence of
Impairment 81
Uinta Basin UT-L-14040106-002_00 Spirit Lake Spirit Lake 2
No Evidence of
Impairment 42
Uinta Basin UT-L-14040107-007_00 Stateline Reservoir Stateline Reservoir 2
No Evidence of
Impairment 274
Uinta Basin UT-L-14060003-296_00 Upper Stillwater Reservoir Upper Stillwater Reservoir 2
No Evidence of
Impairment 301
* Please refer to the 2012/2014 and 2016 IR data files for the sub-category 3 details.
** Big East Lake is also identified as having insufficient data with exceedances in the harmful algal bloom assessment 10 of 13
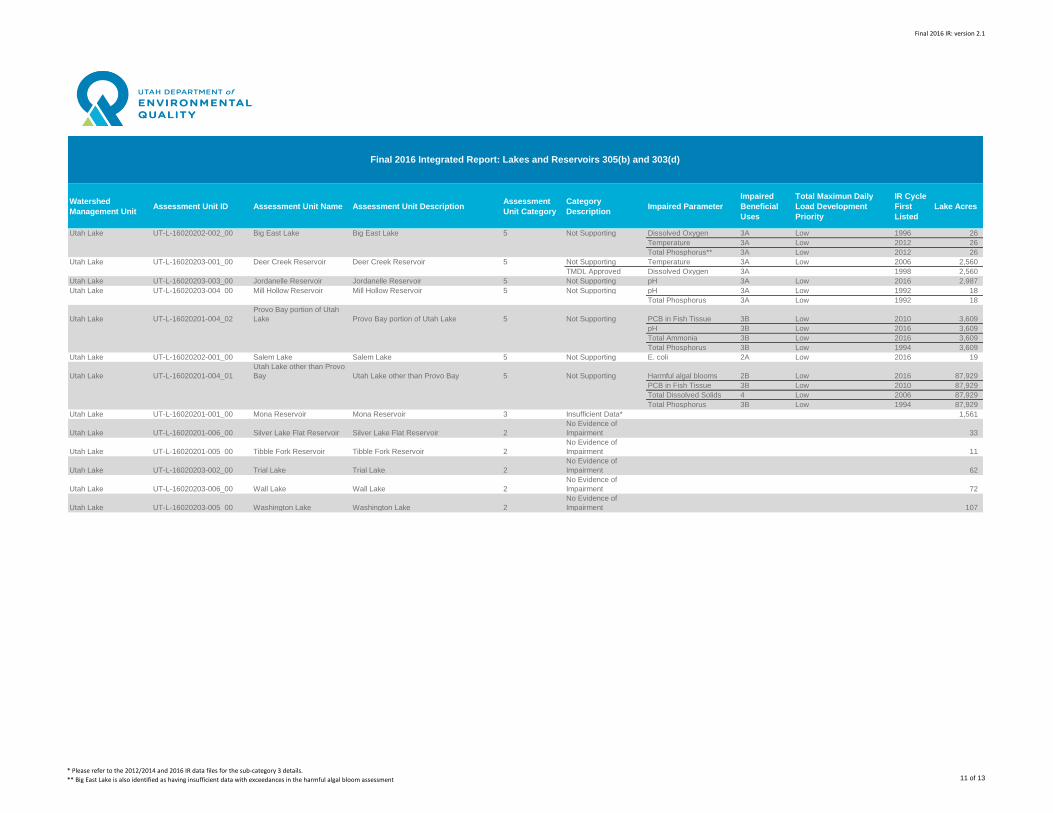
Final 2016 IR: version 2.1
Watershed
Management UnitAssessment Unit ID Assessment Unit Name Assessment Unit Description
Assessment
Unit Category
Category
DescriptionImpaired Parameter
Impaired
Beneficial
Uses
Total Maximun Daily
Load Development
Priority
IR Cycle
First
Listed
Lake Acres
Final 2016 Integrated Report: Lakes and Reservoirs 305(b) and 303(d)
Utah Lake UT-L-16020202-002_00 Big East Lake Big East Lake 5 Not Supporting Dissolved Oxygen 3A Low 1996 26
Temperature 3A Low 2012 26
Total Phosphorus** 3A Low 2012 26
Utah Lake UT-L-16020203-001_00 Deer Creek Reservoir Deer Creek Reservoir 5 Not Supporting Temperature 3A Low 2006 2,560
TMDL Approved Dissolved Oxygen 3A 1998 2,560
Utah Lake UT-L-16020203-003_00 Jordanelle Reservoir Jordanelle Reservoir 5 Not Supporting pH 3A Low 2016 2,987
Utah Lake UT-L-16020203-004_00 Mill Hollow Reservoir Mill Hollow Reservoir 5 Not Supporting pH 3A Low 1992 18
Total Phosphorus 3A Low 1992 18
Utah Lake UT-L-16020201-004_02
Provo Bay portion of Utah
Lake Provo Bay portion of Utah Lake 5 Not Supporting PCB in Fish Tissue 3B Low 2010 3,609
pH 3B Low 2016 3,609
Total Ammonia 3B Low 2016 3,609
Total Phosphorus 3B Low 1994 3,609
Utah Lake UT-L-16020202-001_00 Salem Lake Salem Lake 5 Not Supporting E. coli 2A Low 2016 19
Utah Lake UT-L-16020201-004_01
Utah Lake other than Provo
Bay Utah Lake other than Provo Bay 5 Not Supporting Harmful algal blooms 2B Low 2016 87,929
PCB in Fish Tissue 3B Low 2010 87,929
Total Dissolved Solids 4 Low 2006 87,929
Total Phosphorus 3B Low 1994 87,929
Utah Lake UT-L-16020201-001_00 Mona Reservoir Mona Reservoir 3 Insufficient Data* 1,561
Utah Lake UT-L-16020201-006_00 Silver Lake Flat Reservoir Silver Lake Flat Reservoir 2
No Evidence of
Impairment 33
Utah Lake UT-L-16020201-005_00 Tibble Fork Reservoir Tibble Fork Reservoir 2
No Evidence of
Impairment 11
Utah Lake UT-L-16020203-002_00 Trial Lake Trial Lake 2
No Evidence of
Impairment 62
Utah Lake UT-L-16020203-006_00 Wall Lake Wall Lake 2
No Evidence of
Impairment 72
Utah Lake UT-L-16020203-005_00 Washington Lake Washington Lake 2
No Evidence of
Impairment 107
* Please refer to the 2012/2014 and 2016 IR data files for the sub-category 3 details.
** Big East Lake is also identified as having insufficient data with exceedances in the harmful algal bloom assessment 11 of 13
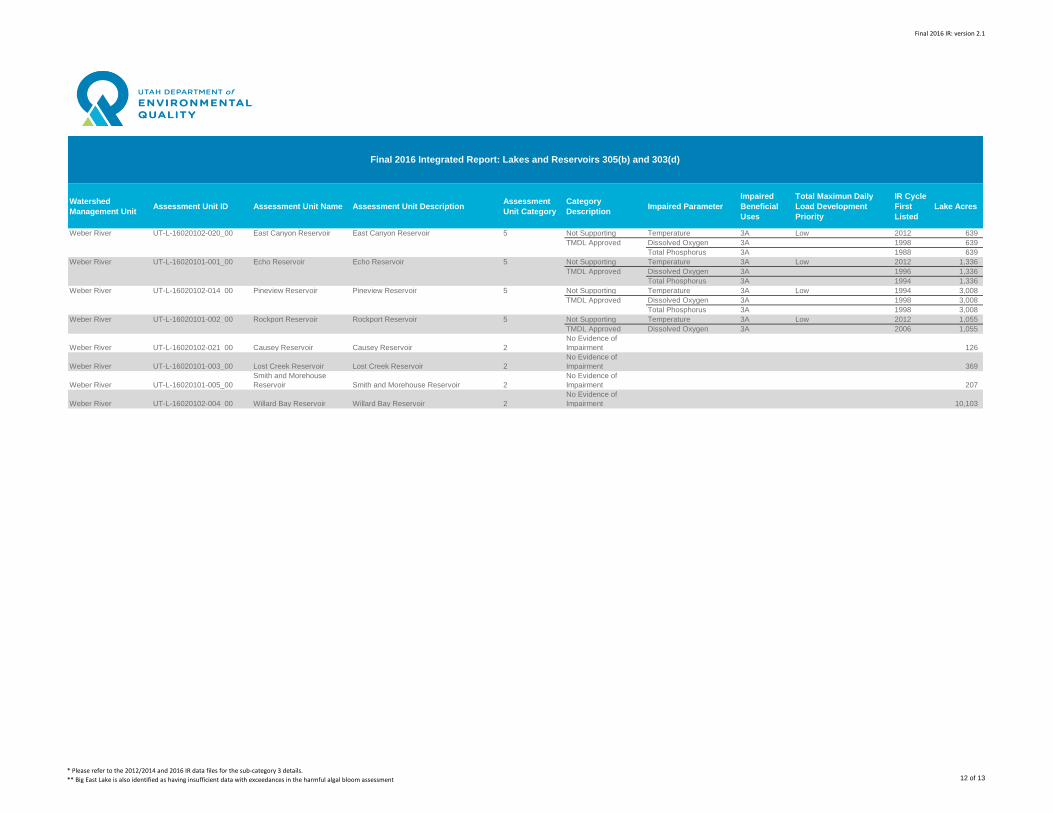
Final 2016 IR: version 2.1
Watershed
Management UnitAssessment Unit ID Assessment Unit Name Assessment Unit Description
Assessment
Unit Category
Category
DescriptionImpaired Parameter
Impaired
Beneficial
Uses
Total Maximun Daily
Load Development
Priority
IR Cycle
First
Listed
Lake Acres
Final 2016 Integrated Report: Lakes and Reservoirs 305(b) and 303(d)
Weber River UT-L-16020102-020_00 East Canyon Reservoir East Canyon Reservoir 5 Not Supporting Temperature 3A Low 2012 639
TMDL Approved Dissolved Oxygen 3A 1998 639
Total Phosphorus 3A 1988 639
Weber River UT-L-16020101-001_00 Echo Reservoir Echo Reservoir 5 Not Supporting Temperature 3A Low 2012 1,336
TMDL Approved Dissolved Oxygen 3A 1996 1,336
Total Phosphorus 3A 1994 1,336
Weber River UT-L-16020102-014_00 Pineview Reservoir Pineview Reservoir 5 Not Supporting Temperature 3A Low 1994 3,008
TMDL Approved Dissolved Oxygen 3A 1998 3,008
Total Phosphorus 3A 1998 3,008
Weber River UT-L-16020101-002_00 Rockport Reservoir Rockport Reservoir 5 Not Supporting Temperature 3A Low 2012 1,055
TMDL Approved Dissolved Oxygen 3A 2006 1,055
Weber River UT-L-16020102-021_00 Causey Reservoir Causey Reservoir 2
No Evidence of
Impairment 126
Weber River UT-L-16020101-003_00 Lost Creek Reservoir Lost Creek Reservoir 2
No Evidence of
Impairment 369
Weber River UT-L-16020101-005_00
Smith and Morehouse
Reservoir Smith and Morehouse Reservoir 2
No Evidence of
Impairment 207
Weber River UT-L-16020102-004_00 Willard Bay Reservoir Willard Bay Reservoir 2
No Evidence of
Impairment 10,103
* Please refer to the 2012/2014 and 2016 IR data files for the sub-category 3 details.
** Big East Lake is also identified as having insufficient data with exceedances in the harmful algal bloom assessment 12 of 13
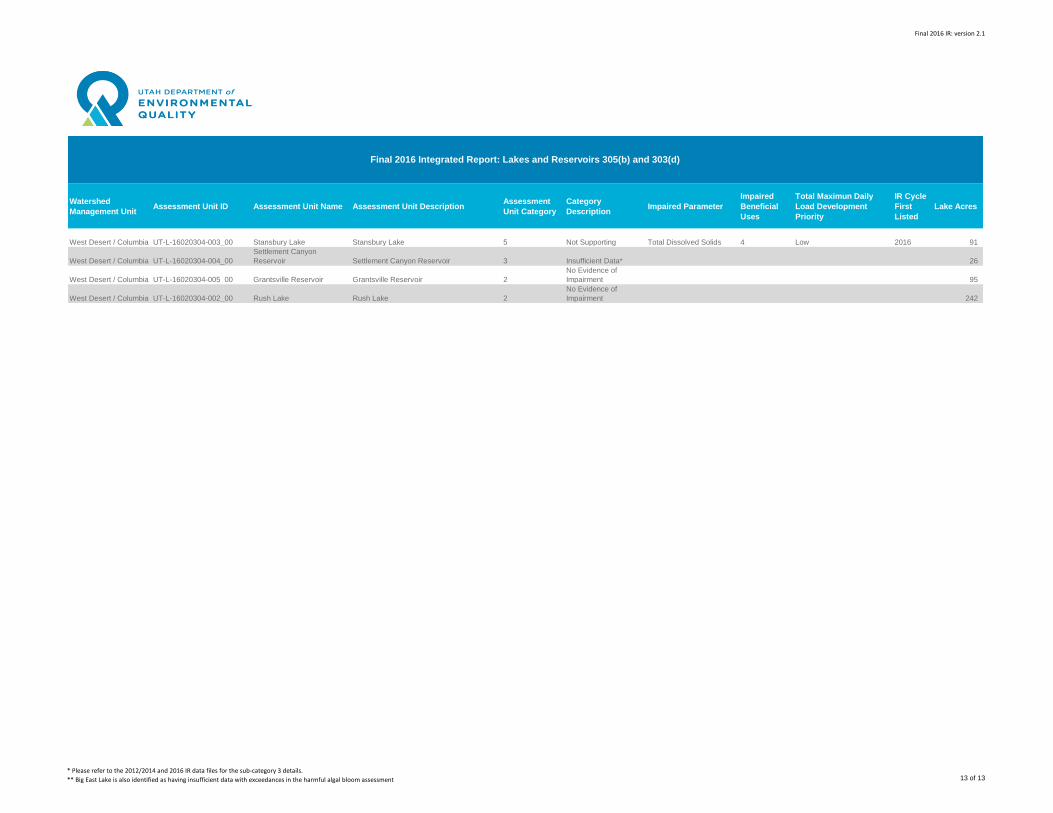
Final 2016 IR: version 2.1
Watershed
Management UnitAssessment Unit ID Assessment Unit Name Assessment Unit Description
Assessment
Unit Category
Category
DescriptionImpaired Parameter
Impaired
Beneficial
Uses
Total Maximun Daily
Load Development
Priority
IR Cycle
First
Listed
Lake Acres
Final 2016 Integrated Report: Lakes and Reservoirs 305(b) and 303(d)
West Desert / Columbia UT-L-16020304-003_00 Stansbury Lake Stansbury Lake 5 Not Supporting Total Dissolved Solids 4 Low 2016 91
West Desert / Columbia UT-L-16020304-004_00
Settlement Canyon
Reservoir Settlement Canyon Reservoir 3 Insufficient Data* 26
West Desert / Columbia UT-L-16020304-005_00 Grantsville Reservoir Grantsville Reservoir 2
No Evidence of
Impairment 95
West Desert / Columbia UT-L-16020304-002_00 Rush Lake Rush Lake 2
No Evidence of
Impairment 242
* Please refer to the 2012/2014 and 2016 IR data files for the sub-category 3 details.
** Big East Lake is also identified as having insufficient data with exceedances in the harmful algal bloom assessment 13 of 13
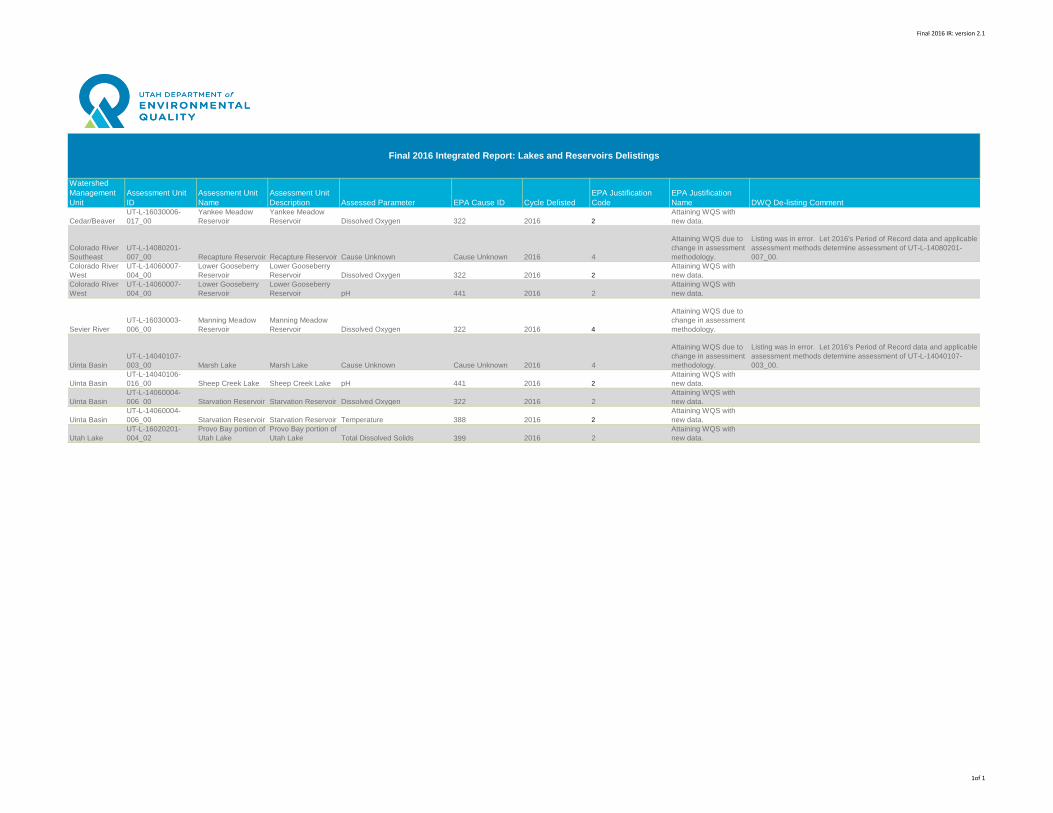
Final 2016 IR: version 2.1
Watershed
Management
Unit
Assessment Unit
ID
Assessment Unit
Name
Assessment Unit
Description Assessed Parameter EPA Cause ID Cycle Delisted
EPA Justification
Code
EPA Justification
Name DWQ De-listing Comment
Cedar/Beaver
UT-L-16030006-
017_00
Yankee Meadow
Reservoir
Yankee Meadow
Reservoir Dissolved Oxygen 322 2016 2
Attaining WQS with
new data.
Colorado River
Southeast
UT-L-14080201-
007_00 Recapture Reservoir Recapture Reservoir Cause Unknown Cause Unknown 2016 4
Attaining WQS due to
change in assessment
methodology.
Listing was in error. Let 2016's Period of Record data and applicable
assessment methods determine assessment of UT-L-14080201-
007_00.
Colorado River
West
UT-L-14060007-
004_00
Lower Gooseberry
Reservoir
Lower Gooseberry
Reservoir Dissolved Oxygen 322 2016 2
Attaining WQS with
new data.
Colorado River
West
UT-L-14060007-
004_00
Lower Gooseberry
Reservoir
Lower Gooseberry
Reservoir pH 441 2016 2
Attaining WQS with
new data.
Sevier River
UT-L-16030003-
006_00
Manning Meadow
Reservoir
Manning Meadow
Reservoir Dissolved Oxygen 322 2016 4
Attaining WQS due to
change in assessment
methodology.
Uinta Basin
UT-L-14040107-
003_00 Marsh Lake Marsh Lake Cause Unknown Cause Unknown 2016 4
Attaining WQS due to
change in assessment
methodology.
Listing was in error. Let 2016's Period of Record data and applicable
assessment methods determine assessment of UT-L-14040107-
003_00.
Uinta Basin
UT-L-14040106-
016_00 Sheep Creek Lake Sheep Creek Lake pH 441 2016 2
Attaining WQS with
new data.
Uinta Basin
UT-L-14060004-
006_00 Starvation Reservoir Starvation Reservoir Dissolved Oxygen 322 2016 2
Attaining WQS with
new data.
Uinta Basin
UT-L-14060004-
006_00 Starvation Reservoir Starvation Reservoir Temperature 388 2016 2
Attaining WQS with
new data.
Utah Lake
UT-L-16020201-
004_02
Provo Bay portion of
Utah Lake
Provo Bay portion of
Utah Lake Total Dissolved Solids 399 2016 2
Attaining WQS with
new data.
Final 2016 Integrated Report: Lakes and Reservoirs Delistings
1of 1
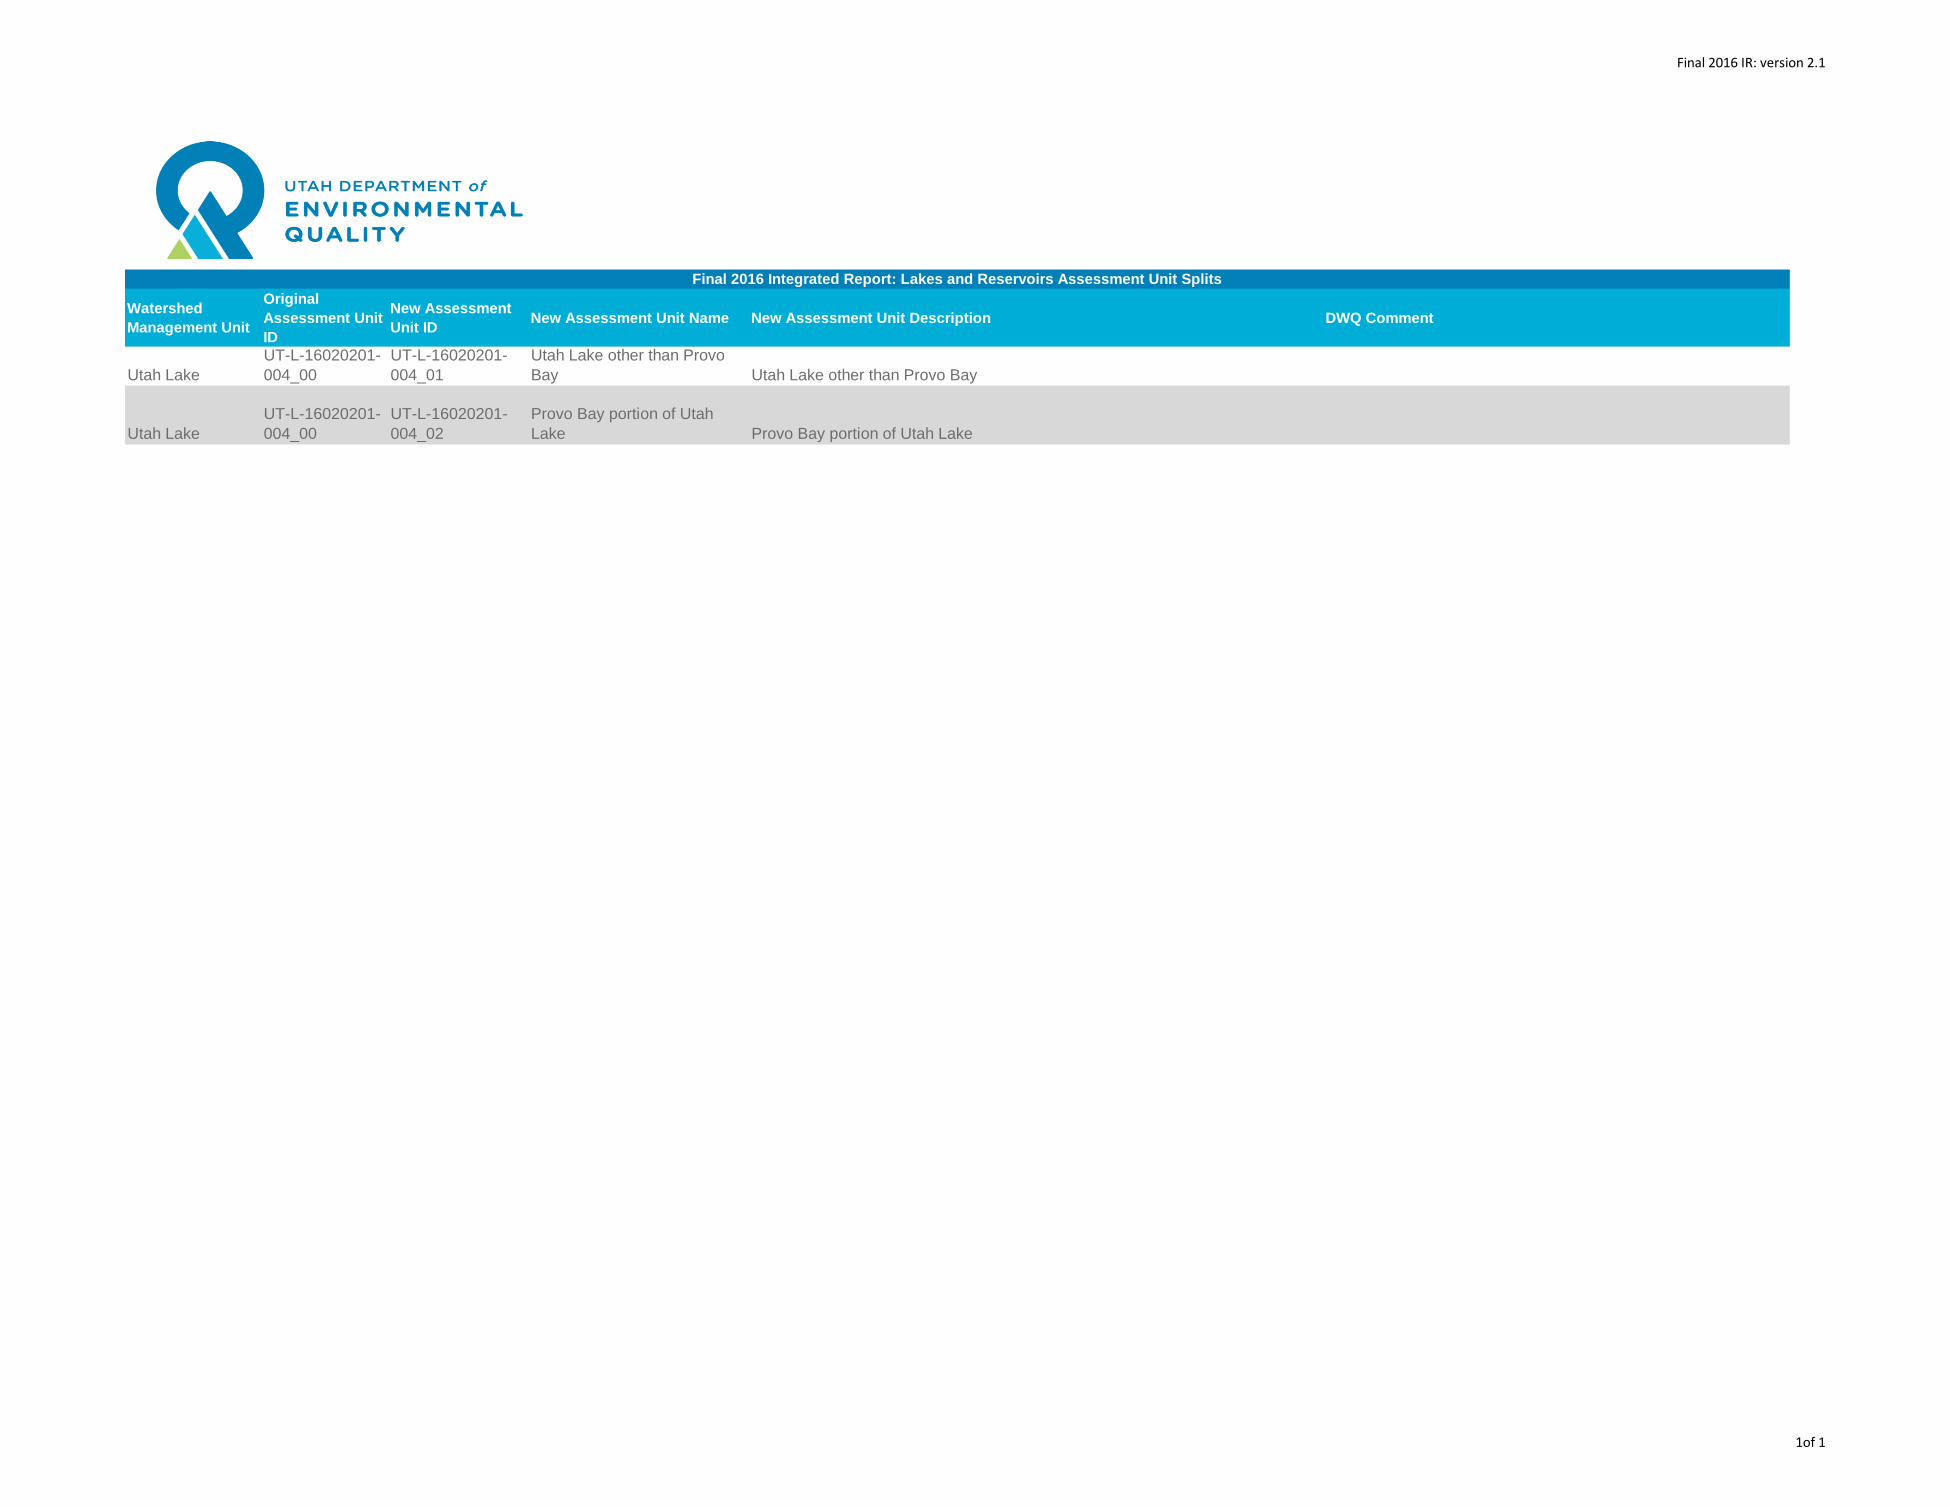
Final 2016 IR: version 2.1
Watershed
Management Unit
Original
Assessment Unit
ID
New Assessment
Unit IDNew Assessment Unit Name New Assessment Unit Description DWQ Comment
Utah Lake
UT-L-16020201-
004_00
UT-L-16020201-
004_01
Utah Lake other than Provo
Bay Utah Lake other than Provo Bay
Utah Lake
UT-L-16020201-
004_00
UT-L-16020201-
004_02
Provo Bay portion of Utah
Lake Provo Bay portion of Utah Lake
Final 2016 Integrated Report: Lakes and Reservoirs Assessment Unit Splits
1of 1
CHAPTER 5: NARRATIVE
STANDARD ASSESSMENT
OF RECREATIONAL USE
SUPPORT IN LAKES AND
RESERVOIRS AND
APPLICATION TO UTAH
LAKE
2016 Final Integrated Report
Chapter 5: Narrative Standard Assessment of Recreational Use Support in Lakes and Reservoirs and Application to Utah Lake
Final 2016 IR: version 2.1 Page 2
[This page is intentionally left blank].
Chapter 5: Narrative Standard Assessment of Recreational Use Support in Lakes and Reservoirs and Application to Utah Lake
Final 2016 IR: version 2.1 Page 3
CONTENTS
CONTENTS .................................................................................................................................................. 3
ABBREVIATIONS ......................................................................................................................................... 4
FIGURES ...................................................................................................................................................... 5
TABLES ........................................................................................................................................................ 6
INTRODUCTION .......................................................................................................................................... 7
Utah’s Narrative Water Quality Standard .................................................................................................................... 7
Harmful algal bloom indicators for recreational use attainment ............................................................................... 8
Primary indicator: Cyanobacteria cell concentrations ....................................................................................... 10
Supplemental indicator: Cyanotoxin concentration indicators ......................................................................... 10
Supplemental indicator: Chlorophyll a concentration indicators ..................................................................... 11
HARMFUL ALGAL BLOOM ASSESSMENT FOR UTAH LAKE ...................................................................... 12
Recreational Uses in Utah Lake ..................................................................................................................................... 12
Relevant Data ................................................................................................................................................................... 13
Exceedances of Primary Indicator: Cyanobacteria cell counts................................................................................ 15
Exceedances of supplemental indicators ..................................................................................................................... 16
Cyanotoxin concentrations in Utah Lake .............................................................................................................. 16
Chlorophyll a concentrations .................................................................................................................................. 17
Other issues related to HAB occurrences in Utah Lake ............................................................................................. 18
Utah Lake recreational use advisories ................................................................................................................. 18
Utah Lake dog deaths ............................................................................................................................................. 19
Cyanotoxins in Jordan River below Utah Lake outlet ....................................................................................... 19
Summary ............................................................................................................................................................................ 19
FREQUENTLY ASKED QUESTIONS ............................................................................................................ 21
Aren’t cyanobacteria naturally occurring in Utah Lake? .......................................................................................... 21
How does the relative importance of natural and human-caused algal blooms play into impairment decisions? ........................................................................................................................................................................... 21
Is the very high microcystin concentration recorded at Lindon Harbor on October 10, 2014 representative of bloom conditions and risk? ............................................................................................................. 22
Doesn’t Utah require two IR cycles to make a listing decision? ............................................................................... 22
Why use the 100,000 cells/mL cyanobacteria threshold? ...................................................................................... 22
How can you be sure that there is a health risk when not all cyanobacteria produce toxins? ......................... 23
What are the implications of potential HAB listings for other UDWQ initiatives? .............................................. 23
LITERATURE CITED .................................................................................................................................... 25
Chapter 5: Narrative Standard Assessment of Recreational Use Support in Lakes and Reservoirs and Application to Utah Lake
Final 2016 IR: version 2.1 Page 4
ABBREVIATIONS
< less than
> greater then
AU assessment unit
cell(s)/mL cell(s) per milliliter
CFR Code of Federal Regulations
DO dissolved oxygen
DWQ Division of Water Quality
EPA U.S. Environmental Protection Agency
HAB(s) harmful algal bloom(s)
IR Integrated report
km2 square kilometer
mg/L milligram per liter
TMDL total maximum daily load
UAC Utah Administrative Code
UDWQ Utah Division of Water Quality
WHO World Health Organization
μg/l microgram per liter
Chapter 5: Narrative Standard Assessment of Recreational Use Support in Lakes and Reservoirs and Application to Utah Lake
Final 2016 IR: version 2.1 Page 5
FIGURES Figure 1. Conceptual diagram of UDWQ's recreational use assessment for HABs under the
Narrative standard. ............................................................................................................................. 9
Figure 2. Number of visitors to Utah Lake State Park from 2006 to 2015 (UDNR, 2016) ..................... 12
Figure 3. Map of UDWQ monitoring locations in Utah Lake and Jordan River. Routine water quality and profile monitoring locations as green circles. Targeted HAB and cyanotoxin samples as orange squares. ........................................................................................ 14
Figure 4 . Harmful algal bloom events in Utah Lake during October, 2014. Total phytoplankton counts for each sample are drawn in dark green with cyanobacteria counts beside in light green. The 100,000 cell/mL indicator is identified by a red dashed line. ................... 15
Figure 5. Photographs of the HAB events and targeted sample collections in Utah Lake, October 2014. .................................................................................................................................................... 16
Figure 6. Photographs of the 2015 algal blooms that triggered a recreational advisory at Utah Lake....................................................................................................................................................... 18
Chapter 5: Narrative Standard Assessment of Recreational Use Support in Lakes and Reservoirs and Application to Utah Lake
Final 2016 IR: version 2.1 Page 6
TABLES Table 1. WHO recommended thresholds of human health risk for cyanobacteria, microcystin-LR,
and chlorophyll a. ................................................................................................................................ 9
Table 2. Microcystin samples collected on Utah Lake and the Jordan River during October 2014. ND = non-detect. ................................................................................................................... 17
Table 3. Chlorophyll a sample size and exceedances of the 50 µg/L chlorophyll a threshold by monitoring location. ............................................................................................................................ 17
Table 4. Number and percent of exceedances in Utah Lake for all three indicators at human health risk thresholds as defined by WHO. .................................................................................. 20
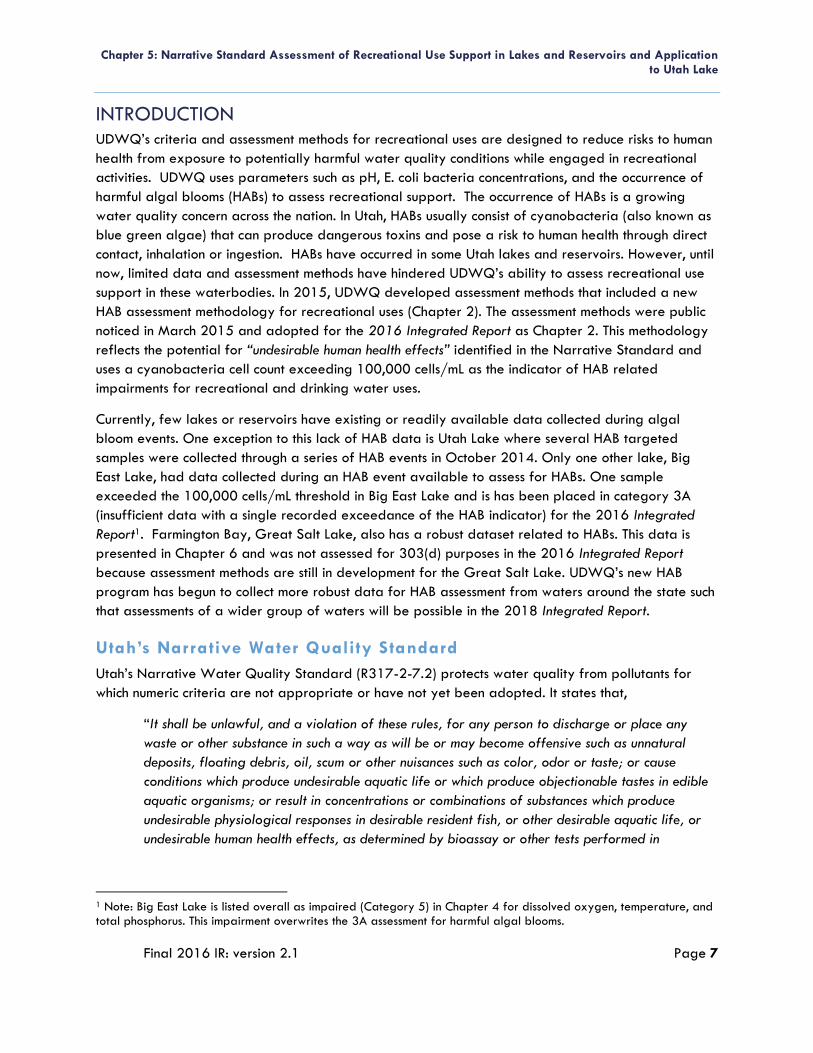
Chapter 5: Narrative Standard Assessment of Recreational Use Support in Lakes and Reservoirs and Application to Utah Lake
Final 2016 IR: version 2.1 Page 7
INTRODUCTION UDWQ’s criteria and assessment methods for recreational uses are designed to reduce risks to human
health from exposure to potentially harmful water quality conditions while engaged in recreational
activities. UDWQ uses parameters such as pH, E. coli bacteria concentrations, and the occurrence of
harmful algal blooms (HABs) to assess recreational support. The occurrence of HABs is a growing
water quality concern across the nation. In Utah, HABs usually consist of cyanobacteria (also known as
blue green algae) that can produce dangerous toxins and pose a risk to human health through direct
contact, inhalation or ingestion. HABs have occurred in some Utah lakes and reservoirs. However, until
now, limited data and assessment methods have hindered UDWQ’s ability to assess recreational use
support in these waterbodies. In 2015, UDWQ developed assessment methods that included a new
HAB assessment methodology for recreational uses (Chapter 2). The assessment methods were public
noticed in March 2015 and adopted for the 2016 Integrated Report as Chapter 2. This methodology
reflects the potential for “undesirable human health effects” identified in the Narrative Standard and
uses a cyanobacteria cell count exceeding 100,000 cells/mL as the indicator of HAB related
impairments for recreational and drinking water uses.
Currently, few lakes or reservoirs have existing or readily available data collected during algal
bloom events. One exception to this lack of HAB data is Utah Lake where several HAB targeted
samples were collected through a series of HAB events in October 2014. Only one other lake, Big
East Lake, had data collected during an HAB event available to assess for HABs. One sample
exceeded the 100,000 cells/mL threshold in Big East Lake and is has been placed in category 3A
(insufficient data with a single recorded exceedance of the HAB indicator) for the 2016 Integrated
Report1. Farmington Bay, Great Salt Lake, also has a robust dataset related to HABs. This data is
presented in Chapter 6 and was not assessed for 303(d) purposes in the 2016 Integrated Report
because assessment methods are still in development for the Great Salt Lake. UDWQ’s new HAB
program has begun to collect more robust data for HAB assessment from waters around the state such
that assessments of a wider group of waters will be possible in the 2018 Integrated Report.
Utah’s Narrative Water Quality Standard
Utah’s Narrative Water Quality Standard (R317-2-7.2) protects water quality from pollutants for
which numeric criteria are not appropriate or have not yet been adopted. It states that,
“It shall be unlawful, and a violation of these rules, for any person to discharge or place any
waste or other substance in such a way as will be or may become offensive such as unnatural
deposits, floating debris, oil, scum or other nuisances such as color, odor or taste; or cause
conditions which produce undesirable aquatic life or which produce objectionable tastes in edible
aquatic organisms; or result in concentrations or combinations of substances which produce
undesirable physiological responses in desirable resident fish, or other desirable aquatic life, or
undesirable human health effects, as determined by bioassay or other tests performed in
1 Note: Big East Lake is listed overall as impaired (Category 5) in Chapter 4 for dissolved oxygen, temperature, and total phosphorus. This impairment overwrites the 3A assessment for harmful algal blooms.
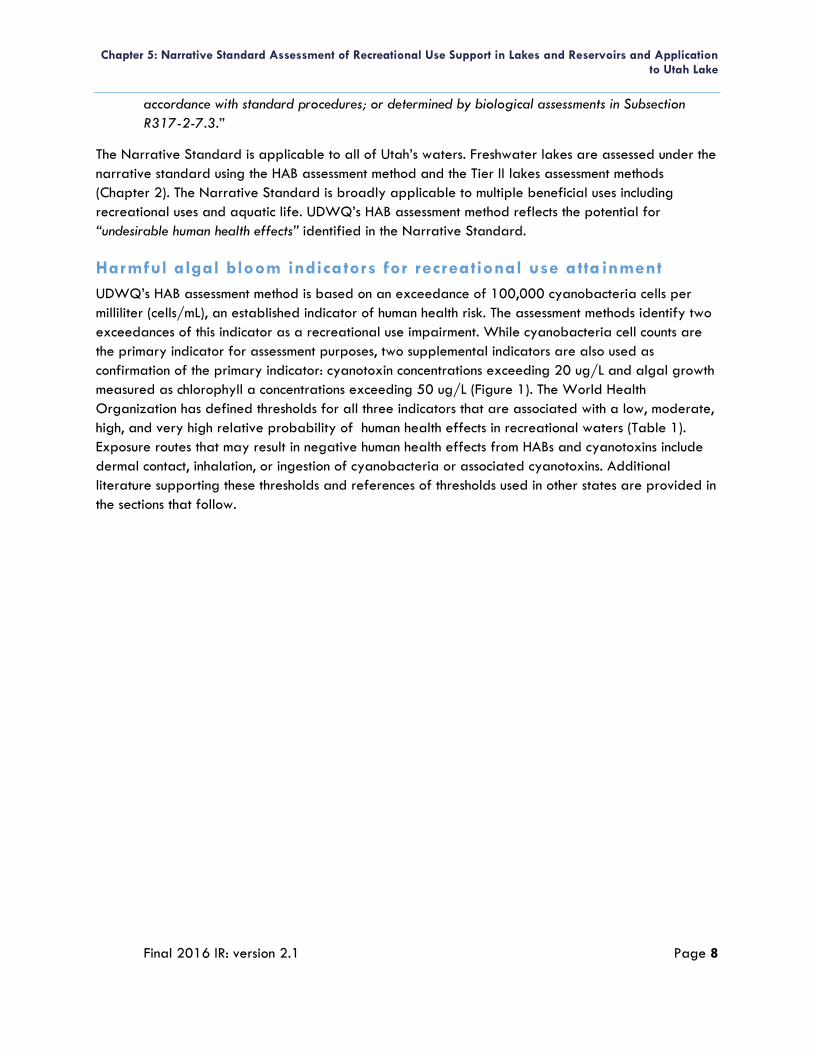
Chapter 5: Narrative Standard Assessment of Recreational Use Support in Lakes and Reservoirs and Application to Utah Lake
Final 2016 IR: version 2.1 Page 8
accordance with standard procedures; or determined by biological assessments in Subsection
R317-2-7.3.”
The Narrative Standard is applicable to all of Utah’s waters. Freshwater lakes are assessed under the
narrative standard using the HAB assessment method and the Tier II lakes assessment methods
(Chapter 2). The Narrative Standard is broadly applicable to multiple beneficial uses including
recreational uses and aquatic life. UDWQ’s HAB assessment method reflects the potential for
“undesirable human health effects” identified in the Narrative Standard.
Harmful algal bloom indicators for recreational use atta inment
UDWQ’s HAB assessment method is based on an exceedance of 100,000 cyanobacteria cells per
milliliter (cells/mL), an established indicator of human health risk. The assessment methods identify two
exceedances of this indicator as a recreational use impairment. While cyanobacteria cell counts are
the primary indicator for assessment purposes, two supplemental indicators are also used as
confirmation of the primary indicator: cyanotoxin concentrations exceeding 20 ug/L and algal growth
measured as chlorophyll a concentrations exceeding 50 ug/L (Figure 1). The World Health
Organization has defined thresholds for all three indicators that are associated with a low, moderate,
high, and very high relative probability of human health effects in recreational waters (Table 1).
Exposure routes that may result in negative human health effects from HABs and cyanotoxins include
dermal contact, inhalation, or ingestion of cyanobacteria or associated cyanotoxins. Additional
literature supporting these thresholds and references of thresholds used in other states are provided in
the sections that follow.
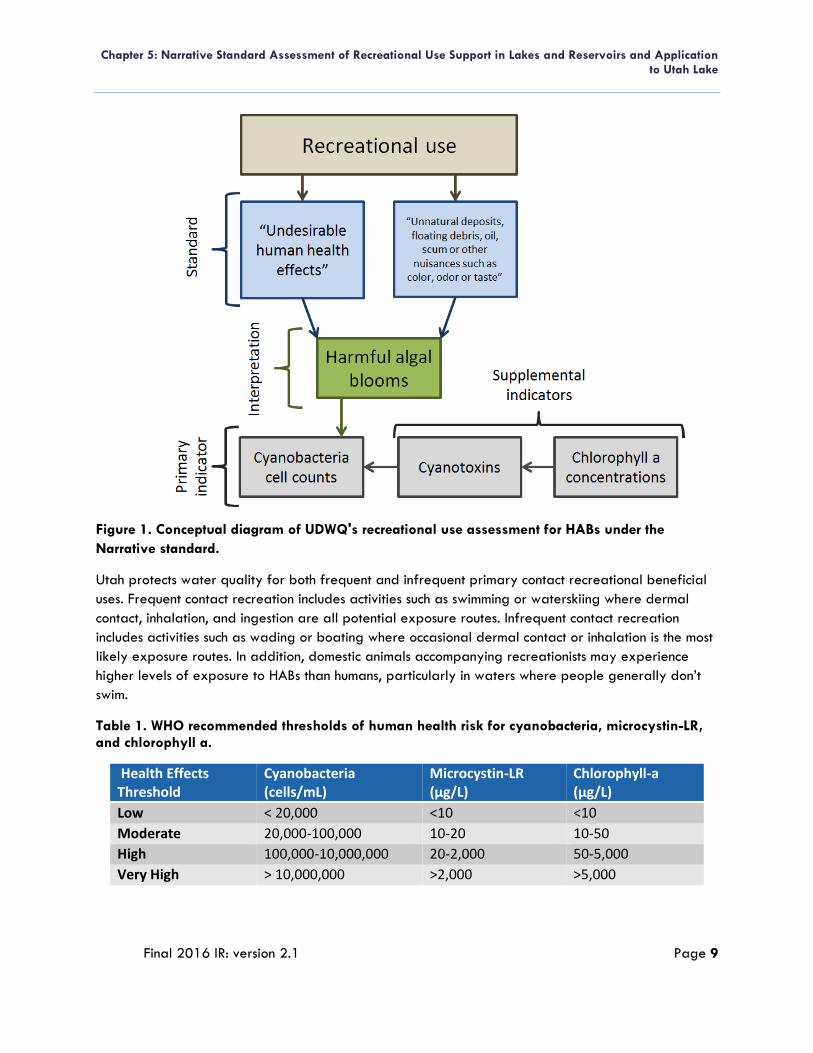
Chapter 5: Narrative Standard Assessment of Recreational Use Support in Lakes and Reservoirs and Application to Utah Lake
Final 2016 IR: version 2.1 Page 9
Figure 1. Conceptual diagram of UDWQ's recreational use assessment for HABs under the
Narrative standard.
Utah protects water quality for both frequent and infrequent primary contact recreational beneficial
uses. Frequent contact recreation includes activities such as swimming or waterskiing where dermal
contact, inhalation, and ingestion are all potential exposure routes. Infrequent contact recreation
includes activities such as wading or boating where occasional dermal contact or inhalation is the most
likely exposure routes. In addition, domestic animals accompanying recreationists may experience
higher levels of exposure to HABs than humans, particularly in waters where people generally don’t
swim.
Table 1. WHO recommended thresholds of human health risk for cyanobacteria, microcystin-LR, and chlorophyll a.
Health Effects Threshold
Cyanobacteria (cells/mL)
Microcystin-LR (µg/L)
Chlorophyll-a (µg/L)
Low < 20,000 <10 <10
Moderate 20,000-100,000 10-20 10-50
High 100,000-10,000,000 20-2,000 50-5,000
Very High > 10,000,000 >2,000 >5,000
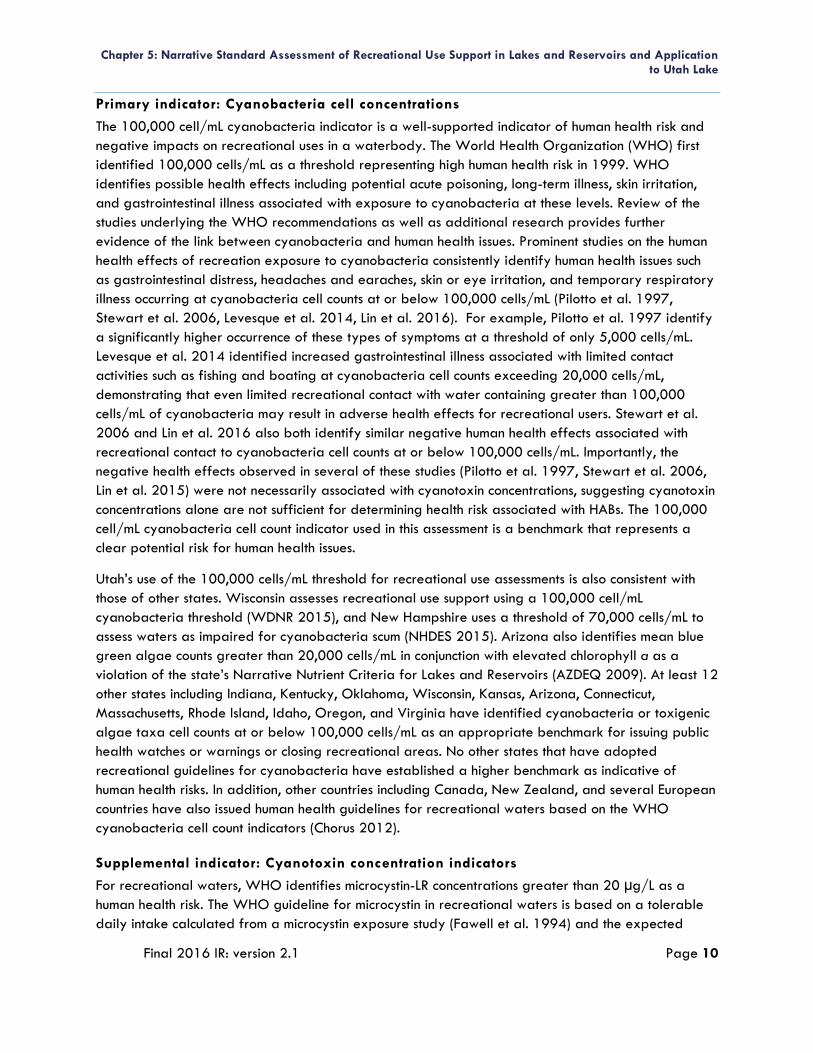
Chapter 5: Narrative Standard Assessment of Recreational Use Support in Lakes and Reservoirs and Application to Utah Lake
Final 2016 IR: version 2.1 Page 10
Primary indicator: Cyanobacteria cell concentrations
The 100,000 cell/mL cyanobacteria indicator is a well-supported indicator of human health risk and
negative impacts on recreational uses in a waterbody. The World Health Organization (WHO) first
identified 100,000 cells/mL as a threshold representing high human health risk in 1999. WHO
identifies possible health effects including potential acute poisoning, long-term illness, skin irritation,
and gastrointestinal illness associated with exposure to cyanobacteria at these levels. Review of the
studies underlying the WHO recommendations as well as additional research provides further
evidence of the link between cyanobacteria and human health issues. Prominent studies on the human
health effects of recreation exposure to cyanobacteria consistently identify human health issues such
as gastrointestinal distress, headaches and earaches, skin or eye irritation, and temporary respiratory
illness occurring at cyanobacteria cell counts at or below 100,000 cells/mL (Pilotto et al. 1997,
Stewart et al. 2006, Levesque et al. 2014, Lin et al. 2016). For example, Pilotto et al. 1997 identify
a significantly higher occurrence of these types of symptoms at a threshold of only 5,000 cells/mL.
Levesque et al. 2014 identified increased gastrointestinal illness associated with limited contact
activities such as fishing and boating at cyanobacteria cell counts exceeding 20,000 cells/mL,
demonstrating that even limited recreational contact with water containing greater than 100,000
cells/mL of cyanobacteria may result in adverse health effects for recreational users. Stewart et al.
2006 and Lin et al. 2016 also both identify similar negative human health effects associated with
recreational contact to cyanobacteria cell counts at or below 100,000 cells/mL. Importantly, the
negative health effects observed in several of these studies (Pilotto et al. 1997, Stewart et al. 2006,
Lin et al. 2015) were not necessarily associated with cyanotoxin concentrations, suggesting cyanotoxin
concentrations alone are not sufficient for determining health risk associated with HABs. The 100,000
cell/mL cyanobacteria cell count indicator used in this assessment is a benchmark that represents a
clear potential risk for human health issues.
Utah’s use of the 100,000 cells/mL threshold for recreational use assessments is also consistent with
those of other states. Wisconsin assesses recreational use support using a 100,000 cell/mL
cyanobacteria threshold (WDNR 2015), and New Hampshire uses a threshold of 70,000 cells/mL to
assess waters as impaired for cyanobacteria scum (NHDES 2015). Arizona also identifies mean blue
green algae counts greater than 20,000 cells/mL in conjunction with elevated chlorophyll a as a
violation of the state’s Narrative Nutrient Criteria for Lakes and Reservoirs (AZDEQ 2009). At least 12
other states including Indiana, Kentucky, Oklahoma, Wisconsin, Kansas, Arizona, Connecticut,
Massachusetts, Rhode Island, Idaho, Oregon, and Virginia have identified cyanobacteria or toxigenic
algae taxa cell counts at or below 100,000 cells/mL as an appropriate benchmark for issuing public
health watches or warnings or closing recreational areas. No other states that have adopted
recreational guidelines for cyanobacteria have established a higher benchmark as indicative of
human health risks. In addition, other countries including Canada, New Zealand, and several European
countries have also issued human health guidelines for recreational waters based on the WHO
cyanobacteria cell count indicators (Chorus 2012).
Supplemental indicator: Cyanotoxin concentration indicators
For recreational waters, WHO identifies microcystin-LR concentrations greater than 20 µg/L as a
human health risk. The WHO guideline for microcystin in recreational waters is based on a tolerable
daily intake calculated from a microcystin exposure study (Fawell et al. 1994) and the expected
Chapter 5: Narrative Standard Assessment of Recreational Use Support in Lakes and Reservoirs and Application to Utah Lake
Final 2016 IR: version 2.1 Page 11
incidental consumption of water of a 60 kilogram adult. However, several states and countries have
set lower thresholds for human health advisories based on studies that have identified lower values for
microcystin toxicity based on expected recreational exposure of small children. Microcystin
concentrations are used in Utah’s HAB assessment as confirmatory evidence of toxin producing algae
that pose a human health risk to recreational uses.
Supplemental indicator: Chlorophyll a concentration indicators
For recreational waters, WHO also recommends 50 ug/L of chlorophyll a as a threshold indicative of
human health risk. The chlorophyll a indicator is only used as a supporting indicator in the IR, and
assessment decisions have not been based solely on the chlorophyll a threshold. The chlorophyll a
indicator as used in the IR is not intended to assess whether individual HAB events have occurred in a
waterbody. Instead, this indicator is intended to provide supporting information regarding the overall
productivity of a waterbody and its underlying potential for HABs. Several scientific studies identify a
pattern of increasing cyanobacterial dominance (as either density or biovolume) with increasing
chlorophyll a concentrations in lakes and reservoirs (e.g. Downing et al. 2001, Rogalus and Watzin
2007). Similarly, the likelihood of occurrence of cyanotoxins has also been shown to increase with
elevated chlorophyll a concentrations (WHO 2003, Rogalus and Watzin 2007, Lindon and Heiskary
2009, Yuan et al. 2014). This pattern of a positive relationship between cyanotoxins and chlorophyll
a concentrations is consistent both within single lakes as demonstrated by Rogalus and Watzin (2007)
in Lake Champlain and across lakes at a national scale as demonstrated by Yuan et al. 2014 using
the EPA’s National Lakes Assessment dataset. Chlorophyll a data from open water samples are used
in Utah’s assessment to provide context and supplemental information regarding the probability and
extent of HAB occurrences.
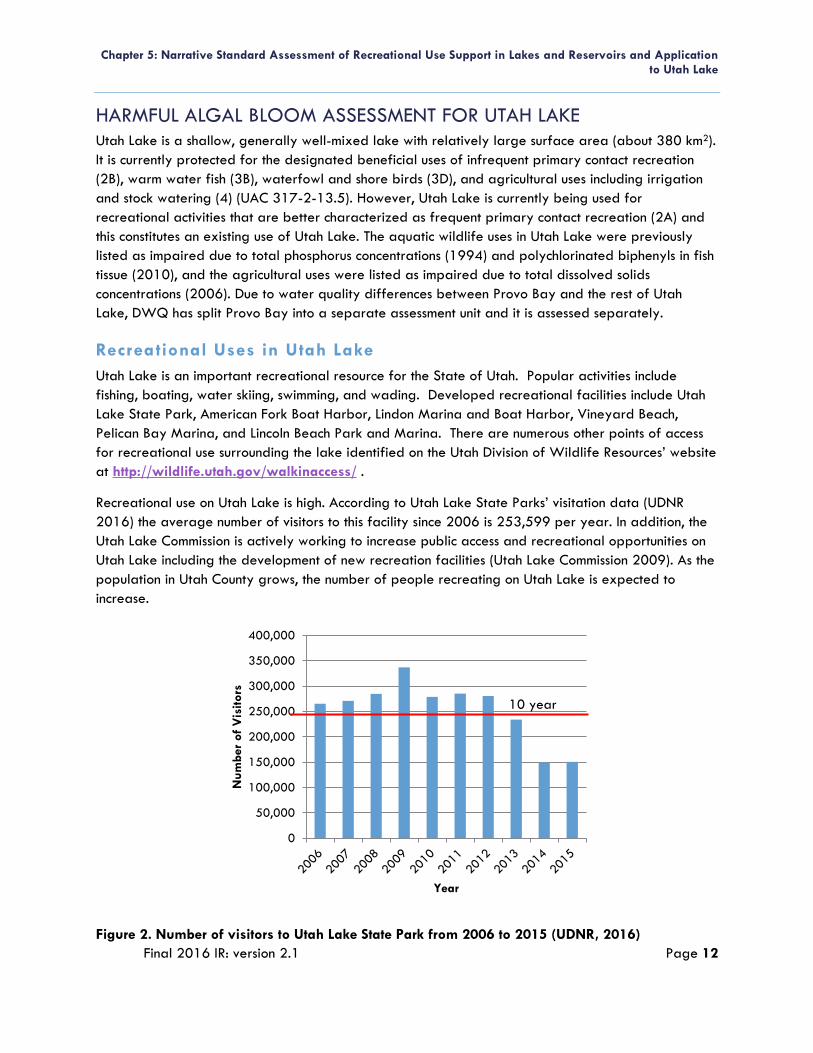
Chapter 5: Narrative Standard Assessment of Recreational Use Support in Lakes and Reservoirs and Application to Utah Lake
Final 2016 IR: version 2.1 Page 12
HARMFUL ALGAL BLOOM ASSESSMENT FOR UTAH LAKE
Utah Lake is a shallow, generally well-mixed lake with relatively large surface area (about 380 km2).
It is currently protected for the designated beneficial uses of infrequent primary contact recreation
(2B), warm water fish (3B), waterfowl and shore birds (3D), and agricultural uses including irrigation
and stock watering (4) (UAC 317-2-13.5). However, Utah Lake is currently being used for
recreational activities that are better characterized as frequent primary contact recreation (2A) and
this constitutes an existing use of Utah Lake. The aquatic wildlife uses in Utah Lake were previously
listed as impaired due to total phosphorus concentrations (1994) and polychlorinated biphenyls in fish
tissue (2010), and the agricultural uses were listed as impaired due to total dissolved solids
concentrations (2006). Due to water quality differences between Provo Bay and the rest of Utah
Lake, DWQ has split Provo Bay into a separate assessment unit and it is assessed separately.
Recreational Uses in Utah Lake
Utah Lake is an important recreational resource for the State of Utah. Popular activities include
fishing, boating, water skiing, swimming, and wading. Developed recreational facilities include Utah
Lake State Park, American Fork Boat Harbor, Lindon Marina and Boat Harbor, Vineyard Beach,
Pelican Bay Marina, and Lincoln Beach Park and Marina. There are numerous other points of access
for recreational use surrounding the lake identified on the Utah Division of Wildlife Resources’ website
at http://wildlife.utah.gov/walkinaccess/ .
Recreational use on Utah Lake is high. According to Utah Lake State Parks’ visitation data (UDNR
2016) the average number of visitors to this facility since 2006 is 253,599 per year. In addition, the
Utah Lake Commission is actively working to increase public access and recreational opportunities on
Utah Lake including the development of new recreation facilities (Utah Lake Commission 2009). As the
population in Utah County grows, the number of people recreating on Utah Lake is expected to
increase.
Figure 2. Number of visitors to Utah Lake State Park from 2006 to 2015 (UDNR, 2016)
0
50,000
100,000
150,000
200,000
250,000
300,000
350,000
400,000
Num
ber
of
Vis
itors
Year
10 year
Chapter 5: Narrative Standard Assessment of Recreational Use Support in Lakes and Reservoirs and Application to Utah Lake
Final 2016 IR: version 2.1 Page 13
Relevant Data
UDWQ collected two types of water quality samples in Utah Lake that are used in this analysis: (1)
targeted HAB samples and (2) routine open water monitoring samples. The targeted HAB samples
were collected at times and locations when observed potential HABs occurred in fall 2014. HAB-
targeted samples are essential for assessing water quality that is protective of potential human health
in locations where recreational contact with HABs is most likely, including marinas, inlets, and
shorelines. These samples were collected to obtain cyanobacteria cell counts and cyanotoxin
quantification and are the primary sample type assessed in this chapter. Given the sporadic nature of
HAB occurrences, infrequent and routine water quality samples collected from open water monitoring
locations are unlikely to detect HABs in most water bodies. Open water chlorophyll a samples are
used to characterize the potential frequency and extent of HAB occurrence in Utah Lake.
A total of 18 HAB-targeted phytoplankton and cyanotoxin samples were collected in several locations
throughout the lake during October 2014 when suspected HABs were observed. An additional three
cyanotoxin samples were collected in the Jordan River immediately below the outlet from Utah Lake
during and after the October 2014 bloom.
UDWQ also collected over 150 open water samples at eight monitoring locations in Utah Lake during
the 2016 IR cycle (May-November, 2008-2014, Figure 3). These samples include full water chemistry
analyses, but only the chlorophyll a data were used as a supporting indicator in this HAB assessment.
An additional 45 phytoplankton samples were also collected during routine monitoring events but
none of them exceeded the 100,000 cells/mL threshold and they are not indicative of HAB events.
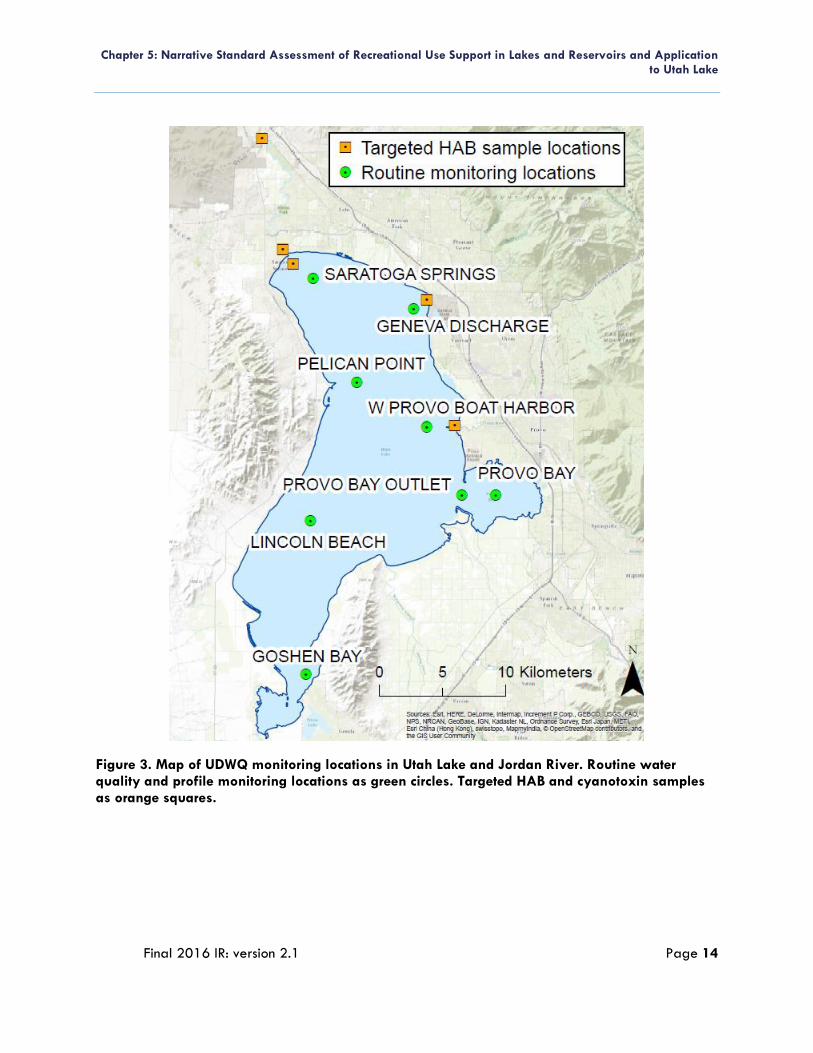
Chapter 5: Narrative Standard Assessment of Recreational Use Support in Lakes and Reservoirs and Application to Utah Lake
Final 2016 IR: version 2.1 Page 14
Figure 3. Map of UDWQ monitoring locations in Utah Lake and Jordan River. Routine water quality and profile monitoring locations as green circles. Targeted HAB and cyanotoxin samples as orange squares.
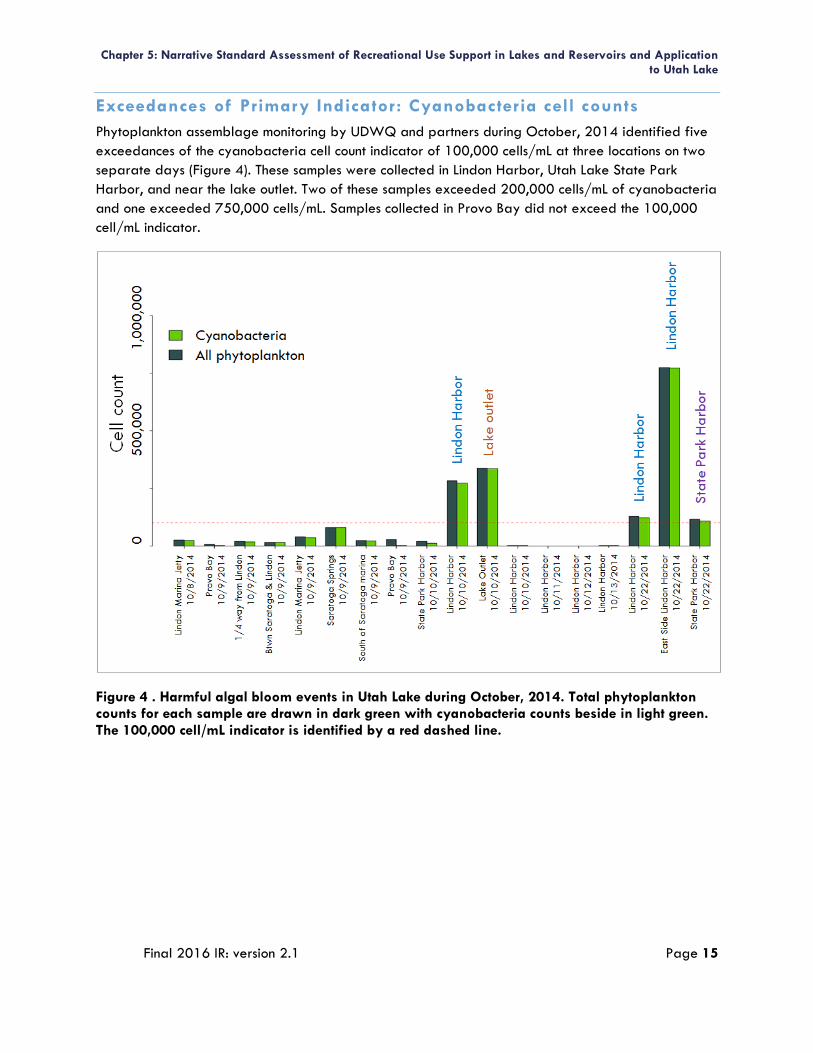
Chapter 5: Narrative Standard Assessment of Recreational Use Support in Lakes and Reservoirs and Application to Utah Lake
Final 2016 IR: version 2.1 Page 15
Exceedances of Primary Indicator: Cyanobacteria cell counts
Phytoplankton assemblage monitoring by UDWQ and partners during October, 2014 identified five
exceedances of the cyanobacteria cell count indicator of 100,000 cells/mL at three locations on two
separate days (Figure 4). These samples were collected in Lindon Harbor, Utah Lake State Park
Harbor, and near the lake outlet. Two of these samples exceeded 200,000 cells/mL of cyanobacteria
and one exceeded 750,000 cells/mL. Samples collected in Provo Bay did not exceed the 100,000
cell/mL indicator.
Figure 4 . Harmful algal bloom events in Utah Lake during October, 2014. Total phytoplankton counts for each sample are drawn in dark green with cyanobacteria counts beside in light green. The 100,000 cell/mL indicator is identified by a red dashed line.
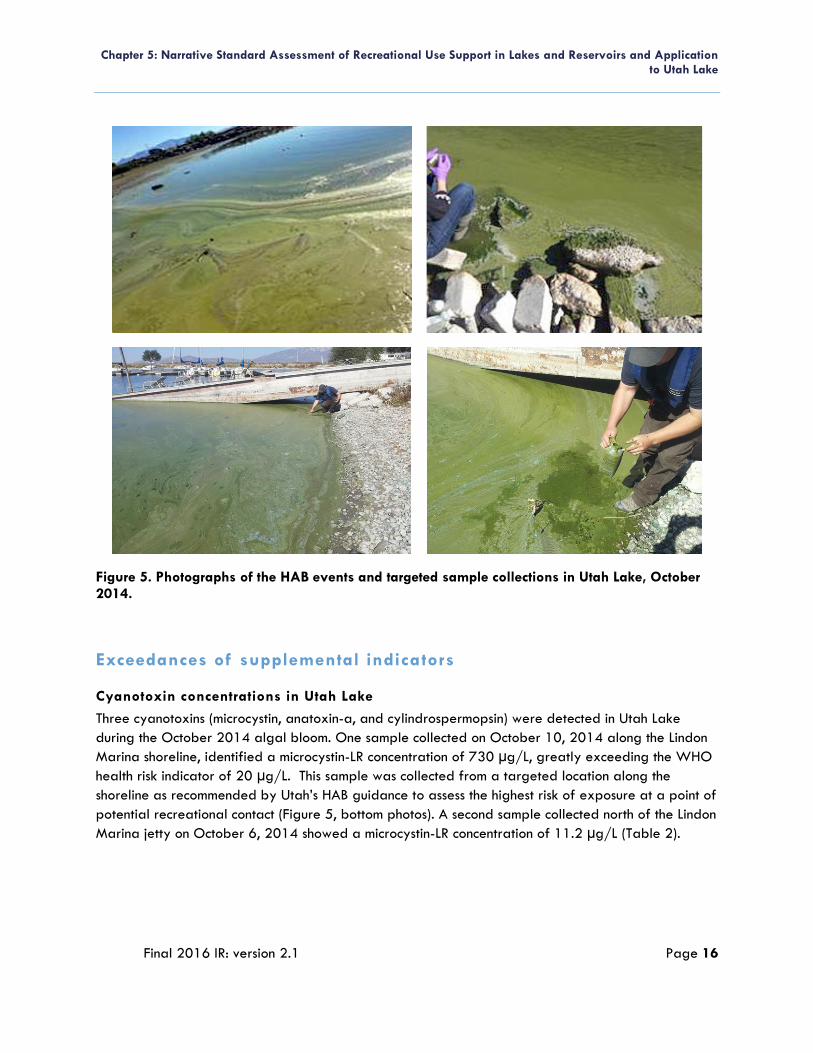
Chapter 5: Narrative Standard Assessment of Recreational Use Support in Lakes and Reservoirs and Application to Utah Lake
Final 2016 IR: version 2.1 Page 16
Figure 5. Photographs of the HAB events and targeted sample collections in Utah Lake, October 2014.
Exceedances of supplemental indicators
Cyanotoxin concentrations in Utah Lake
Three cyanotoxins (microcystin, anatoxin-a, and cylindrospermopsin) were detected in Utah Lake
during the October 2014 algal bloom. One sample collected on October 10, 2014 along the Lindon
Marina shoreline, identified a microcystin-LR concentration of 730 µg/L, greatly exceeding the WHO
health risk indicator of 20 µg/L. This sample was collected from a targeted location along the
shoreline as recommended by Utah’s HAB guidance to assess the highest risk of exposure at a point of
potential recreational contact (Figure 5, bottom photos). A second sample collected north of the Lindon
Marina jetty on October 6, 2014 showed a microcystin-LR concentration of 11.2 µg/L (Table 2).
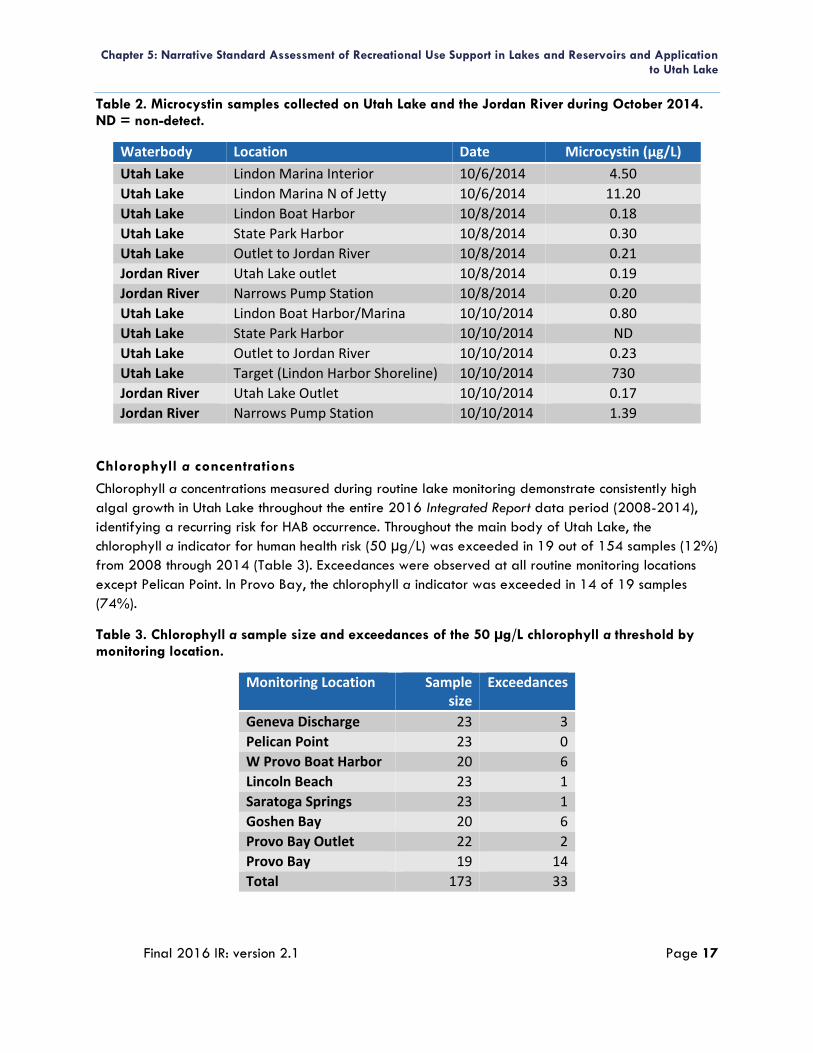
Chapter 5: Narrative Standard Assessment of Recreational Use Support in Lakes and Reservoirs and Application to Utah Lake
Final 2016 IR: version 2.1 Page 17
Table 2. Microcystin samples collected on Utah Lake and the Jordan River during October 2014. ND = non-detect.
Waterbody Location Date Microcystin (µg/L)
Utah Lake Lindon Marina Interior 10/6/2014 4.50
Utah Lake Lindon Marina N of Jetty 10/6/2014 11.20
Utah Lake Lindon Boat Harbor 10/8/2014 0.18
Utah Lake State Park Harbor 10/8/2014 0.30
Utah Lake Outlet to Jordan River 10/8/2014 0.21
Jordan River Utah Lake outlet 10/8/2014 0.19
Jordan River Narrows Pump Station 10/8/2014 0.20
Utah Lake Lindon Boat Harbor/Marina 10/10/2014 0.80
Utah Lake State Park Harbor 10/10/2014 ND
Utah Lake Outlet to Jordan River 10/10/2014 0.23
Utah Lake Target (Lindon Harbor Shoreline) 10/10/2014 730
Jordan River Utah Lake Outlet 10/10/2014 0.17
Jordan River Narrows Pump Station 10/10/2014 1.39
Chlorophyll a concentrations
Chlorophyll a concentrations measured during routine lake monitoring demonstrate consistently high
algal growth in Utah Lake throughout the entire 2016 Integrated Report data period (2008-2014),
identifying a recurring risk for HAB occurrence. Throughout the main body of Utah Lake, the
chlorophyll a indicator for human health risk (50 µg/L) was exceeded in 19 out of 154 samples (12%)
from 2008 through 2014 (Table 3). Exceedances were observed at all routine monitoring locations
except Pelican Point. In Provo Bay, the chlorophyll a indicator was exceeded in 14 of 19 samples
(74%).
Table 3. Chlorophyll a sample size and exceedances of the 50 µg/L chlorophyll a threshold by monitoring location.
Monitoring Location Sample size
Exceedances
Geneva Discharge 23 3
Pelican Point 23 0
W Provo Boat Harbor 20 6
Lincoln Beach 23 1
Saratoga Springs 23 1
Goshen Bay 20 6
Provo Bay Outlet 22 2
Provo Bay 19 14
Total 173 33
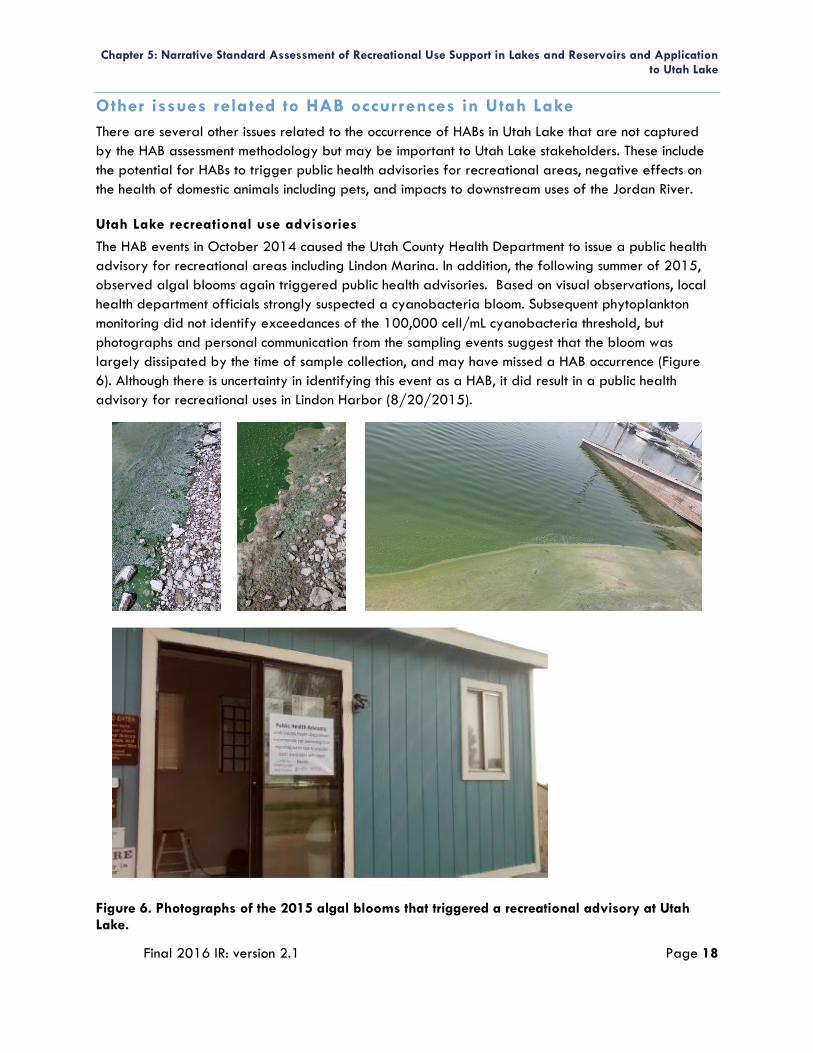
Chapter 5: Narrative Standard Assessment of Recreational Use Support in Lakes and Reservoirs and Application to Utah Lake
Final 2016 IR: version 2.1 Page 18
Other issues related to HAB occurrences in Utah Lake
There are several other issues related to the occurrence of HABs in Utah Lake that are not captured
by the HAB assessment methodology but may be important to Utah Lake stakeholders. These include
the potential for HABs to trigger public health advisories for recreational areas, negative effects on
the health of domestic animals including pets, and impacts to downstream uses of the Jordan River.
Utah Lake recreational use advisories
The HAB events in October 2014 caused the Utah County Health Department to issue a public health
advisory for recreational areas including Lindon Marina. In addition, the following summer of 2015,
observed algal blooms again triggered public health advisories. Based on visual observations, local
health department officials strongly suspected a cyanobacteria bloom. Subsequent phytoplankton
monitoring did not identify exceedances of the 100,000 cell/mL cyanobacteria threshold, but
photographs and personal communication from the sampling events suggest that the bloom was
largely dissipated by the time of sample collection, and may have missed a HAB occurrence (Figure
6). Although there is uncertainty in identifying this event as a HAB, it did result in a public health
advisory for recreational uses in Lindon Harbor (8/20/2015).
Figure 6. Photographs of the 2015 algal blooms that triggered a recreational advisory at Utah Lake.
Chapter 5: Narrative Standard Assessment of Recreational Use Support in Lakes and Reservoirs and Application to Utah Lake
Final 2016 IR: version 2.1 Page 19
Utah Lake dog deaths
Dogs and other animals can be especially susceptible to the harmful health effects of cyanotoxins
while swimming and playing in water with HABs. They tend to ingest larger quantities of scum while
swimming and when grooming, by licking the scum off their fur. Two dog deaths were potentially
linked to algal toxins during the October 2014 HAB events in Utah Lake. UDWQ recognizes the
uncertainty associated with diagnosing the causes of these deaths and directly linking them to algal
toxins, and initial reports for the first reported death did not identify a conclusive cause of death.
However, veterinarian investigations into the second reported death did conclude ingestion of
cyanobacteria or cyanotoxins to be the cause of death. This finding was based on the dog’s symptoms
including rapid breathing, the veterinarian’s past experience dealing with cyanotoxin poisonings in
another state, and clear signs of exposure to cyanobacteria including the presence of cyanobacteria
on the dog’s nose. Despite the lack of confirmation that cyanobacteria poisoning was the cause of the
death for the dog that died on October 5, 2014, UDWQ and Utah Department of Health scientists
still suspect cyanobacteria as the sole or a contributing cause of death for both dogs. Both dogs died
within hours of being in the water where toxin-producing cyanobacteria were present. The symptoms
exhibited were consistent with cyanotoxin poisoning, specifically neurotoxins. Even though
cyanobacteria were not detected in the dog's stomach during necropsy, the dog's owner reported that
the dog was drinking the water where "algae" had accumulated and vomited bright green "algae."
Cyanotoxins were not detected in the tissues of the necropsied dog, but the analytical methods that
were used only identify a limited number of the known cyanotoxins, and additional unidentified toxins
are suspected to exist.
Negative results from the toxin analyses are not uncommon in dog deaths attributed to cyanotoxin
poisonings. Other causes not related to cyanobacteria are plausible as the cause of one or both of the
deaths, but these were judged to be less likely given the weight of environmental evidence and that
two dogs died within 24 hours of one another after ingesting Utah Lake water.
Cyanotoxins in Jordan River below Utah Lake outlet
Four samples taken in the Jordan River downstream from Utah Lake identified levels of microcystin-LR
above detection limits during the October 2014 algal bloom. This section of the Jordan River is
protected as a class 1C drinking water source (UAC R317-2.6). UDWQ will monitor for cyanotoxins at
this site during future HAB blooms to ensure there is no threat to drinking water uses. The Jordan River
is also protected as class 4 for agricultural uses. Numerous diversions from the Jordan River are used
for stock watering and as secondary sources of water for residential properties in the south Salt Lake
Valley. These data demonstrate the potential for negative impacts on downstream uses from HAB
occurrences in Utah Lake.
Summary
Five unique exceedances of the primary HAB indicator for human health risk (100,000 cyanobacteria
cells/mL) occurred at three locations in Utah Lake on two separate days in October 2014 (Table 4).
Of these blooms, UDWQ measured cyanotoxin microcystin concentrations that pose a threat to human
health. In addition, open water chlorophyll a concentrations from 2008-2014 exceeded the human
health risk threshold of 50 µg/L representing 19% of total samples collected and demonstrating a risk
for HAB occurrence (Table 4). Together, these indicators identify an impairment of the recreational use
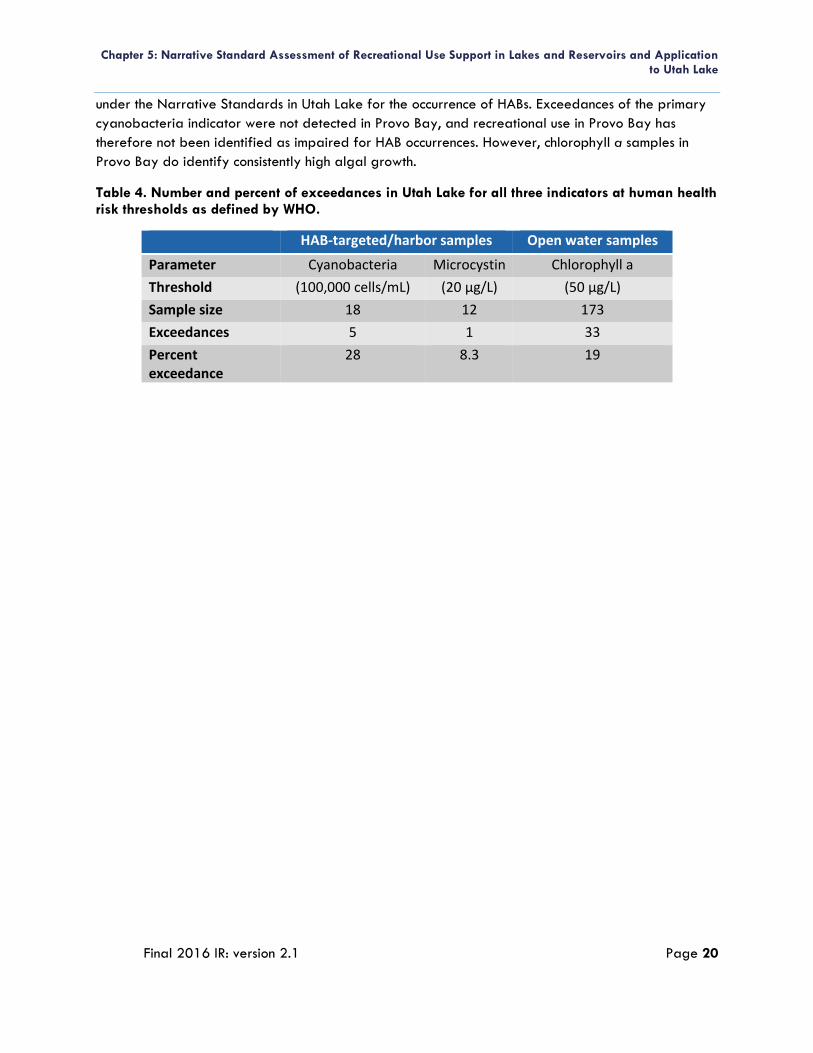
Chapter 5: Narrative Standard Assessment of Recreational Use Support in Lakes and Reservoirs and Application to Utah Lake
Final 2016 IR: version 2.1 Page 20
under the Narrative Standards in Utah Lake for the occurrence of HABs. Exceedances of the primary
cyanobacteria indicator were not detected in Provo Bay, and recreational use in Provo Bay has
therefore not been identified as impaired for HAB occurrences. However, chlorophyll a samples in
Provo Bay do identify consistently high algal growth.
Table 4. Number and percent of exceedances in Utah Lake for all three indicators at human health risk thresholds as defined by WHO.
HAB-targeted/harbor samples Open water samples
Parameter Cyanobacteria Microcystin Chlorophyll a
Threshold (100,000 cells/mL) (20 µg/L) (50 µg/L)
Sample size 18 12 173
Exceedances 5 1 33
Percent exceedance
28 8.3 19
Chapter 5: Narrative Standard Assessment of Recreational Use Support in Lakes and Reservoirs and Application to Utah Lake
Final 2016 IR: version 2.1 Page 21
FREQUENTLY ASKED QUESTIONS
Aren’t cyanobacteria naturally occurring in Utah Lake?
Cyanobacteria are among the oldest known photosynthetic organisms and their persistence over the
last 3.5 billion years has allowed these organisms to evolve into a diverse group of organisms that
are well adapted to a variety of conditions (Pearl and Huisman 2009). They occur naturally in both
freshwater and marine waters, and in conditions that range from hot springs to the arctic. The diversity
and tolerance of these organisms allows then to take advantage of alterations to aquatic ecosystems,
which may explain the increasing dominance of the organism in aquatic ecosystems worldwide (Taranu
et al. 2015).
Although cyanobacteria are naturally present in many temperate waters, including Utah Lake, the
concentrations of cyanobacteria in large blooms in Utah Lake appear to have increased. These
blooms are a concern especially when they involve species that are known to produce toxins, because
exposure during these blooms is more likely to result in detrimental health effects (Pilotto et al. 1997).
It is not the presence of these species that resulted in the impairment decision for these waters, but the
magnitude of blooms and presence of toxins.
Paleolimnology investigations have been conducted on Utah Lake (Macharia 2012; Bolland 1974)
that describe a general increase in algal production following European settlement. Data from these
investigations suggest that Utah Lake has become increasingly eutrophic over time. Macharia (2012)
was primarily interested in the effects of land use patterns, so the Utah Lake study emphasized
indicators of sediment and pollen characteristics over temporal patterns in lake algae. This
investigation demonstrated an increase in sediment nutrient concentrations corresponding to increasing
population growth. Reductions in the carbon:nitrogen ratio were also observed in Utah Lake
indicating an increase in algal productivity over time. This observation was bolstered with increases in
the isotope 13C, which suggests an increasing importance of algal organic matter over other carbon
sources. Using a similar coring technique to that in Macharia (2012), Bolland (1974) analyzed
changes in diatom assemblage over time in Utah Lake cores. This study found that pre-settlement
diatoms in the lake reflected a greater representation of oligo/meso-trophic diatom taxa and benthic
taxa. This means that historic conditions were very likely less turbid and typified by lower nutrient
conditions.
How does the relative impor tance of natural and human-caused
algal blooms play into impairment decisions?
UDWQ, under delegated federal Clean Water Act authority, is required to report any observed
water quality problems to EPA on a biennial basis, including “those water quality standards established
under section 303 of the Act, including numeric criteria, narrative criteria, waterbody uses and
antidegradation requirements” (40 CFR §130.7(b)(3)). Reporting observed violations in water quality
standards means that initial impairment listings are often made in situations where there is uncertainty
about the cause, source or extent of the impairment. The decision to list a water body as impaired is
only the first step in a series of steps aimed at addressing the problem. Additional investigations are
required before remediation plans can be proposed and implemented. In this case, the investigations
Chapter 5: Narrative Standard Assessment of Recreational Use Support in Lakes and Reservoirs and Application to Utah Lake
Final 2016 IR: version 2.1 Page 22
will need to include a better characterization of algal blooms in Utah Lake, including the relative
importance of natural and human-caused sources, and linkages with aquatic life uses.
Is the very high microcystin concentration recorded at Lindon Harbor
on October 10, 2014 representative of bloom conditions and risk?
Phytoplankton and cyanotoxin samples taken during the HAB events in Utah Lake included both
composite water column samples from relatively open water and targeted surface scum samples
located at recreational access points. Taking both types of samples helps quantify both the spatial
extent and overall human health risk of a HAB event. Utah’s HAB sampling guidance recommends
sampling areas of a waterbody where algae cells tend to accumulate and where recreationists are
most likely to contact harmful algae including along shorelines and within protected areas such as
harbors. A targeted sample collected along the Lindon Harbor Shoreline on October 10, 2014
resulted in cyanobacteria cell counts exceeding 750,000 cells/mL and a microcystin concentration of
730 µg/L (Figure 5, bottom). This type of sample helps to quantify the total human health risk of HAB
events.
Doesn’t Utah require two IR cycles to make a listing decision?
UDWQ’s assessment methods for lakes and reservoirs previously required two IR cycles of equivalent
support status to change the use support designation. These methods were developed when
monitoring data was collected every other year for each lake (e.g., see DWQ 2008 Assessment
Methods). When UDWQ began monitoring using a rotating basin approach, commenters questioned
whether the two consecutive monitoring cycle requirement was appropriate because instead of a lake
being sampled every other year, a lake would be sampled every six years (see response to comments
for both the 2008 and 2010 Integrated Reports). UDWQ determined that the two consecutive cycle
methodology could not be supported if the consecutive cycles were six years apart under the rotating
basin monitoring approach. An impairment could go undetected for up to 13 years if for instance, a
lake was newly impaired the year following the last monitoring, it would be five years to the next
monitoring, another six years until the second monitoring, and two years until that data would be
assessed in the Integrated Report. Therefore, the assessment methods were revised and two
consecutive monitoring cycles are no longer required. This change ensures that lakes with impaired
water quality are identified and a plan for resolving the impairment is implemented as soon as
practical.
Why use the 100,000 cells/mL cyanobacteria threshold?
UDWQ’s use of the 100,000 cell/mL cyanobacteria threshold for HAB assessment seeks an
appropriate balance between the high priority of protecting human health and the uncertainty
inherent in the assessment process. Given the human health risks associated with HABs and cyanotoxins,
a significant level of caution is appropriate. Although the presence of cyanotoxins is the clearest sign
of immediate health risk, toxins can be formed, degraded, and dissipated rapidly. In addition, current
tests for cyanotoxin concentrations only account for a subset of potentially occurring toxins. This means
that the presence of cyanotoxins can serve as confirmation of human health risk, but the absence of
cyanotoxins is not necessarily indicative of safe recreational waters. Therefore, the presence of
cyanobacteria in concentrations sufficient to produce toxins is a more reliable indicator of overall
Chapter 5: Narrative Standard Assessment of Recreational Use Support in Lakes and Reservoirs and Application to Utah Lake
Final 2016 IR: version 2.1 Page 23
human health risk than the concentrations of cyanotoxins themselves. In addition, several scientific
studies demonstrate risks to human health at cyanobacteria concentrations at or below100,000
cells/mL. Finally, UDWQ is confident in the use of this threshold and the findings in this chapter for
several reasons including:
The occurrence of toxin producing cyanobacteria was confirmed through taxonomic
identifications.
Concentrations of cyanotoxins exceeded thresholds for human health risk which confirms the
risk indicated by the cyanobacteria cell counts.
The high frequency and magnitude of exceedances of the cyanobacteria cell count indicator
reduces the uncertainty in assessing the recreational uses as impaired. In Utah Lake, two
samples more than doubled the 100,000 cell/mL threshold, and one sample produced cell
counts over 750,000 cells/mL, more than seven times the threshold.
How can you be sure that there is a health risk when not all
cyanobacteria produce toxins?
The presence of high concentrations of cyanobacteria indicate that environmental conditions are
favorable for both toxin and non-toxin producing cyanobacteria. The number and types of
cyanobacteria can rapidly change due to causes that are not currently well understood. High
concentrations of cyanobacteria are not a definitive indicator of the presence of a health risk but they
do indicate a high potential for health risks (WHO 2003). This potential increases with increasing
concentrations of cyanobacteria, if the cyanobacteria are known to be toxin producing, and if toxins
are actually detected. These risks are potentially serious and a proactive response is warranted to
protect human health.
What are the implications of potential HAB listings for other UDWQ
initiatives?
The identification of recreational use impairment for the occurrence of HABs will not alter existing
timelines for studying the effects of nutrients on Utah Lake.
The following initiatives and timelines will remain on track:
Implementation of Utah’s Technology Based Phosphorus Effluent Limit rule (UAC R317-1-3.3)
requiring all mechanical publically owned treatment works to meet a phosphorus effluent limit
of 1 mg/L by January 1, 2020.
Phase 1 of the Utah Lake Water Quality Study that includes beneficial use assessments for
aquatic life; additional monitoring; and a refined load analysis.
No immediate changes to existing permits that discharge nitrogen and phosphorus to the Lake.
Such changes would only be required if nutrients are identified as the cause of the impairment
and after a TMDL is developed.
Chapter 5: Narrative Standard Assessment of Recreational Use Support in Lakes and Reservoirs and Application to Utah Lake
Final 2016 IR: version 2.1 Page 24
New initiatives to follow the 2016 assessment will include:
Evaluation of additional indicators to determine if any are appropriate for inclusion as formal
assessment methods used to interpret the Narrative Standard in future Integrated Reports.
Increased monitoring of harmful algal blooms and nuisance algal growth in popular
recreational waters and drinking water sources across Utah.
Additional research on Utah Lake to determine the causes of harmful algal blooms.
Chapter 5: Narrative Standard Assessment of Recreational Use Support in Lakes and Reservoirs and Application to Utah Lake
Final 2016 IR: version 2.1 Page 25
LITERATURE CITED
Arizona Department of Environmental Quality. 2009. Water Quality Standards for Surface Waters.
Bolland, R.F. 1974. Paleoecological interpretation of the diatom succession in the recent sediments of Utah Lake, Utah. University of Utah Dissertation.
Chorus, I. 2012. Current Approaches to Cyanotoxin risk assessment, risk management and regulations in different countries. Dessau-Roblau: Federal Environment Agency, Germany.
Downing, J.A., S.B. Watson, and E. McCauley. 2001. Predicting cyanobacterial dominance in lakes. Canadian Journal of Fisheries and Aquatic Sciences 58, 1905–1908.
Edler, L., S. Fernöb, M.G. Lindc, R. Lundbergb and P.O. Nilssond. 1985. Mortality of dogs associated with a bloom of the cyanobacterium Nodularia spumigena in the Baltic Sea. Ophelia 24(2): 103-109.
Fawell, J.K., C. P. James, and H. A. James. 1994. Toxins from blue-green algae: toxicological assessment of microcystin-LR and a method for its determination in water. Foundation for Water Research.
Lévesque, B., M. Gervais, P. Chevalier, D. Gauvin, E. Anassour-laouan-sidi, S. Gingras, N. Fortin, G.
Brisson, C. Greer, and D. Bird. 2014. Science of the Total Environment Prospective study of
acute health effects in relation to exposure to cyanobacteria. Science of the Total Environment
466-467:397–403.
Lin, C. J., T. J. Wade, E. A. Sams, A. P. Dufour, A. D. Chapman, and E. D. Hilborn. 2016. A Prospective
Study of Marine Phytoplankton and Reported Illness among Recreational Beachgoers in Puerto
Rico, 2009.
Lindon, M. and S. Heiskary. 2009. Blue-greeen algal toxin (microcystin) levels in Minnesota lakes. Lake
and Reservoir Management 25:240-252.
Macharia, A. N. 2012. Reconstructing paleoenvironments using a mass-energy flux framework.
University of Utah Dissertation.
New Hampshire Department of Environmental Services. 2015. 2014 Section 305(b) and 303(d) Consolidated assessment and listing methodology. NHDEQ-R-WD-15-9. Available at: http://des.nh.gov/organization/divisions/water/wmb/swqa/documents/calm.pdf
Pilotto, L. S., R.M. Douglas, M.D. Burch, S. Cameron, M. Beers, G.J. Rouch, and C. Moore. 1997. Health effects of exposure to cyanobacteria (blue–green algae) during recreational water–related activities. Australian and New Zealand Journal of Public Health, 21(6), 562-566.
Rogalus, M.K., and M.C. Watzin. 2008. Evaluation of sampling and screening techniques for tiered
monitoring of toxic cyanobacteria in lakes. Harmful Algae 7: 504-514.
Stewart, I., P. M. Webb, P. J. Schluter, L. E. Fleming, J. W. B. Jr, M. Gantar, L. C. Backer, and G. R.
Shaw. 2006. Epidemiology of recreational exposure to freshwater cyanobacteria – an
international prospective cohort study. BMC Public Health 11:1–11.
Taranu, Z.e., I. Gregory-Eaves, P.R. Leavitt, L. Bunting, T. Buchaca, J. Catalan, I. Domaizon, P.
Guilizzoni, A. Lami, S. McGowan, H. Moorhouse, G. Morabito, F.R. Pick, M.A. Stevenson, P.L.
Thompson, R.D. Vinebrooke. 2015. Acceleration of cyanobacterial dominance in north
temperate‐ subarctic lakes during the Anthropocene. Ecology Letters 18:375–384.
United States Environmental Protection Agency. 2015. Health Effects Support Document for the
Cyanobacterial Toxin Microcystins. https://www.epa.gov/sites/production/files/2015-
06/documents/microcystins-support-report-2015.pdf.
Utah Division of Water Quality. 2016. Utah’s 303(d) Assessment Methodology: 2016 Integrated
Report. Available at:
Chapter 5: Narrative Standard Assessment of Recreational Use Support in Lakes and Reservoirs and Application to Utah Lake
Final 2016 IR: version 2.1 Page 26
http://www.deq.utah.gov/ProgramsServices/programs/water/wqmanagement/assessment/d
ocs/2015/03Mar/303d_AsseesmentMethodology.pdf
Utah Department of Natural Resources. 2016. State Parks Visitation Data.
http://stateparks.utah.gov/resources/park-visitation-data/
Utah Lake Commission. 2009. Utah Lake Master Plan. http://utahlake.gov/master-plan/
World Health Organization. 2003. Guidelines for safe recreational water environments, Volume 1,
Coastal and Fresh Waters.
http://apps.who.int/iris/bitstream/10665/42591/1/9241545801.pdf
Wisconsin Department of Natural Resources. 2016. Wisconsin 2016 Consolidated Assessment and
Listing Methodology (WisCALM) for CWQ Section 303(d) and 305(b) Integrated Reporting.
Yuan, L.L., A.I. Pollard, S. Pather, J.L. Oliver, and L. D’Anglada. 2014. Managing microcystin:
identifying national-scale thresholds for total nitrogen and chlorophyll a. Freshwater Biology
59: 1970-1981.
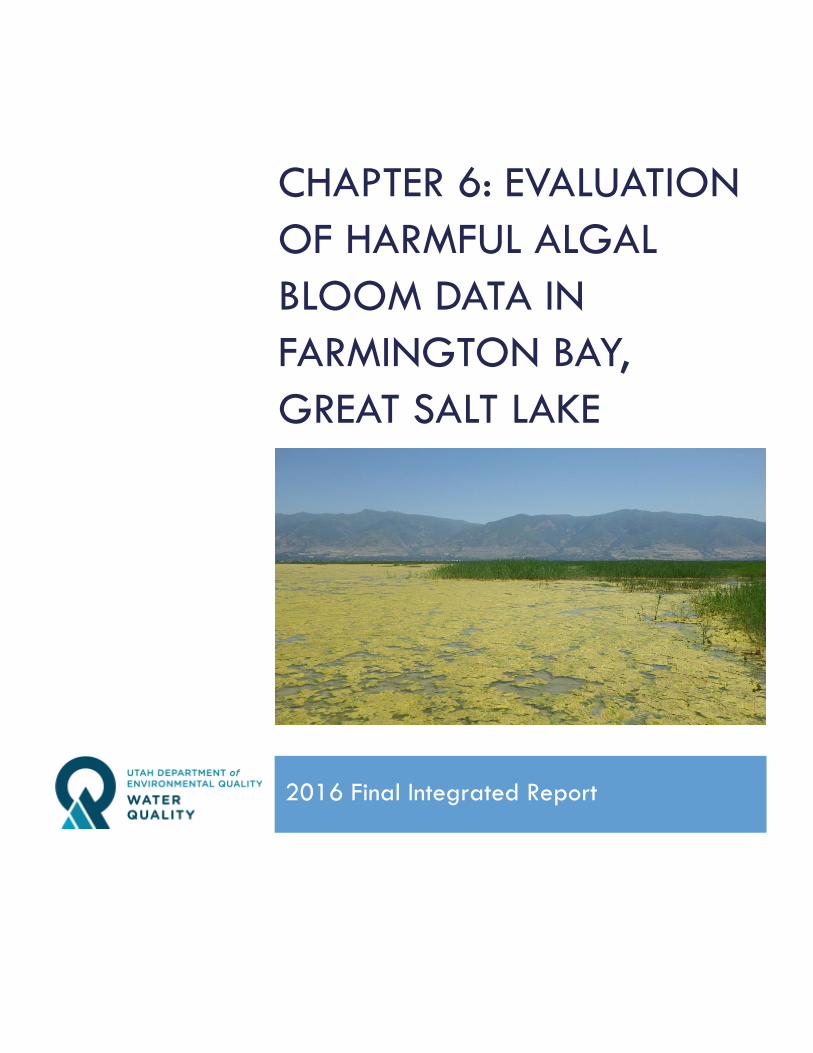
CHAPTER 6: EVALUATION
OF HARMFUL ALGAL
BLOOM DATA IN
FARMINGTON BAY,
GREAT SALT LAKE
2016 Final Integrated Report

Chapter 6: Evaluation of Harmful Algal Bloom Data in Farmington Bay
Final 2016 IR: version 2.1 Page 2
[This page is intentionally left blank].
Chapter 6: Evaluation of Harmful Algal Bloom Data in Farmington Bay
Final 2016 IR: version 2.1 Page 3
CONTENTS
CONTENTS .................................................................................................................................................. 3
ABBREVIATIONS ......................................................................................................................................... 4
FIGURES ...................................................................................................................................................... 5
TABLES ........................................................................................................................................................ 6
INTRODUCTION .......................................................................................................................................... 7
Recreational Uses in Farmington Bay .............................................................................................................................. 7
Available data .................................................................................................................................................................... 8
Harmful Algal Bloom Indicators ........................................................................................................................................ 8
Cyanobacteria Cell Counts ........................................................................................................................................ 8
Cyanotoxin Concentration Indicators ....................................................................................................................... 9
Chlorophyll a Concentration Indicators ................................................................................................................ 10
RESULTS AND DISCUSSION ...................................................................................................................... 11
Cyanobacteria Cell Counts ............................................................................................................................................. 11
Cyanotoxin Concentrations ............................................................................................................................................. 11
Chlorophyll a Concentrations ......................................................................................................................................... 13
SUMMARY ................................................................................................................................................ 15
LITERATURE CITED .................................................................................................................................... 16
Chapter 6: Evaluation of Harmful Algal Bloom Data in Farmington Bay
Final 2016 IR: version 2.1 Page 4
ABBREVIATIONS
< less than
> greater then
cell(s)/mL cell(s) per mililiter
CWA Clean Water Act
EPA U.S. Environmental Protection Agency
HAB(s) harmful algal bloom(s)
IR Integrated report
mL milliliter
UAC Utah Administrative Code
UDWQ Utah Division of Water Quality
WHO World Health Organization
μg/l microgram per liter
Chapter 6: Evaluation of Harmful Algal Bloom Data in Farmington Bay
Final 2016 IR: version 2.1 Page 5
FIGURES
Figure 1. Cyanobacteria concentrations for all samples from the aggregated stakeholder datasets (n=68). The 100,000 cell/mL recreational use HAB indicator is identified by the dashed red line. 1 million cells/mL is shown as a dark red dashed line. ................... 11
Figure 2. The relationship between Nodularia cell concentrations (x-axis) and concentrations of the cyanotoxin Nodularin (y-axis) in Farmington Bay showing a significant increase in Nodularin concentrations at 100,000 cells/mL of Nodularia. Figure from Marden et al. 2015. .............................................................................................................................................. 12
Figure 3. Nodularin concentrations in Farmington Bay by location replotted from Marden et al. 2015. The human health risk level for microcystin-LR (20 µg/L) is plotted as a dashed red line. .................................................................................................................................. 13
Figure 4. Chlorophyll a concentrations in Farmington Bay. The WHO indicator for human health risk (50 µg/L) is identified by the dashed red line. .................................................................... 14
Chapter 6: Evaluation of Harmful Algal Bloom Data in Farmington Bay
Final 2016 IR: version 2.1 Page 6
TABLES
Table 1. WHO recommended thresholds of human health risk for cyanobacteria, microcystin-LR, and chlorophyll a. ................................................................................................................................. 8
Table 2. Number and percent of exceedances in Farmington Bay for all three indicators at human health risk thresholds as defined by WHO. Thresholds for microcystin-LR are used for Nodularin benchmarks. ...................................................................................................... 15
Chapter 6: Evaluation of Harmful Algal Bloom Data in Farmington Bay
Final 2016 IR: version 2.1 Page 7
INTRODUCTION The Utah Division of Water Quality (UDWQ) performed an evaluation of data related to harmful
algal blooms that could pose a health risk to recreational users in Farmington Bay. Extensive datasets
were submitted to UDWQ by two stakeholders, the Central Davis Sewer District and Utah State
University, and were aggregated for the purpose of this evaluation. The data were compared to
indicators of human health risks for harmful algal blooms (HABs) to provide context to the public about
potential risks associated with recreating in Farmington Bay. HABs can adversely affect human health
during recreational activities in and on the water. UDWQ is obligated to analyze these data and
report findings to the public. In this chapter, UDWQ discusses the recreational uses of Farmington Bay,
HAB indicators, and the results of the data evaluation.
When developing the 2016 IR assessment methods, UDWQ did not anticipate having new data that
could be used to perform a beneficial use assessment in Farmington Bay or Great Salt Lake and
therefore deferred any 303(d) listing decisions until further methods were developed and data
collected. The HAB assessment methods adopted in 2015, and applied to freshwater lakes in the
2016 Integrated Report, combined with the recently available data for HABs in Farmington Bay
represents a significant step forward in UDWQ’s ability to assess recreational uses in Farmington Bay.
UDWQ intends to assess recreational use support in Farmington Bay using Utah’s Narrative Standard
in the 2018 Integrated Report. For the 2016 IR, Farmington Bay remains in Category 3C - assessment
methods in development. This chapter constitutes a status update on the monitoring, management, and
progress UDWQ has made towards developing an assessment methods for Great Salt Lake.
Recreational Uses in Farmington Bay
Like other portions of Great Salt Lake, Farmington Bay has a single beneficial use classification that
includes protections for both recreational and aquatic wildlife beneficial uses. These uses are,
“Infrequent primary and secondary contact recreation, waterfowl, shore birds and other water-
oriented wildlife including their necessary food chain,” (UAC R317-2-6).
Recreational uses in Farmington Bay are known to include activities such as air boating, kayaking,
canoeing, hunting, and bird watching. Air boating is a popular recreational use of Farmington Bay. R.
Jefre Hicks, secretary and treasurer of the Utah Airboat Association, estimates that as many as 50 air
boat trips occur per weekend from mid-September through December and 30 airboat trips per
weekend in January and February (personal communication between Jodi Gardberg and R. Jefre
Hicks, March 31, 2016). During the weekdays, there are usually 3 to 8 airboats per day on
Farmington Bay. Some users estimate that they air boat on Farmington Bay as much as 20-50 times
annually (2016 IR comment letter E). While air boating, recreationists are exposed through dermal
contact with the waterbody and potential inhalation from water spray. Much of the western shoreline
of Farmington Bay is formed by Antelope Island State Park, one of the most popular Great Salt Lake
tourism and recreation destinations. The Antelope Island Causeway that runs along the north end of
Farmington Bay, serves as the first introduction many tourists have to Great Salt Lake. One of the
primary access points to the waters of Great Salt Lake, Antelope Island Marina, is located on Gilbert
Bay right outside the outlet from Farmington Bay and when water levels of Great Salt Lake are
higher, the marina is accessible to boaters for airboating, kayaking, paddle boarding, and canoeing.
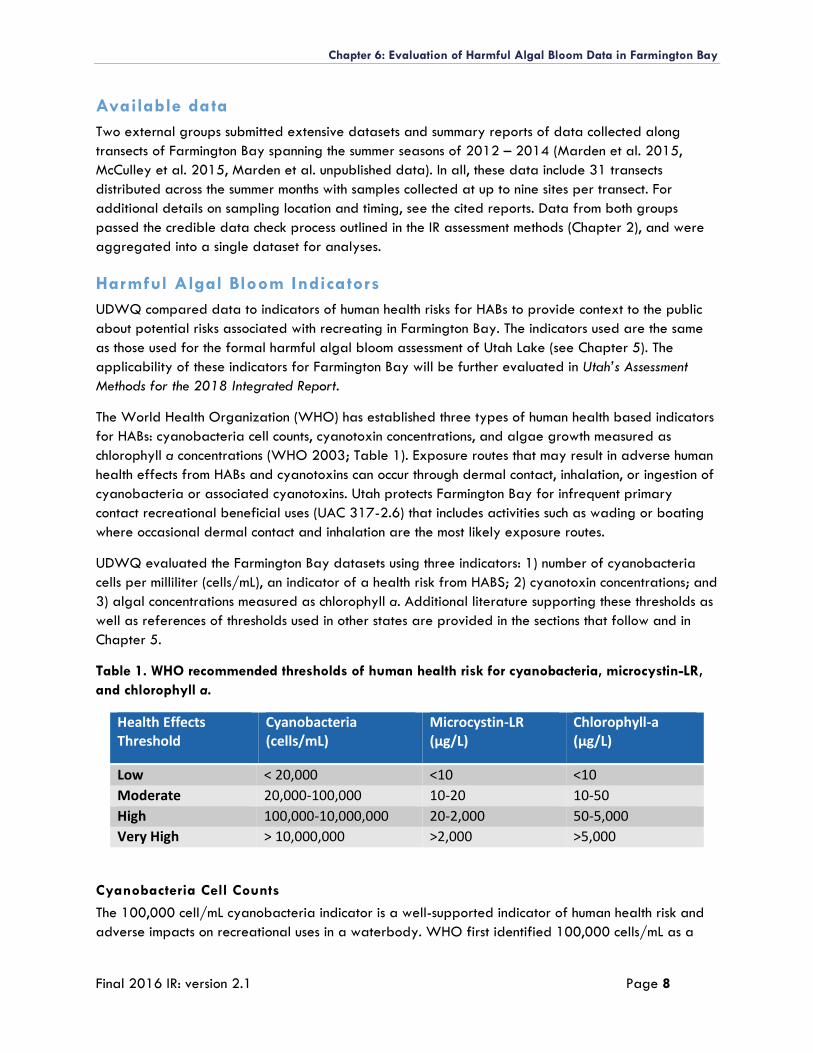
Chapter 6: Evaluation of Harmful Algal Bloom Data in Farmington Bay
Final 2016 IR: version 2.1 Page 8
Available data
Two external groups submitted extensive datasets and summary reports of data collected along
transects of Farmington Bay spanning the summer seasons of 2012 – 2014 (Marden et al. 2015,
McCulley et al. 2015, Marden et al. unpublished data). In all, these data include 31 transects
distributed across the summer months with samples collected at up to nine sites per transect. For
additional details on sampling location and timing, see the cited reports. Data from both groups
passed the credible data check process outlined in the IR assessment methods (Chapter 2), and were
aggregated into a single dataset for analyses.
Harmful Algal Bloom Indicators
UDWQ compared data to indicators of human health risks for HABs to provide context to the public
about potential risks associated with recreating in Farmington Bay. The indicators used are the same
as those used for the formal harmful algal bloom assessment of Utah Lake (see Chapter 5). The
applicability of these indicators for Farmington Bay will be further evaluated in Utah’s Assessment
Methods for the 2018 Integrated Report.
The World Health Organization (WHO) has established three types of human health based indicators
for HABs: cyanobacteria cell counts, cyanotoxin concentrations, and algae growth measured as
chlorophyll a concentrations (WHO 2003; Table 1). Exposure routes that may result in adverse human
health effects from HABs and cyanotoxins can occur through dermal contact, inhalation, or ingestion of
cyanobacteria or associated cyanotoxins. Utah protects Farmington Bay for infrequent primary
contact recreational beneficial uses (UAC 317-2.6) that includes activities such as wading or boating
where occasional dermal contact and inhalation are the most likely exposure routes.
UDWQ evaluated the Farmington Bay datasets using three indicators: 1) number of cyanobacteria
cells per milliliter (cells/mL), an indicator of a health risk from HABS; 2) cyanotoxin concentrations; and
3) algal concentrations measured as chlorophyll a. Additional literature supporting these thresholds as
well as references of thresholds used in other states are provided in the sections that follow and in
Chapter 5.
Table 1. WHO recommended thresholds of human health risk for cyanobacteria, microcystin-LR,
and chlorophyll a.
Health Effects Threshold
Cyanobacteria (cells/mL)
Microcystin-LR (µg/L)
Chlorophyll-a (µg/L)
Low < 20,000 <10 <10
Moderate 20,000-100,000 10-20 10-50
High 100,000-10,000,000 20-2,000 50-5,000
Very High > 10,000,000 >2,000 >5,000
Cyanobacteria Cell Counts
The 100,000 cell/mL cyanobacteria indicator is a well-supported indicator of human health risk and
adverse impacts on recreational uses in a waterbody. WHO first identified 100,000 cells/mL as a
Chapter 6: Evaluation of Harmful Algal Bloom Data in Farmington Bay
Final 2016 IR: version 2.1 Page 9
threshold representing high human health risk in 1999. WHO identifies health risks including acute
poisoning, long-term illness, skin irritation, and gastrointestinal illness associated with exposure to
cyanobacteria at these levels. The cell count threshold is not taxon-specific, but rather represents an
expected risk of HAB exposure based on overall cyanobacteria occurrence. Review of the studies
underlying the WHO recommendations as well as other research literature strengthens the association
between cyanobacteria and human health issues. Prominent studies on the human health effects of
recreational exposure to cyanobacteria consistently report human health issues such as gastrointestinal
distress, headaches and earaches, skin or eye irritation, and temporary respiratory illness occurring at
cyanobacteria cell counts at or below 100,000 cells/mL (Pilotto et al. 1997, Stewart et al. 2006,
Levesque et al. 2014, Lin et al. 2016). For example, Pilotto et al. 1997 identify a significantly higher
occurrence of these types of symptoms at a threshold of only 5,000 cells/mL. Levesque et al. 2014
identified increased gastrointestinal illness associated with limited contact activities such as fishing and
boating at cyanobacteria cell counts exceeding 20,000 cells/mL, demonstrating that even limited
contact with water containing greater than 100,000 cells/mL of cyanobacteria could result in adverse
health effects for recreational users. Stewart et al. 2006 and Lin et al. 2016 also both identify similar
adverse human health effects associated with recreational contact to cyanobacteria cell counts at or
below 100,000 cells/mL. Importantly, the adverse health effects observed in several of these studies
(Pilotto et al. 1997, Stewart et al. 2006, Lin et al. 2015) were not necessarily associated with
cyanotoxin concentrations, suggesting cyanotoxin concentrations alone are not sufficient for
determining health risk associated with HABs.
Cyanotoxin Concentration Indicators
For recreational waters, WHO identifies microcystin-LR concentrations greater than 20 µg/L as a
human health risk. The WHO guideline for microcystin in recreational waters is based on a tolerable
daily intake calculated from a microcystin exposure study (Fawell et al. 1994) and the expected
incidental consumption of water of a 60 kilogram adult. However, several states and countries have
set lower thresholds for human health advisories based on studies that have identified lower values for
microcystin toxicity or based on expected recreational exposures for small children.
Data and reports for Farmington Bay identify extensive occurrence of HABs which are often
dominated by the toxin producing cyanobacteria, Nodularia (Marden et al. 2015, McCulley et al.
2015), an algal species common to brackish waters such as Farmington Bay. Nodularia can produce the
cyanotoxin nodularin. Although nodularin-specific benchmarks are not yet available, nodularin is similar
to microcystin-LR with respect to chemical structures, modes of toxicity, experimental lethal dose
values, and potential for bioaccumulation of both toxins (Karjalainen et al. 2008, Pearson et al. 2010,
Rinehart et al. 1988, Sipia et al. 2006, USEPA 2015, Yoshizawa et al. 1990, Chen et al. 2013). The
WHO Guidelines for Safe Recreational Water Environments place the lethal dose of 50% for mice
for microcystin-LR at 60 µg/kg and for nodularin at 30-50 µg/kg (WHO 2003, Table 8.1). Both
toxins have similar modes of action and can result in liver hemorrhaging, tissue damage, and liver
failure (Pearson et al. 2010). Although nodularin mortality in humans is rare or undocumented, it has
been documented in dogs (e.g. Edler et al. 1985, Harding et al. 1995, Nehring and Stefan 1993).
Another potentially harmful cyanobacteria, Pseudanabaena, occurs in Farmington Bay in very high numbers
(>12 million cells/mL). Pseudanabaena is relatively understudied, but toxin production has been identified
within the genus (Oudra et al. 2002, Teneva et al. 2009), and the genus has been associated with adverse
biological effects in bioassays on mice (Oudra et al. 2002, Rangel et al. 2014) and cladocerans (Olvera-
Chapter 6: Evaluation of Harmful Algal Bloom Data in Farmington Bay
Final 2016 IR: version 2.1 Page 10
Ramirez et al. 2010). One study that included the species of Pseudanabaena known to occur in Farmington
Bay, P. catenata, identified adverse health effects of the cyanobacteria on Artemia that were not
associated with known cyanotoxins (Mohamed and Al-Shehri 2015), suggesting this species may
produce other potentially harmful substances that have not yet been fully described in the scientific
literature.
Chlorophyll a Concentration Indicators
As with the cyanotoxin concentration indicators, WHO has established recommended thresholds for
chlorophyll a concentrations that are associated with adverse human health effects. WHO identifies
chlorophyll a concentrations greater than 50 µg/L as a potential human health risk. The chlorophyll a
indicator is only used as a supporting indicator in the IR, and assessment decisions have not been
based solely on the chlorophyll a threshold. The chlorophyll a indicator as used in the IR is not intended
to assess whether individual HAB events have occurred in a waterbody. Instead, this indicator is
intended to provide supporting information regarding the overall productivity of a waterbody and its
underlying potential for HABs. Although high chlorophyll a levels do not necessarily indicate an
immediate human health risk, they may be indicative of the potential for frequent and intense HAB
events and associated health impacts from recreational contact. For example, several scientific studies
identify a pattern of increasing cyanobacterial dominance (as either density or biovolume) with
increasing chlorophyll a concentrations in lakes and reservoirs (e.g. Downing et al. 2001, Rogalus and
Watzin 2007). Similarly, the likelihood of occurrence of cyanotoxins has also been shown to increase
with elevated chlorophyll a concentrations (WHO 2003, Rogalus and Watzin 2007, Lindon and
Heiskary 2009, Yuan et al. 2014). This pattern of a positive relationship between cyanotoxins and
chlorophyll a concentrations has been identified both within a single lake as demonstrated by Rogalus
and Watzin (2007) in Lake Champlain and across lakes at a national scale as demonstrated by Yuan
et al. 2014 using the EPA’s National Lakes Assessment dataset.
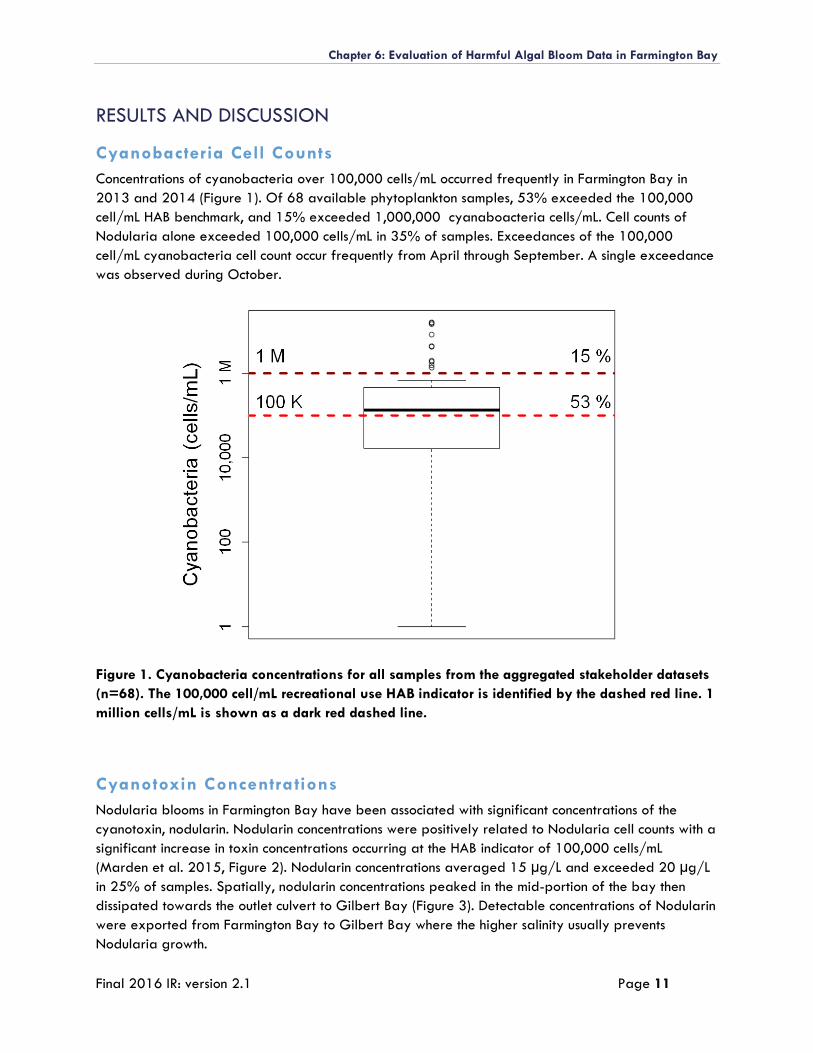
Chapter 6: Evaluation of Harmful Algal Bloom Data in Farmington Bay
Final 2016 IR: version 2.1 Page 11
RESULTS AND DISCUSSION
Cyanobacteria Cell Counts
Concentrations of cyanobacteria over 100,000 cells/mL occurred frequently in Farmington Bay in
2013 and 2014 (Figure 1). Of 68 available phytoplankton samples, 53% exceeded the 100,000
cell/mL HAB benchmark, and 15% exceeded 1,000,000 cyanaboacteria cells/mL. Cell counts of
Nodularia alone exceeded 100,000 cells/mL in 35% of samples. Exceedances of the 100,000
cell/mL cyanobacteria cell count occur frequently from April through September. A single exceedance
was observed during October.
Figure 1. Cyanobacteria concentrations for all samples from the aggregated stakeholder datasets
(n=68). The 100,000 cell/mL recreational use HAB indicator is identified by the dashed red line. 1
million cells/mL is shown as a dark red dashed line.
Cyanotoxin Concentrations
Nodularia blooms in Farmington Bay have been associated with significant concentrations of the
cyanotoxin, nodularin. Nodularin concentrations were positively related to Nodularia cell counts with a
significant increase in toxin concentrations occurring at the HAB indicator of 100,000 cells/mL
(Marden et al. 2015, Figure 2). Nodularin concentrations averaged 15 µg/L and exceeded 20 µg/L
in 25% of samples. Spatially, nodularin concentrations peaked in the mid-portion of the bay then
dissipated towards the outlet culvert to Gilbert Bay (Figure 3). Detectable concentrations of Nodularin
were exported from Farmington Bay to Gilbert Bay where the higher salinity usually prevents
Nodularia growth.
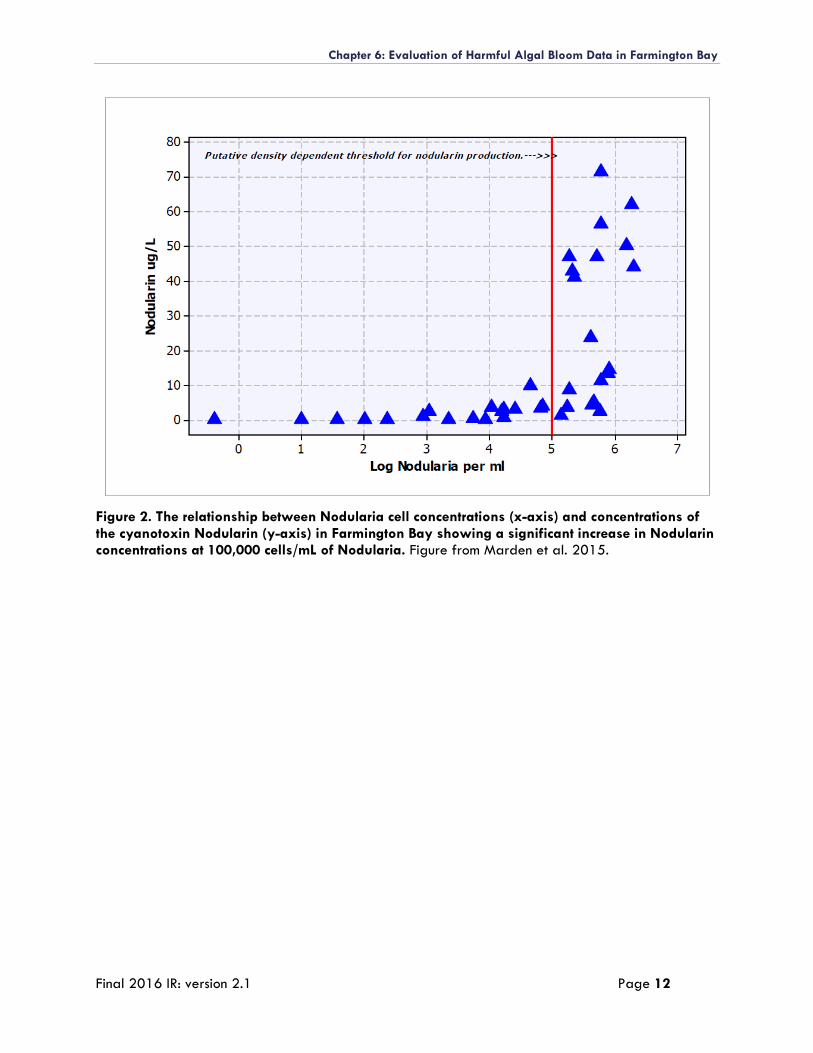
Chapter 6: Evaluation of Harmful Algal Bloom Data in Farmington Bay
Final 2016 IR: version 2.1 Page 12
Figure 2. The relationship between Nodularia cell concentrations (x-axis) and concentrations of the cyanotoxin Nodularin (y-axis) in Farmington Bay showing a significant increase in Nodularin concentrations at 100,000 cells/mL of Nodularia. Figure from Marden et al. 2015.
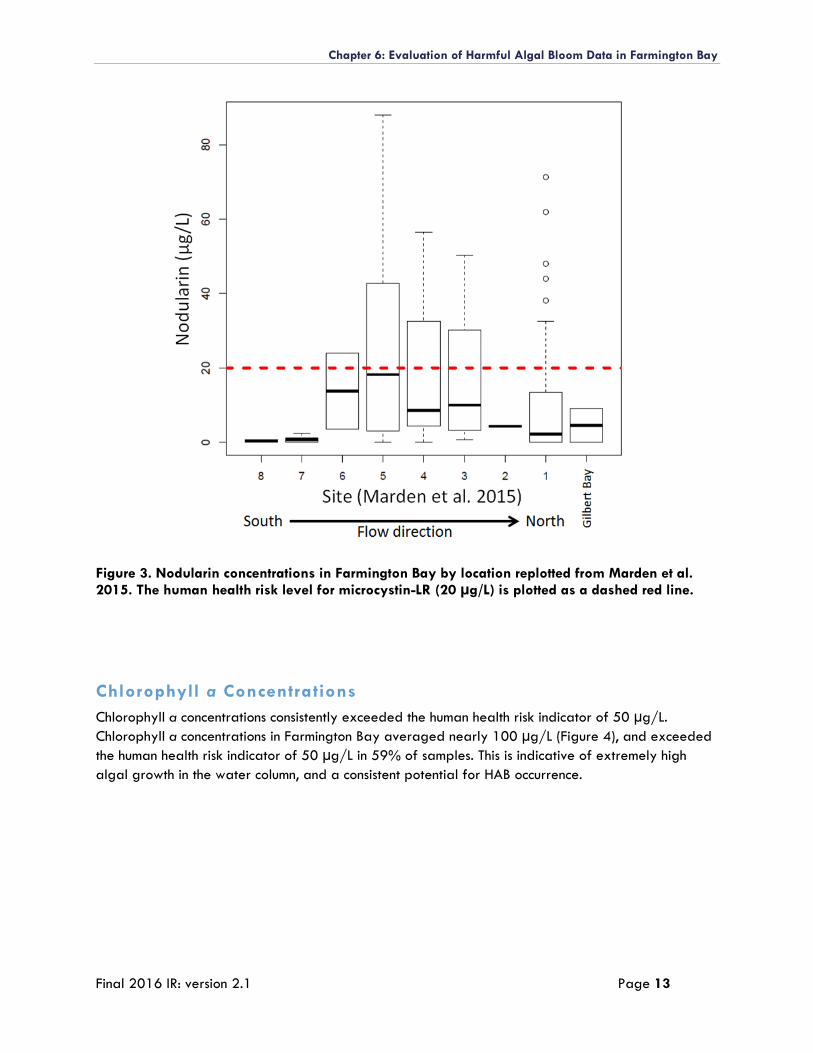
Chapter 6: Evaluation of Harmful Algal Bloom Data in Farmington Bay
Final 2016 IR: version 2.1 Page 13
Figure 3. Nodularin concentrations in Farmington Bay by location replotted from Marden et al. 2015. The human health risk level for microcystin-LR (20 µg/L) is plotted as a dashed red line.
Chlorophyll a Concentrations
Chlorophyll a concentrations consistently exceeded the human health risk indicator of 50 µg/L.
Chlorophyll a concentrations in Farmington Bay averaged nearly 100 µg/L (Figure 4), and exceeded
the human health risk indicator of 50 µg/L in 59% of samples. This is indicative of extremely high
algal growth in the water column, and a consistent potential for HAB occurrence.
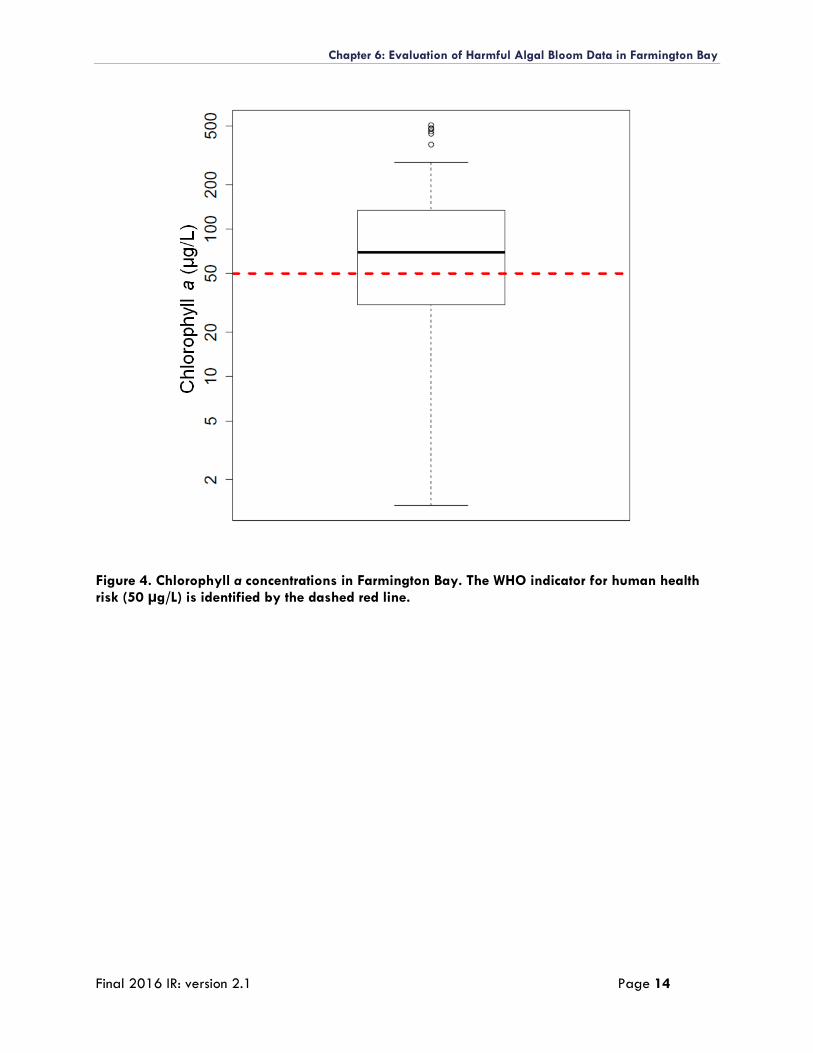
Chapter 6: Evaluation of Harmful Algal Bloom Data in Farmington Bay
Final 2016 IR: version 2.1 Page 14
Figure 4. Chlorophyll a concentrations in Farmington Bay. The WHO indicator for human health risk (50 µg/L) is identified by the dashed red line.
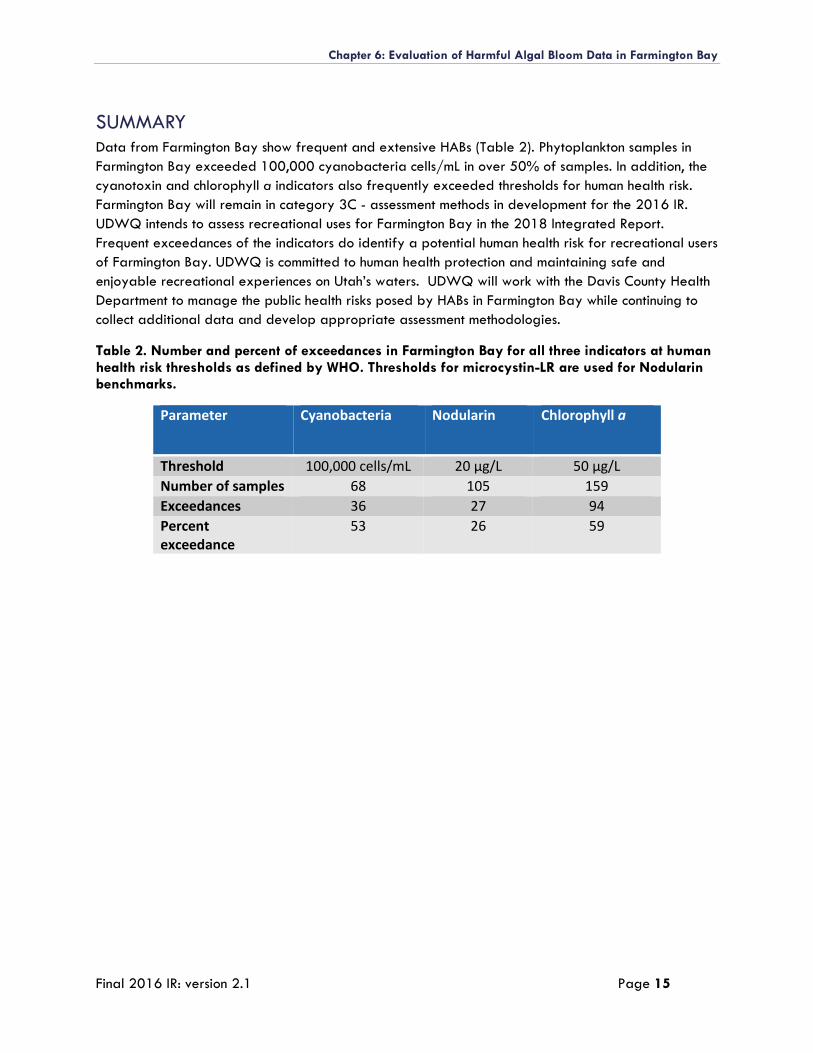
Chapter 6: Evaluation of Harmful Algal Bloom Data in Farmington Bay
Final 2016 IR: version 2.1 Page 15
SUMMARY Data from Farmington Bay show frequent and extensive HABs (Table 2). Phytoplankton samples in
Farmington Bay exceeded 100,000 cyanobacteria cells/mL in over 50% of samples. In addition, the
cyanotoxin and chlorophyll a indicators also frequently exceeded thresholds for human health risk.
Farmington Bay will remain in category 3C - assessment methods in development for the 2016 IR.
UDWQ intends to assess recreational uses for Farmington Bay in the 2018 Integrated Report.
Frequent exceedances of the indicators do identify a potential human health risk for recreational users
of Farmington Bay. UDWQ is committed to human health protection and maintaining safe and
enjoyable recreational experiences on Utah’s waters. UDWQ will work with the Davis County Health
Department to manage the public health risks posed by HABs in Farmington Bay while continuing to
collect additional data and develop appropriate assessment methodologies.
Table 2. Number and percent of exceedances in Farmington Bay for all three indicators at human health risk thresholds as defined by WHO. Thresholds for microcystin-LR are used for Nodularin benchmarks.
Parameter Cyanobacteria Nodularin Chlorophyll a
Threshold 100,000 cells/mL 20 µg/L 50 µg/L
Number of samples 68 105 159
Exceedances 36 27 94
Percent exceedance
53 26 59
Chapter 6: Evaluation of Harmful Algal Bloom Data in Farmington Bay
Final 2016 IR: version 2.1 Page 16
LITERATURE CITED
Arizona Department of Environmental Quality. 2009. Water Quality Standards for Surface Waters.
Chen, Y., D. Shen, and D. Fang. 2013. Clinica Chimica Acta Nodularins in poisoning. Clinica Chimica
Acta 425:18–29.
Downing, J.A., S.B. Watson, and E. McCauley. 2001. Predicting cyanobacterial dominance in lakes. Canadian Journal of Fisheries and Aquatic Sciences 58, 1905–1908.
Edler, L., S. Fernöb, M.G. Lindc, R. Lundbergb and P.O. Nilssond. 1985. Mortality of dogs associated with a bloom of the cyanobacterium Nodularia spumigena in the Baltic Sea. Ophelia 24(2): 103-109.
Fawell, J.K., C. P. James, and H. A. James. 1994. Toxins from blue-green algae: toxicological assessment of microcystin-LR and a method for its determination in water. Foundation for Water Research.
Harding, W.R., N. Rowe, J.C. Wessels, K.A. Beattie, and G.A. Codd. 1995. Death of a dog attributed to the cyanobacterial (blue-green algal) hepatotoxin nodularin in South Africa. Journal of the South African Veterinary Association 66(4): 256-259.
Lévesque, B., M. Gervais, P. Chevalier, D. Gauvin, E. Anassour-laouan-sidi, S. Gingras, N. Fortin, G.
Brisson, C. Greer, and D. Bird. 2014. Science of the Total Environment Prospective study of
acute health effects in relation to exposure to cyanobacteria. Science of the Total Environment
466-467:397–403.
Lin, C. J., T. J. Wade, E. A. Sams, A. P. Dufour, A. D. Chapman, and E. D. Hilborn. 2015. A Prospective
Study of Marine Phytoplankton and Reported Illness among Recreational Beachgoers in Puerto
Rico, 2009.
Lindon, M. and S. Heiskary. 2009. Blue-greeen algal toxin (microcystin) levels in Minnesota lakes. Lake
and Reservoir Management 25:240-252.
Marden, B., T. Miller, and D. Richards. 2015. Factors Influencing Cyanobacteria Blooms in Farmington
Bay , Great Salt Lake , Utah.
McCulley, E., W. Wurtsbaugh, and B. Barnes. 2015. Factors affecting the spatial and temporal
variability of cyanobacteria, metals, and biota in the Great Salt Lake, Utah. Report submitted
to Utah Division of Water Quality, Department of Environmental Quality and Utah Division of
Forestry, Fire and State Lands, Department of Natural Resources.
Mohamed, Z. A., and A.M. Al-Shehri. 2015. Biodiversity and toxin production of cyanobacteria in
mangrove swamps in the Red Sea off the southern coast of Saudi Arabia. Botanica Marina, 58(1), 23-
34.
Nehring, S. 1993. Mortality of dogs associated with a mass development of Nodularia spumigena (Cyanophyceae) in a brackish lake at the German North Sea coast. Journal of Plankton Research 15(7): 867-872.
New Hampshire Department of Environmental Services. 2015. 2014 Section 305(b) and 303(d) Consolidated assessment and listing methodology. NHDEQ-R-WD-15-9. Available at: http://des.nh.gov/organization/divisions/water/wmb/swqa/documents/calm.pdf
Olvera-ramírez, R., C. Centeno-ramos, and F. Martínez-jerónimo. 2010. Toxic effects of
Pseudanabaena tenuis ( Cyanobacteria ) on the cladocerans Daphnia magna and
Ceriodaphnia dubia Efectos tóxicos de Pseudanabaena tenuis ( Cyanobacteria ) en los
cladóceros Daphnia magna y Ceriodaphnia dubia 20:203–212.
Chapter 6: Evaluation of Harmful Algal Bloom Data in Farmington Bay
Final 2016 IR: version 2.1 Page 17
Oudra, B., M. Loudiki, V. Vasconcelos, B. Sabour, B. Sbiyyaa, K. Oufdou, and N. Mezrioui. 2002.
Detection and quantification of microcystins from cyanobacteria strains isolated from reservoirs and
ponds in Morocco. Environmental toxicology, 17(1), 32-39.
Pearson, L., T. Mihali, M. Moffitt, R. Kellmann, and B. Neilan. 2010. On the Chemistry, Toxicology and
Genetics of the Cyanobacterial Toxins, Microcystin, Nodularin, Saxitoxin and
Cylindrospermopsin. Marine Drugs 8:1650–1680.
Pilotto, L. S., R.M. Douglas, M.D. Burch, S. Cameron, M. Beers, G.J. Rouch, and C. Moore. 1997. Health effects of exposure to cyanobacteria (blue–green algae) during recreational water–related activities. Australian and New Zealand Journal of Public Health, 21(6), 562-566.
Rangel, M., J. C. G. Martins, G. A. A. Conserva, A. Costa-neves, L. R. De Carvalho, and P. Section.
2014. marine drugs:508–524.
Rogalus, M.K., and M.C. Watzin. 2008. Evaluation of sampling and screening techniques for tiered
monitoring of toxic cyanobacteria in lakes. Harmful Algae 7: 504-514.
Rinehart, K. L., K. Harada, M. Namikoshi, C. Chen, and C. A. Harvis. 1988. Nodularin, microcystin-LR
and the configuration of Adda. Journal of the American Chemical Society 110:8557–8558.
Sipiä, V. O., O. Sjövall, T. Valtonen, D. L. Barnaby, G. a Codd, J. S. Metcalf, and J. a O. Meriluoto.
2006. Analysis of nodularin-R in eider (Somateria mollissima), roach (Rutilus rutilus L.), and
flounder (Platichthys flesus L.) liver and muscle samples from the western Gulf of Finland,
northern Baltic Sea. Environmental Toxicology and Chemistry 25:2834–2839.
Stewart, I., P. M. Webb, P. J. Schluter, L. E. Fleming, J. W. B. Jr, M. Gantar, L. C. Backer, and G. R.
Shaw. 2006. Epidemiology of recreational exposure to freshwater cyanobacteria – an
international prospective cohort study 11:1–11.
Teneva, I., R. Mladenov, and B. Dzhambazov. 2009. Toxic effects of extracts from Pseudanabaena
galeata (Cyanoprokaryota) in mice and cell cultures in vitro. Nat. Sci. Hum, 12, 237-243.
United States Environmental Protection Agency. 2015. Health Effects Support Document for the
Cyanobacterial Toxin Microcystins. https://www.epa.gov/sites/production/files/2015-
06/documents/microcystins-support-report-2015.pdf.
Utah Department of Natural Resources. 2016. State Parks Visitation Data.
http://stateparks.utah.gov/resources/park-visitation-data/
Utah Division of Water Quality. 2016. Utah’s 303(d) Assessment Methodology: 2016 Integrated
Report. Available at:
http://www.deq.utah.gov/ProgramsServices/programs/water/wqmanagement/assessment/d
ocs/2015/03Mar/303d_AsseesmentMethodology.pdf
Utah Lake Commission. 2009. Utah Lake Master Plan. http://utahlake.gov/master-plan/
World Health Organization. 2003. Guidelines for safe recreational water environments, Volume 1,
Coastal and Fresh Waters.
http://apps.who.int/iris/bitstream/10665/42591/1/9241545801.pdf
Wisconsin Department of Natural Resources. 2016. Wisconsin 2016 Consolidated Assessment and
Listing Methodology (WisCALM) for CWQ Section 303(d) and 305(b) Integrated Reporting.
Yoshizawa, S., R. Matsushima, M. F. Watanabe, K. Harada, A. Ichihara, W. W. Carmichael, and H.
Fujiki. 1990. Inhibition of protein phosphatases by microcystis and nodularin associated with
hepatotoxicity. Journal of Cancer Research and Clinical Oncology 116:609–614.
Yuan, L.L., A.I. Pollard, S. Pather, J.L. Oliver, and L. D’Anglada. 2014. Managing microcystin:
identifying national-scale thresholds for total nitrogen and chlorophyll a. Freshwater Biology
59: 1970-1981.

Chapter 6: Evaluation of Harmful Algal Bloom Data in Farmington Bay
Final 2016 IR: version 2.1 Page 18
CHAPTER 7: UTAH’S
DRAFT ASSESSMENT
METHODS FOR HIGH
FREQUENCY DATA
AND PILOT
APPLICATION FOR
THE JORDAN RIVER
2016 Final Integrated Report

Chapter 7: Utah’s Draft Assessment Methods for High Frequency Data and Pilot Application for the Jordan River
[This page is intentionally left blank].
Final 2016 IR: version 2.1 Page 2
ACRONYMS
AU Assessment Unit
CWA Clean Water Act
DO Dissolved Oxygen
DWQ Utah Division of Water Quality
EPA U.S. Environmental Protection Agency
IR
MLID
Integrated Report
Monitoring Location ID
QA/QC
POR
POTW
WQS
Quality Assurance/Quality Control
Period-of-record
Publicly Owned Treatment Works
Water Quality Standard
Chapter 7: Utah’s Draft Assessment Methods for High Frequency Data and Pilot Application for the Jordan River
ContentsACRONYMS ...................................................................................................... 2
CONTENTS ........................................................................................................................... 3
INTRODUCTION ................................................................................................................... 4
Background ................................................................................................................................................ 4
Dissolved Oxygen .................................................................................................................................... 5
ANALYSIS AND INTERPRETATION OF HIGH FREQUENCY DISSOLVED OXYGEN DATA ................................................................................................................................... 6
Quality Assurance: Screening Raw DO Data ...................................................................................... 6
Assessing DO with High Frequency Data: Draft Methods ................................................................ 6
Primary Statistics: Assessing Acute and Chronic DO Impairments ................................................ 7
Consideration for Sensitive Life Stages .......................................................................................... 7
DO Minima Statistics as indicators of acute impairments ........................................................... 7
DO Average Statistics (7-day and 30-day) as indicators of chronic impairments ............... 7
Acute Assessment Procedures ........................................................................................................... 8
Chronic Assessment Procedures ........................................................................................................ 8
Secondary Statistics: Better Interpretations of DO Water Quality Concerns ............................ 9
JORDAN RIVER PILOT STUDY: AN APPLICATION OF DRAFT ASSESSMENT METHODS .......................................................................................................................... 10
Methods ................................................................................................................................................... 10
Results ...................................................................................................................................................... 12
QA/QC of the Jordan River DO Records ..................................................................................... 12
Site-Specific Characterization of DO on the Lower Jordan River ............................................ 12
3300 South Monitoring Location................................................................................................... 12
2100 South Monitoring Location................................................................................................... 14
800 South Monitoring Location ..................................................................................................... 16
300 North Monitoring Location ..................................................................................................... 18
Cudahy Lane Monitoring Location ................................................................................................ 20
Site DO Trends .................................................................................................................................... 22
DISCUSSION ...................................................................................................................... 24
Ongoing Considerations .................................................................................................................... 24
Index Period ..................................................................................................................................... 24
Longer-Term Temporal Variation ................................................................................................. 24
Draft Supplemental Summary Statistics ...................................................................................... 24
Conclusions .............................................................................................................................................. 25
LITERATURE CITED ............................................................................................................. 26
APPENDIX 1. ..................................................................................................................... 27
Chapter 7: Utah’s Draft Assessment Methods for High Frequency Data and Pilot Application for the Jordan River
2016 IR Draft Assessment Methods for High Frequency Data Page 4
INTRODUCTION
Utah’s Draft Assessment Methods and for High Frequency Data provide a framework for determining
whether a waterbody or segment within a waterbody supports or does not support the Dissolved Oxygen
(DO) criteria that were establish to protect the applicable aquatic life designated uses found in UAC R317-
2. These water quality criteria include several different averaging periods that prescribe the magnitude
and the duration of low levels of DO that should not be exceeded to maintain support groups of biota that
vary in their relative susceptibility to low DO conditions. The assessment methods include several summary
statisitics to facilitate the use of high frequency data to assess ambient conditions against both acute and
chronic criteria.
The draft assessments methods are intended to be as closely aligned with Utah’s existing water quality
criteria, and the underlyng rationale used to support these criteria (EPA 1986), as possible. The methods
also attempt to encapsulate the underlying rationale behind these criteria and the current scientific
evidence with respect to the various ways that low DO conditions can degrade the health of stream biota.
DWQ welcomes input on the draft assessment methods and recommendations for other approaches that
could be used to interpret high frequency DO data in a way that improves the accuracy and interpretation
of DO assessments. DWQ will evaluate and incorporate suggestions that are received, as appropriate, into
revised assessment methods that will be used to make impairment decisions in subsequent Integrated
Reports.
Background
DWQ’s current assessment methods for field parameters (e.g., DO, temperature, pH) are based on data
obtained from discrete water quality measurements (e.g., grab samples) during routine water quality
sampling activities. While ongoing assessments based on discrete water chemistry collections enable DWQ to
identify and address many water quality concerns, DWQ also acknowledges that there are important water
quality parameters where instantaneous measurements are often insufficient. For instance, discrete samples
are difficult to interpret for parameters that exhibit strong diel variation, such as dissolved oxygen, which can
result in either over- or under-protection of water quality, depending on the time of day when the samples
were collected.
Recent technological advances make obtaining high-frequency data (i.e., data collected on intervals of 1
minute to 1 hour to several hours) for field parameters more affordable and therefore more readily
available. In many cases, these data provide more ecologically meaningful water quality information,
particularly for temporally variable water quality parameters (i.e., dissolved oxygen concentration and
saturation, specific conductance, pH, temperature, and turbidity) (EPA 1986). For example, high frequency
data are more likely to reveal patterns of daily, weekly, monthly, or seasonal variation. Similarly, high
frequency data can be used to more accurately quantify important water quality summary statisitics such as
maxima (or minima) that are equally important determinants of threats to biological assemblages. In an
assessment context, high frequency characterizations of water quality more closely mirror the duration and
frequency components of water quality standards, which should lead to a reduction of both false positive and
false negative impairment decisions.
While high frequency data offer numerous advantages, there are several unique challenges with their
analysis and interpretation. For instance, the large data sets generated by such monitoring can be a
challenge to manage, apply Quality Assurance/Quality Control (QA/QC) procedures to, and ultimately to
interpret. For example, drift (systematic bias) sometimes occurs during long-term deployment of high
frequency data collection instruments and methods are required for identifying and addressing suspect data.
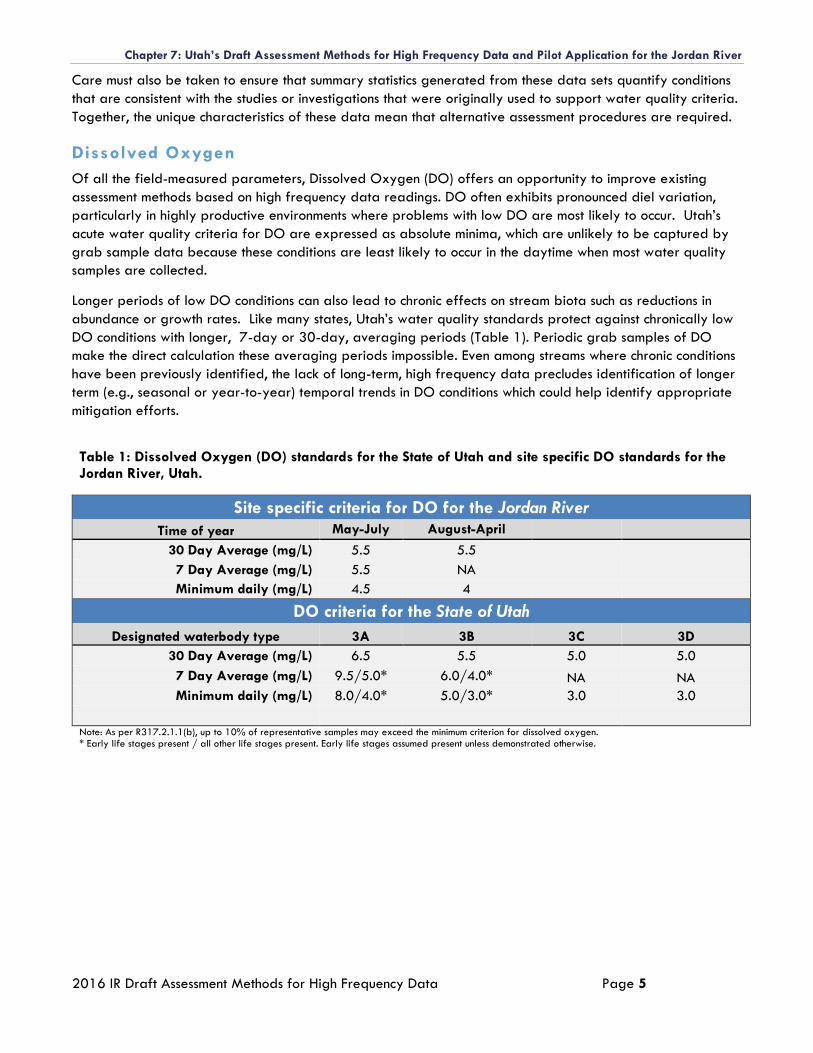
Chapter 7: Utah’s Draft Assessment Methods for High Frequency Data and Pilot Application for the Jordan River
2016 IR Draft Assessment Methods for High Frequency Data Page 5
Care must also be taken to ensure that summary statistics generated from these data sets quantify conditions
that are consistent with the studies or investigations that were originally used to support water quality criteria.
Together, the unique characteristics of these data mean that alternative assessment procedures are required.
Dissolved Oxygen
Of all the field-measured parameters, Dissolved Oxygen (DO) offers an opportunity to improve existing
assessment methods based on high frequency data readings. DO often exhibits pronounced diel variation,
particularly in highly productive environments where problems with low DO are most likely to occur. Utah’s
acute water quality criteria for DO are expressed as absolute minima, which are unlikely to be captured by
grab sample data because these conditions are least likely to occur in the daytime when most water quality
samples are collected.
Longer periods of low DO conditions can also lead to chronic effects on stream biota such as reductions in
abundance or growth rates. Like many states, Utah’s water quality standards protect against chronically low
DO conditions with longer, 7-day or 30-day, averaging periods (Table 1). Periodic grab samples of DO
make the direct calculation these averaging periods impossible. Even among streams where chronic conditions
have been previously identified, the lack of long-term, high frequency data precludes identification of longer
term (e.g., seasonal or year-to-year) temporal trends in DO conditions which could help identify appropriate
mitigation efforts.
Table 1: Dissolved Oxygen (DO) standards for the State of Utah and site specific DO standards for the Jordan River, Utah.
Site specific criteria for DO for the Jordan River
Time of year May-July August-April
30 Day Average (mg/L) 5.5 5.5
7 Day Average (mg/L) 5.5 NA
Minimum daily (mg/L) 4.5 4
DO criteria for the State of Utah
Designated waterbody type 3A 3B 3C 3D
30 Day Average (mg/L) 6.5 5.5 5.0 5.0
7 Day Average (mg/L) 9.5/5.0* 6.0/4.0* NA NA
Minimum daily (mg/L) 8.0/4.0* 5.0/3.0* 3.0 3.0
Note: As per R317.2.1.1(b), up to 10% of representative samples may exceed the minimum criterion for dissolved oxygen. * Early life stages present / all other life stages present. Early life stages assumed present unless demonstrated otherwise.
Chapter 7: Utah’s Draft Assessment Methods for High Frequency Data and Pilot Application for the Jordan River
2016 IR Draft Assessment Methods for High Frequency Data Page 6
ANALYSIS AND INTERPRETATION OF HIGH FREQUENCY DISSOLVED OXYGEN DATA
If high frequency data are to be used to make water quality assessment decisions, it is necessary to
summarize the data in a way that allows direct interpretation of the magnitude, duration and frequency
components of water quality standards. The selection of appropriate summary statistics should also align with
the scientific basis behind DO criteria, as described in the EPA guidance that provided their underlying
rationale. This section describes how DWQ proposes summarizing and assessing high frequency DO data,
and the underlying rationale behind the draft assessment methods.
Quality Assurance: Screening Raw DO Data
DWQ has developed a detailed QA/QC process for high frequency monitoring data. First, data sets are
graded into several discrete categories based on the relative rigour of collection methods (see Chapter 7
Appendix 1). High frequency data sets that receive data quality grades of an A or B will be considered
suitable for formal assessment purposes. Next, qualifying data sets are screened for data anomalies such as
data drift or other instrument errors following the procedures and recommendations of the US Geologic
Survey (Wagner et al. 2006). All questionable data points are removed prior to analysis and interpretation.
These data quality screens are particularly important for DO sensors because they are subject to bio-fouling,
especially in nutrient-rich waters where they have a higher potential to become covered with algae growth.
When bio-fouling occurs, it results in erroneous logger measurements, or sensor drift.
Assessing DO with High Frequency Data: Draft Methods
Utah’s DO criteria are largely based on USEPA’s guidance “Ambient Water Quality Criteria for Dissolved
Oxygen” (USEPA, 1986). When drafted, this guidance document compiled existing scientific literature and
made several recommendations for appropriate DO criteria based on the following assumptions:
Chronic criteria (7-day and 30-day moving averages) are needed to minimize the extent to which low DO threatens the condition of fish populations (e.g., density, growth rates)
Acute (1-day minimum) criteria are intended to protect against the lethal effects of low DO
More strigent criteria are required for protection of early life stages
Together chronic and acute criteria are intrinsically protective of biota other than fish
Warm water fish assemblages are more tolerant to low DO than cold water fish assemblages With these assumptions in mind, DWQ identified several summary statistics that can be calculated from high frequency data and used to evaluate the acute and chronic effects of low DO to biological designated uses. These statistics were then divided into two classes: Primary Statistics and Secondary Statistics. Primary statistics are measure with direct linkages to Utah’s water quality standards, which are used to evaluate both acute and chronic DO impairments. Supplemental statistics are measures that are intended to provide insight into the nature and extent of any DO impairments that are identified.
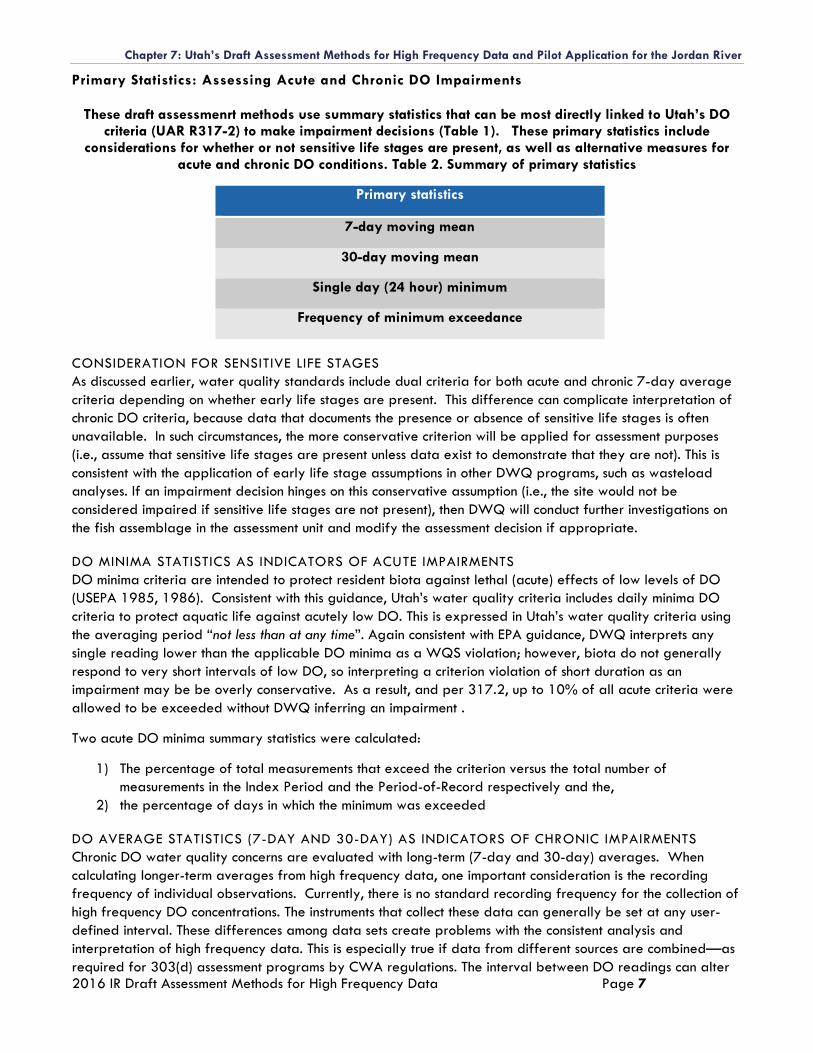
Chapter 7: Utah’s Draft Assessment Methods for High Frequency Data and Pilot Application for the Jordan River
2016 IR Draft Assessment Methods for High Frequency Data Page 7
Primary Statistics: Assessing Acute and Chronic DO Impairments
These draft assessmenrt methods use summary statistics that can be most directly linked to Utah’s DO criteria (UAR R317-2) to make impairment decisions (Table 1). These primary statistics include
considerations for whether or not sensitive life stages are present, as well as alternative measures for acute and chronic DO conditions. Table 2. Summary of primary statistics
Primary statistics
7-day moving mean
30-day moving mean
Single day (24 hour) minimum
Frequency of minimum exceedance
CONSIDERATION FOR SENSITIVE LIFE STAGES
As discussed earlier, water quality standards include dual criteria for both acute and chronic 7-day average
criteria depending on whether early life stages are present. This difference can complicate interpretation of
chronic DO criteria, because data that documents the presence or absence of sensitive life stages is often
unavailable. In such circumstances, the more conservative criterion will be applied for assessment purposes
(i.e., assume that sensitive life stages are present unless data exist to demonstrate that they are not). This is
consistent with the application of early life stage assumptions in other DWQ programs, such as wasteload
analyses. If an impairment decision hinges on this conservative assumption (i.e., the site would not be
considered impaired if sensitive life stages are not present), then DWQ will conduct further investigations on
the fish assemblage in the assessment unit and modify the assessment decision if appropriate.
DO MINIMA STATISTICS AS INDICATORS OF ACUTE IMPAIRMENTS
DO minima criteria are intended to protect resident biota against lethal (acute) effects of low levels of DO
(USEPA 1985, 1986). Consistent with this guidance, Utah’s water quality criteria includes daily minima DO
criteria to protect aquatic life against acutely low DO. This is expressed in Utah’s water quality criteria using
the averaging period “not less than at any time”. Again consistent with EPA guidance, DWQ interprets any
single reading lower than the applicable DO minima as a WQS violation; however, biota do not generally
respond to very short intervals of low DO, so interpreting a criterion violation of short duration as an
impairment may be be overly conservative. As a result, and per 317.2, up to 10% of all acute criteria were
allowed to be exceeded without DWQ inferring an impairment .
Two acute DO minima summary statistics were calculated:
1) The percentage of total measurements that exceed the criterion versus the total number of
measurements in the Index Period and the Period-of-Record respectively and the,
2) the percentage of days in which the minimum was exceeded
DO AVERAGE STATISTICS (7-DAY AND 30-DAY) AS INDICATORS OF CHRONIC IMPAIRMENTS
Chronic DO water quality concerns are evaluated with long-term (7-day and 30-day) averages. When
calculating longer-term averages from high frequency data, one important consideration is the recording
frequency of individual observations. Currently, there is no standard recording frequency for the collection of
high frequency DO concentrations. The instruments that collect these data can generally be set at any user-
defined interval. These differences among data sets create problems with the consistent analysis and
interpretation of high frequency data. This is especially true if data from different sources are combined—as
required for 303(d) assessment programs by CWA regulations. The interval between DO readings can alter
Chapter 7: Utah’s Draft Assessment Methods for High Frequency Data and Pilot Application for the Jordan River
2016 IR Draft Assessment Methods for High Frequency Data Page 8
the ecological interpretation of low DO conditions, which could potentially lead to differing impairment
conclusions. For instance, longer intervals may be more consistent with DWQ’s ongoing use of instantaneous
DO measurements, whereas higher frequency data (i.e., 1, 5, 15 minutes rather than 2 hour) more accurately
quantifies the temporally dynamic variation in DO concentrations. Ideally, datasets should be generated in
hourly (or less ) intervals.
Utah’s DO water quality criteria also include protection against chronic problems resulting from extended
periods of low DO conditions. The criteria specify an averaging period of 7- and 30-days (Table 1). DWQ
proposes that these calculations should mirror those originally used to derive Utah’s DO criteria (EPA 1985,
1986). Specifically, DWQ first calculated the daily mean DO from all of a single days measurements. Next,
DWQ used these daily averages to calculate a moving average over both 7-day and 30-day intervals to
facilitate interpretation of the data against the chronic DO criterion.
ACUTE ASSESSMENT PROCEDURES
The draft assessment methods (Figure 1) uses high frequency DO measurements to assess the frequency of
excursions below the DO minima criteria based on the duration of these violations within a day and also the
total number of days where DO minima criteria violations were observed. For this assessment draft, the total
number of days where the minima criterion was exceeded at least once was tabulated. Also, the sum total of
all observed excursions below the minima criterion is compared against the total number of observations
within the Period-of-Record and Index Periods. Any site, and associated assessment unit, where acute criteria
are exceeded for >10% of days over the Period-of-Record and/or the Index Period will be considered
impaired (Figure 1). Additionally any site where acute criteria exceed >10% of observations over the Period-
of-Record and/or the Index Period will result in the site being considered impaired. Chronic and acute
criteria will be evaluated independently.
CHRONIC ASSESSMENT PROCEDURES
Chronic DO criteria are intended to protect against conditions that may alter the health, condition or
productivity of aquatic biota (EPA 1985, 1986). Consistent with EPA guidance, the duration of exposure to
low DO conditions is dependent upon whether sensitive life stages—most commonly fish fry—are present. If
sensitive life stages are present, then the more stringent 7-day criterion is required, otherwise the less
stringent 7-day criterion is applied for other life stages (see Table 1).
Where data of sufficient duration are available, DWQ will assess the chronic DO criteria with both the 7-day
and 30-day averaging periods using moving average summary statistics. These calulations are made by first
calculating the daily arithmetic mean of DO observations. Next, these daily means are averaged over both
7- and 30-days, moving from one day to the next over the POR. Consistent with the rationale that EPA used
to support the DO recommendations (EPA 1986), these calculations allow DWQ to evaluate not just the total
number of violations of the DO chronic criteria, but also the persistence of any observed excursions. Also,
comparisons between these averaging periods will allow DWQ to evaluate whether or not chronic DO
impairments hinge on the presence or absence of sensitive life stages. If neither the acute nor chronic
assessments result in an impairment decision, then the site would be considered to be fully-supporting its
aquatic life uses with respect to dissolved oxygen.
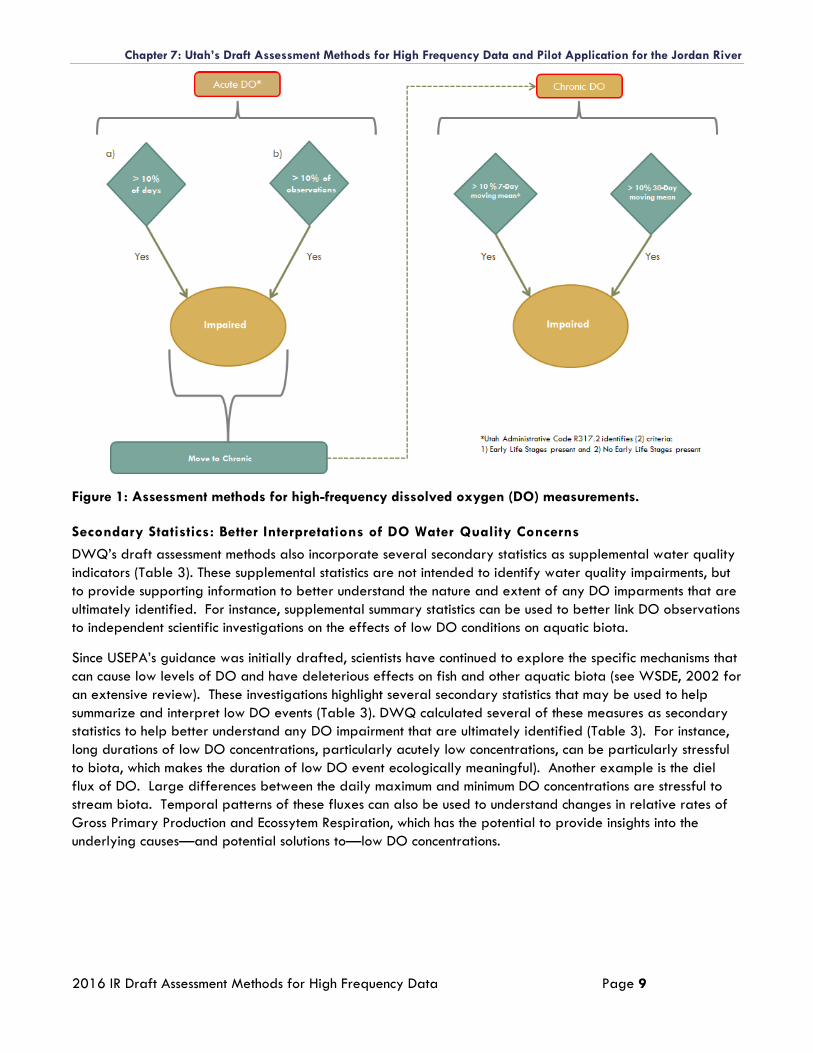
Chapter 7: Utah’s Draft Assessment Methods for High Frequency Data and Pilot Application for the Jordan River
2016 IR Draft Assessment Methods for High Frequency Data Page 9
Figure 1: Assessment methods for high-frequency dissolved oxygen (DO) measurements.
Secondary Statistics: Better Interpretations of DO Water Quality Concerns
DWQ’s draft assessment methods also incorporate several secondary statistics as supplemental water quality
indicators (Table 3). These supplemental statistics are not intended to identify water quality impairments, but
to provide supporting information to better understand the nature and extent of any DO imparments that are
ultimately identified. For instance, supplemental summary statistics can be used to better link DO observations
to independent scientific investigations on the effects of low DO conditions on aquatic biota.
Since USEPA’s guidance was initially drafted, scientists have continued to explore the specific mechanisms that
can cause low levels of DO and have deleterious effects on fish and other aquatic biota (see WSDE, 2002 for
an extensive review). These investigations highlight several secondary statistics that may be used to help
summarize and interpret low DO events (Table 3). DWQ calculated several of these measures as secondary
statistics to help better understand any DO impairment that are ultimately identified (Table 3). For instance,
long durations of low DO concentrations, particularly acutely low concentrations, can be particularly stressful
to biota, which makes the duration of low DO event ecologically meaningful). Another example is the diel
flux of DO. Large differences between the daily maximum and minimum DO concentrations are stressful to
stream biota. Temporal patterns of these fluxes can also be used to understand changes in relative rates of
Gross Primary Production and Ecossytem Respiration, which has the potential to provide insights into the
underlying causes—and potential solutions to—low DO concentrations.
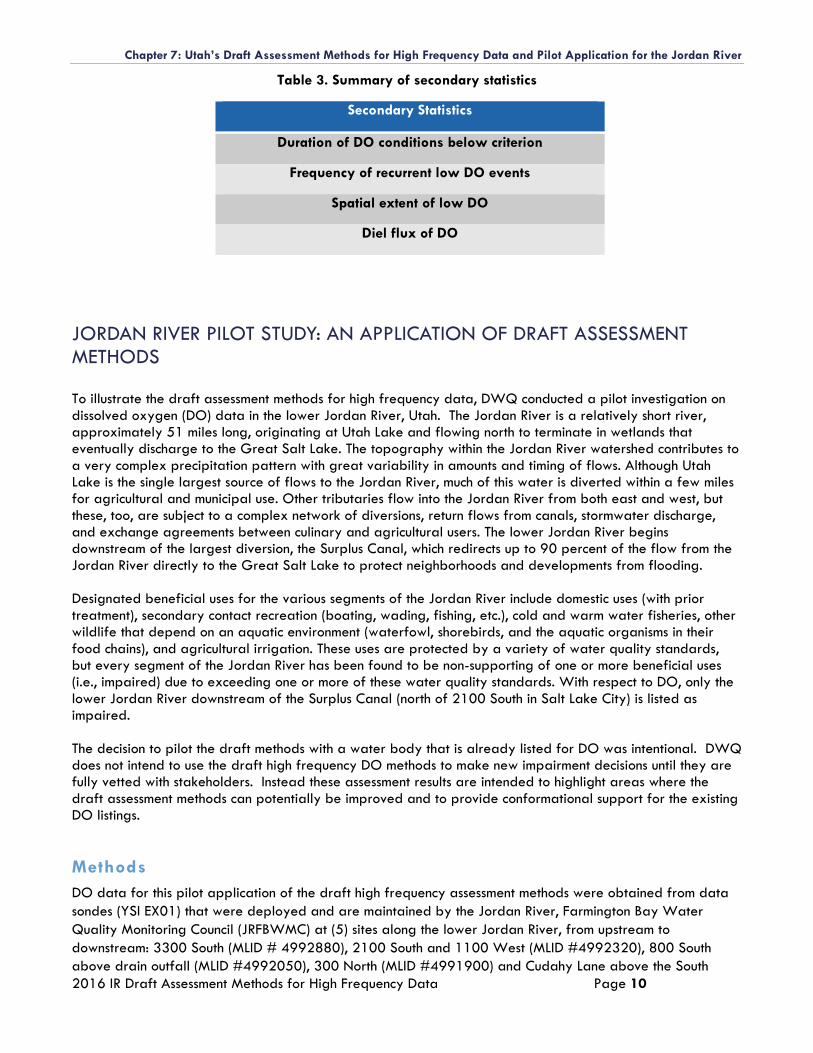
Chapter 7: Utah’s Draft Assessment Methods for High Frequency Data and Pilot Application for the Jordan River
2016 IR Draft Assessment Methods for High Frequency Data Page 10
Table 3. Summary of secondary statistics
Secondary Statistics
Duration of DO conditions below criterion
Frequency of recurrent low DO events
Spatial extent of low DO
Diel flux of DO
JORDAN RIVER PILOT STUDY: AN APPLICATION OF DRAFT ASSESSMENT METHODS
To illustrate the draft assessment methods for high frequency data, DWQ conducted a pilot investigation on dissolved oxygen (DO) data in the lower Jordan River, Utah. The Jordan River is a relatively short river, approximately 51 miles long, originating at Utah Lake and flowing north to terminate in wetlands that eventually discharge to the Great Salt Lake. The topography within the Jordan River watershed contributes to a very complex precipitation pattern with great variability in amounts and timing of flows. Although Utah Lake is the single largest source of flows to the Jordan River, much of this water is diverted within a few miles for agricultural and municipal use. Other tributaries flow into the Jordan River from both east and west, but these, too, are subject to a complex network of diversions, return flows from canals, stormwater discharge, and exchange agreements between culinary and agricultural users. The lower Jordan River begins downstream of the largest diversion, the Surplus Canal, which redirects up to 90 percent of the flow from the Jordan River directly to the Great Salt Lake to protect neighborhoods and developments from flooding. Designated beneficial uses for the various segments of the Jordan River include domestic uses (with prior treatment), secondary contact recreation (boating, wading, fishing, etc.), cold and warm water fisheries, other wildlife that depend on an aquatic environment (waterfowl, shorebirds, and the aquatic organisms in their food chains), and agricultural irrigation. These uses are protected by a variety of water quality standards, but every segment of the Jordan River has been found to be non-supporting of one or more beneficial uses (i.e., impaired) due to exceeding one or more of these water quality standards. With respect to DO, only the lower Jordan River downstream of the Surplus Canal (north of 2100 South in Salt Lake City) is listed as impaired. The decision to pilot the draft methods with a water body that is already listed for DO was intentional. DWQ does not intend to use the draft high frequency DO methods to make new impairment decisions until they are fully vetted with stakeholders. Instead these assessment results are intended to highlight areas where the draft assessment methods can potentially be improved and to provide conformational support for the existing DO listings.
Methods
DO data for this pilot application of the draft high frequency assessment methods were obtained from data
sondes (YSI EX01) that were deployed and are maintained by the Jordan River, Farmington Bay Water
Quality Monitoring Council (JRFBWMC) at (5) sites along the lower Jordan River, from upstream to
downstream: 3300 South (MLID # 4992880), 2100 South and 1100 West (MLID #4992320), 800 South
above drain outfall (MLID #4992050), 300 North (MLID #4991900) and Cudahy Lane above the South
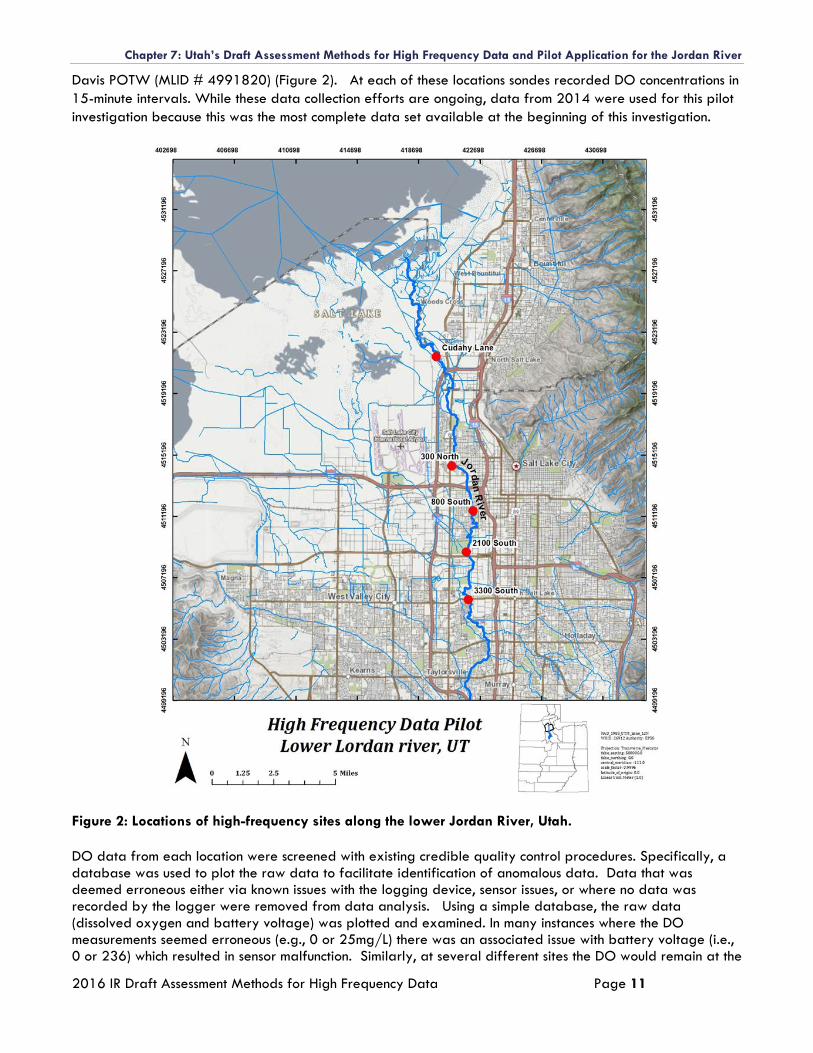
Chapter 7: Utah’s Draft Assessment Methods for High Frequency Data and Pilot Application for the Jordan River
2016 IR Draft Assessment Methods for High Frequency Data Page 11
Davis POTW (MLID # 4991820) (Figure 2). At each of these locations sondes recorded DO concentrations in
15-minute intervals. While these data collection efforts are ongoing, data from 2014 were used for this pilot
investigation because this was the most complete data set available at the beginning of this investigation.
Figure 2: Locations of high-frequency sites along the lower Jordan River, Utah.
DO data from each location were screened with existing credible quality control procedures. Specifically, a database was used to plot the raw data to facilitate identification of anomalous data. Data that was deemed erroneous either via known issues with the logging device, sensor issues, or where no data was recorded by the logger were removed from data analysis. Using a simple database, the raw data (dissolved oxygen and battery voltage) was plotted and examined. In many instances where the DO measurements seemed erroneous (e.g., 0 or 25mg/L) there was an associated issue with battery voltage (i.e., 0 or 236) which resulted in sensor malfunction. Similarly, at several different sites the DO would remain at the
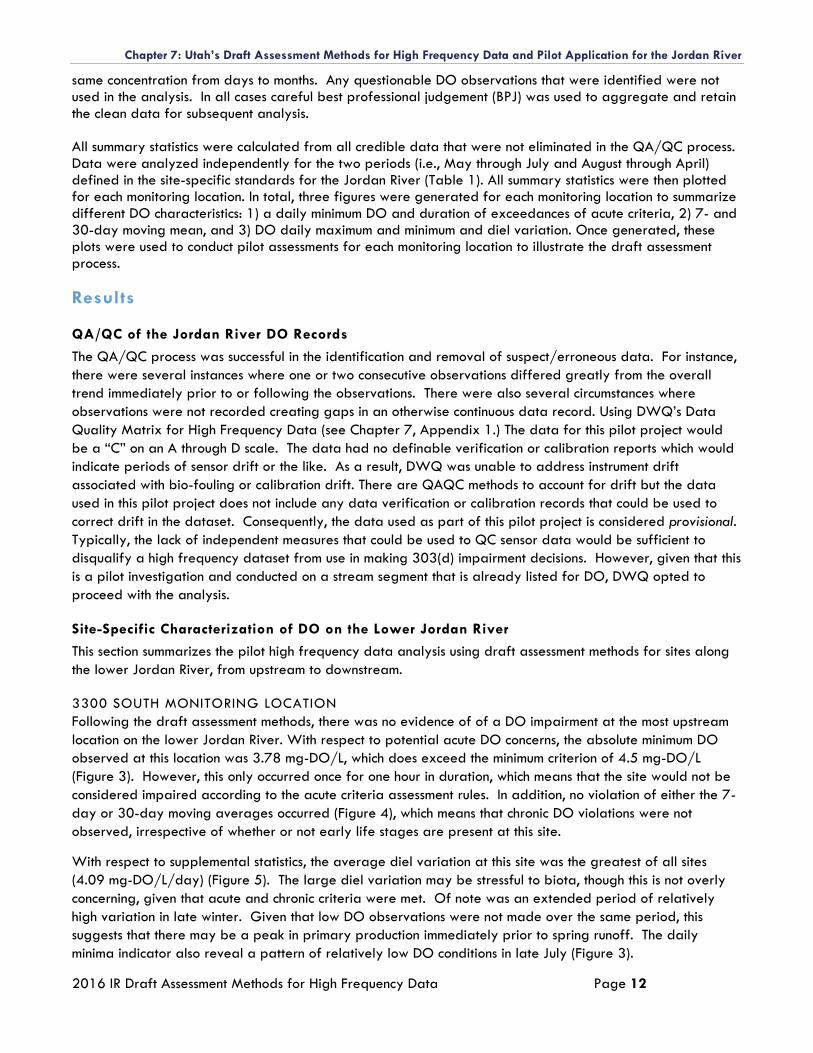
Chapter 7: Utah’s Draft Assessment Methods for High Frequency Data and Pilot Application for the Jordan River
2016 IR Draft Assessment Methods for High Frequency Data Page 12
same concentration from days to months. Any questionable DO observations that were identified were not used in the analysis. In all cases careful best professional judgement (BPJ) was used to aggregate and retain the clean data for subsequent analysis. All summary statistics were calculated from all credible data that were not eliminated in the QA/QC process. Data were analyzed independently for the two periods (i.e., May through July and August through April) defined in the site-specific standards for the Jordan River (Table 1). All summary statistics were then plotted for each monitoring location. In total, three figures were generated for each monitoring location to summarize different DO characteristics: 1) a daily minimum DO and duration of exceedances of acute criteria, 2) 7- and 30-day moving mean, and 3) DO daily maximum and minimum and diel variation. Once generated, these plots were used to conduct pilot assessments for each monitoring location to illustrate the draft assessment process.
Results
QA/QC of the Jordan River DO Records
The QA/QC process was successful in the identification and removal of suspect/erroneous data. For instance,
there were several instances where one or two consecutive observations differed greatly from the overall
trend immediately prior to or following the observations. There were also several circumstances where
observations were not recorded creating gaps in an otherwise continuous data record. Using DWQ’s Data
Quality Matrix for High Frequency Data (see Chapter 7, Appendix 1.) The data for this pilot project would
be a “C” on an A through D scale. The data had no definable verification or calibration reports which would
indicate periods of sensor drift or the like. As a result, DWQ was unable to address instrument drift
associated with bio-fouling or calibration drift. There are QAQC methods to account for drift but the data
used in this pilot project does not include any data verification or calibration records that could be used to
correct drift in the dataset. Consequently, the data used as part of this pilot project is considered provisional.
Typically, the lack of independent measures that could be used to QC sensor data would be sufficient to
disqualify a high frequency dataset from use in making 303(d) impairment decisions. However, given that this
is a pilot investigation and conducted on a stream segment that is already listed for DO, DWQ opted to
proceed with the analysis.
Site-Specific Characterization of DO on the Lower Jordan River
This section summarizes the pilot high frequency data analysis using draft assessment methods for sites along
the lower Jordan River, from upstream to downstream.
3300 SOUTH MONITORING LOCATION
Following the draft assessment methods, there was no evidence of of a DO impairment at the most upstream
location on the lower Jordan River. With respect to potential acute DO concerns, the absolute minimum DO
observed at this location was 3.78 mg-DO/L, which does exceed the minimum criterion of 4.5 mg-DO/L
(Figure 3). However, this only occurred once for one hour in duration, which means that the site would not be
considered impaired according to the acute criteria assessment rules. In addition, no violation of either the 7-
day or 30-day moving averages occurred (Figure 4), which means that chronic DO violations were not
observed, irrespective of whether or not early life stages are present at this site.
With respect to supplemental statistics, the average diel variation at this site was the greatest of all sites
(4.09 mg-DO/L/day) (Figure 5). The large diel variation may be stressful to biota, though this is not overly
concerning, given that acute and chronic criteria were met. Of note was an extended period of relatively
high variation in late winter. Given that low DO observations were not made over the same period, this
suggests that there may be a peak in primary production immediately prior to spring runoff. The daily
minima indicator also reveal a pattern of relatively low DO conditions in late July (Figure 3).
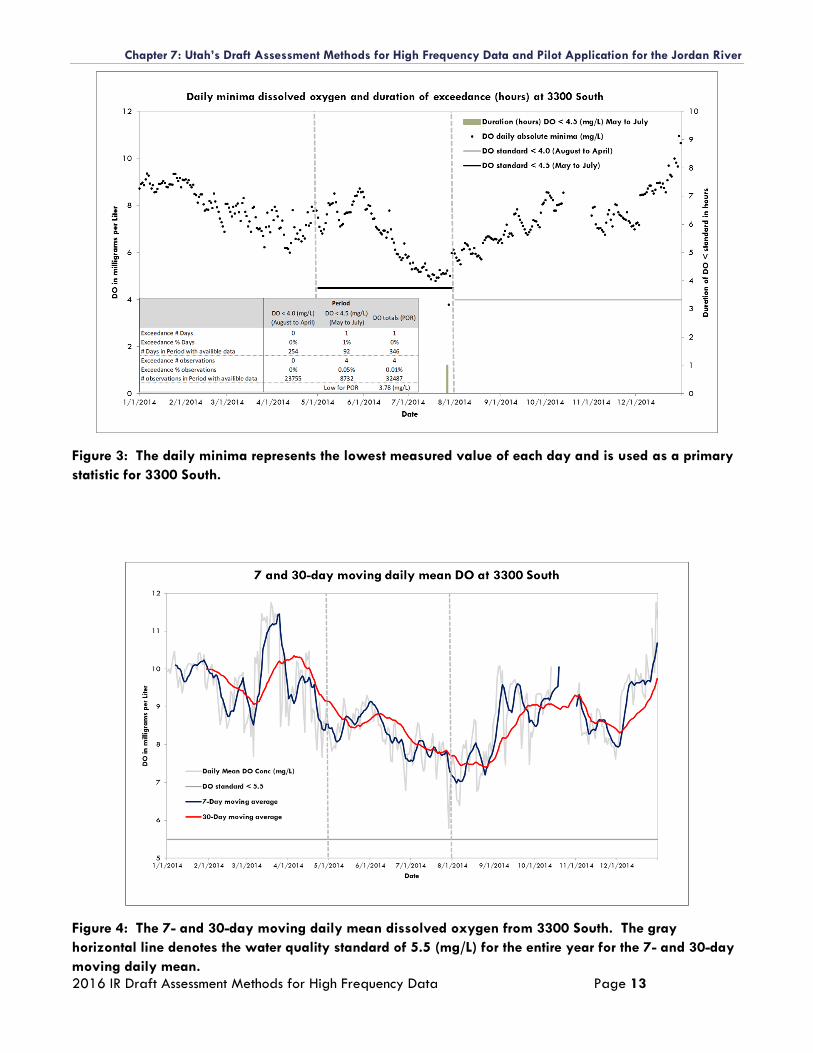
Chapter 7: Utah’s Draft Assessment Methods for High Frequency Data and Pilot Application for the Jordan River
2016 IR Draft Assessment Methods for High Frequency Data Page 13
Figure 3: The daily minima represents the lowest measured value of each day and is used as a primary
statistic for 3300 South.
Figure 4: The 7- and 30-day moving daily mean dissolved oxygen from 3300 South. The gray
horizontal line denotes the water quality standard of 5.5 (mg/L) for the entire year for the 7- and 30-day
moving daily mean.
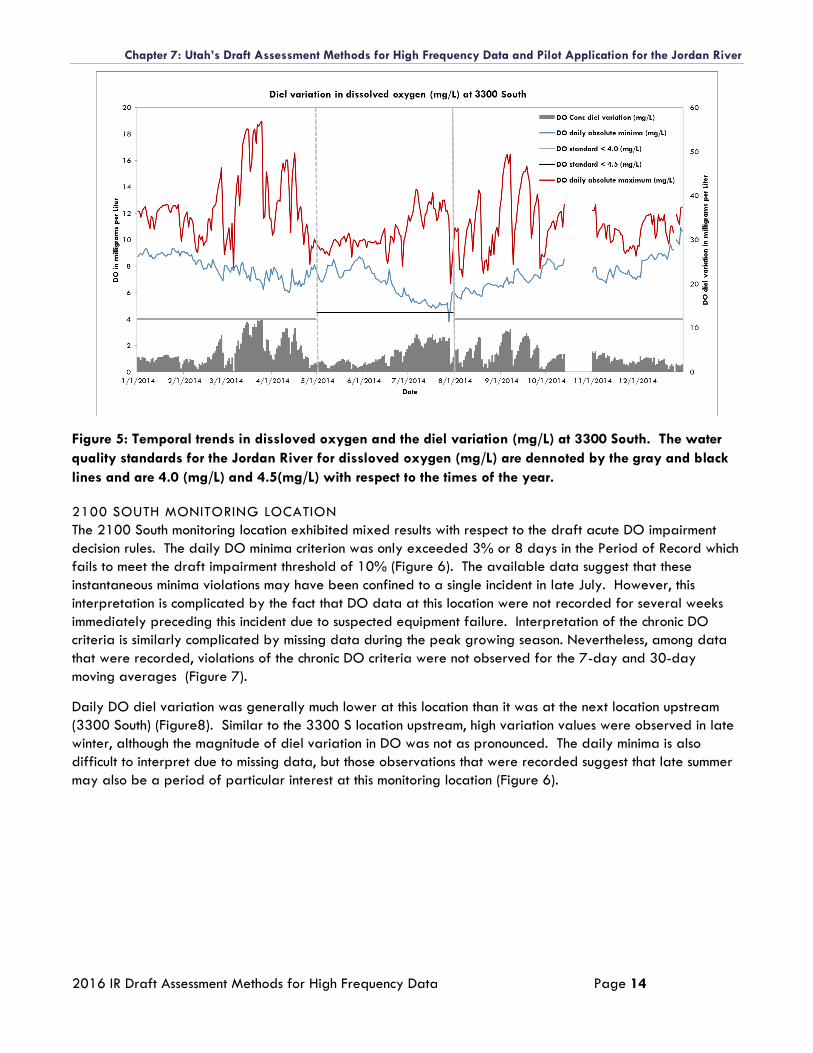
Chapter 7: Utah’s Draft Assessment Methods for High Frequency Data and Pilot Application for the Jordan River
2016 IR Draft Assessment Methods for High Frequency Data Page 14
Figure 5: Temporal trends in dissloved oxygen and the diel variation (mg/L) at 3300 South. The water
quality standards for the Jordan River for dissloved oxygen (mg/L) are dennoted by the gray and black
lines and are 4.0 (mg/L) and 4.5(mg/L) with respect to the times of the year.
2100 SOUTH MONITORING LOCATION
The 2100 South monitoring location exhibited mixed results with respect to the draft acute DO impairment
decision rules. The daily DO minima criterion was only exceeded 3% or 8 days in the Period of Record which
fails to meet the draft impairment threshold of 10% (Figure 6). The available data suggest that these
instantaneous minima violations may have been confined to a single incident in late July. However, this
interpretation is complicated by the fact that DO data at this location were not recorded for several weeks
immediately preceding this incident due to suspected equipment failure. Interpretation of the chronic DO
criteria is similarly complicated by missing data during the peak growing season. Nevertheless, among data
that were recorded, violations of the chronic DO criteria were not observed for the 7-day and 30-day
moving averages (Figure 7).
Daily DO diel variation was generally much lower at this location than it was at the next location upstream
(3300 South) (Figure8). Similar to the 3300 S location upstream, high variation values were observed in late
winter, although the magnitude of diel variation in DO was not as pronounced. The daily minima is also
difficult to interpret due to missing data, but those observations that were recorded suggest that late summer
may also be a period of particular interest at this monitoring location (Figure 6).
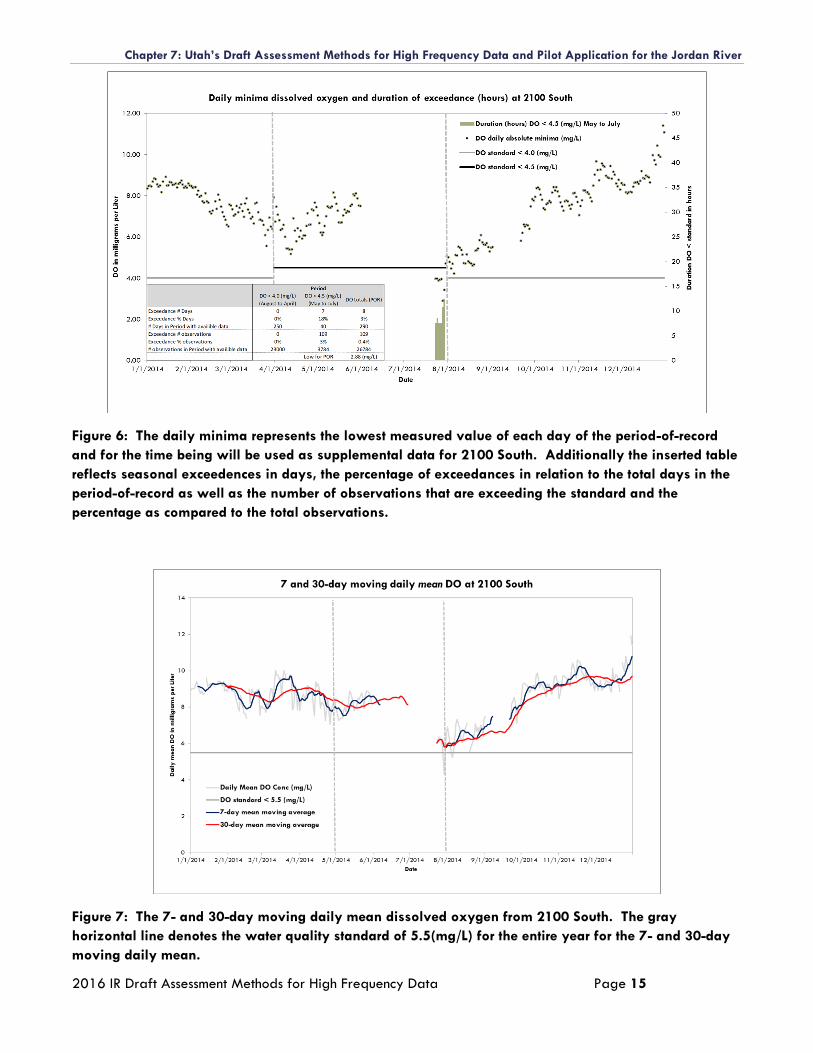
Chapter 7: Utah’s Draft Assessment Methods for High Frequency Data and Pilot Application for the Jordan River
2016 IR Draft Assessment Methods for High Frequency Data Page 15
Figure 6: The daily minima represents the lowest measured value of each day of the period-of-record
and for the time being will be used as supplemental data for 2100 South. Additionally the inserted table
reflects seasonal exceedences in days, the percentage of exceedances in relation to the total days in the
period-of-record as well as the number of observations that are exceeding the standard and the
percentage as compared to the total observations.
Figure 7: The 7- and 30-day moving daily mean dissolved oxygen from 2100 South. The gray
horizontal line denotes the water quality standard of 5.5(mg/L) for the entire year for the 7- and 30-day
moving daily mean.
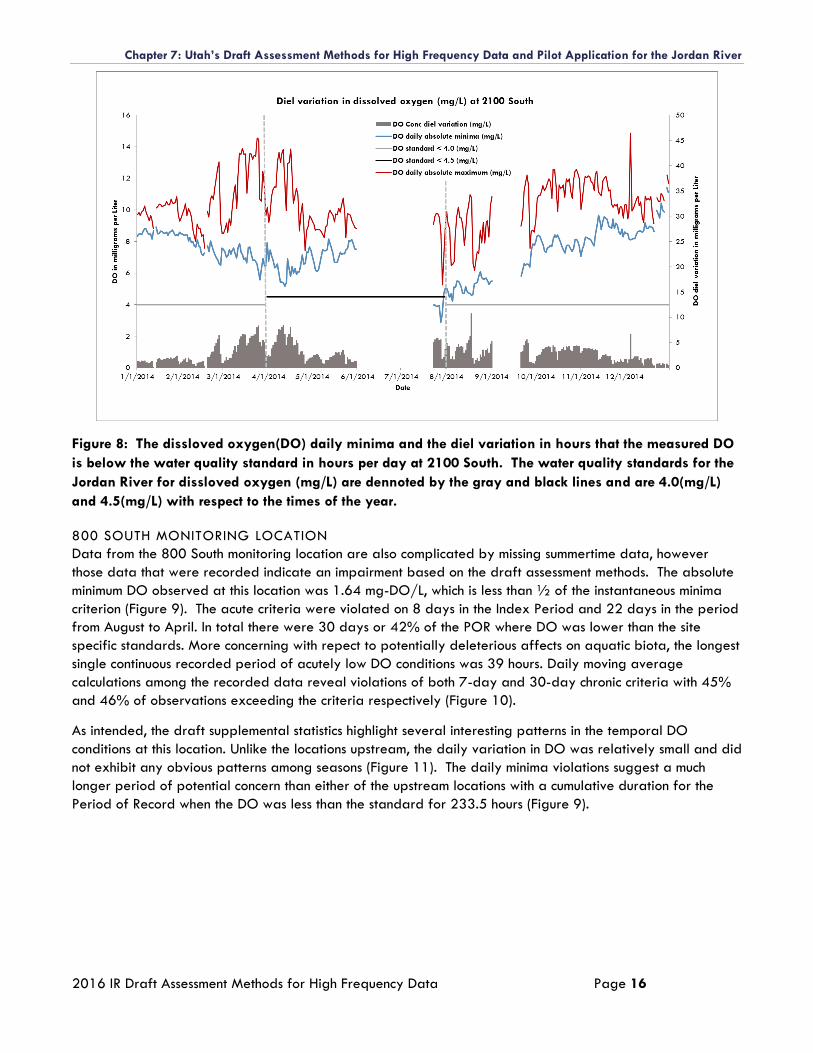
Chapter 7: Utah’s Draft Assessment Methods for High Frequency Data and Pilot Application for the Jordan River
2016 IR Draft Assessment Methods for High Frequency Data Page 16
Figure 8: The dissloved oxygen(DO) daily minima and the diel variation in hours that the measured DO
is below the water quality standard in hours per day at 2100 South. The water quality standards for the
Jordan River for dissloved oxygen (mg/L) are dennoted by the gray and black lines and are 4.0(mg/L)
and 4.5(mg/L) with respect to the times of the year.
800 SOUTH MONITORING LOCATION
Data from the 800 South monitoring location are also complicated by missing summertime data, however
those data that were recorded indicate an impairment based on the draft assessment methods. The absolute
minimum DO observed at this location was 1.64 mg-DO/L, which is less than ½ of the instantaneous minima
criterion (Figure 9). The acute criteria were violated on 8 days in the Index Period and 22 days in the period
from August to April. In total there were 30 days or 42% of the POR where DO was lower than the site
specific standards. More concerning with repect to potentially deleterious affects on aquatic biota, the longest
single continuous recorded period of acutely low DO conditions was 39 hours. Daily moving average
calculations among the recorded data reveal violations of both 7-day and 30-day chronic criteria with 45%
and 46% of observations exceeding the criteria respectively (Figure 10).
As intended, the draft supplemental statistics highlight several interesting patterns in the temporal DO
conditions at this location. Unlike the locations upstream, the daily variation in DO was relatively small and did
not exhibit any obvious patterns among seasons (Figure 11). The daily minima violations suggest a much
longer period of potential concern than either of the upstream locations with a cumulative duration for the
Period of Record when the DO was less than the standard for 233.5 hours (Figure 9).
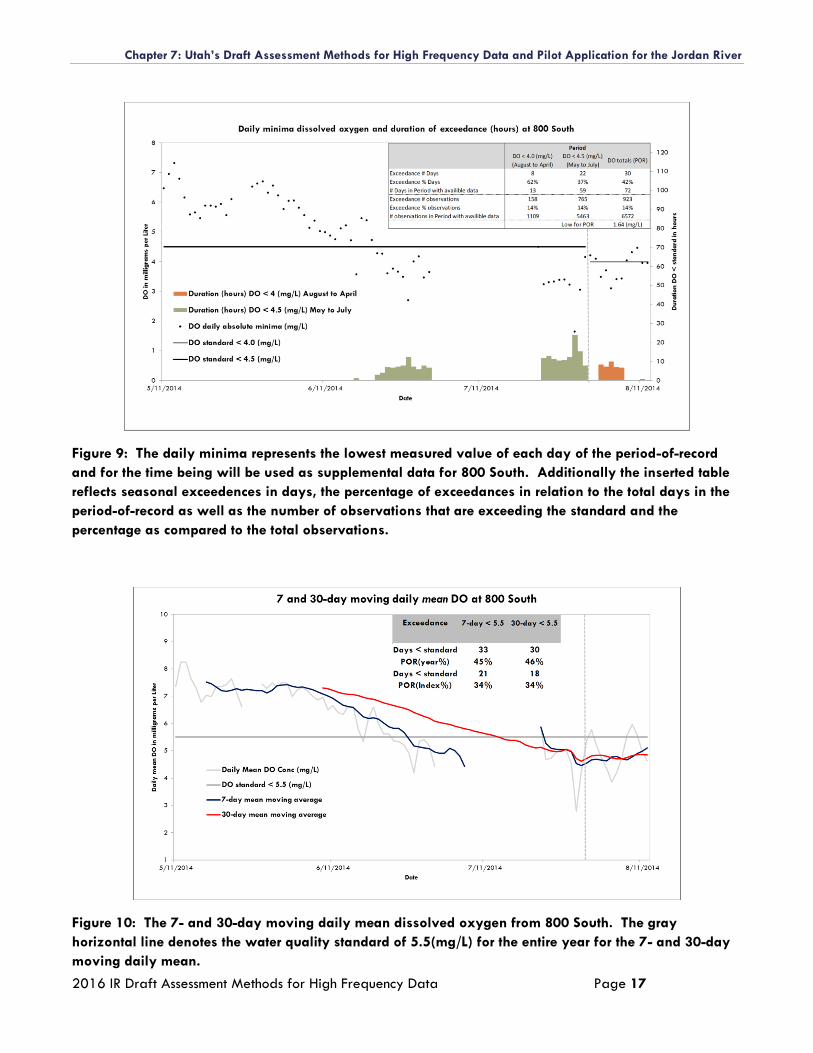
Chapter 7: Utah’s Draft Assessment Methods for High Frequency Data and Pilot Application for the Jordan River
2016 IR Draft Assessment Methods for High Frequency Data Page 17
Figure 9: The daily minima represents the lowest measured value of each day of the period-of-record
and for the time being will be used as supplemental data for 800 South. Additionally the inserted table
reflects seasonal exceedences in days, the percentage of exceedances in relation to the total days in the
period-of-record as well as the number of observations that are exceeding the standard and the
percentage as compared to the total observations.
Figure 10: The 7- and 30-day moving daily mean dissolved oxygen from 800 South. The gray
horizontal line denotes the water quality standard of 5.5(mg/L) for the entire year for the 7- and 30-day
moving daily mean.
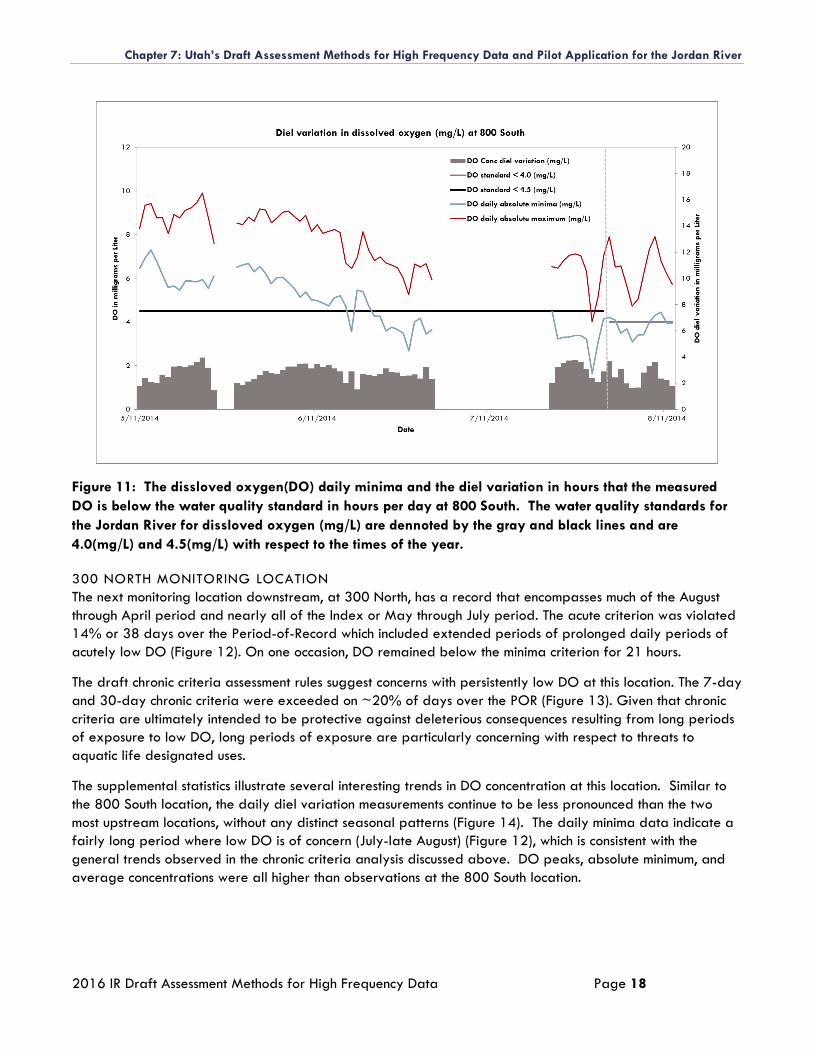
Chapter 7: Utah’s Draft Assessment Methods for High Frequency Data and Pilot Application for the Jordan River
2016 IR Draft Assessment Methods for High Frequency Data Page 18
Figure 11: The dissloved oxygen(DO) daily minima and the diel variation in hours that the measured
DO is below the water quality standard in hours per day at 800 South. The water quality standards for
the Jordan River for dissloved oxygen (mg/L) are dennoted by the gray and black lines and are
4.0(mg/L) and 4.5(mg/L) with respect to the times of the year.
300 NORTH MONITORING LOCATION
The next monitoring location downstream, at 300 North, has a record that encompasses much of the August
through April period and nearly all of the Index or May through July period. The acute criterion was violated
14% or 38 days over the Period-of-Record which included extended periods of prolonged daily periods of
acutely low DO (Figure 12). On one occasion, DO remained below the minima criterion for 21 hours.
The draft chronic criteria assessment rules suggest concerns with persistently low DO at this location. The 7-day
and 30-day chronic criteria were exceeded on ~20% of days over the POR (Figure 13). Given that chronic
criteria are ultimately intended to be protective against deleterious consequences resulting from long periods
of exposure to low DO, long periods of exposure are particularly concerning with respect to threats to
aquatic life designated uses.
The supplemental statistics illustrate several interesting trends in DO concentration at this location. Similar to
the 800 South location, the daily diel variation measurements continue to be less pronounced than the two
most upstream locations, without any distinct seasonal patterns (Figure 14). The daily minima data indicate a
fairly long period where low DO is of concern (July-late August) (Figure 12), which is consistent with the
general trends observed in the chronic criteria analysis discussed above. DO peaks, absolute minimum, and
average concentrations were all higher than observations at the 800 South location.
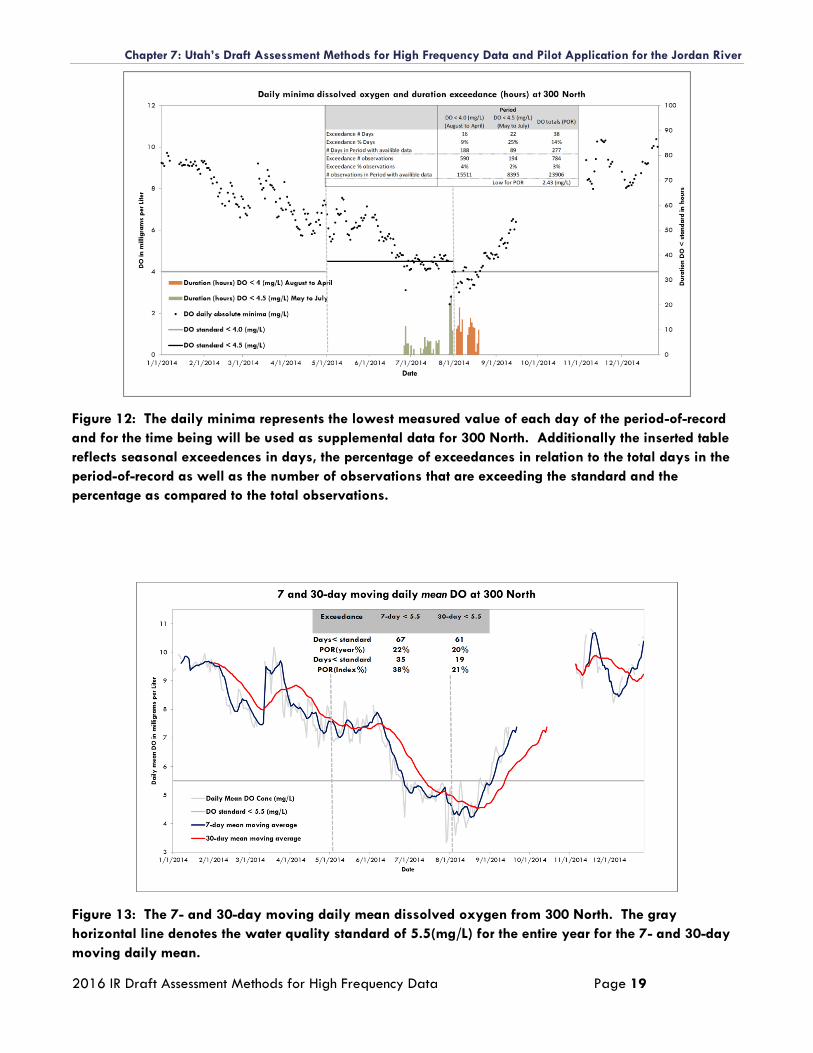
Chapter 7: Utah’s Draft Assessment Methods for High Frequency Data and Pilot Application for the Jordan River
2016 IR Draft Assessment Methods for High Frequency Data Page 19
Figure 12: The daily minima represents the lowest measured value of each day of the period-of-record
and for the time being will be used as supplemental data for 300 North. Additionally the inserted table
reflects seasonal exceedences in days, the percentage of exceedances in relation to the total days in the
period-of-record as well as the number of observations that are exceeding the standard and the
percentage as compared to the total observations.
Figure 13: The 7- and 30-day moving daily mean dissolved oxygen from 300 North. The gray
horizontal line denotes the water quality standard of 5.5(mg/L) for the entire year for the 7- and 30-day
moving daily mean.
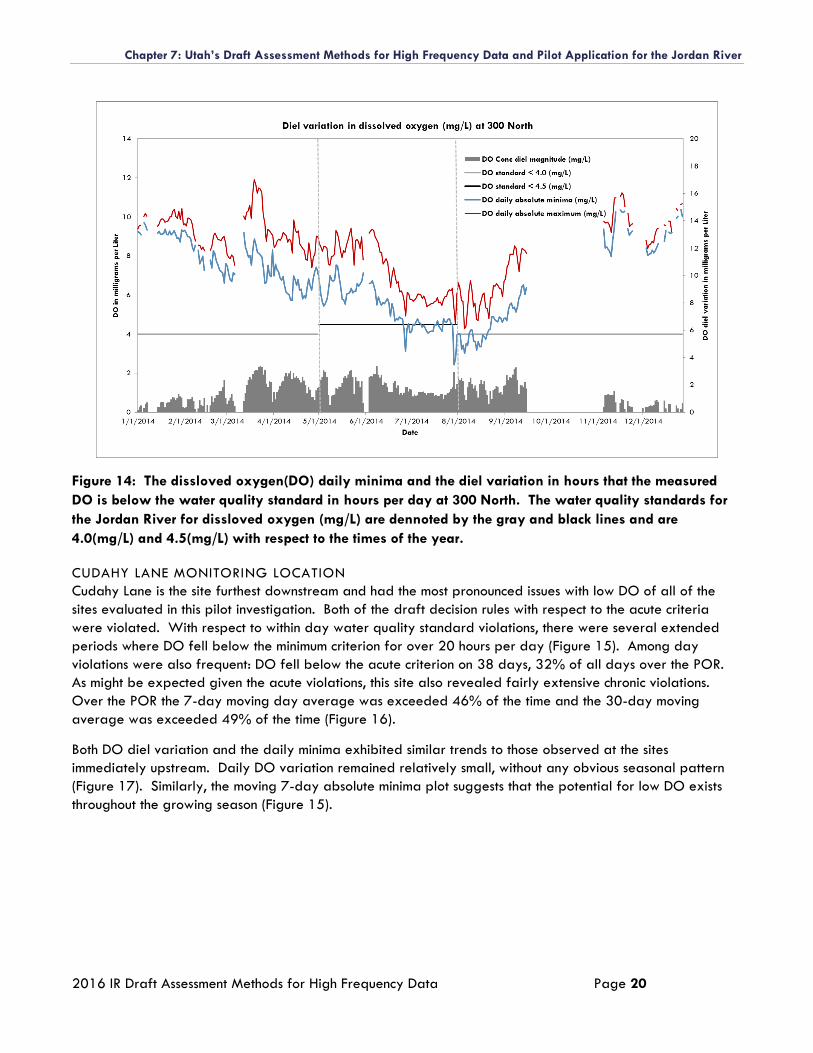
Chapter 7: Utah’s Draft Assessment Methods for High Frequency Data and Pilot Application for the Jordan River
2016 IR Draft Assessment Methods for High Frequency Data Page 20
Figure 14: The dissloved oxygen(DO) daily minima and the diel variation in hours that the measured
DO is below the water quality standard in hours per day at 300 North. The water quality standards for
the Jordan River for dissloved oxygen (mg/L) are dennoted by the gray and black lines and are
4.0(mg/L) and 4.5(mg/L) with respect to the times of the year.
CUDAHY LANE MONITORING LOCATION
Cudahy Lane is the site furthest downstream and had the most pronounced issues with low DO of all of the
sites evaluated in this pilot investigation. Both of the draft decision rules with respect to the acute criteria
were violated. With respect to within day water quality standard violations, there were several extended
periods where DO fell below the minimum criterion for over 20 hours per day (Figure 15). Among day
violations were also frequent: DO fell below the acute criterion on 38 days, 32% of all days over the POR.
As might be expected given the acute violations, this site also revealed fairly extensive chronic violations.
Over the POR the 7-day moving day average was exceeded 46% of the time and the 30-day moving
average was exceeded 49% of the time (Figure 16).
Both DO diel variation and the daily minima exhibited similar trends to those observed at the sites
immediately upstream. Daily DO variation remained relatively small, without any obvious seasonal pattern
(Figure 17). Similarly, the moving 7-day absolute minima plot suggests that the potential for low DO exists
throughout the growing season (Figure 15).
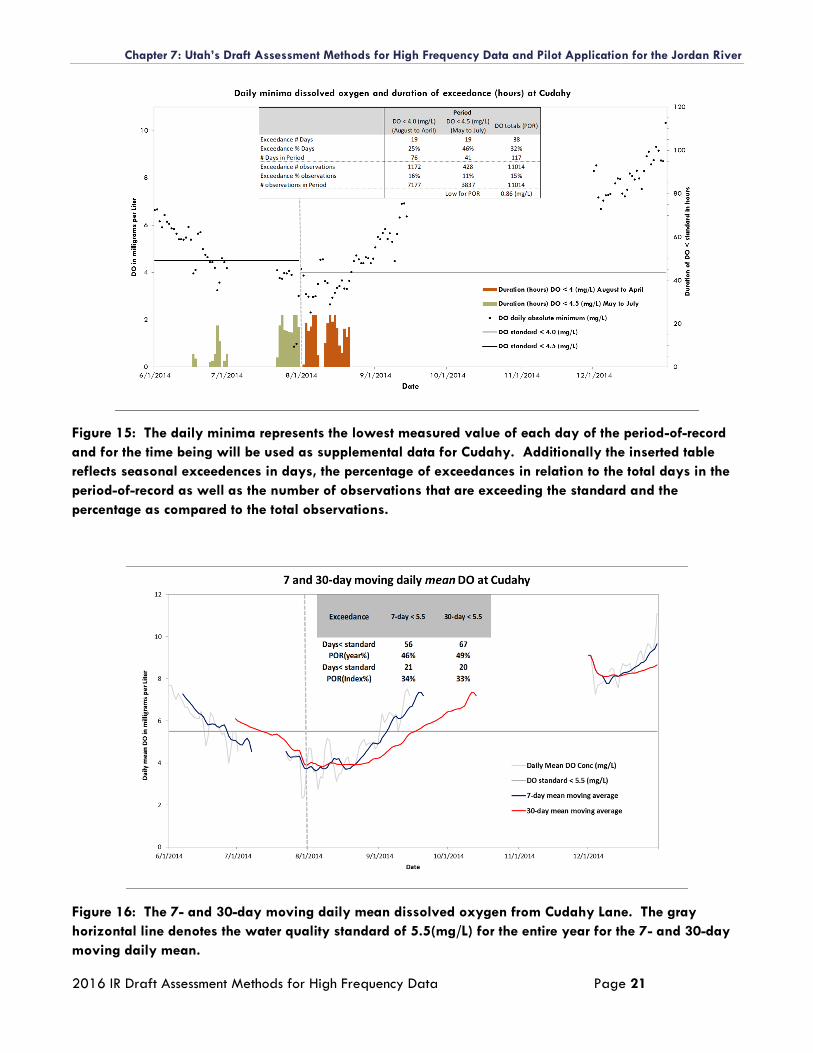
Chapter 7: Utah’s Draft Assessment Methods for High Frequency Data and Pilot Application for the Jordan River
2016 IR Draft Assessment Methods for High Frequency Data Page 21
Figure 15: The daily minima represents the lowest measured value of each day of the period-of-record
and for the time being will be used as supplemental data for Cudahy. Additionally the inserted table
reflects seasonal exceedences in days, the percentage of exceedances in relation to the total days in the
period-of-record as well as the number of observations that are exceeding the standard and the
percentage as compared to the total observations.
Figure 16: The 7- and 30-day moving daily mean dissolved oxygen from Cudahy Lane. The gray
horizontal line denotes the water quality standard of 5.5(mg/L) for the entire year for the 7- and 30-day
moving daily mean.
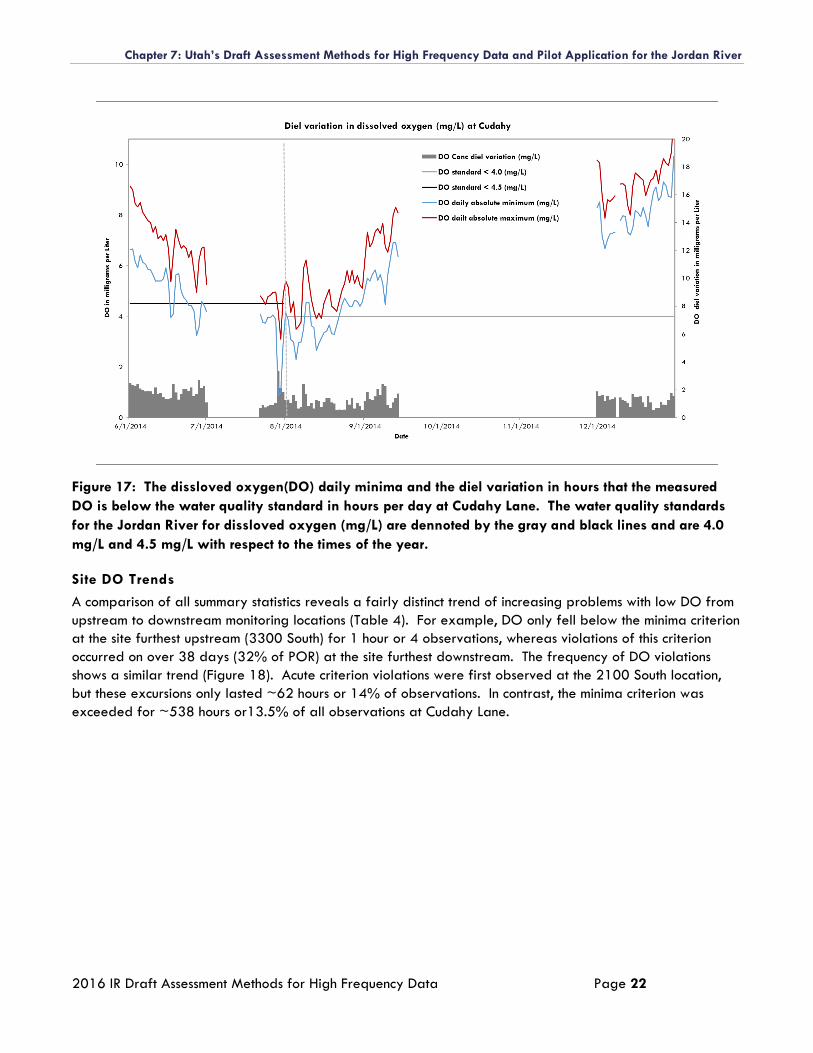
Chapter 7: Utah’s Draft Assessment Methods for High Frequency Data and Pilot Application for the Jordan River
2016 IR Draft Assessment Methods for High Frequency Data Page 22
Figure 17: The dissloved oxygen(DO) daily minima and the diel variation in hours that the measured
DO is below the water quality standard in hours per day at Cudahy Lane. The water quality standards
for the Jordan River for dissloved oxygen (mg/L) are dennoted by the gray and black lines and are 4.0
mg/L and 4.5 mg/L with respect to the times of the year.
Site DO Trends
A comparison of all summary statistics reveals a fairly distinct trend of increasing problems with low DO from
upstream to downstream monitoring locations (Table 4). For example, DO only fell below the minima criterion
at the site furthest upstream (3300 South) for 1 hour or 4 observations, whereas violations of this criterion
occurred on over 38 days (32% of POR) at the site furthest downstream. The frequency of DO violations
shows a similar trend (Figure 18). Acute criterion violations were first observed at the 2100 South location,
but these excursions only lasted ~62 hours or 14% of observations. In contrast, the minima criterion was
exceeded for ~538 hours or13.5% of all observations at Cudahy Lane.
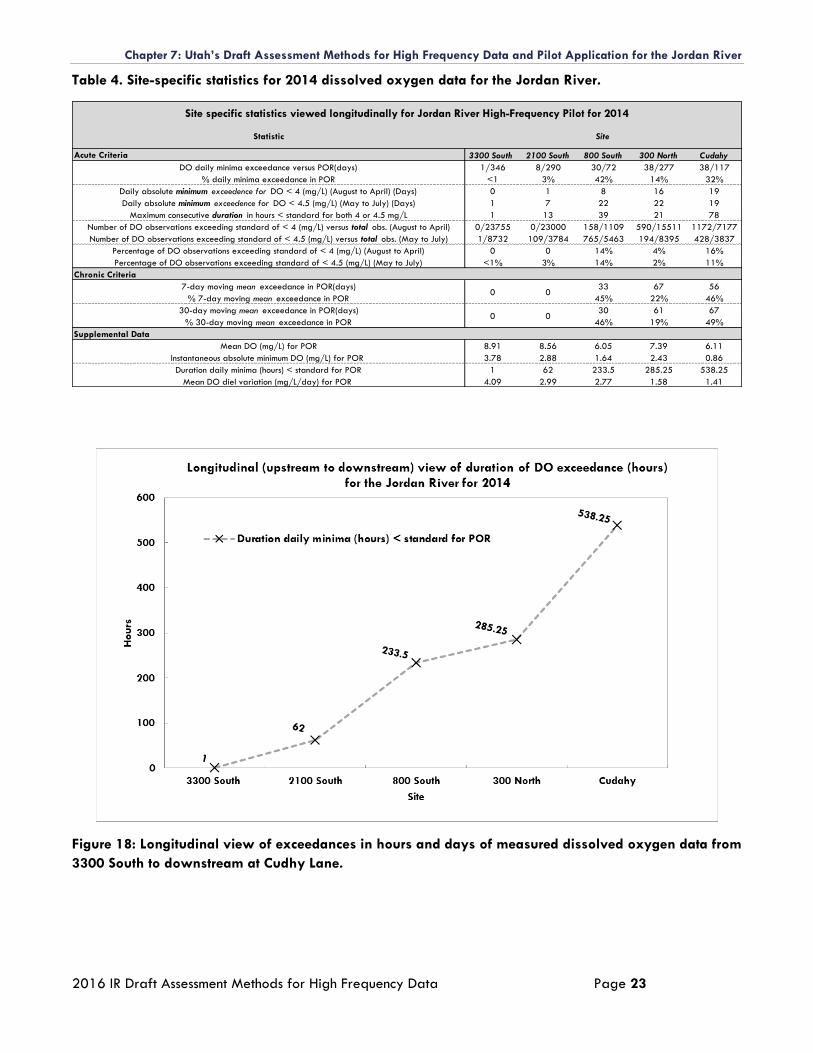
Chapter 7: Utah’s Draft Assessment Methods for High Frequency Data and Pilot Application for the Jordan River
2016 IR Draft Assessment Methods for High Frequency Data Page 23
Table 4. Site-specific statistics for 2014 dissolved oxygen data for the Jordan River.
Figure 18: Longitudinal view of exceedances in hours and days of measured dissolved oxygen data from
3300 South to downstream at Cudhy Lane.
Acute Criteria 3300 South 2100 South 800 South 300 North Cudahy
DO daily minima exceedance versus POR(days) 1/346 8/290 30/72 38/277 38/117
% daily minima exceedance in POR <1 3% 42% 14% 32%
Daily absolute minimum exceedence for DO < 4 (mg/L) (August to April) (Days) 0 1 8 16 19
Daily absolute minimum exceedence for DO < 4.5 (mg/L) (May to July) (Days) 1 7 22 22 19
Maximum consecutive duration in hours < standard for both 4 or 4.5 mg/L 1 13 39 21 78
Number of DO observations exceeding standard of < 4 (mg/L) versus total obs. (August to April) 0/23755 0/23000 158/1109 590/15511 1172/7177
Number of DO observations exceeding standard of < 4.5 (mg/L) versus total obs. (May to July) 1/8732 109/3784 765/5463 194/8395 428/3837
Percentage of DO observations exceeding standard of < 4 (mg/L) (August to April) 0 0 14% 4% 16%
Percentage of DO observations exceeding standard of < 4.5 (mg/L) (May to July) <1% 3% 14% 2% 11%
7-day moving mean exceedance in POR(days) 33 67 56
% 7-day moving mean exceedance in POR 45% 22% 46%
30-day moving mean exceedance in POR(days) 30 61 67
% 30-day moving mean exceedance in POR 46% 19% 49%
Mean DO (mg/L) for POR 8.91 8.56 6.05 7.39 6.11
Instantaneous absolute minimum DO (mg/L) for POR 3.78 2.88 1.64 2.43 0.86
Duration daily minima (hours) < standard for POR 1 62 233.5 285.25 538.25
Mean DO diel variation (mg/L/day) for POR 4.09 2.99 2.77 1.58 1.41
Supplemental Data
Site
Site specific statistics viewed longitudinally for Jordan River High-Frequency Pilot for 2014
0
0
Statistic
0
0
Chronic Criteria
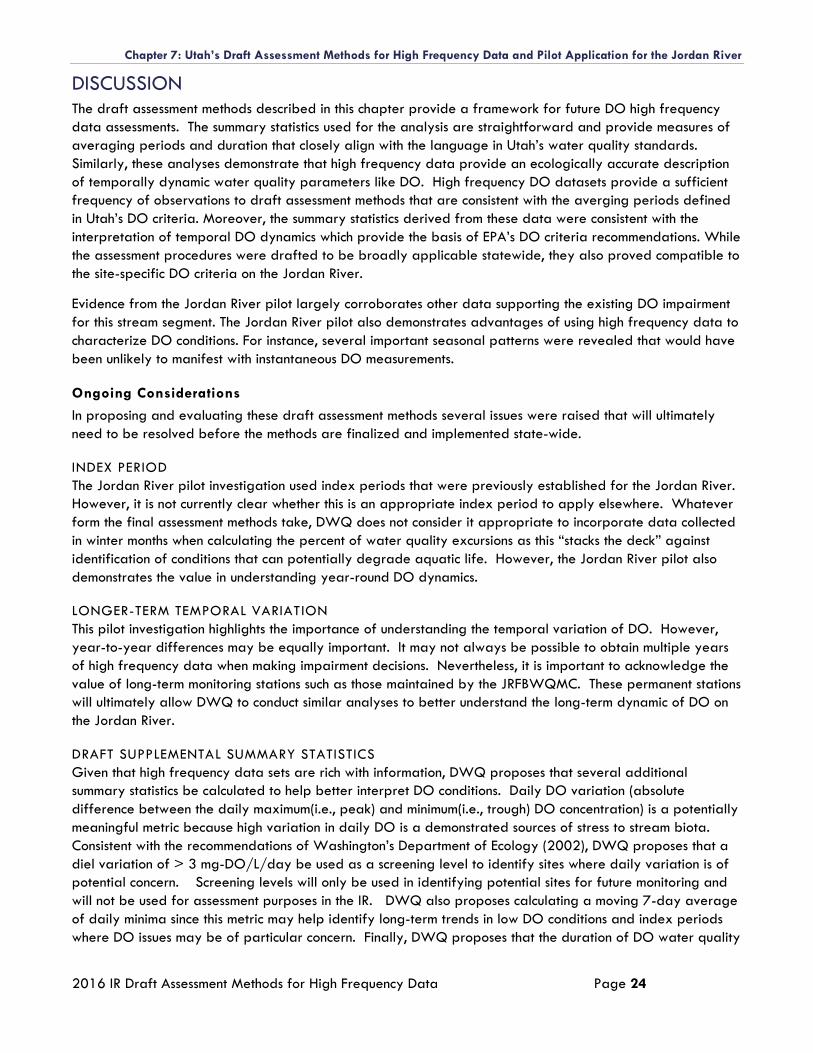
Chapter 7: Utah’s Draft Assessment Methods for High Frequency Data and Pilot Application for the Jordan River
2016 IR Draft Assessment Methods for High Frequency Data Page 24
DISCUSSION
The draft assessment methods described in this chapter provide a framework for future DO high frequency
data assessments. The summary statistics used for the analysis are straightforward and provide measures of
averaging periods and duration that closely align with the language in Utah’s water quality standards.
Similarly, these analyses demonstrate that high frequency data provide an ecologically accurate description
of temporally dynamic water quality parameters like DO. High frequency DO datasets provide a sufficient
frequency of observations to draft assessment methods that are consistent with the averging periods defined
in Utah’s DO criteria. Moreover, the summary statistics derived from these data were consistent with the
interpretation of temporal DO dynamics which provide the basis of EPA’s DO criteria recommendations. While
the assessment procedures were drafted to be broadly applicable statewide, they also proved compatible to
the site-specific DO criteria on the Jordan River.
Evidence from the Jordan River pilot largely corroborates other data supporting the existing DO impairment
for this stream segment. The Jordan River pilot also demonstrates advantages of using high frequency data to
characterize DO conditions. For instance, several important seasonal patterns were revealed that would have
been unlikely to manifest with instantaneous DO measurements.
Ongoing Considerations
In proposing and evaluating these draft assessment methods several issues were raised that will ultimately
need to be resolved before the methods are finalized and implemented state-wide.
INDEX PERIOD
The Jordan River pilot investigation used index periods that were previously established for the Jordan River.
However, it is not currently clear whether this is an appropriate index period to apply elsewhere. Whatever
form the final assessment methods take, DWQ does not consider it appropriate to incorporate data collected
in winter months when calculating the percent of water quality excursions as this “stacks the deck” against
identification of conditions that can potentially degrade aquatic life. However, the Jordan River pilot also
demonstrates the value in understanding year-round DO dynamics.
LONGER-TERM TEMPORAL VARIATION
This pilot investigation highlights the importance of understanding the temporal variation of DO. However,
year-to-year differences may be equally important. It may not always be possible to obtain multiple years
of high frequency data when making impairment decisions. Nevertheless, it is important to acknowledge the
value of long-term monitoring stations such as those maintained by the JRFBWQMC. These permanent stations
will ultimately allow DWQ to conduct similar analyses to better understand the long-term dynamic of DO on
the Jordan River.
DRAFT SUPPLEMENTAL SUMMARY STATISTICS
Given that high frequency data sets are rich with information, DWQ proposes that several additional
summary statistics be calculated to help better interpret DO conditions. Daily DO variation (absolute
difference between the daily maximum(i.e., peak) and minimum(i.e., trough) DO concentration) is a potentially
meaningful metric because high variation in daily DO is a demonstrated sources of stress to stream biota.
Consistent with the recommendations of Washington’s Department of Ecology (2002), DWQ proposes that a
diel variation of > 3 mg-DO/L/day be used as a screening level to identify sites where daily variation is of
potential concern. Screening levels will only be used in identifying potential sites for future monitoring and
will not be used for assessment purposes in the IR. DWQ also proposes calculating a moving 7-day average
of daily minima since this metric may help identify long-term trends in low DO conditions and index periods
where DO issues may be of particular concern. Finally, DWQ proposes that the duration of DO water quality
Chapter 7: Utah’s Draft Assessment Methods for High Frequency Data and Pilot Application for the Jordan River
2016 IR Draft Assessment Methods for High Frequency Data Page 25
criteria violations be tabulated, both within a day (number of hours below the criterion) and among days to
describe the duration and recurrence of low DO events.
Conclusions
This pilot investigation provides a useful “real world” example of how the draft assessment methods would be
used to make impairment decisions with high frequency DO data. The summary of data from 2014 confirmst
the existing dissolved oxygen impairments in the lower Jordan Rive (Assessment Units Jordan River-1, Jordan
River-2, and Jordan River-3). These analyses were successful in highlighting several details that will need to
be considered as DWQ adopts the draft assessment methods. These analyses will also provide an empirical
basis for ongoing discussions with stakeholders on how to make these final assessment procedures both
scientifically defensible and consistent with state and federal regulations.
Chapter 7: Utah’s Draft Assessment Methods for High Frequency Data and Pilot Application for the Jordan River
2016 IR Draft Assessment Methods for High Frequency Data Page 26
LITERATURE CITED
AWCA/EPA. 2014. Options for Addressing Continuous Monitoring Data, ACWA/EPA Water Quality Standards Forum Discussion Paper, Mike Tate (KS), Randy Pahl (NV) and Don Essig (ID), April 18, 2014
DWQ. 2005. Standards of quality for waters of Utah, R317-2, Utah Administrative Code, Utah Department of Environmental Quality, Utah Division of Water Quality.
DWQ. 2014b. Nutrients in Utah's Waters. Available at: http://www.nutrients.utah.gov/. Accessed September 19, 2014.
EPA. 1985. Guidelines for Deriving Numerical National Water Quality Criteria for the Protection of Aquatic Organisms and their Uses. EPA-PB85-227049.
EPA, 1986. Quality Criteria for Water 1986, EPA. 440/5-86-001., U.S. Environmental Protection Agency, Washington, D.C.
EPA. 1986. Ambient Water Quality Criteria for Dissolved Oxygen (Freshwater). EPA 440/5/86- 003. U.S. Environmental Protection Agency, Washington, D. C.
EPA. 2005. Guidance for 2006 assessment, listing and reporting requirements pursuant to Sections 303(d) and 305(b) of the Clean Water Act. Available at: https://www.epa.gov/sites/production/files/2015-10/documents/2006irg-report.pdf. Accessed September 19, 2014.
WSDE. 2002. Evaluating Criteria for the Protection of Freshwater Aquatic Life in Washington’s Surface Water
Quality Standards. Watershed Management Unit. Washington State Department of Ecology Water Quality
Program. Olympia, Washington.
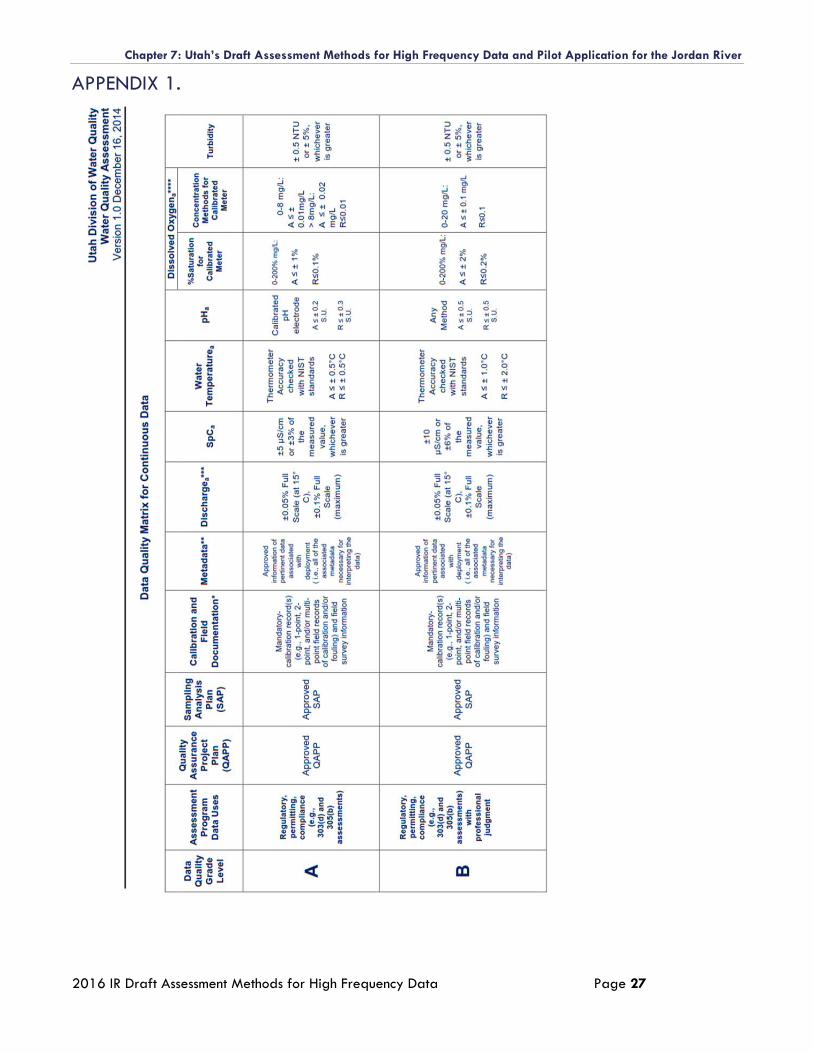
Chapter 7: Utah’s Draft Assessment Methods for High Frequency Data and Pilot Application for the Jordan River
2016 IR Draft Assessment Methods for High Frequency Data Page 27
APPENDIX 1.
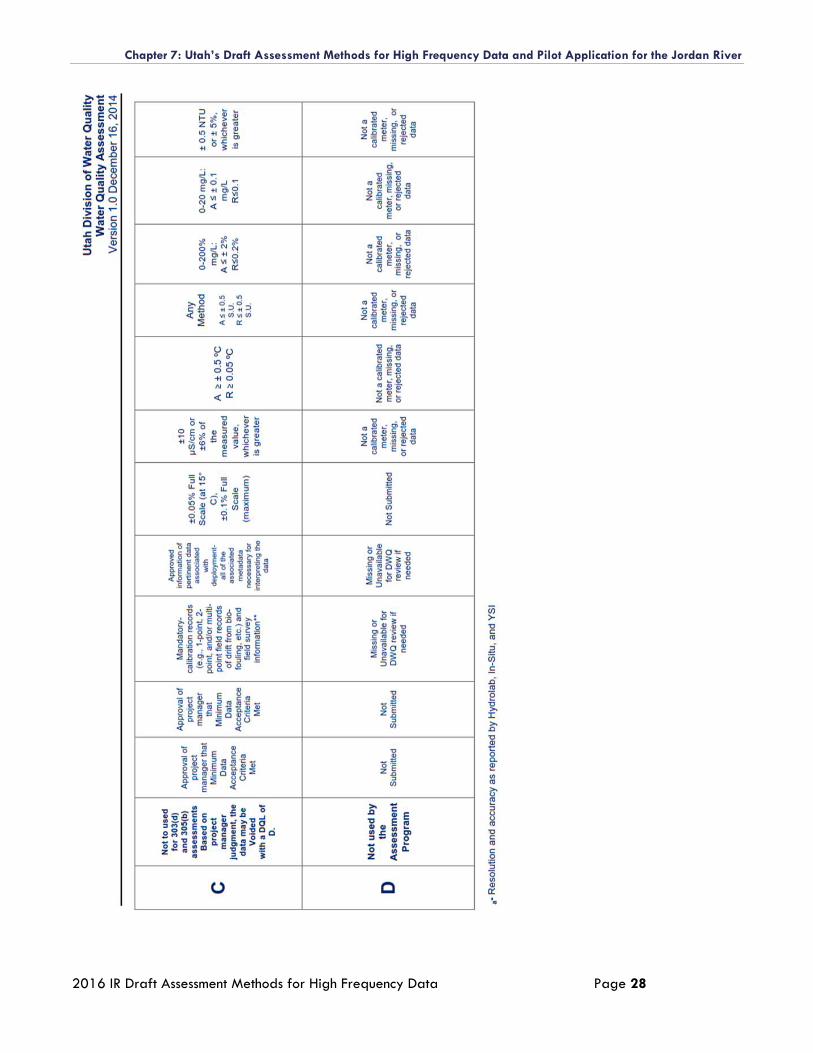
Chapter 7: Utah’s Draft Assessment Methods for High Frequency Data and Pilot Application for the Jordan River
2016 IR Draft Assessment Methods for High Frequency Data Page 28
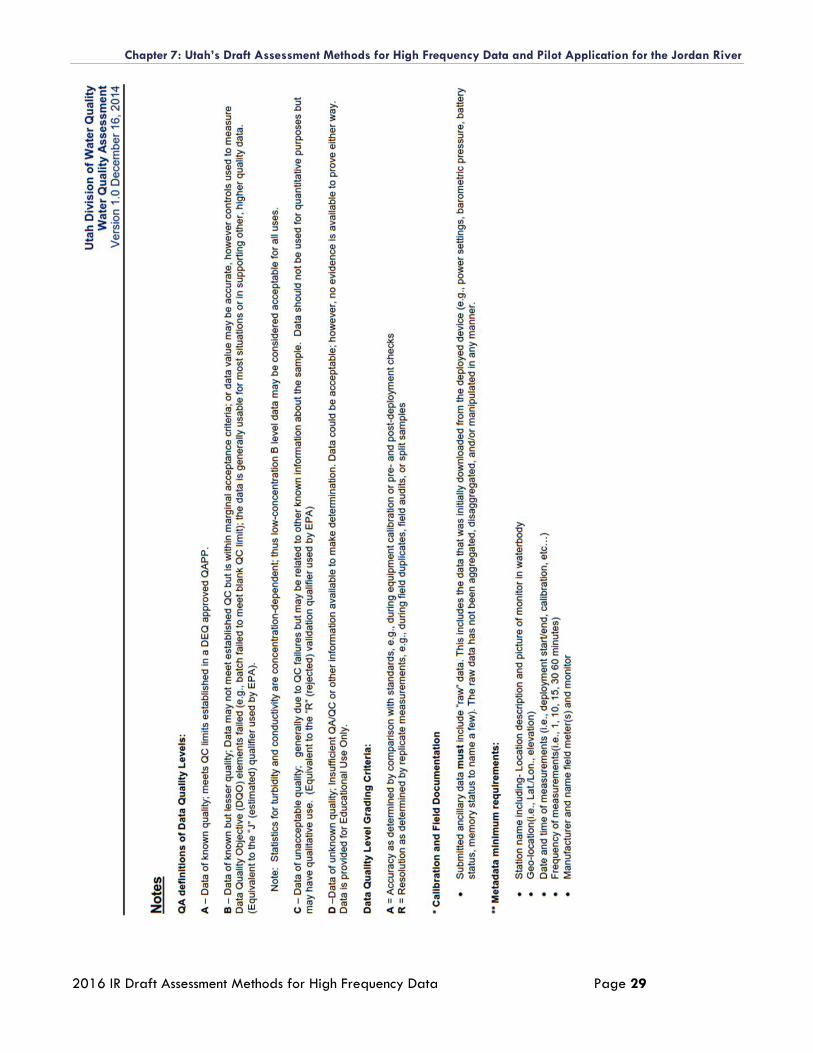
Chapter 7: Utah’s Draft Assessment Methods for High Frequency Data and Pilot Application for the Jordan River
2016 IR Draft Assessment Methods for High Frequency Data Page 29
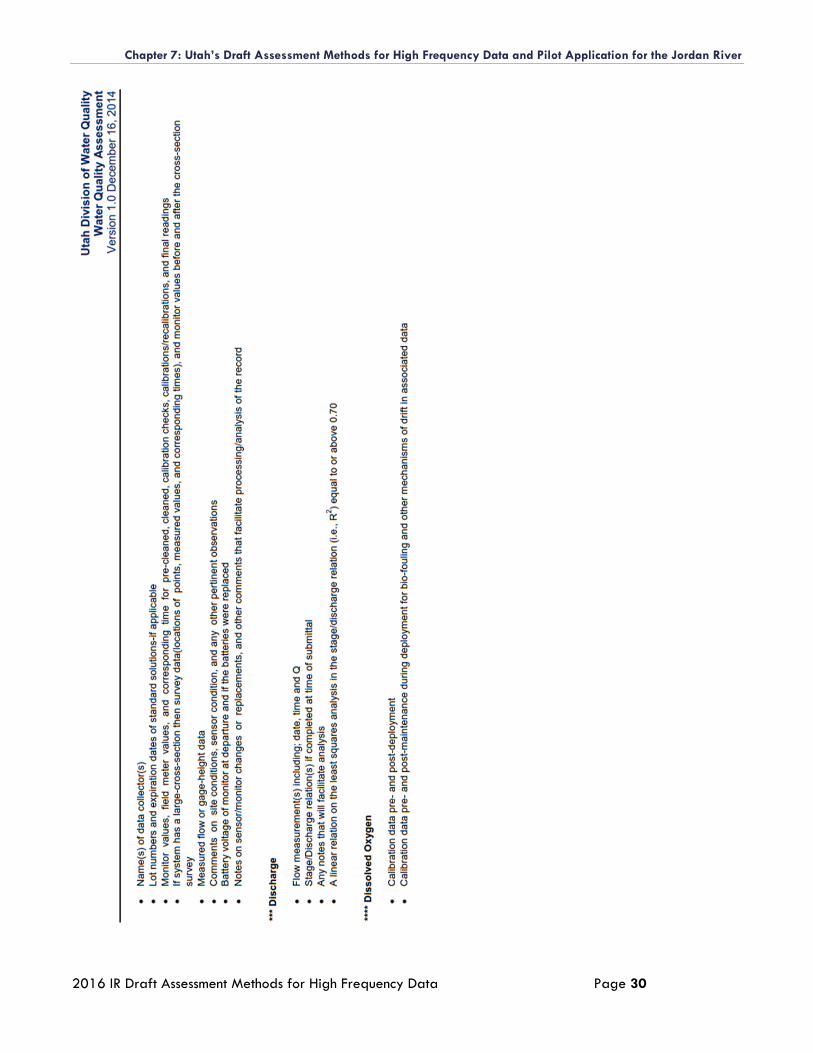
Chapter 7: Utah’s Draft Assessment Methods for High Frequency Data and Pilot Application for the Jordan River
2016 IR Draft Assessment Methods for High Frequency Data Page 30