utilities and horizontal energy efficiency webinar nº 11
TRANSCRIPT

Utilities and Horizontal Energy
Efficiency
Webinar nº 11

Contents 1. Energy efficiency in lighting
• Energy efficiency in installations
• Improvement of installed equipment
• Installation of energy saving devices
• Switch on and switch off devices
2. Energy efficiency in compressed air • Operation compressor All/Nothing
• Variable Speed Compressor
• Control systems
• General Improvements
3. Measurement devices • Lux Meter
• U-Value
• Combustion Gas Analyzer
• Grid Analyzer

Energy efficiency in lighting systems
1. Energy efficiency in installations
2. Improvement of installed equipment
3. Installation of energy saving devices
4. Switch on and switch off devices.

Título capítulo
Lighting: the measure of the power of electromagnetic radiation related to visible
light.
Luminous flux: objective measure of the useful light emitted by a light source.
Symbol: F
Units: lumen (lm)
Luminous intensity: the flux that is radiated by a light source in a determinate
direction.
Symbol: I
Units: candela (cd)
Energy efficiency in lighting

Título capítulo
Luminous efficacy: It is the ratio of luminous flux to power (usually electric power)
Units: lm/W
Illuminance: Relationship between the luminous flux (lumens) and the area.
Units: lux (lx) = 1lx = 1lm/m2
W lm
Energy efficiency in lighting

Lamps classification
incandescent High intensity discharge
Thermoresistence
halogen
Gas discharge
fluorescent pipe compact
fluorescent
Ligh emiting diode
(LED)
Energy efficiency in lighting

Título capítulo
Luminous Efficacy and Luminous Efficiency
The luminous efficiency is expressed as a value
between zero and one.
1 corresponding to an efficacy of 683lm/W
Light bulb label
Energy efficiency in lighting

Título capítulo
VEEI: Energy Efficiency Value in Lighting systems
The energy efficiency of the lighting system in a particular zone is
determined by the VEEI value (W/m2) for each 100 lux. Ratio of the lighting
density in an area.
P, the total power of light taking into account the auxiliary devices (W)
S, illuminated surface (m2)
Em, horizontal average of illuminance (lux)
[W/m2]
Energy efficiency in lighting

Improvement of installed equipment
Lamps
Ballast or reactance
Luminary
Energy efficiency in lighting

Improvement of installed equipment
Profits:
1.- Power installed is reduced with the same amount of illumination
Mercury vapour 250 W high pressure sodium 150 W
Mercury vapour 125 W high pressure sodium 70 W
2.- Lifespan is higher, so it reduces the cost of replacing the lamps
Mercury vapour 10.000 h high pressure sodium 20.000 h
Energy efficiency in lighting
Improvement of installed equipment:
Problems:
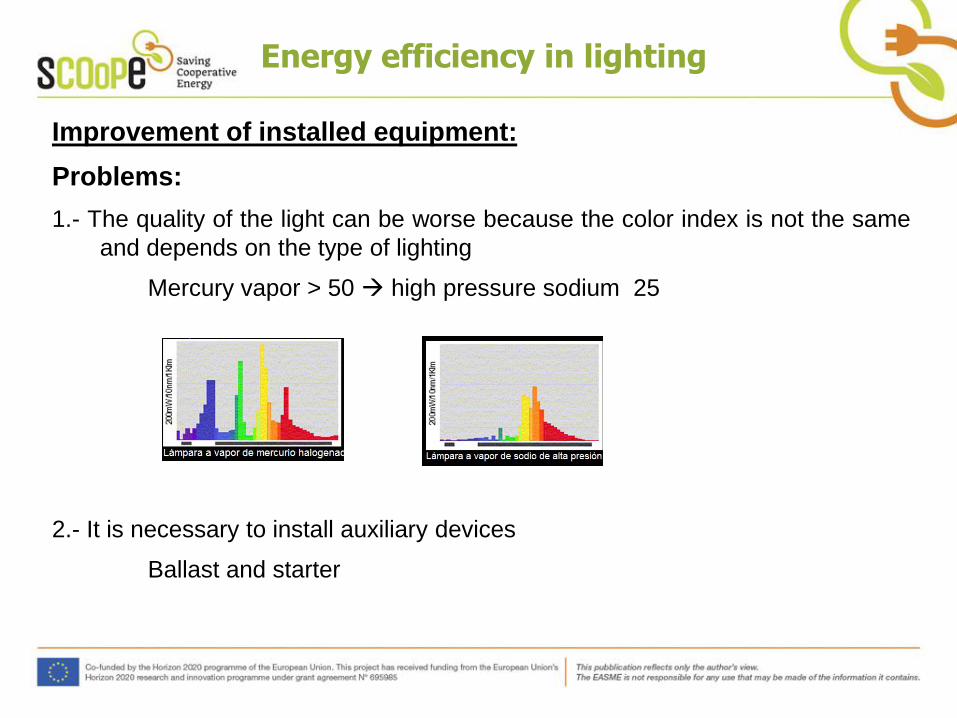
1.- The quality of the light can be worse because the color index is not the same
and depends on the type of lighting
Mercury vapor > 50 high pressure sodium 25
2.- It is necessary to install auxiliary devices
Ballast and starter
Energy efficiency in lighting

Improvement of installed equipment:
Replacement of electromagnetic ballasts by other electronic devices.
Energy efficiency in lighting
Improvement of installed equipment: replace the ballast
Problems:
• Operation problems in high temperatures.
• Because there are electronic components in them, it is necessary to remove the heat to
ensure operating temperatures below 70ºC
Improve of installed equipment: replace luminary
Profits
• Improve energy efficiency in the lighting system by directing the lighting flow to the area
that needs lighting
• With the use of high efficiency reflectors it is possible to reduce the electrical power of
the lamps
• It includes systems with IP protection that improve maintenance operations
Problems
• It is necessary to adapt the system (support)
Energy efficiency in lighting
Installation of saving devices:
To obtain energy savings in lighting systems it is possible to install
equipment that reduces the lighting flow and the hours of operation.
• Lighting flow regulators
• Dual level line installation
• Regulated electronic ballasts
Energy efficiency in lighting

Installation of saving devices: lighting flow balancers
This device reduces the input voltages in the lamps for
a certain time. It is possible to achieve energy savings
up to 40%.
The lower voltages may vary depending on the type of
installations, but due to the safety conditions, it is
recommended to discharge lamps following these
values:
• Nominal value: 230 V
• Reduced value in sodium: 184 V
• Reduced value in mercury: 207 V
Due to voltage losses in the line, it is not recommended
to adjust theses values too much.
Energy efficiency in lighting

The function is very easy, the system allows adjusting the level of
illumination and a regulator must turn on or off each one.
The energy consumption is very low
Installation of double level of ballasts in each lamp
Energy efficiency in lighting

Profits:
• There are very high energy savings
• It is an economical system, but only in the case of a dual level line
installation
Problems:
• A double line level is required at each point of light
• It reduces power factor, so an auxiliary capacitor is needed
• Devices that can turn the line on and off are required (clock, photocell)
Installation of double level of ballasts in each lamp
Energy efficiency in lighting

Lighting system with LEDs
Characteristics:
• Efficiency: very high, around 90 lm/W
• Lifespan: Long (100.000 -50.000 h)
• Cost reduction in operation and maintenance
• Colour: High spectrum of colours
• IRC: high RA = 80
• It is recommended for installations that have too many switches on and off
(e.g. cooling chambers)
Applications
• Traffic lighting
• Information displays
• Low power outdoor lighting
• All applications for indoor lighting (lamps, pipes)
Energy efficiency in lighting
Energy efficiency in compressed air
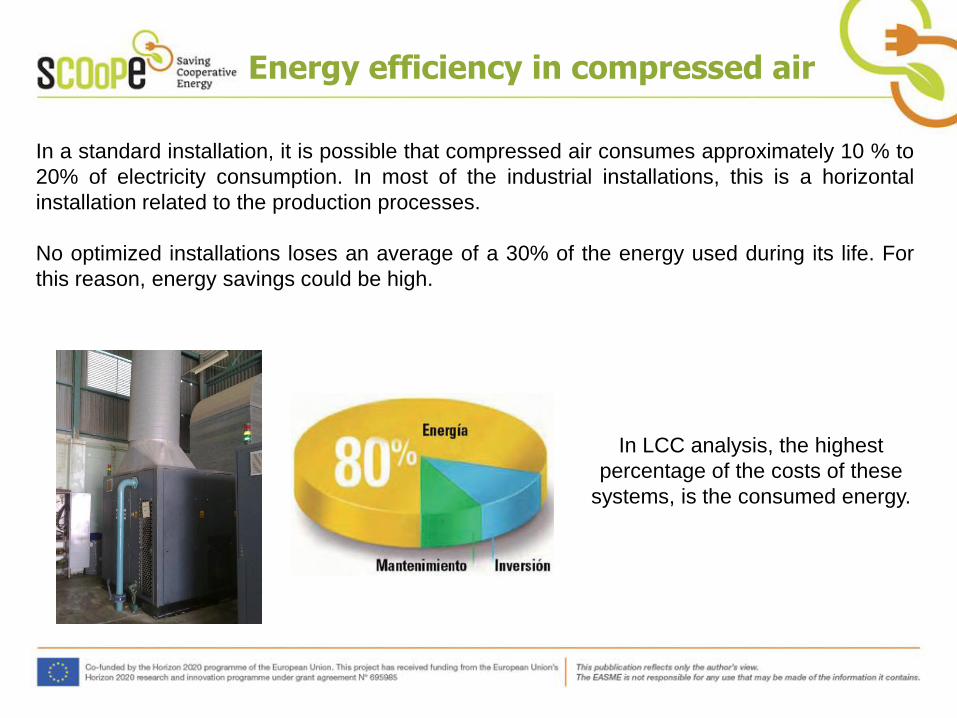
In a standard installation, it is possible that compressed air consumes approximately 10 % to
20% of electricity consumption. In most of the industrial installations, this is a horizontal
installation related to the production processes.
No optimized installations loses an average of a 30% of the energy used during its life. For
this reason, energy savings could be high.
In LCC analysis, the highest
percentage of the costs of these
systems, is the consumed energy.

Sumario
Compressor working
• Load. The compressor demands nominal power and injects the nominal flow into the
compressed air circuit.
• Unload. The compressor demands between 30 and 20 % of nominal power without injecting
compressed air into the circuit.
Operation compressor All/Nothing (Loading and unloading)
Energy efficiency in compressed air

Variable Speed Compressor
A compressor without variable speed can only control its pressure by loading or unloading.
For this reason, these compressors, in periods of demand, consume an average of 30% of
energy without producing compressed air.
Proposed Improvement:
The installation of a variable speed compressor will allow to control periods of variable demand
and reduce the energy consumption.
Energy efficiency in compressed air

A control System
An automatic control is very important if there are several compressors in the same installation
Advantages:
Management priorities, giving preference to the most efficient compressors and
adapting the workload.
Possibility of programming different pressure points.
Fix a reduced pressure band. (For each 1bar of pressure reduced in a system of
7-8 bar, the energy consumption decreases 7% ).
Energy efficiency in compressed air

Detection of air leaks in compressed air net and creation of a leak control and
maintenance plan.
Divide the air compressor net into different production areas.
Set the adequate working pressure. (A 20% reduction in pressure produces a
15% reduction in energy consumption in the air compressor).
Heat recovery: The heat removed can be recovered to produce energy savings.
General improvements
Energy efficiency in compressed air

• Lux Meter
• Thermographic camera
• U-Value Meter
• Combustion Gas Analyzer - Flue Gas Analyzer
• Grid Analyzer
Measurements Devices

LUX METER

The Lux Meter allows the measurement of luminous flux (lumen) per unit area
(m2) that provides a lighting value in lux, the illuminance level.
European Standards exist covering minimum lighting levels depending on the activity.
• EN 12464-1 Lighting of work places – Indoor work places
• EN 12464-2 Lighting of work places – Outdoor work places
• EN 15193 Energy Performance of Buildings – Energy requirements for lighting
• EN 12193 Sports lighting level
However, the standards also specify that sometimes “more” is required depending on
the situation.
Lux Meter

Components of a Lux Meter
The lux meter must be calibrate by an
authorised laboratory
1. Sensor – Silicon photodiode
2. Low battery indication
3. Range selector
4. Peak function (813) or max function (811)
5. Measures of foot-candles or lux or off (power selector)
6. Removable sensor for remote reading
7. Display
8. Hold function

THERMOGRAPHIC CAMERA
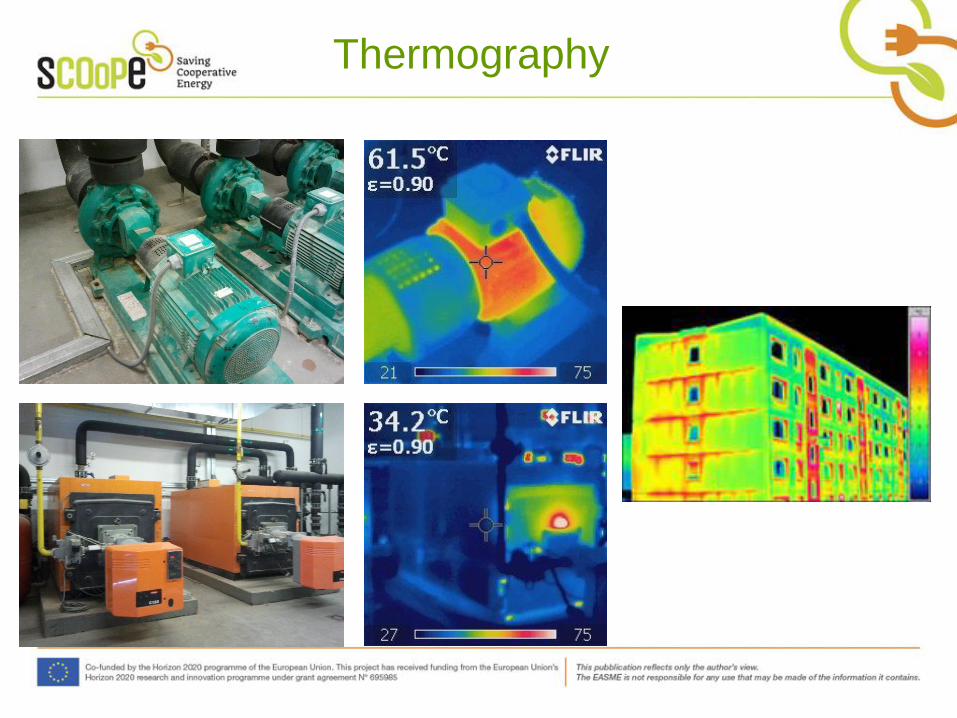
Thermography
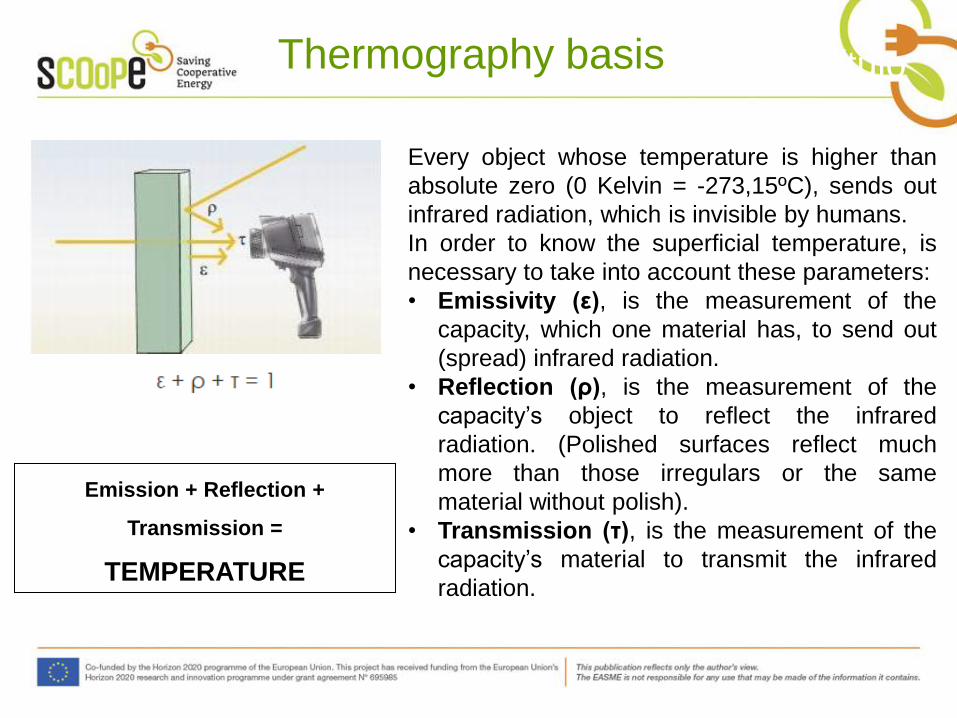
Título capítulo Thermography basis
Emission + Reflection +
Transmission =
TEMPERATURE
Every object whose temperature is higher than
absolute zero (0 Kelvin = -273,15ºC), sends out
infrared radiation, which is invisible by humans.
In order to know the superficial temperature, is
necessary to take into account these parameters:
• Emissivity (ε), is the measurement of the
capacity, which one material has, to send out
(spread) infrared radiation.
• Reflection (ρ), is the measurement of the
capacity’s object to reflect the infrared
radiation. (Polished surfaces reflect much
more than those irregulars or the same
material without polish).
• Transmission (τ), is the measurement of the
capacity’s material to transmit the infrared
radiation.

Título capítulo Parameters to configure a
thermographic camera
The configuration of a thermographic camera is possible depending on the
characteristics of the surface. It is necessary to define the emissivity and reflection of
the material.
Most of the thermographic camera’s software have included a material data base.
There are also cameras with automatic regulation
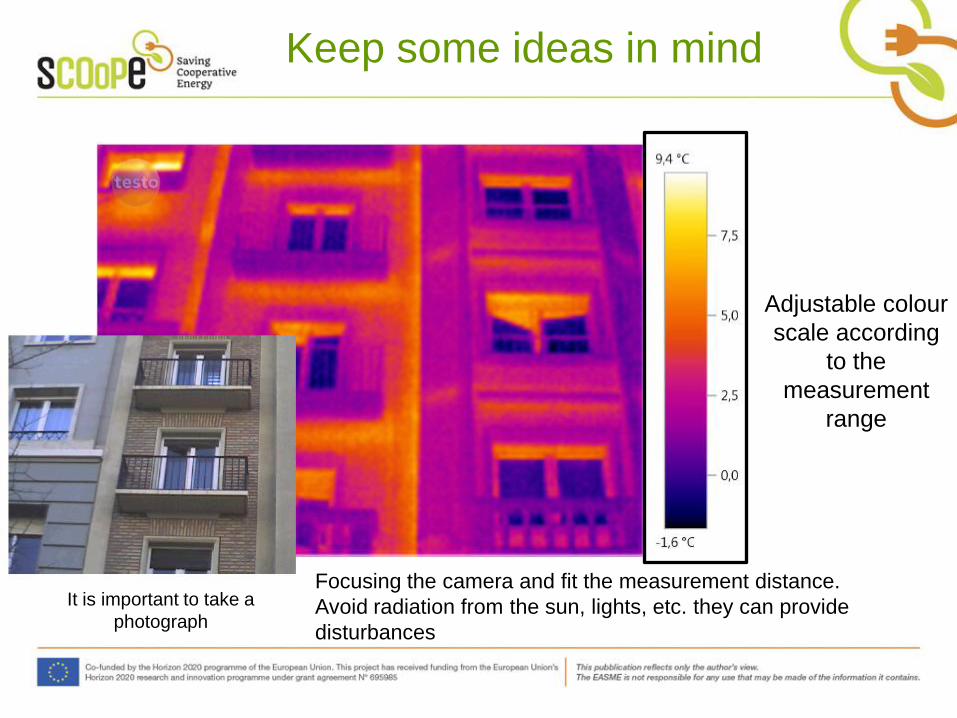
Keep some ideas in mind
Adjustable colour
scale according
to the
measurement
range
It is important to take a
photograph
Focusing the camera and fit the measurement distance.
Avoid radiation from the sun, lights, etc. they can provide
disturbances

Why thermography is useful?
Termites detection Humidity detection
Infiltration detection Condensations

U-VALUE METER

U-Value Meter

Thermal transmittance
The Thermal transmittance or U-Value, is the rate of transfer of heat
through one square metre of a structure, divided by the difference in
temperature across the structure. W/m2K.

Basis of calculation
• The thermal transmittances of most walls and roofs can be calculated
using ISO 6946.
• For most ground floors it can be calculated using ISO 13370.
• For most windows the thermal transmittance can be calculated using ISO
10077 or ISO 15099.
• ISO 9869 describes how to measure the thermal transmittance of a
structure experimentally.

Basis of calculation
Q/A: The rate of heat and surface [W/m2]
e: thickness [m]
k: heat conductivity [W/mK]
hci: indoor convection coefficient [W/m2K]
hce: external convection coefficient
[W/m2K]
Ti: indoor temperature [ºC]
Tsi: indoor surface temperature [ºC]
Te: outdoor temperature [ºC]
Tse: outdoor surface temperature [ºC]
U: U-Value of transfer of heat [W/m2K]
Indoor conditions
Heat flux through the
wall
U-Value meter equation
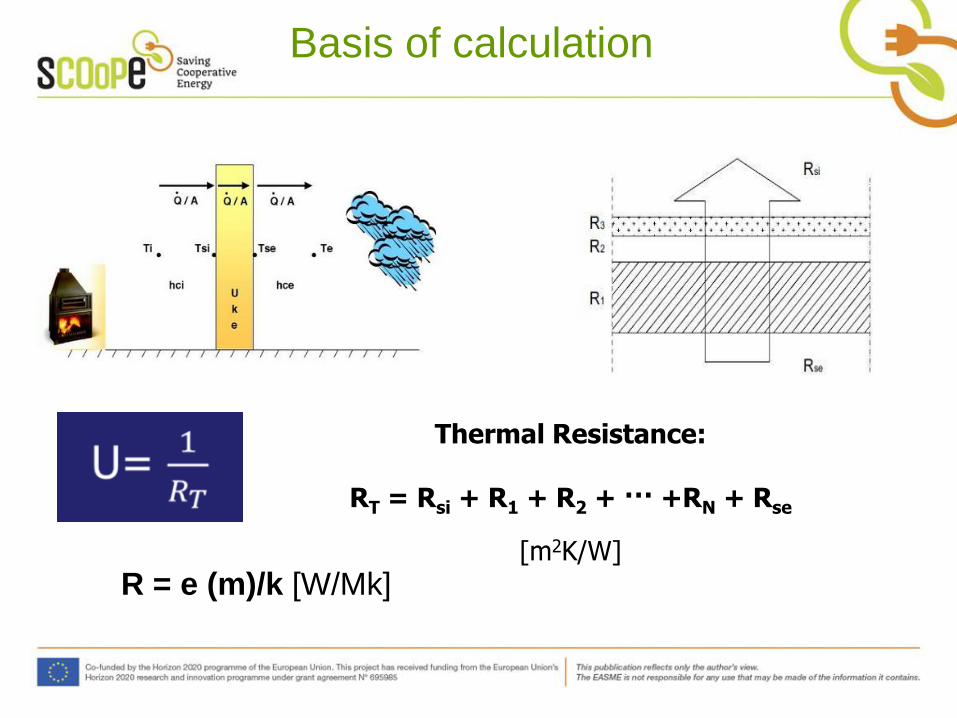
Basis of calculation
Thermal Resistance:
RT = Rsi + R1 + R2 + ··· +RN + Rse
[m2K/W] R = e (m)/k [W/Mk]

How is the measurement?
The external conditions influence:
• The difference in temperature between the inside and outside
of the building is at least 5°C.
• The weather is cloudy rather than sunny
• There is good thermal contact between the heat flux meter and
the wall or roof being tested.
• The monitoring of heat flow and temperatures is carried out
over at least 72 hours.
• Different spots on a building element are measured or a
thermographic camera is used to secure the homogeneity of
the building element.
ISO 9869 describes how to measure the thermal transmittance of a roof or a wall by using heat
flux meters. These heat flux meters usually consist of thermopiles which provide an electrical
signal.
For most wall and roof constructions the heat flux meter needs to monitor heat flows
continuously for a period of 72 hours to be conform the ISO 9869 standard.

U-Value Meter
Wireless measurement data transmission via radio;
Both indoors and outdoors temperature
measurements can be carried out simultaneously;
To calculate the U-Value is possible thanks of three
sensors or thermopiles in contact with the wall. These
sensors measure the indoor conditions;
The U-Value Meter registers all the values and
calculates the U-Value;
This equipment measures both temperature and
humidity.
Testo 635-2 U-value set and thermohygrometer

U-Value Meter
The difference in temperature between
the inside and outside of the building is
at least 15°C;
Measurement in stable zones of the
walls; Avoid thermal bridges and unions;
The external surface should be protected
from the snow, wind, rain or sun
radiation;
Indoor temperature should be constant
during the measurement period.
Testo 635-2 U-value set and thermohygrometer

The Results
It is important to know how to analyse the results, because the
value fluctuates a lot during the measurement period.

Combustion Gas Analyser
Flue Gas Analyser

Combustion reaction in a boiler

Energy Efficiency of a Boiler
To verify the energy performance of a boiler:
• Direct Method
• Indirect Method: The evaluation of the different losses in a boiler
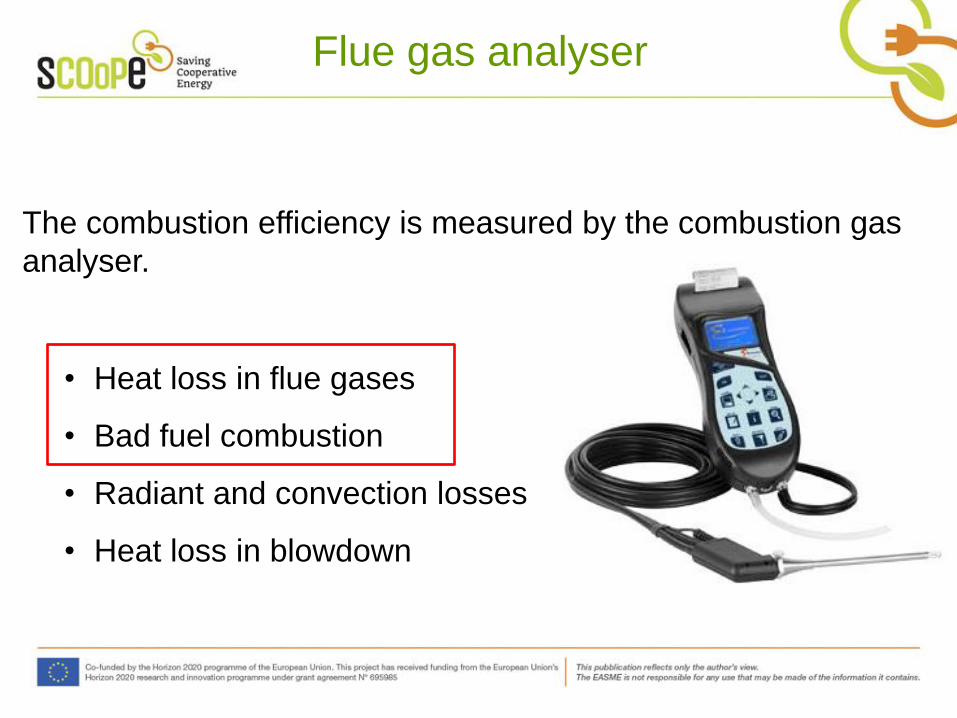
• Heat loss in flue gases
• Bad fuel combustion
• Radiant and convection losses
• Heat loss in blowdown

Energy Efficiency of a Boiler
• Heat loss in flue gases
• Bad fuel combustion
• Radiant and convection losses
• Heat loss in blowdown
Flue gas analyser
• Heat loss in flue gases
• Bad fuel combustion
• Radiant and convection losses
• Heat loss in blowdown
The combustion efficiency is measured by the combustion gas
analyser.
Flue gas analyser
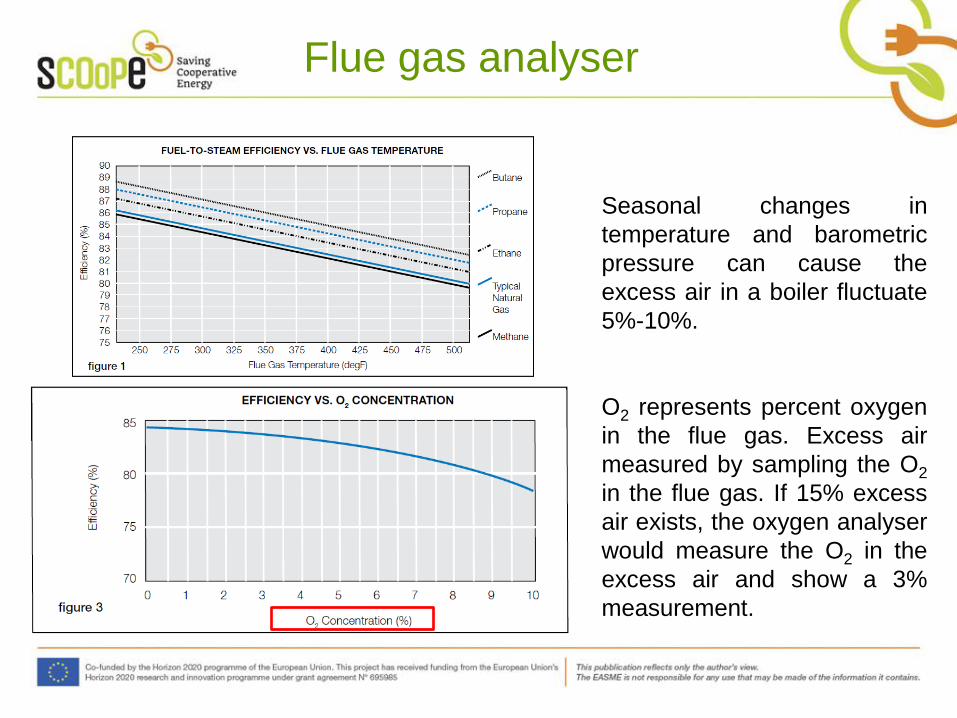
Seasonal changes in
temperature and barometric
pressure can cause the
excess air in a boiler fluctuate
5%-10%.
O2 represents percent oxygen
in the flue gas. Excess air
measured by sampling the O2
in the flue gas. If 15% excess
air exists, the oxygen analyser
would measure the O2 in the
excess air and show a 3%
measurement.

Flue gas analyser
The combustion gas analyser, measures, display, store and
print combustion efficiency, O2, CO, CO2, along with all of the
necessary temperature, draft, and pressure measurements.

GRID ANALYZER

Grid analyzer
An analyzer allows you to measure all the necessary parameters:
voltage, current and power parameters for a complete diagnosis of an
electrical installation. It provides captures and records of all the
parameters, transients, alarms and waveforms simultaneously to have a
complete knowledge of the installation or equipment under study with a
simple and easy use.

Grid analyser
How to switch on the analyzer? 1. The analyzer has two different kinds of connection:
• Connection to the network: to charge the intern battery of the
equipment for being allowed to use it in the field.
• USB connection to PC: to download the information registered from
analyzer to the computer.
2. There are several sorts of sensor you can use depending on what you
need to measure:
• You have 4 current inputs where you have to connect the current
sensors. The most important ones are:
• Clamp meter for measuring moderate intensity (up to 400 A) in
AC, no cables very large section. You have 4 voltage inputs
where you have to connect the voltage sensors.
• Amflex for measuring high intensity (up to 6.000 A) in AC, cables
of very large section.
• Clamp meter DC: for measuring intensity in direct current.
You have 4 voltage inputs where you have to connect the voltage sensors.

Grid analyser

Grid analyser
Configuration parameters
Image 1.- Keyboard
Image 2.- SETUP Screen
Image 3.- Colours display
ENTER button to confirm and
access to the different menus
GRAPH button to show the
value of measurements
POWER button
RECORDING button
POWER Button to
switch on the
analyzer

Grid analyser
Within the SETUP Screen you can modify the following basic parameters:
• DATE/TIME: Adjust if is necessary the time and the date of the
instrument. To know when a certain event happens when you analyze
the data in the whole period of measurements.
• COLOURS: Select different options about the colour assigned to the
power lines in both current and voltage.
• ELECTRICAL CONNECTION: This is one of the most important
steps. You have to choose the type of electrical configuration you
need to make according to the kind of installation you have: a single-
phase or triphasic voltage measure. The selected option is displayed
in bold, if you wanted to change it you will have to use the cursors to
choose other one.
• SENSORS AND RATIOS: After selecting the net configuration of your
installation, made in the previous item, you have to select the sensors
that you have connected to the analyzer.

Grid analyser
“GRAPH” button: You can check the different voltages
measure which appear in the right side of the screen.
Obviously, if the network configuration was single-phase you
will only have one value of voltage. In this mode, three types
of representations are possible: graphic, table and vector:
• 3U: Line voltage
• 3V: Phase voltage
• 3A: Current
• L1, L2 and L3: The three power
lines with all the values measurable.
• N: neuter line
“POWER” button: You can check the power and energy,
and check if you have installed in the right direction the
current clamp meters, too. There is an arrow drawn in the
current clamp indicating the direction in which the clamp
should be placed, which is in the current flow. If you had
negative values in one or more of the lines, you will have to
change the direction of the clamp of each line which has
negative value.

Grid analyser
Saved data:
To save the data you have just recorded it is necessary to either turn off
the analyzer or wait until the recording is finished. Before the process is
considered complete, restart the machine and check that the recording is
performed.

WP3 -
DIAGNOSIS TOOL

AUTODIAGNOSIS TOOL
1º STEP: Identify process, systems, and equipment.
2º STEP: Do an inventory of electric equipment and thermal equipment
Electric equipment:
a) Identify the equipment and the associated process (pumping, ventilation, drives…)
a) Engines
b) Lighting
c) Heat pump
d) Chiller
e) Cold compressor
f) Evaporators, condensators
b) Identify the electric characteristics: Power, demand current, voltage, power factor, operation regime.
c) To know how many hours operate ?
d) Load Factor
a) Maintenance program
b) Consumption if it is possible (meter or grid analyzer)

AUTODIAGNOSIS TOOL
Thermal equipment:
a) Identify the equipment and the associated process
a) Boilers
b) Dryers
c) Burners
b) Identify the thermal characteristics: Power, demand , kind combustible, exhausted gas
temperatures,
c) To know how many hours operate?
d) Load Factor
a) Maintenance program
b) Consumption if it is possible (meter and flue combustion analyzer)
Thank you for your attention!
Inmaculada Fraj
Gema Millán