Utility Billing and Utilities EnergyCAP · Monthly CV Spreadsheet. General Ledger. Collect Meter Readings. ... 6/1/2017. 7/1/2017. 8/1/2017. 9/1/2017. 10/1/2017 11/1/2017 12/1/2017
42
Utility Billing and EnergyCAP November 20, 2019 Facilities Management Presenters: Marla Johnson, Financial Manager, Utilities George Paterson, Manager, Energy Control Center, Utilities
George Paterson, Manager, Energy Control Center, Utilities
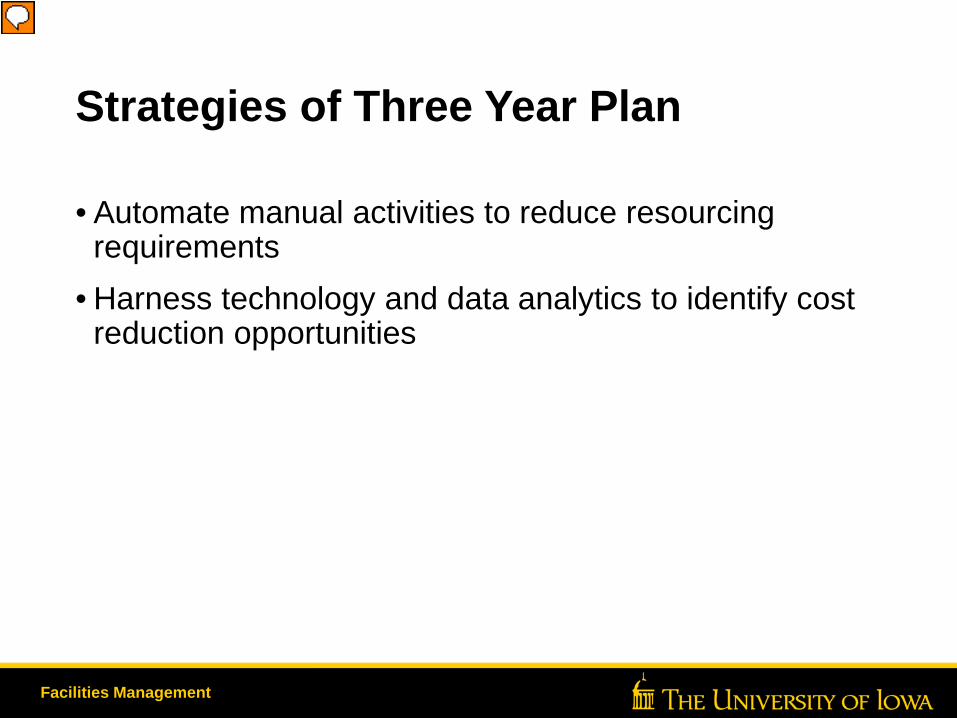
Strategies of Three Year Plan
• Automate manual activities to reduce resourcing requirements
• Harness technology and data analytics to identify cost reduction opportunities
Facilities Management
Presenter
Presentation Notes
This project directly addresses two of the 10 strategies identified in the Facilities Management 3-year strategic plan.
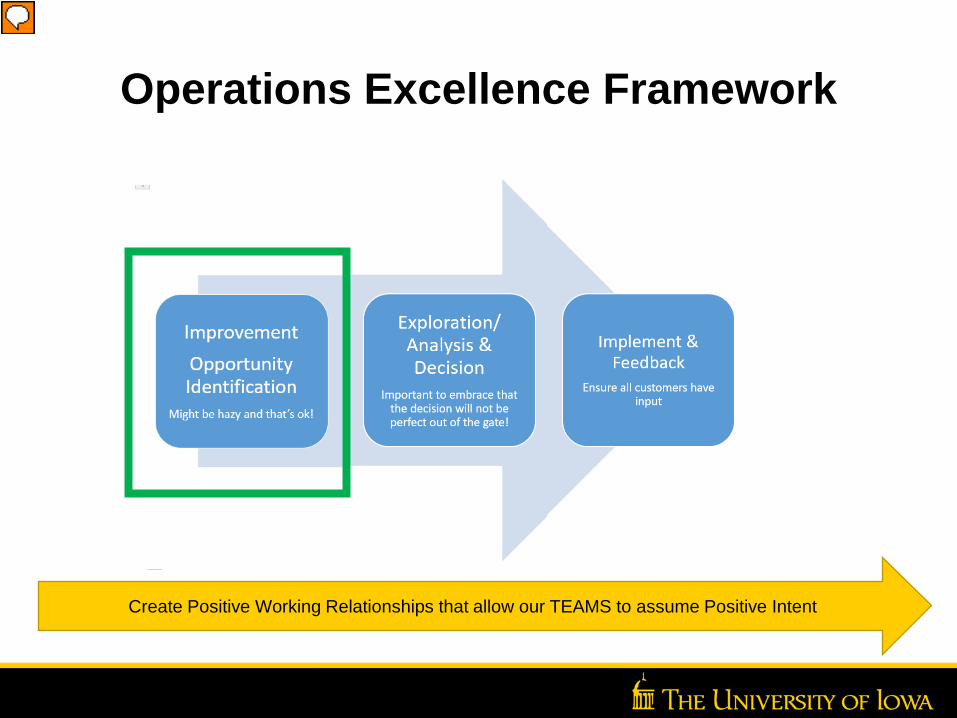
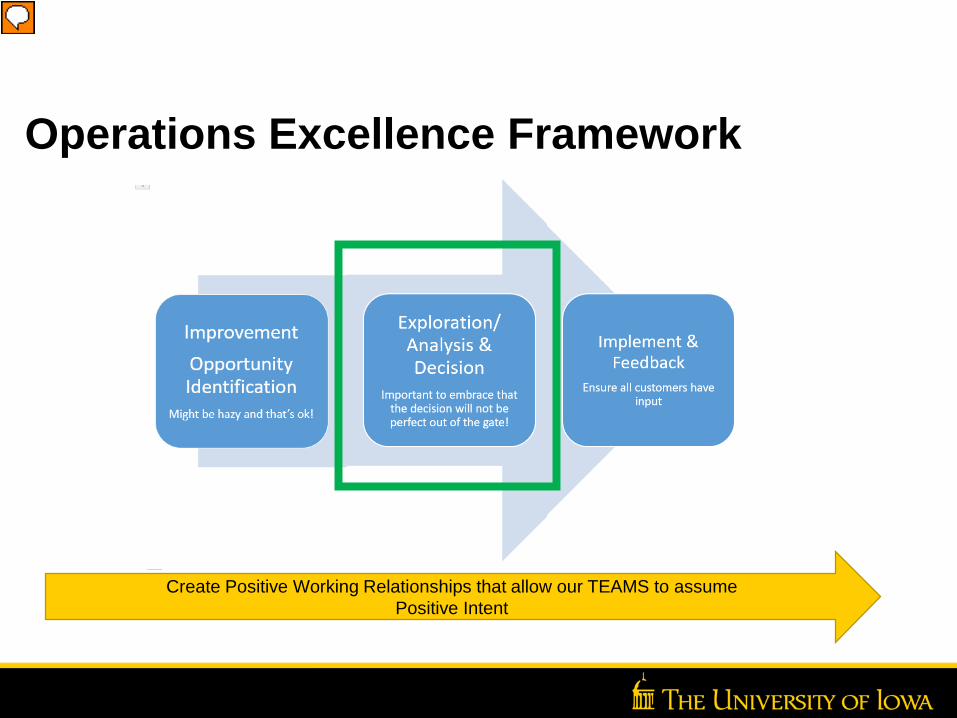
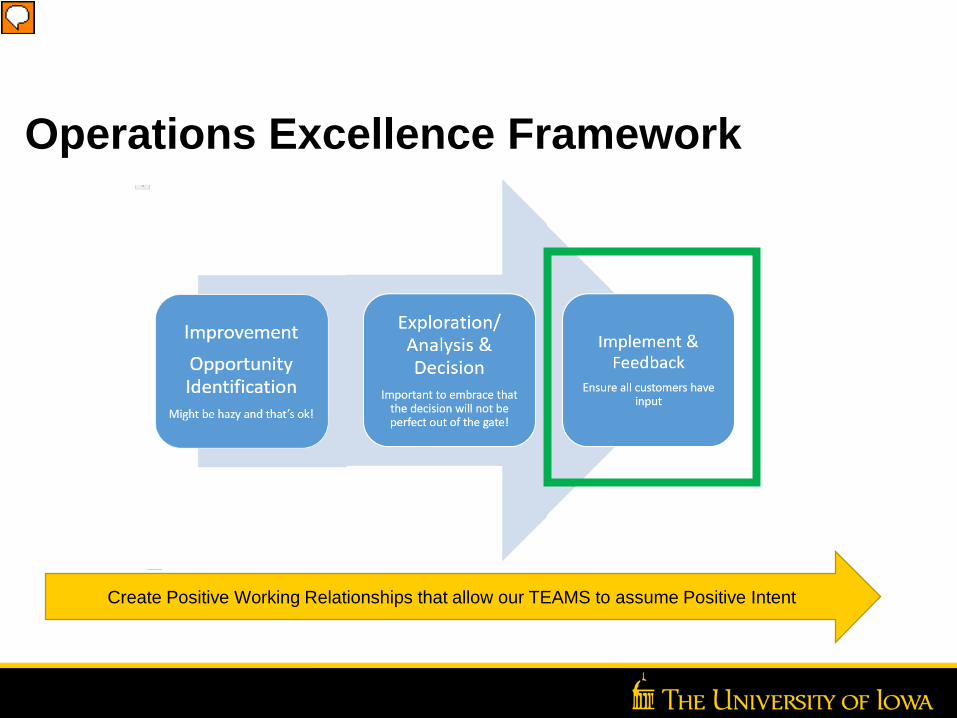
Operations Excellence Framework
Create Positive Working Relationships that allow our TEAMS to assume Positive Intent
Presenter
Presentation Notes
The operations excellence framework shows the three main steps we use to implement positive change in Facilities Management. In the first step we choose a process and try to identify untapped opportunities.
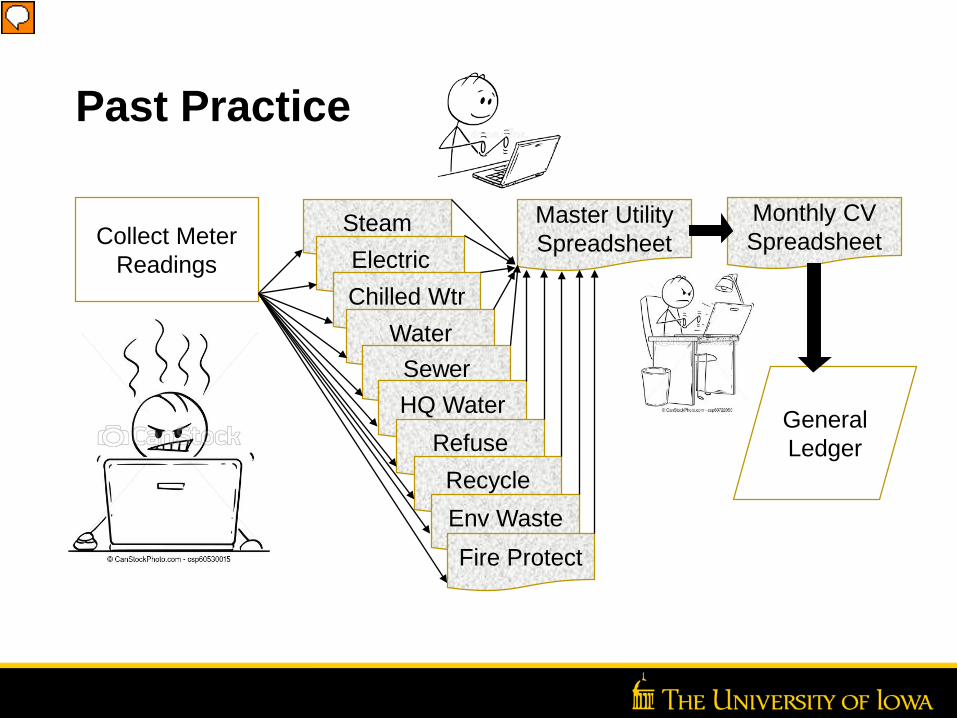
Past Practice
SteamElectricChilled Wtr
WaterSewerHQ Water
RefuseRecycleEnv WasteFire Protect
Master Utility Spreadsheet
Monthly CV Spreadsheet
General Ledger
Collect Meter Readings
Presenter
Presentation Notes
Analyzing the status quo gives insight into opportunities. Past practice involved a great deal of manual data entry and manipulation. All eleven commodities were handled by different people with different processes.
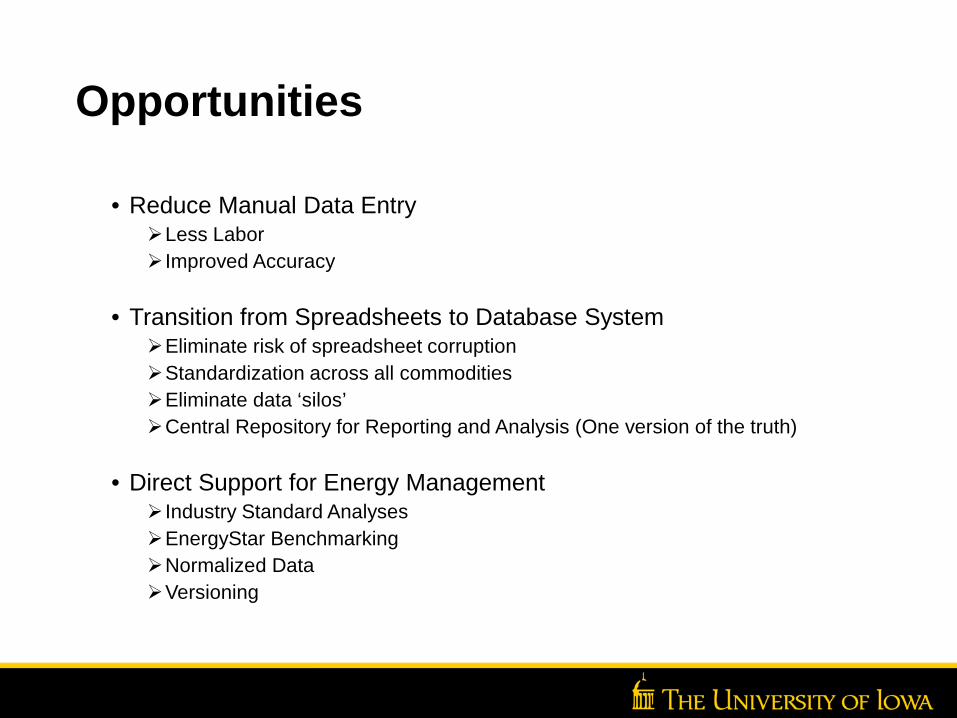
Opportunities
• Reduce Manual Data EntryLess Labor Improved Accuracy
• Transition from Spreadsheets to Database SystemEliminate risk of spreadsheet corruptionStandardization across all commoditiesEliminate data ‘silos’Central Repository for Reporting and Analysis (One version of the truth)
• Direct Support for Energy Management Industry Standard AnalysesEnergyStar BenchmarkingNormalized DataVersioning
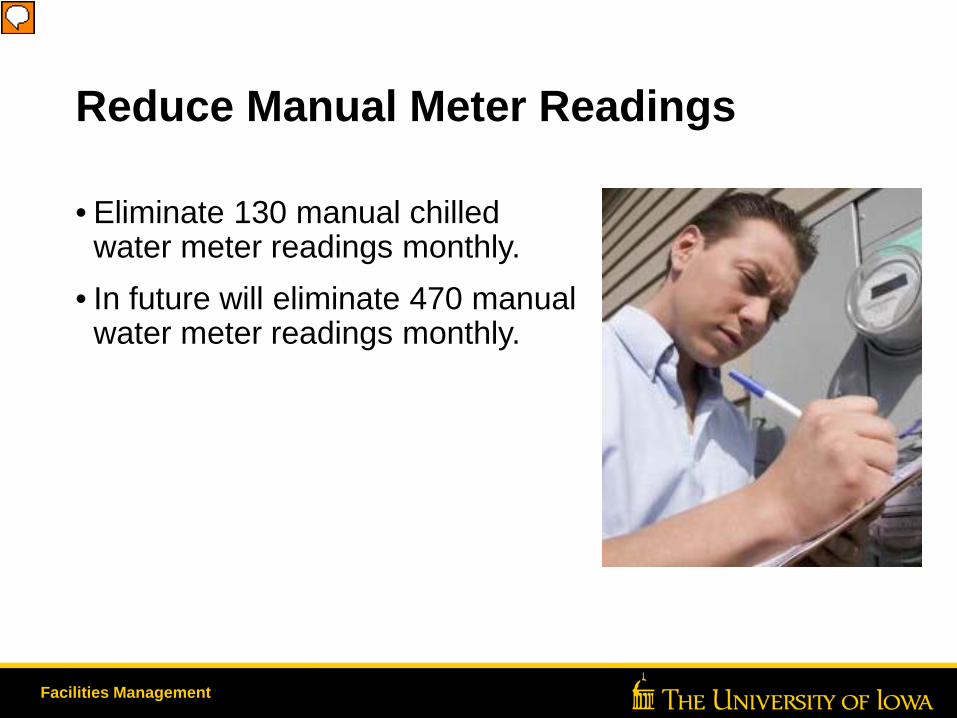
Reduce Manual Meter Readings
• Eliminate 130 manual chilled water meter readings monthly.
• In future will eliminate 470 manual water meter readings monthly.
Facilities Management
Presenter
Presentation Notes
Eliminated approximately 30 labor hours/month for chilled water meter readings. Those hours are now put to better use for meter maintenance.
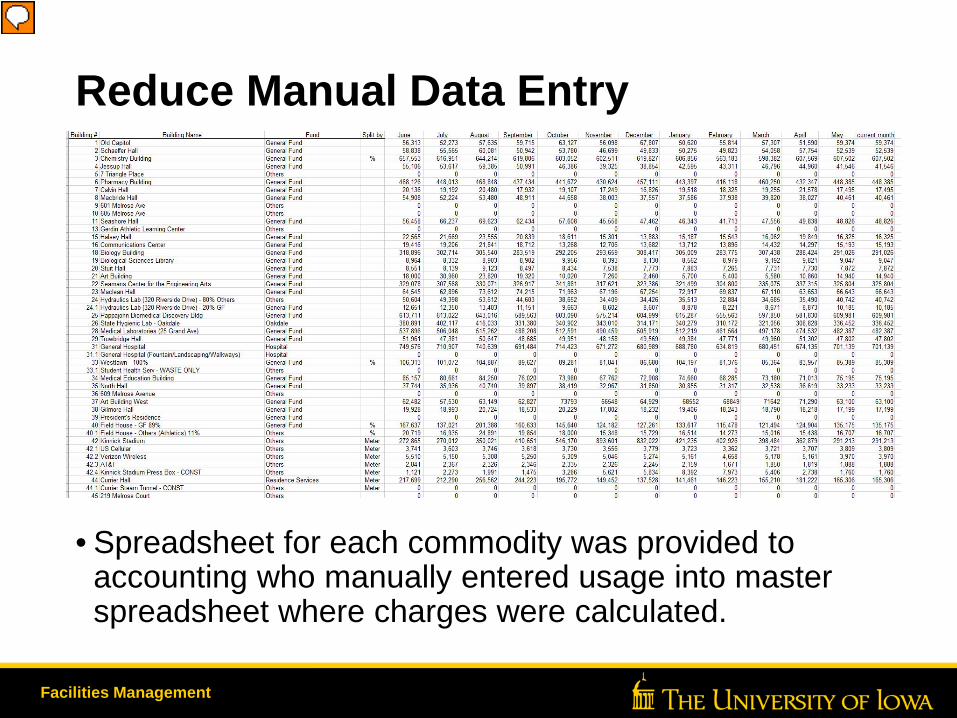
Reduce Manual Data Entry
• Spreadsheet for each commodity was provided to accounting who manually entered usage into master spreadsheet where charges were calculated.
Facilities Management
Presenter
Presentation Notes
Master spreadsheet contained 15 worksheets or ‘tabs’ with over 350 rows each. Over 46,200 individual values entered yearly. With 99% accuracy, there would be over 400 errors per year.
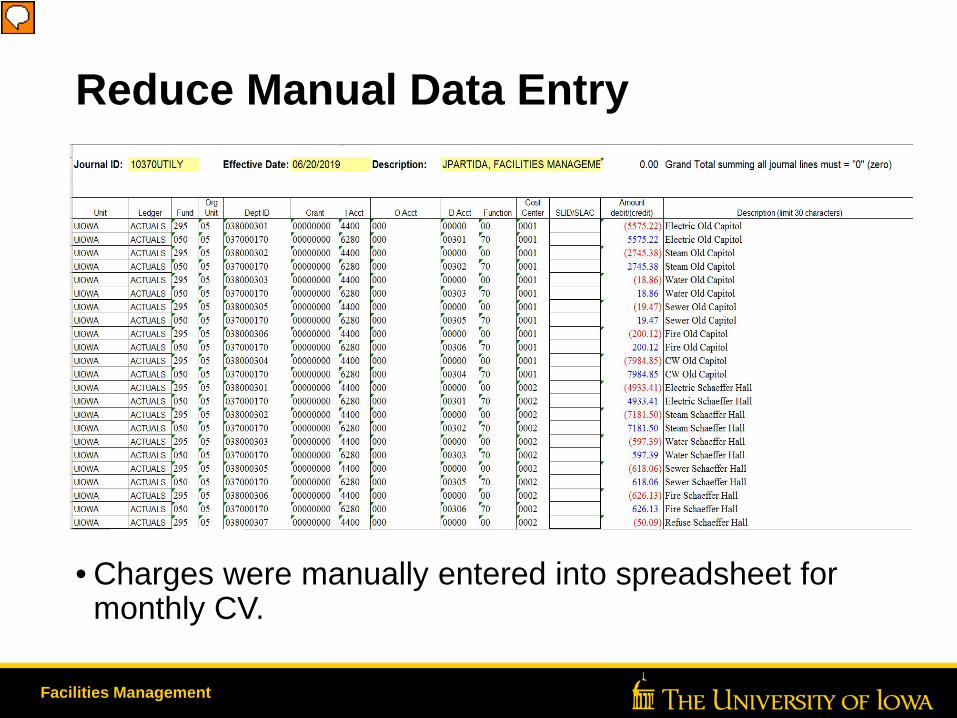
Reduce Manual Data Entry
• Charges were manually entered into spreadsheet for monthly CV.
Facilities Management
Presenter
Presentation Notes
Costs are manually added to monthly CV workbook after being calculated in master spreadsheet. Over 2400 entries monthly.
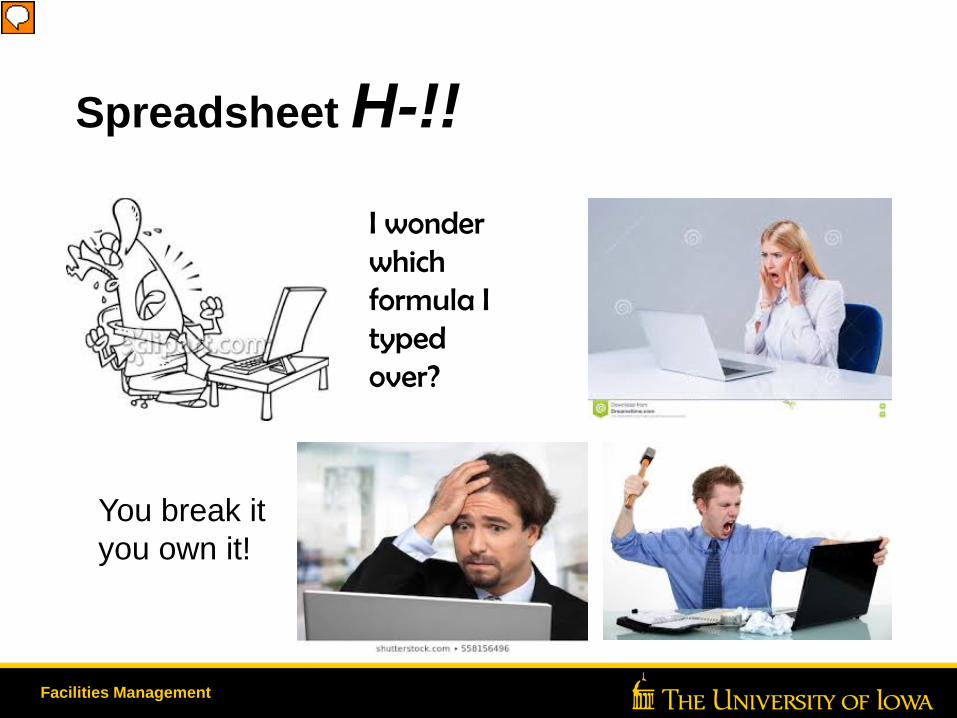
Spreadsheet H-!!
Facilities Management
I wonder which formula I typed over?
You break it you own it!
Presenter
Presentation Notes
One keystroke in the wrong place can cause incorrect results throughout a complex spreadsheet and may even go un-noticed for long periods of time.
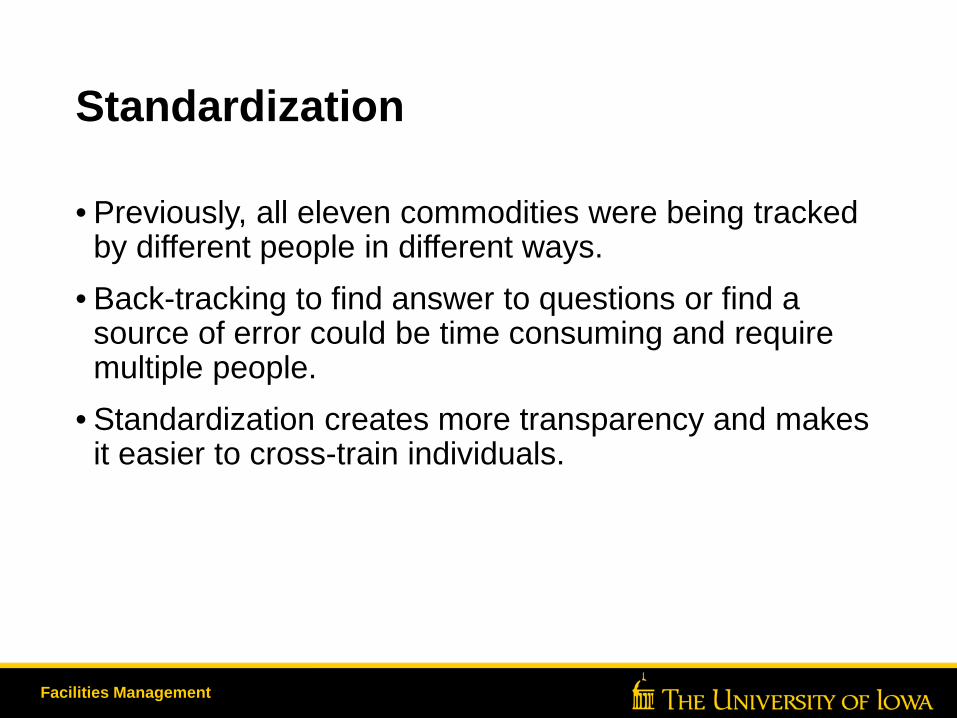
Standardization
• Previously, all eleven commodities were being tracked by different people in different ways.
• Back-tracking to find answer to questions or find a source of error could be time consuming and require multiple people.
• Standardization creates more transparency and makes it easier to cross-train individuals.
Facilities Management
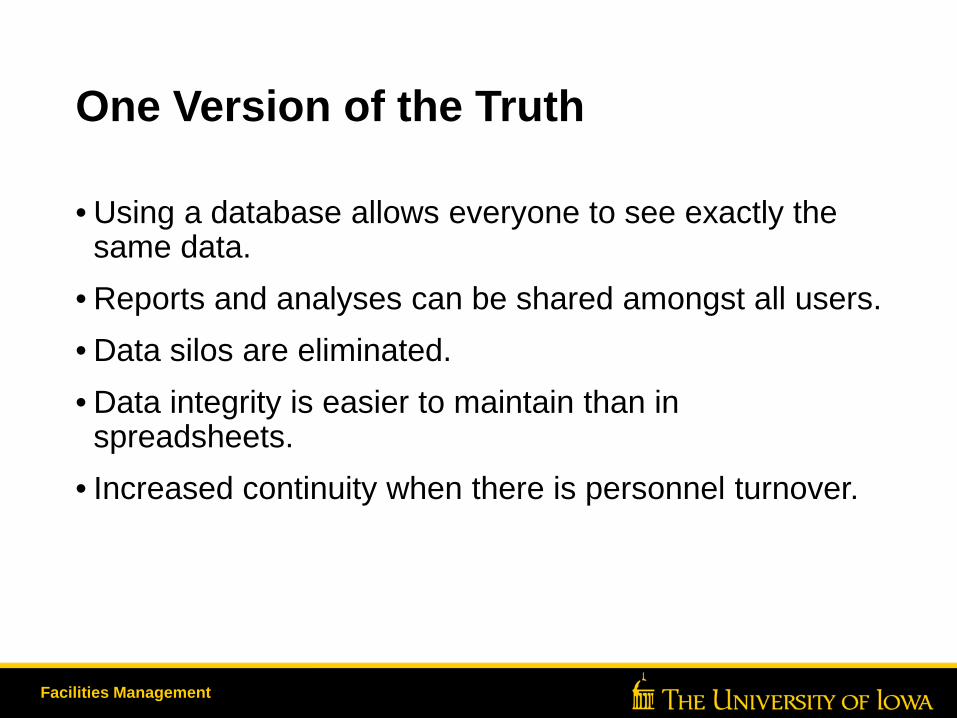
One Version of the Truth
• Using a database allows everyone to see exactly the same data.
• Reports and analyses can be shared amongst all users.• Data silos are eliminated.• Data integrity is easier to maintain than in
spreadsheets.• Increased continuity when there is personnel turnover.
Facilities Management
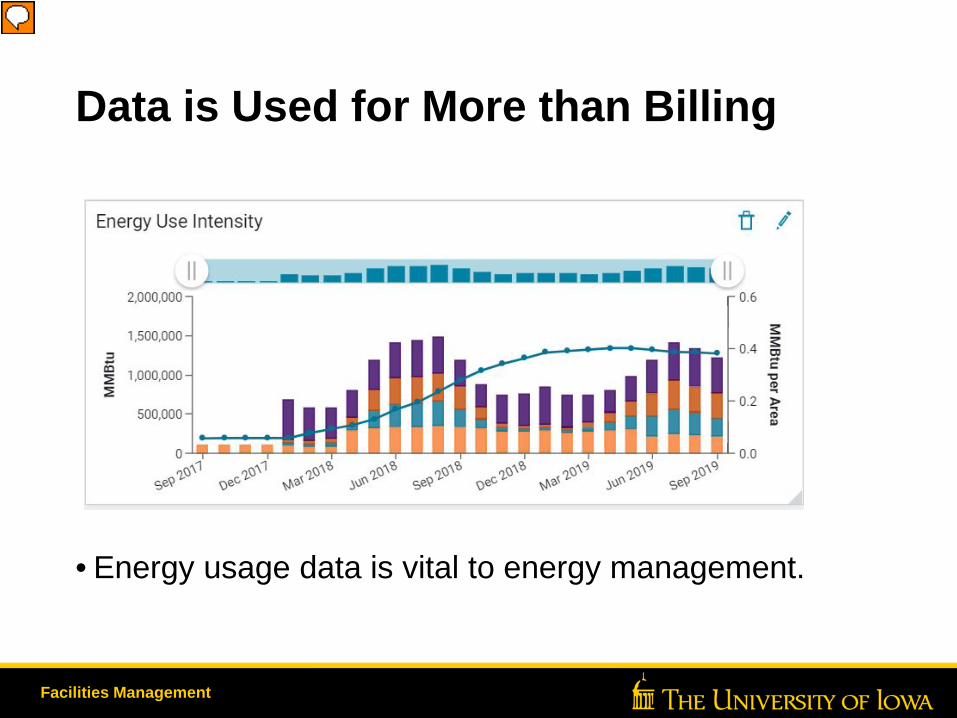
Data is Used for More than Billing
• Energy usage data is vital to energy management.
Facilities Management
Presenter
Presentation Notes
Total campus energy intensity by commodity. How can we leverage our utility billing data for use in energy management? Do we need two separate systems?
Improvements for Energy Management• Automatically normalize data by weather and area (gsf)• Versioning• Industry Standard Analyses• EnergyStar Benchmarking• Measurement and Verification
Facilities Management
Presenter
Presentation Notes
How does the weather affect energy usage? Must answer that to know if you’re winning or losing. Weather normalization does that. Versioning means the system keeps track of when billing formulas and rates change so that we can accurately compare current to historical data. Provide standard, proven tools that make energy analysis easy and consistent.
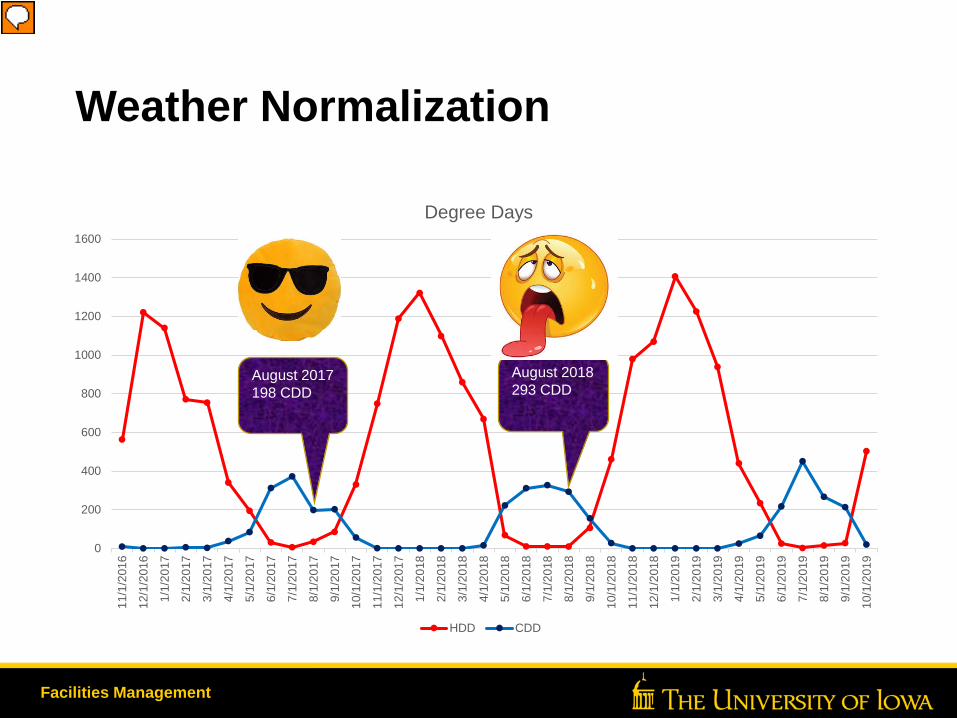
Weather Normalization
Facilities Management
0
200
400
600
800
1000
1200
1400
1600
11/1
/201
6
12/1
/201
6
1/1/
2017
2/1/
2017
3/1/
2017
4/1/
2017
5/1/
2017
6/1/
2017
7/1/
2017
8/1/
2017
9/1/
2017
10/1
/201
7
11/1
/201
7
12/1
/201
7
1/1/
2018
2/1/
2018
3/1/
2018
4/1/
2018
5/1/
2018
6/1/
2018
7/1/
2018
8/1/
2018
9/1/
2018
10/1
/201
8
11/1
/201
8
12/1
/201
8
1/1/
2019
2/1/
2019
3/1/
2019
4/1/
2019
5/1/
2019
6/1/
2019
7/1/
2019
8/1/
2019
9/1/
2019
10/1
/201
9
Degree Days
HDD CDD
August 2017 198 CDD
August 2018 293 CDD
Presenter
Presentation Notes
Normalizing data is a very important process in energy management. For example; Say that my boss comes to me and says we’re going to install a more efficient cooling system in a building. The project is completed and he comes back after it’s been running for six months and says “How much energy did we save?”. Should I simply compare six months prior to the project and six months after the project? What if we had a heat wave prior to the project? It would be impossible to say how much energy we saved unless the weather conditions for the two periods were the same. How often does that happen in Iowa? This is why we want to normalize data. Degree Days – the number of days in a month where the average temperature is above or below 65 Degrees. As you can see, we should have only used two thirds as much cooling in August, 2017 as compared to August, 2018.
Operations Excellence Framework
Create Positive Working Relationships that allow our TEAMS to assume Positive Intent
Presenter
Presentation Notes
The second step in our journey is Exploration, or Analysis and Decisions. Here we explore how others are addressing the opportunities we have identified. What are industry standards? Is there software available to help us with some of these opportunities?
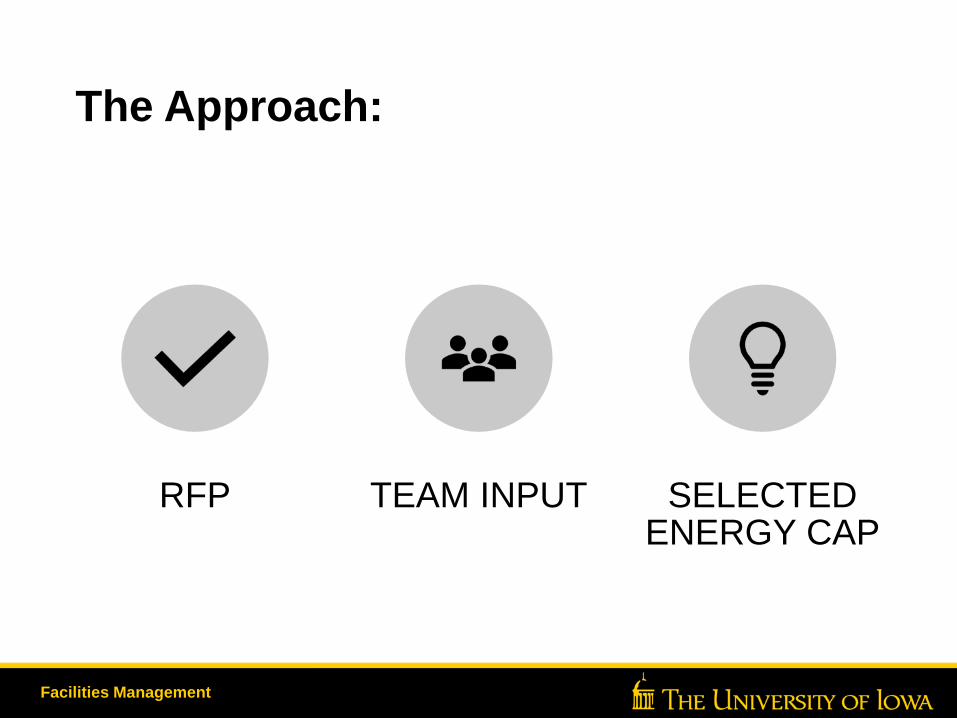
The Approach:
Facilities Management
RFP TEAM INPUT SELECTED ENERGY CAP
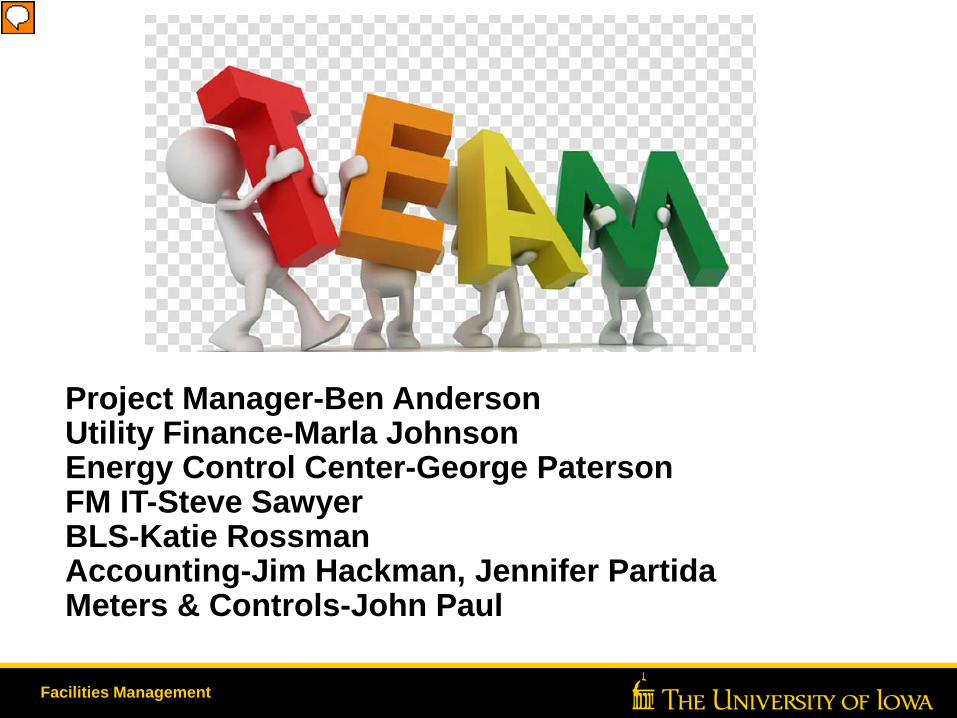
Project Manager-Ben AndersonUtility Finance-Marla JohnsonEnergy Control Center-George PatersonFM IT-Steve SawyerBLS-Katie RossmanAccounting-Jim Hackman, Jennifer PartidaMeters & Controls-John Paul
Facilities Management
Presenter
Presentation Notes
Team approach is crucial to the success of the final product. Our team was made up of stakeholders in the current process. We wanted their input so that we met everyone’s goals.
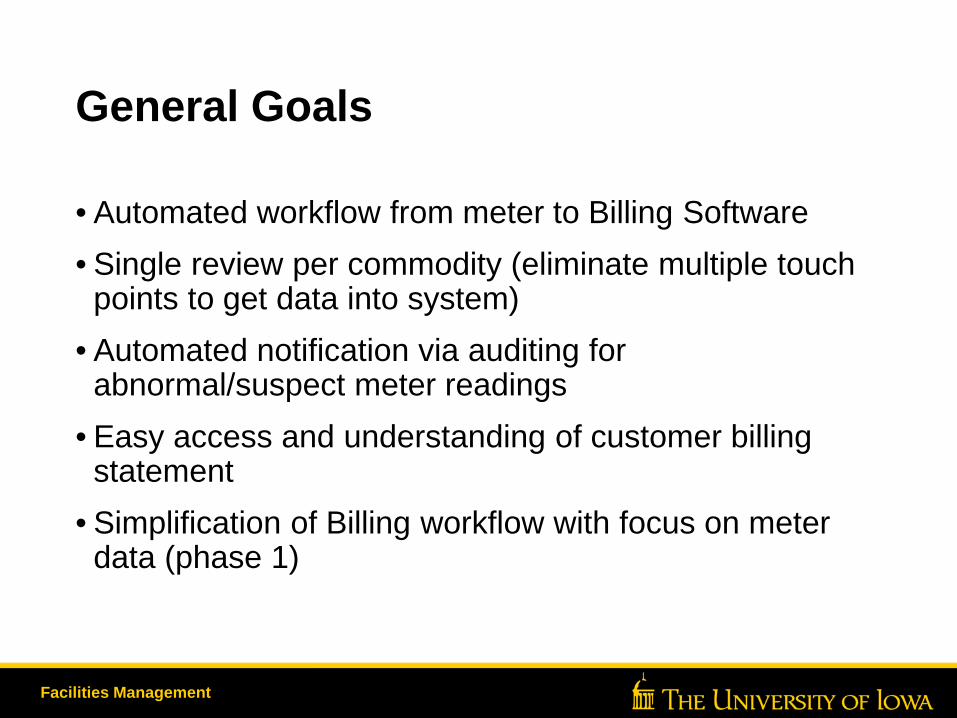
General Goals
• Automated workflow from meter to Billing Software• Single review per commodity (eliminate multiple touch
points to get data into system)• Automated notification via auditing for
abnormal/suspect meter readings• Easy access and understanding of customer billing
statement• Simplification of Billing workflow with focus on meter
data (phase 1)
Facilities Management
Presenter
Presentation Notes
EnergyCAP was selected via the RFP process. Their mission matched very well with our priorities. Easier, smarter and friendlier. Note that they emphasize both billing and energy management.
Operations Excellence Framework
Create Positive Working Relationships that allow our TEAMS to assume Positive Intent
Presenter
Presentation Notes
Now for the real fun! Implementation.
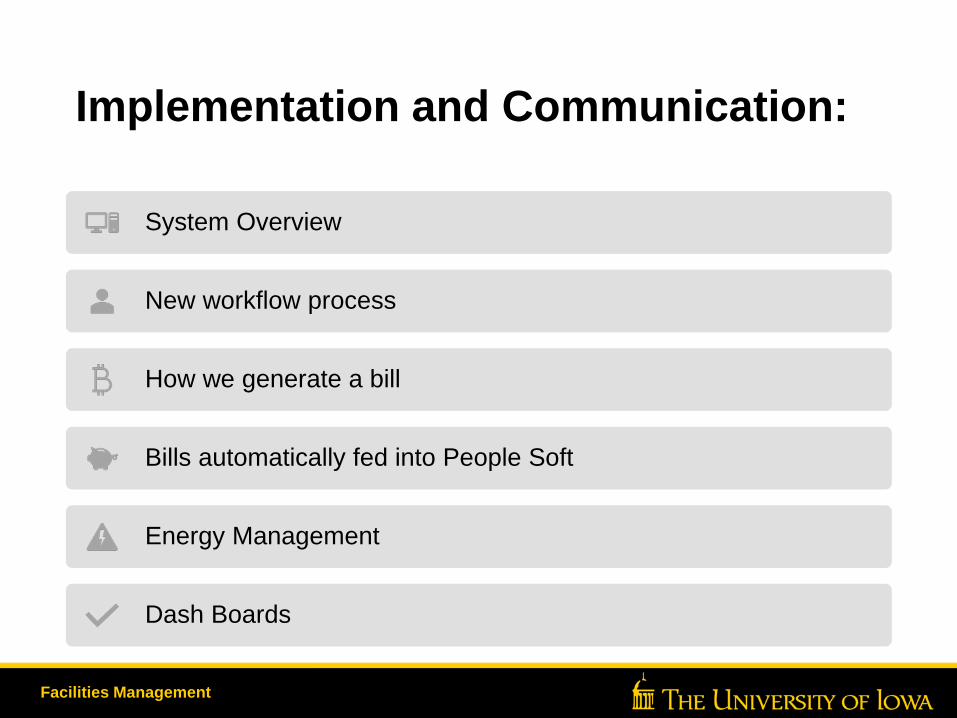
Implementation and Communication:
Facilities Management
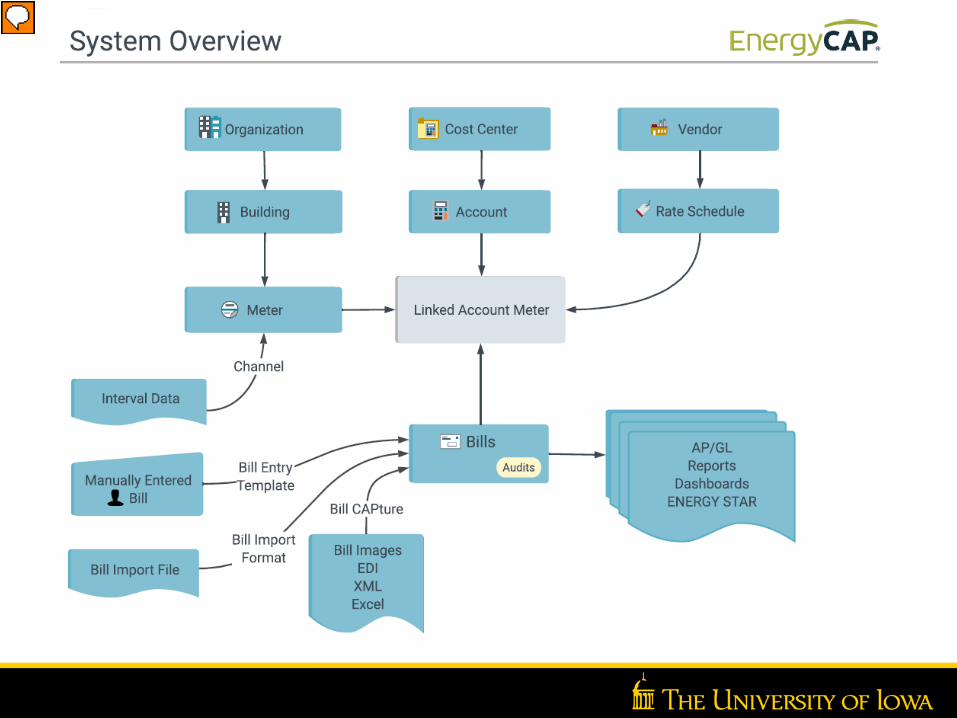
System Overview
New workflow process
How we generate a bill
Bills automatically fed into People Soft
Energy Management
Dash Boards
Presenter
Presentation Notes
The process starts with interval data. In our case that is often a meter, but could be usage from recycling or waste. A meter has a different meaning in EnergyCAP. It is a place to record usage. Meters are also used to perform calculations (virtual meters). A key feature of EnergyCAP is the account-meter relationship. Every meter links to an account and every account links to a meter. It is this structure that allows us to bill by funds and perform energy management by building. Many customers use this software to track external bills such as from outside vendors (MidAM). Our primary goal is to bill all of our internal customers.
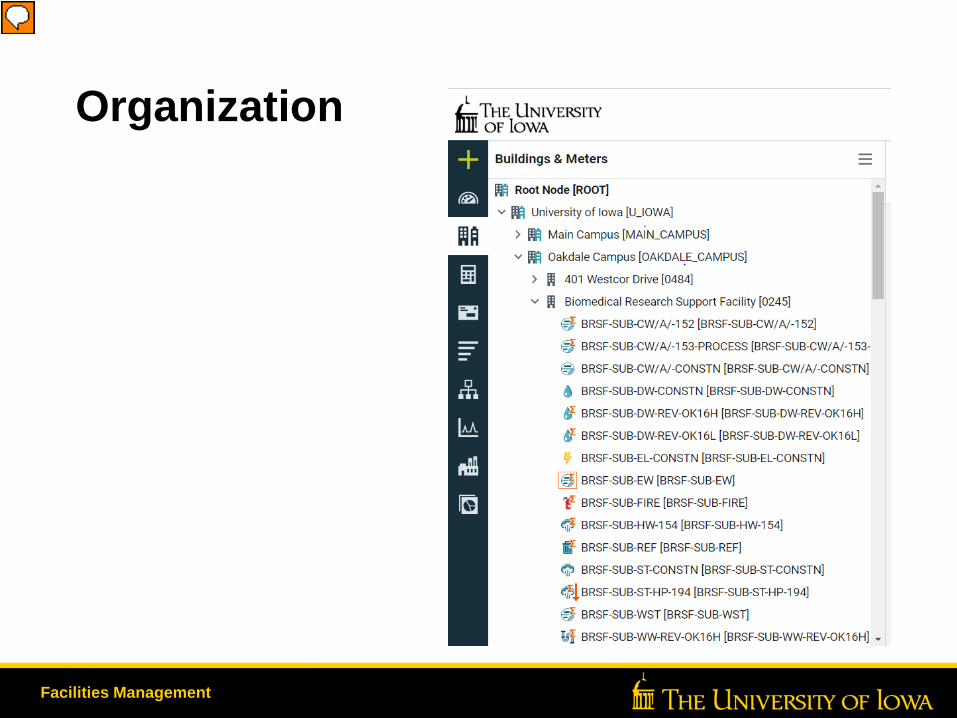
Organization
Facilities Management
Presenter
Presentation Notes
Meters are placed under buildings which are under campuses. This hierarchy is very useful because we can roll data up to each level or start at the top and drill down to the details. Icons are used to provide easy navigation. We spent quite a bit of time deciding how we wanted this setup with the proper naming convention. The black bar on the left contains the icons for the main menu and the other icons are used to identify commodity types. Example BRSF- toggle between name and number. Also has a great search function.
How We Generate the Bill
Run Reformatter
General Ledger
Import Interval Data
Process Chargebacks
PI System
EnergyCAP
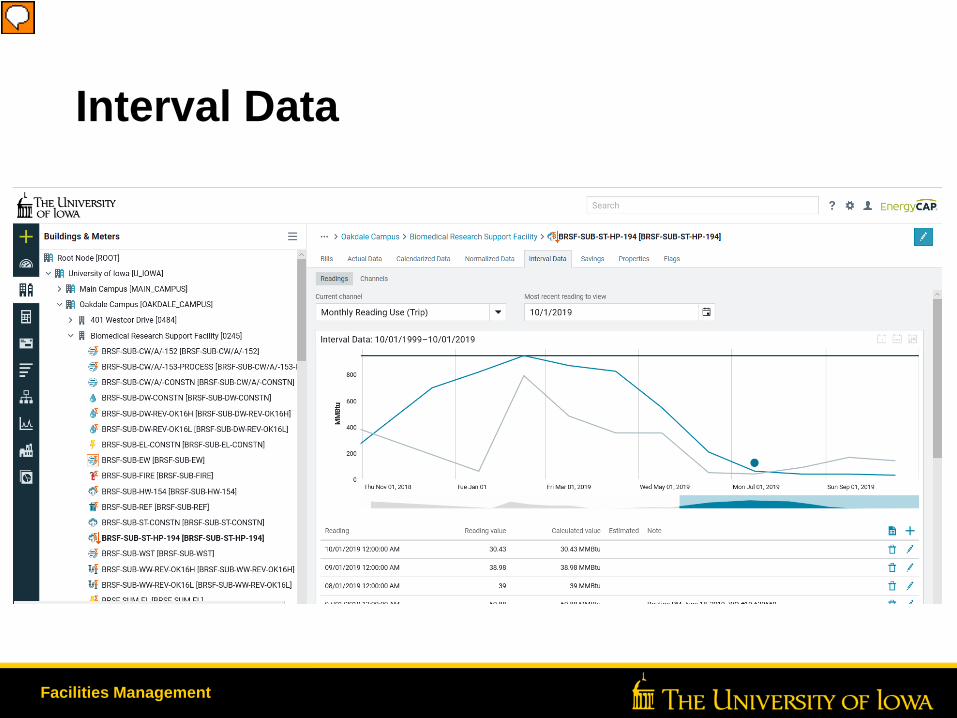
Interval Data
Facilities Management
Presenter
Presentation Notes
Meter data is first loaded into a channel where we can perform unit conversions such as from gallons to CCF for sewer. Much of this comes from automated systems. From here we can see trends of the data compared to previous time periods and also a list of values. This is not the bill, it is the first step in generating the bill. We can also add notes to entries to remind us of anomalies that may have affected usage.
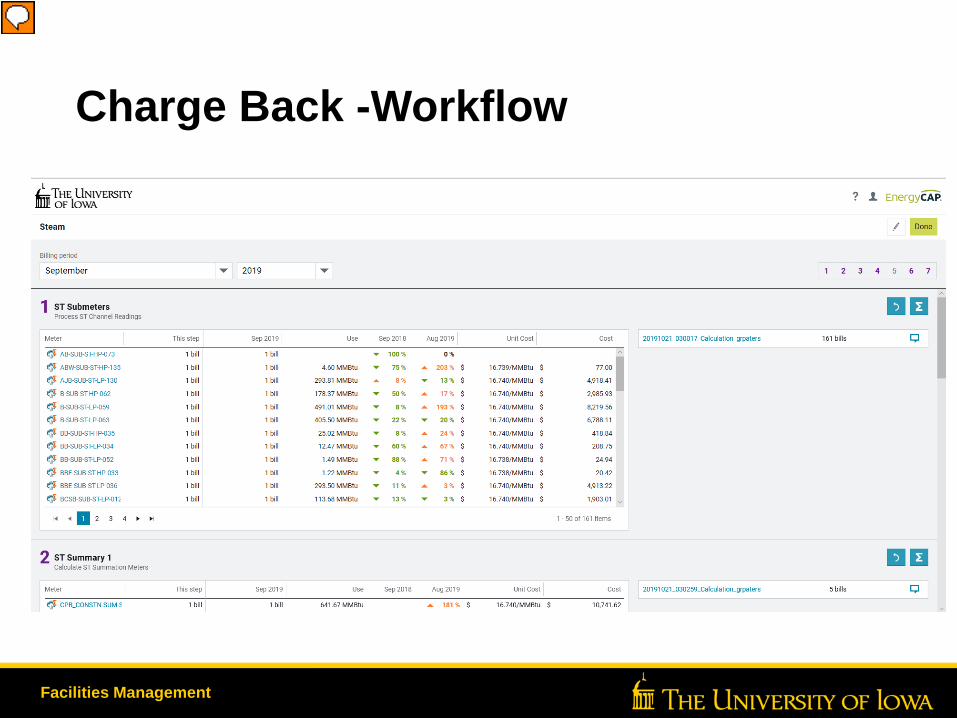
Charge Back -Workflow
Facilities Management
Presenter
Presentation Notes
Creating chargebacks is the process of turning raw meter data into bills. As you can see by the numbers, there are 7 steps for creating steam bills. Each commodity has a different set of steps and are processed separately. When a building has more than one meter, there is a step to add them together. If a bill is split across multiple MFK’s there is another step to perform those calculations. When this step is complete the bills have been created. This process allows us to compare month over month and year over year meter readings using the calculated percentage columns.
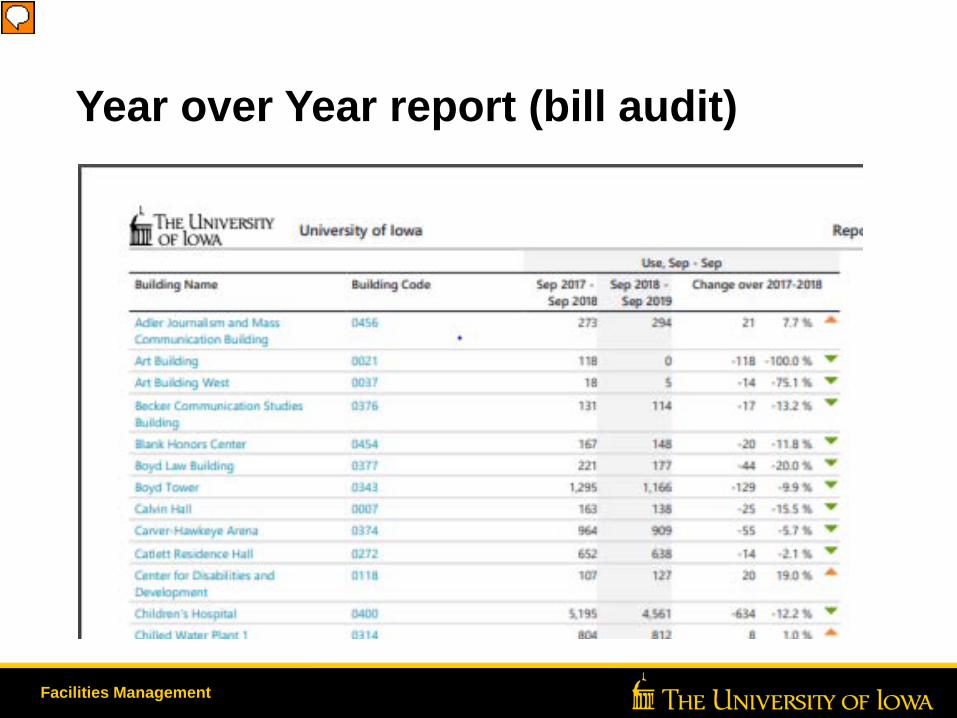
Year over Year report (bill audit)
Facilities Management
Presenter
Presentation Notes
Difference from checking usage in charge-back workflow is the scope. This report looks at entire building. Charge-backs looks at individual meter.
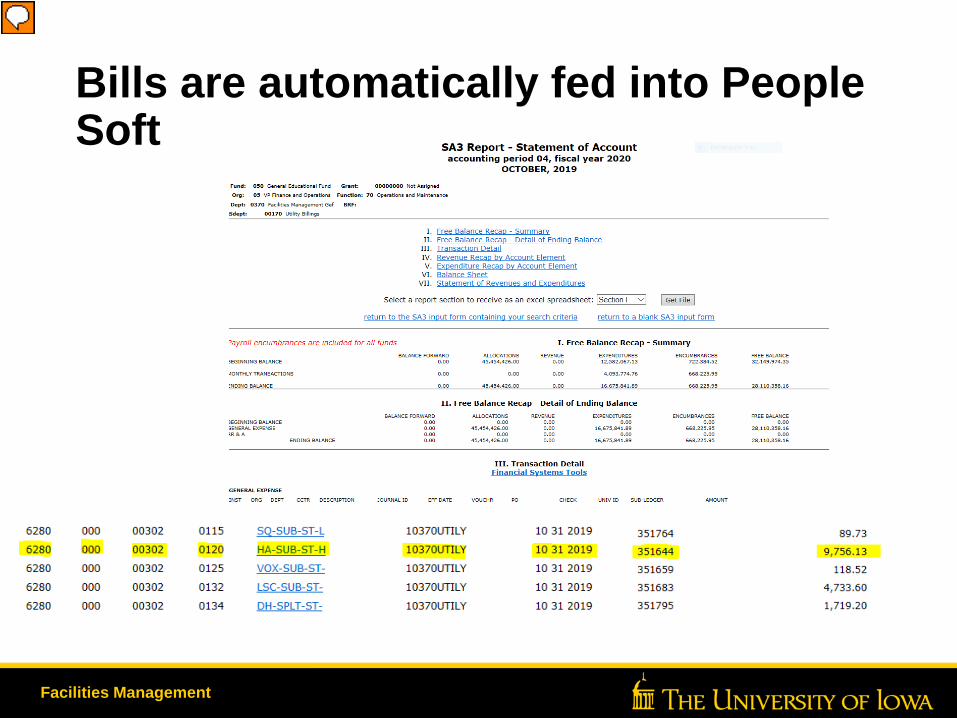
Bills are automatically fed into People Soft
Facilities Management
Presenter
Presentation Notes
In the GL SA3 report you will be able to see the EnergyCAP account associated with the charges. You can also click on the description which will open an image of the bill.
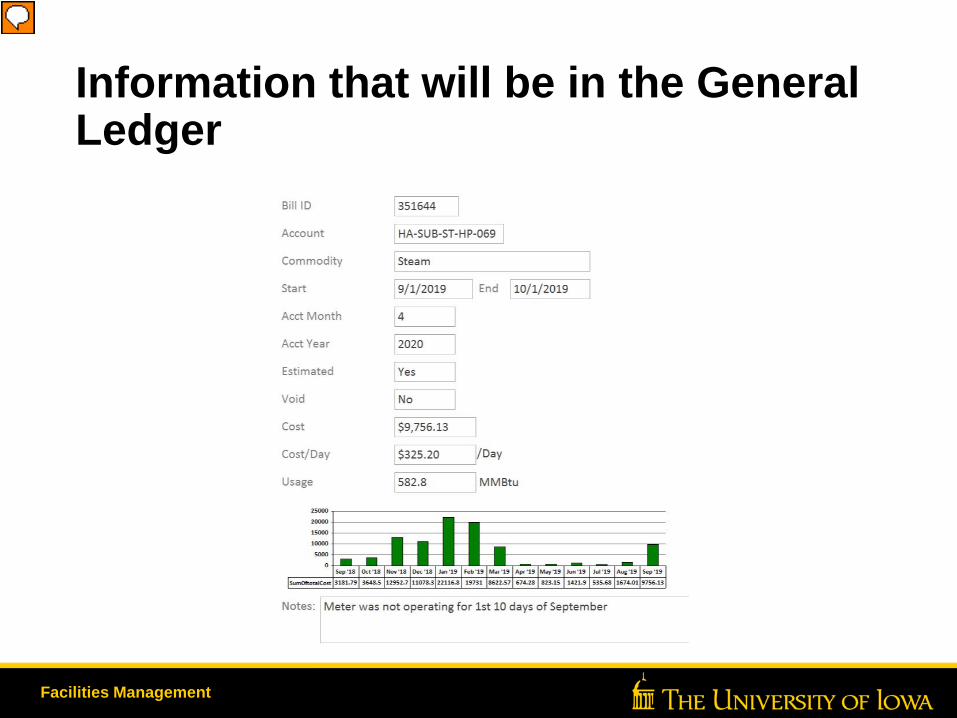
Information that will be in the General Ledger
Facilities Management
Presenter
Presentation Notes
This will be available soon. It provides the usage as well as the cost and historical graph of usage for comparison. If there are any special notes on the bill you can also see those.
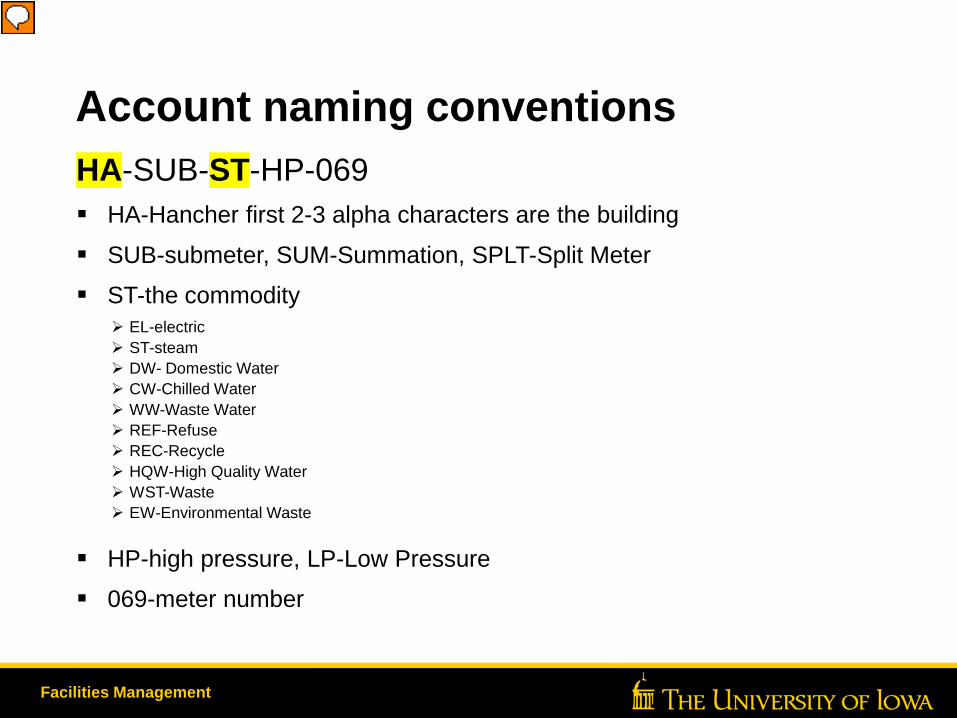
Account naming conventionsHA-SUB-ST-HP-069 HA-Hancher first 2-3 alpha characters are the building SUB-submeter, SUM-Summation, SPLT-Split Meter ST-the commodity
EL-electric ST-steam DW- Domestic Water CW-Chilled Water WW-Waste Water REF-Refuse REC-Recycle HQW-High Quality Water WST-Waste EW-Environmental Waste
HP-high pressure, LP-Low Pressure 069-meter number
Facilities Management
Presenter
Presentation Notes
The two hi-lighted pieces are the most important. Sub, sum and split indicate if the meters were added, subtracted or split across funds. To the right of the commodity is giving us details about the meter either what kind or the number.
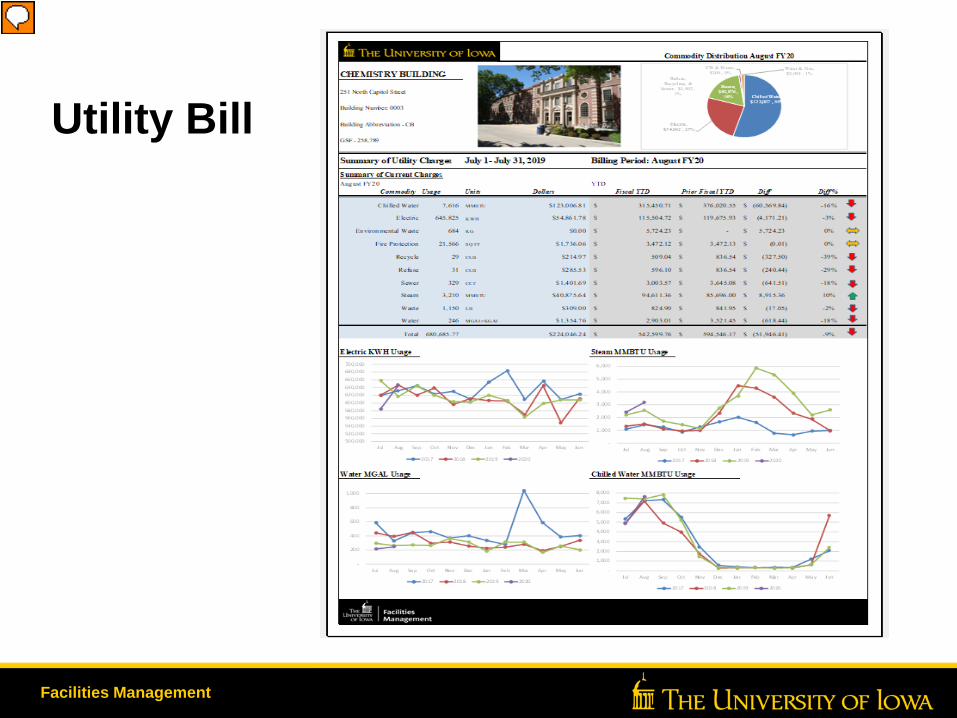
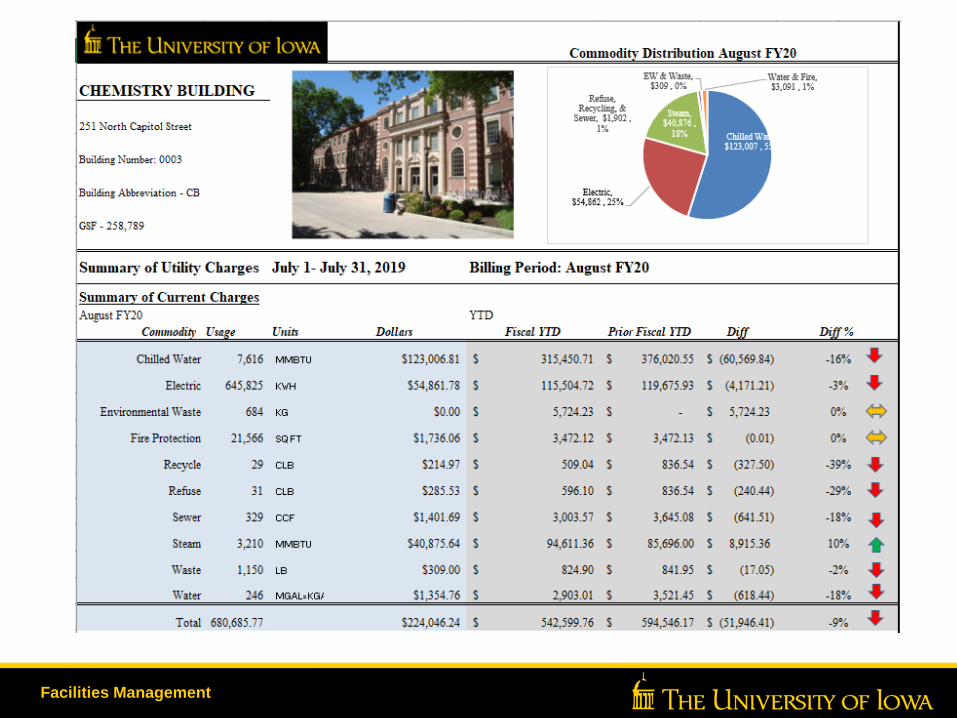
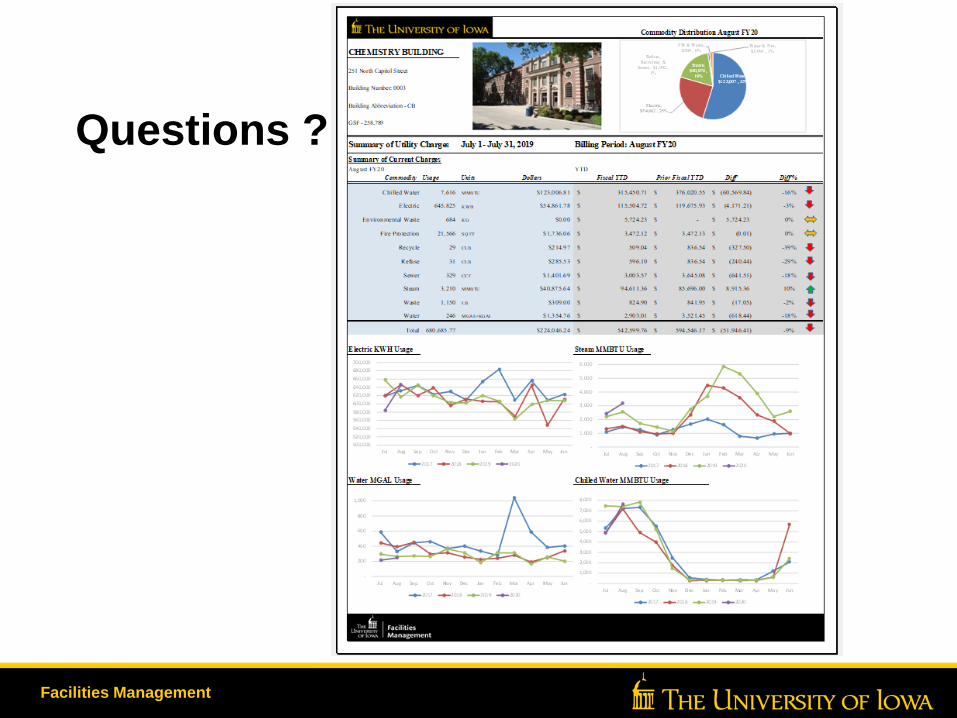
Utility Bill
Facilities Management
Presenter
Presentation Notes
We are also going to provide a detailed utility bill that includes all usage and charges for a building.
Facilities Management
Facilities Management
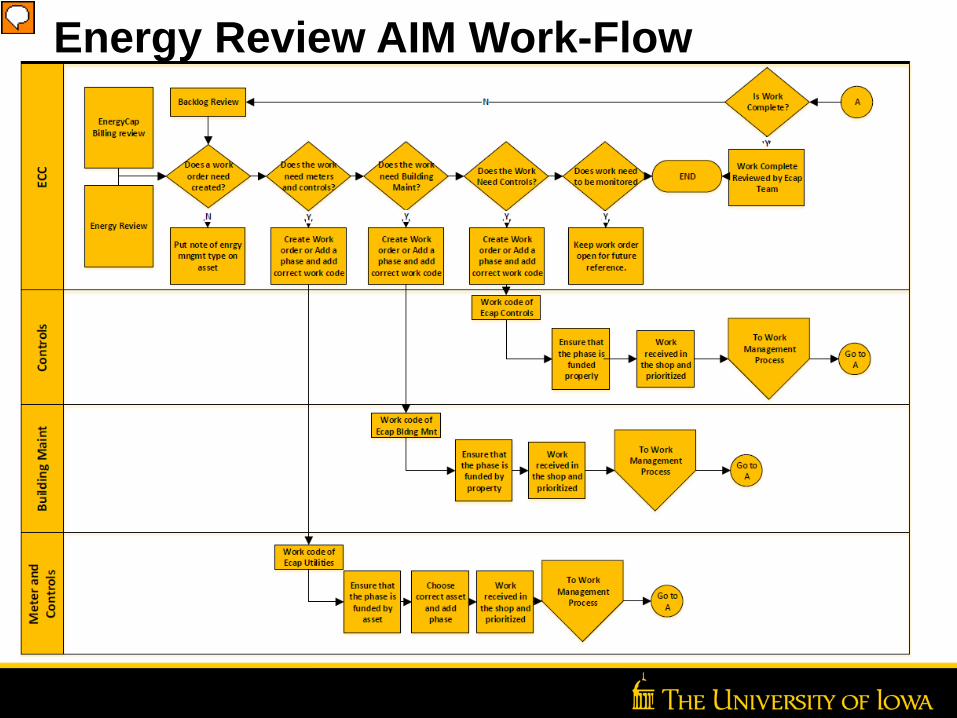
Energy Review AIM Work-Flow
Presenter
Presentation Notes
As part of our monthly review for billing and for energy management with BLS we sometimes find surprises! We do our best to resolve issues as we find them, but often times more information is needed. At that point we create a work order in AIM and determine whether to send it first to Meters, Controls or Maintenance. Above is a new workflow that outlines this process. Give example where work order had to be re-assigned.
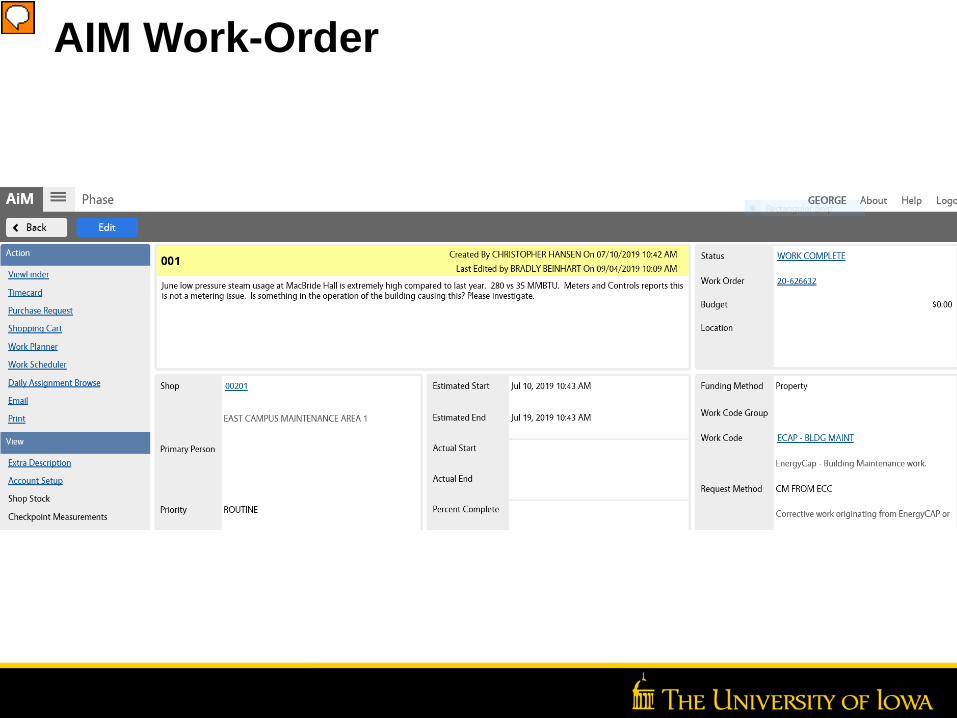
AIM Work-Order
Presenter
Presentation Notes
This is an example from AIM. In order to be able to re-route work orders between Meters, Controls and Maintenance we created new work codes.
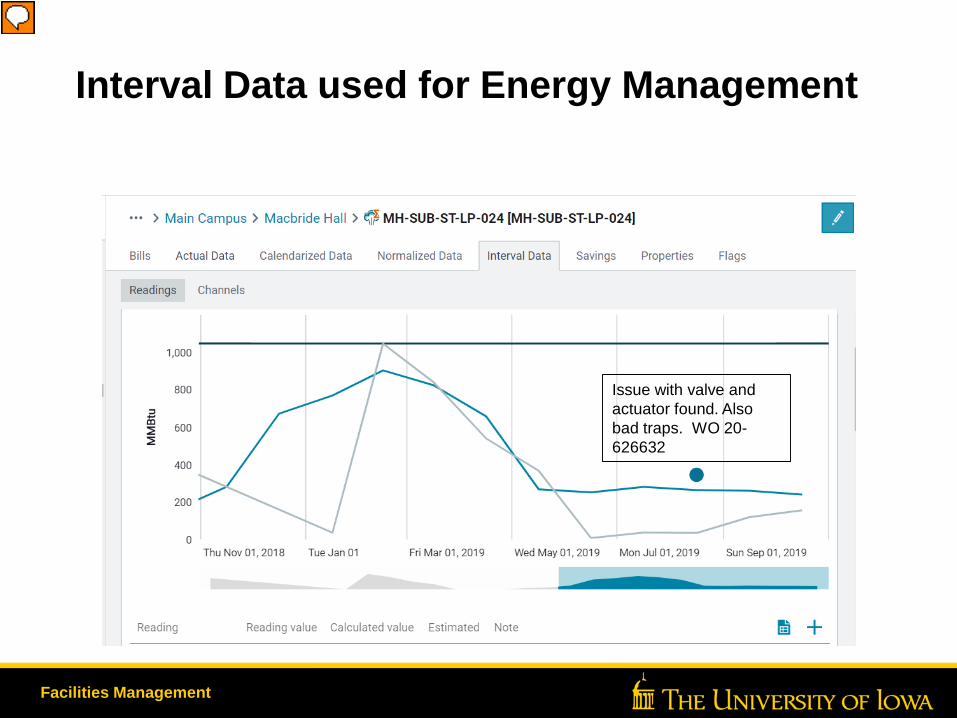
Interval Data used for Energy Management
Facilities Management
Issue with valve and actuator found. Also bad traps. WO 20-626632
Presenter
Presentation Notes
See the difference between the current blue and prior-year gray lines from this summer. Mention note.
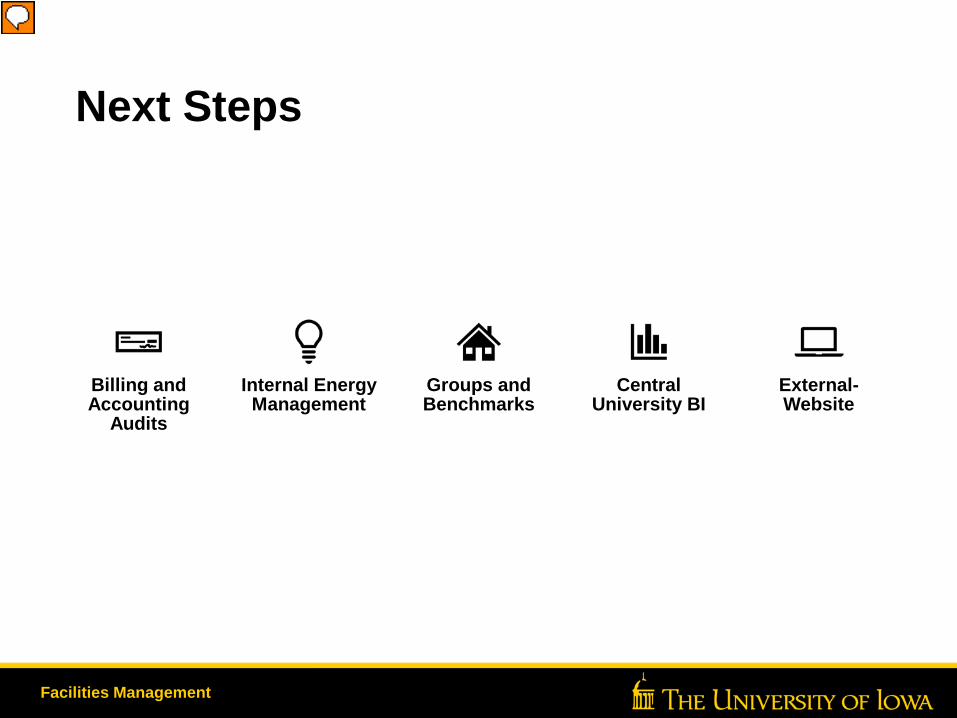
Next Steps
Facilities Management
Billing and Accounting
Audits
Internal Energy Management
Groups and Benchmarks
Central University BI
External-Website
Presenter
Presentation Notes
Now that we have implemented the basics of the system there are more features we’re working on. We’re primarily focused on dashboards and reports for our customers. Some other areas that we may focus on are Billing and Accounting Audits and Central University BI. We’re adding the EnergyCAP data into the BI data sets.
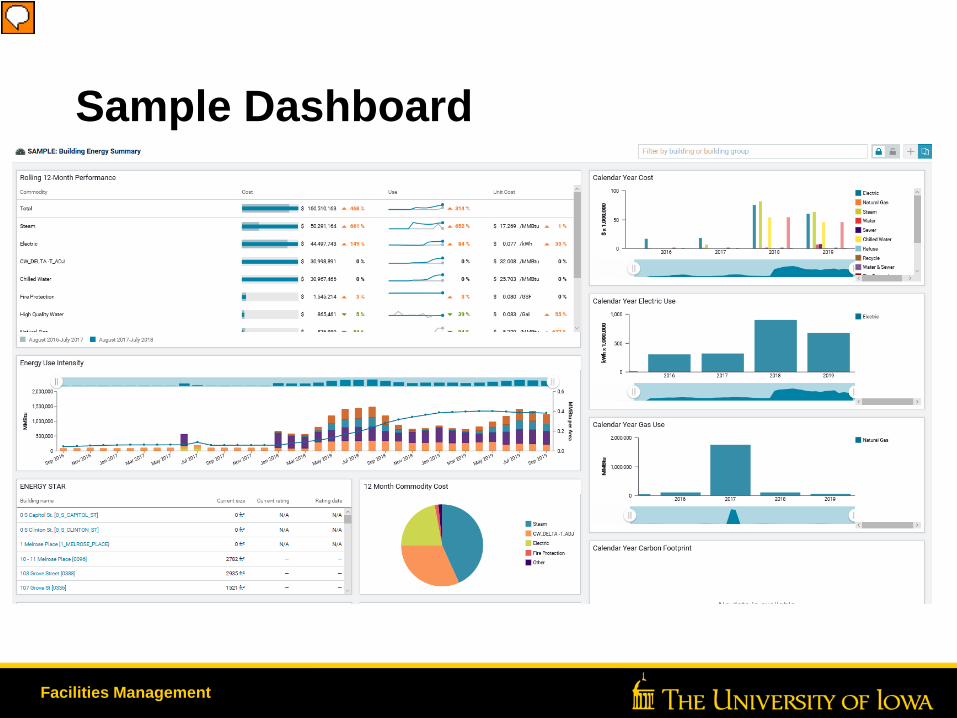
Sample Dashboard
Facilities Management
Presenter
Presentation Notes
Here is a sample of a dashboard containing several widgets for analyzing energy usage data that can all be viewed from the same page. These can be applied to an entire campus or just groups of buildings. We will be standardizing some of these dashboards and make them available on the internet to everyone.
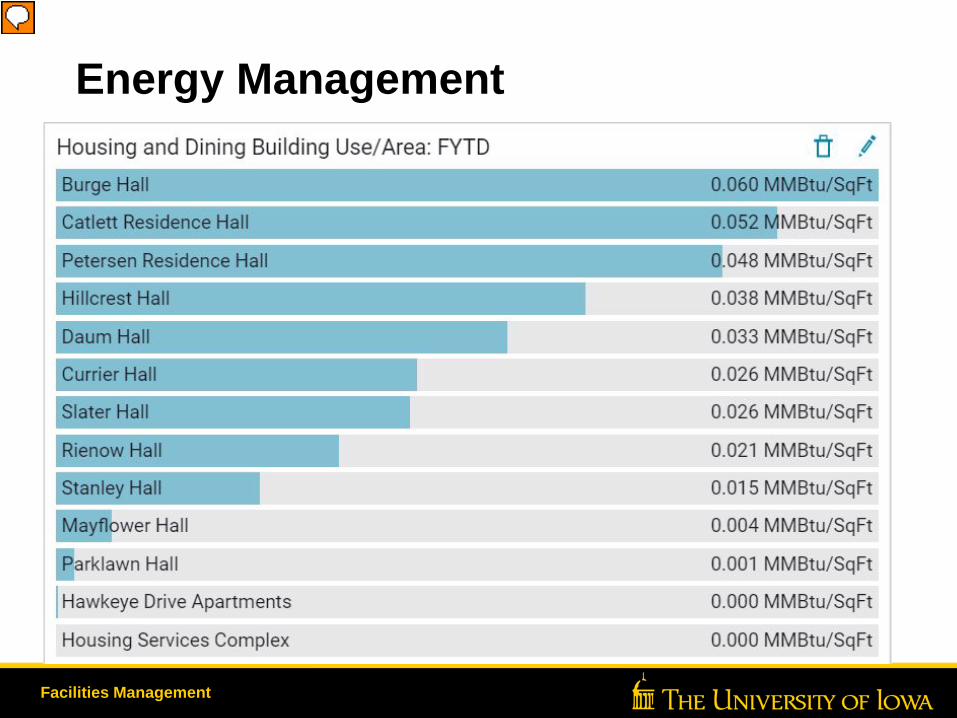
Energy Management
Facilities Management
Presenter
Presentation Notes
Here is an example of grouping buildings by owner, Housing and Dining.
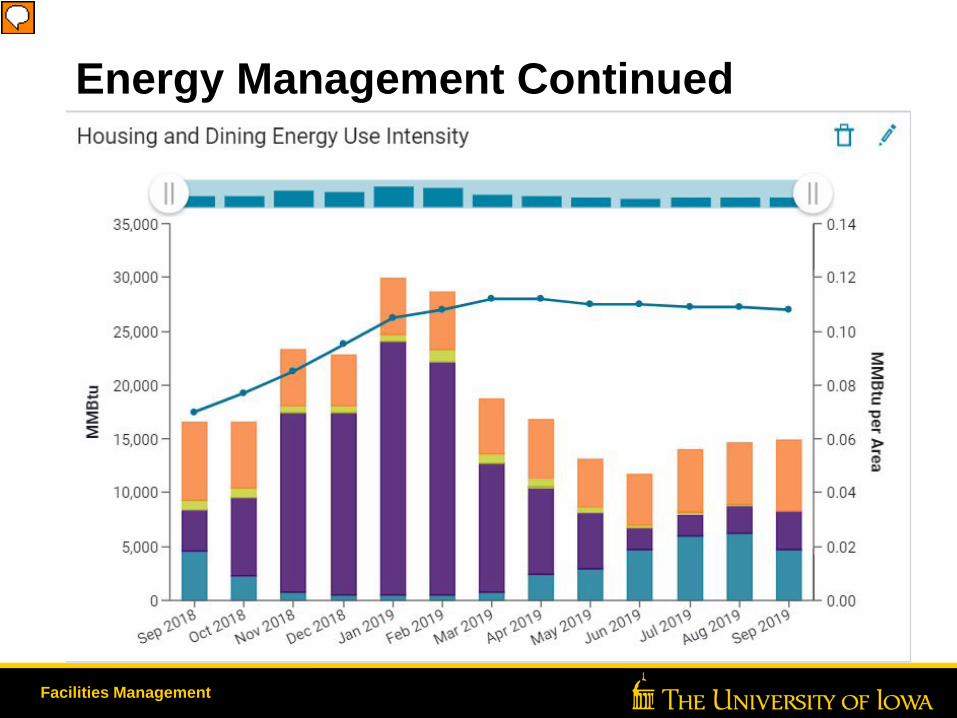
Energy Management Continued
Facilities Management
Presenter
Presentation Notes
Orange is electric, purple is steam, blue is chilled water and gold yellow is natural gas. Straight line is the annualized energy intensity trend. Over time we would like to see that line trend downward. The sharp incline at the beginning of the trend is because we only have one year of data. After time, the trend will be much flatter, with less variation.
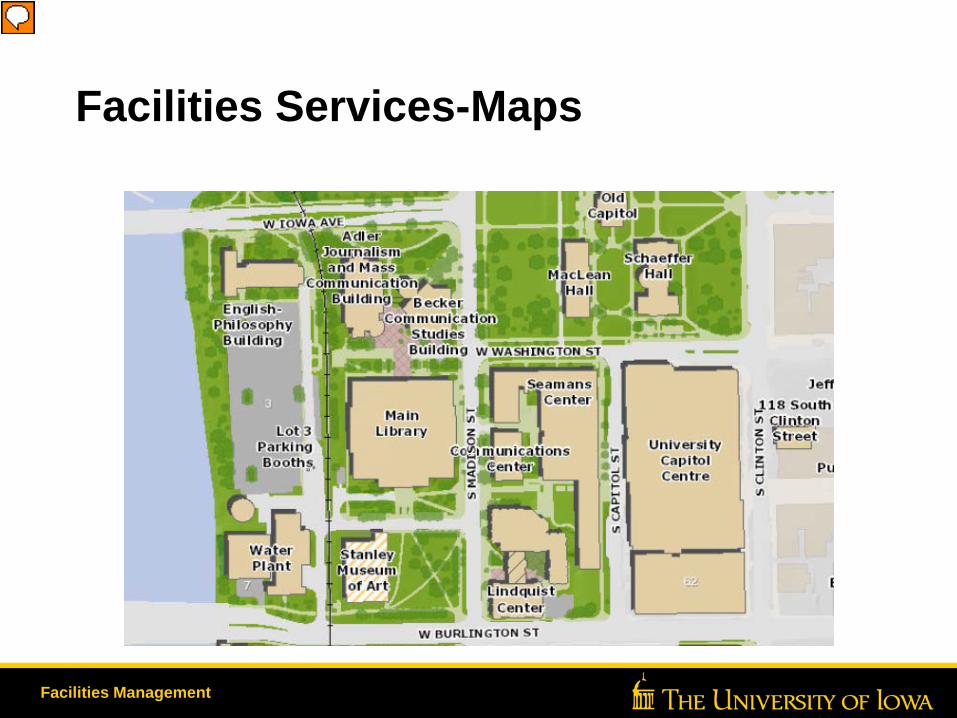
Facilities Services-Maps
Facilities Management
Presenter
Presentation Notes
We will be adding a link on campus maps to our new utility bills for each building.