utility-marketer partnerships: technical report - nrel · 303-275-3000 • ... ongoing marketing...
TRANSCRIPT

National Renewable Energy Laboratory Innovation for Our Energy Future
A national laboratory of the U.S. Department of EnergyOffice of Energy Efficiency & Renewable Energy
NREL is operated by Midwest Research Institute ● Battelle Contract No. DE-AC36-99-GO10337
Utility-Marketer Partnerships: An Effective Strategy for Marketing Green Power? L.A. Bird and E.S. Brown
Technical Report NREL/TP-620-39730 April 2006

Utility-Marketer Partnerships: An Effective Strategy for Marketing Green Power? L.A. Bird and E.S. Brown
Prepared under Task No. ASG5.1005
Technical Report NREL/TP-620-39730 April 2006
National Renewable Energy Laboratory 1617 Cole Boulevard, Golden, Colorado 80401-3393 303-275-3000 • www.nrel.gov
Operated for the U.S. Department of Energy Office of Energy Efficiency and Renewable Energy by Midwest Research Institute • Battelle
Contract No. DE-AC36-99-GO10337
NOTICE
This report was prepared as an account of work sponsored by an agency of the United States government. Neither the United States government nor any agency thereof, nor any of their employees, makes any warranty, express or implied, or assumes any legal liability or responsibility for the accuracy, completeness, or usefulness of any information, apparatus, product, or process disclosed, or represents that its use would not infringe privately owned rights. Reference herein to any specific commercial product, process, or service by trade name, trademark, manufacturer, or otherwise does not necessarily constitute or imply its endorsement, recommendation, or favoring by the United States government or any agency thereof. The views and opinions of authors expressed herein do not necessarily state or reflect those of the United States government or any agency thereof.
Available electronically at http://www.osti.gov/bridge
Available for a processing fee to U.S. Department of Energy and its contractors, in paper, from:
U.S. Department of Energy Office of Scientific and Technical Information P.O. Box 62 Oak Ridge, TN 37831-0062 phone: 865.576.8401 fax: 865.576.5728 email: mailto:[email protected]
Available for sale to the public, in paper, from: U.S. Department of Commerce National Technical Information Service 5285 Port Royal Road Springfield, VA 22161 phone: 800.553.6847 fax: 703.605.6900 email: [email protected] online ordering: http://www.ntis.gov/ordering.htm
Printed on paper containing at least 50% wastepaper, including 20% postconsumer waste

Acknowledgments This work was funded by the U.S. Department of Energy’s (DOE) Office of Energy Efficiency and Renewable Energy (EERE). The authors thank Linda Silverman of EERE and the EERE renewable energy technology programs for their support of this work. The authors also thank Jim Michaud of The United Illuminating Company; Bryan Garcia of the Connecticut Clean Energy Fund; John Hatfield of New York State Electric and Gas (NYSEG) Corporation; Thor Hinckley of Portland General Electric; Alex Rate and Marci Grossman of Green Mountain Energy; Kathleen Yetman and Michelle Baker of National Grid; Dan Kalafatas and Gabe Petlin of 3 Phases Energy; Ed Holt of Ed Holt and Associates Inc.; Amy McGinty of Community Energy; Steve DeMott of PECO; Lisa Frantzis of Navigant Consulting; and Ron Benioff, Walter Short, and Blair Swezey of NREL for their thoughtful reviews of the document. In addition, we thank Michelle Kubik of NREL for her editorial support. Finally, the authors appreciate the contribution of the many utility, green power marketing, and public utility commission contacts that provided information and perspectives for this report: Michelle Baker and Kathleen Yetman, National Grid David Bates, Florida Power and Light Steve DeMott, PECO Bryan Garcia, Connecticut Clean Energy Fund David Goldberg, Connecticut Department of Public Utility Control Marci Grossman, Paul Markovich, Mark Hammer, and Alex Rate, Green Mountain Energy John Hatfield, NYSEG Thor Hinkley, Portland General Electric Dan Kalafatas, Gabe Petlin, and Elaine Horn, 3 Phases Energy Bob Maddox, Sterling Planet Amy McGinty, Community Energy Anne Marie McShea, New Jersey Board of Public Utilities Jim Michaud, The United Illuminating Company Lisa Schwartz, Oregon Public Utility Commission Aprille Soderman, Northeast Utilities Erich Stevens, People’s Power and Light Bob Stull and Rhonda Rasmussen, PacifiCorp Brian Ward and Karl Knapp, City of Palo Alto Utilities Additional information on green power markets can be found on DOE’s Green Power Network Web site (http://www.eere.energy.gov/greenpower/).
iii

Table of Contents Acknowledgments.......................................................................................................................... iii
Table of Contents........................................................................................................................... iv
Executive Summary ........................................................................................................................ 1
Introduction..................................................................................................................................... 3
Overview of Recent Experience with Utility-Marketer Partnerships ....................................... 4
Considerations in Making the Partnership Decision................................................................. 4
Issues in Designing and Implementing a Partnership ..................................................................... 8
Case Studies of Utility-Marketer Partnerships ............................................................................. 11
Voluntary Partnerships............................................................................................................ 11
Mandatory Partnerships .......................................................................................................... 17
Comparing the Performance of Partnership Programs ................................................................. 32
Key Factors for Successful Partnerships....................................................................................... 35
General Success Factors ......................................................................................................... 35
Voluntary Programs ................................................................................................................ 36
Mandatory Programs............................................................................................................... 37
Summary and Conclusions ........................................................................................................... 40
iv

Executive Summary This paper explores whether partnerships between utilities and independent marketers are an effective strategy for marketing green power. We present case studies of voluntary and mandatory partnerships covering green power program design and implementation in both regulated and restructured electricity markets. We also include perspectives (based on interviews) from utilities, marketers, and regulators involved in developing and implementing these partnerships. From these case studies and interviews, we describe lessons learned about developing effective partnerships, including such issues as respective roles in marketing and administration, product branding, and contract and incentive structures. Based on experience to date, strategic partnerships between utilities and marketers can be an effective approach to marketing green power. Partnerships leverage the sales and resource procurement experience of marketers and the utility’s reputation and access to customers. Further, partnerships can create greater incentives for success because marketers have a vested financial interest in maximizing customer participation and green power sales. Utilities may benefit from teaming with marketers, if they have limited experience in procuring renewable energy supplies, marketing renewable energy or other value-added products, or are interested in reducing the risks of offering renewable energy options to their customers. In states with competitive electricity markets, partnerships between default suppliers and marketers provide greater choices for residential and small commercial customers, who may otherwise be hesitant to switch suppliers. However, partnerships can fail if either the program or the partnering arrangement is not properly designed and implemented. It is important that both parties be adequately compensated and actively engaged in the program. Because marketers are typically paid for performance, they are most likely to invest their time and energy in programs where the utility is supportive and actively works to make the program a success. Partnerships in which both parties are vested in the success of the program have been most effective. Specific findings include:
• The single-marketer model is preferred because it eliminates the need for the utility to be a neutral party in offering a green power option. This model leads to greater enrollments because the utility can be more active in promoting the program, while the marketer has greater incentive to invest resources. In addition, the single-marketer approach avoids the complexity and marketing challenges of programs involving multiple marketers and product choices. Competitive market concerns can be addressed by using a competitive procurement process to select suppliers. Where utilities are free to choose a partnership approach, there are no clear advantages to a multiple-marketer model.
• It is important that both parties be fully engaged in the program. Utilities can enhance the
chances of success by actively promoting the program with the marketer, leveraging ongoing marketing activities within the utility, and facilitating access to various utility departments, such as the communications, call center, mail house, and billing
1

departments. Marketers will be most vested where the utility provides program support and the contract terms provide performance incentives.
• The division of risk between the utility and marketer does not appear to be an important
factor, as long the parties are adequately compensated for their respective risks. Most marketers will assume greater risks if given adequate time to recoup start-up costs and generate a profit; generally, a contract length of three to five years is preferred.
• Unless clear advantages to co-branding are identified, it is best to promote the program
through the utility’s brand for simplicity and to avoid confusing customers. The use of multiple brands and logos can create difficulties in preparing marketing materials with limited space. Co-branding can also be problematic for programs in which a new marketer may be selected periodically.
• Performance targets are important for evaluating program success and to ensure that the
parties have similar expectations. In later years, performance metrics can become particularly important to ensure that marketing efforts are sustained.
• Flexibility on the part of both parties is needed to achieve an effective working
relationship. Marketers often bring new ideas and nontraditional marketing approaches that have proven effective for reaching green power customers. Some important advantages of the partnership will be lost if the utility is unwilling to try new approaches.
2

Introduction In the mid- to late 1990s, electric utilities began to embrace the idea of offering renewable energy options to their customers. Initially, utility interest in offering green power stemmed from the threat of retail competition. During the late 1990s, competitive retail markets for green power emerged as a number of states rolled out retail access programs, in which independent marketers offered green power options to compete with the incumbent utilities. More recently, utilities have developed programs to offer customers product choices and to improve their corporate image. Over time, a number of challenges have emerged. In competitive markets, many retail green power marketers found it difficult to persuade customers to switch suppliers. In particular, they found that selling to and serving residential and small commercial customers is very expensive. Under the most favorable market conditions, competitive green power marketers have garnered about 1% to 2% of retail customers. Similarly, in regulated markets, utility green pricing programs, on average, have experienced participation rates of about 1%, while the most successful programs have achieved participation rates of from 4% to 15%. In recent years, a number of utilities have turned to partnering with independent, third-party renewable energy marketers to design and promote their green power programs or to enhance the effectiveness of existing programs. And retail marketers have shown increasing interest in forging partnerships with utilities to improve their success in competitive markets. The first utility-marketer partnerships emerged in 2002 in Oregon, where the state’s two investor-owned utilities were required by law to offer renewable energy options in conjunction with independent marketers. Today, more than 25 utilities either voluntarily team with marketers to offer green power options or do so under legal or regulatory requirements. Several states also require default electricity suppliers to offer green power options in conjunction with competitive marketers. These programs provide access to retail green energy products in restructured markets where none may otherwise exist. Utility-marketer partnerships have the potential to increase program success. Teaming arrangements build on the strengths of the utility, in terms of reputation and access to customers; and build on the strengths of the marketer, in terms of expertise in procuring renewable energy supplies, designing programs, and marketing green energy products to consumers. In addition, partnerships spread the risks of developing and implementing green power programs between both the utility and participating marketer. Finally, marketers have a vested financial interest in maximizing customer participation and green power sales. This paper explores whether partnerships between utilities and independent marketers are an effective strategy for marketing green power. We present case studies of voluntary and mandatory partnerships covering green power program design and implementation in both regulated and restructured electricity markets. We also include perspectives (based on interviews) from utilities, marketers, and regulators involved in developing and implementing these partnerships. From these case studies and interviews, we describe lessons learned about
3
developing effective partnerships, including such issues as respective roles in marketing and administration, product branding, and contract and incentive structures. Overview of Recent Experience with Utility-Marketer Partnerships Partnerships between utilities or default suppliers and independent marketers specializing in selling green energy have become more common. Today, more than 25 utilities have entered into voluntary or mandatory partnerships with third-party marketers to offer green power options to their customers. These programs exist both in states that have implemented retail competition (Table 1) and those with traditionally regulated electricity markets (Table 2). In states with competitive electricity markets, marketers may team with default suppliers to offer renewable energy options to customers not being served by competitive suppliers. In most cases, these teaming arrangements are required by state law or other agreements to provide renewable energy options to residential and small commercial customers, who have had few competitive market choices. These programs provide green power marketers with easier access to small customers, who are otherwise very expensive to contact, enroll, and service. Some mandated partnerships have been designed to involve multiple marketers and encourage greater competition in the market. In Oregon, Connecticut, and New Jersey—where programs are required by law—regulators have involved various stakeholders in program design and implementation in order to balance diverse stakeholder interests. These programs have typically involved competitive solicitations to select the market participants. With voluntary partnerships, utilities have typically opted to partner with a single marketer. Considerations in Making the Partnership Decision Utilities offer green power options to their consumers for any number of reasons, including to satisfy customers or shareholders who want to promote cleaner technologies; improve the utility’s image; develop experience with renewable energy technologies; gain competitive advantage; improve the environmental performance of the utility; or, in some cases, meet state requirements to offer green pricing options.1 And market research has found that customers look more favorably on utilities that offer a green power option, even if they do not participate in the program.2 Once the utility has decided to offer a renewable energy option, it must consider whether to offer the program “in-house” or in partnership with a third-party entity that specializes in green power marketing and supply. Such partnerships may offer the following benefits:
1 Holt, E.A., and M. Holt, 2004. Green Pricing Resource Guide (2nd Edition), Ed Holt & Associates Inc., Harpswell, Maine. Prepared for the American Wind Energy Association, Washington, D.C., September. http://www.awea.org/greenpower/greenPricingResourceGuide040726.pdf 2 Hinckley, Thor. Portland General Electric. “Key Considerations in Green Power Program Administration,” presentation at the Tenth National Green Power Marketing Conference, Austin, Texas, October 24, 2005 http://www.eere.energy.gov/greenpower/conference/gpmconf05_pres.html
4
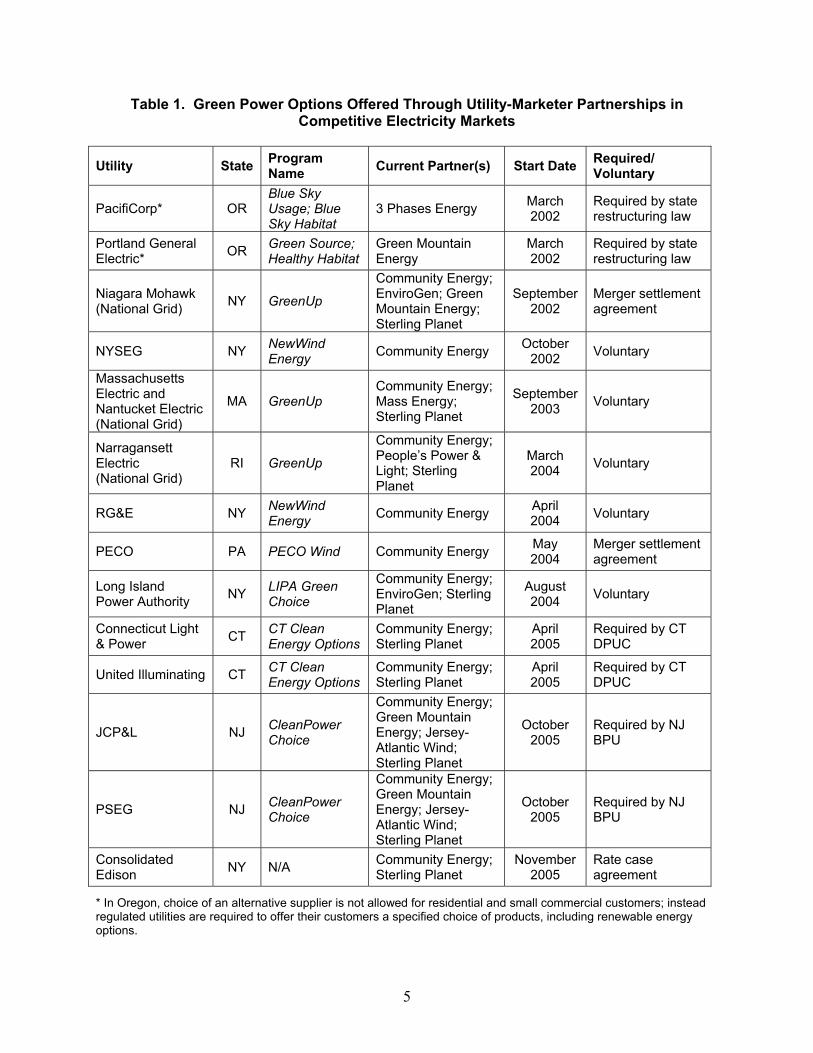
Table 1. Green Power Options Offered Through Utility-Marketer Partnerships in Competitive Electricity Markets
Utility State Program Name Current Partner(s) Start Date Required/
Voluntary
PacifiCorp* OR Blue Sky Usage; Blue Sky Habitat
3 Phases Energy March 2002
Required by state restructuring law
Portland General Electric* OR Green Source;
Healthy Habitat Green Mountain Energy
March 2002
Required by state restructuring law
Niagara Mohawk (National Grid) NY GreenUp
Community Energy; EnviroGen; Green Mountain Energy; Sterling Planet
September 2002
Merger settlement agreement
NYSEG NY NewWind Energy Community Energy October
2002 Voluntary
Massachusetts Electric and Nantucket Electric (National Grid)
MA GreenUp Community Energy; Mass Energy; Sterling Planet
September 2003 Voluntary
Narragansett Electric (National Grid)
RI GreenUp
Community Energy; People’s Power & Light; Sterling Planet
March 2004 Voluntary
RG&E NY NewWind Energy Community Energy April
2004 Voluntary
PECO PA PECO Wind Community Energy May 2004
Merger settlement agreement
Long Island Power Authority NY LIPA Green
Choice
Community Energy; EnviroGen; Sterling Planet
August 2004 Voluntary
Connecticut Light & Power CT CT Clean
Energy Options Community Energy; Sterling Planet
April 2005
Required by CT DPUC
United Illuminating CT CT Clean Energy Options
Community Energy; Sterling Planet
April 2005
Required by CT DPUC
JCP&L NJ CleanPower Choice
Community Energy; Green Mountain Energy; Jersey-Atlantic Wind; Sterling Planet
October 2005
Required by NJ BPU
PSEG NJ CleanPower Choice
Community Energy; Green Mountain Energy; Jersey-Atlantic Wind; Sterling Planet
October 2005
Required by NJ BPU
Consolidated Edison NY N/A Community Energy;
Sterling Planet November
2005 Rate case agreement
* In Oregon, choice of an alternative supplier is not allowed for residential and small commercial customers; instead regulated utilities are required to offer their customers a specified choice of products, including renewable energy options.
5

Table 2. Green Power Options Offered Through Utility-Marketer Partnerships in Regulated Electricity Markets
Utility State Program Name Current Partner Start Date Required/ Voluntary
City of Tallahassee FL Green for You Sterling Planet December 2002 Voluntary
Green Mountain Power VT Cool Home NativeEnergy January
2003 Voluntary
City of Palo Alto Utilities CA PaloAltoGreen 3 Phases Energy June
2003 Voluntary
Emerald People’s Utility District OR Green Power Green Mountain
Energy Summer
2003 Voluntary
City of Ashland OR Renewable Pioneers
Bonneville Environ-mental Foundation
November 2003 Voluntary
Florida Power & Light FL Sunshine Energy Green Mountain
Energy February
2004 Voluntary
AMP-Ohio OH Nature’s Energy Green Mountain Energy
March 2004 Voluntary
Silicon Valley Power CA Santa Clara
GreenPower 3 Phases Energy November 2004 Voluntary
Keyes Energy Services FL GO GREEN Sterling Planet November
2004 Voluntary
City of Naperville IL Renewable Energy Option Community Energy January
2005 Voluntary
Roseville Electric CA Green Roseville 3 Phases Energy December 2005 Voluntary
• Building on the strengths of both the utility (reputation for service and reliability, brand and name recognition, access to and relationships with customers, existing communication channels) and the marketer (specialized expertise in green power procurement, marketing, and program and product design).
• Creating greater incentives for success. Marketers survive on the success of programs; whereas these programs are a small part of the utility’s overall business and may not be a high corporate priority. Most partnerships are structured so that the marketer is paid for performance, which is a strong incentive for success; whereas utility staff typically are salaried and do not have direct financial incentives for success.
• Reducing risks associated with offering the program. Marketers are willing to absorb a portion or most of the program risk.
• Sharing the start-up costs with a third party may enable utilities to shorten the period until the program covers its costs, strengthening the overall business case for the program.
• Providing access to larger marketing budgets. Marketers typically commit some of their own resources to marketing, which can lead to more funds than the utility would be
6

willing to commit internally. In addition, marketers may be eligible for state marketing incentives for which the utility is not.
• Providing more flexibility in staff availability for marketing campaigns (events, door-to-door sales, etc.) and program implementation.
• Supplementing in-house capabilities if marketing value-added products is not a core utility competency, or if the utility lacks expertise in renewable energy markets or marketing.
• Enhancing the effectiveness of marketing materials and campaigns. Marketers may be more creative and nimble. Also, marketers may have experience with marketing approaches not typically used by the utility but that have proven effective for attracting green power customers.
• Facilitating the sale of renewable energy certificates (RECs) to residential and small commercial customers. The RECs concept is confusing to many consumers. Under a teaming arrangement, the utility provides customers with electricity, which creates a bundled electricity product. Also, utility involvement in offering a REC-based product may increase the customer’s comfort level, because the utility is a known and trusted entity.
• Creating a greater market impact than individual organizations can achieve independently.
On the other hand, partnerships between utilities and third-party marketers may have some disadvantages or create challenges, such as:
• Requiring greater coordination and collaboration with an external entity. For example,
the two parties may have differing opinions on the best approaches to program implementation or the pace of marketing. A marketer may want to use marketing approaches or techniques not typically used by the utility, such as telemarketing or door-to-door sales. Final decisions regarding marketing are typically made by the utility.
• Reducing the profit potential for the utility—particularly in the long run—if revenues are shared with the marketer. However, many utilities with in-house programs report that these programs rarely make money; and, in many cases, are intentionally structured not to do so, but instead are implemented for public relations, environmental, and other benefits.
• Providing a significant short-term benefit, if the utility has limited experience marketing green power or procuring renewable energy supplies. However, the value of the partnership may decline over time, if the utility is experienced in marketing value-added products.
• Leading customers to wonder why the utility is not offering the product in-house. However, marketing the program exclusively under the utility brand and essentially hiding the marketer’s participation can mitigate this concern.
• Giving customers the impression that the product is more expensive than if it were offered by the utility in-house. Again, marketing the program under the utility’s brand can mitigate this concern.
• Implementing new programs that involve lengthy or delayed regulatory approval processes. It can be difficult for marketers to invest heavily in start-up activities for new programs, if revenues from program participants are delayed.
7
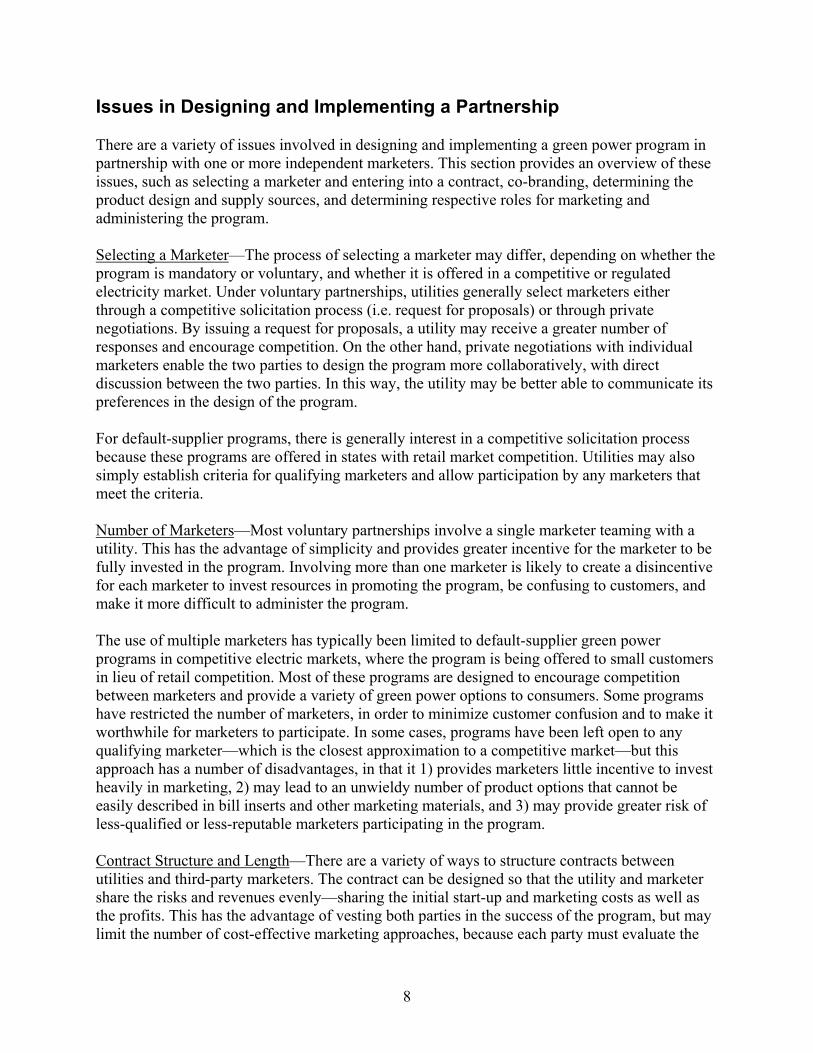
Issues in Designing and Implementing a Partnership There are a variety of issues involved in designing and implementing a green power program in partnership with one or more independent marketers. This section provides an overview of these issues, such as selecting a marketer and entering into a contract, co-branding, determining the product design and supply sources, and determining respective roles for marketing and administering the program. Selecting a Marketer—The process of selecting a marketer may differ, depending on whether the program is mandatory or voluntary, and whether it is offered in a competitive or regulated electricity market. Under voluntary partnerships, utilities generally select marketers either through a competitive solicitation process (i.e. request for proposals) or through private negotiations. By issuing a request for proposals, a utility may receive a greater number of responses and encourage competition. On the other hand, private negotiations with individual marketers enable the two parties to design the program more collaboratively, with direct discussion between the two parties. In this way, the utility may be better able to communicate its preferences in the design of the program. For default-supplier programs, there is generally interest in a competitive solicitation process because these programs are offered in states with retail market competition. Utilities may also simply establish criteria for qualifying marketers and allow participation by any marketers that meet the criteria. Number of Marketers—Most voluntary partnerships involve a single marketer teaming with a utility. This has the advantage of simplicity and provides greater incentive for the marketer to be fully invested in the program. Involving more than one marketer is likely to create a disincentive for each marketer to invest resources in promoting the program, be confusing to customers, and make it more difficult to administer the program. The use of multiple marketers has typically been limited to default-supplier green power programs in competitive electric markets, where the program is being offered to small customers in lieu of retail competition. Most of these programs are designed to encourage competition between marketers and provide a variety of green power options to consumers. Some programs have restricted the number of marketers, in order to minimize customer confusion and to make it worthwhile for marketers to participate. In some cases, programs have been left open to any qualifying marketer—which is the closest approximation to a competitive market—but this approach has a number of disadvantages, in that it 1) provides marketers little incentive to invest heavily in marketing, 2) may lead to an unwieldy number of product options that cannot be easily described in bill inserts and other marketing materials, and 3) may provide greater risk of less-qualified or less-reputable marketers participating in the program. Contract Structure and Length—There are a variety of ways to structure contracts between utilities and third-party marketers. The contract can be designed so that the utility and marketer share the risks and revenues evenly—sharing the initial start-up and marketing costs as well as the profits. This has the advantage of vesting both parties in the success of the program, but may limit the number of cost-effective marketing approaches, because each party must evaluate the
8

cost-effectiveness based on a lower fraction of revenues. Alternatively, contracts can be structured so that the marketer is compensated with the majority of the revenues and paid on a per-customer or per-MWh basis, with a small portion of the revenues used to cover the utility’s administrative costs. This places most of the risk on the marketer, but also creates a strong incentive for the marketer to enroll customers in the program. The willingness of the marketer to assume risk depends partly on the contract length. Marketers typically prefer the longest contract length possible—at least three to five years—in order to recoup their start-up costs and to make it worthwhile to significantly invest in marketing. It takes time and resources to place staff, raise awareness, and enroll customers in the program; therefore, it is important that contracts are structured to allow the marketer time to gain sufficient momentum in the market. On the other hand, the utility may want to limit the length of the contract to keep its options open, encourage competition and continued commitment to the program, explore new ideas that other marketers may be able to offer, and limit its risk, if the partnership does not work well. It is necessary to balance these conflicting needs, in order to achieve an effective partnership. The preferred approach to structuring the contract depends partly on the utility’s motivation for offering the program and its willingness to assume risk. Regardless of the structure, however, it is important for the utility to be actively engaged in facilitating and promoting the program, or it is less likely to succeed. Product Design—Considerations in the design of a green power product include: 1) the renewable energy supply and whether it comes from existing or new sources, and from sources in-state or within some geographic region; 2) whether the product must be certified or verified independently; 3) whether the product is sold in kWh increments, as total use, or some fraction of a customer’s electricity use, and 4) the price. When partnering with a third party, the utility can either specify its preferred product design or leave it to the marketer, who may have more experience in product design, naming and pricing, and market messaging, as well as greater knowledge of available renewable energy resources. Generally, however, the product design is usually accomplished through some collaboration between the utility and the marketer to fit both the utility’s and the customers’ needs. Programs offered in competitive markets that involve multiple marketers may need to establish minimum product requirements to provide a level playing field among competing suppliers. This can help avoid a situation in which suppliers compete only on price at the expense of product quality. For this reason, some programs have established criteria for the resource mix, resource vintage, pricing, and product certification or verification. Co-Branding—Under a partnering arrangement, another issue to be addressed is whether the product will be marketed under the utility’s brand or co-branded. Including the marketer’s brand may appeal to customers who do not have a favorable opinion of the utility or question its environmental credentials. On the other hand, there are good reasons to stick with the utility’s brand, such as: 1) it is well-recognized by customers, 2) it may be less confusing to customers if only one brand and logo are included, 3) it may be easier to implement, particularly on marketing materials with limited space, and 4) it can eliminate customers’ concerns about why the utility is
9

not offering the program in-house or whether it might cost more because a third party is involved. It is important to establish at the outset of the program how co-branding will be implemented. Co-branding can be accomplished by either branding the product under the marketer’s brand or including the marketer’s name and logo on promotional materials and formally recognizing its role in implementing the program. Determining Respective Roles—It is also important to define roles for the utility and marketer at the outset. The division of duties will depend on the core capabilities of the parties and the reason for retaining the marketer in the first place. Roles are likely to differ to some degree in mandatory and voluntary partnerships. Typically, third-party marketers provide program supplies and/or marketing services, although the utility often plays a role in marketing the program as well. In some cases, marketers develop annual or periodic marketing plans, which are subject to the utility’s approval, and take the lead in implementing these plans. The third-party marketer often will also fully design the marketing collateral. However, the utility may play a role in designing marketing materials and messaging, implementing supplemental marketing campaigns, conducting analyses to target customers (or sharing data with the marketer for this purpose), and managing the customer contact through mailings or facilitating events. Perhaps one of the most important functions of the utility program manager is to act as a facilitator among the various groups within the utility (call center, graphic arts/communications, billing, etc.) to enable the marketer to be successful. Also, the utility program manager may be able to leverage marketing activities already underway at the utility to more cost-effectively market the program. Generally, marketers play a limited role in program administration because utilities are already well-positioned to undertake administrative functions, such as enrolling and billing customers, managing call centers, and handling customer communications. Marketers may play a role in training call center staff and answering specific enrollment and billing questions. In addition, marketers may be involved in other administrative duties, depending on the utility’s needs. In default-supplier programs, marketers are typically responsible for customer enrollments, which are handled through processes established for the competitive electricity market.
10
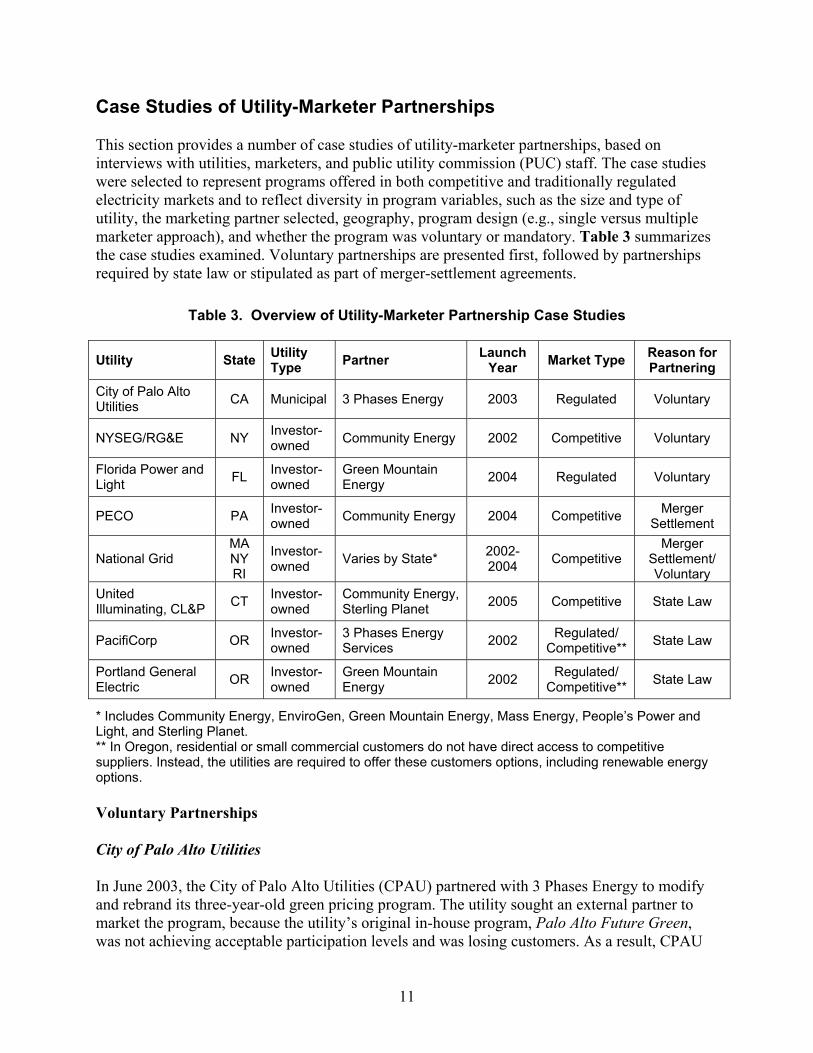
Case Studies of Utility-Marketer Partnerships This section provides a number of case studies of utility-marketer partnerships, based on interviews with utilities, marketers, and public utility commission (PUC) staff. The case studies were selected to represent programs offered in both competitive and traditionally regulated electricity markets and to reflect diversity in program variables, such as the size and type of utility, the marketing partner selected, geography, program design (e.g., single versus multiple marketer approach), and whether the program was voluntary or mandatory. Table 3 summarizes the case studies examined. Voluntary partnerships are presented first, followed by partnerships required by state law or stipulated as part of merger-settlement agreements.
Table 3. Overview of Utility-Marketer Partnership Case Studies
Utility State Utility Type Partner Launch
Year Market Type Reason for Partnering
City of Palo Alto Utilities CA Municipal 3 Phases Energy 2003 Regulated Voluntary
NYSEG/RG&E NY Investor-owned Community Energy 2002 Competitive Voluntary
Florida Power and Light FL Investor-
owned Green Mountain Energy 2004 Regulated Voluntary
PECO PA Investor-owned Community Energy 2004 Competitive Merger
Settlement
National Grid MA NY RI
Investor-owned Varies by State* 2002-
2004 Competitive Merger
Settlement/ Voluntary
United Illuminating, CL&P CT Investor-
owned Community Energy, Sterling Planet 2005 Competitive State Law
PacifiCorp OR Investor-owned
3 Phases Energy Services 2002 Regulated/
Competitive** State Law
Portland General Electric OR Investor-
owned Green Mountain Energy 2002 Regulated/
Competitive** State Law
* Includes Community Energy, EnviroGen, Green Mountain Energy, Mass Energy, People’s Power and Light, and Sterling Planet. ** In Oregon, residential or small commercial customers do not have direct access to competitive suppliers. Instead, the utilities are required to offer these customers options, including renewable energy options. Voluntary Partnerships City of Palo Alto Utilities In June 2003, the City of Palo Alto Utilities (CPAU) partnered with 3 Phases Energy to modify and rebrand its three-year-old green pricing program. The utility sought an external partner to market the program, because the utility’s original in-house program, Palo Alto Future Green, was not achieving acceptable participation levels and was losing customers. As a result, CPAU
11

decided to seek a green marketing specialist to assist with a redesign and relaunch of the renewable energy program. To select a marketer, CPAU issued a request for proposals (RFP), which established some product-design guidelines (such as 100% new and emissions-free resources), but left other design and marketing aspects to the bidders. CPAU selected 3 Phases Energy to be its partner and entered into a five-year agreement that allows the utility to purchase renewable energy certificates (RECs) for a fixed megawatt-hour price, with an annual renewal option. Under the contract, the MWh price (which includes marketing costs) declines when a certain sales threshold is reached. The utility only purchases enough RECs to meet customer subscriptions. In this structure, the marketer assumes much of the risk and, thus, is motivated to market the program effectively to increase sales. The utility viewed the lower risk as a primary advantage of the partnership, which played a role in the utility’s initial motivation for seeking a third-party marketer. Together, CPAU and 3 Phases launched the PaloAltoGreen Program on June 1, 2003.3 Under the program, the utility’s residential and small commercial customers can purchase renewable energy for 100% of their electricity needs at a premium of 1.5¢/kWh above standard electricity rates. Medium- and large-business customers can purchase 1-MWh blocks for $15 per block. The product is a blend of 97.5% new wind and 2.5% new solar, and is Green-e certified.4 The wind energy is procured from the Bonneville Power Administration from wind projects in Oregon, Washington, and Wyoming; and the solar energy is supplied from large-scale solar installations in northern California.5 The product is marketed under the utility brand (PaloAltoGreen) with no mention of the marketer. CPAU was not interested in co-branding, because it did not want consumers to question why the utility was not administering the program in-house. There were also concerns that mention of a third-party marketer would lead customers to believe that the program was more expensive to administer. In reality, the success of the program—and the volume of renewable energy sold—has lowered administrative costs, compared to the utility’s initial offering. In addition, the marketer was comfortable using just the utility brand. The utility handles all program administration and customer contact to offer a seamless product and protect customer privacy. CPAU manages customer enrollment, sends out mailings, and tracks renewable energy sales. It also manages the call center and trains call center staff, with assistance from the marketer. A portion of the program revenues are used to cover the utility’s costs of program administration. Program marketing is primarily the responsibility of 3 Phases, although the utility helps design marketing pieces and campaigns. The utility also has final say on all marketing campaigns and
3 News Release, May 6, 2003, 3 Phases Energy. “City of Palo Utilities Announce Partnership with 3 Phases Energy to Launch New Wind and Solar Offering, Palo Alto Green.” http://www.3phases.com/news/news_5_6_03.htm. 4 Launched in 1997, Green-e is a voluntary certification and verification program that sets standards for renewable electricity-based products sold in North America. See http://www.green-e.org/5 City of Palo Alto Utilities, PaloAltoGreen Program http://www.cpau.com/programs/green/generation.html, accessed March 13, 2006.
12

approves a quarterly marketing plan submitted by the marketer. From the utility’s perspective, this arrangement has worked well. Program marketing has included bill stuffers, bangtails, a “welcome kit,” an e-mail newsletter designed to keep customers informed of the impacts of the program, news conferences to publicize large purchases, and community partnerships. Occasionally, the marketer has wanted to be more aggressive or use marketing approaches (such as door-to-door marketing) that the utility has been unwilling to support, because they do not fit within its culture. Nevertheless, the utility program manager noted that, because of the partnering arrangement, the program has been given more flexibility internally to be innovative and try different tactics (such as yard signs and bangtails) that were not previously used by the utility. Going forward, CPAU is considering conducting it own resource procurement, now that it has an established base of participants. This would allow the utility to pursue longer-term power purchase contracts for its renewable energy supplies, rather than relying on RECs. In this case, the utility would need to restructure its contract with the marketer to obtain marketing services only. Results and Lessons Learned The PaloAltoGreen program has well-exceeded its initial goal of 5% customer enrollment over five years and, in fact, met that goal in the first six months. In comparison, the utility’s original program achieved less than 1% penetration in three years of operation. As of December 2005, more than 3,700 customers—or nearly 14% of the utility’s customer base—were enrolled in the PaloAltoGreen program and collectively purchased more than 30 million kWh of renewable energy annually. The program model is being replicated by other municipal utilities in California, such as Silicon Valley Power, with similar success. From the utility’s perspective, several factors have contributed to the success of the program. First, the partnership enables the utility and the marketer to leverage their individual strengths by taking advantage of 3 Phases’ renewable energy marketing and procurement expertise, and CPAU’s reputation and access to customers. The program’s structure provides an incentive to the marketer to make the program successful, while limiting the utility’s risk. Partnering enabled the utility to promote the program in new and innovative ways, beyond those traditionally used by the utility’s in-house marketing staff. Finally, the partnership and its early success helped generate internal interest in, and support for, the program among various utility departments—from the mail house to the communications department—which has also helped promote the program. From the marketer’s perspective, several factors have led to success. The utility program manager is enthusiastic and very supportive, and there is widespread support within the utility for the program. In addition, the product characteristics are very appealing, containing resources preferred by customers (new wind and solar) and carrying Green-e certification. Also, the product is sold to customers for 100% of their electricity needs at a relatively low premium of 1.5¢/kWh. Another success factor is the progressive nature of the community with demographics conducive to marketing green power, and a utility that is well-regarded in the community.
13
NYSEG/RG&E In 2002, New York State Electric and Gas Corporation (NYSEG) partnered with Community Energy Inc. to provide its customers in upstate New York with a green power purchase option. This was the first voluntary partnership between a marketer and a utility in the United States. The partnership was supported by a five-year grant from the New York State Energy Research and Development Authority (NYSERDA), which was designed to encourage entities to offer voluntary green power programs in the state’s competitive retail electricity market (NYSERDA 2001).6 The program was later expanded to NYSEG’s sister company, Rochester Gas and Electric (RG&E), in April 2004. The product design was influenced by the terms of the NYSERDA grant. The grant dictated that the renewable product be supplied from 20% new renewable energy sources in the initial year (increasing by 5% annually), and that 75% of the product be supplied from wind or solar resources.7 NYSERDA also required that the product comply with the state electricity source disclosure laws. The final product—based on these guidelines and developed collaboratively by NYSEG and Community Energy—is a 100% new wind product marketed under the Community Energy brand NewWind Energy. It is sold in 100-kWh monthly increments for $2.50 (or a rate premium of 2.5¢/kWh), with a minimum purchase of 200 kWh for residential customers. Price discounts are available for large purchases by nonresidential customers. The program is supplied from the 30-MW Fenner wind project near Syracuse, New York. Program materials carry the NYSEG brand and mention that the program is a partnership with Community Energy, while the product carries the Community Energy NewWind Energy brand. Both NYSEG and Community Energy share the program risks and revenues. In this way, both parties are vested in the success of the program. Both the utility and marketer are involved in the marketing and program administration, while Community Energy procures the renewable energy supplies. The parties jointly develop an annual marketing plan with NYSEG leading its implementation. For example, NYSEG issues semiannual bill inserts, trains call center employees, enrolls customers in the program, and coordinates marketing to large commercial and industrial customers. Because this was the first voluntary partnership between a utility and a marketer, NYSEG assumed that it was in a better position to market the program in-house, given its marketing capabilities and staff, and access to customers. Going forward, Community Energy plans to play a greater role in designing marketing materials, developing messaging, and planning promotional events. Customer billing has been a particular issue for the program. Although the utility bills customer participants, the charge did not appear as a line item on the standard customer electricity bill prior to 2006, because the utility had difficulty modifying its billing system to accommodate an extra charge. Instead, customers received a separate bill or had the charge applied monthly to their credit cards. There is some concern that this may have limited enrollment because
6 [NYSERDA] New York State Energy Research and Development Authority. 2001. Pon 599-01: Green Marketing Support Programs. http://www.nyserda.org/funding/599PON.html7 NYSERDA defined “new” product as those renewable resources in service after January 1, 2000.
14

customers may prefer to receive only one bill or be hesitant to give out their credit card numbers. The impact of the billing system issue on enrollment may only become clear once the modification is made. Community Energy plans to expand its marketing role, once the upgrade is fully implemented. Results and Lessons Learned As of December 2005, more than 5,300 customers were enrolled in the NYSEG and Rochester Gas and Electric programs. These customers purchase nearly 45 million kWh annually, with more than half of sales to nonresidential customers. The overall customer participation rate of 0.4% is below the national average for green pricing programs, which is about 1.3%. Once the billing system modification is implemented, the program may be poised for growth. Although NYSEG and Community Energy did not establish specific performance targets for the green power program, the utility views the program as a success. NYSEG attributes the success largely to the fact that both parties share the program risks and financial rewards. Therefore, both have a vested interest in its success. In addition, teaming with a third-party marketer allowed the program to take advantage of the NYSERDA grant, which has helped cover implementation costs and reduce program risks. Florida Power and Light In February 2004, Florida Power and Light (FPL) teamed with Green Mountain Energy Company to offer a renewable energy option to the utility’s residential customers. FPL voluntarily initiated the program and opted to work with a third party, because it thought that it could benefit from having a partner with specific renewable energy marketing and procurement expertise. The marketer was chosen through a competitive-bid process. Although the RFP specified a preference for Florida-based resources, it left much of the product design and pricing to the bidders. Development of the final product involved significant collaboration between the utility and the marketer. The successful bidder, Green Mountain Energy, provided input on consumer preferences for renewable energy resources, while the utility contributed an understanding of customer demographics and the demand for locally produced renewable energy. Under the Sunshine Energy program, customers can purchase renewable energy in 1,000-kWh increments each month at a premium of $9.75 above standard electricity rates. The product is a blend of new wind, landfill gas, and biomass resources. In addition, the utility pledges to build 150 kW of new solar capacity for every 10,000 enrolled customers. Green Mountain Energy is responsible for obtaining the renewable energy supplies and for implementing the majority of the marketing—and, therefore, assuming much of the program risk. The marketer is compensated for each new customer, with a small portion of the revenues used to cover the utility’s administrative costs.
15
The program is promoted exclusively under the utility brand, with no mention of the marketer. FPL decided against co-branding for several reasons, including 1) customers were accustomed to utility-offered programs, 2) co-branding with a lesser-known third party could result in customer confusion, and 3) the utility has an established green brand—it relies heavily on natural gas for electricity generation, and its sister company (FPL Energy) is the largest wind developer in the United States. Green Mountain Energy plans and leads the marketing, including market analysis and targeting, product messaging, and development of marketing materials. The marketer also provides scripts to the FPL call center, promotes the program at events, and uses other marketing channels such as direct mail and telemarketing. The company also enrolls customers in the program, except for those who sign up by returning utility bill inserts. FPL approves all messaging, marketing materials, and campaigns, and has also developed some marketing elements in-house, such as the product name, logo, and other graphics. The utility handles many administrative tasks, including processing bill-insert enrollments, communicating with customers through the call center and the utility’s Web site, and billing customers—the program charge appears as a line item on the customer’s standard utility bill. The recent hurricanes have posed a particular challenge to program marketing. Because the utility and many homeowners were preoccupied with power outages and recovery activities, the utility curtailed program marketing for much of the hurricane season. Although customers could still enroll in the program, it was not actively marketed. Despite these limitations, the utility included three promotional bill inserts in 2005. Results and Lessons Learned Measuring the program success and developing performance metrics have been a challenge for the utility, particularly with the marketing curtailments. Initially, the partners set a goal of enrolling 1% of utility customers within the first few years. At the end of 2005―less than two years after the program launch—23,000 residential customers had enrolled, representing 0.6% of the utility’s residential customers. While the 1% goal has not yet been met, both parties have been pleased with the program’s success. Program revenues have exceeded the utility’s expectations outlined in its three-year plan, because customer retention has been higher than expected. The program grew dramatically during 2005, with the number of participants more than doubling and annual purchases of renewable energy reaching 225 million kWh. As a result, the program ranked fourth nationally in renewable energy sales and sixth in customer participants in 2005.8 From the utility’s perspective, it has benefited substantially from the partnership, because it had little in-house experience with obtaining renewable energy supplies and marketing renewable energy to end-use customers. The marketer has also added value by using effective marketing techniques that the utility would not have used on its own. The primary partnership challenges
8 “NREL Highlights Leading Utility Green Power Programs.” News release dated March 15, 2006. (http://www.eere.energy.gov/greenpower/resources/tables/pdfs/0306_topten_pr.pdf) See also: http://www.eere.energy.gov/greenpower/markets/pricing.shtml?page=3
16
have been coordination and obtaining utility approval for marketing activities, which can be time-consuming. Mandatory Partnerships PECO As a result of a settlement agreement reached during its corporate merger with Unicom, PECO agreed to team with Community Energy to offer a green power option to its retail consumers. Despite this requirement, PECO was interested in a marketer partnership to reduce risk and start-up costs, and thought it could benefit from Community Energy’s experience and understanding of the renewable energy market. By teaming with a third party to share some of the start-up expenses, PECO was able to make the program more profitable in the early years, which fit its business strategy. The partnership details were not specified in the settlement agreement, and the two companies worked collaboratively to design the program. To avoid regulatory challenges, the partners agreed to propose a program specifically for customers who chose PECO as their electricity provider in Pennsylvania’s competitive retail electricity market. PECO notes that this has reduced the flexibility of the program, because it limits the utility’s ability to offer price discounts to small commercial and industrial customers, and to offer the program to customers who switch suppliers. However, the parties were willing to sacrifice some flexibility to gain regulatory approval. The PECO WIND program was unveiled in May 2004 and gives residential and business customers the option of purchasing wind energy in 100-kWh increments each month for an additional charge of $2.54—or a rate premium of 2.54¢/kWh. The surcharge is added to the participating customer's monthly electricity bill. Price discounts are available for large purchases of 2,600 MWh/year or greater. The product pricing was determined by supply contracts and consistency with other utility programs at the time, which was considered to be defensible with regulators. The product is supplied from a new 64.5-MW wind power facility in Waymart, Pennsylvania. Although the parties agreed to co-brand the product, the agreement contained no definition on this point, creating an implementation challenge. The product is branded as PECO WIND, but promotional materials indicate that Community Energy supplies the wind energy. And all marketing materials contain three logos—the product logo and the two company logos. From this experience, both parties have learned the importance of clearly defining the brand identity and the practical implementation of co-branding prior to the launch of the product. Community Energy leads the effort to develop marketing materials and design marketing and outreach campaigns, although the utility reviews and approves the marketing plans. Event marketing and canvassing has been a key element of the program’s successful launch. PECO makes space available on four to eight bill inserts a year—which are an important mechanism for enrolling customers—and the utility’s large account managers work with the marketer’s account managers to sell the product to commercial customers.
17

Community Energy secured enrollment incentives ($/customer) from the Sustainable Development Fund, which has provided another advantage to the partnership. These incentives have helped reduce customer-acquisition costs and have encouraged the marketer to spend more resources overall on the program. The incentives have also enabled Community Energy to test more expensive marketing techniques and, thus, overcome one of the key challenges of the shared-revenue partnering approach—that marketing is often limited to the most cost-effective channels. Because PECO had profitability goals, PECO and Community Energy negotiated a roughly equal split of the long-run profits. The utility acknowledges that if it had provided Community Energy with higher margins, the marketer could have more readily implemented marketing tactics with higher acquisition costs. PECO undertook the expense of upgrading its billing system to include the green pricing charge as a line item on the standard electricity bill. The utility also provides the marketer with its customer lists, which, from the marketer’s perspective, is an important contributor to the program’s success. Community Energy plays a significant role in program administration, taking responsibility for adding and dropping customers, processing enrollments, and handling telephone and Web inquiries about the program. Results and Lessons Learned The partnership set modest goals for both profitability and volume sales. Although the commercial-sector goal was not met, the residential-sector goal was substantially exceeded. PECO reports that more than 22,000 customers (or 1.5% of its customer base) had enrolled in the program at the end of 2005, collectively purchasing about 45 million kWh during the year. The program was ranked seventh nationally in the number of participating customers.9 From the utility’s perspective, the partnership has been mutually beneficial. In addition to its renewable energy market expertise and credibility, Community Energy brought marketing dollars and access to enrollment incentives, which resulted in a larger marketing budget than PECO would have been able to secure on its own. In addition, teaming with a marketer was important politically for gaining regulatory approval to offer a program. For its part, the utility has contributed its name recognition, credibility, and access to customers, as well as in-house expertise from marketing other products, such as the ability to conduct sophisticated market-segmentation analysis. The marketer has benefited through sharing the marketing risk, gaining greater access to the utility’s customers (particularly residential and small commercial customers), and the ability to leverage the utility’s positive reputation and existing customer communication channels. As an independent marketer, Community Energy has found it particularly challenging to reach small customers cost-effectively in the competitive retail market without working with a utility.
9 Ibid.
18

PECO recommends a “partnering” approach to any utility with limited knowledge of green energy markets, or who is not prepared to market value-added products. The utility also recognizes the significant initial benefits that a marketer can bring to understanding the green power marketplace. However, PECO thinks that the value of the partnership has diminished somewhat over time, as the utility has acquired market knowledge and gained experience in product marketing and program implementation. And the utility gave up some of the long-term profitability in exchange for risk reduction and short-term profitability. On balance, the utility has found the early partnership benefits of market experience, accelerated profitability, and reduced risk to be well worth the trade-off of sharing long-run profits with the marketer. National Grid As a result of a merger settlement agreement, National Grid began offering a renewable energy program to customers in the former Niagara Mohawk service territory in upstate New York in September 2002. Sometimes referred to as the “open access” model of utility-marketer partnerships, the GreenUp program allows any marketer to offer customers one or more green power options at an additional cost to the basic electric service. The utility provides the avenue to reach customers. While required in New York, National Grid voluntarily expanded the GreenUp program to its distribution utilities in Massachusetts (formerly Massachusetts Electric and Nantucket Electric) in September 2003 and Rhode Island (formerly Narragansett Electric) in March 2004, to stimulate competition in these retail electricity markets and provide additional service options to residential and small commercial customers.10
The basic goal of establishing the GreenUp program was presented in the merger petition of Niagara Mohawk and National Grid, but the settlement agreement did not include specifics, and instead directed the parties to create more detailed guidelines for implementation.11 As a result, the parties—which included environmental groups, consumer advocates, and several green energy suppliers and marketers—participated in a six-month public process to develop a more detailed program design. The final guidelines address marketer participation, customer-enrollment procedures, utility marketing and environmental disclosure requirements, and the utility-marketer interface. In New York, participating marketers must pay for the utility billing system upgrades needed to incorporate the GreenUp charge on the utility bill. While this requires an up-front investment from the green energy marketer, the resulting access to the utility’s billing system provides a ready avenue to potential customers. In Rhode Island and Massachusetts, National Grid absorbed the cost of the necessary billing system modifications. Although National Grid does not require marketer certification, each marketer must follow state protocols for electricity market participation. In Massachusetts and Rhode Island, retail marketers must obtain an electricity broker’s license; while, in New York, the marketers must be registered.
10 The program was not expanded to the company’s New Hampshire territory because the limited number of National Grid customers in that market (45,000) made program investment economically unattractive for marketers. 11 State of New York Public Service Commission, Opinion No. 01-06, Case 01-M-0075, Opinion and Order Authorizing Merger and Rate Plan, Niagara Mohawk and National Grid, December 3, 2001.
19

Product details, such as pricing and resource mix, are defined by the marketers. However, suppliers are required to disclose the product content and resource mix in accordance with state fuel-mix disclosure policies. In New York, marketers are also required to match supply with sales on a six-month basis. Third-party certification is not required, but some marketers have offered certified products.12
As of February 2006, four marketers were offering green power options in National Grid’s New York service territory, with prices ranging from 1¢/kWh to 2.5¢/kWh above basic service rates. National Grid customers in Rhode Island and Massachusetts also each have access to four green power suppliers with product prices ranging from 1.5¢/kWh to 2.4¢/kWh for 100% renewable energy use (Tables 4-6).13 Most products are renewable energy blends, containing wind, biomass, small hydro, or solar. While National Grid promotes the overall program, it does not promote specific options or suppliers but instead refers customers to the participating marketers for additional product information. In Massachusetts, the utility provides customer lists to the marketer but is barred from doing this in New York or Rhode Island. Participating suppliers are responsible for marketing their own products and can use the GreenUp program logo on their promotional materials, subject to utility review and approval. National Grid helps market the program through a GreenUp Web page, by educating its customer-service representatives, and by issuing bill inserts that describe the program options. The utility also includes a postage-paid enrollment card for its customers. In New York, National Grid was required to issue and pay for an annual GreenUp bill insert for the first three years (through 2004) as a condition of the merger-settlement agreement. In 2005 and going forward, the utility will continue to issue an annual bill insert, but the expense will be shouldered by participating marketers, similar to Rhode Island and Massachusetts. Generally, the marketers think that a single bill insert is insufficient to market the program. In Rhode Island, National Grid has agreed to issue two bill inserts per year after initially agreeing to only one. Because the program is open to multiple suppliers, creating the bill inserts has been a challenge for all of the parties. With limited print space, it is difficult to include enough information on the available product choices. It is also difficult to get consensus on how to present the information. The initial design and implementation required coordination of different opinions about the messaging, layout, and overall design. With subsequent bill inserts, the process has become less onerous, but the issue of providing adequate product information to customers has remained. The utility has worked to address these concerns by providing additional space on the bill inserts. In those cases where the marketers pay the cost of the bill insert, the total number of marketers participating can impact the cost-effectiveness of the bill insert as an enrollment tool. In Rhode Island, one marketer recently decided to not participate in the bill insert, citing cost concerns.
12 For example, some products are certified by either Green-e (www.green-e.org) or Environmental Resources Trust (ERT) (http://www.ert.net/). 13 A fourth supplier, Clear Sky Power, was recently added to the Massachusetts and Rhode Island Green-up programs but product information was not available to be included in this report.
20

While this resulted in higher costs for the two remaining marketers, one noted that the greater market share compensated for the additional cost. Customers can enroll in the program by returning the mail-in cards included with the utility bill inserts or by contacting marketers directly. To process enrollments, the marketers provide the utility with each customer’s account number and product preference. The utility then confirms the enrollments, adds the charge to each customer’s electricity bill, and tracks the amount of power purchased through the program. The marketers deliver RECs to the utility through the New England (NEPOOL) GIS tracking system. Support from state system benefit funds has helped provide overall marketing support for the GreenUp program. In Rhode Island and Massachusetts, a third-party promoter (SmartPower) has conducted advertising campaigns and promoted the program with municipalities. And NYSERDA and the Rhode Island Renewable Energy Fund have provided significant incentives for marketers to enroll customers, which has helped reduce customer-acquisition costs. Results and Lessons Learned Although specific performance goals or targets were not established, the program has exceeded the utility’s expectations. As of the end of December 2005, there were nearly 21,000 customers participating in the program in all three states, with about 12,500 in New York (0.7% of eligible customers), 4,900 in Massachusetts (0.4%), and 3,600 in Rhode Island (0.8%). Collectively, customer participants purchased more than 130 million kWh in 2005, making it one of the largest utility green power programs nationwide—the program ranked among the Top 10 programs for sales and customer participants in both 2004 and 2005, but participation rates are below the national average. While the multi-supplier “open-access” design of the GreenUp program closely approximates a competitive market environment by offering customers multiple product choices and enabling a range of suppliers to participate, it also poses a number of implementation challenges. It has been a challenge to achieve consensus among the suppliers on how best to present product information on collaborative marketing materials. Further, presenting too many product options can be confusing to customers. The open-access design also provides a more limited incentive for marketers to invest in the program, particularly with a large number of supplier participants. Most of the marketers have limited their individual marketing and relied heavily on the utility-bill inserts. Some marketers believe that it is equitable for the utility to share the marketing costs because the utility receives public relations benefits from the program’s existence, even if it doesn’t share in the direct profits. On the other hand, the utility and some regulators have raised concerns about imposing program costs on nonparticipants. Finally, both the utility and the marketers agree that program implementation would be easier with fewer suppliers, but this would limit customer choices.
21

Table 4. New York GreenUp Options
Utility Partner Product Name Product Content Product Price
Generation Location Certification
NewWind Energy and Water
60% New Wind 40% Small Hydro 1.3¢/kWh New York ----
Community Energy NewWind
Energy 100% New Wind 2.5¢/kWh New York ----
Sterling Planet Sterling Green 40% New Wind 30% Small Hydro 30% Bioenergy
1.5¢/kWh New York ERT
Green Mountain Energy Pollution Free 50% New Wind
50% Small Hydro 1.5¢/kWh New York Green-e
EnviroGen Think Green! 75% Biomass 25% Small Hydro 1.0¢/kWh New York ----
Table 5. Selected Massachusetts GreenUp Options
Utility Partner Product Name Product Content Product Price
Generation Location Certification
Community Energy
NewWind Energy and Water
70% Small Hydro 30% New Wind 2.0¢/kWh Northeast ----
Sterling Planet Sterling Premium
50% Small Hydro 30% Bioenergy 15% New Wind 5% New Solar
1.5¢/kWh New England ERT
Mass Energy Consumers Alliance
New England GreenStart
75% Small Hydro 19% New Biomass 5% New Wind 1% New Solar
2.4¢/kWh New England ----
Table 6. Selected Rhode Island GreenUp Options
Utility Partner Product Name Product Content Product Price
Generation Location Certification
Community Energy
NewWind Energy and Water
60% Small Hydro 40% New Wind 1.5¢/kWh Northeast ----
People’s Power & Light
New England GreenStart RI
70% Small Hydro 29% New Wind 1% New Solar
1.5¢/kWh New England
----
Sterling Planet Sterling Supreme
40% Small Hydro 25% New Solar 25% Bioenergy 10% Wind
1.98¢/kWh New England ERT
22

Connecticut: CL&P and UI In June 2003, the Connecticut legislature amended the state’s Electric Restructuring Act to, among other things, require the state’s two electric distribution companies—Connecticut Light and Power (CL&P) and The United Illuminating Company (UI)—to offer their customers green power options.14 The legislation called for the options to be developed and implemented by third-party companies selected through a competitive bidding process, and enabled the Connecticut Department of Public Utility Control (DPUC) to determine the program terms and conditions. Shortly thereafter, the DPUC initiated a docket to develop the program.15
The DPUC established several working groups of interested parties to develop consensus documents on program design and structure. The working groups focused on marketing and operations, treatment of renewable energy certificates (RECs), and the design of legal contracts and solicitations. On October 24, 2004, the DPUC issued a final decision regarding the structure for the “Alternative Transitional Standard Offer” (ATSO) program (later renamed CTCleanEnergyOptions), based on the consensus of the working groups. The DPUC instructed the distribution utilities to select at least two green power suppliers for the program, subject to the commission’s approval. Eligible resources were defined to include Connecticut Class I and Class II renewable resources (as defined for the state’s renewable portfolio standard)16 or Green-e certified resources. Although Green-e certification is not required, the product offerings must meet Green-e labeling and content disclosure guidelines, including product content and emissions impacts. The DPUC established a price cap for product offerings and allowed the use of RECs. Any RECs sourced from outside NEPOOL must be Green-e certified or accompanied by electricity wheeled into NEPOOL. The utilities evaluated proposals using criteria established by the working groups, with final selection subject to DPUC approval. Proposals were evaluated on the following factors: renewable energy supply and marketing experience, financial performance, price and resource mix, the number of service options proposed, and the marketing plan. Community Energy and Sterling Planet were selected as the suppliers for the initial three-year period, with both offering renewable energy blends for 50% and 100% of the customer’s electricity use (Table 7). The CTCleanEnergyOptions program was launched on April 1, 2005.
14 Connecticut Public Act 03-135, “An Act Concerning Revisions to the Electric Restructuring Legislation.” http://www.cga.ct.gov/2003/act/Pa/2003PA-00135-R00SB-00733-PA.htm 15 DPUC, Docket No. 03-07-16, Investigation of Alternative Transitional Standard Offer Services for United Illuminating and CL&P Customers. 16 Class I resources are defined as solar power, wind power, fuel cell, methane gas (landfill), ocean thermal, wave or tidal, run-of-river hydropower facilities (new and less than 5 MW), biomass (that does not result in depletion of resources, and low emission advanced renewable energy conversion technologies as well as electricity generated from any of these. Class II resources are defined as biomass and hydropower facilities (not qualifying under Class I) and producing minimal pollution.
23

Table 7. Products Offered Through the CTCleanEnergyOptions Program
Supplier/(Product) Product Content Product Price
50% Option 0.55¢/kWh Community Energy (NewWind Energy) 100% Option
50% Wind 50% Landfill Gas 1.10¢/kWh
50% Option 0.575¢/kWh Sterling Planet (Sterling Select) 100% Option
34% Landfill Gas 33% Wind 33% Small Hydro 1.15¢/kWh
The competitive suppliers lead the marketing effort, with assistance required from the utilities. The utilities must design (with input from stakeholders) and issue bill inserts twice annually (in the spring and fall) and provide the marketers with access to the program name and logo. The utilities also provide program information on their Web sites and provide scripts for call-center staff to handle program inquiries. At their discretion, the utilities can promote the program to their employees or retail customers, in concert with conservation and demand-side management programs and other utility-sponsored events. The two utilities have yet to pursue these optional activities, although the program is less than a year old. The utilities are also responsible for enrolling customers via the Electronic Data Interchange (EDI) standards that were adopted for enrollment of alternate generation-supplied customers; this method was also selected for the renewable energy program to minimize costs. The utilities accept the bill inserts returned with customer bill payments and forward these inserts to the suppliers. The costs incurred by the utility to administer and market the program, including issuing the bill inserts, are recoverable through customer rates. The direct product cost is reflected as a line item on the regular utility bill of participating customers. The marketers are responsible for all other program marketing, and for following the marketing plans submitted under the solicitation. They must also submit quarterly updates to the DPUC on the progress and effectiveness of the marketing campaign. While the utilities handle the bill insert enrollments, the marketers enroll those customers who respond by phone or through the Web site. The marketers send the enrollment information (including each customer’s account number) to the utilities, who verify that the customer is eligible and credit-worthy. For event sign-ups, the marketers can obtain a “wet signature” from customers, indicating enrollment interest. In these cases, the utilities have assisted the marketers by providing the account identifier necessary to process the EDI enrollment transaction. However, the provision of this assistance is not a requirement of the program and can be terminated if it becomes too time-consuming. This assistance has been very important for the marketers, who report typically losing 20% to 50% of customers who enroll at events if they must later contact the customer to obtain an account number. It also makes the program appear more integrated to customers, who expect the marketers to be able to access account information for a program offered in conjunction with the utility.
24

The CTCleanEnergyOptions program is also marketed by an independent nonprofit marketer, Smartpower, with support provided from the Connecticut Clean Energy Fund. SmartPower promotes the program through television and radio advertisements, Web sites,17 and working with community groups. Recently, SmartPower launched a “20% by 2010” campaign to encourage municipalities, faith communities, educational institutions, and businesses to purchase renewable energy for 20% of their electricity needs. The Connecticut Clean Energy Fund provides incentives to participating municipalities through the Connecticut Clean Energy Communities Program. Under the program, communities can receive free solar photovoltaic systems for community buildings by achieving specific participation goals.18 These programs have been effective in raising program awareness, generating local news coverage, and increasing enrollments. To coordinate marketing and implementation, the Connecticut Clean Energy Fund hosts monthly meetings of the program collaborators, including the utilities, marketers, DPUC, and SmartPower, to discuss implementation issues. All of the parties have found the meetings to be useful for resolving issues and for coordinating marketing efforts and messaging. Results and Lessons Learned Although in place for less than a year, the program has met its initial performance targets. The DPUC established enrollment goals of 2,000 customers per supplier in the first year, 3,000 per supplier after 18 months, and 4,000 per supplier within two years. The DPUC reports that more than 6,000 customers were participating in the program at the end of 2005, which represents an overall participation rate of 0.4% of eligible customers. Generally, the utilities, marketers, and DPUC have been pleased with the program design and the decision to select two marketers through a competitive solicitation. The program has been relatively easy to implement, and coordination among the parties has been manageable, given the limited number of parties involved. The parties also agree that the program structure adequately addresses competitive market issues. And because the program is meeting its performance targets, the collaborators generally consider it a success. However, the program has faced a considerable challenge from the use of RECs. Because the marketers procure only RECs (and not electricity) to supply the program, program customers are subject to the fuel-cost increases associated with the electricity they receive from the utility. Although this is a common supply structure for default-supplier programs, green power customers have expressed confusion and concern as their electricity rates have gone up in recent months. Some customers do not understand why they are subject to rate increases resulting from higher fossil-fuel prices, when they are supporting renewable energy to meet their own electricity
17 See the CTCleanEnergyOptions Web site at http://www.ctcleanenergyoptions.com. 18 Communities must commit to the “20% by 2010” campaign through a local town resolution and sign up
customers to the CTCleanEnergyOptions program. To be eligible for PV systems, they must achieve any one of three thresholds: (1) 100 or more customer sign-ups, (2) a commercial customer that signs-up to purchase at least 1 million kWh, or (3) a residential customer participation rate of 10% or more.
25
needs. This has been a significant public relations issue for the program, and the utilities, marketers, and PUC are working to collectively address it. Regarding product design, marketers have raised the concern that they are locked into the resource mix and product price (the price can go down but not up) for the period of the contract, which may prove to be a challenge over time. However, consistency in the product mix and price are beneficial to participating consumers. Other unique aspects of the program that have been deemed beneficial are the monthly meetings of the collaborators, which have allowed the parties to coordinate activities and resolve issues; and the use of “wet signatures,” which has enabled marketers to more easily enroll customers through events. Oregon: PacifiCorp and PGE In 1999, the Oregon State Legislature adopted legislation to restructure the state’s electricity market. The law required the state’s two investor-owned utilities— PacifiCorp (which operates as Pacific Power in Oregon) and Portland General Electric (PGE)—to offer a green power rate option to their residential and small commercial customers.19 Lawmakers sought to limit direct competitive market access to large commercial and industrial consumers but still provide retail product choices to smaller electricity customers. These alternative products were to be provided by the incumbent utilities. The Oregon Public Utility Commission (OPUC) established a stakeholder group to advise it on program structure and implementation. The Portfolio Options Committee (POC) is comprised of the utilities, nonprofits, community representatives, and other interested parties. In early 2001, the OPUC approved three renewable energy options: (1) a renewable resources block product, which allowed customers to buy one or more blocks of renewable power each month; (2) a blended renewable energy product containing a minimum of 50% renewable energy with at least 15% coming from new renewable sources;20 and (3) an “environmental mitigation product,” which allowed customers purchasing the blended product to contribute an additional amount to be directed toward restoration of threatened or endangered fish species. Minimum product-content standards, such as for new renewable energy content, were also established.21
With the advent of retail competition in 2002, the two utilities were required to solicit a single green energy marketer to supply and market the “renewable usage” and “habitat” programs for an initial 24-month period.22 The utilities were allowed to market the “block” products as separate utility products. Both utilities selected Green Mountain Energy Company as their marketing partner. 19 Oregon Legislative Assembly, Senate Bill 1149, June 1999. http://www.puc.state.or.us/PUC/electric_restruc/billsum/sb1149.pdf 20 The remaining product content had to meet regional system average emissions as well as the state's siting standard for carbon dioxide emissions. 21 The standards were based on the Renew 2000 green power product certification program for the Pacific Northwest, which has since merged with the Green-e program. 22 See Oregon Public Utility Commission, Direct Access Regulation: http://arcweb.sos.state.or.us/rules/OARS_800/OAR_860/860_038.html
26

The utilities also opted to co-brand the products. The “renewable usage” product, marketed under the brand “Green Mountain Energy Electricity,” was a blend of new wind (15%) and existing geothermal sources (85%). The “habitat” product, dubbed “Green Mountain Energy Salmon Friendly Plan,” offered the same renewable energy blend with the additional contribution dedicated to the Pacific Salmon Watershed Fund (Table 8).
Table 8. Products Offered in Phase 1 of Oregon Portfolio Program (2002–2003)
Utility Product Price Product Content
Fixed Renewable 2.95¢/kWh 100% New Wind
Renewable Usage* 0.78¢/kWh 85% Geothermal 15% New Wind PacifiCorp
Habitat* 0.78¢/kWh + $2.50 per
month for salmon restoration
85% Geothermal 15% New Wind
Fixed Renewable 3.50¢/kWh 100% New Wind
Renewable Usage* 0.80¢/kWh 85% Geothermal 15% New Wind Portland General
Electric
Habitat* 0.80¢/kWh + $2.50 per
month for salmon restoration
85% Geothermal 15% New Wind
* Product marketed in partnership with Green Mountain Energy Company.
As the program progressed, a number of issues and challenges arose that required attention, including: 1) the relatively short contract length between the utilities and the supplier; 2) the potential to confuse or alienate customers with changes in the product content, price, or branding; and 3) the disincentives for marketers to expend significant marketing resources in the final contract year. With respect to contract length, the utilities and marketer found that the two-year contract period was too short a period for the marketer to recover its marketing investments. In addition, it challenged the ability of the parties to develop a broad working relationship and for the marketer to learn the intricacies of the program and the marketing territory. To address these concerns, the OPUC extended the contract period from two to three years for the second program solicitation. In 2005, the OPUC also granted the utilities the option of extending the marketing contract for up to three years before issuing another competitive solicitation. Both the utilities and marketers supported this change. To help address the issue of product quality and consistency, the OPUC increased the new renewable energy content requirement for the blended product to 30%, because the initial product offerings had exceeded the minimum requirements, and all stakeholders wanted to
27

ensure continuous improvement. Also, local resources were now given preference in the selection process.23 The two utilities also sought to address these challenges individually, with each taking different approaches. For the second-round solicitation, PacifiCorp made several RFP modifications to encourage product consistency, including setting a price target. PacifiCorp was able to secure two products from a new partner, 3 Phases Energy Services, with 100% new renewable energy content at the same price as the Phase 1 product offerings. By improving the product content—while keeping the price constant—the parties avoided a backlash from customers, who might otherwise have been dissatisfied with a product change. The two parties also agreed to promote the products under the utility’s “Blue Sky” brand, which is used for PacifiCorp’s green power block product, thereby eliminating concerns about introducing a new brand. Finally, PacifiCorp modified the contract by tying required marketing expenditures to MWh sales to encourage continued marketing of the program throughout the contract period. The initial contract simply specified a set dollar amount to be spent on marketing over the contract period. Instead of issuing a second competitive solicitation, PGE incorporated a number of changes in its contract with Green Mountain Energy. The two parties agreed to market the products under the utility’s brand, with new product names of “Green Source” and “Healthy Habitat.” In addition, they improved the products by increasing the new wind energy content to 50%, while maintaining the same product price. Finally, PGE modified the contract to encourage marketing through the end of the contract period, by including performance incentives and by specifying a marketing expenditure amount in the last year of the contract. The two parties also agreed to a series of annual reviews followed by rolling contract extensions, and are currently negotiating a contract extension through the end of 2008. Table 9 shows the changes in the Phase 2 products. The respective program roles of the utilities and marketers have evolved somewhat over time; but, generally, the utilities handle the program administration—including processing enrollments, tracking customers, managing customer contact, and conducting market research—while the marketers lead the marketing activities. The utility collaborates with its marketer partner on the marketing campaigns for all three green power options, including the utility’s independent offering. The utilities work with the marketers to establish joint business objectives and develop marketing materials, and approve all marketing materials and messaging to ensure that they conform to company standards. And the marketers lead promotional interactions with the public, such as presentations, events, and community-based marketing efforts. The POC stakeholder group plays a continuing role in guiding and coordinating marketing efforts by the utilities, marketers, and external stakeholders (such as environmental organizations) who help promote the program to local businesses and communities. The POC meetings provide an arena for the parties to plan and coordinate marketing activities and discuss strategies for expanding the program. The POC also makes recommendations for modifying the program requirements as issues arise.
23 Public Utility Commission of Oregon, Order 03-208, April 9, 2003, Portfolio Advisory Committee, Recommendations for Renewable Portfolio Options, http://www.puc.state.or.us/PUC/electric_restruc/advcomm/03mtngs/03_208.pdf.
28

Table 9. Products Offered in Phase 2 of Oregon Portfolio Program (2004–2006)
Utility Product Price Product Content
Blue Sky Block 1.95¢/kWh 100% New Wind
Blue Sky Usage* 0.78¢/kWh 61% New Wind 38% Biomass 1% Solar PacifiCorp
Blue Sky Habitat* 0.78¢/kWh + $2.50 per
month for salmon restoration
61% New Wind 38% Biomass 1% Solar
Clean Wind 1.75¢/kWh 100% New Wind
Green Source* 0.80¢/kWh 50% New Wind 25% Geothermal 25% Small Hydro
Portland General Electric
Healthy Habitat* 0.80¢/kWh + $2.50 per
month for salmon restoration
50% New Wind 25% Geothermal 25% Small Hydro
* PacifiCorp product marketed in partnership with 3 Phases Energy Services. ** PGE product marketed in partnership with Green Mountain Energy Company.
Results and Lessons Learned The Oregon model is unique in using a single-marketer approach to provide multiple product options to customers, as a substitute for full retail access to competitive suppliers. Based on several years of program experience, the utilities, regulators, and marketers have all been pleased with this approach, and there is general consensus that the competitive solicitation adequately addresses competitive market issues. According to the utilities, the use of a single marketer is advantageous, because it is much easier to manage the partnership and customer impacts when there are not multiple parties involved. In addition, by working with a single marketer, the utility is able to develop a true partnership and working relationship through which the program can be promoted collaboratively. The Oregon programs have been successful as measured by a number of factors. Both programs have consistently ranked among the top 10 nationally in terms of customer participants and renewable energy sales (Table 10). While both programs ranked high prior to the partnership program, they experienced a surge in enrollments in 2002 (roughly a threefold increase), when the third-party marketer model was introduced—and the programs have continued to grow substantially over time. Further, both utilities indicate that the programs have met or exceeded goals and metrics. PacifiCorp thinks that while partnering has had a positive impact on the program’s success, the program would have been successful without the introduction of a third-party marketer. According to the utilities, the primary advantages of partnering include gaining additional resources to promote the program, as well as access to new ideas that enable the utility to “think
29
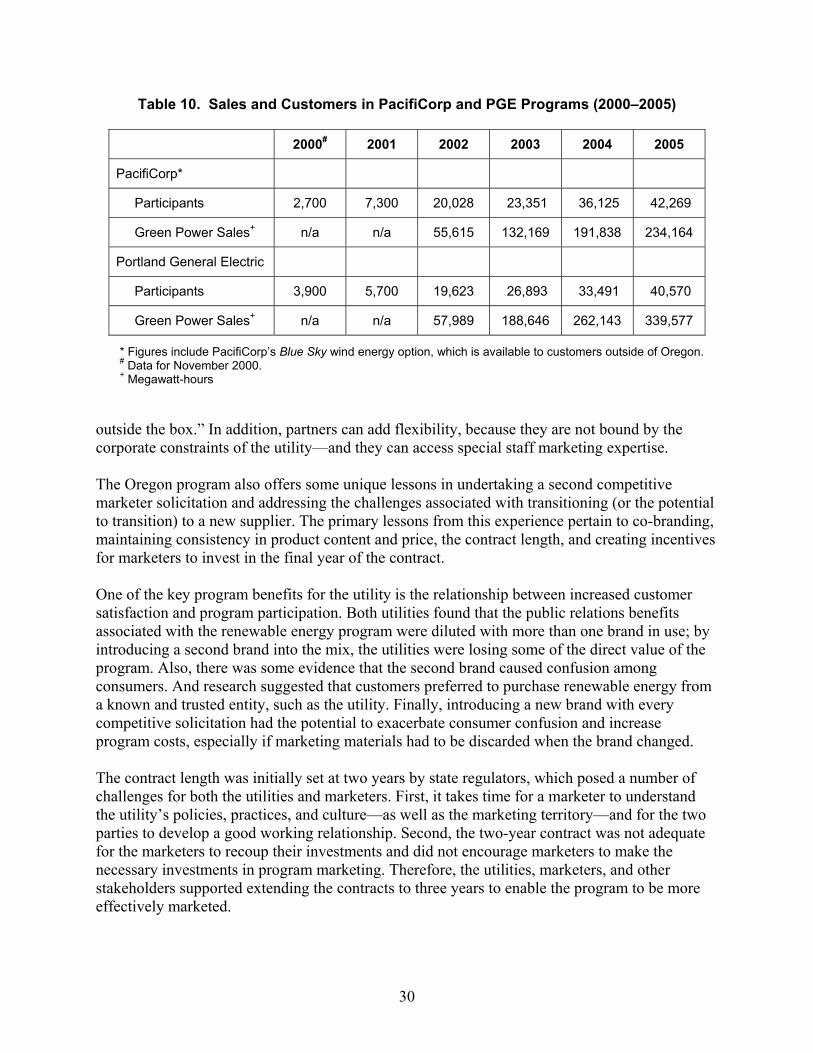
Table 10. Sales and Customers in PacifiCorp and PGE Programs (2000–2005)
2000# 2001 2002 2003 2004 2005
PacifiCorp*
Participants 2,700 7,300 20,028 23,351 36,125 42,269
Green Power Sales+ n/a n/a 55,615 132,169 191,838 234,164
Portland General Electric
Participants 3,900 5,700 19,623 26,893 33,491 40,570
Green Power Sales+ n/a n/a 57,989 188,646 262,143 339,577
* Figures include PacifiCorp’s Blue Sky wind energy option, which is available to customers outside of Oregon. # Data for November 2000. + Megawatt-hours
outside the box.” In addition, partners can add flexibility, because they are not bound by the corporate constraints of the utility—and they can access special staff marketing expertise. The Oregon program also offers some unique lessons in undertaking a second competitive marketer solicitation and addressing the challenges associated with transitioning (or the potential to transition) to a new supplier. The primary lessons from this experience pertain to co-branding, maintaining consistency in product content and price, the contract length, and creating incentives for marketers to invest in the final year of the contract. One of the key program benefits for the utility is the relationship between increased customer satisfaction and program participation. Both utilities found that the public relations benefits associated with the renewable energy program were diluted with more than one brand in use; by introducing a second brand into the mix, the utilities were losing some of the direct value of the program. Also, there was some evidence that the second brand caused confusion among consumers. And research suggested that customers preferred to purchase renewable energy from a known and trusted entity, such as the utility. Finally, introducing a new brand with every competitive solicitation had the potential to exacerbate consumer confusion and increase program costs, especially if marketing materials had to be discarded when the brand changed. The contract length was initially set at two years by state regulators, which posed a number of challenges for both the utilities and marketers. First, it takes time for a marketer to understand the utility’s policies, practices, and culture—as well as the marketing territory—and for the two parties to develop a good working relationship. Second, the two-year contract was not adequate for the marketers to recoup their investments and did not encourage marketers to make the necessary investments in program marketing. Therefore, the utilities, marketers, and other stakeholders supported extending the contracts to three years to enable the program to be more effectively marketed.
30

Another challenge was maintaining marketing expenditures near the end of the contract period. Without incentives, the marketers had little reason to continue marketing the program because of the risk of losing the contract in a competitive rebid. To prevent gaps in program marketing, the utilities modified their contracts to provide incentives or specific requirements to continue the marketing effort in the final year of the contract.
31
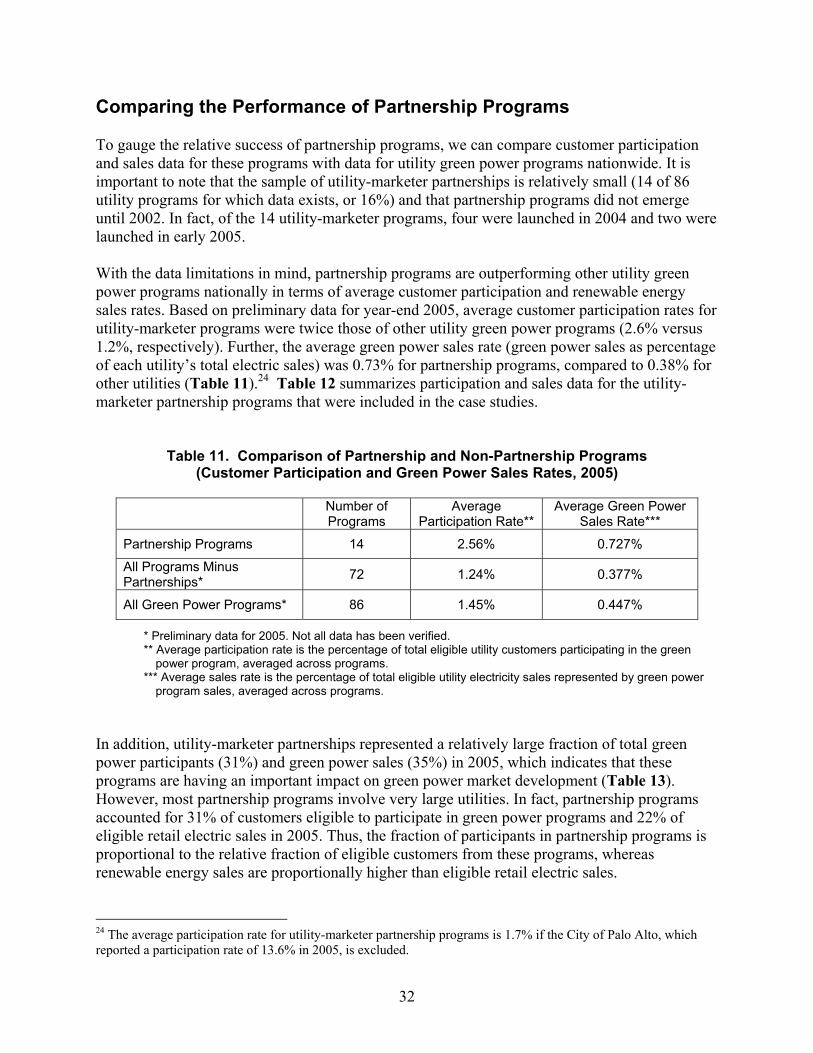
Comparing the Performance of Partnership Programs To gauge the relative success of partnership programs, we can compare customer participation and sales data for these programs with data for utility green power programs nationwide. It is important to note that the sample of utility-marketer partnerships is relatively small (14 of 86 utility programs for which data exists, or 16%) and that partnership programs did not emerge until 2002. In fact, of the 14 utility-marketer programs, four were launched in 2004 and two were launched in early 2005. With the data limitations in mind, partnership programs are outperforming other utility green power programs nationally in terms of average customer participation and renewable energy sales rates. Based on preliminary data for year-end 2005, average customer participation rates for utility-marketer programs were twice those of other utility green power programs (2.6% versus 1.2%, respectively). Further, the average green power sales rate (green power sales as percentage of each utility’s total electric sales) was 0.73% for partnership programs, compared to 0.38% for other utilities (Table 11).24 Table 12 summarizes participation and sales data for the utility-marketer partnership programs that were included in the case studies.
Table 11. Comparison of Partnership and Non-Partnership Programs (Customer Participation and Green Power Sales Rates, 2005)
Number of
Programs Average
Participation Rate** Average Green Power
Sales Rate***
Partnership Programs 14 2.56% 0.727%
All Programs Minus Partnerships* 72 1.24% 0.377%
All Green Power Programs* 86 1.45% 0.447% * Preliminary data for 2005. Not all data has been verified. ** Average participation rate is the percentage of total eligible utility customers participating in the green
power program, averaged across programs. *** Average sales rate is the percentage of total eligible utility electricity sales represented by green power
program sales, averaged across programs. In addition, utility-marketer partnerships represented a relatively large fraction of total green power participants (31%) and green power sales (35%) in 2005, which indicates that these programs are having an important impact on green power market development (Table 13). However, most partnership programs involve very large utilities. In fact, partnership programs accounted for 31% of customers eligible to participate in green power programs and 22% of eligible retail electric sales in 2005. Thus, the fraction of participants in partnership programs is proportional to the relative fraction of eligible customers from these programs, whereas renewable energy sales are proportionally higher than eligible retail electric sales.
24 The average participation rate for utility-marketer partnership programs is 1.7% if the City of Palo Alto, which reported a participation rate of 13.6% in 2005, is excluded.
32
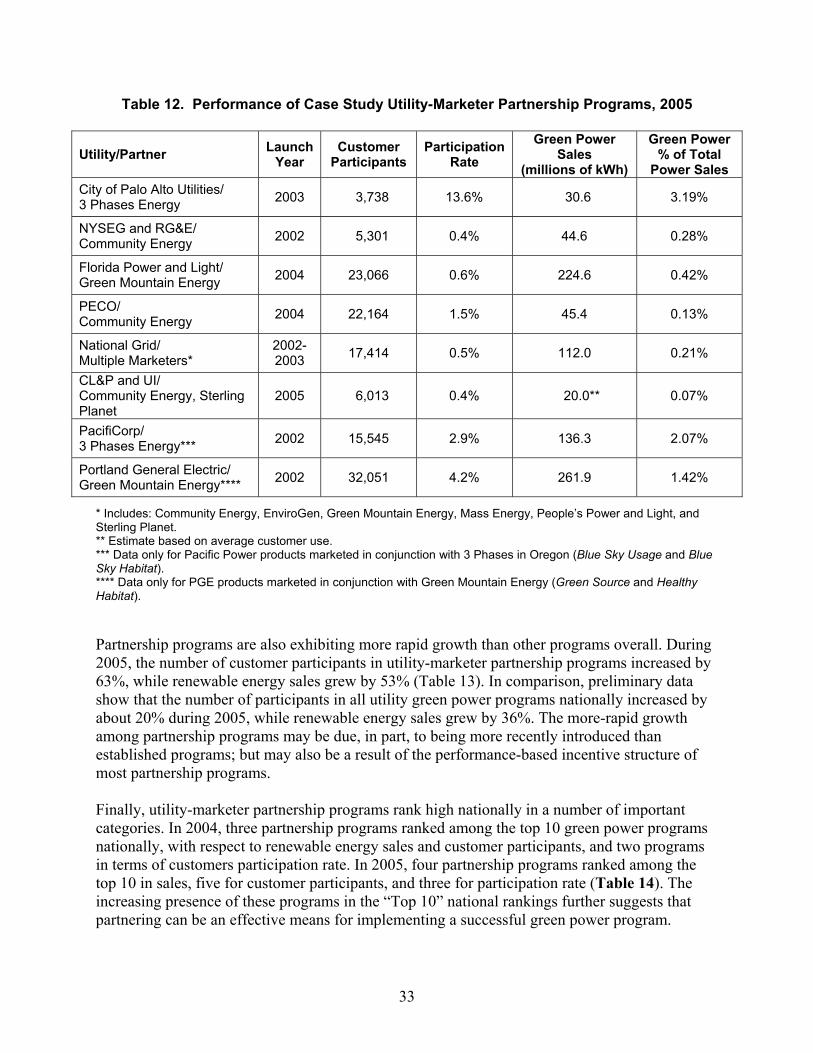
Table 12. Performance of Case Study Utility-Marketer Partnership Programs, 2005
Utility/Partner Launch Year
Customer Participants
ParticipationRate
Green Power Sales
(millions of kWh)
Green Power % of Total
Power Sales City of Palo Alto Utilities/ 3 Phases Energy 2003 3,738 13.6% 30.6 3.19%
NYSEG and RG&E/ Community Energy 2002 5,301 0.4% 44.6 0.28%
Florida Power and Light/ Green Mountain Energy 2004 23,066 0.6% 224.6 0.42%
PECO/ Community Energy 2004 22,164 1.5% 45.4 0.13%
National Grid/ Multiple Marketers*
2002- 2003 17,414 0.5% 112.0 0.21%
CL&P and UI/ Community Energy, Sterling Planet
2005 6,013 0.4% 20.0** 0.07%
PacifiCorp/ 3 Phases Energy*** 2002 15,545 2.9% 136.3 2.07%
Portland General Electric/ Green Mountain Energy**** 2002 32,051 4.2% 261.9 1.42%
* Includes: Community Energy, EnviroGen, Green Mountain Energy, Mass Energy, People’s Power and Light, and Sterling Planet. ** Estimate based on average customer use. *** Data only for Pacific Power products marketed in conjunction with 3 Phases in Oregon (Blue Sky Usage and Blue Sky Habitat). **** Data only for PGE products marketed in conjunction with Green Mountain Energy (Green Source and Healthy Habitat). Partnership programs are also exhibiting more rapid growth than other programs overall. During 2005, the number of customer participants in utility-marketer partnership programs increased by 63%, while renewable energy sales grew by 53% (Table 13). In comparison, preliminary data show that the number of participants in all utility green power programs nationally increased by about 20% during 2005, while renewable energy sales grew by 36%. The more-rapid growth among partnership programs may be due, in part, to being more recently introduced than established programs; but may also be a result of the performance-based incentive structure of most partnership programs. Finally, utility-marketer partnership programs rank high nationally in a number of important categories. In 2004, three partnership programs ranked among the top 10 green power programs nationally, with respect to renewable energy sales and customer participants, and two programs in terms of customers participation rate. In 2005, four partnership programs ranked among the top 10 in sales, five for customer participants, and three for participation rate (Table 14). The increasing presence of these programs in the “Top 10” national rankings further suggests that partnering can be an effective means for implementing a successful green power program.
33

Table 13. Comparison of Partnership and Non-Partnership Programs (Total Participants and Green Power Sales, 2004–2005)
2004 2005* Increase
Partnership Green Power Programs
Participants 83,000 135,000 63%
Green Power Sales 618,000 944,000 53%
All Utility Green Power Programs
Participants 362,000 435,000 20%
Green Power Sales 1,975,000 2,694,000 36%
Partner Programs as % of All Utility Green Power Programs
Participants 23% 31% ----
Sales 31% 35% ---- *Preliminary data for 2005. Not all data has been verified.
Table 14. Utility-Marketer Partnership National Rankings, 2005
Criteria Rank Utility/Partner(s)
Green Power Sales
2 3 4 7
Portland General Electric/ Green Mountain Energy
Pacificorp/3 Phases Energy Florida Power & Light/Green Mountain Energy
National Grid/Various*
Customer Participants
2 3 6 7 8
Pacificorp/3 Phases Energy
Portland General Electric/Green Mountain Energy Florida Power & Light/Green Mountain Energy
PECO/Community Energy National Grid/Various*
Customer Participation
Rate
1 6 8
City of Palo Alto Utilities/3 Phases Energy
Portland General Electric/Green Mountain Energy Silicon Valley Power/3 Phases Energy
* Program offered in conjunction with Community Energy, EnviroGen, Green Mountain Energy, Mass Energy, People's Power & Light, and Sterling Planet. http://www.eere.energy.gov/greenpower/markets/pricing.shtml?page=3
34

Key Factors for Successful Partnerships While utility-marketer partnerships have proven successful in many cases, they do not ensure the success of a green power program. Any program can fail if not properly designed and implemented, or if management commitment is lacking. However, third-party marketers bring specific renewable energy procurement and marketing expertise that may be lacking in the utility. Further, partnerships can leverage the unique strengths of both the utility and marketer, and create greater incentives for program success. The success of partnership programs also depends on how the partnership itself is structured, including the respective partner roles, the contract terms, and other implementation details. Based on interviews with utilities, marketers, and regulators, as well as the case studies presented, we have identified a number of factors that are critical to success. While some factors depend on whether the partnership is voluntary or mandatory, others are broadly applicable. We present the general factors first, followed by specific factors relevant to voluntary and mandatory (primarily default-supplier programs) partnerships. General Success Factors • Active Participation by Both Parties—It is important to have both parties fully engaged in the
program. Utilities must actively promote the program in conjunction with the marketer(s). Utilities can leverage ongoing activities (e.g., existing marketing activities), and facilitate marketer access to various utility departments. In addition, the partnership must be designed to create sufficient incentives for the marketer to be fully vested. Marketers are more likely to invest resources in the program, if the utility also invests resources and provides program support.
• Contract Terms/Delineation of Risk—The division of risk between the utility and marketer
does not appear to be important, as long as the parties are adequately compensated for their respective risks. Program risks include start-up costs such as the initial investment in marketing and program launch, modifying the billing system, establishing systems to handle customer inquiries, creating a program Web site, and procuring renewable energy supplies. Typically, program revenues are generated on a per-MWh sales basis and divided according to the respective program investments. Utilities reap significant public relations benefits from offering a green power program, which should be considered when determining the contract terms and division of labor and revenues.
Partnerships have been successful, both in cases where the risks and start-up costs are shared fairly evenly between the utility and the marketer, and where the marketer assumes the majority of the risk. The willingness of the marketer to assume greater risk depends largely on the length of the contract. In Oregon, the parties found that the initial two-year contract cycle was too short to allow marketers time to form a working relationship with the utility, understand the program and marketing service territory, and recoup marketing investments. Most marketers prefer contract periods of at least three to five years to provide adequate time to recoup start-up costs and generate a profit. Contracts longer than five years provide greater
35

flexibility and enable the marketer to invest more marketing dollars and undertake a wider array of marketing techniques, including some that are more expensive. However, from the utility’s perspective, long-term contracts may have some disadvantages by locking in a partner and losing the ability to re-compete the contract or address performance issues. If a long-term contract is used, the utility should incorporate conditions to ensure that the marketer continues to invest in the program, such as setting minimum marketing standards and annual performance targets.
• Transitioning Suppliers/Re-competing Contracts—Transitional issues arise when a utility switches marketers. If the switch causes significant changes in product design or price, customers can become confused. Thus, it is important to establish product quality and price standards to ensure consistency or continued improvement, in the event that new marketers are retained. Co-branding can also be problematic if marketers change over time. Finally, it is important to structure contracts to ensure that marketing continues in the final year, if the current marketer is not retained.
• Performance Targets—It is helpful to establish annual or periodic performance targets—such
as number of customers enrolled and MWh sales—to evaluate program performance and to ensure that the parties have similar expectations. Although it may be difficult to determine appropriate metrics for the early years, these can be adjusted periodically to reflect market conditions and past performance. In later years, performance metrics are particularly important to ensure that marketing efforts are sustained.
• Green Power Billing—One important value that the utility brings to the partnership is
existing mechanisms to bill and communicate with customers. It is most efficient and cost-effective to use these systems for program implementation. The green power charge should appear on the customer’s regular utility bill. If customers receive a separate bill, the program appears disconnected from the utility, and the benefits of the credibility that the utility has with its customers may be lost. Customers may also question the legitimacy of the program. Finally, customers view it as a hassle to receive more than one bill, which can discourage participation.
Voluntary Programs • Utility Champion/Integrating Program Within the Utility—Voluntary utility-marketer
programs are more likely to succeed if there is an internal champion at the utility. A dedicated and enthusiastic program manager is important for facilitating access to internal resources and convincing internal staff to support the program. Marketers need support from, and access to, a variety of utility resources and departments, such as the call center, mail house, the billing department, and corporate communications. Marketers will invest time and energy in programs where the utility is actively supportive, because this is where they will likely receive the greatest financial returns.
• Leveraging Other Utility Marketing Activities—Another key role of the utility is determining
how to leverage its ongoing marketing efforts to promote the green power program. Leveraging existing activities (events, sponsorships, marketing for related programs, etc.) can
36

be very cost-effective and free up the marketer’s resources for supplemental activities, essentially increasing the overall program marketing budget.
• Number of Marketers—For voluntary programs, the single-marketer approach is preferred,
because it enables the parties to work together closely and form a true partnership. It also provides greater incentive for the marketer to be engaged in the program, and avoids the complexities of involving multiple marketers. If the utility’s primary partnering motive is to improve program success, there is no benefit in adding multiple marketers.
• Co-branding—Unless clear advantages to co-branding are identified, promoting the program
through the utility’s brand is the preferred approach because it is simpler to implement and avoids confusing customers. The use of multiple brands and logos can create difficulties in preparing marketing materials with limited space. One utility found that consumer response to its program increased substantially after switching from co-branding to the single utility brand. Co-branding can also be problematic for programs in which a new marketer may be selected periodically.
• Flexibility—Both the utility and the marketer need to be flexible to achieve an effective
working relationship. Marketers often bring new ideas and approaches that are not traditionally used by utilities, but are effective for reaching green power customers. If the utility is unwilling to try new approaches, then some advantages of the partnership may be lost.
• Data for Targeting and Analysis—Targeting can be effective in reducing customer-
acquisition costs and improving the efficiency of marketing efforts. Marketers may bring expertise in targeting that can be utilized if they have access to the necessary data. Utilities must be willing to share this data.
• Enrollment/Billing—Generally, the best practice is to have the utility handle customer
enrollments and billing. This is the most cost-effective approach, because the utility already has procedures to handle customer service and billing. In cases where the utility has been unable to modify its billing system to add the green power charge, this has been a barrier to enrollment.
Mandatory Programs • Utility Role in Marketing and Implementation—For default-supplier programs that are
designed to replace or stimulate retail competition (e.g., in Connecticut and New Jersey), the utilities are typically not vested in the success of the program, and simply view themselves as the vessel to allow marketers access to retail customers. Therefore, the challenge is to create a program environment in which marketers can succeed. It is important to specify the marketing role of the utility up-front. Most marketers report that it is also important for the utility to issue at least two bill inserts annually—and more are better. Many voluntary partnership programs use bill inserts much more frequently, as many as eight or more per year. Moreover, marketers are more engaged in programs where the utility pays for the bill
37

inserts (sometimes through public benefits funds), which can be justified because the utility shares in the public relations benefits of the program.
• Number of Marketers—For programs offered in competitive electricity markets, determining
the appropriate number of marketers to include involves weighing issues of creating competition and providing choices against ease of implementation and effectiveness in achieving customer enrollments. The Oregon model, which involves a single marketer selected through a competitive solicitation, effectively balances these concerns. This approach creates a true partnership among the utility and marketer, while eliminating the need for the utility to be a neutral party in offering green power choices. The utility can be more active in promoting the program, and the marketer has greater incentive to invest in marketing. And the single-marketer approach avoids the complexity and marketing challenges of programs involving multiple marketers and product choices. On the other hand, in some states, the single-marketer approach may be politically unpalatable and viewed as out-of-step with retail access. In this case, a two-marketer model may be the preferred approach, as in Connecticut. This model helps to mitigate concerns about program complexity, customer confusion, marketing difficulties, and lack of investment by marketers.
• Product Design Criteria—Particularly for programs with multiple marketers, it is important to establish product-design criteria or require certification to set a floor for product quality, and create a level playing field among the marketers. Minimum standards should be established for resource mix, plant vintage (i.e., new versus existing), geographic location of sources, and verification, to assure that products provide the expected environmental benefits. Product standards also help avoid a “race to the bottom,” where marketers compete only on price. Further, product standards can protect against “bait-and-switch” tactics, where a marketer may advertise an attractive product but offer it only very briefly. The standard setting process should consider difficulties that marketers may face if required to lock into a particular product for an extended period of time, as market conditions may change.
• Customer Communications—To maximize program participation, it is important to structure
information channels to maximize marketer access to customers—the marketers are the most knowledgeable about their products, are best able to communicate the benefits, and are most focused on enrolling customers. Because the utility must be neutral in providing information, it is best to limit reliance on “in-house” utility communication channels and instead encourage direct communication between marketers and customers. This also minimizes the number of steps customers must endure to enroll in the program.
• Data Access/Customer Account Numbers—One issue raised consistently by marketers in
default-supplier programs is the lack of access to customer account numbers, which are required to process enrollments. Typically, states limit marketer access to customer account numbers to prevent “slamming,” or the practice of enrolling customers without their permission. However, this has proven to be a significant barrier to enrolling customers in green power programs, with some marketers reporting losing on the order of 20% to 50% of customers who register at events. When marketers must follow-up with these customers to
38
obtain their account numbers, it creates customer confusion and additional expense for the marketer. One solution that balances consumer protection and marketer concerns is to require a “wet signature” for customers who enroll at events, which the marketers can then use to obtain the account number from the utility. This approach has been effective in Connecticut.
• Coordination and Ongoing Communication—Particularly for programs that involve multiple
utilities and marketers, ongoing communication among the program participants is helpful. The Connecticut Clean Energy Fund facilitates monthly meetings among the utilities, marketers, PUC staff, and other stakeholders. All parties have found the interactions to be useful in resolving program issues and helping to coordinate messaging.
• Statewide Access—Statewide implementation of mandatory programs is preferred, as
opposed to individual utility mandates. Because individual utility service territories often cut across media markets, marketers have found it easier to communicate the availability of green power options across the entire state. Statewide access also enables marketers to promote the program in conjunction with special interest groups, such as environmental organizations, who may have members in different utility service territories. And, finally, statewide implementation allows for supplemental marketing support, such as in Connecticut, where a statewide program to engage local communities has been particularly effective.
39
Summary and Conclusions Strategic partnerships between utilities and marketers can be an effective approach to marketing green power. Partnerships offer the advantage of leveraging the marketer’s experience with selling green power and procuring renewable energy supplies, and the utility’s reputation and access to customers. Further, partnerships can create greater incentives for success because marketers have a vested financial interest in maximizing customer participation and green power sales. Interviews with utilities, marketers, and regulators involved in partnership programs found general consensus that these partnerships can significantly improve the performance of green power programs. Available data, though limited, show that partnership programs have been more successful, on average, than “in-house” utility programs, as measured by customer participation rate and the percentage of total utility electric sales represented by green power. Utilities generally benefit from teaming with independent renewable energy marketers if they have limited experience in procuring renewable energy supplies, marketing renewable energy or other value-added products, or want to reduce the risks of offering renewable energy options to their customers. In states with competitive retail electricity markets, partnership programs involving default suppliers and marketers can provide easily accessible green product choices for residential and small commercial customers, where they might not exist otherwise. However, partnerships can fail if the program or partnering arrangement is poorly designed and implemented. To be most effective, it is important that both parties be adequately compensated and actively engaged in the program operation. Because marketers are typically paid for performance, they are most likely to invest their time and energy in programs where the utility is supportive and actively works to make the program a success. Utility-marketer partnerships, in which both parties are vested in the success of the program, have been effective both at large and small utilities, and in regulated and competitive electricity markets.
40

F1147-E(12/2004)
REPORT DOCUMENTATION PAGE Form Approved OMB No. 0704-0188
The public reporting burden for this collection of information is estimated to average 1 hour per response, including the time for reviewing instructions, searching existing data sources, gathering and maintaining the data needed, and completing and reviewing the collection of information. Send comments regarding this burden estimate or any other aspect of this collection of information, including suggestions for reducing the burden, to Department of Defense, Executive Services and Communications Directorate (0704-0188). Respondents should be aware that notwithstanding any other provision of law, no person shall be subject to any penalty for failing to comply with a collection of information if it does not display a currently valid OMB control number. PLEASE DO NOT RETURN YOUR FORM TO THE ABOVE ORGANIZATION. 1. REPORT DATE (DD-MM-YYYY)
April 2006 2. REPORT TYPE
Technical Report 3. DATES COVERED (From - To)
5a. CONTRACT NUMBER
DE-AC36-99-GO10337
5b. GRANT NUMBER
4. TITLE AND SUBTITLE Utility-Marketer Partnerships: An Effective Strategy for Marketing Green Power?
5c. PROGRAM ELEMENT NUMBER
5d. PROJECT NUMBER NREL/TP-620-39730
5e. TASK NUMBER ASG5.1005
6. AUTHOR(S) L.A. Bird and E.S. Brown
5f. WORK UNIT NUMBER
7. PERFORMING ORGANIZATION NAME(S) AND ADDRESS(ES) National Renewable Energy Laboratory 1617 Cole Blvd. Golden, CO 80401-3393
8. PERFORMING ORGANIZATION REPORT NUMBER NREL/TP-620-39730
10. SPONSOR/MONITOR'S ACRONYM(S) NREL
9. SPONSORING/MONITORING AGENCY NAME(S) AND ADDRESS(ES)
11. SPONSORING/MONITORING AGENCY REPORT NUMBER
12. DISTRIBUTION AVAILABILITY STATEMENT National Technical Information Service U.S. Department of Commerce 5285 Port Royal Road Springfield, VA 22161
13. SUPPLEMENTARY NOTES
14. ABSTRACT (Maximum 200 Words) This paper explores whether partnerships between utilities and independent marketers are an effective strategy for marketing green power. We present case studies of voluntary and mandatory partnerships covering green power program design and implementation in both regulated and restructured electricity markets. We also include perspectives (based on interviews) from utilities, marketers, and regulators involved in developing and implementing these partnerships. From these case studies and interviews, we describe lessons learned about developing effective partnerships, including such issues as respective roles in marketing and administration, product branding, and contract and incentive structures. Based on experience to date, strategic partnerships between utilities and marketers can be an effective approach to marketing green power. Partnerships leverage the sales and resource procurement experience of marketers and the utility’s reputation and access to customers. Further, partnerships can create greater incentives for success because marketers have a vested financial interest in maximizing customer participation and green power sales.
15. SUBJECT TERMS green power; marketing green power; product branding; utilities; public utility commission; green power incentives; green power sales; Lori Bird; Elizabeth Brown.
16. SECURITY CLASSIFICATION OF: 19a. NAME OF RESPONSIBLE PERSON a. REPORT
Unclassified b. ABSTRACT Unclassified
c. THIS PAGE Unclassified
17. LIMITATION OF ABSTRACT
UL
18. NUMBER OF PAGES
19b. TELEPHONE NUMBER (Include area code)
Standard Form 298 (Rev. 8/98) Prescribed by ANSI Std. Z39.18