utility of bottom-up and top-down o&g emission inventory
TRANSCRIPT

Utility of Bottom-up and Top-down O&G Emission Inventory estimates for air quality
management purposes
Tom Moore WRAP/WESTAR
Data Workshop
Spring 2015 Measurements in Oil and Gas Production Regions
NOAA Earth System Research Laboratory Boulder, CO
October 19, 2015

Mary Uhl New Mexico State Office, BLM
Santa Fe, NM
Amnon Bar-Ilan and John Grant Ramboll Environ
Novato, CA
Kathleen Sgamma Western Energy Alliance
Denver, CO
Doug Henderer Newfield Exploration
Denver, CO
Lee Gribovicz Airstar Consulting
Acknowledgements

The Clean Air Act (CAA) • Federal Clean Air Act - major revisions 1970, 1977, 1990
– Establishes regulatory authorities and structures to manage air pollution for the entire U.S.
– Series of Titles in CAA lay out specific and broad authorities • Complex requirements for EPA and states have evolved with more than
20 years of interpretation since last major update – Clearly establishes federal–state partnership to regulate and manage
air pollution • Local air quality control agencies (county or district) and tribes can be
“treated as states” – 1990 Amendments established and/or revised
• Specific requirements to correct NAAQS nonattainment • Permitting programs for major and minor stationary sources • New Source Review (NSR) in NAAQS nonattainment areas • Prevention of Significant Deterioration (PSD) in other areas • Additional protection for Class I areas

National Environmental Policy Act (NEPA) • NEPA requires federal agencies to consider the environmental
impacts of their proposed actions and reasonable alternatives to those actions
• Federal agencies prepare an Environmental Impact Statement (EIS) or Environmental Assessment (EA) for oil and gas development on federal lands
• Vast majority of O&G NEPA actions are by U.S. Bureau of Land Management, a lesser number by the US. Forest Service
– BLM controls much of the mineral estate in the West, separate from surface ownership
– Once development is authorized by the federal agency through the NEPA process, air emissions become the responsibility of the states, or the EPA regional office in the case of tribal lands

2006 Oil and Gas Production
Air Quality Planning in Eastern Utah
BLM proposed leasing for oil shale development
BLM proposed leasing for tar sands development
“Indian Country” – Regulatory authority controlled by the Tribes and EPA
Oil Shale Leasing
Tar Sands Leasing
“Indian Country”

CAA Emissions Inventories
• Emissions are what is regulated, not ambient air quality - through:
– Limits on permitted sources and tracking of actual emissions • Strategies that address group or types of sources by specifying
technology for operations (fuels, turnover of technology) or controls (specified emissions limits)
• Fees for permitted sources allow regulators to recover costs to issue, inspect, and monitor impacts
– Reporting and analysis of inventory data allows trend and compliance tracking
• A heightened effort is required to build and understand a baseline historical period inventory for a modeling study
• Modeling studies also require projections of future emissions to assess control programs to efficient emissions reduction strategies

7
Regulatory-grade emissions inventories - permits
Permitted “point” sources - what are they? – States, Tribes and EPA issue permits with
emission limits – Regulation of point sources varies by jurisdiction
• Permitting thresholds • Actual emissions are less • Inventories tally up tons of emissions from source types
– Periodic testing and inspections are also done to verify compliance with permit conditions
– Best-understood emissions are from permitted sources

Wide variation among states in permitting/reporting thresholds
Permit Thresholds
8
Permit data from State databases and EPA
permit data (Title V) or other permit data
State Emissions Thresholds
(tons/yr)
New Mexico Notice of Intent Required for Facilities with Emissions > 10tpy Criteria Pollutants; Permits Required for Facilities > 25 tpy
Colorado Permits Required for All Sources with Emissions > 2 tpy Criteria Pollutants
Utah Permits Required for All Sources with Potential to Emit (PTE) > 100 tpy
Wyoming
Combustion Sources: All Compressor Engines Require Permit; Oil and Gas Process Sources : Variable Depending on Development Region but Not Less than 6 tpy VOC Emissions in Most Areas (Some Sources Require Permits at Any Emissions Levels in JPAD Area or CDA)
Montana Permits Required for All Sources with Potential to Emit (PTE) > 25 tpy;
North Dakota Permits Required for All Sources with Potential to Emit (PTE) > 100 tpy

9
Regulatory-grade emissions inventories - Non-Point (Area) Sources
Area sources - what are they? – Sources too small and numerous to have individual
permits with emission limits – Determination of “which are area sources” varies
by jurisdiction • Related to permitting thresholds • Counted and then emissions are estimated at the county
and tribal reservation levels • Inventories tally up tons of emissions from source types
– Less well-understood emissions are from area sources

Oil & Gas Basins in the Intermountain West

• Large Point Sources
(Gas plants, compressor stations)
• Drill Rigs
• Wellhead Compressor Engines
• CBM Pump Engines
• Heaters
• Pneumatic Devices
• Condensate and Oil Tanks
• Dehydrators
• Completion Venting
• Fracking Engines
• Lateral compressor engines
• Workover Rigs
• Salt-Water Disposal Engines
• Artificial Lift Engines (Pumpjacks)
• Vapor Recovery Units (VRUs)
• Miscellaneous or Exempt Engines
• Flaring
• Fugitive Emissions
• Well Blowdowns
• Truck Loading
• Amine Units (acid gas removal)
• Water Tanks
WRAP Source Categories

12
Calculating basin or sub-basin regulatory emissions inventories for upstream oil and gas point and area sources
[activity count * production] * emission factor = annual emissions
• Activity characteristics affected by • Age • Controls • Quality and frequency of operations and maintenance • Throughput of liquids and gases
• Emission factors • One or more field tests of specific equipment at specific locations • Assigned by Source Classification Code • Representativeness assignment in EI is professional judgment
• Annual emissions are tons/year of released emissions (VOCs, NOx, CO, etc.) • CH4 and C2H6 are not VOCs • Emissions inventories are flat, 2-dimensional, summed over time
• All chemical speciation, and further temporal and spatial refinements are handled in photochemical grid modeling

Basin Inventories
• Wide variation in inventories among basins
• Drivers for variations include production types (liquid vs. gas, CBM vs. non-CBM, sour vs. sweet gas), regulatory control levels, intensity of activity
* Williston Basin emissions are for 2009
13
2008 Emission Inventories
Basin
Emissions (tons/yr)
NOx VOC CO SOx PM Denver-Julesburg Basin 22,165 100,622 14,367 115 717 Uinta Basin 15,508 97,302 11,569 431 716 Piceance Basin 20,113 45,714 11,520 519 1,812 North San Juan Basin 5,917 2,187 6,456 30 72 South San Juan Basin 42,233 54,469 23,602 273 557 Wind River Basin 1,335 10,993 2,062 1,276 31 Powder River Basin 20,980 14,787 15,445 596 666 Greater Green River Basin 23,824 87,374 16,024 6,030 679 Williston Basin* 14,387 357,798 18,765 2,081 1,045

$1.00
$2.00
$3.00
$4.00
$5.00
$6.00
$7.00
$8.00
$9.00
0
1,000,000
2,000,000
3,000,000
4,000,000
5,000,000
6,000,000
7,000,000
Gas Prices ($/M
CF)
Gas
Pro
duct
ion
(mill
ion
cubi
c fe
et)
Intermountain West - Gas Production and Prices
Intermountain West Gas Production Wellhead Gas Prices

U.S. natural gas gross withdrawals by well type (2007-13)*
~ half of Natural Gas wells are (still) conventional/CBM ~ 25% of gas is from Oil wells
* - AWMA Environmental Manager, Aug. 2015

U.S.
Natural Gas Production
Sources for Natural Gas production past 15 years
increasingly directly affected by current, recent EPA NSPS
/ NESHAP regulations AWMA Environmental Manager, Aug. 2015

Mass Balance and (near or far) Remote Sensing – emissions from which piece of equipment or SCC process level are being
represented in those data?
More methodology, Data if there’s time and interest

“Unpermitted” sources surveys to
O&G producers
Combined survey responses for all
participating companies
IHS database (oil and gas production
and well and spud counts)
Scaled-up “unpermitted” sources emissions for
entire basin
Permit data from State databases and EPA
permit data (Title V) or other permit data
Complete oil and gas emissions inventory for
entire basin
WRAP Methodology Diagram
19

• Detailed spreadsheet-‐based surveys sent to major operators in each basin • Not all sources surveyed are “unpermi9ed”
WRAP Methodology
20
Unpermitted sources surveys to O&G
producers

Basin Oil and Gas Statistics
• Wide variation in total production of gas and oil/condensate among basins
• and produced and leaked methane…..
• Gas production activity is more significant than oil production activity in all basins except the Williston Basin
• Spud counts are surrogates for where greatest exploration and production activity was occurring in 2008
Red figures are greatest value in each column, showing spatial variation in O&G E&P operations * Williston Basin production statistics are for 2009
21
Spud Counts
Total Oil Non-CBM Gas CBM Total Oil Well OilGas Well
Condensate Total Non-CBM CBM TotalD-‐J Basin 20,054 3,620 16,434 0 19,363,429 3,428,383 15,935,046 266,919,382 266,919,382 0 1,777Uinta Basin 8,405 2,658 4,869 878 15,458,217 12,165,460 3,292,757 415,443,288 346,793,180 68,650,108 1,149Piceance Basin 9,300 644 8,569 87 7,785,316 5,424,924 2,360,392 659,065,078 657,495,707 1,569,371 2,121North San Juan Basin 2,969 97 1,003 1,869 39,462 31,491 7,971 432,276,612 33,749,342 398,527,270 226South San Juan Basin 21,776 1,670 15,421 4,685 2,549,679 957,056 1,592,623 951,832,297 499,085,236 452,747,061 585Wind River Basin 1,389 566 805 18 3,010,316 2,565,847 444,469 141,577,755 137,709,512 3,868,243 53Powder River Basin 27,256 7,177 544 19,535 18,857,799 18,378,654 479,145 607,467,975 53,887,969 553,580,006 2,086Southwest Wyoming Basin 11,072 1,143 9,616 313 17,334,716 5,548,836 11,785,880 1,735,260,915 1,718,031,661 17,229,254 1,418Williston Basin* 8,144 6,623 1,518 3 105,868,409 101,729,112 4,139,297 150,025,060 149,979,559 45,501 716
Basin
Well Count Oil Production (bbl) Gas Production (MCF)
2008 Production Statistics

• Survey respondents in Phase III do not represent all production in a basin • Scale-up of survey data necessary to capture all activity
WRAP Methodology
22
Response rates from operator surveys of
“unpermitted” sources emissions for
entire basin
Basin Percentage Ownership in Phase III
Gas Liquid Wells Denver-Julesburg 63% 58% 50% Piceance 84% 91% 75% Uinta 82% 78% 71% North San Juan 85% 93% 87% South San Juan 82% 48% 67% Wind River 97% 23% 54% Greater Green River 77% 64% 54% Powder River 46% 24% 30% Williston 30% 33% 20%

NOx emissions primarily comprised of compressor engines (central and wellhead) and drill rigs for basins in which active drilling was occurring
Results – Example NOx Emissions Breakdown By Source Category
23
Southwest Wyoming Basin Powder River Basin
Compressor engines
44%
Drill rigs27%
Heaters2%
Miscellaneous engines
20%
Artificial Lift2%
Other Categories
5%
Compressor Engines
54%
Drill rigs24%
Heaters12%
Dehydrator2%
Other Categories
6%

VOC emissions sources vary significantly from basin to basin – tank flashing, dehydration and pneumatic devices are consistently large source categories in most basins, but for CBM dominant basins other categories are significant
Results – Example VOC Emissions Breakdown By Source Category
24
Compressor Engines
2%Drill rigs1%
Pneumatic devices
17%
Pneumatic pumps
6%
Fugitives24%
Dehydrator10%
Condensate tank 33%
Oil Tank2%
Venting -initial
completions1%
Venting -recompletions
0.5%
Other Categories
3% Compressor engines
27%
Drill rigs2%
Venting -initial
completions5%
Venting -recompletions
7%Fugitives
14%Miscellaneous
engines3%
Artificial Lift2%
Dehydrator6%
Oil Well Truck Loading
6%
Pneumatic Devices
20%
Other Categories
8%
Southwest Wyoming Basin Powder River Basin

Cross-Basin – NOx Emissions
25
0
5,000
10,000
15,000
20,000
25,000
30,000
35,000
40,000
45,000
DJ Piceance Uinta North San Juan
South San Juan
Wind River Powder River South West Wyoming
Williston
NOx Em
ission
s (tons/year)
Basins
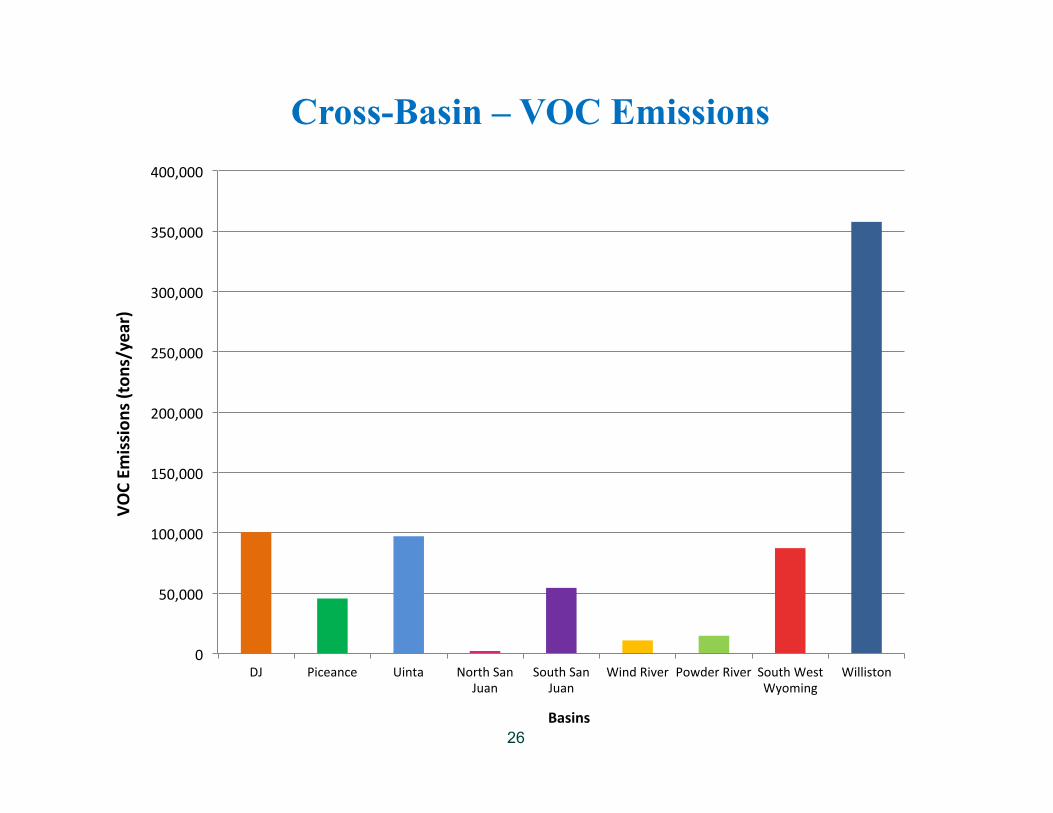
Cross-Basin – VOC Emissions
26
0
50,000
100,000
150,000
200,000
250,000
300,000
350,000
400,000
DJ Piceance Uinta North San Juan
South San Juan
Wind River Powder River South West Wyoming
Williston
VOC Em
ission
s (tons/year)
Basins
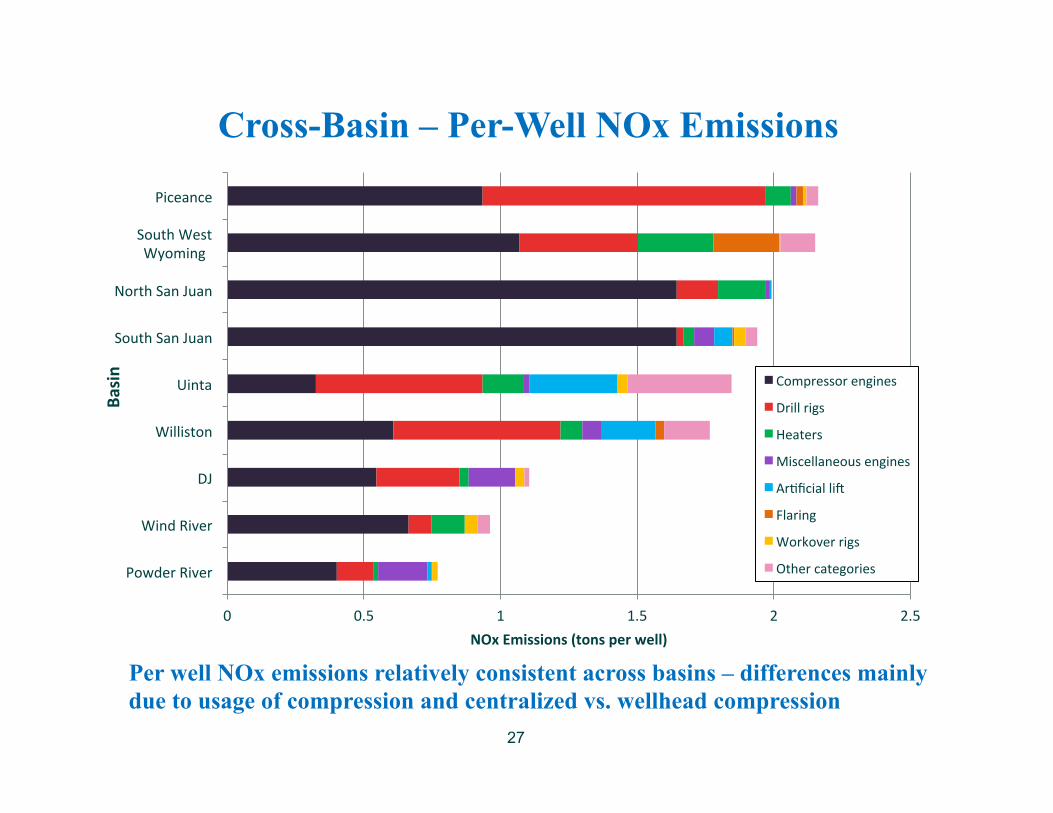
Cross-Basin – Per-Well NOx Emissions
Per well NOx emissions relatively consistent across basins – differences mainly due to usage of compression and centralized vs. wellhead compression
27
0 0.5 1 1.5 2 2.5
Powder River
Wind River
DJ
Williston
Uinta
South San Juan
North San Juan
South West Wyoming
Piceance
NOx Emissions (tons per well)
Basin
Compressor engines
Drill rigs
Heaters
Miscellaneous engines
ArJficial liL
Flaring
Workover rigs
Other categories

Cross-Basin – Per-Unit-Gas-Production VOC Emissions
Per unit gas production VOC emissions vary widely across basins – differences due to levels of liquid hydrocarbon production (oil and condensate) and VOC content of produced gas
28
0 0.5 1 1.5 2 2.5 3
North San Juan
Powder River
South West Wyoming
South San Juan
Piceance
Wind River
Uinta
DJ
Williston
VOC Emissions (tons per MMCF of produced gas)
Basin
Blowdowns
CompleJon venJng
Condensate tank
Condensate truck loading
Crude oil truck loading
Dehydrator
FugiJves
Oil tank
PneumaJc devices
PneumaJc pumps
Other categories

Cross-Basin – Per-Unit-Liquid-Production VOC Emissions
Per unit gas production VOC emissions vary widely across basins – differences due to levels of liquid hydrocarbon production (oil and condensate) and VOC content of produced gas
29
0 10 20 30 40 50 60
Powder River
Williston
Wind River
South West Wyoming
DJ
Piceance
Uinta
South San Juan
North San Juan
VOC Emissions (tons per barrel of liquid hydrocarbon)
Basins
Blowdowns
CompleJon venJng
Condensate tank
Condensate truck loading
Crude oil truck loading
Dehydrator
FugiJves
Oil tank
PneumaJc devices
PneumaJc pumps
Other categories

Oil & Gas Projections - Methodology
30
• No standardized methodology for conducting projections • Each inventory study has used different approaches (EPA methods,
Resource Management Plans, NEPA air quality projects, Western States Air Quality Modeling Study regional inventories)
• WRAP O&G inventories have used a three-step approach: 1. Activity scaling factors 2. “Uncontrolled” projections 3. State and federal regulatory control requirements
• Activity scaling requires input from operators on planned activities, and/or analyzes trends, and/or relies on industry studies
• State and federal regulatory control requirements complex and continuing to evolve
• National rules focused on new sources

31
Trends in projected emissions - example
CO NOX VOC NH3 SO2 PM2_5 Colorado -185992 -37563 225853 51 -31871 -1379 Utah -144069 -27324 32826 312 -7625 -313 Wyoming -40936 -8922 42778 443 -41052 -4820
-250000
-200000
-150000
-100000
-50000
0
50000
100000
150000
200000
250000
Tons
/Yea
r C
hang
e (2
020-
2011
)
State Total Inventory Change: 2020-2011 – Mostly decreases for all sectors/pollutants/states except O&G VOCs
– Plots show differences for example states (CO, UT, WY)
Source: Intermountain West Data Warehouse – Western Air Quality Study

Emission Inventories – Issues and New Concepts
1. Point vs. area sources 2. Missing source categories 3. Skewness 4. Gas composition data 5. New factor data 6. Uncertainties
32

Issues and New Concepts – Point vs. Area
• Expect improvement in spatial resolution and accuracy of emissions data from point sources but significant effort to process and track
• Colorado (APENs) and Wyoming (site surveys) already doing this
33
Point vs. Area Sources Pros Cons
Better spatial resolution Resource intensive (to states and industry) Gather actual emissions/actual usage Resource intensive to process Improved accuracy of emissions Factor approach still used for minor sources

Issues and New Concepts – Missing Categories
• Phase III inventories significant improvement on past inventories
• Some categories could not be included due to lack of data, lack of emissions quantification approach
• Potential contribution to inventories – unclear
34

Issues and New Concepts – Missing Categories
• Emission factors uncertain and highly dependent on composition, production type
• Seasonal/diurnal variations
• See for example Utah State University work to characterize emissions in Uinta Basin
35
Produced water (evaporation) ponds

Issues and New Concepts – Missing Categories
• Lack of data on extent of pipeline infrastructure within fields
• Pipeline companies historically not part of the inventory process
36
Field gathering pipelines

Issues and New Concepts – Missing Categories
• Midstream sources not always captured in inventories – state reporting thresholds
• Midstream sources on tribal lands
• Midstream companies historically not part of the inventory process
37
Midstream sources

Issues and New Concepts – Missing Categories
• Trucking and off-road equipment likely underestimated in existing mobile inventories
• Activities dispersed throughout basins and among basins
• See for example P3 study in Piceance Basin
38
Mobile sources
0%10%20%30%40%50%60%70%80%90%
100%
NOX CO VOC PM10
All Counties -‐ All Activities
Oil and Gas 2009
Mobile Sources
As operators and regulators move to other systems to produce and move products and by-products (train, pipelines and electrification) and away from trucks and diesel/field gas combustion, new data is needed
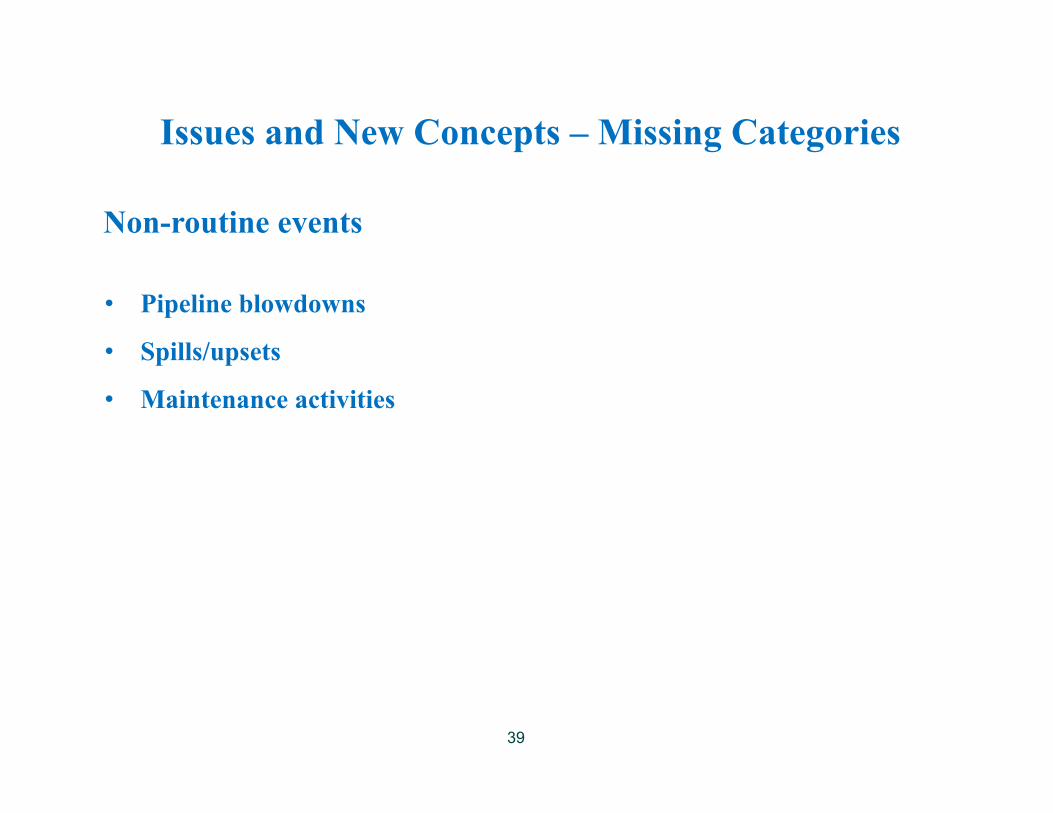
Issues and New Concepts – Missing Categories
• Pipeline blowdowns
• Spills/upsets
• Maintenance activities
39
Non-routine events

Issues and New Concepts – Skewness
• Poorly performing and “non-average” sources could have significantly higher emissions than estimated in inventories
• Analogous to “smoking vehicles” in mobile source inventories
• Statistical sampling/monitoring of sources needed to develop methods to represent this in inventories
• See for example NOAA monitoring in Uinta Basin and CDPHE capture efficiency adjustments
40

Issues and New Concepts – Gas ComposiJons
• Gas compositions in Phase III use a basin-average approach
• Variability within a basin by production type (field to field)
• Variability within the production/gathering system
• More data needed – field or formation level approach for basins?
41
Methane
Others
ConvenJonal Gas (Vented/FugiJve Sources)
Flash Gas (Condensate and Oil Tanks)
EthanePropanen-‐ButaneCO2i-‐ButaneHexanesi-‐Pentanen-‐PentaneNitrogenC8+TolueneBenzeneHeliumXylenesOther
MethaneOthers
CO2N2Methane C1Ethane C2Propane C3i-‐Butane i-‐C4n-‐Butane n-‐C4i-‐Pentane iC5n-‐Pentane nC5n-‐Hexane n-‐C6Hexanes C6Heptanes C7C8+ HeaviesBenzeneToluenee-‐Benzene

Issues and New Concepts – Factors and Uncertainty
42
New factor data • Fugitive emissions
• Venting from well completions
• Water tanks / evap ponds
Uncertainty • Uncertainties not quantitatively estimated in most
inventories
• Large data sets needed to estimate uncertainty
• Helpful in identifying poorly-characterized sources, and estimating uncertainty in AQ modeling