utilização do sistema de classificação de dez...
TRANSCRIPT

i
Elton Carlos Ferreira
Utilização do Sistema de Classificação de Dez Grupos de Robson para partos na investigação
da morbidade materna grave
Applying the Robson Ten Group Classification System for deliveries to the investigation of
severe maternal morbidity
CAMPINAS 2014

ii

iii
UNIVERSIDADE ESTADUAL DE CAMPINAS Faculdade de Ciências Médicas
Elton Carlos Ferreira
Utilização do Sistema de Classificação de Dez Grupos de Robson para partos na investigação
da morbidade materna grave
Applying the Robson Ten Group Classification System for deliveries to the investigation of
severe maternal morbidity
Dissertação de Mestrado apresentada ao Programa de Pós-Graduação em Tocoginecologia da Faculdade de Ciências Médicas da Universidade Estadual de Campinas – UNICAMP, para obtenção de Título de Mestre em Ciências da Saúde, área de concentração em Saúde Materna e Perinatal.
Master’s dissertation presented to the Obstetrics and Gynecology Graduate Program of the School of Medical Sciences, University of Campinas, to obtain the MSc degree in Health Science, in the concentration area of Maternal and Perinatal Health.
ORIENTADOR: Prof. Dr. José Guilherme Cecatti
COORIENTADOR: Prof.ª Drª. Maria Laura Costa do Nascimento
ESTE EXEMPLAR CORRESPONDE À VERSÃO FINAL DA DISSERTAÇÃO DEFENDIDA PELO ALUNO Elton Carlos Ferreira E ORIENTADA PELO Prof. Dr. José Guilherme Cecatti
Assinatura do Orientador
Campinas 2014

iv

v

vi

vii
Dedico este trabalho...
Dedico esta dissertação primeiramente a Deus, detendor de todo poder e sabedoria, que ilumina meus passos e me protege em todos os momentos da minha vida. Dedico, também, à minha mãe Vera e a meu pai Sebastião que, com muito amor e perseverança, ensinaram-me os verdadeiros valores da vida e, com muita luta, deram-me a oportunidade de estudar e estar aqui hoje defendendo esse trabalho. À minha avó Regina, minha segunda mãe, dona do mais puro coração, que jamais conhecerei igual, sinônimo de amor e de bondade. Quero, também, dedicar esta dissertação à minha amada esposa, Renata, companheira de todas as horas, meu porto seguro, minha alma gêmea; mulher que impulsiona meus sonhos e que me faz querer ser uma pessoa melhor a cada dia. Ao meu irmão Renato, dono de um caráter e de uma honestidade intocáveis; lutador sempre; vencedor inquestionável e admirável sobre todas as adversidades que a vida lhe impôs.

viii

ix
Agradecimentos
Ao meu orientador, Prof. Dr. José Guilherme Cecatti, por sua sabedoria
inspiradora e sua dedicação incansável à pesquisa e à busca pelo
conhecimento. Obrigado professor pela confiança.
À minha coorientadora, Profª Drª. Maria Laura Costa do Nascimento, pelo
apoio, dedicação e amizade, incentivando-me e orientando durante toda a
dissertação.
Aos meus sogro e sogra, Manoel e Ane, pelo carinho e apoio, acolhendo-me
como a um filho; aos meus cunhados Regina e Clóvis e aos amigos
Ricardo e Roberta e suas respectivas famílias, pela amizade e incentivo.
A toda minha família que forma o alicerce sólido da minha formação e que me
ensina diariamente o significado das palavras união, respeito e amor.
Aos meus amigos que sempre me apoiaram e me incentivaram, rindo comigo
na alegria, chorando e me amparando nas minhas dores.
Aos docentes, médicos contratados e funcionários do CAISM pelo acolhimento,
apoio e suporte.
Aos colegas e amigos do COMMAG que transformam nossas pesquisas em
momentos ainda mais prazerosos e de muita alegria e companheirismo.

x

xi
Sumário
Símbolos, Siglas e Abreviaturas .................................................................................................. xiii
Resumo ......................................................................................................................................... xv
Summary ..................................................................................................................................... xvii
1. Introdução ................................................................................................................................. 1
2. Objetivos ................................................................................................................................... 9
2.1. Objetivo geral .................................................................................................................... 9
2.2. Objetivos específicos......................................................................................................... 9
3. Sujeitos e Método ................................................................................................................... 11
3.1. Desenho do estudo ......................................................................................................... 11
3.2. Tamanho Amostral .......................................................................................................... 12
3.3. Variáveis .......................................................................................................................... 13 3.3.1. Variável independente: ...................................................................................... 13 3.3.2. Variáveis dependentes: ...................................................................................... 13 3.3.3. Variáveis de controle .......................................................................................... 14
3.4. Seleção dos sujeitos........................................................................................................ 15
3.5. Instrumento para coleta de dados ................................................................................... 16
3.6. Processamento dos dados .............................................................................................. 17
3.7. Plano de análise dos dados ............................................................................................ 18
3.8. Considerações Éticas ...................................................................................................... 20
4. Publicações ............................................................................................................................. 21
4.1. Artigo 1 ............................................................................................................................ 22
4.2. Artigo 2 ............................................................................................................................ 45
5. Discussão Geral ...................................................................................................................... 61
6. Conclusões.............................................................................................................................. 69

xii
7. Referências Bibliográficas ....................................................................................................... 71
8. Anexos .................................................................................................................................... 77
8.1. Anexo 1 – Critérios diagnósticos de near miss ............................................................... 77
8.2. Anexo 2 – Critérios diagnósticos de condições potencialmente ameaçadoras da vida . 78
8.3. Anexo 3 – Robson Ten Group Classification System ..................................................... 79
8.4. Anexo 4 – Ficha de identificação dos casos ................................................................... 80
8.5. Anexo 5 – Ficha de coleta de dados ............................................................................... 81
8.6. Anexo 6 – Parecer do Comitê de Ética em Pesquisa ..................................................... 83

Símbolos, Siglas e Abreviaturas xiii
Símbolos, Siglas e Abreviaturas
CAISM – Centro de Atenção Integral à Saúde da Mulher
CEMICAMP – Centro de Estudos em Saúde Reprodutiva de Campinas
CEP – Comitê de Ética em Pesquisa
CNPq
CONEP
– Conselho Nacional de Pesquisa
– Conselho Nacional de Ética em Pesquisa
CS – Cesarean Section
CI – Confidence Interval
ICU
MD
– Intensive Care Unit
– Matenal Death
MDG – Milenium Development Goals
MMG – Morbidade Materna Grave
MMR – Maternal Mortality Ratio
MNM – Maternal Near Miss
OMS – Organização Mundial de Saúde
PLTC – Potentially Life Threatening Condition
RBVMMG – Rede Brasileira de Vigilância de Morbidade Materna Grave
RTGCS – Robson Ten Group Classication System
SMM – Severe Maternal Morbidity
SMO – Severe Maternal Outcome (near miss + óbito materno)
SUS – Sistema Único de Saúde
UNICAMP – Universidade Estadual de Campinas
UTI – Unidade de Terapia Intensiva
VBAC – Vaginal Birth After Cesarean
WHO – World Health Organization

Símbolos, Siglas e Abreviaturas xiv

Resumo xv
Resumo
Objetivo: avaliar a distribuição dos partos segundo o Sistema de Classificação
em Dez Grupos de Robson (RTGCS) explorando os dados da Rede Brasileira
de Vigilância da Morbidade Materna Grave (RBVMMG) e do Hospital da Mulher
(CAISM) da Universidade Estadual de Campinas (UNICAMP), Brasil; e
comparação de ambos com os dados do estudo Global Survey da Organização
Mundial de Saúde (WHO). Método: Foram realizadas duas abordagens. A
primeira foi uma análise secundária de um estudo de corte transversal
multicêntrico que ocorreu em 27 maternidades brasileiras de referência,
localizadas nas cinco regiões do país e participantes da RBVMMG. Foi
realizada a codificação dos dados para alocação de todas as mulheres segundo
o RTGCS e as mulheres foram classificadas de acordo com o espectro clínico
de gravidade e a condição subjacente de morbidade materna grave. Para a
segunda abordagem, foi realizado um estudo de corte transversal, com
avaliação das mulheres admitidas para parto no CAISM no período de janeiro
2009 a julho de 2013. As mulheres foram agrupadas segundo a RTGCS e,
adicionalmente, a distribuição das mulheres entre os diferentes grupos foi
comparada entre os casos que tiveram morbidade materna grave,
operacionalmente definida pela necessidade de internação em unidade de
terapia intensiva (UTI), com os demais casos sem complicações graves. Para
as duas abordagens (RBVMMG e CAISM), realizou-se também uma
comparação com resultados publicados de outro grande estudo, realizado em
diferentes contextos e países, fundamentalmente com os dados para o Brasil,
disponíveis no estudo Global Survey da WHO. Resultados: Para a RBVMMG,
das 7247 mulheres que compuseram o estudo, 73.2% foram submetidas à
cesariana (CS). O grupo 10, grupo com provável indicação de cesárea por

Resumo xvi
complicação materna e/ou fetal, foi o mais prevalente com 33.9% e também
aquele com maior contribuição para a taxa geral de cesárea, 28%. Os grupos
que tiveram maior gravidade (¨near miss¨ e óbito materno) foram, em ordem
decrescente, os grupos 7 e 9, o grupo 8 e o grupo 10. O grupo 3 teve um caso
de resultado materno grave (¨near miss¨ + óbito materno) para cada 29 casos
de condição potencialmente ameaçadora da vida. Nas mulheres desse grupo
submetidas a CS, essa relação atingiu valores de 1:10. Em todos os grupos
avaliados, a hipertensão foi o fator de gravidade mais frequente. Na segunda
abordagem, foram admitidas 12.771 parturientes durante o período do estudo.
A taxa de cesariana encontrada foi de 46.6%. O grupo 1 foi o mais prevalente
com 28.1%, sendo o grupo 5 aquele que mais contribui para a taxa geral de
cesárea (12.7%). Apresentaram, proporcionalmente, mais internação em UTI os
grupos 10 (46.8%), 5 (13.3%) e 2 com 9.8%. Conclusões: O estudo evidenciou
uma alta taxa de cesárea nas duas populações avaliadas e o uso do RTGCS
mostrou-se útil, evidenciando grupos clinicamente relevantes com alta taxa de
parto por cesárea. Estudos futuros serão necessários para melhor avaliar a
associação entre cesárea e morbidade materna grave, assim como definir
possíveis intervenções e a taxa de cesárea esperada para esse grupo
específico de mulheres.
Palavras chaves: morbidade materna grave, parto cesárea, near miss materno,
parto, mortalidade materna

Summary xvii
Summary
Objective: To evaluate the distribution of delivering women according to the
Robson’s Ten Group Classification System (RTGCS) exploring the data from the
Brazilian Network for the Surveillance of Severe Maternal Morbidity (RBVMMG)
and from a tertiary hospital (CAISM), University of Campinas, Brazil; comparing
both data with that from the WHO Global survey. Method: Two approaches
were proposed. The first, a secondary analysis of a database obtained from a
multicenter cross-sectional study taking place in 27 referral obstetric units
located in the five geographical regions of Brazil, members of the Brazilian
Network for the Surveillance of Severe Maternal Morbidity (RBVMMG), was
carried out. For this analysis, data was organized following information
necessary to classify all women into one of the RTGCS and cases from each of
the 10 groups were classified according to case severity and underlying cause
of severe morbidity. Subsequently, certain Robson groups were subdivided for
further analysis. For the second approach, a cross-sectional study of data from
women delivering at CAISM from January 2009 to July 2013 was carried out.
Women were grouped according to RTGCS and, additionally, the distribution of
women among the different groups was compared between cases who had
severe maternal morbidity (SMM), operationally defined by intensive care unit
(ICU) admission, with the other cases without severe complications. For both
approaches (RBVMMG and CAISM), patients distributed among groups were
compared to another Brazilian study population, available on the WHO Global
Survey study. Results: For RBVMMG, among the 7247 women considered,
73.2% underwent cesarean section (CS). Group 10 had the highest prevalence

Summary xviii
rate (33.9%), also contributing most significantly (28%) to the overall CS rate.
Groups associated with a severe maternal outcome (maternal ¨near miss¨ or
maternal death), in decreasing order were: groups 7 and 9, 8 and 10. Group 3
had one case of severe maternal outcome (maternal ¨near miss¨ + maternal
death) for every 29 cases of potentially life-threatening conditions. When
evaluating only women undergoing CS in this group, ratios of 1:10 were
achieved, indicating a worse outcome. Among all groups evaluated,
hypertension was the most common condition of severity. For CAISM, of the
12771 women, 46.6% underwent CS. Group 1 had the highest prevalence rate
(28%) and Group 5 contributed most significantly to overall CS rates. ICU
admission was proportionally higher in groups 10 (46.8%), 5 (13.3%) and 2 with
9.8%.Conclusions: The study demonstrated a high cesarean section rate in the
two populations studied and the use of RTGCS proved to be extremely useful,
showing clinically relevant groups with high rates of cesarean section. Future
studies are needed to better evaluate the association between cesarean section
and severe maternal morbidity, as well as to define possible interventions and
the expected cesarean section rate for this particular group of women.
Keywords: severe maternal morbidity, cesarean section, maternal near-miss,
delivery, maternal mortality

Introdução 1
1. Introdução
A Organização das Nações Unidas, ao analisar os maiores problemas
mundiais, estabeleceu oito objetivos denominados de Metas do Milênio que
devem ser atingidos por todos os países até 2015. Dentre essas metas,
encontra-se a de reduzir a mortalidade materna em dois terços. (Barros et
al.,2010; UN, 2010)
No Brasil, segundo o Ministério da Saúde, as mortes maternas
apresentaram importante redução de 1990 a 2011, passando de 143 para 63
por 100 mil nascidos vivos (55% de redução). Porém, o objetivo traçado pelas
Metas de Desenvolvimento do Milênio para 2015 ainda está longe de ser
alcançado, provavelmente porque a velocidade da queda reduziu nos últimos
dez anos (Barros et al., 2010; Brasil, 2012; UN, 2013)
De acordo com a Organização Mundial de Saúde (OMS),
aproximadamente 20 milhões de complicações agudas na gravidez ocorrem
anualmente, incluindo cerca de 289 mil mortes maternas. Embora a mortalidade
materna seja a questão principal, ela representa uma parcela do problema. A
extensão de toda a morbidade associada à gravidez, parto e puerpério
permanece desconhecida. Nesse sentido, a morbidade tem ganhado

Introdução 2
importância crescente nos estudos de saúde materna. (Geller et al., 2004;
Pacagnella et al., 2010)
O espectro da gravidade clínica da morbidade materna pode ser dividido
de acordo com características clinicas e epidemiológicas. Isso permite a análise
dos fatores que podem, de alguma maneira, ajudar a predizer a gestação
normal, a morbidade materna, a morbidade materna grave, o ¨near miss¨
materno e a morte. (Geller et al., 2004)
A OMS define ¨near miss¨ materno como a sobrevida de mulheres após
uma complicação grave ameaçadora à vida ocorrida durante a gravidez, parto
ou nos primeiros 42 dias de puerpério, usando critérios específicos - clínicos,
laboratoriais e de manejo. (Anexo 1) Define também os critérios que classificam
uma condição potencialmente ameaçadora de vida (morbidade materna grave
não ¨near miss¨), incluindo desordens hemorrágicas e hipertensivas, outras
desordens sistêmicas e indicadores de manejo de gravidade. (Anexo 2) (Say et
al., 2009)
Em alguns estudos em que os critérios padronizados pela WHO não
foram coletados de forma pragmática ou naqueles em que esses critérios ainda
não haviam sido propostos, foram usadas informações clínicas ou de manejo
preditoras de gravidade para definir casos de morbidade materna grave como
internação em UTI, histerectomia puerperal, necessidade de transfusão
sanguínea, eclâmpsia ou complicações cardíacas e renais. (Oliveira Neto et al.,
2009; Souza et al., 2010)
Com a necessidade crescente, não somente de vigilância, mas também
de desenvolvimento de novas estratégias para melhoria de assistência à saúde

Introdução 3
materna e perinatal no Brasil, foi proposto um grande estudo multicêntrico
denominado RBVMMG. Esse foi composto por 27 centros distribuídos por todo
o Brasil que fizeram a coleta prospectiva de dados entre os anos de 2009 e
2010 (Haddad et al., 2011), contemplando um sistema desenvolvido para
identificação de casos de morbidade materna grave, utilizando como parâmetro
diagnóstico os critérios de ¨near miss¨ e condições potencialmente
ameaçadoras à vida, recentemente definidos pela OMS. Dos 82.388 partos que
ocorreram nos centros participantes no período de estudo, foram 82.144
nascidos vivos e, destes, 9555 casos morbidade materna grave. (Souza et al.,
2012)
Paralelamente, o aumento na taxa de cesariana tem sido verificado em
todo o mundo e vem se tornando uma questão de saúde pública e causa de
inúmeras discussões devido aos seus riscos potenciais maternos e perinatais.
(Torloni et al., 2011)
A Organização Mundial de Saúde estabeleceu que nenhuma região/país
deveria ultrapassar valores de 15% nas taxas de cesariana, porém esse
objetivo está longe de ser alcançado tanto em países desenvolvidos quanto em
desenvolvimento. (WHO, 1985) De acordo com dados recentes, cerca de 24,3%
dos partos na América do Norte ocorrem por via alta, atingindo cifras de 31% na
América Central, acima de 30% nos países europeus e de 40% em muitos
países da América Latina. (Betrán et al., 2007)
Esse índice de 15% proposto pela OMS em 1985 tem sido a referência
tida como uma taxa ótima de cesárea em um serviço ou país nas últimas três
décadas. Para elucidar se essa cifra é ainda condizente com a realidade atual,

Introdução 4
foi conduzido um estudo em 2014 que englobou Japão, Nova Zelândia,
Austrália, América do Norte, norte e oeste Europeu, totalizando 19 países tidos
como os mais desenvolvidos do mundo. Tal estudo mostrou que quando as
taxas de cesariana ultrapassavam cifras de 10-15%, não foram acompanhadas
pela diminuição da mortalidade materna, neonatal ou infantil, evidenciando,
portanto, que esses números continuam atuais. (Ye et al., 2014). Em tal análise,
apenas países desenvolvidos foram avaliados uma vez que esses apresentam
dados estastísticos confiáveis e a cesárea pode prontamente ser realizada se
necessário.
Em geral, as taxas de cesariana diferem significativamente entre países
e entre regiões e instituições de um mesmo país, variando ainda com o tipo de
acesso ao sistema de saúde (público ou privado). (Ross, 2005) Pacientes que
são cobertas por planos de saúde ou com atendimento privado são mais
submetidas a parto via alta do que pacientes atendidas no sistema público de
saúde. (Grant, 2005) Estudo australiano mostrou cifras de 48% em serviços
privados versus 26.9% em serviços públicos em Queensland em 2006. (Howell
et al., 2009)
Muitas potenciais explicações têm sido propostas para o aumento
progressivo do número de cesarianas incluindo cesariana por solicitação
materna (Minkoff & Chervenak, 2003; Wax et al., 2004; Robson et al., 2008),
preocupações médico-legais (Minkoff & Chervenak, 2003), obesidade e idade
materna avançada. (Bell et al., 2001) Porém, as razões específicas
permanecem desconhecidas na maioria dos países. (Torloni et al., 2011)

Introdução 5
A implementação de medidas eficazes para diminuição das taxas de
cesariana nos diversos serviços obstétricos exige, inicialmente, a identificação
de quais grupos de mulheres são mais submetidas a esse procedimento. Para
esse propósito, diversos sistemas de classificação têm sido descritos, porém a
falta de um padrão que seja universalmente aceito tem prejudicado as
tentativas de caracterizar o aumento nas taxas de cesariana. Na maioria das
vezes, os partos por cesárea têm sido avaliados usando a taxa geral de
cesariana ou descritos de acordo com a indicação médica para o procedimento
cirúrgico como distócia, sofrimento fetal, cesariana prévia ou apresentação
pélvica. Porém, a falta de uniformidade na definição da indicação médica para o
procedimento entre os serviços ou dentro do mesmo serviço ao longo do tempo
traz preocupação quanto à consistência dos dados obtidos. (Bell et al., 2001;
Howell et al., 2009)
Uma classificação proposta em 2001, denominada sistema de
classificação em dez grupos de Robson (RTGCS) objetivou descrever grupos
clinicamente relevantes de mulheres submetidas a parto operatório. Embora
originalmente utilizada como um método para acessar as taxas de cesárea, o
RTGCS permite a classificação de todas as mulheres admitidas para parto
(Robson, 2001b). Essa classificação baseia-se em características distintas de
cada mulher individualmente e de sua gestação ao invés de focar na indicação
do parto operatório, a saber: gestação única ou múltipla, paridade e presença
de cesárea prévia, apresentação, forma de início ou cesariana antes do
trabalho de parto, idade gestacional no parto. (anexo 3) (Robson, 2001a)

Introdução 6
Os dez grupos são mutuamente exclusivos e totalmente inclusivos, ou
seja, todas as mulheres podem ser classificadas, porém cada mulher enquadra-
se somente em um desses grupos. (anexo 3) (Robson, 2001a). Uma revisão
sistemática analisando as diversas classificações de cesariana, mostrou que a
de Robson contempla as necessidades locais e internacionais, permitindo a
análise e comparação das taxas de cesárea entre diferentes hospitais, cidades,
países e regiões, além de possibilitar essa avaliação na mesma unidade em
diferentes períodos de tempo. (Torloni et al., 2011)
A partir da criação dessa classificação em 2001, diversos estudos tem
sido realizados objetivando levantar as taxas de cesariana segundo os 10
grupos e, dessa forma, obter estratégias para implementação de medidas que
possam diminuir esses números. A simplicidade, reprodutibilidade, a robustes e
a possibilidade de categorizar as mulheres prospectivamente são algumas das
características favoráveis apontadas por revisão sistemática conduzida mais
recentemente para avaliar o RTGCS. Por outro lado, esse estudo aponta
algumas limitações da classificação como grupos heterogêneos, ausência da
informação sobre a indicação da cesárea e não inclusão de características
maternas que podem estar associadas com maior taxa de cesariana como
idade avançada e obesidade (Betran et al., 2014).
O estudo “Global Survey” realizado em oito países da América Latina em
2005 avaliou mais de 97 mil mulheres, sendo incluídas 14462 brasileiras.
Destas, a maioria pertencia ao grupo 3 de Robson (30.9%) (multíparas, feto
único, cefálico, ≥37 semanas, trabalho de parto espontâneo, sem cesárea
anterior), seguido pelos grupos 1 (28.6%) (nulípara, feto único, cefálico,

Introdução 7
≥37semanas, trabalho de parto espontâneo) e 5 (11.1) (multípara com pelo
menos uma cesárea anterior, feto único, cefálico, ≥37semanas),
respectivamente. Nesse mesmo levantamento, a maior taxa relativa de
cesariana foi verificada no grupo 5 ( 28.7%), seguido pelos grupos 2 (22%)
(nulípara, feto único, cefálico, ≥37semanas, trabalho de parto induzido ou
cesárea antes do trabalho de parto) e 1 (13.5%), respectivamente, indicando
que cesariana anterior (grupo 5) é maior preditivo de parto via alta. (Betrán et
al., 2007)
Outro estudo realizado em 2010 em hospital terciário na Universidade
Estadual de Campinas, Brasil, com taxa geral de cesariana em torno de 45%
também mostrou que a maioria das mulheres que deram entrada no hospital
referido pertenciam ao grupo 3 de Robson (27.7%), sendo que a taxa de
cesariana, considerando a contribuição de cada grupo, foi maior no grupo 5
(16.0%), seguido pelo grupos 3 (6.1%) e 1 (6.0%), respectivamente. (Costa et
al., 2010)
Nenhum estudo até o momento avaliou genericamente a aplicação do
sistema de classificação em dez grupos de Robson (RTGCS) em mulheres com
morbidade materna grave. Acredita-se que mulheres que sofreram algum
evento significativo na gravidez caracterizando condição potencialmente
ameaçadora da vida, ¨near miss¨ ou morte, apresentem, em geral, maiores
chances de parto por cesariana. Este estudo propõe a avaliação, segundo
RTGCS, das mulheres acompanhadas no estudo da RBVMMG e no CAISM, a
comparação com a população geral nacional (dados Global Survey-Brasil) e
possível relação dos diversos grupos com pior desfecho materno.

Introdução 8

Objetivos 9
2. Objetivos
2.1. Objetivo geral
Avaliar a distribuição dos partos segundo o Sistema de Classificação em
Dez Grupos de Robson (RTGCS) e critérios de morbidade materna, explorando
os dados da Rede Brasileira de Vigilância da Morbidade Materna Grave
(RBVMMG) e do Hospital da Mulher (CAISM) da Universidade de Campinas
(UNICAMP), Brasil; e comparar ambos com a população geral do estudo Global
Survey da WHO.
2.2. Objetivos específicos
Explorar os dados da RBVMMG avaliando a aplicação do sistema
de classificação em dez grupos de Robson (RTGCS) em mulheres
com morbidade materna grave, as taxas de cesárea nessas
mulheres e sua distribuição, a relação dos diversos grupos com
pior desfecho materno, comparação dessas com a população
geral do estudo Global Survey da WHO, assim como avaliar

Objetivos 10
possíveis subdivisões de alguns grupos de Robson considerados
heterogêneos.
Explorar os dados do Hospital da Mulher (CAISM) da Universidade
de Campinas (UNICAMP), Brasil, avaliando a prevalência de
gestantes admitidas para parto segundo o RTGCS de Janeiro de
2009 a Julho de 2013, a taxa de cesárea no período, assim como
comparação dessas com a população geral do estudo Global
Survey da WHO. Secundariamente, comparar a distribuição dos
casos de cesárea pelos diferentes grupos da classificação entre
as mulheres que apresentaram alguma condição de morbidade
materna grave definida pela necessidade de internação na
unidade de terapia intensiva (Souza et al., 2010) e as demais sem
tais complicações.

Sujeitos e Método 11
3. Sujeitos e Método
3.1. Desenho do estudo
Para cumprir o primeiro objetivo, foi realizada uma análise secundária de
estudo de corte transversal multicêntrico que ocorreu em 27 maternidades de
referência, localizadas nas cinco regiões brasileiras e participantes da
RBVMMG. (Haddad et al., 2011) Realizou-se a vigilância prospectiva com
dados coletados após o desfecho do caso de todas as mulheres admitidas por
morbidade materna grave (alta hospitalar ou óbito ou transferência) durante o
período de 12 meses, de julho de 2009 a junho de 2010. Os dados foram
coletados em formulários específicos e digitados na plataforma OpenClinica® e
os detalhes sobre metodologia do estudo original podem ser encontrados na
literatura (Haddad et al., 2011). Foi realizada uma análise secundária do estudo,
sendo os sujeitos alocados segundo os 10 grupos da classificação de Robson
definidos por: paridade, número de fetos, apresentação fetal, idade gestacional
no parto, existência ou não de cesárea anterior, forma de início do trabalho de
parto e a forma de término do trabalho de parto. (Robson, 2001a)

Sujeitos e Método 12
Para cumprir o segundo objetivo, foi realizado um estudo de corte
transversal, com avaliação de todas as mulheres admitidas para parto no
CAISM, no período de janeiro 2009 a julho de 2013. Os dados foram obtidos a
partir da base de dados do serviço estatístico da instituição.
Para ambos objetivos, a contribuição de cada grupo foi comparada com
os resultados de avaliação populacional similar para o Brasil disponível no
estudo Global Survey da WHO (Betrán et al., 2007). Assim, dispomos de
informações de três bancos de dados distintos em um crescente de gravidade:
Global Survey, representativo da população geral; CAISM, hospital terciário de
referência para gestações de alto risco; e RBVMMG, contemplando mulheres
com morbidade materna grave.
3.2. Tamanho Amostral
No estudo original, para determinar o número de centros colaboradores
que iriam compor a RBVMMG, o cálculo do tamanho amostral determinou o
número partos que deveriam ser seguidos para identificação dos casos de ¨near
miss¨. Estimou-se a incidência aproximada de 8 casos de ¨near miss¨ por 1000
partos, baseado em estudos prévios. Assim, aproximadamente 75.000 partos
deveriam ser seguidos , adotando-se o índice de segurança de 25%. (Haddad
et al., 2011)

Sujeitos e Método 13
Para cumprir o segundo objetivo, todas as mulheres admitidas para parto
no CAISM no período de janeiro 2009 a julho de 2013 foram avaliadas,
estimando-se uma prevalência de 3000 partos por ano, com taxa de cesárea
em torno de 40%. (Costa et al., 2010)
3.3. Variáveis
3.3.1. Variável independente:
Via de parto: Parto abdominal (cesárea) ou parto vaginal (normal ou
fórcipe).
Morbidade Materna Grave: definida pela admissão em unidade de terapia
intensiva, segundo consta no prontuário; categorizada em presente ou
ausente (Oliveira Neto et al., 2009; Souza et al.; 2010).
3.3.2. Variáveis dependentes:
Os 10 grupos da Classificação de Robson:
Grupo 1. Nulíparas, gestação única, cefálica, ≥37 semanas, trabalho de
parto espontâneo;
Grupo 2. Nulíparas, gestação única, cefálica, ≥ 37 semanas, indução ou
cesárea antes do início do trabalho de parto;
Grupo 3. Multíparas (sem cesárea anterior), gestação única, cefálica, ≥ 37
semanas, trabalho de parto espontâneo;

Sujeitos e Método 14
Grupo 4. Multíparas (sem cesárea anterior), gestação única, cefálica, ≥ 37
semanas, indução ou cesárea antes do trabalho de parto;
Grupo 5. Multíparas com cesárea anterior, gestação única, cefálica, ≥ 37
semanas;
Grupo 6. Todas apresentações pélvicas em nulíparas;
Grupo 7. Todas apresentações pélvicas em multíparas (incluindo cesárea
anterior);
Grupo 8. Todas gestações múltiplas (incluindo cesárea anterior);
Grupo 9. Todas situações anormais (incluindo cesárea anterior);
Grupo10. Todas gestações únicas, cefálicas, ≤ 36 semanas (incluindo
cesárea anterior);
3.3.3. Variáveis de controle
Ano: ano em que ocorreu o parto (2009 a 2013)
História reprodutiva: histórico sobre o número prévio de gestações e
seus desfechos; identificado pelo prontuário médico; categorizado pelo
número de gestações, partos normais, partos por cesárea e abortos.
Forma de início do trabalho de parto: descrição da forma de início do
trabalho de parto da atual gestação, segundo consta no prontuário
médico, categorizada em trabalho de parto espontâneo, trabalho de parto
induzido ou parto cesárea antes do início do trabalho de parto.

Sujeitos e Método 15
Idade gestacional ao nascimento: variável numérica contínua,
correspondente ao número de semanas de gestação no momento do
parto, calculada pela data da última menstruação ou por ultrassonografia
precoce (<20 semanas) ou considerando-se ainda os dados da avaliação
somática do recém-nascido, segundo dados do prontuário médico.
Número de nascidos vivos: número de nascidos da gestação atual,
segundo dados do prontuário médico, categorizada em: 1, 2 ou 3.
Condição de alta materna: forma de término da internação hospitalar da
mulher, identificada pela revisão de prontuário, categorizada como alta
médica, óbito ou transferência.
3.4. Seleção dos sujeitos
Para a RBVMMG, a população foi formada por todas as mulheres
internadas nos hospitais participantes durante o período do estudo que
apresentaram algum dos critérios diagnósticos de ¨near miss¨, de condições
potencialmente ameaçadoras da vida materna, faleceram ou foram transferidas
para outros serviços de saúde. Nas 27 instituições participantes da RBVMMG,
ocorreram 82388 partos, sendo 9555 casos de morbidade materna grave
(condições potencialmente ameaçadoras de vida, eventos de ¨near miss¨ e
mortes maternas) nos doze meses de estudo. Para a análise em questão, dos
9555 casos iniciais, foram excluídos os abortos, as gestações ectópicas e

Sujeitos e Método 16
aquelas que receberam alta hospitalar ainda sem a resolução da gestação. Dos
8330 restantes, foram excluídos os casos com quaisquer dados faltantes na
ficha de coleta que impedissem a sua classificação, sendo consideradas,
portanto, 7.247 mulheres no presente estudo.
Para os dados do CAISM, foi realizado um estudo de corte transversal,
com avaliação de todas as mulheres admitidas para no período de janeiro 2009
a julho de 2013. Adicionalmente, a distribuição das mulheres entre os diferentes
grupos foi comparada entre os casos que tiveram morbidade materna grave,
definida pela necessidade de internação em UTI (Souza et al., 2010), com os
demais casos.
3.5. Instrumento para coleta de dados
Para a coleta dos dados da RBVMMG foi desenvolvida uma ficha de
identificação dos casos (anexo 4), e preenchida para todas as internações
hospitalares (com dados dos prontuários médicos), visando a identificar os
possíveis casos de MMG. Esses prontuários foram posteriormente revisados
para a coleta de dados logo após a alta hospitalar, a transferência da mulher ou
a morte materna. Para os casos selecionados, outra ficha era preenchida
(anexo 5). Foi utilizado um banco de dados on line que continha formulários
eletrônicos abrigados no website do projeto (openclinica®), hospedado na
página institucional da web do Hospital da Mulher Prof. Dr. José Aristodemo
Pinotti - Centro de Atenção Integral à Saúde da Mulher (CAISM) da UNICAMP.

Sujeitos e Método 17
Informações não disponíveis no prontuário, mas de interesse para a pesquisa,
foram obtidas junto à equipe assistente. O número total de partos e o número
total de mortes maternas por centro colaborador no período de estudo também
foram coletados.
Para o CAISM, os dados foram compilados a partir da base de dados
informatizada da instituição, com posterior verificação criteriosa de consistência
e revisão de prontuários médicos, quando necessário. Vale ressaltar que houve
uma mudança na base de dados a partir de 2009, com inclusão de todas as
variáveis necessárias para a classificação de mulheres segundo RTGCS, desde
a publicação do estudo com dados locais (Costa et al., 2010).
3.6. Processamento dos dados
Para a RBVMMG, foi realizada a codificação dos dados, para alocação de
todas as mulheres, segundo os 10 grupos da classificação de Robson. Para o
Caism, os dados foram compilados da base de dados hospitalares da instituição
para uma base de dados Excel, com avaliação descritiva da distribuição de
todas as mulheres admitidas para parto nos 10 grupos. Para aquelas pacientes
em que o banco de dados estava incompleto e impossibilitava a classificação
da mesma em um dos 10 grupos, foi solicitado o prontuário junto ao serviço de
arquivo médico da instituição, perfazendo cerca de 500 prontuários, onde todas
as informações necessárias para a classificação puderaram ser recuperadas e
nova verificação criteriosa de consistência foi realizada.

Sujeitos e Método 18
3.7. Plano de análise dos dados
Para a RBVMMG, foi calculada a taxa de cesárea de cada grupo (dividindo o
número de cesáreas de cada grupo pelo total de mulheres pertencentes a esse
mesmo grupo), a taxa relativa de cesárea (dividindo-se o número de cesáreas
de cada grupo pelo total de cesáreas) e a taxa geral de cesárea (dividindo-se o
número de cesáreas de cada grupo pelo total de partos da população
estudada). (Robson, 2001b) Além disso, as mulheres de cada um dos 10
grupos foram alocadas de acordo com a gravidade do desfecho do caso, em
condição potencialmente ameaçadora de vida (PLTC) ou ¨near miss¨/óbito
materno (SMO). A razão entre SMO e PLTC também foi relatada para cada
grupo. Adicionalmente, a contribuição de cada grupo deste estudo para as
taxas de cesárea foi comparada com os resultados de avaliação populacional
similar para o Brasil disponível no estudo Global Survey da WHO (Betrán et al.,
2007). Foram também distribuídas conforme a principal causa identificada de
morbidade grave (hemorrágica, hipertensiva, infecciosa, clínico-cirúrgica)
(Haddad., 2011). Alguns grupos de Robson foram posteriormente subdivididos,
segundo sugestão do próprio autor da classificação (Robson, 2001a). Os
grupos 2 e 4 (respectivamente nulíparas e multíparas, com gestação única,
cefálico, a termo, trabalho de parto induzido ou cesárea antes do início do
trabalho de parto) foram avaliados segundo realização de indução de parto
(grupos 2a e 4a) ou parto cesárea antes do início do trabalho de parto (grupos
2b e 4b). Além disso, o grupo de mulheres com gestação única, apresentação
cefálica e que tiveram parto prematuro, incluindo cesárea anterior (grupo 10), foi

Sujeitos e Método 19
subdividido em parto espontâneo (grupo 10a), trabalho de parto induzido (grupo
10b), e cesárea antes do início do trabalho de parto (grupo 10c).
Para os dados do CAISM, A abordagem analítica correspondeu à distribuição
percentual de todos os casos entre os dez grupos da classificação de Robson e
a contribuição geral e proporcional de cada grupo para as taxas de cesárea.
Além disso, foi realizada uma comparação com resultados publicados de outro
grande estudo, realizado em diferentes contextos e países, fundamentalmente
com os dados para o Brasil, disponíveis no estudo Global Survey da WHO
(Betrán et al., 2007). Adicionalmente, a distribuição das mulheres entre os
diferentes grupos foi comparada entre os casos que tiveram morbidade materna
grave, operacionalmente definida pela necessidade de internação em unidade
de terapia intensiva (UTI), com os demais casos (Souza et al., 2010).
Comparações entre a prevalência geral de cesáreas e entre cada grupo de
Robson foram conduzidas levando em consideração os diferentes anos do
estudo, para tentar identificar alguma tendência (2009 a 2013), com a diferença
entre os grupos avaliada pelo teste do 2 para tendência. As análises foram
feitas em planilha Excel e com o software Epi.Info versão 3.5.4, utilizando-se o
limite do valor de p de 5% para significância estatística entre os valores
comparados.

Sujeitos e Método 20
3.8. Considerações Éticas
Na RBVMMG, o centro coordenador submeteu o projeto de pesquisa
inicialmente à apreciação do Comitê de Ética em Pesquisa (CEP) local e,
posteriormente, o projeto foi encaminhado à apreciação do CONEP; os centros
colaboradores também aprovaram o projeto nos respectivos Comitês de Ética
em Pesquisa. Foi solicitada a dispensa do termo de consentimento livre e
esclarecido. Foram mantidos todos os princípios que regulam as pesquisas em
seres humanos. (Anexo 6)
Para os dados do CAISM foram cumpridos todos os princípios enunciados
na Declaração de Helsinque e na Resolução 466/12 do Conselho Nacional de
Saúde. A confidencialidade dos dados pessoais foi garantida. A identidade dos
indivíduos não foi revelada. Por isso foi solicitada a dispensa do consentimento
livre e esclarecido. (Anexo 6)

Publicações 21
4. Publicações
Artigo 1 - Robson Ten Group Classification System applied to women
with severe maternal morbidity
Artigo 2 - The use of the Robson Ten Group Classification System to
appraise deliveries at a tertiary referral hospital and its
association with severe maternal morbidity

Publicações 22
4.1. Artigo 1

Publicações 23
ORIGINAL RESEARCH
Robson Ten Group Classification System applied to women with
severe maternal morbidity
Elton Carlos Ferreira1, Maria Laura Costa1, José Guilherme Cecatti1, Samira M Haddad1, Mary Angela Parpinelli1, Michael S Robson2, and the Brazilian Network for Surveillance of Severe Maternal Morbidity Study Group
1. Department of Obstetrics and Gynecology, University of Campinas, School of Medicine, Campinas, Brazil. 2. National Maternity Hospital, Dublin, Ireland, UK.
Correspondence to: Jose G Cecatti Departamento de Tocoginecologia, Universidade Estadual de Campinas Campinas, Brasil R. Alexander Fleming, 101; 13083-881 Campinas-SP, Brasil Phone: +55-19-35219482 Fax: +55-19-35219304 E-mail: [email protected].
Word count: 3499

Publicações 24
Abstract
Objective: To evaluate the distribution of women with severe maternal morbidity
(SMM) according to Robson´s 10 Group Classification System (RTGCS).
Methods: secondary analysis of a multicenter cross-sectional study in 27 obstetric units
in Brazil, using RTGCS. Cesarean section (CS) rates were obtained and cases were
classified into potentially life-threatening condition (PLTC) or maternal near-miss/death
(SMO), according to severity. Certain groups were subdivided for further analysis.
Results: among 7247 women with SMM, 73.2% underwent CS. Group 10 (single,
cephalic, preterm) was the most prevalent (33.9%). Groups mostly associated with a
SMO were: 7 (multiparous, breech), 9 (all abnormal lies, single, term), 8 (all multiple)
and 10. Groups 1 (nulliparous, single, cephalic, term, spontaneous) and 3 (multiparous,
single, cephalic, term, spontaneous) were associated with better maternal outcome.
Group 3 had one SMO to 29 cases of PLTC, but the ratio was 1:10 for women
undergoing CS, indicating a worse outcome. Group 4a (multiparous, no previous CS,
single, cephalic, term, induced labor) had a better maternal outcome than those
delivered by CS before labor (group 4b). Hypertension was the most common condition
of severity.
Conclusions: the RTGCS was useful to consider SMM, showing groups with higher
cesarean section rates and worse maternal outcomes.
Keywords: severe maternal morbidity, cesarean section, classification of cesarean
section, maternal near-miss

Publicações 25
Introduction
In Brazil, a significant reduction in the ratio of maternal deaths has occurred from
1990 to 2010, dropping from 141 to 68 per 100 thousand live births (a 51% decrease),
according to the Ministry of Health. However, the aim established by the Millennium
Development Goals for 2015 is still far from being achieved (1,2). Although maternal
mortality is the main issue, it represents only a portion of the problem. Therefore,
morbidity in maternal health studies has gained increasing importance, especially after
the recent standardization of the World Health Organization for criteria that define
potentially life-threatening conditions and maternal near-miss events. (3-5)
Simultaneously, there has been a growing rate of cesarean section worldwide. It has
become a public health issue and is the cause of considerable debate due to its
potential maternal and perinatal risks. (6) The World Health Organization established
almost 30 years ago that no region/country should exceed the cesarean section rate of
15% and recently confirmed that in high income countries no benefits are seen in
maternal and neonatal survival with higher rates. However, this goal is far from being
achieved, in both high-income and middle-income countries (7,8). According to recent
data, 24.3% of deliveries in North America occur by cesarean section, achieving rates of
31% in Central America, surpassing 30% in European countries and 40% in many Latin
American countries. (9)
There are major difficulties in evaluating and comparing the results of studies on
births and cesarean section rates. A variety of classification systems have been
proposed in an attempt to minimize this limitation (6). A classification system proposed
in 2001, termed the Robson Ten Group Classification System (RTGCS), was aimed at
describing clinically relevant groups according to characteristics of women admitted for
delivery. This evaluation was based on distinct individual features of every pregnancy
and not surgical indication: single or multiple pregnancy, parity and presence of
previous cesarean section, presentation, initial mode of delivery or cesarean section
before onset of labor, and gestational age at delivery. The ten groups are mutually
exclusive and totally inclusive, i.e., all women may be classified. However, each woman

Publicações 26
belongs to only one of these groups (Table 1) (10). Although the RTGCS was popularized
by CS, it was designed to look at all events and outcomes related to labor and delivery.
A systematic review conducted in 2011 that analyzed diverse classification systems
of cesarean section showed that the RTGCS encompasses local and international needs,
allowing for analysis and comparison of cesarean section rates among different
hospitals, cities, countries and regions, in addition to permitting evaluation in the same
unit during different time periods. (6)
Up to now, no study has generically evaluated the application of the Robson Ten
Group Classification System (RTGCS) to women with severe maternal morbidity. In
general, it is believed that women suffering from a significant event during pregnancy,
characterizing a potentially life-threatening condition, maternal near miss or death, are
more likely to be delivered by cesarean section. This study proposes to evaluate the
cesarean section rates in these women, its distribution among the 10 groups, a
comparison with other populations and a possible association between the diverse
groups and a worse maternal outcome.
Material and Methods
A secondary analysis was performed with the database from a multicenter cross-
sectional study carried out in 27 Brazilian referral maternity hospitals, located in the
five regions of the country, participating in the Brazilian Network for the Surveillance of
Severe Maternal Morbidity. (11) The concept of maternal morbidity used in this study
was published in 2009 by the World Health Organization (WHO), with standardized
criteria that consider organ dysfunction and/or failure, through the use of clinical signs,
laboratory tests and management interventions. There are 25 proposed severity
markers to adequately cover a large range of life-threatening conditions. Near miss is
defined as an event as similar to maternal death as possible, in which the woman
survives due to timely interventions or just good fortune (5)
A prospective surveillance was conducted in all women hospitalized for severe
maternal morbidity with data collection after patient outcome (hospital discharge,
transfer or death) during a 12-month period, from July 2009 to June 2010. Data were

Publicações 27
collected in specific forms and entered into the electronic database in the OpenClinica®
platform. Details of the method for the original study were already published
elsewhere. (11)
For data collection, a patient identification form was developed for use in all hospital
admissions related to pregnancy, aimed at identifying possible SMM cases. Then, data
obtained from the respective forms was entered into a clinical research form (CRF),
which was subsequently reviewed soon after hospital discharge. An online database
containing electronic forms was hosted in the project website and embedded in the
web page of the coordinating center of the study. Any information unavailable in the
charts but of interest to the study was obtained from the attending professionals. The
total number of deliveries and total number of maternal deaths per collaborating
center during the study period were also collected. Local IRB and national IRB approval
was granted prior to the initiation of data collection.
Quality control was assured by various manners. Initially, before data collection was
initiated, researchers from each center received a manual of operations and received
training in the procedures predicted in the study. During data collection, each
coordinator reviewed the forms, checked for completeness and consistencies, and
provided search for unavailable data. Local investigator conducted a new review aimed
at identifying any possible inconsistencies. Finally, the national coordinators of the
project reviewed the database, identified inconsistencies and sent the report with
corrections to the participating centers which made the alterations required.
For this analysis, data coding was performed to categorize all women into the
Robson 10 group classification system. The cesarean section rate from each group was
calculated (dividing the number of cesarean sections in each group by the total number
of women belonging to the same group), the relative cesarean section rate (dividing
the number of cesarean sections in each group by the total number of cesarean
sections) and overall cesarean section rate (dividing the number of cesarean sections in
each group by the total number of deliveries in the study population). (12)

Publicações 28
In addition, women from each of the 10 groups were classified into a potentially life-
threatening condition (PLTC) or maternal near miss/death (severe maternal outcome =
SMO), according to the severity of pregnancy outcome. The ratio between SMO and
PLTC was also reported for each group. Furthermore, in this study the contribution of
each group to cesarean section rates was compared to the results obtained from a
similar population-based evaluation for Brazil that is available in the WHO Global
Survey (11). Women were also distributed according to the main cause of severe
morbidity identified (hemorrhage, hypertension, infection, clinical/surgical).
Certain Robson groups were further subdivided, following a suggestion made by the
own author of the classification system (Robson). (10,13) Groups 2 and 4 (nulliparous
and multiparous women respectively, with single, cephalic, term pregnancies, induced
labor or cesarean section before onset of labor) were evaluated according to the
induction of labor (groups 2a and 4a) or cesarean delivery before onset of labor (groups
2b and 4b). In addition, the group of women with a single pregnancy, cephalic
presentation, preterm delivery, including those with a previous cesarean section (group
10), were further subdivided into spontaneous delivery (group 10a), induced labor
(group 10b), and cesarean section before onset of labor (group 10c).
In order to understand possible denominators for the presented study numbers, we
performed a comparison to already published data for Brazil´s WHO Global Survey (14),
since we do not have the figures for the overall population without maternal morbidity
during the same time period for these facilities.
Results
In the 27 institutions participating in the Brazilian Network for Surveillance of Severe
Maternal Morbidity 82,388 deliveries were covered, identifying 9,555 cases of severe
maternal morbidity (potentially life-threatening conditions, maternal near miss events
and maternal deaths) in the twelve-month study period. For the current analysis,
abortions, ectopic pregnancies and women discharged from the hospital before
pregnancy resolution were excluded from the total 9,555 cases. Of the remaining 8,330

Publicações 29
women, cases with any missing data from the collection chart which could preclude its
classification were also excluded from the study. Therefore, 7,247 women were further
considered for the current analysis. (Figure 1)
The overall cesarean section rate in this study was 73.2%. Considering the total
number of cases (vaginal deliveries and cesarean sections), the most prevalent
Robson´s group in women with severe morbidity was the group with a single, cephalic
pregnancy and gestational age lower than 37 weeks, including previous cesarean
section (group 10) with 33.9% of deliveries, and this group was also responsible for the
highest (28%) overall cesarean delivery rates among groups. The group composed of
nulliparous women, with a single, cephalic, term pregnancy, and induced labor or
cesarean delivery before onset of labor (group 2) had the second highest prevalence
rate (16.2%) and was also the group that most contributed (14.2%) to the overall
cesarean delivery rate. The group of multiparous women, with a single, cephalic, term
pregnancy and a previous cesarean delivery (group 5) ranked third as the group that
contributed most to the high cesarean delivery rates (10.2%) and ranked fourth in
absolute numbers (12.0%). In contrast, the nulliparous group, with a single, cephalic,
term pregnancy, spontaneous labor (group 1) was the third (12.5%) and fourth most
prevalent group (5.2%) contributing to the overall cesarean delivery rate. The group
composed of multiparous women, with a single, cephalic, term pregnancy,
spontaneous labor, excluding those with a previous cesarean section (group 3), despite
being highly prevalent (8.3%), contributed to only 1.5% of the total number of cesarean
deliveries. (Table 1)
The Robson groups with the smallest number of cases were composed of multiple
pregnancies and those with presentations other than cephalic (groups 6 to 9). These
groups had a high cesarean delivery rate within the group (88.2%, 86.8%, 90.1%, and
93.7%, respectively). However, due to the small sample, there was only a slight
contribution to the overall cesarean delivery rate. (Table 1)
When evaluating the severity of patients outcome in PLTC or SMO (MD+MNM), we
observed that the multiparous group, with single, breech presentation, including those

Publicações 30
with previous cesarean section (group 7) and the group of single pregnancies, abnormal
lies, including those with previous cesarean section (group 9) were more closely
associated with an unfavorable outcome, resulting in 1 case of maternal near
miss/death for every 6 cases of potentially life-threatening conditions, and the ratio
was 1:7 in group 8 (all multiple pregnancies, including previous cesarean sections) and
1:8 in group 10 (with a single, cephalic, preterm labor, including previous cesarean
sections). Groups with more favorable outcomes were groups 1 (nulliparous women,
with a single, cephalic, term pregnancy and spontaneous labor) and 3 (multiparous
women, with a single, cephalic, term pregnancy and spontaneous labor without a
previous cesarean section). (Table 2)
In the evaluation of progression to severity in the general group compared to
women delivered by cesarean section, group 3 needs to be highlighted. Group 3 had a
significantly worse SMO: PLTC ratio, ranging from 1:29 in the general evaluation (Table
2) to 1:10 in the cesarean delivery group. (Table 3)
In Table 4, we subdivided some of the Robson groups considered heterogeneous to
evaluate if there was any difference in the maternal near miss/death outcome between
subgroups. The disparity found among the group of multiparous women, with a single,
cephalic, term pregnancy and without a previous cesarean section (group 4) was
noteworthy. In women who had induced labor (group 4a), the SMO:PLTC ratio was
1:30, while the same ratio in women undergoing cesarean section before onset of labor
(group 4b) was 1:10. (Table 4)
The major cause of morbidity, considering all Robson groups was hypertension,
achieving 77.4% of the study population, with a higher prevalence in group 2
(nulliparous women, with a single, cephalic, term pregnancy, who had labor induced or
a cesarean delivery before onset of labor). The second major cause of morbidity in
these women was hemorrhage, accounting for 21.4% of the cases included, and group
3 (multiparous women, with a single, cephalic, term pregnancy and spontaneous labor,
excluding previous cesarean section) was the most prevalent (37.2%). Clinical-surgical
causes were responsible for 6.8% the total number of cases, with the most evident

Publicações 31
participation in group 4 (12.8%). In contrast, infectious causes accounted for 0.5% of
the total number of cases, highlighting group 7 (1.8%). (Table 5)
In the same analysis for women who progressed to cesarean delivery (data not
shown), hypertension remained the major cause of morbidity (82.4%). However, there
was a higher prevalence of hypertension in group 1 (87.5%). When evaluating
hemorrhage as the cause of severe morbidity, among cesarean deliveries, we had an
important decrease in the percentages in groups 1 and 3, dropping from 24.6% and
37.2% to 11.4% and 21.6%, respectively. There were no important differences in
infectious and clinical/surgical causes.
We made a comparison between data from this study and the Global Survey Brazil
(14). The former studied the obstetric population with severe maternal morbidity and
the latter evaluated the general Brazilian obstetric population. Group 3 (multiparous
women, in spontaneous labor, with a cephalic pregnancy and without a previous
cesarean delivery) and group 1 (nulliparous women, in spontaneous labor, with a
single, cephalic pregnancy) had the highest prevalence rates in the population
considered in the Global Survey Brazil, accounting for 30.9% and 28.6%, respectively.
On the other hand, in the current study the most prevalent groups were group 10
(single, cephalic, preterm labor, including those with a previous cesarean section),
accounting for 33.9% and group 2 (nulliparous women, with a single, cephalic
pregnancy, induced labor or cesarean delivery before onset of labor), accounting for
16.2% of the cesarean delivery rates. In both studies, group 5 (multiparous women,
with a single, cephalic, term pregnancy and a previous cesarean section) had significant
values, with 12% in the severe morbidity network and 11.1% in the general population.
Cesarean delivery rates of the two studies were quite distinct from each other (73.2%
in the network study and 29.6% in the Global Survey-Brazil). In the latter, group 5
contributed most substantially to the overall cesarean delivery rate, with 8.5%,
followed by group 1, with 4.0%. In contrast, in the morbidity network study, group 10
with 28.0%, group 2 with 14.2% and group 5 with 10.2% contributed most substantially
to the overall cesarean delivery rate. (Table 6)

Publicações 32
Discussion
The evaluation of births and cesarean section rates according to the Robson Ten Group
Classification System (RTGCS) has been used in several studies in many countries
worldwide (15), allowing the comparison of their rates among health services and
within the same service over time (6). However, to the best of our knowledge, this is
the first time that such a classification is used for a specific population of women with
severe maternal morbidity.
As expected, the cesarean section rate found in our study was considerably
elevated, achieving 73.2%, values obviously and significantly higher than in the Brazilian
general population, which is 29.6%, as shown in the Global Survey Brazil (14) and much
higher than the 15% recommended by WHO. It is probable that this important
difference is due to severe maternal conditions contributing to the indication of
cesarean delivery. In the literature, there are no specific recommendations for
cesarean delivery rates in high-risk populations. Nevertheless, this evaluation could
actually have a significant impact on current clinical practice and overall cesarean
delivery rates in diverse scenarios.
Unfortunately, for this study we do not have the numbers for the overall population
without maternal morbidity, as an ideal model for evaluating the difference in
contribution for each of the groups from RTGCS. In order to best estimate this
approach, the data from Global Survey was assessed.
Previous studies using RTGCS have shown that groups 3 (multiparous women, with a
single, cephalic, term pregnancy and spontaneous labor, excluding a previous cesarean
section) and 1 (nulliparous women, with a single, cephalic, term pregnancy and
spontaneous labor) had the highest prevalence rate, and group 5 (multiparous women,
with a single, term pregnancy and a previous cesarean section) and 2 (nulliparous
women, with a single, cephalic, term pregnancy, induced labor or cesarean section
before the onset of labor) had the highest cesarean section rates. Group 10 (with a
Publicações 33
single, cephalic, preterm labor, including a previous cesarean section) had a relatively
small sample and a low rate of cesarean delivery. (14, 16-20)
In the current study, group 10 was the largest group admitted for labor (33.9%) and
also the most relevant for the overall cesarean delivery rate (28%). The higher
prevalence and higher rate of cesarean section in this group in the severe maternal
morbidity group could be explained by maternal decompensation and/or fetal distress
due to pathological condition of the woman, leading to the indication of cesarean
delivery (21). Further attempts at labor induction in this specific group could possibly
show results of increased vaginal delivery rates, taking therapeutic prematurity into
consideration.
Furthermore, in the current study, group 5 (with a single, cephalic, term pregnancy
and a previous cesarean section) contributed significantly to the overall cesarean
delivery rate (10.2%), a value higher than that observed in the general Brazilian
population (8.5%) (14). When we compared this group to multiparous women without
a previous uterine scar (groups 3 and 4), the cesarean section rate in the latter group
was lower, showing that previous cesarean section increases the indication of surgical
delivery in future pregnancies. Comparing similar groups of women such as groups 2
and 4 or groups 1 and 3, we conclude that having had previous vaginal delivery
decreases the likelihood of delivery by cesarean section in subsequent pregnancies.
Considering that cesarean section rates in the current study were significantly
elevated in highly prevalent groups, such as groups 1 and 2 (nulliparous women, with a
single, cephalic, term pregnancy) and knowing that cesarean section is more prevalent
(14, 19, 20, 22) in women with a previous uterine scar (Group 5), health policies should
be focused both on the prevention of cesarean deliveries in women without a previous
uterine scar and the increase in vaginal deliveries among women with a previous
cesarean section (VBAC) (23), since vaginal delivery is a safe option for the majority of
women in this condition (18, 24, 25). Furthermore, there are studies showing a positive
relationship between a previous uterine scar and puerperal hysterectomy (26), making
a future increase in group 5 even more worrisome.

Publicações 34
In the current study, one case of maternal death/near miss occurred for every 12
cases of potentially life-threatening conditions. The most severe cases were
concentrated in groups 7 to 10 and the impact may have been due to prematurity,
which was highly frequent among the morbidity cases evaluated. It was noteworthy
that women with multiparous breech presentation (group 7) and women with an
abnormal lie (group 9), had a very high overall rate of cesarean deliveries and also a
high rate of bleeding complications. Since multiparity and cesarean sections are risk
factors for uterine atony (27), it is possible that a higher incidence of this complication
could justify the high rates of bleeding complications in this group of women. This
relevant observation draws attention to this risk, stimulating preventive measures,
along with an early diagnosis and treatment of complications. The main cause of
maternal morbidity in all groups was hypertension, followed by hemorrhage, findings
that are in agreement with results in the literature. (28, 29) Infectious causes had a low
rate in the study population, probably because women suffering abortion were
excluded from the study for classification purposes to the RTGCS (30).
The study had some limitations including the loss of 13% of cases due to the lack of
information or incomplete information obtained from charts created by the Brazilian
Network for Surveillance of Severe Maternal Morbidity, making it impossible to classify
these pregnant women into one of the ten Robson groups. There is an enormous
amount of information necessary for adequate classification and we believe that the
13% loss was acceptable and did not have a damaging effect on the analyses and
results presented.
The study demonstrated a high cesarean delivery rate in women with severe
maternal morbidity and the use of RTGCS for evaluation of deliveries in this population
proved to be extremely useful, showing clinically relevant groups with high rates of
abdominal deliveries and specific groups more weakly associated with severe maternal
outcome. Although perfectly understandable that cases of severe morbidity would
more frequently justify the option for a cesarean section, we cannot forget the
concrete possibility that excessive high rates of cesarean sections without a clear
Publicações 35
medical indication are probably associated also with higher rates of postpartum
morbidities. The RTGCS although popularized by its use to address cesarean sections
was designed to look at all events and outcomes related to labor and delivery. Further
studies are needed to understand and assess possible interventions in populations at
risk, as well as to define the expected cesarean section rate in this group.
Conflict of interests The authors denied any conflicts of interests Authors' contributions The idea for the study arose in a group discussion among all the authors. At the end of data collection, ECF, MLC, JGC and MHS prepared a detailed plan of analysis which was then performed by MHS. The first version of the manuscript was drafted by ECF and MLC, and then complemented with suggestions made by the other authors. JGC and MLC supervised the entire process. All authors contributed to the development of the study protocol and approved the final version of the manuscript. Acknowledgements The authors acknowledge the financial support of CNPq/DECIT (The National Research Council and the Department of Science and Technology of the Brazilian Ministry of Health), grant number 402702/2008-5 and also the involvement of its Steering Committee members and all other investigators and coordinators from all centers. Brazilian Network for Surveillance of Severe Maternal Morbidity Study Group: Joao P Souza, Rodrigo S Camargo, Rodolfo C Pacagnella, Fernanda G Surita, Joao L Pinto e Silva, Maria H Sousa, Marilza V Rudge, Iracema M Calderon, Maria V Bahamondes, Danielly S Santana, Simone P Gonçalves, Olímpio B Moraes Filho, Simone A Carvalho, Francisco E Feitosa, George N Chaves, Ione R Brum, Gloria C Saint’ynes, Carlos A Menezes, Patricia N Santos, Everardo M Guanabara, Elson J Almeida Jr, Joaquim L Moreira, Maria R Sousa, Frederico A Peret, Liv B Paula, Luiza E Schmaltz, Cleire Pessoni, Leila Katz, Adriana Bione, Antonio C Barbosa Lima, Edilberto A Rocha Filho, Melania M Amorim, Debora Leite, Ivelyne Radaci, Marilia G Martins, Frederico Barroso, Fernando C Oliveira Jr, Denis J Nascimento, Cláudio S Paiva, Moises D Lima, Djacyr M Freire, Roger D Rohloff, Simone M Rodrigues, Sergio M Costa, Lucia C Pfitscher, Adriana G Luz, Daniela Guimaraes, Gustavo Lobato, Marcos Nakamura-Pereira, Eduardo Cordioli, Alessandra Peterossi, Cynthia D Perez, Jose C Peraçoli, Roberto A Costa, Nelson L Maia Filho, Jacinta P Matias, Silvana M Quintana, Elaine C Moises, Fátima A Lotufo, Luiz E Carvalho, Elvira A Zanette, Carla B Andreucci, Márcia M Aquino, Maria H Ohnuma, Rosiane Mattar and Felipe F Campanharo.

Publicações 36
References 1. Barros FC, Matijasevich A, Requejo JH, Giugliani E, Maranhão AG, Monteiro CA, et al.
Recent trends in maternal, newborn, and child health in Brazil: progress toward Millennium Development Goals 4 and 5. Am J Public Health. 2010;100(10):1877-89.
2. UN Department of Economic and Social Affairs. The Millennium Development Goals Report 2013. New York: United Nations Department of Economic and Social Affairs: 64p., 2013. Available at https://www.unfpa.org/public/publications/pid/6090.
3. Pacagnella RC, Cecatti JG, Camargo RP, Silveira C, Zanardi DT, Souza JP, et al. Rationale for a long-term evaluation of the consequences of potentially life-threatening maternal conditions and maternal "near-miss" incidents using a multidimensional approach. J Obstet Gynaecol Can. 2010;32(8):730-8.
4. Geller SE, Rosenberg D, Cox SM, Brown ML, Simonson L, Driscoll CA, et al. The continuum of maternal morbidity and mortality: factors associated with severity. Am J Obstet Gynecol. 2004;191(3):939-44.
5. Say L, Souza JP, Pattinson RC, WHO working group on Maternal Mortality and Morbidity classifications. Maternal near miss--towards a standard tool for monitoring quality of maternal health care. Best Pract Res Clin Obstet Gynaecol. 2009;23(3):287-96.
6. Torloni MR, Betran AP, Souza JP, Widmer M, Allen T, Gulmezoglu M, et al. Classifications for cesarean section: a systematic review. PLoS One. 2011;6(1):e14566.
7. World Health Organization. Appropriate technology for birth. Lancet. 1985;2(8452):436-7.
8. Ye J, Betrán AP, Vela MG, Souza JP, Zhang J. Searching for the Optimal Rate of Medically Necessary Cesarean Delivery. Birth. 2014; in press (doi: 10.1111/birt.12104).
9. Betrán AP, Merialdi M, Lauer JA, Bing-Shun W, Thomas J, Van Look P, et al. Rates of caesarean section: analysis of global, regional and national estimates. Paediatr Perinat Epidemiol. 2007;21(2):98-113.
10. Robson MS. Classification of caesarean sections. Fetal Mat Med Rev 2001; 12:23-39. 11. Haddad SM, Cecatti JG, Parpinelli MA, Souza JP, Costa ML, Sousa MH, et al. From
planning to practice: building the national network for the Surveillance of Severe Maternal Morbidity. BMC Public Health. 2011;11:283.
12. Robson MS. Can we reduce the caesarean section rate? Best Pract Res Clin Obstet Gynaecol. 2001;15(1):179-94.
13. Farine D, Shepherd D. Classification of caesarean sections in Canada: the modified Robson criteria. J Obstet Gynaecol Can. 2012;34(10):976-9.
14. Betrán AP, Gulmezoglu AM, Robson M, Merialdi M, Souza JP, Wojdyla D, et al. WHO global survey on maternal and perinatal health in Latin America: classifying caesarean sections. Reprod Health. 2009;6:18.
15. Brennan DJ, Robson MS, Murphy M, O'Herlihy C. Comparative analysis of international cesarean delivery rates using 10-group classification identifies significant variation in spontaneous labor. Am J Obstet Gynecol. 2009;201(3):308.e1-8.
16. Costa ML, Cecatti JG, Souza JP, Milanez HM, Gülmezoglu MA. Using a Caesarean Section Classification System based on characteristics of the population as a way of monitoring obstetric practice. Reprod Health. 2010;7:13.
17. Howell S, Johnston T, Macleod SL. Trends and determinants of caesarean sections births in Queensland, 1997-2006. Aust N Z J Obstet Gynaecol. 2009;49(6):606-11.

Publicações 37
18. Chong C, Su LL, Biswas A. Changing trends of cesarean section births by the Robson Ten Group Classification in a tertiary teaching hospital. Acta Obstet Gynecol Scand. 2012;91(12):1422-7.
19. Ciriello E, Locatelli A, Incerti M, Ghidini A, Andreani M, Plevani C, et al. Comparative analysis of cesarean delivery rates over a 10-year period in a single Institution using 10-class classification. J Matern Fetal Neonatal Med. 2012;25(12):2717-20.
20. Kelly S, Sprague A, Fell DB, Murphy P, Aelicks N, Guo Y, et al. Examining caesarean section rates in Canada using the Robson classification system. J Obstet Gynaecol Can. 2013;35(3):206-14.
21. Souza JP, Cecatti JG, Faundes A, Morais SS, Villar J, Carroli G, et al. Maternal near miss and maternal death in the World Health Organization's 2005 global survey on maternal and perinatal health. Bull World Health Organ. 2010;88(2):113-9.
22. Lee YY, Roberts CL, Patterson JA, Simpson JM, Nicholl MC, Morris JM, et al. Unexplained variation in hospital caesarean section rates. Med J Aust. 2013;199(5):348-53.
23. Delbaere I, Cammu H, Martens E, Tency I, Martens G, Temmerman M. Limiting the caesarean section rate in low risk pregnancies is key to lowering the trend of increased abdominal deliveries: an observational study. BMC Pregnancy Childbirth. 2012;12:3.
24. Roberts CL, Algert CS, Ford JB, Todd AL, Morris JM. Pathways to a rising caesarean section rate: a population-based cohort study. BMJ Open. 2012;2(5).
25. National Institute of Health. National Institutes of Health Consensus Development Conference Statement. Vaginal birth after cesarean: new insights March 8-10, 2010. Semin Perinatol. 2010;34(5):351-65.
26. Homer CS, Kurinczuk JJ, Spark P, Brocklehurst P, Knight M. A novel use of a classification system to audit severe maternal morbidity. Midwifery. 2010;26(5):532-6.
27. Bateman BT, Berman MF, Riley LE, Leffert LR. The epidemiology of postpartum hemorrhage in a large, nationwide sample of deliveries. Anesth Analg. 2010;110(5):1368-73.
28. Almerie Y, Almerie MQ, Matar HE, Shahrour Y, Al Chamat AA, Abdulsalam A. Obstetric near-miss and maternal mortality in maternity university hospital, Damascus, Syria: a retrospective study. BMC Pregnancy Childbirth. 2010;10:65.
29. Luz AG, Tiago DB, Silva JC, Amaral E. [Severe maternal morbidity at a local reference university hospital in Campinas, São Paulo, Brazil]. Rev Bras Ginecol Obstet. 2008;30(6):281-6.
30. Karolinski A, Mercer R, Micone P, Ocampo C, Mazzoni A, Fontana O, et al. The epidemiology of life-threatening complications associated with reproductive process in public hospitals in Argentina. BJOG. 2013; 120(13):1685-94.

Publicações 38
Figure 1: Flowchart of women in the study
Women with Severe Maternal
Morbidity 9.555
8.330
Excluded Abortion, Ectopic Pregnancy and
Still Pregnant 1.225
Any missing information necessary for classification
1.083
7.247 Women entering current analysis
82.388 women
delivering 82.144
live births

Publicações 39
Table 1. Distribution of women according to the Robson 10 Group Classification of Cesarean Section (RTGCS) in the Brazilian Network for Surveillance of SMM study
Group
Frequency
(%)
C-section within group
(%)
Proportion of all C-section births
(%)
Contribution to overall C-section
rate (%)
1. Nulliparous, single, cephalic, ≥37 weeks, spontaneous labour
908 (12.5)
376 (41.4)
376/5308 (7.1)
376/7247 (5.2)
2. Nulliparous, single, cephalic, ≥37 weeks, induction or CS before labour
1172 (16.2)
1031 (88.0)
1031/5308 (19.4)
1031/7247 (14.2)
3. Multiparous (excluding previous CS), single, cephalic, ≥37 weeks, spontaneous labour
605 (8.3)
111 (18.3)
111/5308 (2.1)
111/7247 (1.5)
4. Multiparous (excluding previous CS), single, cephalic, ≥37 weeks, induction or CS before labour
399 (5.5)
282 (70.7)
282/5308 (5.3)
282/7247 (3.9)
5. Previous cesarean section, single, cephalic, ≥37 weeks
871 (12.0)
737 (84.6)
737/5308 (13.9)
737/7247 (10.2)
6. All nulliparous breeches 212 (2.9)
187 (88.2)
187/5308 (3.5)
187/7247 (2.6)
7. All multiparous breeches (including previous CS) 272 (3.8)
236 (86.8)
236/5308 (4.4)
236/7247 (3.3)
8. All multiple pregnancies (including previous CS) 272 (3.8)
245 (90.1)
245/5308 (4.6)
245/7247 (3.4)
9. All abnormal presentations (including previous CS) 79 (1.1)
74 (93.7)
74/5308 (1.4)
74/7247 (1.0)
10. All single, cephalic, ≤ 36 weeks (including previous CS)
2457 (33.9)
2029 (82.6)
2029/5308 (38.2)
2029/7247 (28.0)
Total 7247 (100.0)
5308 (73.2)
5308/5308 (100.0)
5308/7247 (73.2)
CS: Cesarean section

Publicações 40
Table 2. Occurrence of severe maternal morbidity by the Robson 10 Group Classification of Cesarean Section (RTGCS) and corresponding indicators in the Brazilian Network for Surveillance of SMM study
Group PLTC (%) NM+MD (%) SMO : PLTC ratio
1.Nulliparous, single, cephalic, ≥37 weeks, spontaneous labour
884 (97.4) 24 (2.6) 1 : 37
2. Nulliparous, single, cephalic, ≥37 weeks, induction or CS before labour
1127 (96.2) 45 (3.8) 1 : 25
3. Multiparous (excluding previous CS), single, cephalic, ≥37 weeks, spontaneous labour
585 (96.7) 20 (3.3) 1 : 29
4. Multiparous (excluding previous CS), single, cephalic, ≥37 weeks, induction or CS before labour
372 (93.2) 27 (6.8) 1 : 14
5. Previous cesarean section, single, cephalic, ≥37 weeks
813 (93.3) 58 (6.7) 1 : 14
6. All nulliparous breeches
199 (93.9) 13 (6.1) 1 : 15
7. All multiparous breeches (including previous CS)
234 (86.0) 38 (14.0) 1 : 6
8. All multiple pregnancies (including previous CS)
238 (87.5) 34 (12.5) 1 : 7
9. All abnormal presentations (including previous CS)
68 (86.1) 11 (13.9) 1 : 6
10. All single, cephalic, ≤ 36 weeks (including previous CS)
2183 (88.8) 274 (11.2) 1 : 8
Total
6703 (92.5) 544 (7.5) 1 : 12
PLTC: Potentially life-threatening condition; NM: near miss; MD: maternal death; SMO: severe maternal outcome (NM + MD); CS: Cesarean section

Publicações 41
Table 3. Occurrence of severe maternal morbidity among C-section cases in each group according to the Robson 10 Group Classification System of Cesarean Section (RTGCS) and corresponding indicators in the Brazilian Network for Surveillance of SMM study
Group PLTC (%) NM + MD (%) SMO : PLTC ratio
1.Nulliparous, single, cephalic, ≥37 weeks, spontaneous labour
368 (97.9) 8 (2.1) 1 : 46
2. Nulliparous, single, cephalic, ≥37 weeks, induction or CS before labour
990 (96.0) 41 (4.0) 1 : 24
3. Multiparous (excluding previous CS), single, cephalic, ≥37 weeks, spontaneous labour
101 (91.0) 10 (9.0) 1 : 10
4. Multiparous (excluding previous CS), single, cephalic, ≥37 weeks, induction or CS before labour
259 (91.8) 23 (8.2) 1 : 11
5. Previous cesarean section, single, cephalic, ≥37 weeks
684 (92.8) 53 (7.2) 1 : 13
6. All nulliparous breeches
174 (93.0) 13 (7.0) 1 : 13
7. All multiparous breeches (including previous CS)
209 (88.6) 27 (11.4) 1 : 8
8. All multiple pregnancies (including previous CS)
214 (87.3) 31 (12.7) 1 : 7
9. All abnormal presentations (including previous CS)
64 (86.5) 10 (13.5) 1 : 6
10. All single, cephalic, ≤ 36 weeks (including previous CS)
1806 (89.0) 223 (11.0) 1 : 8
Total 4869 (91.7) 439 (8.3) 1 : 11
PLTC: Potentially life-threatening condition; NM: near miss; MD: maternal death; SMO: severe maternal outcome (NM + MD) CS: Cesarean section

Publicações 42
Table 4. Occurrence of severe maternal morbidity among Robson subgroup classification of Cesarean Section, and corresponding indicators in the Brazilian Network for Surveillance of SMM study Group Frequency
(%) PLTC (%) NM + MD
(%) SMO :
PLTC ratio 2a - Nulliparous, single, cephalic, ≥37 weeks, induction
293/1172 (25.0)
280 (95.6) 13 (4.4) 1 : 22
2b - Nulliparous, single, cephalic, ≥37 weeks, CS before labour
879/1172 (75.0)
847 (96.4) 32 (3.6) 1 : 26
4a - Multiparous (excluding previous CS), single, cephalic, ≥37 weeks, induction
155/399 (38.8)
150 (96.8) 5 (3.2) 1 : 30
4b – Multiparous (excluding previous CS), single, cephalic, ≥37 weeks, CS before labour
244/399 (61.2)
222 (91.0) 22 (9.0) 1 : 10
5a - One previous cesarean section, single, cephalic, ≥37 weeks
636/871 (73.0)
596 (93.7) 40 (6.3) 1 : 15
5b - Two previous cesarean section, single, cephalic, ≥37 weeks
194/871 (22.3)
179 (92.3) 15 (7.7) 1 : 12
5c - More than two previous cesarean section, single, cephalic, ≥37 weeks
41/871 (4.7)
38 (92.7) 3 (7.3) 1 : 13
10a - All single, cephalic, ≤ 36 weeks (including previous CS), spontaneous labour
480/2457 (19.6)
414 (86.2) 66 (13.8) 1 : 6
10b - All single, cephalic, ≤ 36 weeks (including previous CS), labor induction
227/2457 (9.2)
204 (89.9) 23 (10.1) 1 : 9
10c - All single, cephalic, ≤ 36 weeks (including previous CS), CS before labour
1750/2457 (71.2)
1565 (89.4) 185 (10.6) 1 : 8
PLTC: Potentially life-threatening condition; NM: near miss; MD: maternal death; SMO: severe maternal outcome (NM + MD); CS: Cesarean section

Publicações 43
Table 5. Main causes of severe maternal morbidity according to the Robson 10 Group Classification System of Cesarean section (RTGCS) in the Brazilian Network for Surveillance of SMM study
Group Frequency Hypertension (%)
Haemorrhage (%)
Infection (%)
Clinical/surgical (%)
1.Nulliparous, single, cephalic, ≥37 weeks, spontaneous labour
908 671 (73.9)
223 (24.6)
6 (0.7)
46 (5.1)
2. Nulliparous, single, cephalic, ≥37 weeks, induction or CS before labour
1172 984 (84.0)
172 (14.7)
2 (0.2)
71 (6.1)
3. Multiparous (excluding previous CS), single, cephalic, ≥37 weeks, spontaneous labour
605 374 (61.8)
225 (37.2)
1 (0.2)
30 (5.0)
4. Multiparous (excluding previous CS), single, cephalic, ≥37 weeks, induction or CS before labour
399 297 (74.4)
67 (16.8)
1 (0.3)
51 (12.8)
5. Previous cesarean section, single, cephalic, ≥37 weeks
871 631 (72.4)
189 (21.7)
6 (0.7)
75 (8.6)
6. All nulliparous breeches
212 174 (82.1)
34 (16.0)
1 (0.5)
15 (7.1)
7. All multiparous breeches (including previous CS)
272 189 (69.5)
87 (32.0)
5 (1.8)
26 (9.6)
8. All multiple pregnancies (including previous CS)
272 195 (71.7)
72 (26.5)
2 (0.7)
26 (9.6)
9. All abnormal presentations (including previous CS)
79
53 (67.1)
25 (31.6)
1 (1.3)
6 (7.6)
10. All single, cephalic, ≤ 36 weeks (including previous CS)
2457 2038 (82.9)
455 (18.5)
12 (0.5)
149 (6.1)
Total
7247 5606 (77.4)
1549 (21.4)
37 (0.5)
495 (6.8)
CS: Cesarean section; SMM: severe maternal morbidity

Publicações 44
Table 6. Comparison of relative size and C-section rate of the RTGCS between the Brazilian Network for Surveillance of SMM study and Brazilian data in the WHO Global Survey (GS)
Group
Relative size (n and %)
CS (n and %)
Contribution to CS (%)
Relative contribution (%)
Network GS Network GS Network GS Network GS
1 908 (12.5)
4142 (28.6)
376 (41.4)
575 (13.9)
376/7247 (5.2)
575/14462 (4.0)
376/5308 (7.1)
575/4285 (13.5)
2 1172 (16.2)
1471 (10.2)
1031 (88.0)
934 (63.5)
1031/7247 (14.2)
934/14462 (6.5)
1031/5308 (19.4)
934/4285 (22.0)
3 605 (8.3)
4475 (30.9)
111 (18.3)
234 (5.2)
111/7247 (1.5)
234/14462 (1.6)
111/5308 (2.1)
234/4285 (5.4)
4 399 (5.5)
1041 (7.2)
282 (70.7)
426 (40.9)
282/7247 (3.9)
426/14462 (2.9)
282/5308 (5.3)
426/4285 (9.8)
5 871 (12.0)
1598 (11.1)
737 (84.6)
1229 (76.9)
737/7247 (10.2)
1229/14462 (8.5)
737/5308 (13.9)
1229/4285 (28.7)
6 212 (2.9)
218 (1.5)
187 (88.2)
191 (87.6)
187/7247 (2.6)
191/14462 (1.3)
187/5308 (3.5)
191/4285 (4.4)
7 272 (3.8)
217 (1.5)
236 (86.8)
170 (78.3)
236/7247 (3.2)
170/14462 (1.2)
236/5308 (4.4)
170/4285 (4.1)
8 272 (3.8)
178 (1.2)
245 (90.1)
132 (74.2)
245/7247 (3.4)
132/14462 (0.9)
245/5308 (4.6)
132/4285 (3.9)
9 79 (1.1)
58 (0.4)
74 (93.7)
45 (77.6)
74/7247 (1.0)
45/14462 (0.3)
74/5308 (1.4)
45/4285 (1.0)
10 2457 (33.9)
1064 (7.4)
2029 (82.6)
349 (32.8)
2029/7247 (28.0)
349/14462 (2.4)
2029/5308 (38.2)
349/4285 (8.1)
Total 7247 (100.0)
14462 (100.0)
5308 (73.2)
4285 (29.6)
5308/7247 (73.2)
4285/14462 (29.6)
5308/5308 (100.0)
4285/4285 (100.0)
CS: Cesarean section; Network: Brazilian Network for Surveillance of Severe Maternal Morbidity Group; GS: Global Survey Brazil
Publicações 45
4.2. Artigo 2
Carta de Submissão
29-May-2014
Dear Prof. Cecatti,
Your submission entitled "The use of the Robson Ten Group Classification System to
appraise deliveries at a tertiary referral hospital and its association with severe
maternal morbidity" has been assigned the following manuscript number: EJOGRB-14-
11216.
It will now be forwarded to one of the Specialty Editors for assessment: as a result of
ever-increasing submissions to this journal, it has become necessary to implement
more stringent selection parameters, and preliminary assessment is one of those
recently implemented measures.
You will be able to check on the progress of your paper by logging into Elsevier's
Editorial System (EES) as an author. The URL is http://ees.elsevier.com/euro/
Your username is: [email protected]
If you need to retrieve password details, please go
to: http://ees.elsevier.com/euro/automail_query.asp
With kind regards,
Elsevier Editorial System
European Journal of Obstetrics & Gynecology and Reproductive Biology

Publicações 46
RESEARCH ARTICLE
The use of the Robson Ten Group Classification System to appraise
deliveries at a tertiary referral hospital and its association with severe
maternal morbidity
ELTON C. FERREIRA1, RODOLFO C. PACAGNELLA1, MARIA L. COSTA1 & JOSE G. CECATTI1
1. Department of Obstetrics and Gynecology, School of Medical Sciences, University of Campinas, Brazil
Running headline: delivery and maternal morbidity Correspondence:
Jose Guilherme Cecatti
Department of Obstetrics and Gynecology
University of Campinas
Rua Alexander Fleming, 101
13083-881 Campinas-SP, Brazil
Phone: +55-19-3521-9304 E-mail: [email protected]
Condensation
Classification of delivering women according to their personal and obstetric
characteristics is worth for understanding what groups are more likely to have a
Cesarean section

Publicações 47
The use of the Robson Ten Group Classification System to appraise deliveries at a
tertiary referral hospital and its association with severe maternal morbidity
Abstract
Objective: To evaluate the distribution of delivering women according to Robson Ten
Group Classification System (RTGCS), compare the occurrence of severe maternal
morbidity (SMM) and also the distribution among groups to another Brazilian study
population. Study Design: Cross-sectional study at a tertiary referral hospital from
January 2009-July 2013. Women were grouped according to RTGCS, estimating the
proportion of each group by mode of delivery. For each group, SMM cases were
determined for vaginal and cesarean deliveries, estimating OR and 95%CI. Results: Of
the 12771 women, 46.6% underwent cesarean section (CS), 28% in Group 1
(nulliparous, single, cephalic, term, spontaneous labor), 18.2% in group 5 (multiparous
with at least one previous CS, single, cephalic, term) and 16.5% in group 3 (multiparous
excluding previous CS, single, cephalic, term, spontaneous labor). Group 5 contributed
most significantly to relative and overall CS rates (27.3% and 12.7%, respectively),
followed by group 2 (nulliparous, single, cephalic, term, induced labor or CS before
labor) with 17.6% and 8.2%, followed by group 1 with 15.9% and 7.4%. Group 10
(single, cephalic, preterm, including previous CS) ranked fourth in prevalence (13.4%)
and relative CS rate (15.5%). SMM was proportionally higher in groups 10 (46.8%), 5
(13.3%) and 2 (9.8%). Conclusion: To reduce CS rates health policies should focus on
prevalent groups and those with high CS rates. Interventions to reduce CS rates in
women without previous CS, stimulation of vaginal birth after previous CS and
decreased elective CS rates could have a major impact on overall CS rates.
Keywords: delivery; cesarean section; childbirth

Publicações 48
Introduction
An increasing rate in cesarean deliveries has been observed worldwide. It has become
a public health problem and is the subject of much debate due to potential maternal and
perinatal risks (1-3). The World Health Organization has recommended that the cesarean
section rate should not exceed 15% in any region/country. However, this goal is still far
from being achieved in either high-income countries or middle-income and low-income
countries (4, 5).
According to recent data, cesarean section accounts for one-fourth of deliveries in
North America, around 30% in Central America, higher than 30% in European countries
and 40% in many Latin American countries (1). In Brazil, cesarean rates have achieved
44% (6). In general, these numbers differ significantly between countries, as well as
between regions and institutions of the same country, varying with the type of access to
healthcare system (public or private) (7, 8). Women who use supplementary health care
or receive private care undergo operative delivery more frequently than those managed
by the public health system (9).
Implementation of effective measures to lower cesarean section rates in diverse
obstetric units initially demands a thorough study of each case, to identify the most
frequent patient groups undergoing this procedure (10, 11). For this purpose, different
classification systems have been described. However, the lack of a universally used
standard of care, hinders the comparison between studies and adequate characterization
of the rising rates of cesarean section (12).
The Robson Ten Group Classification System (RTGCS), proposed in 2001, aimed to
consider clinically relevant groups of women undergoing cesarean delivery. This
classification was based on distinct individual characteristics of each woman and her
pregnancy, rather than focusing on the indication for operative delivery: single or
multiple pregnancy, parity and presence of previous cesarean section, presentation,
mode of onset or cesarean section before onset of labor and gestational age at delivery
(13).
The ten groups are mutually exclusive and totally inclusive, i.e., all women can be
classified. However, each woman belongs to one and only one group (13). A systematic
review was carried out in 2011 to analyze the diverse classifications of cesarean

Publicações 49
delivery. The review showed that the Robson classification takes local and international
needs into account, allowing for the analysis and comparison of cesarean delivery rates
among different hospitals, cities, countries and regions. In addition, this classification
system permits evaluation in the same unit over time (12).
After this classification was created in 2001, several studies have used the same
method. A study of 14.462 women conducted in 2005 covering eight Latin American
countries showed that the majority of these women belonged to Robson group 3 (30.9%)
(multiparous women, single fetus, cephalic pregnancy, at ≥37 weeks, spontaneous labor,
without previous cesarean delivery), followed by groups 1 (28.6%) (nulliparous women,
with single fetus, cephalic pregnancy, at ≥37weeks, spontaneous labor) and 5 (11.1%)
(multiparous women with at least one previous cesarean, single fetus, cephalic
pregnancy, at ≥37weeks). The highest relative rate of cesarean delivery was observed in
group 5 (28.7%), followed by groups 2 (22.0%) (nulliparous women, single fetus,
cephalic pregnancy, at ≥37weeks, induced labor or cesarean delivery before labor) and 1
(13.5%), respectively, indicating that prior cesarean section (group 5) is the greatest
predictor of cesarean delivery (14).
The Women’s Hospital at the University of Campinas, Brazil, is a public university
hospital and a high complexity referral center for maternal and neonatal care in high-risk
pregnancies. Around 3000 deliveries occur in this hospital per year. Cesarean delivery
rates have surpassed 40% of deliveries in the last five years, raising some concern (15).
The aim of the current study was primarily to evaluate the distribution of deliveries
occurring in this institution from January 2009 to July 2013, according to the Robson
classification into ten groups. Secondarily, its purpose was to assess the distribution of
cesarean delivery cases across different classification groups in obstetric patients with a
severe maternal morbid condition (defined by the need of ICU admission), in
comparison to the remaining women without such complication.
Material and methods
A descriptive cross-sectional study was carried out to evaluate all women admitted for
delivery at the Women’s Hospital at the University of Campinas from January 2009 to
July 2013. Women were grouped according to the 10 groups of the Robson classification
system, defined considering: parity, number of fetuses, fetal presentation, gestational age

Publicações 50
at the time of delivery, with or without previous cesarean delivery, type of onset of labor
and termination of labor. Data was compiled from the computerized database of the
institution, with subsequent judicious confirmation of consistency and review of medical
charts, when necessary.
The analytical approach corresponded to the percentage distribution of all cases
among the ten groups of the Robson classification, the overall and proportional
contribution of each group to cesarean delivery rates, in addition to the evaluation of
relevant subgroups (e.g. women undergoing labor induction and those with cesarean
delivery before onset of labor). Furthermore, a comparison was proposed between
results from another similar large study published and conducted in different contexts
and countries, especially with the data from Brazil, available in the WHO Global Survey
study (14, 16). In addition, the distribution of women among different groups,
considering the occurrence or not of SMM, operationally defined by the need of ICU
admission, was performed. Comparisons between the overall prevalence of cesarean
sections and between each Robson group were made, taking different years of the study
into account, in an attempt to identify any trend (from 2009 to 2013), with differences
between groups evaluated by the 2 test for trend. Analyses were conducted in Excel
spreadsheet and Epi.Info version 3.5.4 software package, with p values less than 5%
indicating statistical significance between compared values.
Before the beginning of data collection, the study protocol was approved by the
Institutional Review Board.
Results
The total number of women admitted for delivery in the above-mentioned hospital in the
study period of four years and a half was 12.771. The majority of women belonged to
group 1, corresponding to 28.1% (nulliparous women, single, cephalic, term pregnancy,
spontaneous labor), followed by group 5 with 18.2% (multiparous women with prior
cesarean delivery, single, cephalic, term pregnancy), group 3 with 16.5% (multiparous
women with no prior cesarean delivery, single, cephalic, term pregnancy, spontaneous
labor) and group 10 with 13.4% (single, cephalic, preterm pregnancy, including prior
cesarean delivery) (Table1).

Publicações 51
From January 2009 to July 2013, the total number of cesarean sections performed
was 5957, corresponding to 46.6% of women admitted for delivery (Table 1). Of these,
women with breech or abnormal fetal presentation (groups 6, 7 and 9) had the higher
cesarean section rates (87%, 86.9% and 100%, respectively), as well as those with
multiple pregnancy (86.8%), regardless of the year of the study. The lowest cesarean
delivery rates, occurred in group 3 (multiparous women, without prior cesarean delivery,
with a single, cephalic, term pregnancy and spontaneous labor) with a rate of 10.2%,
followed by group 1 (nulliparous women, with a single, cephalic, term pregnancy and
spontaneous labor) with a rate of 26.4%.
Considering the proportion of all cesarean sections, group 5 (multiparous women
with previous cesarean delivery, single, cephalic and term pregnancy) showed the
highest CS rates, with a relative rate of 27.3%, corresponding to an overall rate of 12.7%
among all births, followed by nulliparous women, with single, cephalic, term pregnancy
(groups 2 and 1) and by group 10 (single, cephalic, preterm pregnancy, including prior
cesarean delivery).
Table 2 describes the distribution among Robson groups, comparing vaginal births
and cesarean deliveries with and without ICU admission. For all Robson groups, the
highest frequency of ICU admission occurred in women undergoing cesarean delivery
for pregnancy resolution, highlighting groups 1 to 5 and 10. Estimated risks for ICU
admission increased significantly (from two to nine times) for cesarean deliveries in
these groups. For the total number of women, the risk of ICU admission increased six
times considering cesarean deliveries (OR=6.24; 95%CI 5.06-7.69).
Table 3 comparatively shows data from the Global Survey study Brazil (14), which
evaluated 14462 deliveries, according to RTGCS, occurring in various Brazilian
institutions. In this study, the most prevalent groups were group 3 with 30.9%
(multiparous women without prior cesarean delivery, with single, cephalic, term
pregnancy and spontaneous labor), group 1 with 28.6% (nulliparous women, single,
cephalic, term pregnancy, spontaneous labor) and group 5 with 11.1% (multiparous
women with prior cesarean section, single, cephalic, term pregnancy). The overall
cesarean section rate was 29.6%, with a greater contribution from group 5 (8.5%),
followed by groups 2 with 6.5% (nulliparous women, single, cephalic, term pregnancy,

Publicações 52
induced labor or cesarean section before onset of labor), 1 (4.0%) and 4 with 2.9%
(multiparous women without previous cesarean section, single, cephalic, term
pregnancy, induced labor or cesarean delivery before onset of labor). Group 10 (single,
cephalic, preterm, including previous cesarean delivery) was the fifth most prevalent,
occupying the same position in the overall cesarean delivery rate (14).
During the study period, there was no significant variation in the cesarean delivery
rate of the institution (Table 4), or in the proportional contribution of each Robson
group.
Comment
The current study demonstrated that groups 1 and 5 formed the largest groups of women
admitted for labor, which was in disagreement with other studies categorizing groups 3
and 1 as most prevalent (17-20). However, in the current study as in other published
studies, groups 3 and 1 had the lowest proportion of cesarean deliveries. Nevertheless,
due to the high frequency of women in these groups, both had a substantial number of
cesarean sections (14, 17-20). The prevalence of group 5 in the Brazilian population was
noteworthy. According to previous data, it usually composes less than 10% of the
sample, while in the present study, group 5 accounted for 18.2% and 11% in the Global
Survey study. This reflects an important characteristic of the local population samples
with a very common history of prior cesarean delivery. The strong trend to perform this
procedure has been lasting for decades (6, 21).
In addition to its high frequency, group 5 had the highest relative (27.3%) and overall
(12.7%) cesarean section rates, in agreement with other case studies that also applied the
RTGCS (17, 22). Therefore, public policies aimed at lowering cesarean delivery rates
should focus their efforts on this specific group of women, probably through enhanced
access to VBAC (vaginal birth after Cesarean), particularly in women with only one
prior uterine scar (23).
In our study, we found a high cesarean section rate in women with a single, cephalic,
term pregnancy, with induced labor or cesarean before onset of labor, without previous
uterine scar (groups 2 and 4). This finding was also in agreement with the results of
other published studies (14) and shows the need to review current indications and
Publicações 53
methods of labor induction, as well as indications for cesarean delivery before onset of
labor in these women (15).
In the current study conducted in a tertiary center, group 10 (single, cephalic, preterm
pregnancy, including previous cesarean delivery) showed a high C-section prevalence
rate (13.4%). This finding was predictable and in agreement with other studies
conducted in obstetric referral centers for high-risk pregnancies (18). These results
should be assessed with caution, since this group encompasses a very heterogeneous
patient population, including both spontaneous preterm labor and induced labor.
Cesarean section before onset of labor was also included (24). However, it is certain that
preterm labor, either spontaneous or therapeutic, as a consequence of maternal or fetal
conditions, currently accounts for an important contribution to the total number of births
and cesarean sections worldwide.
Assessment of obstetric ICU admissions to operationally define maternal morbidity
has been an alternative to approach obstetric complications, when criteria for maternal
morbidity are not systematically recorded, and had already been used (25). From the
current study, obviously we could not infer that cesarean section was the cause of
morbidity. However, we observed that women undergoing cesarean section had a higher
prevalence of severe morbidity. In fact this is the innovative aspect of the present study
using the Robson classification for a high risk population from a tertiary level maternity,
with much higher use of cesarean sections and with a higher prevalence of severe
morbidity associated to pregnancy. Differently of what would be supposed for this high
risk population, the highest increases in cesarean section were seen in groups 1, 3 and
10. An association between cesarean section and SMM was observed in other published
studies, reinforcing the concept that the procedure should only be performed when there
is a clear and well-defined benefit (26,27).
A limitation of the study was the short evaluation period (four and a half years),
making it difficult to analyze trends or alterations in the participation of each group
assessed; although the total number of deliveries was substantial. It is worth mentioning
that hospital electronic data made RTGCS use possible. In routine practice, RTGCS has
the potential for use in monitoring, surveillance as basis for the definition and change in
Publicações 54
management. The translation of research findings into clinical practice is of crucial
importance.
Application of the RTGCS to evaluate deliveries occurring in the obstetric facility
showed to be extremely useful for the understanding of local characteristics and
proposal of future interventions in specific groups. Patterns of distribution of cases
among groups depending of the risks and morbidities found in the population would
probably be useful to monitor time trends in each facility. According to data shown,
health policies should concomitantly focus on the prevention of cesarean section in
women without prior uterine scar and on vaginal delivery in women with a previous
cesarean delivery (VBAC). Further studies are needed to assess specific interventions in
each group and also study the association between maternal morbidity and cesarean
section.

Publicações 55
References 1. Betrán AP, Merialdi M, Lauer JA, Bing-Shun W, Thomas J, Van Look P, et al.
Rates of caesarean section: analysis of global, regional and national estimates.
Paediatr Perinat Epidemiol. 2007; 21(2):98-113.
2. Belizán JM, Althabe F, Barros FC, Alexander S. Rates and implications of
caesarean sections in Latin America: ecological study. BMJ. 1999;
319(7222):1397-400.
3. Belizán JM, Althabe F, Cafferata ML. Health consequences of the increasing
caesarean section rates. Epidemiology. 2007; 18(4):485-6.
4. World Health Organization. Appropriate technology for birth. Lancet. 1985;
2(8452):436-7.
5. Ye J, Betrán AP, Vela MG, Souza JP, Zhang J. Searching for the Optimal Rate of
Medically Necessary Cesarean Delivery. Birth. 2014 (in press).
6. Leal MC, Silva AA, Dias MA, da Gama SG, Rattner D, Moreira ME, et al. Birth
in Brazil: national survey into labour and birth. Reprod Health. 2012; 9:15.
7. Ross S. An illustration of the "inverse care law": A commentary on giving birth
in Canada: providers of maternity and infant care. J Obstet Gynaecol Can. 2005;
27(1):51-3.
8. Paleari L, Gibbons L, Chacón S, Ramil V, Belizán JM. [Rates of caesarean
sections tn two types of private hospitals: restriced-access and open-access].
Ginecol Obstet Mex. 2012; 80(4):263-9.
9. Grant D. Explaining source of payment differences in U.S. cesarean rates: why
do privately insured mothers receive more cesareans than mothers who are not
privately insured? Health Care Manag Sci. 2005; 8(1):5-17.
10. Robson MS. Can we reduce the caesarean section rate? Best Pract Res Clin
Obstet Gynaecol. 2001; 15(1):179-94.
11. Colais P, Fantini MP, Fusco D, Carretta E, Stivanello E, Lenzi J, et al. Risk
adjustment models for interhospital comparison of CS rates using Robson's ten
group classification system and other socio-demographic and clinical variables.
BMC Pregnancy Childbirth. 2012; 12:54.
12. Torloni MR, Betran AP, Souza JP, Widmer M, Allen T, Gulmezoglu M, et al.
Classifications for cesarean section: a systematic review. PLoS One. 2011;
6(1):e14566.
13. Robson MS. Classification of caesarean sections. Fetal and Matl Med Rev 2001;
12:23-39.
14. Betrán AP, Gulmezoglu AM, Robson M, Merialdi M, Souza JP, Wojdyla D, et
al. WHO global survey on maternal and perinatal health in Latin America:
classifying caesarean sections. Reprod Health. 2009; 6:18.
15. Costa ML, Cecatti JG, Souza JP, Milanez HM, Gülmezoglu MA. Using a
Caesarean Section Classification System based on characteristics of the
population as a way of monitoring obstetric practice. Reprod Health. 2010; 7:13.
16. Villar J, Valladares E, Wojdyla D, Zavaleta N, Carroli G, Velazco A, et al.
Caesarean delivery rates and pregnancy outcomes: the 2005 WHO global survey
on maternal and perinatal health in Latin America. Lancet. 2006;
367(9525):1819-29.

Publicações 56
17. Kelly S, Sprague A, Fell DB, Murphy P, Aelicks N, Guo Y, et al. Examining
caesarean section rates in Canada using the Robson classification system. J
Obstet Gynaecol Can. 2013; 35(3):206-14.
18. Chong C, Su LL, Biswas A. Changing trends of cesarean section births by the
Robson Ten Group Classification in a tertiary teaching hospital. Acta Obstet
Gynecol Scand. 2012; 91(12):1422-7.
19. Delbaere I, Cammu H, Martens E, Tency I, Martens G, Temmerman M. Limiting
the caesarean section rate in low risk pregnancies is key to lowering the trend of
increased abdominal deliveries: an observational study. BMC Pregnancy
Childbirth. 2012; 12:3.
20. Abdel-Aleem H, Shaaban OM, Hassanin AI, Ibraheem AA. Analysis of cesarean
delivery at Assiut University Hospital using the Ten Group Classification
System. Int J Gynaecol Obstet. 2013; 123(2):119-23.
21. Raifman S, Cunha AJ, Castro MC. Factors associated with high rates of
caesarean section in Brazil between 1991 and 2006. Acta Paediatr. 2014 (in
press).
22. Lee YY, Roberts CL, Patterson JA, Simpson JM, Nicholl MC, Morris JM, et al.
Unexplained variation in hospital caesarean section rates. Med J Aust. 2013;
199(5):348-53.
23. Rossi AC, D'Addario V. Maternal morbidity following a trial of labor after
cesarean section vs elective repeat cesarean delivery: a systematic review with
metaanalysis. Am J Obstet Gynecol. 2008; 199(3):224-31.
24. Farine D, Shepherd D. Classification of caesarean sections in Canada: the
modified robson criteria. J Obstet Gynaecol Can. 2012; 34(10):976-9.
25. Oliveira Neto AF, Parpinelli MA, Cecatti JG, Souza JP, Sousa MH. Factors
associated with maternal death in women admitted to an intensive care unit with
severe maternal morbidity. Int J Gynaecol Obstet. 2009; 105(3):252-6. 26. Souza JP, Gülmezoglu A, Lumbiganon P, Laopaiboon M, Carroli G, Fawole B,
et al. Caesarean section without medical indications is associated with an
increased risk of adverse short-term maternal outcomes: the 2004-2008 WHO
Global Survey on Maternal and Perinatal Health. BMC Med. 2010;8:71. 27. Souza JP, Gulmezoglu AM, Vogel J, Carroli G, Lumbiganon P, Qureshi Z, et al.
Moving beyond essential interventions for reduction of maternal mortality (the
WHO Multicountry Survey on Maternal and Newborn Health): a cross sectional
study. Lancet 2013; 381:1747-55.
Abbreviations
CS, cesarean section; GS, Global Survey; ICU, intensive care unit; RTGCS, Ten Group
Classification System; SMM, severe maternal morbidity; VBAC, vaginal birth after
cesarean; WHO, World Health Organization.
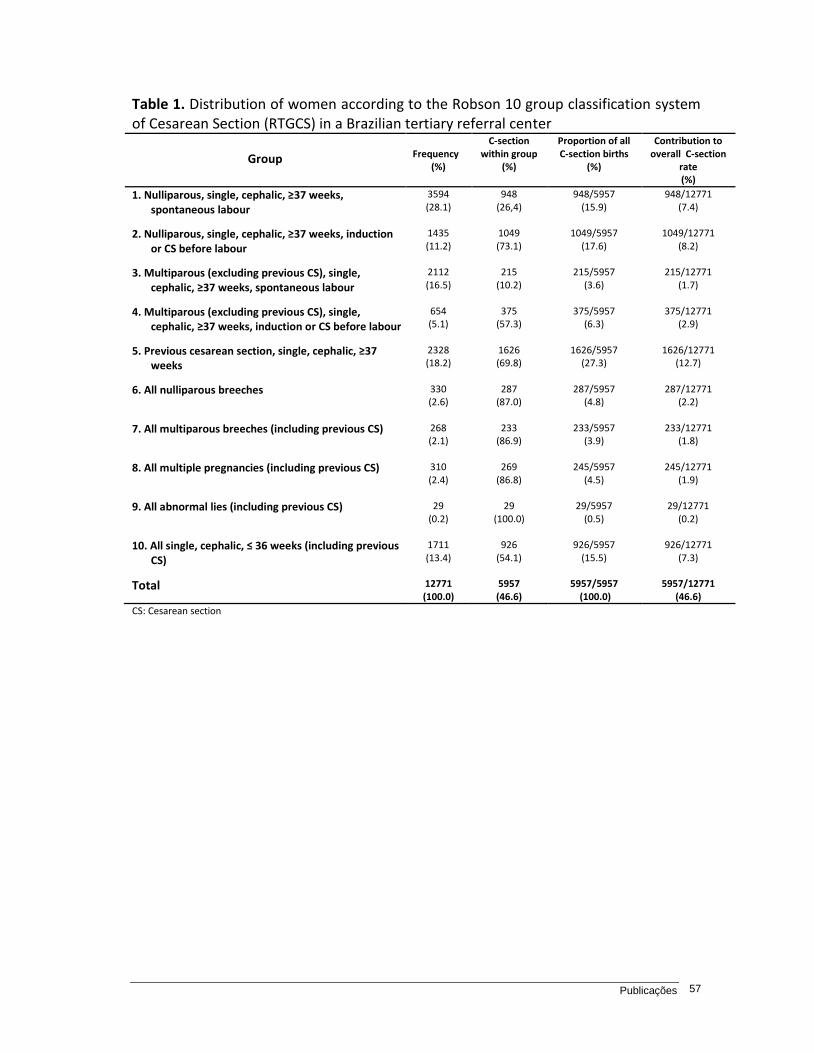
Publicações 57
Table 1. Distribution of women according to the Robson 10 group classification system of Cesarean Section (RTGCS) in a Brazilian tertiary referral center
Group
Frequency
(%)
C-section within group
(%)
Proportion of all C-section births
(%)
Contribution to overall C-section
rate (%)
1. Nulliparous, single, cephalic, ≥37 weeks, spontaneous labour
3594 (28.1)
948 (26,4)
948/5957 (15.9)
948/12771 (7.4)
2. Nulliparous, single, cephalic, ≥37 weeks, induction or CS before labour
1435 (11.2)
1049 (73.1)
1049/5957 (17.6)
1049/12771 (8.2)
3. Multiparous (excluding previous CS), single, cephalic, ≥37 weeks, spontaneous labour
2112 (16.5)
215 (10.2)
215/5957 (3.6)
215/12771 (1.7)
4. Multiparous (excluding previous CS), single, cephalic, ≥37 weeks, induction or CS before labour
654 (5.1)
375 (57.3)
375/5957 (6.3)
375/12771 (2.9)
5. Previous cesarean section, single, cephalic, ≥37 weeks
2328 (18.2)
1626 (69.8)
1626/5957 (27.3)
1626/12771 (12.7)
6. All nulliparous breeches 330 (2.6)
287 (87.0)
287/5957 (4.8)
287/12771 (2.2)
7. All multiparous breeches (including previous CS) 268 (2.1)
233 (86.9)
233/5957 (3.9)
233/12771 (1.8)
8. All multiple pregnancies (including previous CS) 310 (2.4)
269 (86.8)
245/5957 (4.5)
245/12771 (1.9)
9. All abnormal lies (including previous CS) 29 (0.2)
29 (100.0)
29/5957 (0.5)
29/12771 (0.2)
10. All single, cephalic, ≤ 36 weeks (including previous CS)
1711 (13.4)
926 (54.1)
926/5957 (15.5)
926/12771 (7.3)
Total 12771 (100.0)
5957 (46.6)
5957/5957 (100.0)
5957/12771 (46.6)
CS: Cesarean section

Publicações 58
Table 2. Estimated risk for severe maternal morbidity (ICU admission) in the Robson Ten Group Classification System, according to mode of delivery, in a Brazilian tertiary referral center
PLTC: Potentially life-threatening condition; NM: near miss; MD: maternal death; SMO: severe maternal outcome (NM + MD); CS: Cesarean section ap<0.001
Group C-Sectionsa Vaginal Deliveries
a OR (95%CI)
ICU No ICU ICU No ICU
1 - Nulliparous, single, cephalic, ≥37 weeks, spontaneous labour
22 (2.3) 926 29 (1.1) 2617 2.14 (1.23-3.75)
2 - Nulliparous, single, cephalic, ≥37 weeks, induction or CS before labour
60 (5.7) 989 4 (1.0) 382 5.79 (2.09-16.05)
3 - Multiparous (excluding previous CS), single, cephalic, ≥37 weeks, spontaneous labour
10 (4.6) 205 16 (0.8) 1881 5.73 2.57-12.80)
4 - Multiparous (excluding previous CS), single, cephalic, ≥37 weeks, induction or CS before labour
30 (8.0) 345 4 (1.4) 275 5.33 (1.85-15.31)
5 - Previous cesarean section, single, cephalic, ≥37 weeks
71 (4.4) 1555 16 (2.3) 686 1.96 (1.13-3.39)
6 - All nulliparous breeches 28 (9.8) 259 2 (4.6) 41 2.21 (0.51-9.66)
7 - All multiparous breeches (including previous CS)
27 (11.6) 206 4 (11.4) 31 1.02 (0.33-3.10)
8 - All multiple pregnancies (including previous CS)
20 (7.4) 249 - 41 -
9 - All abnormal lies (including previous CS) 4 (0.8) 25 - - -
10 - All single, cephalic, ≤ 36 weeks (including previous CS)
272 (29.4) 654 33 (4.2) 752 9.47 (6.51-13.81)
Total 544 (9.1)
5413
108 (1.6)
6706
6.24 (5.06-7.69)

Publicações 59
Table 3. Comparison of relative size and C-section rate of the RTGCS between the tertiary referral center and data from Brazil in the WHO Global Survey (GS)
Group
Relative size (n and %)
CS (n and %)
Contribution to CS (%)
Relative contribution (%)
CAISM GS CAISM GS CAISM GS CAISM GS
1 3594 (28.1)
4142 28.6
948 (26,4)
575 13.9
948/12771 (7.4)
575/14462 (4.0)
948/5957 (15.9)
575/4285 (13.5)
2 1435 (11.2)
1471 10.2
1049 (73.1)
934 63.5
1049/12771 (8.2)
934/14462 (6.5)
1049/5957 (17.6)
934/4285 (22.0)
3 2112 (16.5)
4475 30.9
215 (10.2)
234 5.2
215/12771 (1.7)
234/14462 (1.6)
215/5957 (3.6)
234/4285 (5.4)
4 654 (5.1)
1041 7.2
375 (57.3)
426 40.9
375/12771 (2.9)
426/14462 (2.9)
375/5957 (6.3)
426/4285 (9.8)
5 2328 (18.2)
1598 11.1
1626 (69.8)
1229 76.9
1626/12771 (12.7)
1229/14462 (8.5)
1626/5957 (27.3)
1229/4285 (28.7)
6 330 (2.6)
218 1.5
287 (87.0)
191 87.6
287/12771 (2.2)
191/14462 (1.3)
287/5957 (4.8)
191/4285 (4.4)
7 268 (2.1)
217 1.5
233 (86.9)
170 78.3
233/12771 (1.8)
170/14462 (1.2)
233/5957 (3.9)
170/4285 (4.1)
8 310 (2.4)
178 1.2
269 (86.8)
132 74.2
245/12771 (1.9)
132/14462 (0.9)
245/5957 (4.5)
132/4285 (3.9)
9 29 (0.2)
58 0.4
29 (100.0)
45 77.6
29/12771 (0.2)
45/14462 (0.3)
29/5957 (0.5)
45/4285 (1.0)
10 1711 (13.4)
1064 7.4
926 (54.1)
349 32.8
926/12771 (7.3)
349/14462 (2.4)
926/5957 (15.5)
349/4285 (8.1)
Total 12771
(100.0)
14462
100.0
5957
(46.6)
4285
29.6
5957/12771
(46.6)
4285/14462
(29.6)
5957/5957
(100.0)
4285/4285
(100.0)
CS: Cesarean section; Network: Brazilian Network for Surveillance of Severe Maternal Morbidity Group; GS: Global Survey Brazil

Publicações 60
Table 4. Trend of cesarean section rates among all deliveries from the institution between 2009 and 2013
Type of
delivery
Year Period
2009 2010 2011 2012 2013 2009/2013
Vaginal 1468 (54.2) 1428 (51.7) 1542 (53.5) 1499 (53.4) 859 (54.3) 6814 (53.4)
Cesarean
section 1255 (45.8) 1332 (48.3) 1342 (46.5) 1306 (46.6) 722 (45.7) 5957 (46.6)
Total 2741 2760 2884 2805 1581 12771
2
trend, p=0.54

Discussão Geral 61
5. Discussão Geral
O sistema de classificação de Robson em dez grupos estratifica as
mulheres admitidas para parto em grupos clinicamente relevantes e tem sido
utilizado em vários países do mundo para uma análise comparativa dos partos
por grupos e das taxas de cesárea entre diferentes serviços de saúde e dentro
do mesmo serviço ao longo do tempo. (Betrán et al., 2007; Torloni et al., 2011)
No presente estudo, adotamos tal sistema de classificação para avaliação
de dois bancos de dados distintos. O primeiro banco analisado é formado por
mulheres classificadas como apresentando morbidade materna grave, que
engloba aquelas com condições potencialmente ameaçadoras de vida, com
¨near miss¨ e também as que tiveram óbito materno como desfecho. (Haddad et
al., 2011) Tais conceitos foram definidos recentemente pela OMS e levam em
consideração critérios clínicos, laboratoriais e de manejo. (Say et al., 2009;
Souza et al.; 2010) O segundo banco avaliado inclui todas as mulheres que
deram entrada para parto no Hospital da Mulher (CAISM) da Universidade
Estadual de Campinas, Brasil, no período de janeiro de 2009 a julho de 2013.
Essa maternidade é um centro terciário, referência para gestações de alto risco.
Logo, a população analisada também não é representativa da população geral.

Discussão Geral 62
Foram avaliados os dados de 7247 mulheres com morbidade materna
grave pertencentes à Rede Brasileira de Vigilância da Morbidade Materna
Grave (RBVMMG). A taxa geral de cesárea encontrada foi alta, 73.2%, muito
acima dos 15% preconizados pela OMS e também superior à encontrada no
CAISM, de 46.6%, considerada, da mesma forma, elevada. Porém, quando
avaliamos as mulheres do CAISM internadas em UTI e, portanto, classificadas
operacionalmente como morbidade materna grave, a taxa geral de cesárea
nesse grupo específico de mulheres foi de 83.4%, ainda mais elevada que a da
RBVMMG.
Assim, para fins de comparação com uma realidade mais próxima à da
população geral, optou-se por utilizar os dados de um grande estudo
multicêntrico realizado em oito países da América Latina em 2005 (Global
Survey), o qual considerou, para o Brasil, 14462 mulheres, com uma taxa de
cesárea de 29.6%. (Betrán et al., 2009)
Na maioria dos estudos em que a classificação de Robson em 10 grupos
(RTGCS) foi adotada, a maior parcela das mulheres avaliadas pertenceu aos
grupos 3 (multíparas sem cesárea anterior, gestação única, cefálico, a termo e
em trabalho de parto espontâneo) e 1 (nulíparas, gestação única, cefálico, a
termo e em trabalho de parto espontâneo) (Chong et al., 2012; Delbaere et al.,
2012; Abdel-Aleem et al., 2013; Kelly et al., 2013), sendo que a cesárea foi mais
frequente nos grupos 5 (multíparas com cesárea anterior, cefálico, gestação
única, a termo) e 2 (nulíparas, gestação única, cefálico, a termo, trabalho de
parto induzido ou CS antes do início do trabalho de parto). (Kelly et al., 2013;
Lee et al., 2013).

Discussão Geral 63
Esse cenário foi diferente ao avaliarmos as mulheres com morbidade
materna grave e a população obstétrica do CAISM. Neste último, as gestantes
admitidas foram, em sua maioria, nulíparas, com gestação única, apresentação
cefálica, a termo e em trabalho de parto espontâneo (grupo 1) e por multíparas
com cesárea anterior, gestação única, apresentação cefálica, a termo (grupo 5),
sendo a maior taxa de cesárea encontrada nos grupos 5, 2 e 1. Na população
da RBVMMG, o grupo 5 contribuiu significativamente para a taxa geral de
cesárea (10.2%) e, ao compararmos esse grupo com as multíparas sem cicatriz
uterina prévia (grupos 3 e 4), a taxa de cesárea nesses últimos foi menor,
mostrando que a cesárea anterior eleva a indicação de parto operatório em
gestações futuras. Ao compararmos grupos similares de mulheres, como os
grupos 2 e 4 ou os grupos 1 e 3, concluímos que ter tido parto vaginal anterior
diminui as chances de parto por cesárea em gestações subsequentes.
Além disso, houve uma alta taxa de cesárea em mulheres sem cicatriz
uterina prévia, com gestação única, apresentação cefálica, a termo, com
trabalho de parto induzido ou cesárea antes do início do trabalho de parto
(grupos 2 e 4), mostrando a necessidade de se rever as atuais indicações e
formas de indução do trabalho de parto, assim como as reais indicações de
cesárea nessas mulheres.
Admitindo-se que as taxas de cesárea encontradas no presente estudo
foram bastante elevadas em grupos altamente prevalentes, como nos grupos 1
e 2 (nulíparas, com gestação única, cefálico, a termo), e sabendo que naquelas
mulheres que apresentam cicatriz uterina prévia (Grupo 5) a cesariana é mais
prevalente (Betrán., 2009; Ciriello et al., 2012; Kelly et al., 2013; Lee et al.,

Discussão Geral 64
2013), políticas de saúde deveriam focar, concomitantemente, na prevenção da
cesariana em mulheres sem cicatriz uterina anterior e no parto vaginal em
mulheres que já tenham uma cesárea prévia (VBAC) (Delbaere et al., 2012),
haja visto que o parto vaginal é uma opção segura para a maioria das mulheres
nesta condição (NIH, 2010; Chong et al., 2012; Roberts et al., 2012). Além
disso, existem estudos mostrando uma relação positiva entre cicatriz uterina
prévia e histerectomia puerperal (Homer et al., 2010), tornando um futuro
incremento no grupo 5 ainda mais preocupante.
Ainda, analisando a população do CAISM, o grupo de mulheres com
gestação única, apresentação cefálica, pré-termo, incluindo aquelas com
cesárea anterior (grupo 10) foi bastante prevalente e contribuiu
significativamente para a taxa geral de cesárea. Esse achado foi semelhante ao
encontrado nas mulheres com morbidade grave, onde o grupo 10 (gestações
única, apresentação cefálica, pré-termo, incluindo aquelas com cesárea
anterior) foi o mais frequente, assim como o principal responsável pela alta taxa
geral de cesárea. Esses resultados devem ser avaliados com cautela, uma vez
que esse grupo abrange uma população bastante heterogênea de mulheres,
englobando tanto o parto prematuro espontâneo quanto o induzido e também a
cesariana antes de iniciado o trabalho de parto. (Farine & Shepherd, 2012)
Entretanto, o parto prematuro, seja espontâneo ou terapêutico, para resolver
situações de condições maternas ou fetais, seguramente hoje representa uma
importante contribuição ao total de nascimentos e de cesarianas.
No presente estudo, as mulheres do CAISM submetidas à internação em
UTI, e então classificadas como tendo morbidade materna grave, foram

Discussão Geral 65
analisadas segundo a via de parto. Para todos os grupos de Robson, a maior
frequência de internação em UTI ocorreu nas mulheres que tiveram parto por
cesárea. Esses achados devem ser avaliados com cautela, uma vez que a
cesárea pode ter sido a via de parto indicada pela condição materna e/ou fetal
de gravidade, e não necessariamente foi o fator causal de maior internação em
UTI dessas mulheres.
Na população com morbidade materna grave pertencente à RBVMMG,
houve um caso de morte materna/¨near miss¨ para cada 12 casos de condição
potencialmente ameaçadora de vida, sendo que os casos com maior gravidade
concentraram-se nos grupos 7 a 10, provavelmente aqueles com impacto pela
prematuridade, muito frequente entre os casos de morbidade avaliados. Foi
interessante observar que as pacientes multíparas com apresentação pélvica
(grupo 7) e as mulheres cuja situação era anômala (grupo 9), apresentaram alta
taxa de cesárea dentro do grupo e também uma alta taxa de complicações
hemorrágicas. Como a multiparidade e a cesariana são fatores de risco para
atonia uterina (Bateman et al., 2010), talvez uma maior incidência dessa
complicação possa justificar estes altos índices de complicações. Esta
observação é relevante para chamar a atenção para este risco e estimular
medidas preventivas, além do diagnóstico e tratamento precoce das
complicações. A principal causa de morbidade materna em todos os grupos foi
a hipertensão, seguida pela hemorragia, achados que estão de acordo com a
literatura.(Luz et al., 2008; Almerie et al., 2010) A taxa de causa infecciosa na
população estudada foi baixa, talvez pelo fato de terem sido excluídos do

Discussão Geral 66
estudo, para fins de classificação no RTGCS, as pacientes com abortamento.
(Karolinski et al., 2013)
O estudo evidenciou uma alta taxa de cesárea tanto em mulheres com
morbidade materna grave como na amostra do CAISM, e a utilização do
RTGCS para avaliação dos partos nessas populações mostrou-se
extremamente útil, evidenciando grupos clinicamente relevantes com altas
taxas de parto por via abdominal e grupos específicos com maior associação
com desfecho materno grave. Estudos futuros são necessários para melhor
compreender e avaliar possíveis intervenções em populações de risco e definir
a taxa esperada de cesárea neste grupo.
Ao se fazer um paralelo entre os três bancos de dados avaliados, nota-se
que conforme a gravidade da população obstétrica aumenta (Global Survey,
CAISM e RBVMMG), há também um aumento proporcional de pacientes
pertencentes ao grupo 10 e uma diminuição dos grupos 3 e 1. Além disso, as
taxas de cesárea elevam-se conforme esse espectro de gravidade progride,
sendo 29.6% na Global Survey-Brasil, 46.6% no CAISM e 73.2% na RBVMMG.
Novamente, esses dados devem ser avaliados com cuidado, uma vez que a
condição de gravidade materna e/ou fetal pode ter sido a causa do aumento do
parto cesárea e não o inverso.
Considerando-se que o RTGCS aplica-se ao estudo de todas as vias de
parto e não apenas para a classificação de cesáreas, é importante ressaltar seu
potencial uso como um indicador obstétrico, instrumento para monitoramento
rotineiro, vigilância e base para definição e alteração de condutas.

Discussão Geral 67
Infelizmente, até o momento não há qualquer estudo que tenha
conseguido contemplar de maneira ampla e sistemática, dados do intra parto e
também antecedentes pessoais de morbidade, na avaliação da via de parto.
Além disso, ao se analisar as taxas de cesariana em determinado país ou
região é importante que os contextos socioeconômico e cultural sejam também
considerados e avaliados. (Robson, 2001b).
Além disso, estratificar as pacientes dentro de cada grupo de Robson de
acordo com sua faixa etária forneceria informações relevantes uma vez que, de
acordo com estudos já publicados, há um aumento da morbimortalidade
materna em mulheres com mais idade, especialmente após os 35 anos, sendo
a idade um fator de risco independente para near miss e óbito materno.
(Oliveira Jr et al., 2013; Oliveira Jr et al., 2014)
Portanto, estudar as taxas de cesárea implica uma análise mais
aprofundanda que vai além da verificação se as taxas são altas ou baixas, mas
se são apropriadas para aquela população específica, se se justifica uma
tentativa de redução destes índices, se é aceito pelas parturientes e se é
segura de ser implementada. (Robson, 2001b)
No presente estudo, algumas necessidades apontadas por recente
revisão sistemática sobre RTGCS, como a divisão de alguns grupos
considerados heterogêneos (grupos 2,4,5 e 10), foram adotadas. Porém, uma
análise mais pormenorizada que contemple as indicações e a forma da indução
de parto, a indicação da cesárea, a idade e o IMC maternos, assim como os
resultados materno e neonatal, se faz necessária. Além disso, considerar a
classificação totalmente inclusiva implica na criação de um novo grupo de

Discussão Geral 68
Robson (grupo "99"), que contemple aquelas mulheres que não puderam ser
classificadas em um dos dez grupos por algum dado faltante, o que também
corroboraria para uma melhor avaliação da qualidade dos dados coletados
(Betran et al., 2014).
A proposta de avaliação da distribuição dos partos segundo os grupos de
Robson para as mulheres com morbidade materna grave foi programada desde
a formulação da RBVMMG (Haddad et al., 2011). Infelizmente, tal análise não
contou com um grupo controle, sem morbidade, porque o estudo original não
incluiu mulheres com estas características. Assim, utilizamos, para fins de
comparação, um estudo semelhante e representativo da população geral,
denominado WHO Global Survey. (Betrán et al., 2009)
Além disso, para o presente estudo, pudemos contar com a colaboração
do próprio autor da classificação, professor Michael S. Robson, o que nos
proporcionou uma visão mais abrangente e, ao mesmo tempo, detalhada de
sua classificação, enriquecendo nossos resultados e estimulando futuras
pesquisas sobre o tema.

Conclusões 69
6. Conclusões
Nos dados da RBVMMG:
– A taxa geral de cesárea encontrada foi elevada (73.2%).
– O grupo 10 de Robson foi o mais prevalente entre as mulheres com
morbidade grave e apresentou maior taxa de cesárea.
– Nos grupos de 7 a 10, o desfecho materno foi mais desfavorável, sendo que
nos grupos 1 e 3 houve melhor evolução.
– As multíparas sem cesárea prévia, com gestação única, cefálico, a termo, em
que o trabalho de parto foi induzido (grupo 4a) tiveram uma melhor evolução
materna que aquelas em que foi realizada cesárea antes do início do
trabalho de parto (grupo 4b).
– Em todos os grupos avaliados, a hipertensão foi o fator de gravidade
mais frequente

Conclusões 70
Nos dados do CAISM:
– A taxa de cesárea foi de 46.6%.
– As gestantes admitidas foram, em sua maioria, compostas por nulíparas,
com gestação única, cefálico, a termo e em trabalho de parto espontâneo
(grupo 1).
– A maior taxa de cesárea ocorreu nas multíparas com cesárea anterior,
gestação única, cefálico, a termo (grupo 5).
– Para maioria dos grupos de Robson, a maior frequência de internação em
UTI ocorreu entre as mulheres que tiveram parto cesárea como forma de
resolução da gravidez.

Referências Bibliográficas 71
7. Referências Bibliográficas
Abdel-Aleem H, Shaaban OM, Hassanin AI, Ibraheem AA. Analysis of cesarean delivery at Assiut University Hospital using the Ten Group Classification System. Int J Gynaecol Obstet. 2013;123(2):119-23.
Almerie Y, Almerie MQ, Matar HE, Shahrour Y, Al Chamat AA, Abdulsalam A.
Obstetric near-miss and maternal mortality in maternity university hospital, Damascus, Syria: a retrospective study. BMC Pregnancy Childbirth. 2010;10:65.
Barros FC, Matijasevich A, Requejo JH, Giugliani E, Maranhão AG, Monteiro
CA, et al. Recent trends in maternal, newborn, and child health in Brazil: progress toward Millennium Development Goals 4 and 5. Am J Public Health. 2010;100(10):1877-89.
Bateman BT, Berman MF, Riley LE, Leffert LR. The epidemiology of postpartum
hemorrhage in a large, nationwide sample of deliveries. Anesth Analg. 2010;110(5):1368-73.
Belizán JM, Althabe F, Barros FC, Alexander S. Rates and implications of
caesarean sections in Latin America: ecological study. BMJ. 1999;319(7222):1397-400.
Belizán JM, Althabe F, Cafferata ML. Health consequences of the increasing
caesarean section rates. Epidemiology. 2007;18(4):485-6. Bell JS, Campbell DM, Graham WJ, Penney GC, Ryan M, Hall MH. Do obstetric
complications explain high caesarean section rates among women over 30? A retrospective analysis. BMJ. 2001;322(7291):894-5.
Betrán AP, Gulmezoglu AM, Robson M, Merialdi M, Souza JP, Wojdyla D, et al.
WHO global survey on maternal and perinatal health in Latin America: classifying caesarean sections. Reprod Health. 2009;6:18.
Betrán AP, Merialdi M, Lauer JA, Bing-Shun W, Thomas J, Van Look P, et al.
Rates of caesarean section: analysis of global, regional and national estimates. Paediatr Perinat Epidemiol. 2007;21(2):98-113

Referências Bibliográficas 72
Betran AP, Vindevoghel N, Souza JP, Gülmezoglu AM, Torloni MR. A Systematic Review of the Robson Classification for Caesarean Section: What Works, Doesn´t Work and How to Improve It. PLoS One 2014; 9(6):e97769.
Brasil. Ministério da Saúde. Indicadores e dados básicos [DATASUS]. Brasília:
MS, 2012 Available at http://tabnet.datasus.gov.br/cgi/idb2012/C03b.htm Brennan DJ, Robson MS, Murphy M, O'Herlihy C. Comparative analysis of
international cesarean delivery rates using 10-group classification identifies significant variation in spontaneous labor. Am J Obstet Gynecol. 2009;201(3):308.e1-8.
Chong C, Su LL, Biswas A. Changing trends of cesarean section births by the
Robson Ten Group Classification in a tertiary teaching hospital. Acta Obstet Gynecol Scand. 2012;91(12):1422-7.
Ciriello E, Locatelli A, Incerti M, Ghidini A, Andreani M, Plevani C, et al.
Comparative analysis of cesarean delivery rates over a 10-year period in a single Institution using 10-class classification. J Matern Fetal Neonatal Med. 2012;25(12):2717-20.
Colais P, Fantini MP, Fusco D, Carretta E, Stivanello E, Lenzi J, et al. Risk
adjustment models for interhospital comparison of CS rates using Robson's ten group classification system and other socio-demographic and clinical variables. BMC Pregnancy Childbirth. 2012;12:54.
Costa ML, Cecatti JG, Souza JP, Milanez HM, Gülmezoglu MA. Using a
Caesarean Section Classification System based on characteristics of the population as a way of monitoring obstetric practice. Reprod Health. 2010;7:13.
Delbaere I, Cammu H, Martens E, Tency I, Martens G, Temmerman M. Limiting
the caesarean section rate in low risk pregnancies is key to lowering the trend of increased abdominal deliveries: an observational study. BMC Pregnancy Childbirth. 2012;12:3.
Leal MC, Silva AA, Dias MA, Gama SG, Rattner D, Moreira ME, et al. Birth in
Brazil: national survey into labour and birth. Reprod Health. 2012;9:15. Farine D, Shepherd D. Classification of caesarean sections in Canada: the
modified robson criteria. J Obstet Gynaecol Can. 2012;34(10):976-9. Geller SE, Rosenberg D, Cox SM, Brown ML, Simonson L, Driscoll CA, et al.
The continuum of maternal morbidity and mortality: factors associated with severity. Am J Obstet Gynecol. 2004;191(3):939-44.
Referências Bibliográficas 73
Grant D. Explaining source of payment differences in U.S. cesarean rates: why do privately insured mothers receive more cesareans than mothers who are not privately insured? Health Care Manag Sci. 2005;8(1):5-17.
Haddad SM, Cecatti JG, Parpinelli MA, Souza JP, Costa ML, Sousa MH, et al.
From planning to practice: building the national network for the Surveillance of Severe Maternal Morbidity. BMC Public Health. 2011;11:283.
Homer CS, Kurinczuk JJ, Spark P, Brocklehurst P, Knight M. A novel use of a
classification system to audit severe maternal morbidity. Midwifery. 2010;26(5):532-6.
Howell S, Johnston T, MacLeod SL. Trends and determinants of caesarean
sections births in Queensland, 1997-2006. Aust N Z J Obstet Gynaecol. 2009;49(6):606-11.
Karolinski A, Mercer R, Micone P, Ocampo C, Mazzoni A, Fontana O, et al. The
epidemiology of life-threatening complications associated with reproductive process in public hospitals in Argentina. BJOG. 2013.
Kelly S, Sprague A, Fell DB, Murphy P, Aelicks N, Guo Y, et al. Examining
caesarean section rates in Canada using the Robson classification system. J Obstet Gynaecol Can. 2013;35(3):206-14.
Lee YY, Roberts CL, Patterson JA, Simpson JM, Nicholl MC, Morris JM, et al.
Unexplained variation in hospital caesarean section rates. Med J Aust. 2013;199(5):348-53.
Luz AG, Tiago DB, Silva JC, Amaral E. [Severe maternal morbidity at a local
reference university hospital in Campinas, São Paulo, Brazil]. Rev Bras Ginecol Obstet. 2008;30(6):281-6.
Minkoff H, Chervenak FA. Elective primary cesarean delivery. N Engl J Med.
2003;348(10):946-50. National Institutes of Health. National Institutes of Health Consensus
Development Conference Statement. Vaginal birth after cesarean: new insights March 8-10, 2010. Semin Perinatol. 2010;34(5):351-65.
Oliveira Jr FC, Costa ML, Cecatti JG, Pinto e Silva JL, Surita FG. Maternal morbidity and near miss associated with maternal age: the innovative approach of the 2006 Brazilian demographic health survey. Clinics (Sao Paulo). 2013;68(7):922-7.
Oliveira Jr FC, Surita FG, Pinto e Silva JL, Cecatti JG, Parpinelli MA, Haddad SM, et al. Severe maternal morbidity and maternal near miss in the

Referências Bibliográficas 74
extremes of reproductive age: results from a national cross- sectional multicenter study. BMC Pregnancy Childbirth. 2014;14:77.
Oliveira Neto AF, Parpinelli MA, Cecatti JG, Souza JP, Sousa MH. Factors associated with maternal death in women admitted to an intensive care unit with severe maternal morbidity. Int J Gynaecol Obstet. 2009;105(3):252-6.
Pacagnella RC, Cecatti JG, Camargo RP, Silveira C, Zanardi DT, Souza JP, et
al. Rationale for a long-term evaluation of the consequences of potentially life-threatening maternal conditions and maternal "near-miss" incidents using a multidimensional approach. J Obstet Gynaecol Can. 2010;32(8):730-8.
Paleari L, Gibbons L, Chacón S, Ramil V, Belizán JM. [Rates of caesarean
sections tn two types of private hospitals: restriced-access and open-access]. Ginecol Obstet Mex. 2012;80(4):263-9.
Raifman S, Cunha AJ, Castro MC. Factors associated with high rates of
caesarean section in Brazil between 1991 and 2006. Acta Paediatr. 2014. doi: 10.1111/apa.12620.
Roberts CL, Algert CS, Ford JB, Todd AL, Morris JM. Pathways to a rising
caesarean section rate: a population-based cohort study. BMJ Open. 2012;2(5).
Robson MS. Classification of caesarean sections. Fetal and Matl Med Rev.
2001; 12:23-39. Robson MS. Can we reduce the caesarean section rate? Best Pract Res Clin
Obstet Gynaecol. 2001;15(1):179-94.
Robson S, Carey A, Mishra R, Dear K. Elective caesarean delivery at maternal request: a preliminary study of motivations influencing women's decision-making. Aust N Z J Obstet Gynaecol. 2008;48(4):415-20.
Ross S. An illustration of the "inverse care law": A commentary on giving birth in
Canada: providers of maternity and infant care. J Obstet Gynaecol Can. 2005;27(1):51-3.
Rossi AC, D'Addario V. Maternal morbidity following a trial of labor after
cesarean section vs elective repeat cesarean delivery: a systematic review with metaanalysis. Am J Obstet Gynecol. 2008;199(3):224-31.
Say L, Souza JP, Pattinson RC, classifications WHO working group of Maternal
Mortality and Morbidity classifications. Maternal near miss--towards a standard tool for monitoring quality of maternal health care. Best Pract Res Clin Obstet Gynaecol. 2009;23(3):287-96.

Referências Bibliográficas 75
Souza JP, Gülmezoglu A, Lumbiganon P, Laopaiboon M, Carroli G, Fawole B,
et al. Caesarean section without medical indications is associated with an increased risk of adverse short-term maternal outcomes: the 2004-2008 WHO Global Survey on Maternal and Perinatal Health. BMC Med. 2010;8:71.
Souza JP, Cecatti JG, Faundes A, Morais SS, Villar J, Carroli G, et al. Maternal
near miss and maternal death in the World Health Organization's 2005 global survey on maternal and perinatal health. Bull World Health Organ. 2010;88(2):113-9.
Souza JP, Cecatti JG, Haddad SM, Parpinelli MA, Costa ML, Katz L, et al. The
WHO maternal near-miss approach and the maternal severity index model (MSI): tools for assessing the management of severe maternal morbidity. PLoS One. 2012;7(8):e44129.
Souza JP, Gülmezoglu AM, Vogel J, Carroli G, Lumbiganon P, Qureshi Z, et al.
Moving beyond essential interventions for reduction of maternal mortality (the WHO Multicountry Survey on Maternal and Newborn Health): a cross-sectional study. Lancet. 2013;381(9879):1747-55.
Torloni MR, Betran AP, Souza JP, Widmer M, Allen T, Gulmezoglu M, et al.
Classifications for cesarean section: a systematic review. PLoS One. 2011;6(1):e14566.
United Nations. Global Strategy for Women´s and Children´s Health. New York:
Uinited Nations, 2010 (World Health Organization website). Available at http://www.who.int/topics/millenium_development_goals/about/en/
United Nations Department of Economic and Social Affairs. The Millennium
Development Goals Report 2013. New York: United Nations Department of Economics and Social Affairs: 64p., 2013. Available at https://www.unfpa.org/public/publications/pid/6090
Villar J, Valladares E, Wojdyla D, Zavaleta N, Carroli G, Velazco A, et al.
Caesarean delivery rates and pregnancy outcomes: the 2005 WHO global survey on maternal and perinatal health in Latin America. Lancet. 2006;367(9525):1819-29.
Wax JR, Cartin A, Pinette MG, Blackstone J. Patient choice cesarean: an
evidence-based review. Obstet Gynecol Surv. 2004;59(8):601-16. World Health Organization. Appropriate technology for birth. Lancet.
1985;2(8452):436-7. Ye J, Betrán AP, Vela MG, Souza JP, Zhang J. Searching for the Optimal Rate
of Medically Necessary Cesarean Delivery. Birth. 2014. doi: 10.1111/birt.12104.

Referências Bibliográficas 76

Anexos 77
8. Anexos
8.1. Anexo 1 – Critérios diagnósticos de near miss
Critérios Clínicos
Cianose aguda
Frequência respiratória >40ipm ou <6imp
Oligúria não responsiva a fluidos ou diuréticos
Perda de consciência ≥12h
Ausência de consciência e de pulso/batimento cardíaco
Icterícia na presença de pré-eclâmpsia
Choque
Gasping
Distúrbio de coagulação
Acidente vascular cerebral
Paralisia total
Critérios Laboratoriais
Saturação de oxigênio <90% por >60minutos
Lactato >5
Trombocitopenia aguda <50000 plaquetas
PaO2/FiO2 <200
Creatinina ≥300µmol/l ou ≥3.5mg/dl
pH < 7.1
Bilirrubinas >100µmol/l ou > 6.0mg/dl
Ausência de consciência e presença de glicose e cetoacidose na urina
Critérios de Manejo
Uso de droga vasoativa contínua
Diálise para insuficiência renal aguda
Histerectomia puerperal por infecção ou hemorragia
Reanimação cardiopulmonar
Transfusão ≥5 unidades de concentrado de hemáceas
Entubação e ventilação por tempo ≥60 minutos, não relacionada com anestesia

Anexos 78
8.2. Anexo 2 – Critérios diagnósticos de condições potencialmente ameaçadoras da vida
Complicações Hemorrágicas
Descolamento prematuro de placenta •Hemorragia pós parto
Placenta prévia/acreta/increta/percreta a) Atonia
Prenhez ectópica b) Retenção placentária
Rotura uterina c) Laceração de trajeto
Hemorragia grave por aborto d) Coagulopatia
Complicações Hipertensivas
Pré-eclâmpsia grave • Hipertensão grave
Eclâmpsia • HELLP síndrome
Outras Complicações
Edema pulmonar • Tromboembolismo
Convulsões • Cetoacidose diabética
Trombocitopenia < 100 mil • Icterícia/disfunção hepática
Crise tiretóxica • Meningite
Choque • Insuficiência renal aguda
Insuficiência respiratória aguda • Sepse grave
Acidose a) endometrite pós-parto
Cardiopatia b) endometrite pós-aborto
AVC c) foco urinário
Distúrbio de coagulação d) foco pulmonar Indicadores de Manejo de Gravidade
Admissão em UTI • Retorno à sala cirúrgica
Acesso venoso central • Intervenção cirúrgica maior
Transfusão de hemoderivados (histerectomia, laparotomia)
Hospitalização prolongada ( >7dias) • Uso de sulfato de magnésio
Entubação não relacionada à anestesia

Anexos 79
8.3. Anexo 3 – Robson Ten Group Classification System
Group
1.Nulliparous, single, cephalic, ≥37 weeks, spontaneous labour
2. Nulliparous, single, cephalic, ≥37 weeks, induction or CS* before
labour
3. Multiparous (excluding previous CS*), single, cephalic, ≥37 weeks,
spontaneous labour
4. Multiparous (excluding previous CS*), single, cephalic, ≥37 weeks,
induction or CS* before labour
5. Previous cesarean section, single, cephalic, ≥37 weeks
6. All nulliparous breeches
7. All multiparous breeches (including previous CS*)
8. All multiple pregnancies (including previous CS*)
9. All abnormal lies (including previous CS*)
10. All single, cephalic, ≤ 36 weeks (including previous CS*)
*CS: Cesarean section

Anexos 80
8.4. Anexo 4 – Ficha de identificação dos casos

Anexos 81
8.5. Anexo 5 – Ficha de coleta de dados
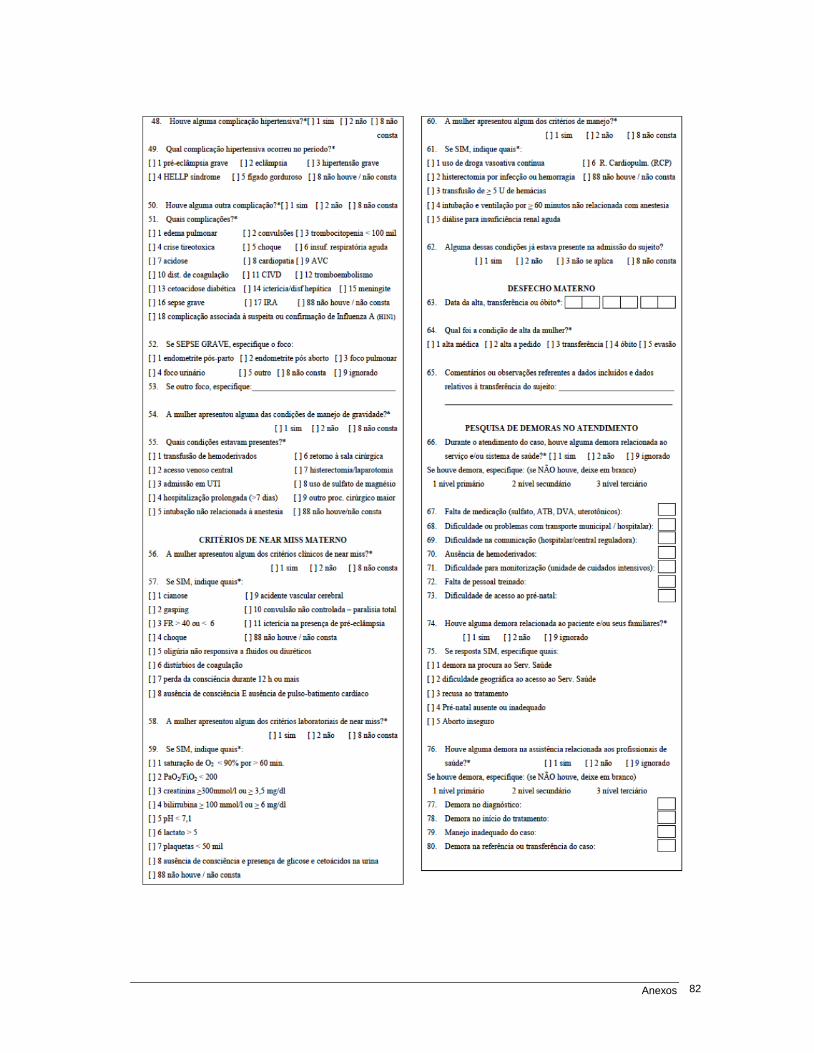
Anexos 82

Anexos 83
8.6. Anexo 6 – Parecer do Comitê de Ética em Pesquisa

Anexos 84

Anexos 85

Anexos 86

Anexos 87

Anexos 88