utilization of wild oat hay for fattening yearling steersuniversityofcalifornia collegeofagriculture...
TRANSCRIPT
UNIVERSITY OF CALIFORNIA
COLLEGE OF AGRICULTUREAGRICULTURAL EXPERIMENT STATION
BERKELEY, CALIFORNIA
UTILIZATION OF WILD OAT HAY FOR
FATTENING YEARLING STEERS
H. R. GUILBERT
BULLETIN 481
OCTOBER, 1929
UNIVERSITY OF CALIFORNIA PRINTING OFFICE
BERKELEY, CALIFORNIA
1929

Digitized by the Internet Archive
in 2012 with funding from
University of California, Davis Libraries
http://www.archive.org/details/utilizationofwil481guil

UTILIZATION OF WILD OAT HAY FOR FATTENING
YEARLING STEERS
H. E, GUILBERTi
INTRODUCTION
California is the leading state in the production of cereal hay, and
over considerable areas where beef cattle are raised on the range,
grain hay is available or can be grown, while the production of alfalfa
hay is not possible or feasible. Tame oat hay, barley hay, and wild
oat hay constitute the bulk of the cereal hays produced. The last
named is a volunteer crop on cultivated lands, often mixed with bur
clover and volunteer grain. It is also widely distributed on the lower
ranges and can, in many places, be cut for hay.
On several ranches the total feed supply is greatly increased, and
its quality retained, by cutting wild oats in the green stage whenfully headed and raking it into windrows or bucking it into large piles.
When the plants have been allowed to fully mature and the seeds to
shatter, there is a decided decrease in nutritional value. Hart and
Guilbert (1) have pointed out that this is due to the loss of protein and
phosphorus and to an increase in fiber content.
In addition to the hay crop many ranches can or do produce con-
siderable quantities of barley, which can be used for fattening cattle.
The total slaughter of cattle in California appears to have no
marked seasonal variations, but there is a marked seasonal variation
in the slaughter of California cattle, and a corresponding variation,
therefore, in slaughter of cattle originating in other states. According
to Voorhies and Koughan, (2) very few slaughter cattle are shipped
into California from May to August, a period during which an actual
surplus sometimes exists within the state.
The price level from October to March, when supplies of cattle are
being drawn from other states, is usually higher than during the
heavy runs of California grass fat cattle. The rather sudden changes
from shortage to surplus which so frequently occurs makes stabiliza-
tion of the market difficult.
1 Assistant Animal Husbandman in the Experiment Station.

4 University of California—Experiment Station
The trend of the past toward more and more intensive methods of
beef production will probably continue. The continued tendency
toward light weight carcasses, the economical gains made by younganimals, and the growing necessity of producing more tonnage of beef
from a given area of land are important considerations. Fattening of
yearling steers in California, though not a common practice, appears
to have possibilities where suitable feeds are available and not too
high priced. Yearling steers may be put on feed in the summer or
fall and marketed between November and March, when the price is
ordinarily good. Under favorable conditions, some cattle might
advantageously be handled in this way and the others carried over
and finished on grass the following spring and summer.
In view of the above facts, it was felt that experimental work on
the feeding value of wild oat hay, along with suitable grain rations
for fattening yearling steers should yield information which sooner
or later would be valuable to cattlemen.
REVIEW OF LITERATURE
In three trials with fattening calves at the Kansas Agricultural
Experiment Station during 1925-1928, Anderson (3) showed that a
ration of corn, corn silage, prairie hay, and cottonseed meal was
considerably less efficient than when alfalfa hay was fed in the com-
bination, but that the prairie hay ration was equal to the one con-
taining alfalfa when supplemented by a tenth of a pound of calcium
carbonate daily per steer. In other trials, (4) where no silage was fed,
the addition of ground limestone to prairie hay appeared to increase
the gains slightly, but the combination of prairie hay and ground
limestone was not equal to alfalfa. In this lot, where the supple-
ment was fed, the increase in gain could possibly be accounted for by
the slightly greater feed consumption, which might have occurred
irrespective of the supplement. The calcium content of the feeds
used in these experiments was, unfortunately, not determined.
That the calicum requirement for growth of cattle is not particu-
larly high when phosphorus is adequate was shown by Thieler, Green,
and DuToit. (5) They report an increase in live weight of two heifers
from about 470 pounds to about 1100 pounds in a period of eighteen
months on a ration supplying 8 grams of calcium oxide daily. This
constituted a gain of over a pound a day for an eighteen-months period
on a ration containing approximately .15 per cent calcium oxide.

Bul. 481] Wild Oat Hay for Fattening Yearling Steers
PLAN OF THE EXPERIMENTS
Information already at hand indicated that the deficiencies of
wild oat hay as compared with alfalfa are low protein, low calcium,
and somewhat lower palatability.
Two experiments were conducted—the first during the winter of
1927-28, the second during the winter of 1928-29. The objects of the
first trial were as follows
:
1. To compare the feeding value of alfalfa hay and wild oat hay in
fattening yearling steers.
2. To determine the advantage, if any, of adding a mineral (cal-
cium carbonate in the form of ground oyster shell) in rations con-
taining wild oat hay.
3. To study the factor of palatability and possibly increased gains
secured by chopping wild oat hay and adding to it cane molasses.
4. To ascertain how replacing one-half of the alfalfa hay with
wild oat hay will affect the gain and finish of the cattle.
5. To determine the value of adding a small quantity of cotton-
seed meal to a ration of alfalfa hay and rolled barley.
The plan of the second experiment was the same as of the first,
except that points 4 and 5 were omitted.
The Cattle Used.—The steers for both trials were purchased from
the same herd in Modoc County. Although predominantly Hereford
in characteristics, they showed a mixture of Shorthorn blood. They
varied widely in individuality as indicated by conformation and
quality. The grades varied from low medium to high good and, as a
group, probably averaged near the top of the medium grade. They
were dehorned after arrival at the feed yards. Although great
individual variation made them by no means ideal for experimental
purposes, they well represented the type of cattle available to Califor-
nia feeders. The lots were divided as evenly as possible on the basis
of weight and individuality. Each group had access to a shed 24 by
32 feet and to an open, paved lot 24 by 40 feet. Ten animals were
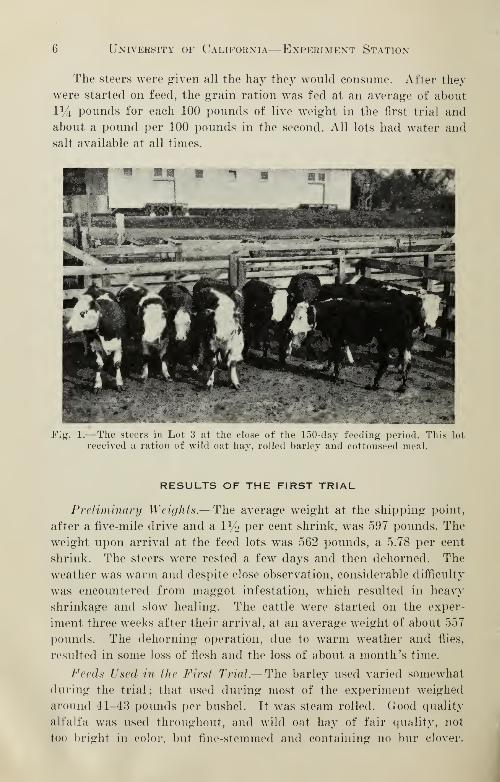
used in each lot. Figure 1 shows the steers in lot 3 at the close of the
experiment and gives an idea of the general quality and condition of
the cattle at the time of marketing.
Method of Feeding.—The grain ration was fed first and followed
by the hay. The cottonseed meal and ground oyster shell were fed
mixed with rolled barley. The chopped hay was placed in a box with
a metal lining. The molasses, diluted with an approximately equal
quantity of water, was sprinkled on the hay, which was then allowed
to stand until the next feeding time.
6 University of California—Experiment Station
The steers were given all the hay they would consume. After they
were started on feed, the grain ration was fed at an average of about
1% pounds for each 100 pounds of live weight in the first trial and
about a pound per 100 pounds in the second. All lots had water and
salt available at all times.
Fig. 1.—The steers in Lot 3 at the close of the 150-day feeding period. This lot
received a ration of wild oat hay, rolled barley and cottonseed meal.
RESULTS OF THE FIRST TRIAL
Preliminary Weights.—The average weight at the shipping point,
after a five-mile drive and a IV2 per cent shrink, was 597 pounds. The
weight upon arrival at the feed lots was 562 pounds, a 5.78 per cent
shrink. The steers were rested a few days and then dehorned. The
weather was warm and despite close observation, considerable difficulty
was encountered from maggot infestation, which resulted in heavy
shrinkage and slow healing. The cattle were started on the exper-
iment three weeks after their arrival, at an average weight of about 557
pounds. The dehorning operation, due to warm weather and flies,
resulted in some loss of flesh and the loss of about a month's time.
Feeds Used in the First Trial.—The barley used varied somewhat
during the trial; that used during most of the experiment weighed
around 41-43 pounds per bushel. It was steam rolled. Good quality
alfalfa was used throughout, and wild oat hay of fair quality, not
too bright in color, but fine-stemmed and containing no bur clover.

Bul. 481] Wild Oat Hay for Fattening Yearling Steers
The cottonseed meal was hot-pressed, guaranteed to contain not less
than 41 per cent protein although the analysis showed it to contain
only 38.28 per cent. The molasses was Hawaiian cane, and the pul-
verized oyster shell contained approximately 97 per cent calcium
carbonate.
The composition of the feeds is shown in table 1.
TABLE 1
Composition of Feeds Used in the First Trial
Feeds Moisture Crudeprotein
Nitrogen-free
extractEtherextract
Crudefiber
Ash CaO P2O5
per cent
8.85
8.09
11.57
18.97
6.62
per cent
14.94
7.39
10.95
1.90
38.28
per cent
36.39
44.61
66.70
59.75
30 29
per cent
1 15
2.08
1.60
0.10
8 19
per cent
29.25
28.94
6.34
0.05
9.46
per cent
9.42
8.89
2.84
9.33
7.16
per cent
1 21
0.26
0.07
36
45
per cent
0.63
0.78
Rolled barley 96
0.025
Cottonseed rnea! 3.46
Weights.—The steers were weighed individually three days in
succession at the beginning of the experiment, and the average taken
as the initial weight. They were weighed at 30-day intervals, and the
average of three daily weights at the close of the experiment was
taken as the final weight.
Rations Used.—The rations for the various lots were as follows :
Lot 1 Alfalfa hay and rolled barley
Lot 2 Alfalfa hay, rolled barley, and cottonseed meal
Lot 3 Wild oat hay, rolled barley, and cottonseed meal
Lot 4 Wild oat hay, rolled barley, cottonseed meal and pulverized
oyster shell.
Lot 5 Chopped wild oat hay, cane molasses, rolled barley, cottonseed
meal, and pulverized oyster shell
Lot 6 Wild oat hay in the morning, alfalfa hay at night, rolled
barley, and cottonseed meal.
As there was no marked difference in appetite, all lots were fed
the same quantity of concentrates except lot 1, which went off feed
during the last 30 days.
The average ration for each 30-day period of a typical lot is shown
in table 2.
The lots receiving alfalfa hay ate about one pound more hay
throughout the experiment than those fed wild oat hay. The lot
fed chopped oat hay and molasses ate 12 pounds of hay daily
throughout most of the experimental period.
The detailed results are given in table 3.

University of California—Experiment Station
TABLE 2
Average Daily Kations by 30-Day Periods, Lot 3
Period Wild oat hay Rolled barley Cottonseed meal
pounds
9.96
10.43
10.46
10.38
8.00
pounds4.13
6.23
6.99
7.99
9.69
pounds1 13
1 88
2 00
2 00
2 00
TABLE 3
Eesults of 150-Day Feeding Experiment in Fattening Yearling Steers
Lot 1* Lot 2 Lot 3 Lot 4 Lot 5 Lot 6
Average initial weight
pounds
557
855
298
1.99
8.32
pounds
557
865
308
2.06
7.77
0.98
pounds
557
862
305
2 03
7.01
1 80
pounds
557
857
300
2 00
6.99
1.80
17
pounds
557
845
288
1 92
4.03
1.98
0.17
2.86
pounds
557
847
290
Average daily gain
Average daily ration:
1 94
7 80
98
Calcium carbonate
10.91 10 97 5.52
9.86
0.40
345
89
9.79
0.47
349
90
9
11.63
0.04
209
103
9
149
5.48
Hay refused
Feed for 100 pounds gain:
0.36
419
0.25
378
47
0.06
402
51
550 534 285
485
434
490
440
605f
462
283
419 426 453
Ten steers in each lot. t Chopped hay.
Discussion of Results.—The difference in gains made by the var-
ious lots is not significant, for it may be attributed to variations in
animals within the lots. The steer making the least gain of the 60
head is in lot 5, and the next lowest is in lot 6. If these two steers
were omitted and the gains calculated on the remaining nine head,
the average would be brought up to that of lots 1, 2, 3 and 4.
The rate of gain may be considered fairly representative of the
results to be expected in feeding yearlings of the quality used in this
experiment. A good many of these steers were somewhat rangy,
lacking in width, and deficient in hind quarter. This experiment and
others demonstrate that steers lacking in breeding reach the limit in
Bul. 481] Wild Oat Hay for Fattening Yearling Steers ft
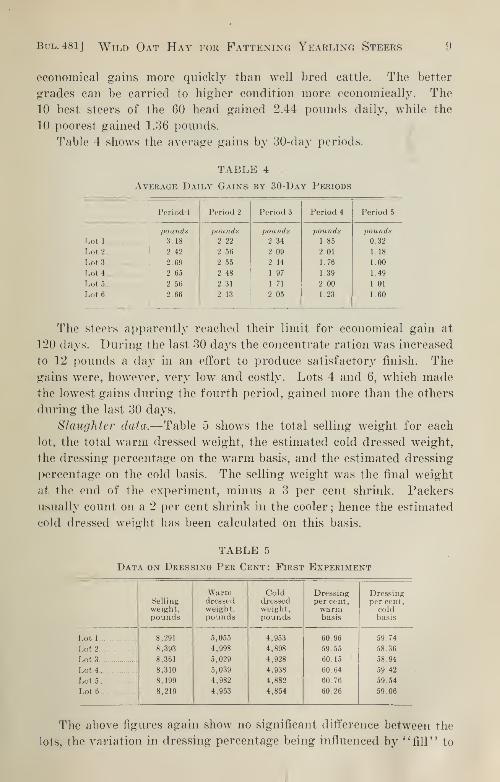
economical gains more quickly than well bred cattle. The better
grades can be carried to higher condition more economically. The
10 best steers of the 60 head gained 2.44 pounds daily, while the
10 poorest gained 1.36 pounds.
Table 4 shows the average gains by 30-day periods.
TABLE 4
Average Daily Gains by 30-Day Periods
Period 1 Period 2 Period 3 Period 4 Period 5
pounds po u n da pounds pounds pounds
Lot 1 3.18 2 22 2.34 1.85 0.32
Lot 2.... 2.42 2 56 2.09 2.01 1.18
Lot 3 .... 2.69 2 55 2 14 1.76 1.00
Lot 4 2 65 2 48 1.97 1 39 1 49
Lot 5 2.56 2 31 1 71 2.00 1 01
Lot 6 2 66 2.13 2 05 1 23 1.60
The steers apparently reached their limit for economical gain at
120 days. During the last 30 days the concentrate ration was increased
to 12 pounds a day in an effort to produce satisfactory finish. The
gains were, however, very low and costly. Lots 4 and 6, which madethe lowest gains during the fourth period, gained more than the others
during the last 30 days.
Slaughter data.—Table 5 shows the total selling weight for each
lot, the total warm dressed weight, the estimated cold dressed weight,
the dressing percentage on the warm basis, and the estimated dressing
percentage on the cold basis. The selling weight was the final weight
at the end of the experiment, minus a 3 per cent shrink. Packers
usually count on a 2 per cent shrink in the cooler; hence the estimated
cold dressed weight has been calculated on this basis.
TABLE 5
Data on Dressing Per Cent: First Experiment
Sellingweight,pounds
Warmdressedweight,pounds
Coldd,ressedweight,pounds
Dressingper cent,warmbasis
Dressingper cent,
coldbasis
Lot 1 8,291
8,393
8,361
8,310
8,199
8,219
5,055
4,998
5,029
5,039
4,982
4,953
4,953
4,898
4,928
4,938
4,882
4,854
60.96
59.55
60.15
60.64
60 76
60.26
59.74
Lot 2 58.36
Lot 3 58.94
Lot 4 59.42
Lot 5 ..' 59.54
Lot 6 59.06
The above figures again show no significant difference between the
lots, the variation in dressing percentage being influenced by " fill" to

10 University of California—Experiment Station
a greater extent than by any difference in condition of the animals.
The final weight of lot 1 was somewhat less than that of lot 2, but the
carcass weights were in the reverse order. Lot 1 had been off feed
during a part of the last 30 days and were not so well ''filled" as
normally; in addition, this lot decreased in weight each day of the
final three weights, while lot 2 weighed practically the same each day.
This again indicated a greater fill in lot 2 steers and a lower dressing
percentage. The remainder of the lots weighed about the same on
each of the three days, and the small differences in dressing percentage
are probably not significant. All lots, although not in high condition,
dressed fairly high, probably because many of the steers were shallow-
bodied, resulting in light offal.
RESULTS OF THE SECOND TRIAL
The second trial, four lots of ten steers each were used. The
animals were heavier than those used in the first trial and were fed
120 days instead of 150.
Preliminary Weights.—The average weight at the shipping point,
after a five-mile drive and a 1% per cent shrink, was 716 pounds. The
steers arrived in Davis after a particularly good run of 36 hours.
The weight at the feed lots after watering, but before feeding, was
688 pounds, or a shrink of 3.9 per cent. After being fed hay and a
small allowance of grain for 8 days, they were divided into lots, and
the experiment began. The average initial weight was 715 pounds,
or only one pound less than the buying weight, the shrinkage being
mostly a matter of fill.
As the weather was warm and flies were numerous at the start of
the experiment, dehorning was delayed until favorable weather. It
was felt that this procedure might not seriously affect the compara-
tive data from the various lots and might yield interesting informa-
tion regarding the loss from dehorning under favorable conditions. It
was realized, however, that this procedure would render of less value
the data on feed required for 100 pounds of gain.
On account of federal accreditation of the breeding herds, the
University is limited in its purchase of feeders to a few counties in
the tuberculosis-free area, where usually few feeder cattle are for sale
and where dehorned cattle could not be bought for the experiment.
The complications resulting from dehorning were therefore unavoid-
able. Figure 2 shows the steers in lot 3 of the second experiment
during the first 30 days and before dehorning. The variation in
quality and conformation is shown in this photograph.

Bul.481] Wild Oat Hay for Fattening Yearling Steers 11
Fig. 2.—The steers in Lot 3 of the second experiment during the first
30 days and before dehorning.
Data on Dehorning.—The steers were started on experiment Octo-
ber 17 and were dehorned November 23, or one week after the close
of the first 30-day period. The weather was cool and frosts had
destroyed or reduced the activity of most of the flies, so that no
trouble was encountered from this source. The average weights of the
steers in each of the lots immediately before dehorning and 10 days
later are shown in table 6.
TABLE 6
Effect of Dehorning
Weightbefore
dehorning
Weight10 daysafter
dehorning
Gain orloss
Gainfor
30-dayperiod
Lot 1
pounds798
789
793
787
792
pounds
796
790
780
770
784
pounds- 2
+ 1
-13-17- 8
pounds
40
Lot 2 2(>
Lot 3 27
Lot 4 24
29
Apparently there was a decided difference in the effect of dehorn-
ing on lots 3 and 4 as compared with 1 and 2 ten days after dehorning.
For the 30-day period lots 2, 3, and 4, showed very little difference
in the total average gain but lot 1 gained considerably more. The
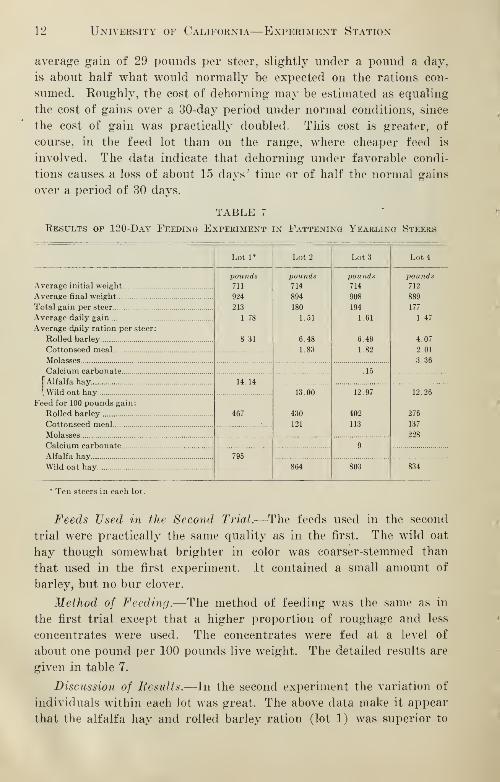
12 University of California—Experiment Station
average gain of 29 pounds per steer, slightly under a pound a day,
is about half what would normally be expected on the rations con-
sumed. Roughly, the cost of dehorning may be estimated as equaling
the cost of gains over a 30-day period under normal conditions, since
the cost of gain was practically doubled. This cost is greater, of
course, in the feed lot than on the range, where cheaper feed is
involved. The data indicate that dehorning under favorable condi-
tions causes a loss of about 15 days' time or of half the normal gains
over a period of 30 days.
TABLE 7
Kesults of 120-Day Feeding Experiment in Fattening Yearling Steers
Lot 1* Lot 2 Lot 3 Lot 4
pounds
711
924
213
1.78
8.31
pounds
714
894
180
1.51
6.48
1.83
pounds714
908
194
1.61
6.49
1.82
pounds
712
889
177
1 47
Average o\aily ration per steer:
4.07
2.01
3.36
.15
["Alfalfa hay 14.14
13.00
430
121
12.97
402
113
12.26
Feed for 100 pounds gain:
467 276
137
228
9
795
864 803 834
* Ten steers in each lot.
Feeds Used in the Second Trial.—The feeds used in the second
trial were practically the same quality as in the first. The wild oat
hay though somewhat brighter in color was coarser-stemmed than
that used in the first experiment. It contained a small amount of
barley, but no bur clover.
Method of Feeding.—The method of feeding was the same as in
the first trial except that a higher proportion of roughage and less
concentrates were used. The concentrates were fed at a level of
about one pound per 100 pounds live weight. The detailed results are
given in table 7.
Discussion of Kesults.—In the second experiment the variation of
individuals within each lot was great. The above data make it appear
that the alfalfa hay and rolled barley ration (lot 1) was superior to
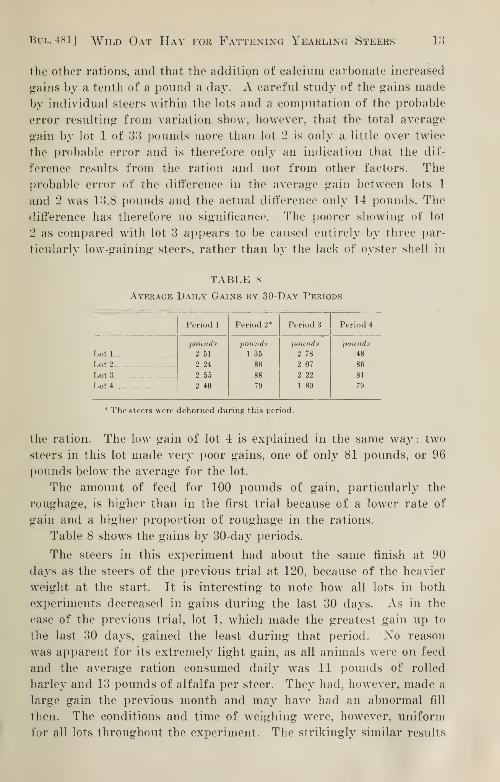
Bul,481J Wild Oat Hay for Fattening Yearling Steers 13
the other rations, and that the addition of calcium carbonate increased
gains by a tenth of a pound a day. A careful study of the gains made
by individual steers within the lots and a computation of the probable
error resulting from variation show, however, that the total average
gain by lot 1 of 33 pounds more than lot 2 is only a little over twice
the probable error and is therefore only an indication that the dif-
ference results from the ration and not from other factors. The
probable error of the difference in the average gain between lots 1
and 2 was 13.8 pounds and the actual difference only 14 pounds. The
difference has therefore no significance. The poorer showing of lot
2 as compared with lot 3 appears to be caused entirely by three par-
ticularly low-gaining steers, rather than by the lack of oyster shell in
TABLE 8
Average Daily Gains by 30-Day Periods
Period 1 Period 2* Period 3 Period 4
Lot 1
pounds
2.51
2.24
2 55
2 40
pounds1.35
.86
.88
.79
pounds2 78
2.07
2.22
1 89
pounds
.48
Lot 2 .86
Lot 3 .81
Lot 4 .79
The steers were dehorned during this period.
the ration. The low gain of lot 4 is explained in the same way : two
steers in this lot made very poor gains, one of only 81 pounds, or 96
pounds below the average for the lot.
The amount of feed for 100 pounds of gain, particularly the
roughage, is higher than in the first trial because of a lower rate of
gain and a higher proportion of roughage in the rations.
Table 8 shows the gains by 30-day periods.
The steers in this experiment had about the same finish at 90
days as the steers of the previous trial at 120, because of the heavier
weight at the start. It is interesting to note how all lots in both
experiments decreased in gains during the last 30 days. As in the
case of the previous trial, lot 1, which made the greatest gain up to
the last 30 days, gained the least during that period. No reason
was apparent for its extremely light gain, as all animals were on feed
and the average ration consumed daily was 11 pounds of rolled
barley and 13 pounds of alfalfa per steer. They had, however, made a
large gain the previous month and may have had an abnormal fill
then. The conditions and time of weighing were, however, uniform
for all lots throughout the experiment. The strikingly similar results

14 University of California—Experiment Station
in both trials give weight to the observation that steers of this quality
reach the limit of economic gains very suddenly. Financial results of
attempting to obtain a higher finish are apt to be disappointing.
Slaughter Data,—Table 9 shows the total weight at the end of the
trial, the warm dressed weight of the carcasses, and the dressing
percentages for each of the lots. The cattle were shipped eight days
after the close of the experiment, and all lots had increased in
weight. The dressing percentage was taken on the basis of the final
weights of the trial, since individual weights were not taken immed-
iately before shipping, and the average of the three final daily weights
was considered more accurate for comparative purpose than a single
weight. The dressing percentage is fairly high on the full basis
because of some increase in carcass after the weights were taken.
TABLE 9
Data on Dressing Per Cent: Second Experiment
•
Liveweight,pounds
Carcassweight,pounds
Dressingper cent,warm basis
Lot 1 9,240
8,943
9,077
8,885
5,474
5,305
5,385
5,200
59.24
Lot 2 59.32
Lot 3 59.32
Lot 4 58.52
The dressing percentage were about the same as in the previous
trial. Lots 1, 2, and 3, produced the same yield, while lot 4 was
0.8 per cent lower. All lots were sold for the same price per pound
in both experiments.
Grading of Steers and Carcasses.—The steers were graded individ-
aully as feeders by the author at the beginning of the trial. At the
end they were graded as slaughter cattle by a committee of three,
composed of W. E. Schneider and E. T. Forsling, Federal-State
Livestock Market News Service, San Francisco, and the author. The
results are summarized in table 10.
In order to make rather fine distinctions in grading the indi-
viduals, each grade was divided into three sub-grades, i.e., high good,
average good, low good, etc. The grading in general showed very
fine agreement among the judges. The committee agreed on 30 out
of the 40 head, and the variance on the remaining 10 head was with one
exception within the limits of one-third of a grade. Several steers
graded low good as feeders were not sufficiently finished to go in
that grade as slaughter cattle and were graded at the top or the
average of the medium grade.

Buu 481] Wild Oat Hay for Fattening Yearling Steers 15
It is realized that live cattle may at times change in appearance
from one day to the next to an extent that would slightly alter the
grading. It is also recognized that not all animals placed in a certain
grade as live cattle may be assigned to the corresponding carcass
grade because of bruises or faults not apparent in the live animal.
Individuals doing the grading introduce a further variation. Acareful appraisal of the individual animals and carcasses, together
with the dressing percentage and total gains, seems a better basis for
comparing one ration with another in regard to finish and market
TABLE 10
Summary of Grading of Steers and of Carcasses
Lot 1,
numberof head
Lot 2,
numberof head
Lot 3,
numberof head
Lot 4,
numberof head
[Good
Feeder grade .... (
[Medium
High
Average
Low' High
Average
1
3
2
2
2
2
4
2
1
1
2
3
3
2
1
5
3
1
' High
2
2
1
5
2
1
1
6
1
1
1
2
5
[Good
Slaughter grade s
[Medium J
Average
LowHigh
3
1
3
Average 1
2
[High
[Good j Average
Carcass grade ^[Medium \ Average
[ Low
2
3
2
3
1
2
1
2
4
1
2
2
3
2
2
1
1
5
1
value than selling price alone. Particularly is this true on the
Pacific Coast, where the price spread between grades is narrow and
where small differences in finish are not recognized in a price dif-
ferential. In the report of feeding trials where appraisal by a market
representative is used as an index of finish, an apparent inconsistency
not infrequently exists between appraisal value and the total gain in
live weight. More careful individual study of the animals comprising
the lots in such cases and a record of actual sales of the carcasses
might reveal that these price differences resulted from factors other
than the effect of the ration, or perhaps were not justified at all from
the standpoint of actual packing house receipts.

16 University of California—Experiment Station
No great difference in the lots is revealed by the grading. The
carcasses from lot 1 seemed, on the average, slightly better covered.
In general the carcasses were characterized by a covering of fat
approximately *4 to % of an inch in thickness over the back and loin.
On the best steers there was a thin covering of fat on the round, which
is one of the last places to cover. In most of the steers, rounds were
deficient in covering. There was very little waste, and the kidney fat
was light. Most of the carcasses were somewhat angular, heavy in
front, and deficient in loin and round. A number of carcasses—some-
what lighter than the average, smooth but very light in kidney fat,
and all grading as medium because of conformation and finish—sold
for a cent more per pound than those better covered.
These and other observations have indicated that high condition
does not necessarily increase the carcass price of this class of cattle.
The packer, when buying: live cattle, can, however, pay somewhat
more for those carrying higher condition, because of greater yield.
The apparent failure of carcass buyers to make a price differential
for high condition may be logically attributed to the trade demandwhich they supply. Fat intermingled with the lean, commonly called
marbling, is generally associated with tenderness and flavor of beef.
Frequently a thick covering over the outside of the carcass is neces-
sary before marbling occurs. The average consumer apparently does
not appreciate that marbling is associated with higher quality, or, if
he does, he considers that the waste fat he must buy to get it makes
the cost more than it is worth to him. This selection for leaner cuts
is reflected all along the line to the producer. The fat on the carcass
has other functions besides imparting flavor and perhaps tenderness
to the lean. It protects the carcass from time of slaughter to con-
sumption. Being dry, it decreases the growth of bacteria and molds;
it prevents excessive drying and becomes hard in the cooler, thus
giving firmness to the carcass and facilitating " aging," which
greatly improves flavor and tenderness. Apparently the minimumamount of condition which permits holding" of the carcass until it can
be merchandised is satisfactory to the average consumer.
The stockman should make every effort to improve the quality of
his cattle and to select the thick-fleshed kind which are well developed
in rib, loin, and round, for such steers are "good doers" and most
economical to produce. Apparently, however, a minimum amount of
condition is satisfactory for the bulk of the Coast market trade—
a
fact adventageous to the producer on account of the great cost of

Bui* 481] Wild Oat Hay for Fattening Yearling Steers 17
putting on the extra fat required to produce the higher grades. The
production of tender, juicy, and palatable beef without excess fat is
a problem justifying attention in the beef industry.
Relation of Grade to Gains and Dressing Percentage.—The average
total gain of 23 head of steers, graded "good" as feeders, was 207
pounds per head, or 1.73 pounds daily. Seventeen head graded as
"medium" feeders gained on the average 171 pounds each or 1.43
pounds daily, a difference of 0.3 pound per day in favor of the better
steers. As shown in table 9, a large number of the steers as feeders
were placed in the low good and high medium grades, so that this
difference in gaining ability is largely between animals within the
limits of a single grade. It demonstrates splendidly the importance
of the right type in beef making.
The average dressing percentage of the 14 steers graded "good"as slaughter cattle was 59.40 per cent. The average for the 26 head
falling into the medium grade was 58.93, a difference of 0.47 per cent
in favor of the good steers. This is a difference in carcass yield of
almost 5 pounds per head, which would, at 20 cents per pound, amount
to $1.00 per head difference because of higher yield. The fact that
most of the steers graded medium were slim in build, and lacked feed
capacity, probably accounts for the small difference in dressing
percentage.
Yields of Packing House Products.—The following figures should
prove interesting to those unfamiliar with packing house procedure,
for they give an idea of the items entering into the cost of dressed
beef.
Pounds Per cent
20,936
780
1,440
2,825
10,054
58.01
2.16
Total tallow 4.00
Total hides.. . 7.84
Tot:\l offal, blood, heads, feet, shrink, etc 27.90
36,035 100 00
With steer prices remaining constant, the variation in hide and
offal values affects materially the carcass cost.
Calcium and Phosphorus Content of the Ration.—The average
dairy intake per steer of calcium and phosphorus has been computed
from the chemical analysis of the feeds and the average daily ration
consumed. It may serve to indicate a certain range of calcium intake
which apparently does not influence gains in live weight in yearling

18 University of California—Experiment Station
steers over 120-150 day feeding periods. Lots 1, 3, and 4 of the first
experiment and lots 1, 2 and 3 of the second are used for this com-
parison, and the data are shown in table 11.
The gains in lots 1, 3, and 4 of the first experiment were almost
identical. Lots 1 and 4 had practically the same calcium intake,
3% times that of lot 3. Apparently an intake of CaO as low as 0.21
per cent of the total ration and a ratio of P 2 3 to CaO of 5 :1 did not
influence the rate of gain.
In the second experiment the ration of alfalfa and rolled barley
(lot 1) produced slightly better gains than the other lots. Since the
TABLE 11
Data on Calcium and Phosphorus in Kelation to Gains in Live Weight
Averageweight,steers
Averagedailygain
CaO,dailyintake
P2O5,dailyintake
CaO,per centof totalration
P2O5,per centof totalration
fLotl
pounds
706
pounds
1.99
pounds
0.14
pounds
15
per cent
0.73
per cent
78
First experiment ....< Lot 3 709 2.03 0.04 0.21 0.21 1.12
kLot4 707 2.00 135 21 72 1.12
r
Lotl 817 1.78 21 15 94 66
Second experiment Lot 2 803 1.51 05 20 0.23 0.94
Lot3 810 1.61 134 0.20 63 0.94
CaO intake in lot 3 was over 0.6 per cent of the ration, the advantage
of lot 1 can hardly be attributed to calcium intake. The difference
between lots 2 and 3, as previously stated, is more logically explained
by individuality of the steers than by the calcium content of the
rations.
In these experiments, the amount of roughage fed was fairly high.
When calves are fed heavy concentrate rations (twice as much con-
centrates as roughage is commonly fed), and a roughage low in
calcium, the percentage would be reduced to perhaps less than half
that of the low calcium lots shown in table 10. Since the calf, growing
rapidly in skeleton, has a relatively higher requirement for mineral
than older cattle, the intake would probably be below the minimumrequirement for most economical gains. Roughage with lower cal-
cium content' than the wild oat hay used in the present experiments,
i.e., 0.26 per cent and 0.28 per cent for the first and second trials,
respectively, is not commonly encountered. The barley, however,
contained only one-fourth as much calcium as the wild oat hay. In
all probability, therefore, calcium does not become a limiting factor
in economical gains even with low calcium roughage unless the
quantity consumed is restricted by heavy concentrate feeding.

Bui* 481] Wild Oat Hay for Fattening Yearling Steers If)
SUMMARY
1. Wild oat hay and rolled barley, when fed with sufficient cotton-
seed meal to supply the necessary protein, are almost equal to alfalfa
and rolled barley in the production of gains and finish.
2. Good quality alfalfa hay contains about 12 per cent digestible
protein, while wild oat hay contains about 4 per cent, or a. difference
of 8 per cent. When 10 pounds of wild oat hay are substituted in
the daily ration for a like amount of alfalfa, the difference in protein
intake is approximately 0.8 of a pound. Two pounds of cotton-
seed meal are required to make up this difference in protein. Prac-
tically the same is true of other grain hays. Good red oat or barley
hay might be expected to have a higher value than wild oat hay,
because of the greater amount of grain which they usually contain.
3. The addition of calcium carbonate in the form of ground
oyster shell did not increase the efficiency of a ration of wild oat
hay, rolled barley, and cottonseed meal.
4. Feeding of chopped wild oat hay and molasses did not produce
greater gains or finish than long hay. There was no waste of hay
when chopped hay was given, and the molasses replaced approximately
an equal quantity of barley.
5. Equal parts of alfalfa hay and wild oat hay seemed no more
efficient than either kind of hay alone.
6. The addition of cottonseed meal to a ration of alfalfa hay and
rolled barley increased neither gains nor finish. The cottonseed meal
in combination with alfalfa has some advantages in producing a sleek
appearance.
7. The wide variation of steers within the lots made small differ-
ences in average gains insignificant.
8. A calcium oxide intake as low as 0.21 per cent of the total
ration did not appear to limit gains.
9. Dehorning under favorable conditions prevented gains in weight
for a period of about 15 days. Cattle intended for finishing as year-
lings should be dehorned while calves.
10. The higher the grade of cattle, the more likely they are to
return a profit from intensive feeding with high priced feeds. Poor
quality cattle gain less, yield a lower percentage of carcass, and cannot
be carried to so high a degree of finish, economically, as the bettor
grades.

20 University of California—Experiment Station
11. Most of the Pacific Coast carcass demand for shop trade
appears to be for a medium to light weight carcass, carrying only
enough fat to keep in the coolers until it can be merchandized, and
carrying a minimum of kidney fat. High yield of rib, loin, and
round cuts is desired by the retail butcher. Cattle yielding a high
per cent of valuable cuts are also the kind which develop rapidly and
economically. The finish desired is much more economical to pro-
duce than the higher finish required to secure top prices in mid-
western markets.
12. Local feed prices can be applied to the amounts of feed re-
quired to produce 100 pounds of gain, and the cattleman can therefore
estimate the cost of finishing under his own conditions. Table 3 is
best for this purpose, because dehorning during the feeding period
made feed consumption in relation to gain abnormally high.
The following example shows the method of using data from table
3 to estimate feeding costs and necessary selling price and margin.
Assume that feeder steers cost $10.00 per cwt., wild oat hay $12.00 per ton,
barley $35.00 per ton, and cottonseed meal $45.00 per ton.
The feed required to produce 100 pounds of gain, using table 3, lot 3
:
barley 345 pounds, cottonseed meal 89 pounds, and wild oat hay 4S5 pounds.
345 pounds barley @ 1.75 cents per pound $6.04
89 pounds cottonseed meal @ 2.25 cents per pound 2.00
485 pounds wild oat hay @ 0.60 cents per pound 2.91
Cost of feed required for 100 pounds gain $10.95
Then, assuming an initial weight of 600 pounds, a total gain of 300 pounds to
finish the steers, and a 3 per cent shrink, the selling weight would be 900 pounds
minus 27 pounds, or 873 pounds.
Initial cost per steer $60.00
Cost of 300 pounds gain (3 x $10.95) 32.85
Interest, labor, etc. (estimated) ,6.00
Total cost $98.85
Total cost divided by selling weight ($98.85^873 pounds) = $11.32, the
necessary selling price per cwt. to break even. The necessary margin is the
selling price minus the purchase price ($11.32 minus $10.00), or $1.32 per cwt.
The necessary margin to break even will vary usually between $1.00 and $2.50 per
cwt., depending on initial weight and price of feeders and the feed prices.

Bul. 481] Wild Oat Hay for Fattening Yearling Steers 21
LITERATURE CITED
i Hart, G. H., and H. R. Guilbert.
1928. Factors influencing percentage calf crop in range herds. California
Agr. Exp. Sta. Bul. 458:3-43.
2 Voorhies, Edwin C, and A. B. Koughan.
1928. Economic aspects of the beef cattle industry. California Agr.
Exp. Sta. Bul. 461:1-128.
3 Anderson, B. M.
1928. A three-year study of the value of adding calcium carbonate to
cattle fattening rations containing only non-legumes. .Record
of Proc. Am. Soc. Animal Production, p. 59-61.
^ Anderson, B. M., and M. A. Alexander.
1928. The relative value of adding ground limestone to alfalfa and to
prairie hay when fed to fattening calves. Kansas Agr. Exp.
Sta., Dept. Animal Husb. Mim. Report.
s Theiler, Sir Arnold, H. H. Green, and P. J. DuToit.
1927. Minimum mineral requirements of cattle. Jour. Agr. Sci. 17;(3):291••
314.


STATION PUBLICATIONS AVAILABLE FOR FREE DISTRIBUTION
BULLETINS
No.
253. Irrigation and Soil Conditions in theSierra Nevada Foothills, California.
263. Size Grades for Ripe Olives.277. Sudan Grass.279. Irrigation of Rice in California.283. The Olive Insects of California.304. A Study of the Effects of Freezes on
Citrus in California.310. Plum Pollination.313. Pruning Young Deciduous Fruit Trees.331. Phylloxera-resistant stocks.
335. Cocoanut Meal as a Feed for DairyCows and Other Livestock.
343. Cheese Pests and Their Control.344. Cold Storage as an Aid to the Market-
ing of Plums, a Progress Report.346. Almond Pollination.347. The Control of Red Spiders in Decid-
uous Orchards.348. Pruning Young Olive Trees.349. A Study of Sidedraft and Tractor
Hitches.353. Bovine Infectious Abortion, and Asso-
ciated Diseases of Cattle and New-born Calves.
354. Results of Rice Experiments in 1922.357. A Self-Mixing Dusting Machine for
Applying Dry Insecticides and Fun-gicides.
361. Preliminary Yield Tables for Second-Growth Redwood.
362. Dust and the Tractor Engine363. The Pruning of Citrus Trees in Cali-
fornia.364. Fungicidal Dusts for the Control ttt
Bunt.366. Turkish Tobacco Culture, Curing, and
Marketing.367. Methods of Harvesting and Irrigation
in Relation to Moldy Walnut*368. Bacterial Decomposition of Olives
During Pickling.369. Comparison of Woods for Butter Boxes.370. Factors Influencing the Development
of Internal Browning of the YellowNewtown Apnle.
371. The Relative Cost of Yarding Smalland Laree Timber.
373. Pear Pollination.374. A Survey of Orchard Practices in the
Citrus Industry of Southern Cali-fornia.
380. Growth of Eucalyptus in CaliforniaPlantations.
385. Pollination of the Sweet Cherry.386. Pruning Bearing Deciduous Fruit
Trees.388. The Principles and Practice of Sun-
Drying Fruit.389. Berseem or Egyptian Clover.390. Harvesting and Packing Grapes in
California.391. Machines for Coating Seed Wheat with
Copper Carbonate Dust.392. Fruit Juice Concentrates.393. Crop Sequences at Davis.394. I. Cereal Hay Production in California.
II. Feeding Trials with Cereal Hays.395. Bark Diseases of Citrus Trees in Cali-
fornia.396. The Mat Bean, Phaseolus Aconitifolius.397. Manufacture of Roquefort Type Cheese
from Goat's Milk.400. The Utilization of Surplus Plums.405. Citrus Culture in Central California.406. Stationary Spray Plants in California.407. Yield. Stand, and Volume Tables for
White Fir in the California PineRegion.
No.
408.409.
410.
412.
414.
415.416.
418.
419.
420.
421.423.
425.426.427.
428.
430.431.
432.
433.
434.
435.
436.
438.
439.
440.
444.
445.
446.447.
448.
449.
450.
451.
452.453.
Alternaria Rot of Lemons.The Digestibility of Certain Fruit By-products as Determined for Rumi-nants. Part I. Dried Orange Pulpand Raisin Pulp.
Factors Influencing the Quality of FreshAsparagus After it is Harvested.
A Study of the Relative Value of Cer-tain Root Crops and Salmon Oil asSources of Vitamin A for Poultry.
Planting and Thinning Distances forDeciduous Fruit Trees.
The Tractor on California Farms.Culture of the Oriental Persimmon in
California.A Study of Various Rations for Fin-
ishing Range Calves as Baby Beeves.Economic Aspects of the CantaloupeIndustry.
Rice and Rice By-Products as Feedsfor Fattening Swine.
Beef Cattle Feeding Trials, 1921-24.Apricots (Series on California Cropsand Prices).
Apple Growing in California.Apple Pollination Studies in California.The Value of Orange Pulp for MilkProduction.
The Relation of Maturity of CaliforniaPlums to Shipping and DessertQuality.
Range Grasses in California.Raisin By-Products and Bean Screen-ings as Feeds for Fattening Lambs.
Some Economic Problems Involved in
the Pooling of Fruit.Power Requirements of ElectricallyDriven Dairy Manufacturing Equip-ment.
Investigations on the Use of Fruits in
Ice Cream and Ices.The Problem of Securing Closer Rela-tionship between Agricultural Development and Irrigation Construction.
I. The Kadota Fig. II. The KadotaFig Products.
Grafting Affinities with Special Refer-ence to Plums.
The Digestibility of Certain Fruit By-Products as Determined for Rumi-nants. II. Dried Pineapple Pulp,Dried Lemon Pulp, and Dried OlivePulp.
The Feeding Value of Raisins andDairy By-Products for Growing andFattening Swine.
Series on California Crops and Prices:Beans.
Economic Aspects of the Apple In-
dustry.The Asparagus Industry in California.A Method of Determining the CleanWeights of Individual Fleeces of Wool.
Farmers' Purchase Agreement for DeepWell Pumps.
Economic Aspects of the WatermelonIndustry.
Irrigation Investigations with FieldCrops at Davis, and at Delhi. California, 1909-1925.
Studies Preliminary to the Establishment of a Series of Fertilizer Trialsin a Bearing Citrus Grove.
Economic Aspects of the Pear Industry.Series on California Crops and Prices:Almonds.
Rice Experiments in Sacramento Val-ley. 1922-1927.
BULLETINS
—
(Continued)
No.
455. Reclamation of the Fresno Type of
Black-Alkali Soil.
456. Yield, Stand and Volume Tables forRed Fir in California.
458. Factors Influencing Percentage CalfCrop in Range Herds.
459. Economic Aspects of the Fresh PlumIndustry.
460. Series on California Crops and Prices:Lemons.
461. Series on California Crops and Prices:Economic Aspects of the Beef CattleIndustry.
462. Prune Supply and Price Situation.464. Drainage in the Sacramento Valley
Rice Fields.
No.
465. Curly Top Symptoms of the Sugar Beet.466. The Continuous Can Washer for Dairy
Plants.467. Oat Varieties in California.468. Sterilization of Dairy Utensils with
Humidified Hot Air.469. The Solar Heater.470. Maturity Standards for Harvesting
Bartlett Pears for Eastern Shipment.471. The Use of Sulfur Dioxide in Shipping
Graoes.474. Factors Affecting the Cost of Tractor
Logging in the California PineRegion.
475. Walnut Supply and Price Situation.
CIRCULARS
No.
115. Grafting Vinifera Vineyards.117. The Selection and Cost of a Small
Pumping Plant.127. House Fumigation.129. The Control of Citrus Insects.
164. Small Fruit Culture in California.166. The County Farm Bureau.178. The Packing of Apples in California.
203. Peat as a Manure Substitute.212. Salvaging Rain-Damaged Prunes.230. Testing Milk. Cream, and Skim Milk
for Butterfat.232. Harvesting and Handling California
Cherries for Eastern Shipment.239. Harvesting and Handling Apricots and
Plums for Eastern Shipment.240. Harvesting and Handling California
Pears for Eastern Shipment.241. Harvesting and Handling California
Peaches for Eastern Shipment.243. Marmalade Juice and Jelly Juice from
Citrus Fruits.244. Central Wire Bracing for Fruit Trees.245. Vine Pruning Systems.248. Some Common Errors in Vine Pruning
and Their Remedies.249. Replacing Missing Vines.250. Measurement of Irrigation Water on
the Farm.253. Vineyard Plans.255. Leguminous Plants as Organic Ferti-
lizers in California Agriculture.257. The Small-Seeded Horse Bean (Vicia
faba var. minor).258. Thinning Deciduous Fruits.259. Pear By-Products.261. Sewing Grain Sacks.262. Cabbage Production in California.263. Tomato Production in California.265. Plant Disease and Pest Control.266. Analyzing the Citrus Orchard by Means
of Simple Tree Records.
No.
269.270.276.277.
278.
279
282.
284.287.288.289.290.292.294.295.296.
298.
300.301.302.304.305.307.308.309.310.
311.312.
313314,315.
An Orchard Brush Burner.A Farm Septic Tank.Home Canning.Head, Cane, and Cordon Pruning of
Vines.Olive Pickling in MediterraneanCountries.
The Preparation and Refining of OliveOil in Southern Europe.
Prevention of Insect Attack on StoredGrain.
The Almond in California.Potato Production in California.Phylloxera Resistant Vineyards.Oak Fungus in Orchard Trees.The Tangier Pea.Alkali Soils.
Propagation of Deciduous Fruits.Growing Head Lettuce in California.Control of the California Ground
Squirrel.Possibilities and Limitations of Coop-erative Marketing.
Coccidiosis of Chickens.Buckeye Poisoning of the Honey Bee.The Sugar Beet in California.Drainage on the Farm.Liming the Soil.
American Foulbrood and Its Control.Cantaloupe Production in California.Fruit Tree and Orchard Judging.The Operation of the BacteriologicalLaboratory for Dairy Plants.
The Improvement of Quality in Figs.Principles Governing the Choice, Oper-ation and Care of Small IrrigationPumping Plants.
Fruit Juices and Fruit Juice Beverages.Termites and Termite Damage.The Mediterranean and Other Fruit
Flies.
14m-ll,'29