utilizing digital marketing tactics to increase license sales
TRANSCRIPT
Utilizing Digital Marketing Tactics to Increase License Sales
RBFF Virtual Workshop February 25, 2021
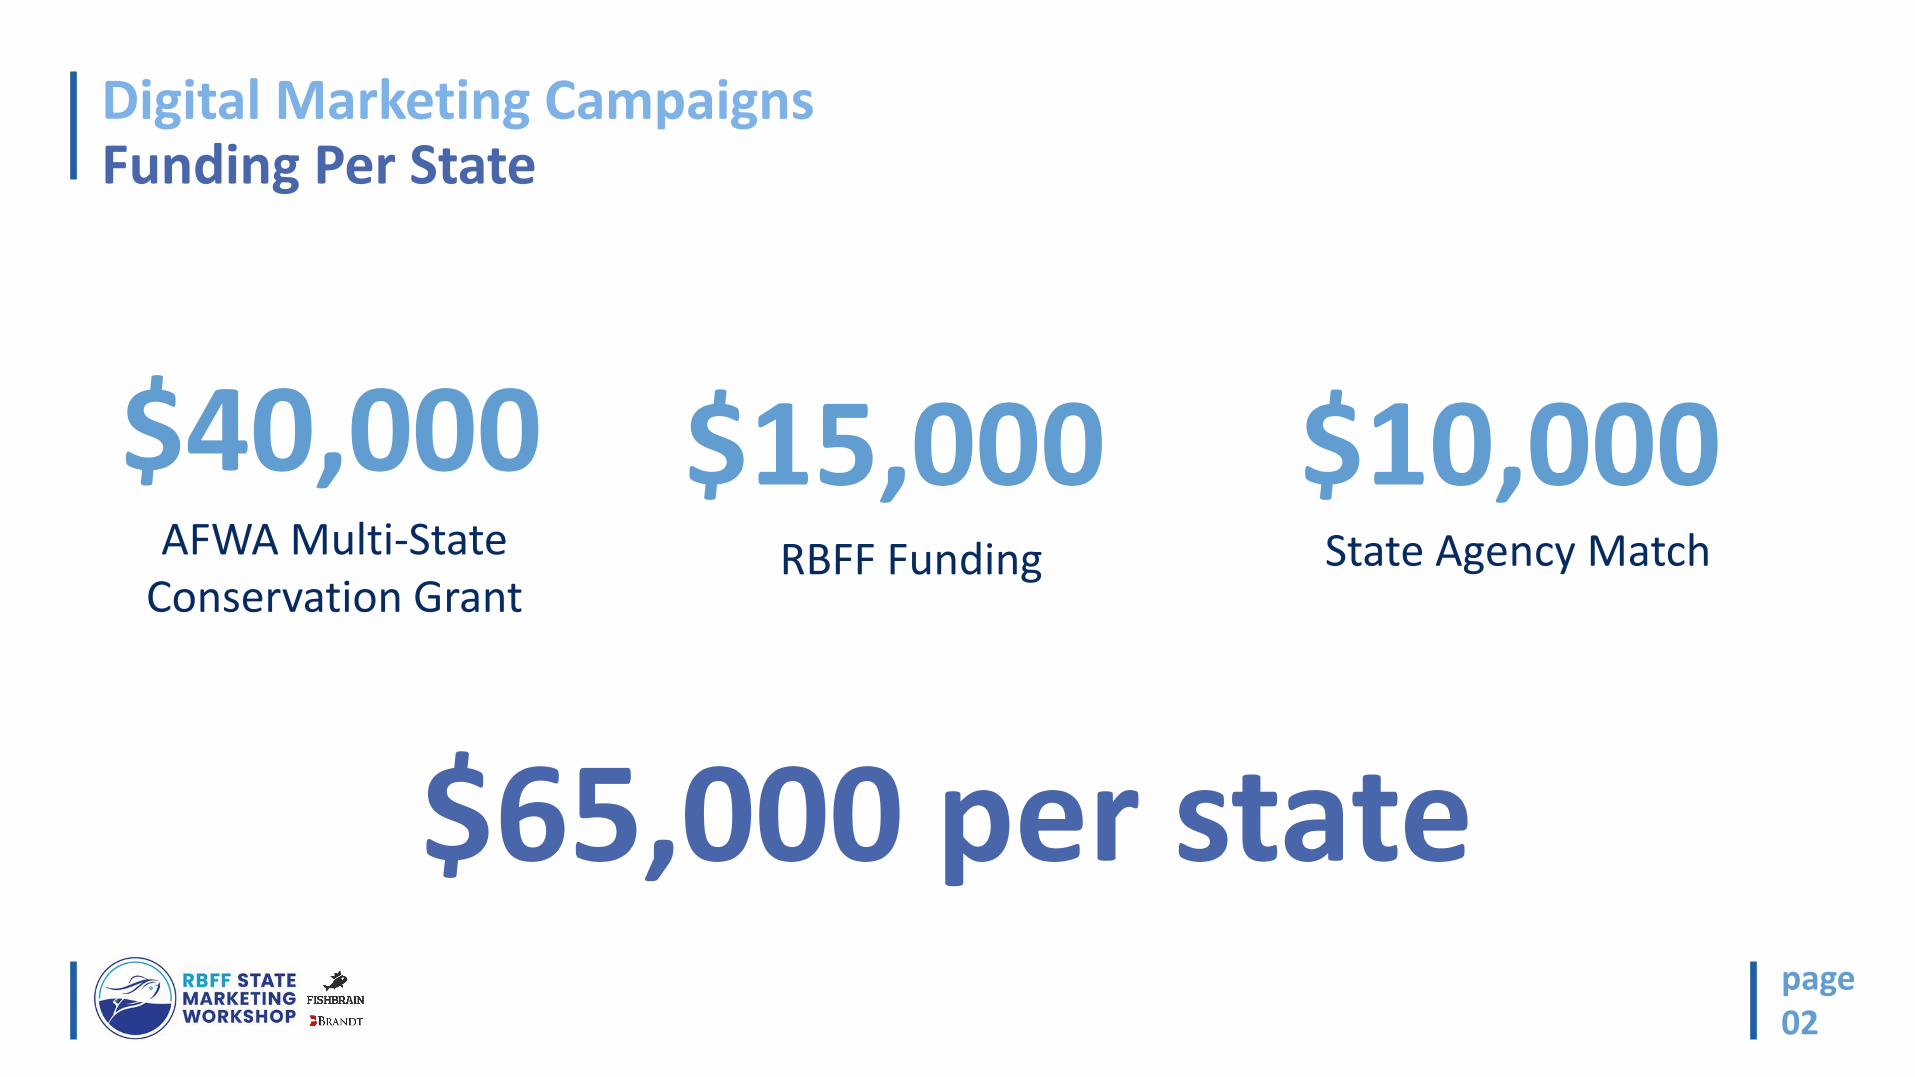
Digital Marketing CampaignsFunding Per State
page02
$40,000AFWA Multi-State
Conservation GrantRBFF Funding State Agency Match
$15,000 $10,000
$65,000 per state

Digital Marketing Campaigns Highlights
page03
Resident fishing licenses up 13%
Spent $19,318.60 on Search Engine Marketing which resulted in revenue of $98,071.19
Campaign delayed until Spring 2021 due to COVID concerns
During the campaign, web
traffic saw:
• 982% increase in users
• 979% increase in new users

Digital Marketing Campaigns Highlights
page04
Stay tuned! Google and social media ads resulted in $1,222,533 in direct license sales.
Earned $146,226 in lift revenue!
Earned $260,525.28 in
revenue from geofencing
Facebook ads.

Digital Marketing Campaigns Sharing Resources
page05
Creative AssetsToolkit of Info Case Studies
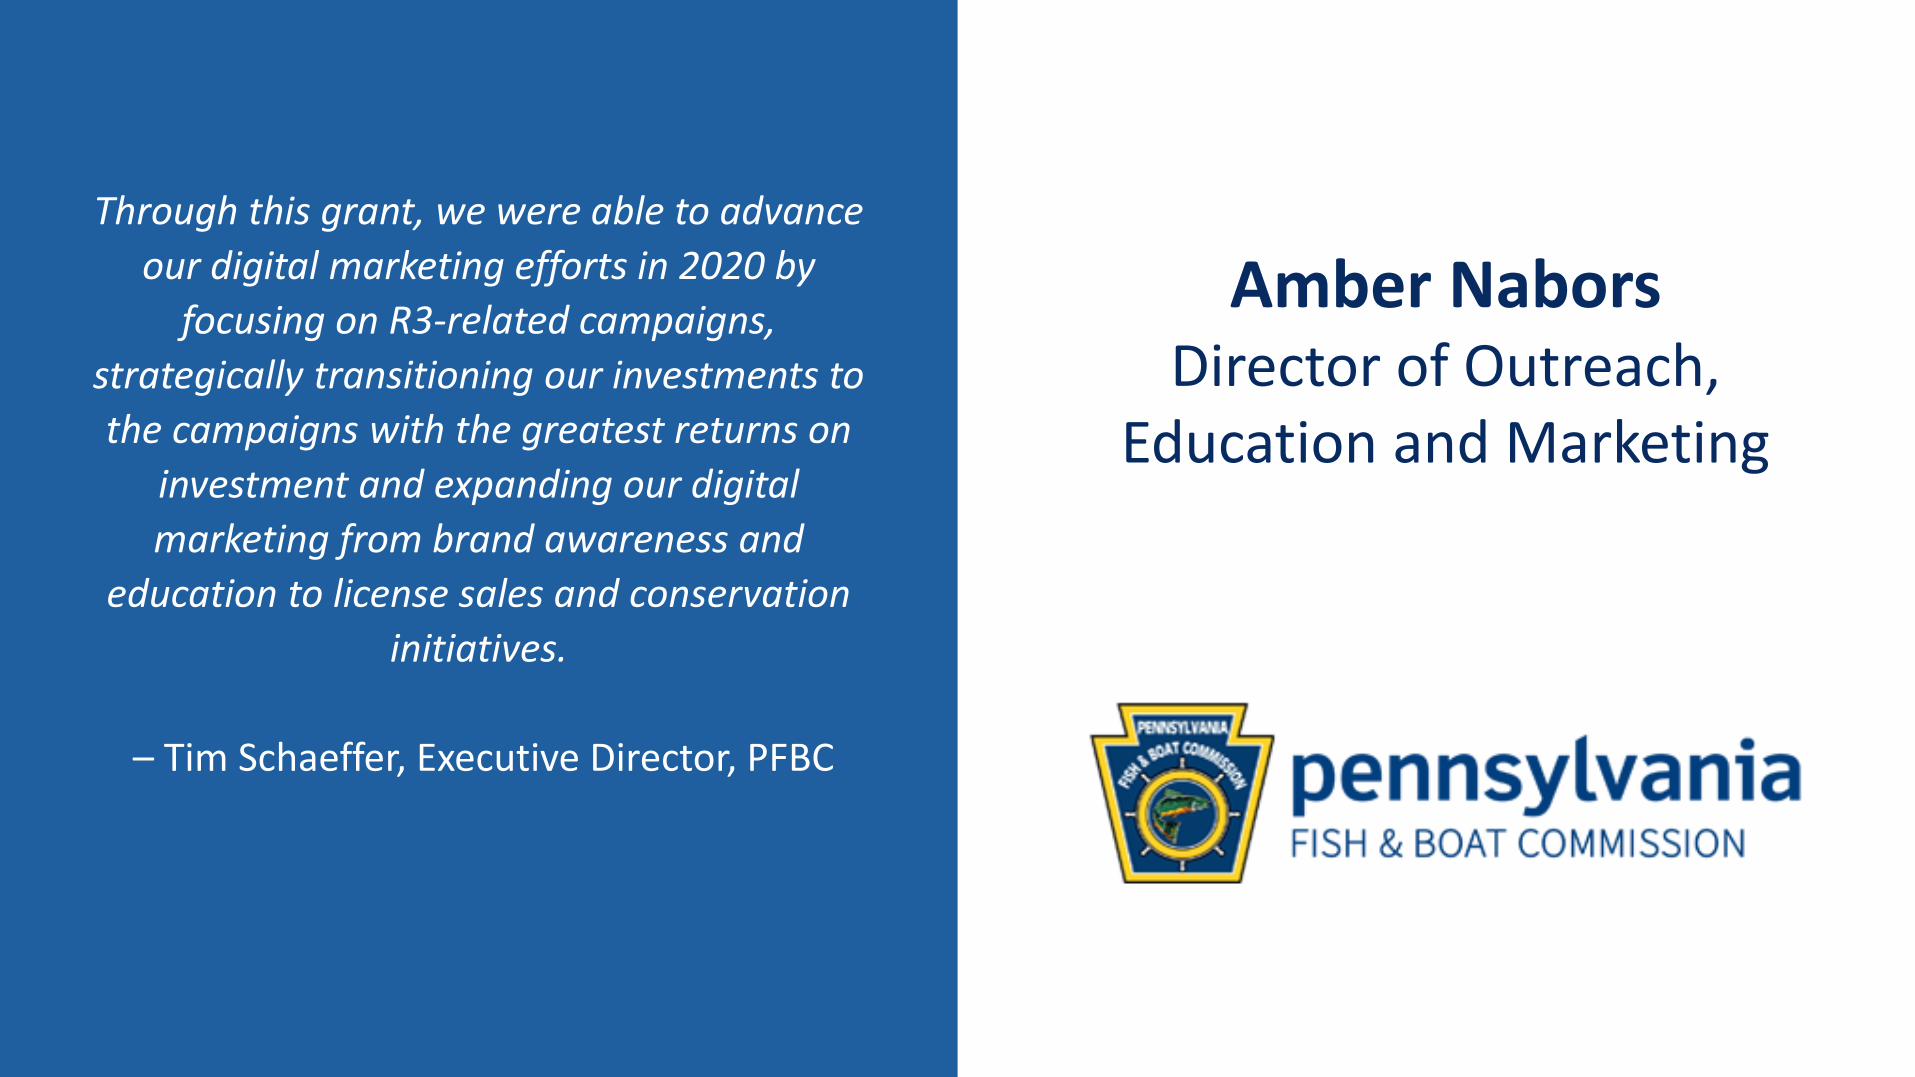
Amber NaborsDirector of Outreach,
Education and Marketing
Through this grant, we were able to advance
our digital marketing efforts in 2020 by
focusing on R3-related campaigns,
strategically transitioning our investments to
the campaigns with the greatest returns on
investment and expanding our digital
marketing from brand awareness and
education to license sales and conservation
initiatives.
– Tim Schaeffer, Executive Director, PFBC

RBFF State Marketing Workshop
Utilizing Digital Marketing Tactics to Increase License SalesA m b e r N a b o r s
PA F i s h a n d B o a t C o m m i s s i o n
D i r e c t o r ; B u r e a u o f O u t r e a c h , E d u c a t i o n , a n d M a r k e t i n g

2020 Marketing Goals
• More robust campaigns
• Use analytics to optimize our results
• Develop and implement customer tracking through the Outdoor Shop (former licensing website)• Our new licensing website, HuntFish.pa.gov, launched in January
• Positive influence on Outdoor Shop sales, especially during slower summer months

2020 Digital Marketing
First Quarter Second Quarter Third Quarter Fourth Quarter
January February March April May June July August September October November December
Fishing License Renewal Paddle Sports Holiday
Trout Season Family Fun
PFBCFunded
Grant Funded
gavinadvertising.com

Digital Marketing
• Search ads
• Display ads
• Social media ads• Facebook and Instagram
• Targeted:• Geographically
• Demographically
• Measurable results
Elements:
• Visual (except search ad)
• Brief call to action
• Link to Outdoor Shop
• Embedded tracking codes
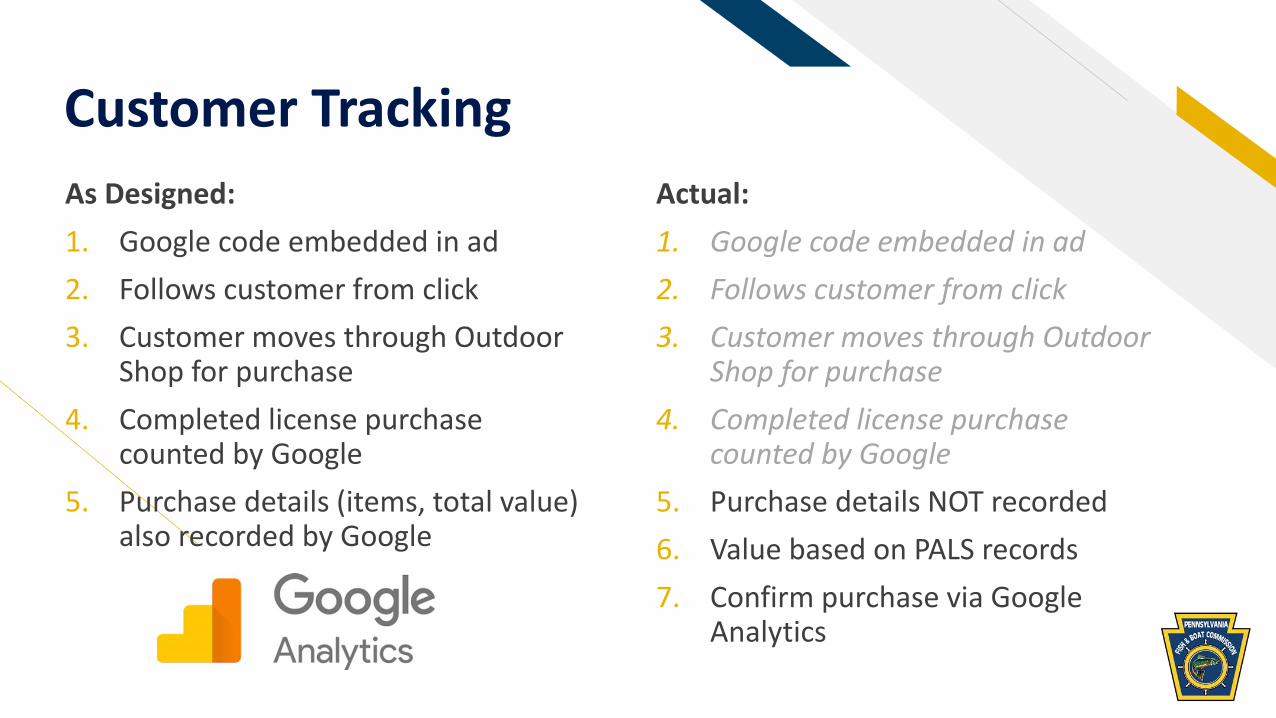
Customer Tracking
As Designed:
1. Google code embedded in ad
2. Follows customer from click
3. Customer moves through Outdoor Shop for purchase
4. Completed license purchase counted by Google
5. Purchase details (items, total value) also recorded by Google
Actual:
1. Google code embedded in ad
2. Follows customer from click
3. Customer moves through Outdoor Shop for purchase
4. Completed license purchase counted by Google
5. Purchase details NOT recorded
6. Value based on PALS records
7. Confirm purchase via Google Analytics

Google Search Ads
• Used from March -August, 2020
• 12,000 words, word combinations

Trout Season Campaign Imagery

Trout Season Campaign Results
Campaign Tactic Segments Targeted
Media Spend
Begin End Impressions Clicks CTR
Trout Season SEM
Leisure-time Enjoyers, Avid Adventurists,
Lukewarm Occasionalists
$8,166.15 1-Mar 31-May 152,049 46,451 30.55%
Trout SeasonSocial Media
Audiences interested in
trout fishing, fly fishing, angler-
related activities
$7,322.70 6-Apr 31-May 2,759,247 17,543 0.64%
Trout Season Display Ads
Audiences in market for
fishing gear, fishing tips, and
related
$1,533.60 16-Apr 31-May 1,853,352 7,789 0.42%

Trout Season Campaign Conversion to Purchase
Campaign Tactic TransactionsConversion
RateCost/
Conversion
Mean* Transaction
Value
Estimated Revenue
Net Revenue ROI
Trout Season
SEM 37,506 81% $0.22 $34.25 $1,284,581 $1,276,414.35 $156.31
Trout Season
Social Media
7,259 41% $1.01 $34.25 $248,621 $241,298.05 $32.95
Trout Season
Display Ads
662 8% $2.32 $34.25 $22,674 $21,139.90 $13.78

Family Fun Campaign
• Search Ads
• Social Media• Instagram

Family Fun Campaign Results
Campaign Tactic Segments TargetedMedia Spend
Begin End Impressions Clicks CTR
Family Fun SEM
Active Social Families,
Family-Focused,Relaxers
$7,712.50 1-Jul 30-Aug 367,570 23,905 6.50%
Family FunSocial Media
Active Social Families,
Family-Focused,Relaxers
$2,765.05 1-Jul 30-Aug 639,932 1,126 0.18%

Family Fun Campaign Conversion to Purchase
Campaign Tactic TransactionsConversion
RateCost/Conversion
Mean* Transaction
Value
Estimated Revenue
Net Revenue ROI
Family Fun SEM 10,492 44% $0.74 $32.00 $335,744 $328,031.50 $42.53
Family FunSocial Media
1,480 131% $1.87 $32.00 $47,360 $44,594.95 $16.13

Digital Contribution to Outdoor Shop License Sales, 2020
3.4%
8.5%
23.6%
9.2%
42.6%
46.7%
7.1%
0.0%
5.0%
10.0%
15.0%
20.0%
25.0%
30.0%
35.0%
40.0%
45.0%
50.0%
March April May June July August September
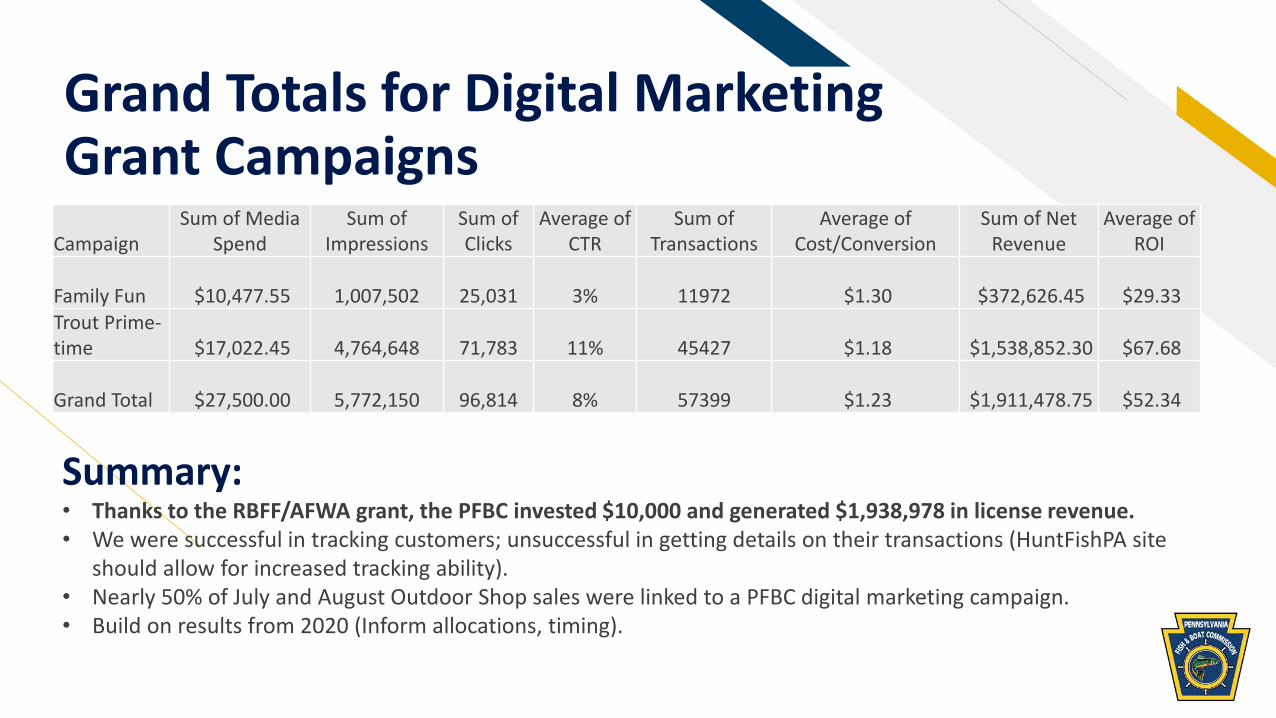
Grand Totals for Digital Marketing Grant Campaigns
CampaignSum of Media
SpendSum of
ImpressionsSum of Clicks
Average of CTR
Sum of Transactions
Average of Cost/Conversion
Sum of Net Revenue
Average of ROI
Family Fun $10,477.55 1,007,502 25,031 3% 11972 $1.30 $372,626.45 $29.33 Trout Prime-time $17,022.45 4,764,648 71,783 11% 45427 $1.18 $1,538,852.30 $67.68
Grand Total $27,500.00 5,772,150 96,814 8% 57399 $1.23 $1,911,478.75 $52.34
Summary: • Thanks to the RBFF/AFWA grant, the PFBC invested $10,000 and generated $1,938,978 in license revenue. • We were successful in tracking customers; unsuccessful in getting details on their transactions (HuntFishPA site
should allow for increased tracking ability).• Nearly 50% of July and August Outdoor Shop sales were linked to a PFBC digital marketing campaign.• Build on results from 2020 (Inform allocations, timing).

Holiday Campaign Imagery

Holiday Campaign Results
Campaign Tactic Segments TargetedMedia Spend
Begin End Impressions Clicks CTR
HolidaySocial Media
Avid Anglers, Active Families, Relaxers (Reactivation, Renewal campaign)
$ 6,724.46 1-Dec 31-Dec 1,395,511 5,944 0.4%
TransactionsConversion
RateCost/Conversion
Mean* Transaction
Value
Estimated Revenue
Net Revenue ROI
1,890 32% $3.56 $32.00 $60,480 $53,755.54 $7.99
