uttipec submission stage i & iiand air pollution. traffic congestion on delhi roads costs around...
TRANSCRIPT

VKS Infratech Management Pvt. Ltd. Consulting Engineers Planners & Managers (AN ISO 9001-2008 COMPANY) 181, Pratap Nagar, Lane-18, Mayur Vihar-I, opposite Pkt-IV Delhi – 110091 (Ph: 011-22793217/18/19 Fax: 011-22793220
TRANSIT CORRIDOR DEVELOPMENT AND STREET NETWORK/ CONNECTIVITY PLAN FOR ITPO , MATHURA ROAD AND RING ROAD
UTTIPEC SUBMISSION STAGE I & II
PUBLIC WORKS DEPARTMENT, DELHI

Integrated transit corridor development and street network/connectivity plan for the corridor/influence zone along with detailed design of all intersections & Mid sections based on traffic and feasibility studies for corridor/network.
PWD
VKS INFRATECH MANAGEMENT PVT. LTD1
Table of Contents
1. The submittals ......................................................................................................................... 2
2. The Project: .............................................................................................................................. 2
3. Characteristics of Influence Area: ............................................................................................ 2
4. Proposed development schemes in the influence area; .......................................................... 2
5. Agencies That Need to cooperate, Provide Information or work together; ............................ 3
6. This report submittals is into two volumes: ............................................................................. 3
7. Project Statement: ................................................................................................................... 4
8. (a) PROBLEMS/ ISSUES............................................................................................................. 4
At Macro Level ................................................................................................................................ 4
At Micro Level ................................................................................................................................. 6
9. (b) GOALS, NEED AND VISION .................................................................................................. 8
10. EVALUATION CRITERIA ......................................................................................................... 8
a. Functional Requirement .......................................................................................................... 8
b. Ease of Implementation and Phasing ...................................................................................... 9
c. Economic Evaluation .............................................................................................................. 10
d. Environmental: ...................................................................................................................... 10
e. Aesthetics ............................................................................................................................... 10
11. CONCEPTUAL DESIGN OPTIONS ......................................................................................... 10
12. Evaluations of Design Options ........................................................................................... 16
13. The context of each of the parameters is analyzed below for alternatives. ...................... 17
14. Traffic Simulation data and Snapshots of flow conditions ................................................ 19
Conclusion and recommendation ............................................................................................. 50
Annexure - Traffic Data

Integrated transit corridor development and street network/connectivity plan for the corridor/influence zone along with detailed design of all intersections & Mid sections based on traffic and feasibility studies for corridor/network.
PWD
VKS INFRATECH MANAGEMENT PVT. LTD2
1. The submittals
The purpose of these submittals is to get approval from UTTIPEC and the report along with drawings/maps clearly identifies the complete project scope and to ensure that it meets the desired goals and objectives.
2. The Project:
The Public Works Department, Government of N.C.T. Delhi, has appointed VKS Infratech Management Pvt. Ltd. to provide Consultancy Services for preparing an Integrated Transit Corridor Development and Street Network/Connectivity Plan for network as defined below:
• From ‘W’ point on Mathura Road Bhairon Marg Intersection. • Bhairon Marg. • From Bhairon Marg Ring Road intersection to ITO Flyover. • New Link from Ring Road to Pustha Road through a bridge across Yamuna. • Connectivity of Mathura Road to Ring Road through underground tunnel below ITPO area.
The influence area is taken further beyond Study Area which comprises of
• Mathura Raod from W Point to DPS Mathura Road intersection • Bhairon Marg between Ring Road and Mathura Road • Bhagwan Das Road, Purana Quila Road, Shershah Raod, SubramanyamBharti Marg and Ring
Raod • C-Hexagon of India Gate in central Vista
3. Characteristics of Influence Area:
• Present Movements to ITPO (Gates and entries); • Roads configuration (Cross sections, length, traffic etc. on corridor and intersections); • Right-of-way, carriage way, number of access points/intersections, surface type, abutting
land use, etc., saturation level, Bypassable traffic etc; • Identification of constraints, including local context; • Presence of Purana Quila, and Shershah Gate, both protected monument by ASI; • Railway Track behind ITPO (track characteristics); • On street parkings in scattered manner;. • Utility and Open Drain (characteristics):and • Proposed Supreme Court Redevelopment area and underpass connection the proposed
complex with existing Supreme Court
4. Proposed development schemes in the influence area;
The concept Plan prepared for this scheme takes into account the development schemes in the influence area as given below;
1. Recommendation of Zonal and Sub Zonal Development Plans as per MPD 2021. 2. Recommendations of High Power committee constituted under chairmanship of Honorable
Urban Development Minister to prepare a Detailed Action Plan on How to Decongest Delhi with participation of Key stakeholders and suggested Tunnel between Ring Road and Bhagwan Das road/ Purana Quila road- with approx. cost of Rs.450 crores (4 Lanes tunnel) as short term measure to be completed by 2017.
Integrated transit corridor development and street network/connectivity plan for the corridor/influence zone along with detailed design of all intersections & Mid sections based on traffic and feasibility studies for corridor/network.
PWD
VKS INFRATECH MANAGEMENT PVT. LTD3
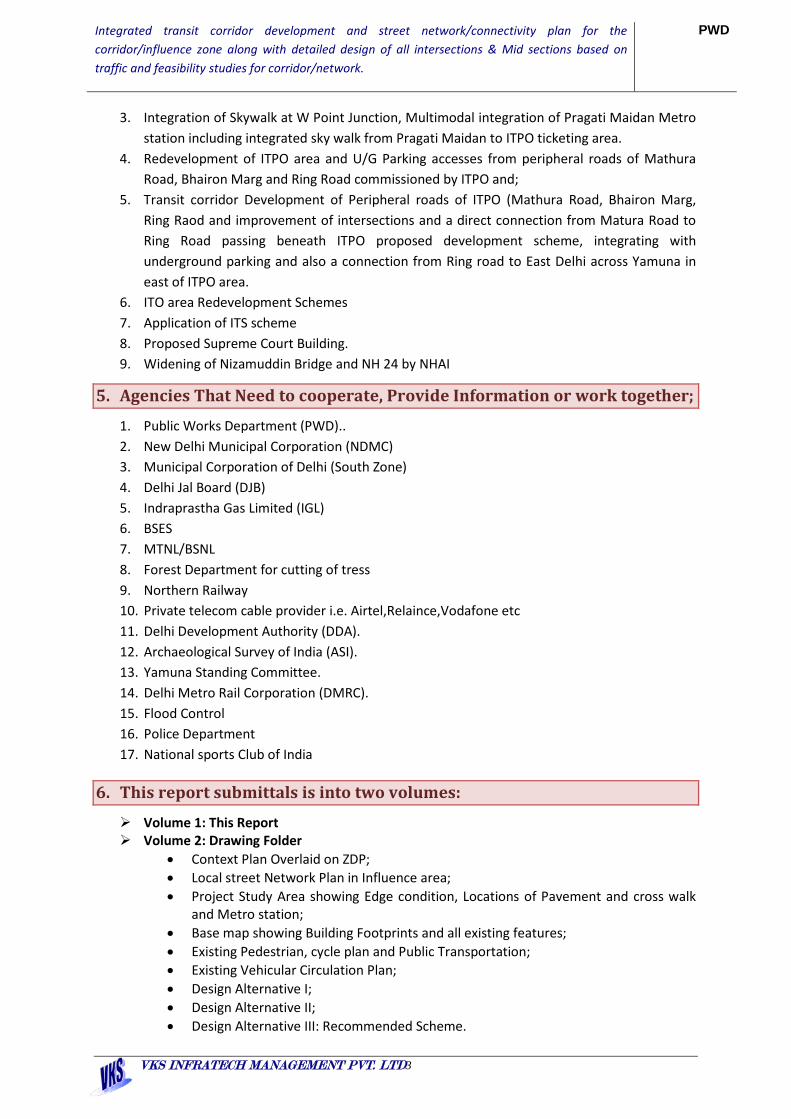
3. Integration of Skywalk at W Point Junction, Multimodal integration of Pragati Maidan Metro station including integrated sky walk from Pragati Maidan to ITPO ticketing area.
4. Redevelopment of ITPO area and U/G Parking accesses from peripheral roads of Mathura Road, Bhairon Marg and Ring Road commissioned by ITPO and;
5. Transit corridor Development of Peripheral roads of ITPO (Mathura Road, Bhairon Marg, Ring Raod and improvement of intersections and a direct connection from Matura Road to Ring Road passing beneath ITPO proposed development scheme, integrating with underground parking and also a connection from Ring road to East Delhi across Yamuna in east of ITPO area.
6. ITO area Redevelopment Schemes 7. Application of ITS scheme 8. Proposed Supreme Court Building. 9. Widening of Nizamuddin Bridge and NH 24 by NHAI
5. Agencies That Need to cooperate, Provide Information or work together;
1. Public Works Department (PWD).. 2. New Delhi Municipal Corporation (NDMC) 3. Municipal Corporation of Delhi (South Zone) 4. Delhi Jal Board (DJB) 5. Indraprastha Gas Limited (IGL) 6. BSES 7. MTNL/BSNL 8. Forest Department for cutting of tress 9. Northern Railway 10. Private telecom cable provider i.e. Airtel,Relaince,Vodafone etc 11. Delhi Development Authority (DDA). 12. Archaeological Survey of India (ASI). 13. Yamuna Standing Committee. 14. Delhi Metro Rail Corporation (DMRC). 15. Flood Control 16. Police Department 17. National sports Club of India
6. This report submittals is into two volumes:
Volume 1: This Report Volume 2: Drawing Folder
• Context Plan Overlaid on ZDP; • Local street Network Plan in Influence area; • Project Study Area showing Edge condition, Locations of Pavement and cross walk
and Metro station; • Base map showing Building Footprints and all existing features; • Existing Pedestrian, cycle plan and Public Transportation; • Existing Vehicular Circulation Plan; • Design Alternative I; • Design Alternative II; • Design Alternative III: Recommended Scheme.

Integrated transit corridor development and street network/connectivity plan for the corridor/influence zone along with detailed design of all intersections & Mid sections based on traffic and feasibility studies for corridor/network.
PWD
VKS INFRATECH MANAGEMENT PVT. LTD4
7. Project Statement:
With urbanization, society faces a rapid accelerating demand for mobility, placing immense pressure on existing urban road networks. This demand manifests in the form of severe traffic congestion, which decreases the road's level of service, while at the same time increases both fuel consumption and air pollution.
Traffic congestion on Delhi roads costs around $10 billion or about Rs 65,000 crore annually. This is on account of fuel waste due to idling of vehicles, productivity loss, air pollution and road crashes, according to a study done by IIT, Madras. As the vehicular population rapidly grows in the capital, the study projects the congestion cost would increase to the tune of around Rs 98,000 crore by 2030 unless steps are taken to tackle the daily mayhem. It has recommended dedicated lane for buses since "the productivity loss due to congestion delays of commuters who use buses accounts for about 75% of total
To mitigate congestion in urban roads, urban planning, traffic predictions and the study of complex networks have been widely investigated the potential influencing factors. However, without comprehensive knowledge of how roads are used dynamically, these studies are conventionally based on expensive and quickly outdated travel surveys or segmented information on traffic flow and travel time , which fail to support the planners and Engineers with the information needed to cope with modern mobility demand.
With the introduction of Metro in Delhi there had been phenomenal change in modal shift but in spite of all measures there are areas which remain gets congested on account of several issues mainly high personalized mode and ever increasing vehicle using congested road networks. Confronted with these problems, transportation engineers and planners have had two possible choices to manage and control the increasingly growing traffic in the urban networks.
1. Consideration for increasing the network capacity by means of constructing urban relief road/missing link or
2. In contrast to the first alternative, this solution is less costly and easily supported by local authorities in urban areas, and therefore transportation engineers tend to use this approach in addressing transportation problems. In fact, traffic engineering and control, nowadays, is the primary solution for growing traffic problem and plays a vital role in managing the increasing traffic demand on current roads.
8. (a) PROBLEMS/ ISSUES
At Macro Level
Rapid increase in development to the East of the Yamuna River. Its population growth rate over the decade 2001-2011 was 26.78%.
70%-65% traffic depending on time of day are through traffic passing through the roads in periphery of ITPO.

Integrated transit corridor development and street network/connectivity plan for the corridor/influence zone along with detailed design of all intersections & Mid sections based on traffic and feasibility studies for corridor/network.
PWD
VKS INFRATECH MANAGEMENT PVT. LTD5
Fig 1: Activity Area
Frequent bottle neck on ring road Mathura road and Bhairon Marg.
The interactions and developments of adjoining Counter magnets (Ghaziabad, NOIDA and NCR Region) will demand more trips via Ring Road, Bhairon Marg, Mathura Road and C-Hexagon
Delhi - Meerut expressway 8 lane road constructions is in progress, it is estimated that the traffic will witness an increase on the NH 24, Ring Road, Mathura Road and on the surrounding road networks of India gate and ITPO area due to fast development of residential townships in GZB NOIDA and Greater NOIDA and in East Delhi.
The maximum trips in one day ever observed is 23 lakhs where 8.88 lakhs trips across river Yamuna followed by 8.1 lakhs trips on Gurgaon Metro link.
Integrated transit corridor development and street network/connectivity plan for the corridor/influence zone along with detailed design of all intersections & Mid sections based on traffic and feasibility studies for corridor/network.
PWD
VKS INFRATECH MANAGEMENT PVT. LTD6
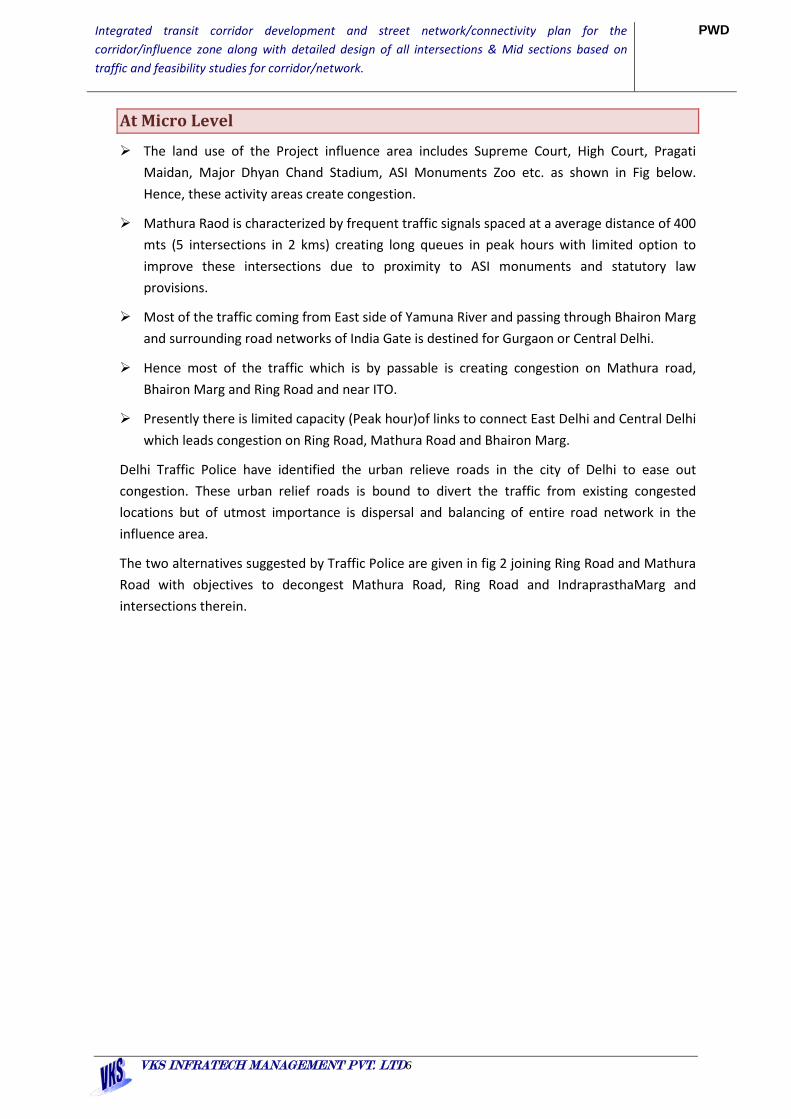
At Micro Level
The land use of the Project influence area includes Supreme Court, High Court, Pragati Maidan, Major Dhyan Chand Stadium, ASI Monuments Zoo etc. as shown in Fig below. Hence, these activity areas create congestion.
Mathura Raod is characterized by frequent traffic signals spaced at a average distance of 400 mts (5 intersections in 2 kms) creating long queues in peak hours with limited option to improve these intersections due to proximity to ASI monuments and statutory law provisions.
Most of the traffic coming from East side of Yamuna River and passing through Bhairon Marg and surrounding road networks of India Gate is destined for Gurgaon or Central Delhi.
Hence most of the traffic which is by passable is creating congestion on Mathura road, Bhairon Marg and Ring Road and near ITO.
Presently there is limited capacity (Peak hour)of links to connect East Delhi and Central Delhi which leads congestion on Ring Road, Mathura Road and Bhairon Marg.
Delhi Traffic Police have identified the urban relieve roads in the city of Delhi to ease out congestion. These urban relief roads is bound to divert the traffic from existing congested locations but of utmost importance is dispersal and balancing of entire road network in the influence area.
The two alternatives suggested by Traffic Police are given in fig 2 joining Ring Road and Mathura Road with objectives to decongest Mathura Road, Ring Road and IndraprasthaMarg and intersections therein.

Integrated transit corridor development and street network/connectivity plan for the corridor/influence zone along with detailed design of all intersections & Mid sections based on traffic and feasibility studies for corridor/network.
PWD
VKS INFRATECH MANAGEMENT PVT. LTD7
Fig 2: Possible recommended possible link Joining Rig road and BD Road or PuranaQuila Road.
Reduction of Traffic :-The relieve tunnel road connecting Mathura Road and Ring Road tunnel below ITPO area will provide dedicated route for through traffic not destined in the project area.

Integrated transit corridor development and street network/connectivity plan for the corridor/influence zone along with detailed design of all intersections & Mid sections based on traffic and feasibility studies for corridor/network.
PWD
VKS INFRATECH MANAGEMENT PVT. LTD8
9. (b) GOALS, NEED AND VISION
Decongestion of the road networks is the main goal for the study area considering all road users.
Carrying out Traffic surveys within study area for decongestion of the road network. The Mid-Block Traffic survey suggests that the mid blocks are operating at its full capacity with frequent bottlenecks at intersections and over the time signal time have increased to unmanageable level.
The approach to decongest the study area thus needs interventions for both the link traffic and node traffic congestion with all road users’ capacity compatible corridor.
Providing direct access through underground tunnel for internationally acclaimed ITPO with world class convention Centre, ITPO Hotel area and to the Under Ground Parking.
10. EVALUATION CRITERIA
a. Functional Requirement
The three road in the study area namely Mathura road, BharionMarg and Ring Road.
Mathura Road is a six lane divided carriageway with five signalized intersections
between Shershah Road and W- Junction, the footpath having variable width of 2-3 m is
provided all along the road and single lane service road is existing between Bhagwan Das
&Purana QuilaRoad. Three numbers of FOB for pedestrian crossinghave been provided
on Mathura road.
Bhairon Marg is also six lane divided carriageway. A split carriageway has been provided
to create parking in one stretch of the road. The footpath isexistingon either side of the
road and there is one pedestrian subway and one Rail under pass exists on the Bhairon
Marg.
Ring Road is eight lane divided carriageway with footpath on either side all along the
road. There are two Railunderpasson the ring road at each side of Intersection of
Bhairon Margand Ring Road.
To meet the functional necessity of all the three roads proposal of underground tunnel is
suitable while the provision of elevated road will create implementation issues due to the
activity area, ASI Heritage monuments and social and aesthetic consideration.
The issue in traffic intervention for the project area is both Link capacity and signalized police
controlled peak hour capacity on study area network. The capacity and volume analysis have
been carried out for both Links and Intersections to evaluate the possibility of improvements.
Table 1: Link Volume Capacity Analysis Base Condition
Link No. Link Name V/C LOS

Integrated transit corridor development and street network/connectivity plan for the corridor/influence zone along with detailed design of all intersections & Mid sections based on traffic and feasibility studies for corridor/network.
PWD
VKS INFRATECH MANAGEMENT PVT. LTD9
Link No. Link Name V/C LOS 1 On Mathura Road
(W point to BD Marg) 1.0 F
2 On Mathura Road (BD Marg to Purana Quila Road)
0.75 D
3 On Mathura Road (Purana Quila Road to Bhairon Marg)
1.15 F
4 On Mathura Road (Bhairon Marg to Shershah Road)
1.25 F
5 On Mathura Road (Shershah Road to Zoo)
1.05 F
6 On Bhairon Marg 1.10 F
• Capacity (PCUs/hr) as per IRC-86
Table 2: Link Volume Capacity Analysis
S. N. Link Name Total Traffic (PCUs)
Morning Peak (PCUs)
Evening Peak (PCUs)
1 Mathura Road - Shershah Road 138640 11095 13142
2 Mathura Road - Bhairon Marg 155158 12202 15140
3 Mathura Road - Purana Quila Road 93560 8534 10390
4 Mathura Rd - Bhagwan Das Road 94991 8983 10827
6 Mathura Road –Subramanyam Bharti Marg 60679 4340 6146
5 Bhairon Marg - Ring Road 189081 13594 19139
b. Ease of Implementation and Phasing
Easiest solution is to improve the intersection however; this alone will not be able to decongest Mathura Road, Bharion Marg& Ring Road due to mismatch of traffic arrivals and limitations of cycle time.
The elevated road in the vicinity of ASI monument, Proposed Convention Centre, Supreme Court, Major Dhyan Chand Stadium, Old fort and Zoo will create a lot of

Integrated transit corridor development and street network/connectivity plan for the corridor/influence zone along with detailed design of all intersections & Mid sections based on traffic and feasibility studies for corridor/network.
PWD
VKS INFRATECH MANAGEMENT PVT. LTD10
implementation issues mainly due to the aesthetics, environmental and visibilities issues.
The underground tunnel will be easy to implement due to the activity area and social area aesthetics will remain same. And the proposed tunnel will beconstructed by cut and cover method which will add more aesthetic looks.
The Underground Tunnel implementation will face minor difficulties due to on and off ramps on existing roads.
The tunneling has been planned by cut and cover method hence construction can be easily implemented with good speed.
c. Economic Evaluation
Amongst various option explored we have come to conclusion that the proposed option for the traffic corridors as recommended in this report has maximum socioeconomic benefit as its benefit outstrips the cost be a huge margin with break even period of approx 5 years.. The reason being that the alignment proposed is the best feasible option taking into account the constructability point of view on that area as well as the lesser lengthwill results in cost saving.
d. Environmental:
Noise will be reduced extensively by providing underground tunnel road. Air pollution will be less and the contamination of particulate matter in air shall also be
less. It will not have much effect on the land greenery so that the environment will be less
effected by underground tunnel. To avoid water logging in depression proper drainage line and pump shall be provided. Proper ventilation will be provided for the tunnel.
e. Aesthetics
The alignment option for traffic corridor has been planned to present an aesthetically pleasant view.
Amongst the existing road pavement portion the entry and exit point ramps to the tunnel / sub way have been so located that it will offer a distinct and smooth flow of vehicular traffic through these structures. At the same time, in plan they occupy a very small area in entry and exit zone amongst the existing road cross section.
The Rotary ramps connecting with Ring Road have been planned in such a manner to make available area of landscaping to give aesthetically pleasant appearance.
11. CONCEPTUAL DESIGN OPTIONS
Integrated Transit Corridors are well defined by themselves except two new corridors i.e. one transit corridor connecting Mathura road to Ring road and another corridor connecting Ring Road to East Delhi via Yamuna Pustha Road. The present study does not include corridor connecting Ring road to East Delhi.

Integrated transit corridor development and street network/connectivity plan for the corridor/influence zone along with detailed design of all intersections & Mid sections based on traffic and feasibility studies for corridor/network.
PWD
VKS INFRATECH MANAGEMENT PVT. LTD11
Much attention has been paid and due deliberations have taken place at several levels and finally 3 (three) Design Options were evolved for new transit corridor connecting Mathura road and Ring road through an underground tunnel in ITPO area which will connect Mathura road with Ring road.
The salient features of each Design Option of this transit corridor are described as below:
Alternative 1:
Main tunnel has been proposed connecting Mathura Road and Ring Road at Northern Boundary of ITPO complex with entry/exit for ITPO parking. Three Ramps are provided along Mathura road for access to main 6 lane tunnel I.e. entry from W point side of Mathura Road and entry/exit from and to towards Bhairon marg. Grade separated junction improvements have been proposed on both the extremities of the tunnel (i.e. Mathura Road and Ring road) • Left turning Down Ramp from Mathura road to ITPO tunnel for traffic coming from W- Point. • Right turning Down Ramp from Mathura road to ITPO tunnel for traffic coming from Moolchand Side. • Left turning up Ramp from ITPO tunnel to Mathura Road. • Up Slip Ramp from ITPO tunnel to Ring Road towards ITO • Dn Slip Ramp from ring road to ITPO Tunnel • Trumpet from ITPO tunnel to Ring Road towards Sarai Kale khan. • Trumpet for Traffic coming from Rajghat side of Ring raod. • Entry exit from Main tunnel to U/G Parking of ITPO A tunnel starting from Purana Quila road have been provided under Mathura Road for right turn on traffic on Mathura Road and other Fork of the tunnel for entry to the underground Parking of ITPO. For traffic decongestion on intersection of Bhairon Marg and Mathura Road two tunnels at this intersection have been proposed one for Right turning traffic from Bhairon Marg to Mathura
Integrated transit corridor development and street network/connectivity plan for the corridor/influence zone along with detailed design of all intersections & Mid sections based on traffic and feasibility studies for corridor/network.
PWD
VKS INFRATECH MANAGEMENT PVT. LTD12
Road and other Right turn traffic from Mathura Road to Bhairon Marg making this intersection as signal free. Two way trumpet ramp has been proposed at the Shershah Road –Mathura road intersection to make it signal free. Traffic coming from Sher Shah Road will take right turn on Mathura Road and from Mathura Road Right turn to Sher Shah Road through this tunnel. Further a tunnel on Mathura Road has been proposed for traffic coming from Sher Shah Road and from Moolchand Side and going towards W-point without obstructing the traffic on Bhairon Marg- Mathura road intersection. Provision for traffic going to ITPO parking area from Bhairon Marg and exit from ITPO area on Bhairon Marg separate tunnels have been provided. Additional connectivity has been provided via tunnel from Subramaniam Bharati Marg for Right turn traffic going towards Moolchand side. Two Trumpet ramp has been proposed at Bhairon Marg –Ring road intersection for right turn traffic from Bhairon Marg to Ring Road and vice versa. Advantages No disturbance to ITPO complex since corridor is traversing through outer northern boundary road and all along is underground. Mathura Road - Sher Shah and Mathura Road - Bhairon Marg intersections are made signal free. Major traffic on Purana Quila Road is right turning traffic on Mathura Road will be signal free. Disadvantages No right turns at Bhagwan Das Road and Purana Quila intersections with Mathura Road. The alignment of tunnel passing through Railway Colony behind ITPO is heavily skewed and necessitates demolition of Railway Quarters. Tunnel below Railway Track passing at skew angle of more than 60 degree which is undesirable on safety considerations both for Railway and Road users. The traffic coming from Purana Quila destined to Mathura road towards Moolchand or Ring Raod has will negotiate addition distance of 900 mts approx. Mathura Road - Bhairon Marg, Mathura Road - Sher Shah Road and SubramanyamBharti Marg-Mathura Road intersections are within the 100 m of protected area of ASI in which construction activities are not allowed.

Integrated transit corridor development and street network/connectivity plan for the corridor/influence zone along with detailed design of all intersections & Mid sections based on traffic and feasibility studies for corridor/network.
PWD
VKS INFRATECH MANAGEMENT PVT. LTD13
Alternative 2:
The 6-lane Main tunnel has been proposed along Purana Quila Road to Ring Road through ITPO area complex. The tunnel is aligned centrally on Purana Quila road for entry and exit to main tunnel. Left turning Down Ramp from Mathura Road for vehicle approaching from W point junction to ITPO tunnel is provided for access from Mathura road. The integration with Ring road is in form of Trumpet interchange and slip ramps providing all accesses for a typical 3 arm interchange. Following junctions improvement have also been proposed on the extremities of this tunnel (i.e. Mathura Road, Purana Quila Road & Ring Road) From down ramp at Mathura Road two separate accesses have been proposed one for ITPO parking area and other for proposed Hotel site. For traffic decongestion on intersection of Bhairon Marg and Mathura Road two tunnels at this intersection have been proposed one for Right turning traffic from Bhairon Marg to Mathura Road and other Right turn traffic from Mathura Road to Bhairon Marg making this intersection as signal free. The trumpet ramp with slip roads for all possible movement of traffic for a 3 arm interchange has been proposed at the Shershah Road –Mathura road intersection to make it signal free. Provision for traffic going to ITPO parking area from Bhairon Marg and exit from ITPO area on Bhairon Marg separate tunnels have been provided. Additional connectivity has been provided via tunnel from Subramaniam Bharati Marg for Right turn traffic going towards Moolchand side. Trumpet ramp has been proposed at Bhairon Marg –Ring road intersection providing full turning maneouver for 3 arm interchange.

Integrated transit corridor development and street network/connectivity plan for the corridor/influence zone along with detailed design of all intersections & Mid sections based on traffic and feasibility studies for corridor/network.
PWD
VKS INFRATECH MANAGEMENT PVT. LTD14
Advantages: This length of this corridor alignment is shorter. Alignment passes through Railway track easilt without prominenet skewness No Railway Quarters need to be demolished/acquired for tunnel. By-passable traffic from India Gate side can reach ring road easily without decongesting Mathura road and Bhairon Marg/Indraprastha road. Major portion of traffic from Purana Quila Road to Mathura Road are destined for East Delhi/NCR which will pass through tunnel reducing the traffic load on Mathura Road Similarly Traffic from Ring Road will pass through tunnel to Purana Quila Road reducing traffic on Bhairon Marg and Mathura Road. Mathura Road - Sher Shah and Mathura Road - Bhairon Marg intersections are made signal free. Major traffic on Purana Quila Road is right turning traffic on Mathura Road will be signal free.
Disadvantages Mathura Road - Bhairon Marg and Mathura Road - Sher Shah Road intersections are within the 100 m of protected area of ASI in which construction activities are not possiblee as per ASI statutory guidelines. Right closure is managed with traffic management schemes as signel free corridor on Mathura road and Bharon Marg but with additional average travel distance of 800 mts.

Integrated transit corridor development and street network/connectivity plan for the corridor/influence zone along with detailed design of all intersections & Mid sections based on traffic and feasibility studies for corridor/network.
PWD
VKS INFRATECH MANAGEMENT PVT. LTD15
Alternative. 3:
The scheme is similar to alternative 2 for Main tunnel and its accesses. The trumpet interchange at intersection of Ring Road and Bhairon Marg also remains the same as per alternative I. The only variations are
No improvement has been suggested for Shershah- Mathura road crossing except closure of intersection for right turning traffic due to ASI Monument. The median closure is with movable barriers. No improvement has been suggested for Subramanayam Bharti Marg-Mathura road crossing except closure of intersection for right turning traffic due to ASI Monument. The median closure is with movable barriers
Right turn at intersections are managed by 4- U turns and rerouting of traffic with an additional average e travel distance of 800 mts of right turning traffic. Right turn for traffic from Mathura Road to Bhairon Marg is closed. Traffic from Moolchand Side and Sher Shah Road bound to Bhairon Marg will take U-turn from tunnel provided near National Sports Club on Mathura Road between Purana Quila Road & Bhairon Marg Intersection. Entry and Exit Ramps have been proposed for ITPO Parking area from Bhairon Marg Advantage: The entire proposed tunnel is beyond the prohibited area of ASI Monuments. However, they are within the regulated area in which permission have been obtained from ASI.

Integrated transit corridor development and street network/connectivity plan for the corridor/influence zone along with detailed design of all intersections & Mid sections based on traffic and feasibility studies for corridor/network.
PWD
VKS INFRATECH MANAGEMENT PVT. LTD16
All the intersections on Mathura Road have been made signal free decongesting the intersections on peak hour. Implementation is easiest as compared to other laternatives as the improvements are not at all intersections of Mathura road but localized as U turns where diversin during construction and assurance of lane availability will not be a problem. Implementation is easy as the improvements are not at all intersections of Mathura road but localized as U turns where diversin during construction and assurance of lane availability will not be a problem. Significant benefit as the Pay back Period of Tunnel is 5 years. The EIRR is highest as compared to other alternatives more than 21% which suggests that the option must be taken immediately. Disadvantage: Due to closure of intersection the average travel distance of right turning traffic is
increases by 800 mts but offset by time as average delay due ti intersection on Mathura road is 121 secs for all vehicles where as the 800 mts is only for right turning traffic.
12. Design Option Major features
While comparing the Design Options it is found alternative 3 has got an edge over the first and second ones due to several factors. Do nothing will not improve the exiting situation particularly in peak hour as no improvement is possible on Mthura road majot intersections due to proximity to ASI monuments. Moreover, 4600 dedicated ECS will decongest the on street parking issues. Parking entry exit has been provided from all sides i.e. Mathura Raod, Bhairon Marg and Ring raod thus not creating congestion on any one road and moreover the VMS sign and controlled operation for exit vehicles and sufficient holding bay for entry to tunnel will manage the route efficiently.
The tunnel is provided with 40 mts long X 7.0 mts wide with IRC compliant merging for emergency Nreak down and also for security inside tunnel.
Telephone Bothhs and CCTV camera with VMS signs at entry of Tunnel to warn the road users ahead of entry to tunnel.
As emergency measures all intersection on Mathura road and Bharon Marg with Ring are provided with movable barriers for VVIP movements during ceremonial functions.
Ventilation system is panned through the tunnel as it length is more than 500 mts ( IRC recommendation)
Drainage cut off at entry and exit are planned judiciously for effective drainage management.
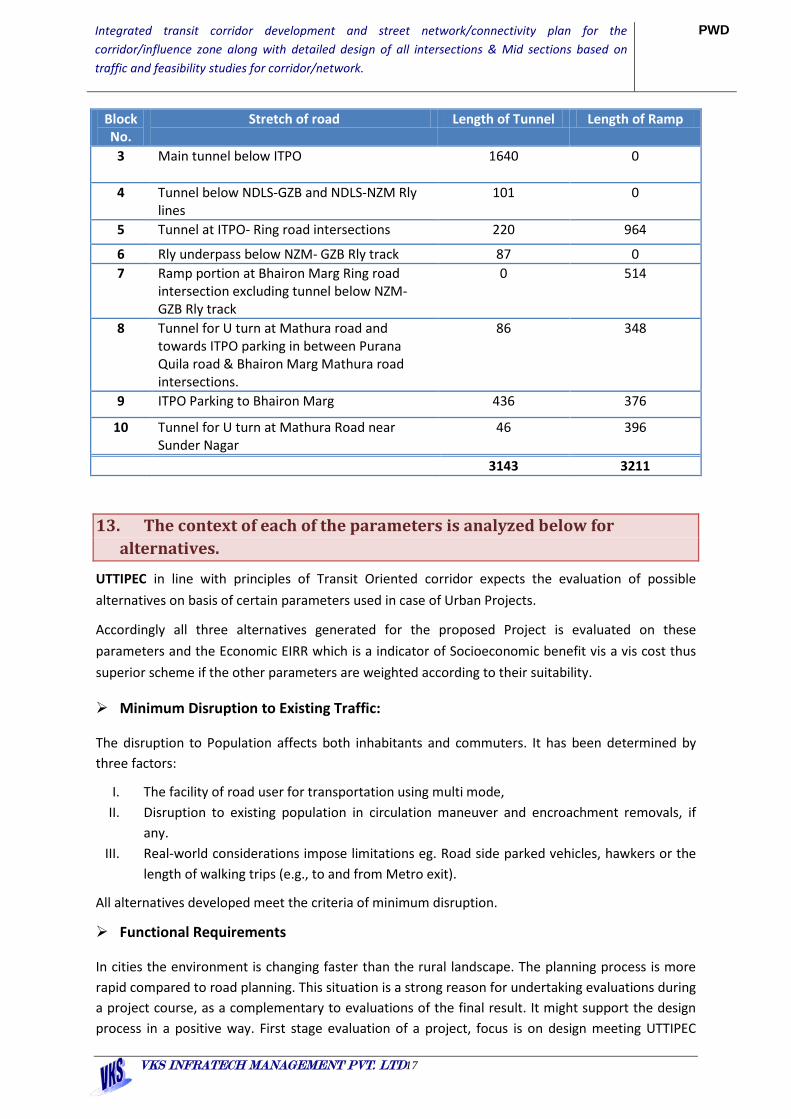
Length of tunnel and ramp
Block No.
Stretch of road Length of Tunnel Length of Ramp
1 Tunnel for U turn at Mathura road and towards ITPO parking
527 396
2 Purana Quila road to ITPO boundary 0 217
Integrated transit corridor development and street network/connectivity plan for the corridor/influence zone along with detailed design of all intersections & Mid sections based on traffic and feasibility studies for corridor/network.
PWD
VKS INFRATECH MANAGEMENT PVT. LTD17
Block No.
Stretch of road Length of Tunnel Length of Ramp
3 Main tunnel below ITPO 1640 0
4 Tunnel below NDLS-GZB and NDLS-NZM Rly lines
101 0
5 Tunnel at ITPO- Ring road intersections 220 964
6 Rly underpass below NZM- GZB Rly track 87 0 7 Ramp portion at Bhairon Marg Ring road
intersection excluding tunnel below NZM- GZB Rly track
0 514
8 Tunnel for U turn at Mathura road and towards ITPO parking in between Purana Quila road & Bhairon Marg Mathura road intersections.
86 348
9 ITPO Parking to Bhairon Marg 436 376
10 Tunnel for U turn at Mathura Road near Sunder Nagar
46 396
3143 3211
13. The context of each of the parameters is analyzed below for alternatives.
UTTIPEC in line with principles of Transit Oriented corridor expects the evaluation of possible alternatives on basis of certain parameters used in case of Urban Projects.
Accordingly all three alternatives generated for the proposed Project is evaluated on these parameters and the Economic EIRR which is a indicator of Socioeconomic benefit vis a vis cost thus superior scheme if the other parameters are weighted according to their suitability.
Minimum Disruption to Existing Traffic:
The disruption to Population affects both inhabitants and commuters. It has been determined by three factors:
I. The facility of road user for transportation using multi mode, II. Disruption to existing population in circulation maneuver and encroachment removals, if
any. III. Real-world considerations impose limitations eg. Road side parked vehicles, hawkers or the
length of walking trips (e.g., to and from Metro exit).
All alternatives developed meet the criteria of minimum disruption.
Functional Requirements
In cities the environment is changing faster than the rural landscape. The planning process is more rapid compared to road planning. This situation is a strong reason for undertaking evaluations during a project course, as a complementary to evaluations of the final result. It might support the design process in a positive way. First stage evaluation of a project, focus is on design meeting UTTIPEC

Integrated transit corridor development and street network/connectivity plan for the corridor/influence zone along with detailed design of all intersections & Mid sections based on traffic and feasibility studies for corridor/network.
PWD
VKS INFRATECH MANAGEMENT PVT. LTD18
street design guidelines/IRC/MoUD and performance for the coming stages. The evaluation gives suggestions for improvement of aesthetics and function on the way. Evaluation of urban road design makes is essential to discuss the urban aspect as well as the aesthetic aspect. Below is a list of parameters to consider:
Ease of Implementation
In all alternatives as the improvements are on surface or below ground and ease of implementation cannot be compared expressly except degree of easiness by diversion during construction measures.
In alternative I the Tunnel/Underpass is skewed more than 45 degrees with Railway and hence undesirable based on ease of implementation where as alternative II and III are better.
Moreover, ASI statutory provision limits improvement within 100 m of ASI monument campus. Based on these criteria the alternative II is found unsuitable.
Financial cost and Economic cost
Based on Conceptual Cost the Financial and economic cost of Alternative III is recommended for selection within competing schemes.
Aesthetics Evaluation and discussion about the aesthetics in the road planning design process is important there is a connection between the quality of safety, function and aesthetics and the adjustment to the environments around. There are methods and routines that can be applied in the road planning process. Post-Occupancy Evaluation at stage III will be carried out when the alternatives are approved.
Summary Comparison of alternatives S.N. Parameter Alt I Alt II Alt III
Functional Requirements a Road Carriageway
Width Capacity Compatible lanes
Capacity Compatible lanes
Capacity Compatible lanes
b Footpath Minimum 2/2.5 mts Minimum 2/2.5 mts Minimum 2/2.5 mts c Cycle Track Along Mathura Road Along Mathura Road Along Mathura Road d Frontages Frontage with Service
Road Frontage with Service Road
Frontage with Service Road
e Does the road create barriers?
On Bhgawan Das Road
On Purana Quila road min. effect
On Purana Quila road min. effect
f Is the road environment safe for unprotected road-users, like pedestrians, cyclists, children, handicapped and elderly?
yes yes Yes
g What problems are there: poor visibility, speed problem, poor circumstances for
None None None

Integrated transit corridor development and street network/connectivity plan for the corridor/influence zone along with detailed design of all intersections & Mid sections based on traffic and feasibility studies for corridor/network.
PWD
VKS INFRATECH MANAGEMENT PVT. LTD19
orientation etc h Are road signs meet
UTTIPEC Criteria As per UTTIPEC As per UTTIPEC As per UTTIPEC
Ease of Implementation a Diversion during
Construction Not a issue planned to lane assurance
Not a issue planned to lane assurance
Not a issue planned to lane assurance
Financial and Economic Cost a Financial Cost 795 crores 960 crores 750 crores b Benefit (VOC,VOT
and Carbon footprints)
83 crores 130 crores 110 Crores
c EIRR 16.20% 20.60% 21.80% Aesthetics Less compared to
others Best on aesthetic parameters
Relatively inferior to alt II but superior to alt I.
14. Traffic Simulation data and Snapshots of flow conditions
Vissim PTV software has been applied as per recommendation of UTIPEC considering three critical scenarios • Base condition with current traffic flow • Peak Hour (Prominent) with projected traffic of 2024 (5years after construction of facility) to
simulate the congestion primarily conflict areas • Peak Hour (Prominent) with projected traffic of 2024 (5years after construction of facility) to
after removing conflict areas. (Conflict managed scenario)
Background
Integrated Transit Corridor Development and Street Network / Connectivity plan for the corridor / Influence Zone along with Detailed Design of all Intersections and Mid Sections based on traffic and feasibility studies for the Corridor/Network.
The report provides detailed information on the following:
• Data from primary and secondary sources. • Development of the Simulation Model in PTV Vissim + for scenarios • Parameters of the Input for PTV Vissim Model • Evaluation of Base model and Proposed Model including validations.
Objective and Scope of Micro Simulation
Figure below gives the objective and scope of the assignment:

Integrated transit corridor development and street network/connectivity plan for the corridor/influence zone along with detailed design of all intersections & Mid sections based on traffic and feasibility studies for corridor/network.
PWD
VKS INFRATECH MANAGEMENT PVT. LTD20
Figure 1: Scope and Objective
Simulation Model
Software: PTV VISSIM and PTV VISWALK is a microscopic, time step and behaviour based simulation model and it is the most powerful tool available for simulating multi-modal traffic flows, including cars, trucks, buses, heavy rail, trams, LRT, bicyclists and pedestrians. Its flexible network structure provides the user with the confidence to know they can model any type of geometric configuration or unique operational/driver behaviour encountered within the transportation system therefore making it an ideal simulation tool for mixed traffic conditions in Developing Countries.
Simulation is carried out for following purposes.
To build confidence in the proposal but also:
• Provides a virtual platform of the traffic/pedestrian flow
• Identifies critical sections and intersections, and areas with critical level of service
• Identifies bottlenecks and conflict areas
• Optimizing signal controls
• Quantifies the impact of the new proposal over the horizon years
• Simulates bus priority schemes
• Validates the new development proposal such a flyovers, underpass and round-about
• Validates the new building proposal for evacuation or peak hour operations
• Can test and validate different traffic management schemes. etc.
• Generates outputs in a statistical format for evaluation.
Scope
•Prepartion of the Simulation Model for the
Base year
•Validation of the Base year Simulation
model
•Preparation of the proposed simulation
model for the "Do Nothing Scenario"
•Preparation of the proposed simulation
model for the "Proposed Scenario"
Objectives
•Evaluation of the proposed design for
network performance parameters such as
level of service and queue lengths
•Comparison of the existing and proposed
design in terms of network performance

Integrated transit corridor development and street network/connectivity plan for the corridor/influence zone along with detailed design of all intersections & Mid sections based on traffic and feasibility studies for corridor/network.
PWD
VKS INFRATECH MANAGEMENT PVT. LTD21
Data for simulation

Integrated transit corridor development and street network/connectivity plan for the corridor/influence zone along with detailed design of all intersections & Mid sections based on traffic and feasibility studies for corridor/network.
PWD
VKS INFRATECH MANAGEMENT PVT. LTD22
Data Collection
The base line map and traffic data has been obtained from primary sources and are given in this report as Annexure.
1) Details of base model drawings: Base drawing is provided by the client with details of the carriageway widths and geometry.Figure 2 below shows the base model drawing.
Figure 2: Base Year Plan
Source: BASE MAP SHOWING FOOTPATH - Copy.dwg
2) Details of traffic volume and composition: Turning movement counts, midblock counts and the traffic composition for various junctions and mid-block sections are carried out in the file Summary of all intersection.xlsx and Summary of Mid Block.xlsx
3) Details of the traffic management plan and proposed road geometry
• All information regarding the design of the proposed plan and the road geometry are coded in the software as per file Proposed DWG.dwg.

Integrated transit corridor development and street network/connectivity plan for the corridor/influence zone along with detailed design of all intersections & Mid sections based on traffic and feasibility studies for corridor/network.
PWD
VKS INFRATECH MANAGEMENT PVT. LTD23
Snapshot of the proposed drawing is given in the figure below:
Figure 3: Proposed Scheme Plan

Integrated transit corridor development and street network/connectivity plan for the corridor/influence zone along with detailed design of all intersections & Mid sections based on traffic and feasibility studies for corridor/network.
PWD
VKS INFRATECH MANAGEMENT PVT. LTD24
Evaluation using Micro Simulation Base Model
Development

Integrated transit corridor development and street network/connectivity plan for the corridor/influence zone along with detailed design of all intersections & Mid sections based on traffic and feasibility studies for corridor/network.
PWD
VKS INFRATECH MANAGEMENT PVT. LTD25
Methodology
Flowchart below describes the methodology for developing the simulation model for the base year and the horizon year. Various parameters for the methodology are described in this section.
Evaluation of Mitigation Options (If Required)
Calibration and Validation of the Base model
Evaluation of the proposed model with proposed design and projected traffic
Observations and Recommendations
Traffic volume and compositions Data
Network Model Setup in VISSIM/VISWALK Discussions with Client
Geometric Data/ Design
Data Processing & Analysis
Data Analysis
Data Collection and Compilation from the client
Project Start
Coding the Model Parameter, Desired Speeds, Composition, Driving Behaviour
Figure 4: Methodology for Simulation Model Development
Integrated transit corridor development and street network/connectivity plan for the corridor/influence zone along with detailed design of all intersections & Mid sections based on traffic and feasibility studies for corridor/network.
PWD
VKS INFRATECH MANAGEMENT PVT. LTD26
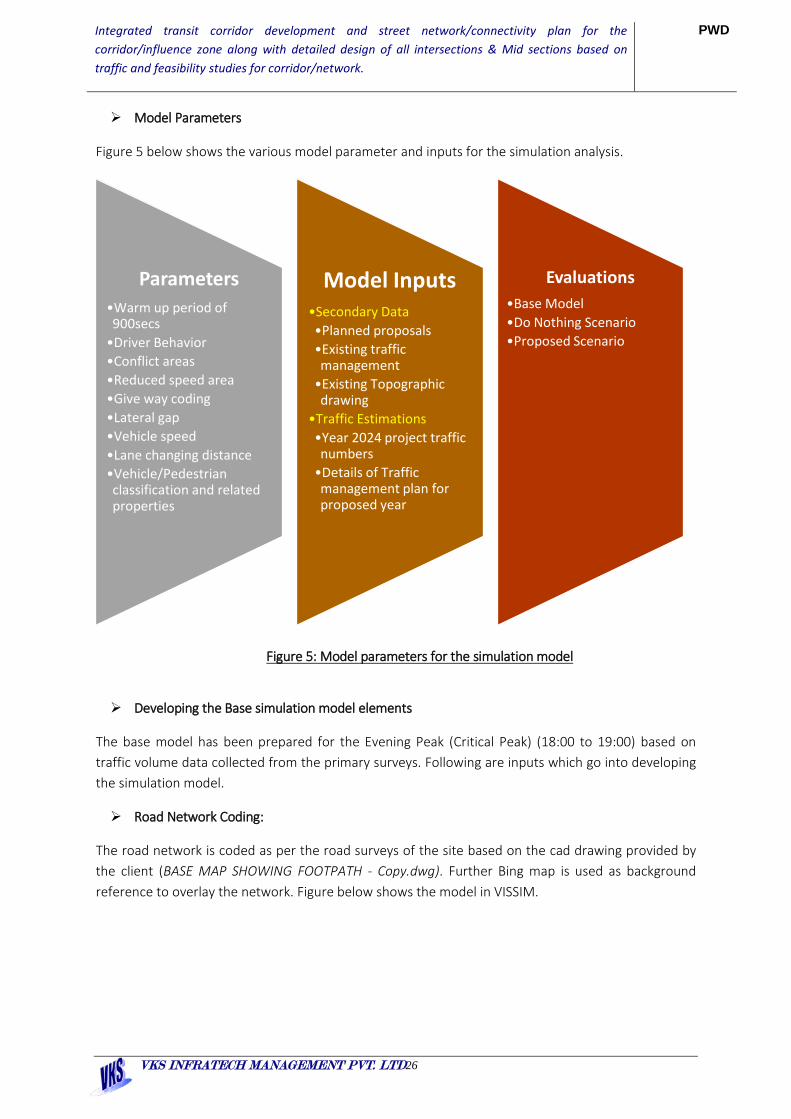
Model Parameters
Figure 5 below shows the various model parameter and inputs for the simulation analysis.
Figure 5: Model parameters for the simulation model
Developing the Base simulation model elements
The base model has been prepared for the Evening Peak (Critical Peak) (18:00 to 19:00) based on traffic volume data collected from the primary surveys. Following are inputs which go into developing the simulation model.
Road Network Coding:
The road network is coded as per the road surveys of the site based on the cad drawing provided by the client (BASE MAP SHOWING FOOTPATH - Copy.dwg). Further Bing map is used as background reference to overlay the network. Figure below shows the model in VISSIM.
Parameters •Warm up period of 900secs •Driver Behavior •Conflict areas •Reduced speed area •Give way coding •Lateral gap •Vehicle speed •Lane changing distance •Vehicle/Pedestrian classification and related properties
Model Inputs •Secondary Data •Planned proposals •Existing traffic management •Existing Topographic drawing
•Traffic Estimations •Year 2024 project traffic numbers •Details of Traffic management plan for proposed year
Evaluations •Base Model •Do Nothing Scenario •Proposed Scenario

Integrated transit corridor development and street network/connectivity plan for the corridor/influence zone along with detailed design of all intersections & Mid sections based on traffic and feasibility studies for corridor/network.
PWD
VKS INFRATECH MANAGEMENT PVT. LTD27
Figure 6: Base Networkas coded in PTV Vissim
Traffic counts and composition:
Figure 7 and 8 below shows the vehicle composition and turning movement volumes from different direction as observed during peak hour from the primary survey and coded in the simulation software. Simulation model is developed for total 4500 seconds, with 900 seconds of buffer time which fills up the volume for the peak hour of remaining 3600 seconds. The turning movement diagram is balanced for validation of the simulation and observed counts, balancing of volume diagram is necessary due to possible errors during the survey.
Figure 7: Average Traffic Composition during critical peak period

Integrated transit corridor development and street network/connectivity plan for the corridor/influence zone along with detailed design of all intersections & Mid sections based on traffic and feasibility studies for corridor/network.
PWD
VKS INFRATECH MANAGEMENT PVT. LTD28
Figure 8: Turning movement volumes in vehicles per hour balanced diagram

Integrated transit corridor development and street network/connectivity plan for the corridor/influence zone along with detailed design of all intersections & Mid sections based on traffic and feasibility studies for corridor/network.
PWD
VKS INFRATECH MANAGEMENT PVT. LTD29
Car/Jeep/Van
62.70%
2-Wh 22.45%
Auto 8.67%
Bus 1.45%
Bus 0.65%
LCV 2.05%
Truck 1.61%
MAV 0.03%
Cycle 0.25%
Rick 0.07%
Other (S) 0.07%
Composition of traffic at Intersection Location:- at Ring Road-Bhairon Marg
Car 53.35% 2W
30.45%
Auto 10.89%
Bus 2.53%
Mini Bus Truck LCV MAV
0.00% Cycle
Rick 0.16%
Others 0.00%
Composition of traffic at Intersection Location: Mathura Road & Bhairon Marg
Car/Jeep/Van
48.33% 2-Wh 28.67%
Auto 16.73%
Bus 3.03%
M_Bus 0.39%
LCV 0.54%
Truck 0.12%
MAV 0.07%
Cycle 1.62% Rick
0.34%
Other (S) 0.15%
Composition of Total Traffic at Subramanyam Marg & Mathura Rd.(Near sundar nagar petrol
pump)
Car 52.12% 2W
25.55%
Auto 14.96%
Bus 4.64%
Mini Bus Truck LCV MAV
0.00% Cycle Rick
0.10%
Others 0.00%
Composition of traffic at Intersection Location: Mathura Road & Shershah Road
Car 55.20% 2W
25.56%
Auto 14.50%
Bus 2.77%
Mini Bus Truck LCV MAV 0.00% Cycle Rick
0.04% Others 0.00%
Composition of traffic at Intersection Location: Mathura Road Purana Quila
Car 39.26%
2W 30.37%
Auto 24.69%
Bus 2.84%
Mini Bus Truck LCV MAV
0.00% Cycle Rick 0.27%
Others 0.02%
Composition of traffic at Intersection Location: Mathura Rd. & Bhagwan das Rd.
Composition of traffic at all Intersections

Integrated transit corridor development and street network/connectivity plan for the corridor/influence zone along with detailed design of all intersections & Mid sections based on traffic and feasibility studies for corridor/network.
PWD
VKS INFRATECH MANAGEMENT PVT. LTD30
Car 36.39%
2W 42.43%
Auto 15.80%
Bus 2.95%
Mini Bus Truck
LCV MAV 0.00%
Cycle
Rick 0.20%
Others 0.04%
Composition of traffic at Intersection Location: W-Point
Car/Jeep/Van
60.75%
2-Wh 23.46%
Auto 14.36%
Bus 0.68%
M_Bus 0.26%
LCV 0.12%
Truck 0.13%
MAV 0.00%
Cycle 0.21%
Rick 0.03%
Other (S) 0.01%
Composition of traffic at Intersection Location:C-HEXAGON with PURANA QUILA
ROAD
Car/Jeep/Van
62.31%
2-Wh 18.96%
Auto 14.38%
Bus 2.38%
M_Bus 0.73%
LCV 0.25%
Truck 0.24% MAV
0.15%
Cycle 0.43%
Rick 0.05%
Other (S) 0.11%
Composition of traffic at intersection Location:c-hexagon with SHERSHAH ROAD
Car/Jeep/Van
41.61% 2-Wh 32.33%
Auto 16.90%
Bus 3.60%
M_Bus 2.33%
LCV 0.50%
Truck 0.01%
MAV 0.00% Cycle
1.66% Rick
1.07%
Other (S) 0.00%
Composition of traffic at Intersection Location:- MATHURA ROAD (NEAR DPS
)

Integrated transit corridor development and street network/connectivity plan for the corridor/influence zone along with detailed design of all intersections & Mid sections based on traffic and feasibility studies for corridor/network.
PWD
VKS INFRATECH MANAGEMENT PVT. LTD31
Desired Speed and Acceleration graphs
The acceleration speeds and dimensions of the different kind of vehicles were coded in the mode. These values area taken from existing literature of a similar stretch Reference (1)(2)(3)(4).
Figure 9 below provides a snapshot of the developed functions for speed and acceleration
Figure 9: Speed and Acceleration Curves
Coding of Vehicle routes
Static vehicle Routing is assigned to the network traffic on different paths for distributing the traffic as observed.
.
Figure 10: Vehicle Static Routing` in PTV VISSIM
Conflict areas are used to handle non-signalized Conflicts. Parameters such as front/rear gap, safety distance, blocking is set as per Indian conditions.

Integrated transit corridor development and street network/connectivity plan for the corridor/influence zone along with detailed design of all intersections & Mid sections based on traffic and feasibility studies for corridor/network.
PWD
VKS INFRATECH MANAGEMENT PVT. LTD32
Figure 11: Conflict areas
Coding of Signal Timings
During the survey for signal timings it was found that during peak hours no fixed cycle or phase time is followed due to saturated state of traffic in most parts of the network. Signal times are manually controlled by the authorities with cycle time for T junction (3 Way junction) to be nearly 170-180 seconds and for the 4 way junction the cycle time is approximately 240 seconds, with amber time varying from 3-5 seconds. Figure (12) below shows the diagram for a typical T-Junction with 170 seconds of cycle time, with phases for Straight-Right Traffic, Straight-Straight-Traffic and Left-Right Traffic.
Figure 12: Signal phasing for 3 Way Junction
Figure (13) below shows the diagram for a 4 Way junction with 260 seconds of cycle time, with separate phases for each direction of flow, except the left turn movement when allowed.

Integrated transit corridor development and street network/connectivity plan for the corridor/influence zone along with detailed design of all intersections & Mid sections based on traffic and feasibility studies for corridor/network.
PWD
VKS INFRATECH MANAGEMENT PVT. LTD33
Figure 13: Signal phasing for 4 Way Junction
Figure (14-16) below provides the phase diagrams for typical junction coded in the base model. Figure () below shows signal phase diagram at shersharsuri road junction, similar phase diagram is applicable for Junction at Bhagwan Das road and puranaqila road with Mathura road.
Figure 14: T Junction at ShersharhSuri Road and Mathura Road

Integrated transit corridor development and street network/connectivity plan for the corridor/influence zone along with detailed design of all intersections & Mid sections based on traffic and feasibility studies for corridor/network.
PWD
VKS INFRATECH MANAGEMENT PVT. LTD34
Figure 15:T Junction at BhairavMarg and Mathura Road
Figure 16: T Junction at BhairavMarg and Ring Road
Driver Behaviour
The drivers were coded with Indian urban traffic driver behavior typology according to the parameters shown in figure below. The attributes were also referred from the various research
Integrated transit corridor development and street network/connectivity plan for the corridor/influence zone along with detailed design of all intersections & Mid sections based on traffic and feasibility studies for corridor/network.
PWD
VKS INFRATECH MANAGEMENT PVT. LTD35
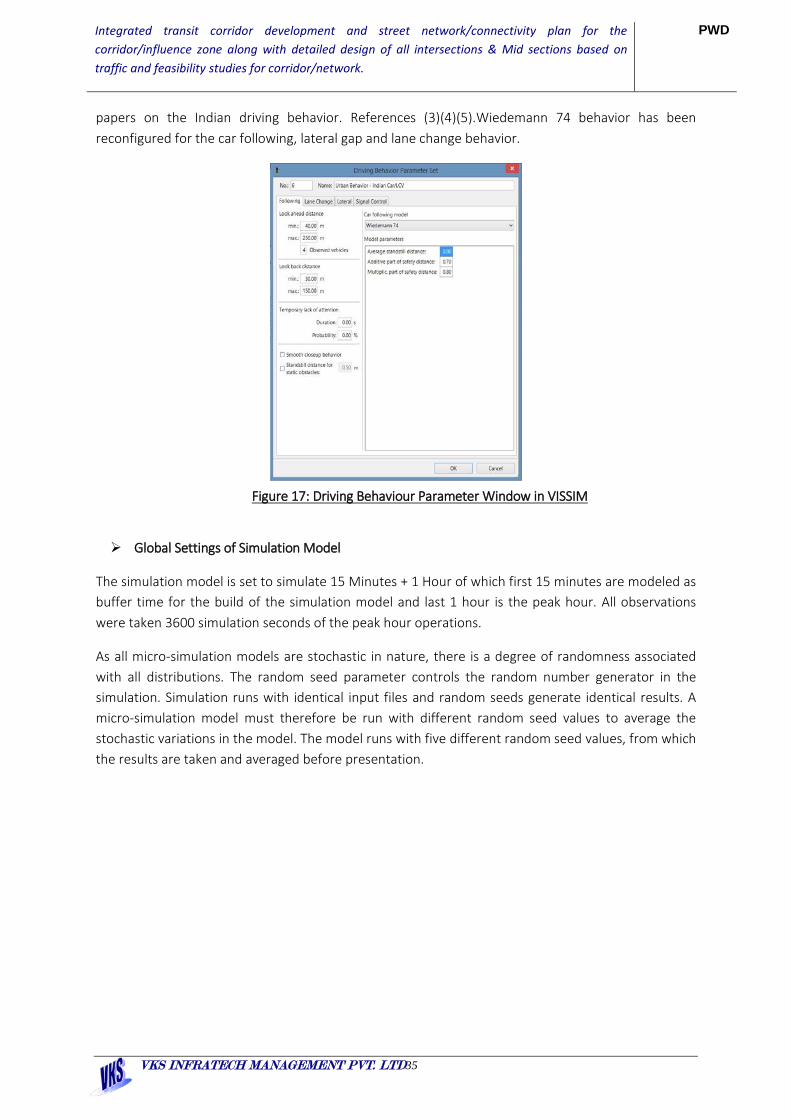
papers on the Indian driving behavior. References (3)(4)(5).Wiedemann 74 behavior has been reconfigured for the car following, lateral gap and lane change behavior.
Figure 17: Driving Behaviour Parameter Window in VISSIM
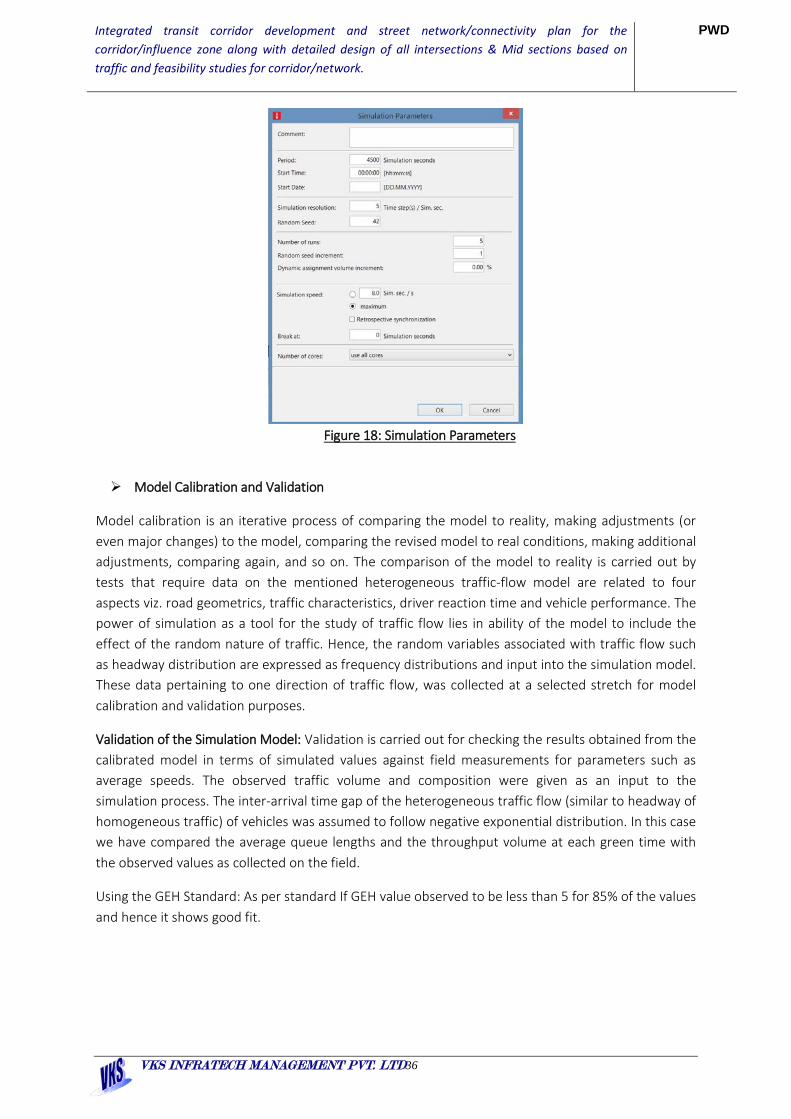
Global Settings of Simulation Model
The simulation model is set to simulate 15 Minutes + 1 Hour of which first 15 minutes are modeled as buffer time for the build of the simulation model and last 1 hour is the peak hour. All observations were taken 3600 simulation seconds of the peak hour operations.
As all micro-simulation models are stochastic in nature, there is a degree of randomness associated with all distributions. The random seed parameter controls the random number generator in the simulation. Simulation runs with identical input files and random seeds generate identical results. A micro-simulation model must therefore be run with different random seed values to average the stochastic variations in the model. The model runs with five different random seed values, from which the results are taken and averaged before presentation.
Integrated transit corridor development and street network/connectivity plan for the corridor/influence zone along with detailed design of all intersections & Mid sections based on traffic and feasibility studies for corridor/network.
PWD
VKS INFRATECH MANAGEMENT PVT. LTD36
Figure 18: Simulation Parameters
Model Calibration and Validation
Model calibration is an iterative process of comparing the model to reality, making adjustments (or even major changes) to the model, comparing the revised model to real conditions, making additional adjustments, comparing again, and so on. The comparison of the model to reality is carried out by tests that require data on the mentioned heterogeneous traffic-flow model are related to four aspects viz. road geometrics, traffic characteristics, driver reaction time and vehicle performance. The power of simulation as a tool for the study of traffic flow lies in ability of the model to include the effect of the random nature of traffic. Hence, the random variables associated with traffic flow such as headway distribution are expressed as frequency distributions and input into the simulation model. These data pertaining to one direction of traffic flow, was collected at a selected stretch for model calibration and validation purposes.
Validation of the Simulation Model: Validation is carried out for checking the results obtained from the calibrated model in terms of simulated values against field measurements for parameters such as average speeds. The observed traffic volume and composition were given as an input to the simulation process. The inter-arrival time gap of the heterogeneous traffic flow (similar to headway of homogeneous traffic) of vehicles was assumed to follow negative exponential distribution. In this case we have compared the average queue lengths and the throughput volume at each green time with the observed values as collected on the field.
Using the GEH Standard: As per standard If GEH value observed to be less than 5 for 85% of the values and hence it shows good fit.

Integrated transit corridor development and street network/connectivity plan for the corridor/influence zone along with detailed design of all intersections & Mid sections based on traffic and feasibility studies for corridor/network.
PWD
VKS INFRATECH MANAGEMENT PVT. LTD37
Figure 19: GEH Standard and Data Collection Points
Table (1) below provides the validation results for the base model with respect to turning volumes at various locations. With average GEH value of 4.93, the model is suitably calibrated spatiotemporally and further it may be also applied for different scenarios for evaluating proposed options. Some gaps in GEH values can be explained by the some percentage errors in manual traffic survey counts.
Table 1: Validation Table
Figure 20-23 below are snapshots of simulation run in base case scenario (DO NOTHING SITUATION)
Location Simulated Volumes Observed Volumes GEHLeft From Mathura Road to Subaramaniam road 276 317 2.38Right From Subaramaniam Road to Mathura Road 128 146 1.54Right From Mathura Road to Subaramaniam Road 288 328 2.28Left From Subaramaniam Road to Mathura Road 747 714 1.22Straight from Sher Shah_Mathura Road Junction to Subaramaniam 3589 4102 8.27Straight from Subaramaniam Junction to Sher Shah Suri Junction 3958 4369 6.37Left From Mathura road Sher Shah Suri Road 231 262 1.97Right From Sher Shah Road to Mathura Road 1746 1778 0.76Mid Block Sher Shah Road towards Mathura Road 2409 2469 1.21Mid Block Sher Shah Road towards C Hexagon 1265 1407 3.88Right From Mathura Road to Bhairav Marg 3555 3933 6.18Right From Bhairav Marg to Mathura Road 932 923 0.30Left From Bhairav Marg to Mathura Road 740 697 1.60Left From Mathura Road to Bhairav Marg 2083 2459 7.89Left From Bhairav Marg to Ring Road 2036 2428 8.30Left From Ring Road to Bhairav Marg 1656 1621 0.86Straight from Bhairav Marg Junction to Purana Qila Junction 1618 1786 4.07Left From Mathura Road to Purana Qila Junction 487 535 2.12Left from Purana Qila Junction to Mathura Road 88 115 2.68Right from Purana Qila Junction to Mathura Road 1129 1329 5.70Straight from Purana Qila Junction towards Bhagwan Das Junction 1264 1365 2.79Straight from Bhagwan Das Junction towards Purana Qila Junction 3668 4243 9.14Left from Mathura Road to Bhagwan Das Road 570 600 1.24Right from Bhagwan Das Road to Mathura Road 1808 2321 11.29Right from Mathura Road to Bhagwan Das Road 301 366 3.56Straight from Bhagwan Das Junction to W Junction 2254 2515 5.34Straight from W Junction to Bhagwan Das Junction 1970 2289 6.91On Ring Road Towards Vikas Marg 5736 6211 6.15At W Junction From Mathura Road to Tilak Marg 129 176 3.81At W Junction From Mathura Road to Sikandra Road 898 1081 5.82At W Junction From Mathura Road to Bahadar Shah Zafar Road 1027 1257 6.81

Integrated transit corridor development and street network/connectivity plan for the corridor/influence zone along with detailed design of all intersections & Mid sections based on traffic and feasibility studies for corridor/network.
PWD
VKS INFRATECH MANAGEMENT PVT. LTD38
Figure 20: Long queue due to signal in peak hour along Mathura Road
Figure 21: Peak Hour Queue at Intersection of Bhairon Marg with Ring Road
Integrated transit corridor development and street network/connectivity plan for the corridor/influence zone along with detailed design of all intersections & Mid sections based on traffic and feasibility studies for corridor/network.
PWD
VKS INFRATECH MANAGEMENT PVT. LTD39
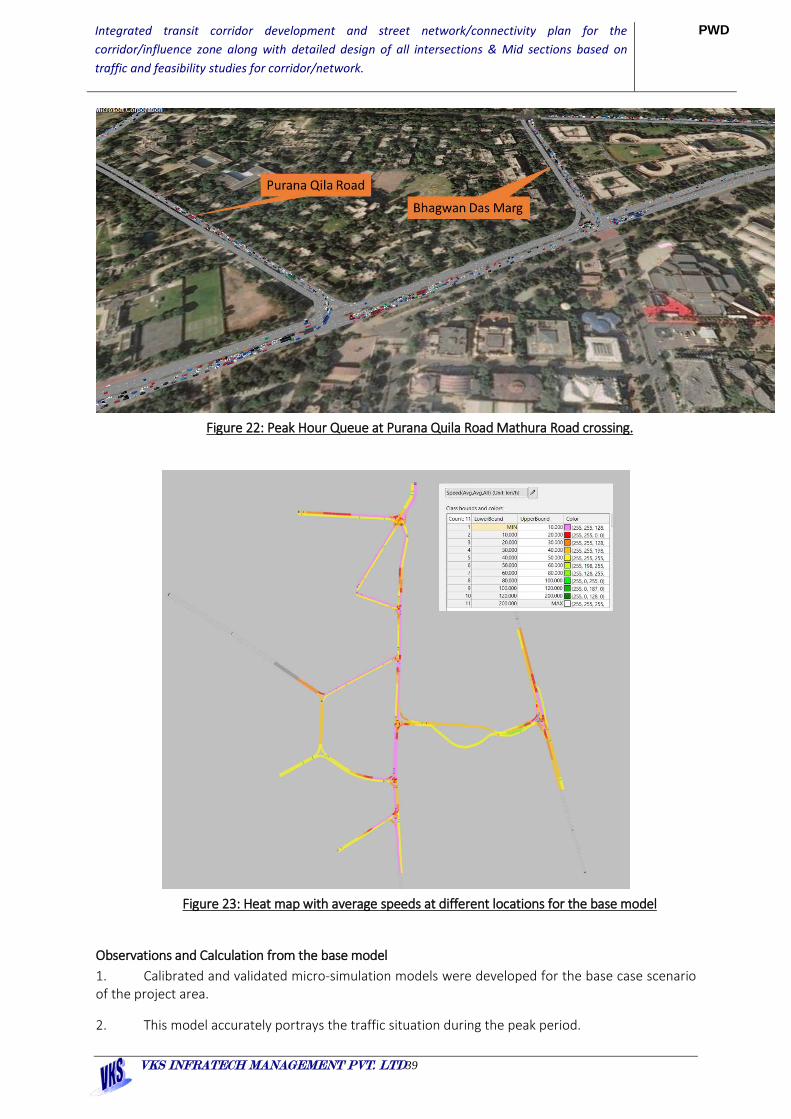
Figure 22: Peak Hour Queue at Purana Quila Road Mathura Road crossing.
Figure 23: Heat map with average speeds at different locations for the base model
Observations and Calculation from the base model 1. Calibrated and validated micro-simulation models were developed for the base case scenario of the project area.
2. This model accurately portrays the traffic situation during the peak period.

Integrated transit corridor development and street network/connectivity plan for the corridor/influence zone along with detailed design of all intersections & Mid sections based on traffic and feasibility studies for corridor/network.
PWD
VKS INFRATECH MANAGEMENT PVT. LTD40
3. As per the statistical outputs, the model accurately shows traffic condition
Developing the Simulation Model with Proposed Option
The validation and calibrated simulation model is to evaluate the traffic impact with the proposed development and design around the ITPO area to improve the level of service for the users. Figure 48 below explains the process for the simulation analysis.
Figure 24: Study Process for the proposed design options
Three models and simulation run has been carried out to simulate present scenario, future scenario identifying conflict areas and finally running after conflict management.
Proposed Scenario: Year 2024 projected vehicular traffic. The model has been prepared for Most Critical (Evening) peak for the Network traffic.
The model has been prepared for Most Critical peak to further identify conflict area/congested merging/weaving and subsequently after addressing all the conflicts.
Proposed Model Simulation Parameters and Assumptions Figure 25 below shows the parameters for the simulation model for the proposed scenario. In addition to the base model, the layout for the proposed design of is added to the model. The routing of the vehicles is balanced based on the new routes available for a particular origin to destination.
Base model preparation with the existing traffic condition and road geometry
Base model calibration and validation
Proposed Scenario with Proposed design and projected traffic
Recommendations and Mitigation Measures (in case the proposed system do not work)

Integrated transit corridor development and street network/connectivity plan for the corridor/influence zone along with detailed design of all intersections & Mid sections based on traffic and feasibility studies for corridor/network.
PWD
VKS INFRATECH MANAGEMENT PVT. LTD41
Figure 25: Proposed Model Parameters for Simulation The following growth factors are applied based on the regression analysis (population and vehicular growth) and after moderation with the impact of metro.
Figure 26: Estimated growth rates for each mode
Figure below shows the snapshot of the proposed design; following are the main features of the proposed design:
Parameters •Warm up period of 900secs •Indian Driver Behavior •Conflict areas •Reduced speed area •Give way coding •Lateral gap •Vehicle speed •Lane changing distance •Dwell Times •Vehicle classification and related properties
Model Inputs •Proposed Road layout •Proposed model for year– i.e 2024 •Future traffic growth
Evaluations •Conflict area •Queueing area •Network delay
Year Car 2 Wh 3 Wh Taxi Bus Goods2016 5.24% 4.95% 2.41% 8.67% 3.68% 4.00%2017 5.01% 4.75% 2.38% 7.97% 3.20% 4.00%2018 4.83% 4.60% 2.37% 7.42% 2.96% 4.00%2019 4.47% 4.26% 2.26% 6.67% 2.80% 4.00%2020 3.95% 3.78% 2.05% 5.75% 2.72% 4.00%2021 3.85% 3.69% 2.04% 5.47% 2.68% 4.00%2022 3.75% 3.60% 2.03% 5.23% 2.64% 3.60%2023 3.48% 3.35% 1.93% 4.77% 2.60% 3.60%
Integrated transit corridor development and street network/connectivity plan for the corridor/influence zone along with detailed design of all intersections & Mid sections based on traffic and feasibility studies for corridor/network.
PWD
VKS INFRATECH MANAGEMENT PVT. LTD42
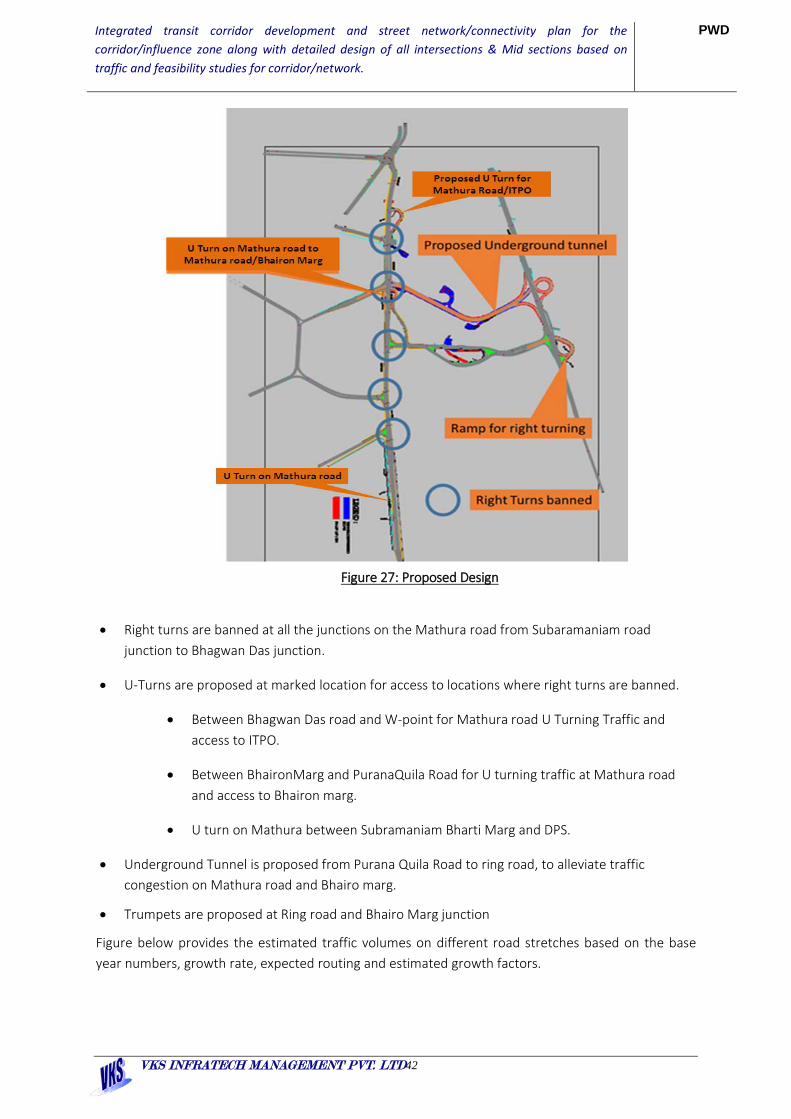
Figure 27: Proposed Design
• Right turns are banned at all the junctions on the Mathura road from Subaramaniam road junction to Bhagwan Das junction.
• U-Turns are proposed at marked location for access to locations where right turns are banned.
• Between Bhagwan Das road and W-point for Mathura road U Turning Traffic and access to ITPO.
• Between BhaironMarg and PuranaQuila Road for U turning traffic at Mathura road and access to Bhairon marg.
• U turn on Mathura between Subramaniam Bharti Marg and DPS.
• Underground Tunnel is proposed from Purana Quila Road to ring road, to alleviate traffic congestion on Mathura road and Bhairo marg.
• Trumpets are proposed at Ring road and Bhairo Marg junction
Figure below provides the estimated traffic volumes on different road stretches based on the base year numbers, growth rate, expected routing and estimated growth factors.

Integrated transit corridor development and street network/connectivity plan for the corridor/influence zone along with detailed design of all intersections & Mid sections based on traffic and feasibility studies for corridor/network.
PWD
VKS INFRATECH MANAGEMENT PVT. LTD43
Figure 28: Projected traffic volumes for proposed year 2024
• Right turning traffic from Bhagwan Das Marg to Mathura road for Bhairo marg is expected to use the tunnel to access the ring road, via Puarana Quila marg.
• Since right turning from Purana quilamarg to Mathura road is proposed to be banned, most of traffic accessing ring road would use the tunnel and very few will use Shershah road.
• Left turning traffic from sher shahsuri road to Mathura road for Bhairon marg would use the u-turn to access the left turn to Bhairon marg
• From ring road right turning traffic can use the tunnel to access the C-Hexagon and the ramp to right turn to Bhairo marg

Integrated transit corridor development and street network/connectivity plan for the corridor/influence zone along with detailed design of all intersections & Mid sections based on traffic and feasibility studies for corridor/network.
PWD
VKS INFRATECH MANAGEMENT PVT. LTD44
• Traffic from Bhairo marg would use the trumpet to the take right onto ring road, thus eliminating the need for signal at the junction (Ring road and Bhairo marg)
Peak Hour (Prominent) with projected traffic of 2024 (5years after construction of facility) to simulate the congestion primarily conflict areas.
Figures below shows the observations from the simulation analysis of the proposed design with the projected traffic:
• Lack of entry angle and curve is causing delays to the signal free merging vehicles at the intersection of the Subramanyam Bharti Marg with Mathura road. This has been considered and 75 degree netry has been reduced to 15 degree entry to Mathura road hence efficient merging. The merging could not be improved to 5 degree entry due to ASI campus.
Figure 29: Issues for Left rung traffic to Mathura Road

Integrated transit corridor development and street network/connectivity plan for the corridor/influence zone along with detailed design of all intersections & Mid sections based on traffic and feasibility studies for corridor/network.
PWD
VKS INFRATECH MANAGEMENT PVT. LTD45
Figure 30: Bharon Marg merging with Mathura Raod
The intersection merging has been improved by channelization for easy merging and critical gap study to make it easy in merging.
Figure 31: Purana Quila Road congestion in peak hour while merging with India gate.
The Purana Quila road is widened from undivided 4 lane road to dual 3-lane road which ensures uninterrupted flow in and out from tunnel.

Integrated transit corridor development and street network/connectivity plan for the corridor/influence zone along with detailed design of all intersections & Mid sections based on traffic and feasibility studies for corridor/network.
PWD
VKS INFRATECH MANAGEMENT PVT. LTD46
Conflict management (Conflict managed scenario)
Figure 32: shershah Raod with Mathura Raod
Figure 33: Purana Quila Raod

Integrated transit corridor development and street network/connectivity plan for the corridor/influence zone along with detailed design of all intersections & Mid sections based on traffic and feasibility studies for corridor/network.
PWD
VKS INFRATECH MANAGEMENT PVT. LTD47
Figure 34: Bhairon Marg Merging conflict addressed.
Figure 35: pedetrain Signal at Bhairon Marg
Integrated transit corridor development and street network/connectivity plan for the corridor/influence zone along with detailed design of all intersections & Mid sections based on traffic and feasibility studies for corridor/network.
PWD
VKS INFRATECH MANAGEMENT PVT. LTD48
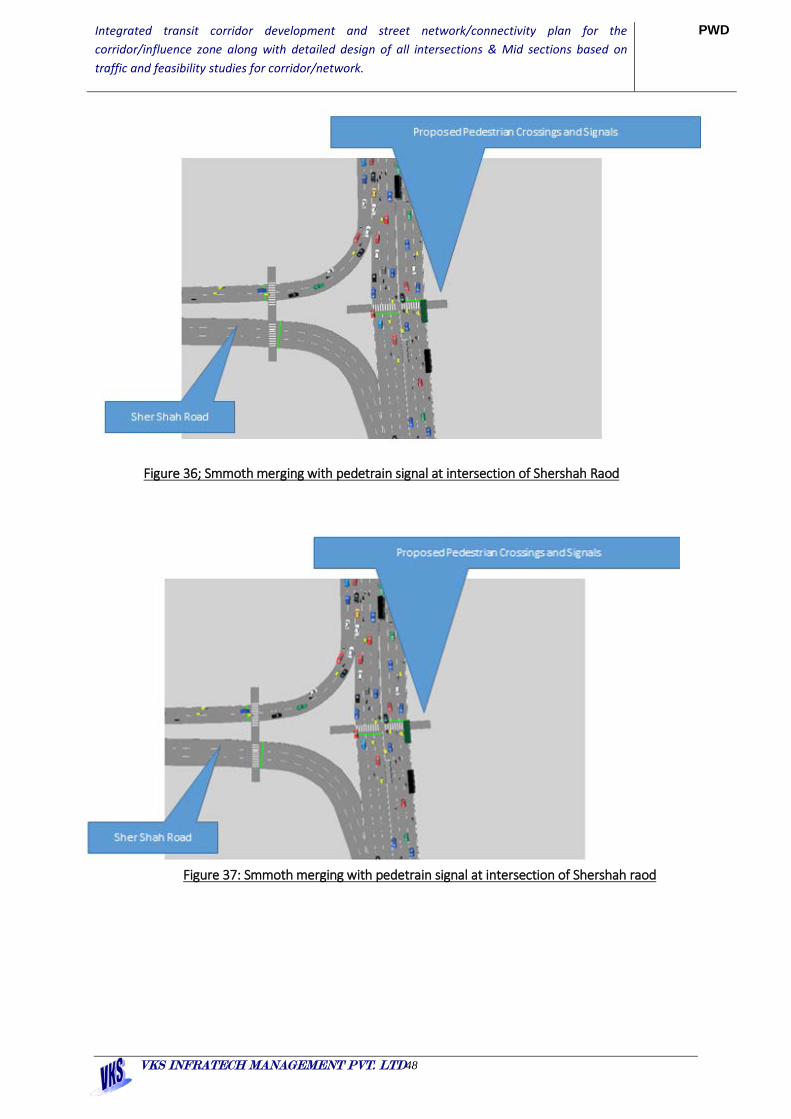
Figure 36; Smmoth merging with pedetrain signal at intersection of Shershah Raod
Figure 37: Smmoth merging with pedetrain signal at intersection of Shershah raod
Integrated transit corridor development and street network/connectivity plan for the corridor/influence zone along with detailed design of all intersections & Mid sections based on traffic and feasibility studies for corridor/network.
PWD
VKS INFRATECH MANAGEMENT PVT. LTD49
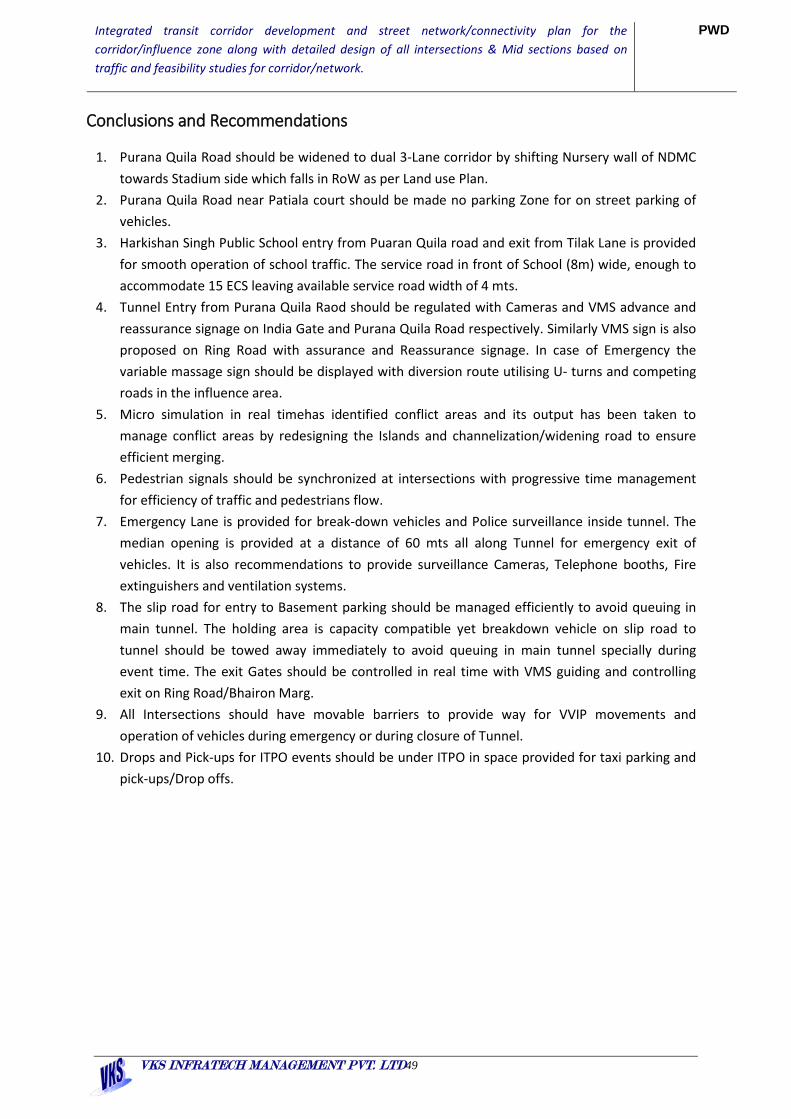
Conclusions and Recommendations
1. Purana Quila Road should be widened to dual 3-Lane corridor by shifting Nursery wall of NDMC towards Stadium side which falls in RoW as per Land use Plan.
2. Purana Quila Road near Patiala court should be made no parking Zone for on street parking of vehicles.
3. Harkishan Singh Public School entry from Puaran Quila road and exit from Tilak Lane is provided for smooth operation of school traffic. The service road in front of School (8m) wide, enough to accommodate 15 ECS leaving available service road width of 4 mts.
4. Tunnel Entry from Purana Quila Raod should be regulated with Cameras and VMS advance and reassurance signage on India Gate and Purana Quila Road respectively. Similarly VMS sign is also proposed on Ring Road with assurance and Reassurance signage. In case of Emergency the variable massage sign should be displayed with diversion route utilising U- turns and competing roads in the influence area.
5. Micro simulation in real timehas identified conflict areas and its output has been taken to manage conflict areas by redesigning the Islands and channelization/widening road to ensure efficient merging.
6. Pedestrian signals should be synchronized at intersections with progressive time management for efficiency of traffic and pedestrians flow.
7. Emergency Lane is provided for break-down vehicles and Police surveillance inside tunnel. The median opening is provided at a distance of 60 mts all along Tunnel for emergency exit of vehicles. It is also recommendations to provide surveillance Cameras, Telephone booths, Fire extinguishers and ventilation systems.
8. The slip road for entry to Basement parking should be managed efficiently to avoid queuing in main tunnel. The holding area is capacity compatible yet breakdown vehicle on slip road to tunnel should be towed away immediately to avoid queuing in main tunnel specially during event time. The exit Gates should be controlled in real time with VMS guiding and controlling exit on Ring Road/Bhairon Marg.
9. All Intersections should have movable barriers to provide way for VVIP movements and operation of vehicles during emergency or during closure of Tunnel.
10. Drops and Pick-ups for ITPO events should be under ITPO in space provided for taxi parking and pick-ups/Drop offs.

ANNEXURE

Integrated transit corridor development and street network/connectivity plan for the corridor/influence zone along with detailed design of all intersections & Mid sections based on traffic and feasibility studies for corridor/network.
PWD
VKS INFRATECH MANAGEMENT PVT. LTD50
LIST OF CONTENTS Traffic Survey and Analysis Page 1.1 Introduction 2 1.2 Project Location 3 1.3 Traffic Survey Location 3 1.4 Traffic Volume Survey And Analysis 7 1.5 Vehicle Classification System 8 1.6 Traffic Surveys 8 1.6.1 Manual Classified Counts 8 1.6.2 Mid Block Volume Counts 8 1.6.2.1 Average Daily Traffic (ADT) 9 1.6.2.2 Traffic Composition 15 1.6.2.3 Day Wise Traffic Variation 22 1.6.2.4 Hourly Variation And Peak Hour Traffic 26 1.6.3 Turning Movement Count Surveys 32 1.6.3.1 Traffic Composition 34 1.6.3.2 Hourly Variation And Peak Hour Traffic 41 1.6.4 Pedestrian Survey 55 1.6.5 Bus stop Boarding-Alighting Survey 56 1.6.6 Metro Station Boarding-Alighting Survey 56 1.6.7 Auto Rickshaw Stop Boarding-Alighting Survey 57 1.6.8 Parking Survey 58

Integrated transit corridor development and street network/connectivity plan for the corridor/influence zone along with detailed design of all intersections & Mid sections based on traffic and feasibility studies for corridor/network.
PWD
VKS INFRATECH MANAGEMENT PVT. LTD51
TRAFFIC SURVEYS AND ANALYSIS
INTRODUCTION
The feasibility study of integrated transit corridor development and street network/connectivity plan for the corridor/influence zone along with detailed design of all intersections & Mid sections based on traffic and feasibility studies for corridor/network.
Critical to making decisions about interchange schemes and final alignment is the input regarding driver choices. If this corridor is not constructed, how will motorists whose normal route is available get to their destinations? Must motorists look for new driving options, or are transit options practicable?
PWD recognized the importance of gathering information required to answer these and a Variety of other questions. As such, TOR recommended Number of Traffic surveys to extract this information from the most direct source – the motorists currently using alternate routes.This Chapter deals with the traffic studies undertaken and the analysis thereafter. In order to make a realistic assessment of the existing situation and estimation of the traffic on project road, the following surveys were carried out:-
1. Mid-Block Manual Classified Count surveys
2. Junction Volume Counts or Intersection Turning Movement Survey
3. Pedestrian Survey
4. Boarding-Alighting Survey
5. Parking Survey

Integrated transit corridor development and street network/connectivity plan for the corridor/influence zone along with detailed design of all intersections & Mid sections based on traffic and feasibility studies for corridor/network.
PWD
VKS INFRATECH MANAGEMENT PVT. LTD52
PROJECT LOCATION
TRAFFIC SURVEY LOCATIONS Traffic Surveys are thus carried out to assess the nature and magnitude of the traffic. The traffic currently using alternate routes is characterized by a variety of transport modes. The type of surveys along with locations are shown in Figure .1.1 and are presented in Table 1.1
Table 1-2: Details of Traffic Survey Locations.
S.No Location Road (Both sides) Date/Day Duration of
Survey
I. Mid-Block Manual Classified Count surveys
1 Ring Road Near X-ing of Bhairon Marg
03rd and 4th Jan 2017,Tuesday &
Wednesday
24 Hour, 2 Day
2 Pragati Maidan Gate No-5 Pragati_Maidan-Nizamuddin
03rd and 4th Jan 2017,Tuesday &
Wednesday
24 Hour, 2 Day

Integrated transit corridor development and street network/connectivity plan for the corridor/influence zone along with detailed design of all intersections & Mid sections based on traffic and feasibility studies for corridor/network.
PWD
VKS INFRATECH MANAGEMENT PVT. LTD53
S.No Location Road (Both sides) Date/Day Duration of
Survey
3 Bhiaron Marg Ring_Road-Mathura road
03rd and 4th Jan 2017,Tuesday &
Wednesday
24 Hour, 2 Day
4 Bahadur shah Zafar Marg ITO-Nizamuddin 5th and 6th Jan
2017,Thursday & Friday 24 Hour, 2 Day
5 Subramanium Marg JLN stadium-Mathura Road
5th and 6th Jan 2017,Thursday & Friday
24 Hour, 2 Day
6 Purana Qila Road Near X-ing with Mathura road
5th and 6th Jan 2017,Thursday & Friday
24 Hour, 2 Day
7 Shershah Road Near X-ing with Mathura road
10th and 11th Jan 2017,Tuesday &
Wednesday
24 Hour, 2 Day
8 Tilak Road W.junction-Mathura Road
10th and 11th Jan 2017,Tuesday &
Wednesday
24 Hour, 2 Day
9 Sikandra Road W junction 10th and 11th Jan 2017,Tuesday &
Wednesday
24 Hour, 2 Day
II. Turning Movement Surveys
1 Near Purana Quila Mathura Road-Shershah Road (Three arm Intersection)
19.12.2016,Monday 16 Hour, 1 Day
2 Near Purana Quila Mathura Road-Bhairon Marg (Three arm Intersection)
19.12.2016,Monday 16 Hour, 1 Day
3 Near Government office colony
Mathura Road-Purana Quila Road (Three arm Intersection)
20.12.2016,Tuesday 16 Hour, 1 Day
4 Near Pragati maidangate-No-7
Marhura Rd. & Bhagwan Das Rd. (Three arm Intersection)
20.12.2016,Tuesday 16 Hour, 1 Day
5 Near Milienium Park Ring Road- Bhairon Marg (Three arm Intersection)
21.12.2016,Wednesday 16 Hour, 1 Day

Integrated transit corridor development and street network/connectivity plan for the corridor/influence zone along with detailed design of all intersections & Mid sections based on traffic and feasibility studies for corridor/network.
PWD
VKS INFRATECH MANAGEMENT PVT. LTD54
S.No Location Road (Both sides) Date/Day Duration of
Survey
6 Near sundar nagar Subramanyam Marg & Mathura Road (Three arm Intersection)
21.12.2016,Wednesday 16 Hour, 1 Day
7 W.Junction (Four arms Intersection)
21.12.2016,Wednesday 16 Hour, 1 Day
8 C-HEXAGON -PURANA QUILA ROAD
Three Arms 27.03.2017, Mondaay 16 Hour, 1 Day
9 C-HEXAGON- Shershah Road
Three Arms 27.03.2017, Mondaay
16 Hour, 1 Day
10 Mathura Road (Near DPS)
Three Arms 27.03.2017, Mondaay
16 Hour, 1 Day
III. Intersection Pedestrian Survey
1 Near Purana Quila Mathura Road-Shershah Road
6.01.2017,Friday 16 Hour, 1 Day
2 Near Purana Quila Mathura Road-Bhairon Marg
6.01.2017,Friday 16 Hour, 1 Day
3 Near Government office colony
Mathura Road-Purana Quila Road
6.01.2017,Friday 16 Hour, 1 Day
4 Near Pragati maidangate-No-7
Marhura Rd. & Bhagwan Das Rd.
6.01.2017,Friday 16 Hour, 1 Day
5 Near Milienium Park Ring Road- Bhairon Marg
6.01.2017,Friday 16 Hour, 1 Day
6 Dr. Dinesh Dalmia chowk 6.01.2017,Friday 16 Hour, 1 Day
IV. FOB Pedestrian Survey
1 Purana Quila NearTMC-2 Mathura Road-Bhairon Marg
9.01.2017,Monday 16 Hour, 1 Day
2 Near Pragati maidangate-No-7 Near TMC-4
Marhura Rd. & Bhagwan Das Rd.
9.01.2017,Monday 16 Hour, 1 Day
3 Dr. Dinesh Dalmia chowk 9.01.2017,Monday 16 Hour, 1 Day
V. Bus Stop Boarding - Alighting Survey
1 National Stadium Towards 10.01.2017,Tuesday 16 Hour, 1 Day

Integrated transit corridor development and street network/connectivity plan for the corridor/influence zone along with detailed design of all intersections & Mid sections based on traffic and feasibility studies for corridor/network.
PWD
VKS INFRATECH MANAGEMENT PVT. LTD55
S.No Location Road (Both sides) Date/Day Duration of
Survey
ITO
2 National Stadium Towards Nizamuddin
10.01.2017,Tuesday 16 Hour, 1 Day
3 Pargati Maidan Near Gate No. 5 Towards ITO
10.01.2017,Tuesday 16 Hour, 1 Day
4 Pargati Maidan Near Gate No. 5 Towards Nizamuddin
10.01.2017,Tuesday 16 Hour, 1 Day
5 ITPO Pargati Maidan Towards ITO
10.01.2017,Tuesday 16 Hour, 1 Day
6 ITPO Pargati Maidan Towards Nizamuddin
10.01.2017,Tuesday 16 Hour, 1 Day
7 Pargati Maidan Infront of Supreme Court (Towards ITO)
10.01.2017,Tuesday 16 Hour, 1 Day
8 Pargati Maidan infront of Supreme Court (Towards Nizamuddin)
10.01.2017,Tuesday 16 Hour, 1 Day
9 Purana Quila Bhiron Marg Towards Ring Road
10.01.2017,Tuesday 16 Hour, 1 Day
10 Purana Quila Bhiron Marg Towards Nizamuddin
10.01.2017,Tuesday 16 Hour, 1 Day
VI. Metro Station Boarding - Alighting Survey
1 Pargati Maidan Metro Station
(IN+OUT) 9.01.2017,Monday 16 Hour, 1 Day
2 Inderprastha Metro Station (IN+OUT) 9.01.2017,Monday 16 Hour, 1 Day
VII. Auto & Rickshaw Stop Boading-Alighting
1 Pargati Maidan Metro Station
On Mathura road 11.1.2017,Wednesday 16 Hour, 1 Day
2 Indraprashta Metro Station On Ring road 11.1.2017,Wednesday 16 Hour, 1 Day
VIII. Parking Survey
1 Purana Quila Road Parking (off street) 12.1.2017,Thursday 12 Hour, 1 Day
2 Parking_Bhagwan Das (on street) Left Side 12.1.2017,Thursday 12 Hour, 1 Day

Integrated transit corridor development and street network/connectivity plan for the corridor/influence zone along with detailed design of all intersections & Mid sections based on traffic and feasibility studies for corridor/network.
PWD
VKS INFRATECH MANAGEMENT PVT. LTD56
S.No Location Road (Both sides) Date/Day Duration of
Survey
Road
3 Parking_Bhagwan Das Road
(on street) Right Side 12.1.2017,Thursday 12 Hour, 1 Day
4 Parking_Inderprastha Metro Station
(off street) 12.1.2017,Thursday 12 Hour, 1 Day
5 Parking_Pargati Maidan Metro Station
(off street) 12.1.2017,Thursday 12 Hour, 1 Day
6 Prgati Maidan Metro Stn. Prking
(off street) 12.1.2017,Thursday 12 Hour, 1 Day
7 Purana Quila Road Parking (off Street) 12.1.2017,Thursday 12 Hour, 1 Day
Figure 1.1 Traffic Survey Locations
TRAFFIC VOLUME SURVEY AND ANALYSIS
The data collected from primary and secondary sources are recorded in Excel sheets, compiled, checked and corrected before further proceeding for analysis. Traffic data analysis has been carried out, to understand traffic characteristics and travel pattern in the study area and to provide basic input for design.
VEHICLE CLASSIFICATION SYSTEM
The vehicle classification used in the survey along with their PCU values, as suggested in IRC: 106, are presented in the following Table 1.2

Integrated transit corridor development and street network/connectivity plan for the corridor/influence zone along with detailed design of all intersections & Mid sections based on traffic and feasibility studies for corridor/network.
PWD
VKS INFRATECH MANAGEMENT PVT. LTD57
Table 1.2: Vehicle Classification and PCU Factors
Vehicle Type PCU Factor 2 Wheler 0.75 3 wheeler - Auto 2.0 Car/Jeep /Van 1 Truck or Bus 3.7 LCV 2.0 Tractor with Trailer 4.0 Cycle 0.4 Cycle Rickshaw 1.5
TRAFFIC SURVEYS
Manual Classified counts While the area most affected physically by this project is the section of Ring road, Mathura Road, it is reasonable to assume that the impacts to motorists causing traffic diversions would extend to the nearest influence area and will cause a travel pattern based on capacity constraint assignment principle and hence, the survey was conducted at these locations.
Each survey location was examined in the field to locate areas where surveyors could safely distribute survey forms when vehicles come to a stop.
Manual Traffic Surveys are carried out to assess the nature and magnitude of the traffic. The traffic along the corridor is characterized by a variety of transport modes. A number of traffic surveys have been carried out on the road after having made detailed reconnaissance study. Manual Mid-block traffic volume counts are carried out for 16 hours. A detailed proforma ( given in Annexure-I) having Auto Rickshaw, Bus, Mini buses, Trucks, Two and Three wheelers, Cycles, Trucks etc. types of vehicles was used for the data collection purpose. The enumerators were imparted thorough training before conducting the surveys.
Mid block Volume Counts At nine locations mid block classified volume counts were carried out for one days round the clock. A detailed Performa ( given in Annexure-I) having Auto Rickshaw, Bus, Mini buses, Trucks, Two and Three wheelers, Cycles, Trucks etc. types of vehicles was used for the data collection purpose. The enumerators were imparted through training before conducting the surveys.
Table 1.3: Mid-Block Survey Locations
Location No. Mid-Block Locations
1 Ring Road
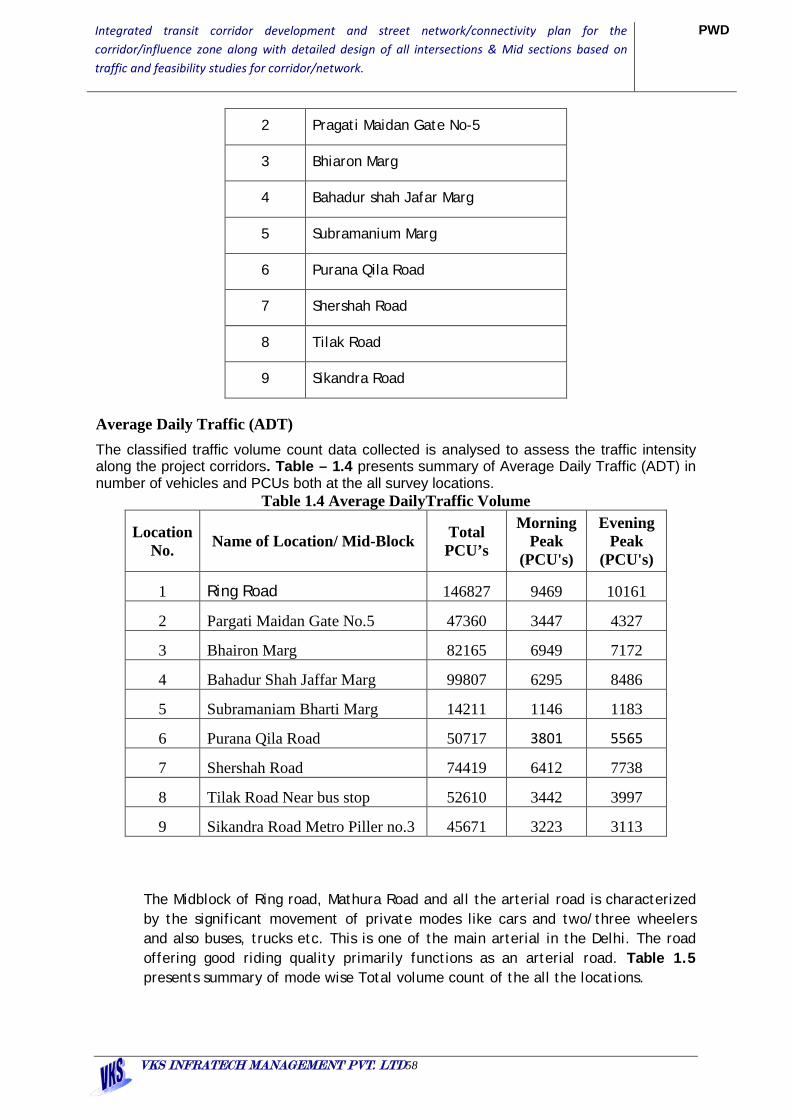
Integrated transit corridor development and street network/connectivity plan for the corridor/influence zone along with detailed design of all intersections & Mid sections based on traffic and feasibility studies for corridor/network.
PWD
VKS INFRATECH MANAGEMENT PVT. LTD58
2 Pragati Maidan Gate No-5
3 Bhiaron Marg
4 Bahadur shah Jafar Marg
5 Subramanium Marg
6 Purana Qila Road
7 Shershah Road
8 Tilak Road
9 Sikandra Road
Average Daily Traffic (ADT) The classified traffic volume count data collected is analysed to assess the traffic intensity along the project corridors. Table – 1.4 presents summary of Average Daily Traffic (ADT) in number of vehicles and PCUs both at the all survey locations.
Table 1.4 Average DailyTraffic Volume
Location No. Name of Location/ Mid-Block Total
PCU’s
Morning Peak
(PCU's)
Evening Peak
(PCU's)
1 Ring Road 146827 9469 10161
2 Pargati Maidan Gate No.5 47360 3447 4327
3 Bhairon Marg 82165 6949 7172
4 Bahadur Shah Jaffar Marg 99807 6295 8486
5 Subramaniam Bharti Marg 14211 1146 1183
6 Purana Qila Road 50717 3801 5565
7 Shershah Road 74419 6412 7738
8 Tilak Road Near bus stop 52610 3442 3997
9 Sikandra Road Metro Piller no.3 45671 3223 3113
The Midblock of Ring road, Mathura Road and all the arterial road is characterized by the significant movement of private modes like cars and two/three wheelers and also buses, trucks etc. This is one of the main arterial in the Delhi. The road offering good riding quality primarily functions as an arterial road. Table 1.5 presents summary of mode wise Total volume count of the all the locations.

Integrated transit corridor development and street network/connectivity plan for the corridor/influence zone along with detailed design of all intersections & Mid sections based on traffic and feasibility studies for corridor/network.
PWD
VKS INFRATECH MANAGEMENT PVT. LTD1
Table 1.5 CLASSIFIED TRAFFIC VOLUME COUNT AT MID - BLOCKS Sr. No.
LOCATION NAME
FAST MOVING PASSENGER VEHICLES Total Fast
GOODS VEHICLES Total
Goods
SLOW MOVING VEHICLES Grand Total (Nos.)
Grand Total
(PCU's) Car/Jeep/V
an
Two Wheeler
s Auto Bus Mini
Bus Truck LCV MAV Cycles Rickshaw
Others
Total Slow
1 Ring Road-Bhairon
marg
24 Hrs. Day-1 Tuesday 74724 38934 14988 3834 1503 13398
3 7144 2971 55 10170 283 131 221 635 14478
8 14639
9
Volume Count
Day-2 Wednesday 75087 39053 14961 3812 1612 13452
5 7249 2983 55 10287 294 131 221 646 14504
2 14725
5
ADT 74906 38994 14975 3823 1558 134254 7197 2977 55 1022
9 289 131 221 641 144915
146827
COMPOSITION 51.69 26.91 10.33 2.64 1.07 92.64 4.97 2.05
0.04 7.06 0.20 0.09 0.15 0.44
100.00
Morning Peak BOTH DIRECTION 4576 2328 785 248 223 8160 304 297 15 616 5 7 23 35 8811 9469
11.00-12.00 COMPOSITION 51.94 26.42 8.91 2.81 2.53 92.61 3.45 3.37
0.17 6.99 0.06 0.08 0.26 0.40
100.00
Evening Peak BOTH DIRECTION 5395 3004 1150 222 75 9846 522 122 0 644 19 1 14 34 10524 10161
17:00-18:00 COMPOSITION 51.26 28.54 10.93 2.11 0.71 93.56 4.96 1.16
0.00 6.12 0.18 0.01 0.13 0.32
100.00
2 Pargati Maidan Gate No.5
24 Hrs. Day-1 Tuesday 18364 12692 6261 3950 292 41559 440 480 0 920 557 189 45 783 43262 46562
Volume Count
Day-2 Wednesday 18512 12931 6574 4252 312 42581 456 495 0 951 522 188 45 747 44279 48158
ADT 18438 12811.5 6417.5 4101 302 42070 448 487.
5 0 935.5 539.5 188.5 45 765 43771 47360
COMPOSITION 42.12 29.27 14.66 9.37 0.69 96.11 1.02 1.11
0.00 2.14 1.23 0.43 0.10 1.75
100.00
Morning Peak BOTH DIRECTION 937 1036 607 400 20 3000 13 13 0 26 54 14 4 72 3098 3447

Integrated transit corridor development and street network/connectivity plan for the corridor/influence zone along with detailed design of all intersections & Mid sections based on traffic and feasibility studies for corridor/network.
PWD
VKS INFRATECH MANAGEMENT PVT. LTD2
8.30-9.30 COMPOSITION 30.25 33.44 19.59 12.91 0.65 96.84 0.42 0.42
0.00 0.84 1.74 0.45 0.13 2.32
100.00
Evening Peak BOTH DIRECTION 2039 1388 462 307 18 4214 20 17 0 37 49 16 6 71 4322 4327
17:45-18:45 COMPOSITION 47.18 32.11 10.69 7.10 0.42 97.50 0.46 0.39
0.00 0.86 1.13 0.37 0.14 1.64
100.00
3 Bhairon Marg
24 Hrs. Day-1 Tuesday 40578 21825 6519 2403 1974 73299 2318 1536 0 3854 1168 393 107 1668 78821 80880.
5
Volume Count
Day-2 Wednesday 41006 21977 6829 3001 1859 74672 2304 1504 0 3808 1267 651 104 2022 80502 83449.
5
ADT 40792 21901 6674 2702 1916.5
73985.5 2311 1520 0 3831 1217.
5 522 105.5 1845 79662 82165
COMPOSITION 51.21 27.49 8.38 3.39 2.41 92.87 2.90 1.91
0.00 4.81 1.53 0.66 0.13 2.32
100.00
Morning Peak
BOTH DIRECTION 3363 1810 633 307 188 6301 156 67 0 223 112 24 8 144 6668 6949
9.00-10.00 COMPOSITION 50.43 27.14 9.49 4.60 2.82 94.50 2.34 1.00
0.00 3.34 1.68 0.36 0.12 2.16
100.00
Evening Peak
BOTH DIRECTION 4521 1550 405 192 134 6802 127 64 0 191 82 34 4 120 7113 7172
17:00-18:00 COMPOSITION 63.56 21.79 5.69 2.70 1.88 95.63 1.79 0.90
0.00 2.69 1.15 0.48 0.06 1.69
100.00
4 Bahadur Shah Jaffar Marg
24 Hrs. Day-1 Thursday 50784 27108 13096 5860 625 97473 790 441 0 1231 726 772 0 1498 10020
2 10091
8
Volume Count Day-2 Friday 49422 26930 12753 5759 623 95487 787 419 0 1206 671 758 0 1429 98122 98696
ADT 50103 27019 12924.5
5809.5 624 96480 788.
5 430 0 1218.5 698.5 765 0 1463.
5 99162 99807
COMPOSITION 50.53 27.25 13.03 5.86 0.63 97.30 0.80 0.43
0.00 1.23 0.70 0.77 0.00 1.48
100.00
Morning Peak BOTH DIRECTION 2765 2008 959 377 51 6160 35 16 0 51 104 87 0 191 6402 6295

Integrated transit corridor development and street network/connectivity plan for the corridor/influence zone along with detailed design of all intersections & Mid sections based on traffic and feasibility studies for corridor/network.
PWD
VKS INFRATECH MANAGEMENT PVT. LTD3
8.45-9.45 COMPOSITION 43.19 31.37 14.98 5.89 0.80 96.22 0.55 0.25
0.00 0.80 1.62 1.36 0.00 2.98
100.00
Evening Peak BOTH DIRECTION 4956 2562 905 324 49 8796 40 10 0 50 74 65 0 139 8985 8486
17:15-18:15 COMPOSITION 55.16 28.51 10.07 3.61 0.55 97.90 0.45 0.11
0.00 0.56 0.82 0.72 0.00 1.55
100.00
5 Subramaniam Bharti Marg
24 Hrs. Day-1 Tuesday 5678 3413 2082 1200 29 12402 18 45 0 63 383 13 14 410 12875 13590
Volume Count
Day-2 Wednesday 6249 3537 2243 1331 46 13406 19 46 0 65 383 13 14 410 13881 14832
ADT 5964 3475 2163 1266 38 12904 19 46 0 64 383 13 14 410 13378 14211
COMPOSITION 44.58 25.98 16.16 9.46 0.28 96.46 0.14 0.34
0.00 0.48 2.86 0.10 0.10 3.06
100.00
Morning Peak BOTH DIRECTION 624 312 100 85 0 1121 0 1 0 1 16 0 0 16 1138 1146
10.00-11.00 COMPOSITION 54.83 27.42 8.79 7.47 0.00 98.51 0.00 0.09
0.00 0.09 1.41 0.00 0.00 1.41
100.00
Evening Peak BOTH DIRECTION 509 250 205 84 4 1052 1 8 0 9 90 3 1 94 1155 1183
17:00-18:00 COMPOSITION 44.07 21.65 17.75 7.27 0.35 91.08 0.09 0.69
0.00 0.78 7.79 0.26 0.09 8.14
100.00
6 Purana Quila Road
24 Hrs. Day-1 Tuesday 33314 11880 7895 491 383 53963 154 162 0 316 419 0 0 419 54698 50698
Volume Count
Day-2 Wednesday 32945 11932 7850 568 424 53719 162 175 0 337 463 0 0 463 54519 50737
ADT 33129.5 11906 7872.5 529.5 403.5 53841 158 168.5 0 326.5 441 0 0 441 54609 50717
COMPOSITION 60.67 21.80 14.42 0.97 0.74 98.59 0.29 0.31
0.00 0.60 0.81 0.00 0.00 0.81
100.00
Morning Peak BOTH DIRECTION 2259 937 759 39 38 4032 14 13 0 27 46 0 0 46 4105 3801
9.30-10.30 COMPOSITION 55.03 22.83 18.49 0.95 0.93 98.22 0.34 0.32
0.00 0.66 1.12 0.00 0.00 1.12
100.00
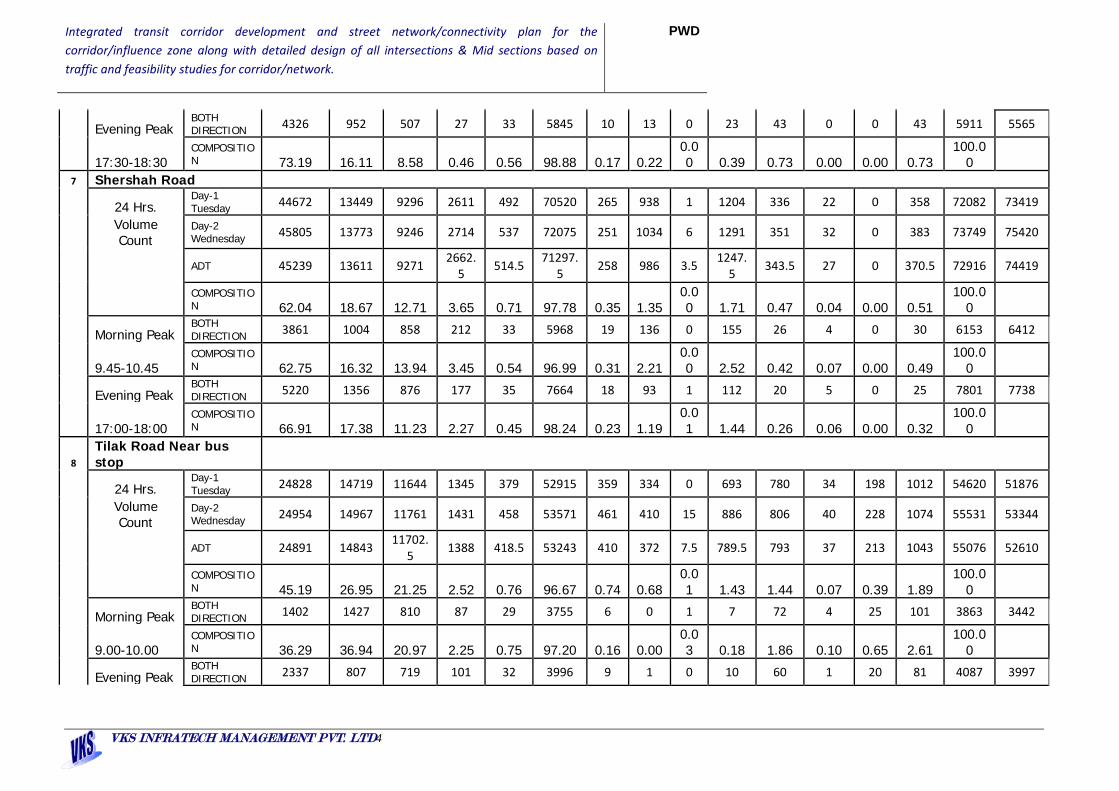
Integrated transit corridor development and street network/connectivity plan for the corridor/influence zone along with detailed design of all intersections & Mid sections based on traffic and feasibility studies for corridor/network.
PWD
VKS INFRATECH MANAGEMENT PVT. LTD4
Evening Peak BOTH DIRECTION 4326 952 507 27 33 5845 10 13 0 23 43 0 0 43 5911 5565
17:30-18:30 COMPOSITION 73.19 16.11 8.58 0.46 0.56 98.88 0.17 0.22
0.00 0.39 0.73 0.00 0.00 0.73
100.00
7 Shershah Road
24 Hrs. Day-1 Tuesday 44672 13449 9296 2611 492 70520 265 938 1 1204 336 22 0 358 72082 73419
Volume Count
Day-2 Wednesday 45805 13773 9246 2714 537 72075 251 1034 6 1291 351 32 0 383 73749 75420
ADT 45239 13611 9271 2662.5 514.5 71297.
5 258 986 3.5 1247.5 343.5 27 0 370.5 72916 74419
COMPOSITION 62.04 18.67 12.71 3.65 0.71 97.78 0.35 1.35
0.00 1.71 0.47 0.04 0.00 0.51
100.00
Morning Peak BOTH DIRECTION 3861 1004 858 212 33 5968 19 136 0 155 26 4 0 30 6153 6412
9.45-10.45 COMPOSITION 62.75 16.32 13.94 3.45 0.54 96.99 0.31 2.21
0.00 2.52 0.42 0.07 0.00 0.49
100.00
Evening Peak BOTH DIRECTION 5220 1356 876 177 35 7664 18 93 1 112 20 5 0 25 7801 7738
17:00-18:00 COMPOSITION 66.91 17.38 11.23 2.27 0.45 98.24 0.23 1.19
0.01 1.44 0.26 0.06 0.00 0.32
100.00
8 Tilak Road Near bus stop
24 Hrs. Day-1 Tuesday 24828 14719 11644 1345 379 52915 359 334 0 693 780 34 198 1012 54620 51876
Volume Count
Day-2 Wednesday 24954 14967 11761 1431 458 53571 461 410 15 886 806 40 228 1074 55531 53344
ADT 24891 14843 11702.5 1388 418.5 53243 410 372 7.5 789.5 793 37 213 1043 55076 52610
COMPOSITION 45.19 26.95 21.25 2.52 0.76 96.67 0.74 0.68
0.01 1.43 1.44 0.07 0.39 1.89
100.00
Morning Peak BOTH DIRECTION 1402 1427 810 87 29 3755 6 0 1 7 72 4 25 101 3863 3442
9.00-10.00 COMPOSITION 36.29 36.94 20.97 2.25 0.75 97.20 0.16 0.00
0.03 0.18 1.86 0.10 0.65 2.61
100.00
Evening Peak BOTH DIRECTION 2337 807 719 101 32 3996 9 1 0 10 60 1 20 81 4087 3997

Integrated transit corridor development and street network/connectivity plan for the corridor/influence zone along with detailed design of all intersections & Mid sections based on traffic and feasibility studies for corridor/network.
PWD
VKS INFRATECH MANAGEMENT PVT. LTD5
18:00-19:00 COMPOSITION 57.18 19.75 17.59 2.47 0.78 97.77 0.22 0.02
0.00 0.24 1.47 0.02 0.49 1.98
100.00
9 Sikandra Road Metro Piller no.3
24 Hrs. Day-1 Tuesday 21581 14464 5651 2068 582 44346 648 311 0 959 652 284 98 1034 46339 45119
Volume Count
Day-2 Wednesday 22383 14781 5849 2079 574 45666 654 319 0 973 633 280 83 996 47635 46223
ADT 21982 14622.5 5750 2073.
5 578 45006 651 315 0 966 642.5 282 90.5 1015 46987 45671
COMPOSITION 46.78 31.12 12.24 4.41 1.23 95.78 1.39 0.67
0.00 2.06 1.37 0.60 0.19 2.16
100.00
Morning Peak BOTH DIRECTION 1370 1580 539 104 48 3641 21 0 0 21 25 13 1 39 3701 3223
9.30-10.30 COMPOSITION 37.02 21.47 6.26 1.16 0.27 99.04 0.25 0.03 0.0
0 0.28 0.42 0.24 0.01 0.68 100.00
Evening Peak BOTH DIRECTION 1899 701 315 127 17 3059 16 3 0 19 59 15 7 81 3159 3113
18:30-19:30 COMPOSITION 60.11 22.19 9.97 4.02 0.54 96.83 0.51 0.09
0.00 0.60 1.87 0.47 0.22 2.56
100.00

Integrated transit corridor development and street network/connectivity plan for the corridor/influence zone along with detailed d Mid sections based on traffic and feasibility studies for corridor/network.
VKS INFRATECH MANAGEMENT PVT. LTD6
Traffic Composition Table 1.6 to 1.14: shows traffic composition in percentage at the count station and the same is presented in the form of pie chart in Fig 1.1 to 1.9 for all the survey locations.
1. Ring Road near X-ing –Bhairon Marg Table 1.6: Traffic Composition
Vehicles Composition % Car/Jeep/Van 51.69
2-Wh 26.91 Auto 10.33 Bus 2.64
M_Bus 1.07 LCV 4.97 Truck 2.05 MAV 0.04 Cycle 0.20 Rick 0.09
Other (S) 0.15
Fig 1.1 Traffic Compositions
2. Mathura Road-Pargati Maidan Near Gate-5 Table 1.7: Traffic Composition
Vehicles Composition % Car/Jeep/Van 42.12
2-Wh 29.27 Auto 14.66 Bus 9.37
M_Bus 0.69 LCV 1.02 Truck 1.11 MAV 0.00 Cycle 1.53
51.62% 26.87%
10.32%
2.63% 1.07%
4.96%
2.05% 0.04%
0.20% 0.09% 0.15%
Composition % at _ Ring Road-Bhairon Marg
Car/Jeep/Van2-WhAutoBusM_BusLCVTruckMAVCycle

Integrated transit corridor development and street network/connectivity plan for the corridor/influence zone along with detailed d Mid sections based on traffic and feasibility studies for corridor/network.
VKS INFRATECH MANAGEMENT PVT. LTD7
Vehicles Composition % Rick 0.66
Other (S) 0.10
Fig 1.2 Traffic Compositions
3. Bhiaron Marg Table 1.8: Traffic Composition
Vehicles Composition % Car/Jeep/Van 51.21
2-Wh 27.49 Auto 8.38 Bus 3.39
M_Bus 2.41 LCV 2.90 Truck 1.91 MAV 0.00 Cycle 1.53 Rick 0.66
Other (S) 0.13

Integrated transit corridor development and street network/connectivity plan for the corridor/influence zone along with detailed d Mid sections based on traffic and feasibility studies for corridor/network.
VKS INFRATECH MANAGEMENT PVT. LTD8
Fig 1.3 Traffic Compositions
4. Bhadur Shah Zafar Marg Table 1.9: Traffic Composition
Vehicles Composition % Car/Jeep/Van 50.53
2-Wh 27.25 Auto 13.03 Bus 5.86
M_Bus 0.63 LCV 0.80 Truck 0.43 MAV 0.00 Cycle 0.70 Rick 0.77
Other (S) 0.00
Fig 1.4 Traffic Compositions

Integrated transit corridor development and street network/connectivity plan for the corridor/influence zone along with detailed d Mid sections based on traffic and feasibility studies for corridor/network.
VKS INFRATECH MANAGEMENT PVT. LTD9
5. Subramanium Road Table 1.10: Traffic Composition
Vehicles Composition % Car/Jeep/Van 44.58
2-Wh 25.98 Auto 16.16 Bus 9.46
M_Bus 0.28 LCV 0.14 Truck 0.34 MAV 0.00 Cycle 2.86 Rick 0.10
Other (S) 0.10
Fig 1.5 Traffic Compositions
6. Purana Quila Road Table 1.11: Traffic Composition
Vehicles Composition
% Car/Jeep/Van 60.67
2-Wh 21.80 Auto 14.42 Bus 0.97
M_Bus 0.74 LCV 0.29 Truck 0.31 MAV 0.00 Cycle 0.81 Rick 0.00
Other (S) 0.00

Integrated transit corridor development and street network/connectivity plan for the corridor/influence zone along with detailed d Mid sections based on traffic and feasibility studies for corridor/network.
VKS INFRATECH MANAGEMENT PVT. LTD10
Fig 1.6 Traffic Compositions
7. Shershah Road Table 1.12: Traffic Composition
Vehicles Composition % Car/Jeep/Van 63.64
2-Wh 17.96 Auto 12.16 Bus 3.22
M_Bus 0.62 LCV 0.31 Truck 1.63 MAV 0.00 Cycle 0.42 Rick 0.03
Other (S) 0.00
Fig 1.7 Traffic Compositions
60.67% 21.80%
14.42%
0.97% 0.74% 0.29% 0.31% 0.00% 0.81% 0.00%
0.00%
Composition % at _ Purana Quila Road Xing Mathura road
Car/Jeep/Van2-WhAutoBusM_BusLCVTruck
63.64% 17.96%
12.16%
3.22% 0.62%
0.31% 1.63% 0.00% 0.42%
0.03% 0.00%
Composition % at _ Shershah Road
Car/Jeep/Van2-WhAutoBusM_BusLCVTruckMAVCycle

Integrated transit corridor development and street network/connectivity plan for the corridor/influence zone along with detailed d Mid sections based on traffic and feasibility studies for corridor/network.
VKS INFRATECH MANAGEMENT PVT. LTD11
8. Tilak Road Table 1.13: Traffic Composition
Vehicles Composition % Car/Jeep/Van 45.19
2-Wh 26.95 Auto 21.25 Bus 2.52
M_Bus 0.76 LCV 0.74 Truck 0.68 MAV 0.01 Cycle 1.44 Rick 0.07
Other (S) 0.39
Fig 1.8 Traffic Compositions
9. Sikandar Road Table 1.14: Traffic Composition
Vehicles Composition % Car/Jeep/Van 46.78
2-Wh 31.12 Auto 12.24 Bus 4.41
M_Bus 1.23 LCV 1.39 Truck 0.67 MAV 0.00 Cycle 1.37 Rick 0.60
Other (S) 0.19

Integrated transit corridor development and street network/connectivity plan for the corridor/influence zone along with detailed d Mid sections based on traffic and feasibility studies for corridor/network.
VKS INFRATECH MANAGEMENT PVT. LTD12
Fig 1.9 Traffic Compositions

Integrated transit corridor development and street network/connectivity plan for the corridor/influence zone along with detailed d Mid sections based on traffic and feasibility studies for corridor/network.
VKS INFRATECH MANAGEMENT PVT. LTD13
Day Wise Traffic Variation The Day wise variation of traffic is presented in graphical form as given below.
1. Ring Road near X-ing –Bhairon Marg
Fig 1.10 Day wise variation of Total Traffic
2. Mathura Road-Pargati Maidan near Gate-5
Fig 1.11 Day wise variation of Total Traffic
144788 145042
146399
147255
144915 144915
146827 146827
143500
144000
144500
145000
145500
146000
146500
147000
147500
Tuesday Wednesday
Traf
fic in
Veh
icle
s
Day of the Week
Day-wise Variation of Traffic at_ Ring Road-Bhairon Marg
Total Veh.Total PCU'sADT-in Veh.ADT-in PCU

Integrated transit corridor development and street network/connectivity plan for the corridor/influence zone along with detailed d Mid sections based on traffic and feasibility studies for corridor/network.
VKS INFRATECH MANAGEMENT PVT. LTD14
3. Bhiaron Marg
Fig 1.12 Day wise variation of Total Traffic
4. Bhadur Shah Zafar Marg
Fig 1.13 Day wise variation of Total Traffic

Integrated transit corridor development and street network/connectivity plan for the corridor/influence zone along with detailed d Mid sections based on traffic and feasibility studies for corridor/network.
VKS INFRATECH MANAGEMENT PVT. LTD15
5. Subramanium Road
Fig 1.14 Day wise variation of Total Traffic
6. Purana Quila Road
Fig 1.15 Day wise variation of Total Traffic
12875
13881
13590
14832 13378 13378
14211 14211
11500
12000
12500
13000
13500
14000
14500
15000
Tuesday Wednesday
Traf
fic in
Veh
icle
s
Day of the Week
Day-wise Variation of Traffic at_ Subramanium Bharti Marg
Total Veh.Total PCU'sADT-in Veh.ADT-in PCU
54698 54519
50698 50737
54609 54609
50717 50717
48000
49000
50000
51000
52000
53000
54000
55000
Thursday Friday
Traf
fic in
Veh
icle
s
Day of the Week
Day-wise Variation of Traffic at_ Purana Quila Road xing Mathura road
Total Veh.
Total PCU's
ADT-in Veh.
ADT-in PCU

Integrated transit corridor development and street network/connectivity plan for the corridor/influence zone along with detailed d Mid sections based on traffic and feasibility studies for corridor/network.
VKS INFRATECH MANAGEMENT PVT. LTD16
7. Tilak Road
Fig 1.16 Day wise variation of Total Traffic
8. Shershah Road
Fig 1.17 Day wise variation of Total Traffic
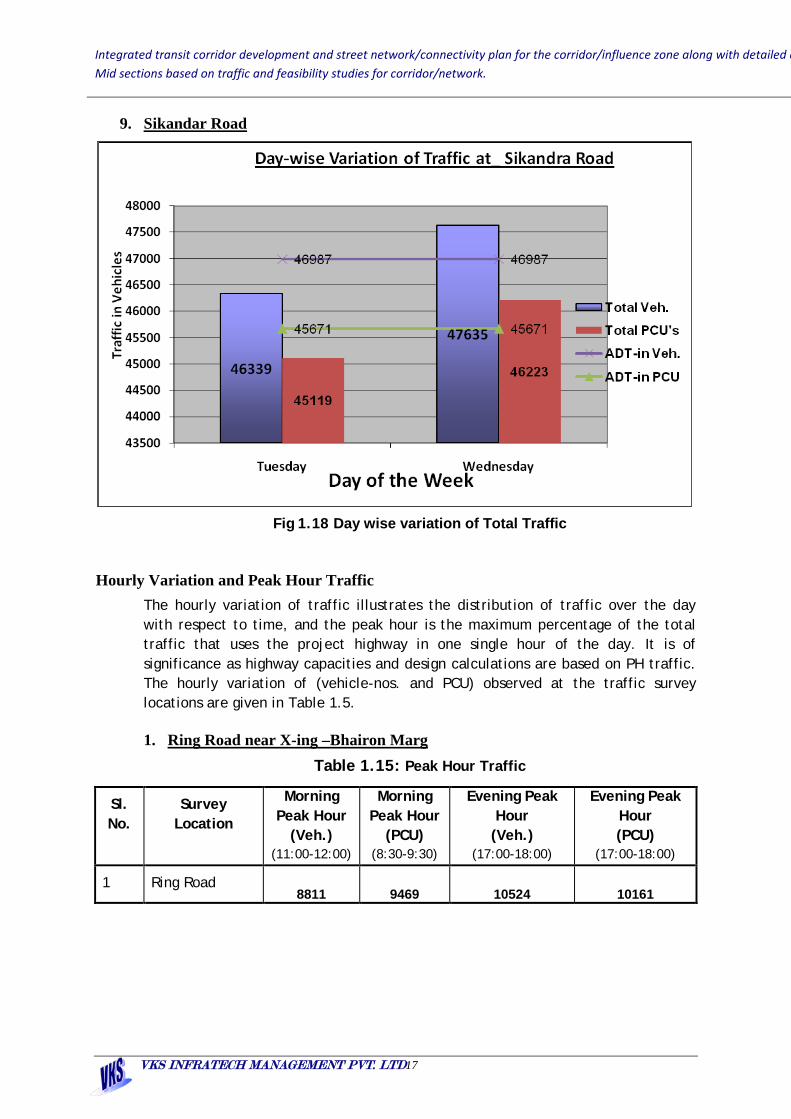
Integrated transit corridor development and street network/connectivity plan for the corridor/influence zone along with detailed d Mid sections based on traffic and feasibility studies for corridor/network.
VKS INFRATECH MANAGEMENT PVT. LTD17
9. Sikandar Road
Fig 1.18 Day wise variation of Total Traffic
Hourly Variation and Peak Hour Traffic The hourly variation of traffic illustrates the distribution of traffic over the day with respect to time, and the peak hour is the maximum percentage of the total traffic that uses the project highway in one single hour of the day. It is of significance as highway capacities and design calculations are based on PH traffic. The hourly variation of (vehicle-nos. and PCU) observed at the traffic survey locations are given in Table 1.5.
1. Ring Road near X-ing –Bhairon Marg Table 1.15: Peak Hour Traffic
Sl. No.
Survey Location
Morning Peak Hour
(Veh.) (11:00-12:00)
Morning Peak Hour
(PCU) (8:30-9:30)
Evening Peak Hour
(Veh.) (17:00-18:00)
Evening Peak Hour (PCU)
(17:00-18:00)
1 Ring Road 8811 9469 10524 10161

Integrated transit corridor development and street network/connectivity plan for the corridor/influence zone along with detailed d Mid sections based on traffic and feasibility studies for corridor/network.
VKS INFRATECH MANAGEMENT PVT. LTD18
Fig 1.18 Hourly Variations
2. Mathura Road-Pargati Maidan near Gate-5 Table 1.16: Peak Hour Traffic
Sl. No.
Survey Location Morning Peak Hour
(Veh.) (8:30-9:30)
Morning Peak Hour
(PCU) (8:30-9:30)
Evening Peak Hour
(Veh.) (17:45-18:45)
Evening Peak Hour (PCU)
(17:45-18:45)
1 Pragati Maidan 3098 3447 4322 4327
Fig 1.19 Hourly Variations
0
2000
4000
6000
8000
10000
12000
Hourly variation of Traffic at _Ring Road-Bhairo Marg
Nos. PCU's

Integrated transit corridor development and street network/connectivity plan for the corridor/influence zone along with detailed d Mid sections based on traffic and feasibility studies for corridor/network.
VKS INFRATECH MANAGEMENT PVT. LTD19
3. Bhiaron Marg Table 1.17: Peak Hour Traffic
Sl. No.
Survey Location Morning Peak Hour
(Veh.) (9:30-10:00)
Morning Peak Hour
(PCU) (9:30-10:00)
Evening Peak Hour
(Veh.) (17:00-18:00)
Evening Peak Hour (PCU)
(17:00-18:00)
1 Bhairon Marg 6668 6949 7113 7172
Fig 1.20 Hourly Variations
4. Bhadur Shah Zafar Marg Table 1.18: Peak Hour Traffic
Sl. No.
Survey Location Morning Peak Hour (Veh.) (8:45-9:45)
Morning Peak Hour (PCU)
(8:45-9:45)
Evening Peak Hour (Veh.)
(17:15-18:15)
Evening Peak Hour (PCU)
(17:15-18:15)
1 BSZ Road 6402 6295 8985 8486
Fig 1.21 Hourly Variations
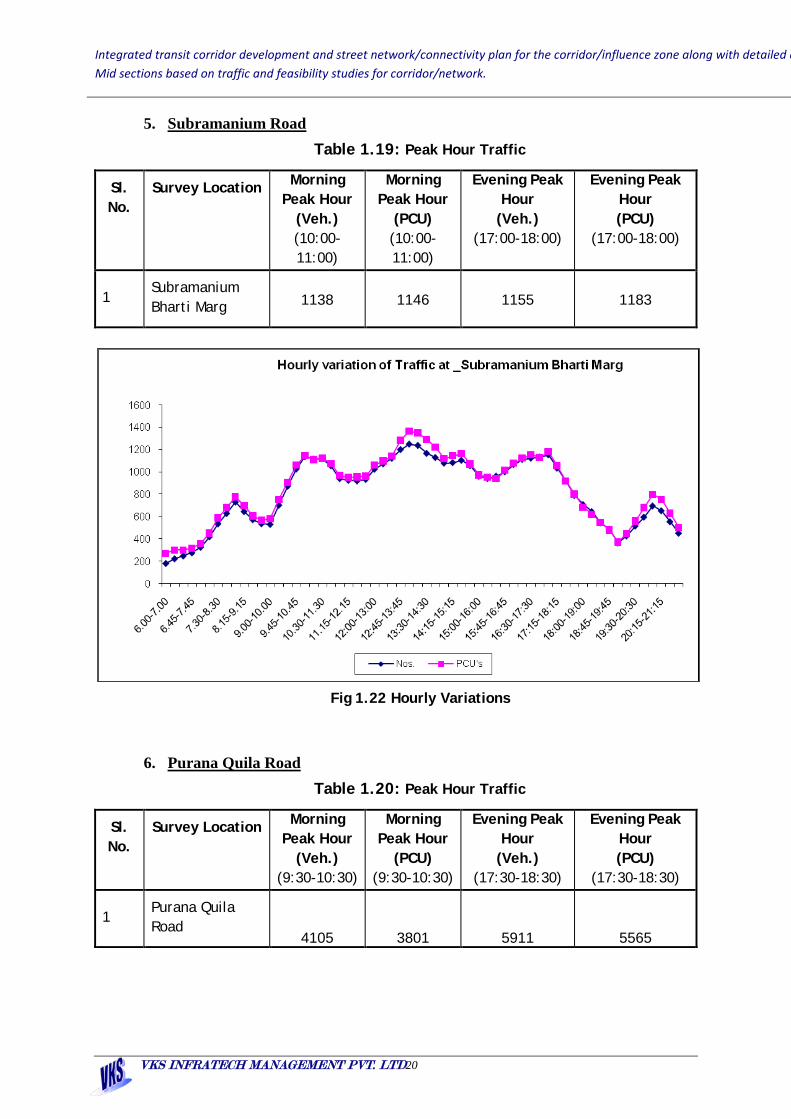
Integrated transit corridor development and street network/connectivity plan for the corridor/influence zone along with detailed d Mid sections based on traffic and feasibility studies for corridor/network.
VKS INFRATECH MANAGEMENT PVT. LTD20
5. Subramanium Road Table 1.19: Peak Hour Traffic
Sl. No.
Survey Location Morning Peak Hour
(Veh.) (10:00-11:00)
Morning Peak Hour
(PCU) (10:00-11:00)
Evening Peak Hour
(Veh.) (17:00-18:00)
Evening Peak Hour (PCU)
(17:00-18:00)
1 Subramanium Bharti Marg 1138 1146 1155 1183
Fig 1.22 Hourly Variations
6. Purana Quila Road Table 1.20: Peak Hour Traffic
Sl. No.
Survey Location Morning Peak Hour
(Veh.) (9:30-10:30)
Morning Peak Hour
(PCU) (9:30-10:30)
Evening Peak Hour
(Veh.) (17:30-18:30)
Evening Peak Hour (PCU)
(17:30-18:30)
1 Purana Quila Road
4105 3801 5911 5565

Integrated transit corridor development and street network/connectivity plan for the corridor/influence zone along with detailed d Mid sections based on traffic and feasibility studies for corridor/network.
VKS INFRATECH MANAGEMENT PVT. LTD21
Fig 1.23 Hourly Variations
7. Shershah Road Table 1.21: Peak Hour Traffic
Sl. No.
Survey Location Morning Peak Hour
(Veh.) (9:45-10:45)
Morning Peak Hour
(PCU) (9:45-10:45)
Evening Peak Hour
(Veh.) (17:30-18:30)
Evening Peak Hour (PCU)
(17:00-18:00)
1 Shershah Road 6153 6412 7801 7738
Fig 1.24 Hourly Variations
0
1000
2000
3000
4000
5000
6000
7000
Hourly variation of Traffic at _Purana Quila road xing Mathura road
Nos. PCU's
0
1000
2000
3000
4000
5000
6000
7000
8000
9000
Hourly variation of Traffic at _Shershah Road
Nos. PCU's

Integrated transit corridor development and street network/connectivity plan for the corridor/influence zone along with detailed d Mid sections based on traffic and feasibility studies for corridor/network.
VKS INFRATECH MANAGEMENT PVT. LTD22
8. Tilak Road Table 1.22: Peak Hour Traffic
Sl. No.
Survey Location Morning Peak Hour (Veh.) (9:00-10:00)
Morning Peak Hour (PCU)
(9:00-10:00)
Evening Peak Hour (Veh.)
(18:00-19:00)
Evening Peak Hour (PCU)
(18:00-19:00)
1 Pragati Maidan 3863 3442 4087 3997
Fig 1.25 Hourly Variations
9. Sikandar Road Table 1.22: Peak Hour Traffic
Sl. No.
Survey Location Morning Peak Hour (Veh.) (9:30-10:30)
Morning Peak Hour (PCU)
(9:30-10:30)
Evening Peak Hour (Veh.)
(18:30-19:30)
Evening Peak Hour (PCU)
(18:30-19:30)
1 Pragati Maidan 3701 3223 4322 4327
Fig 1.26 Hourly Variations

Integrated transit corridor development and street network/connectivity plan for the corridor/influence zone along with detailed d Mid sections based on traffic and feasibility studies for corridor/network.
VKS INFRATECH MANAGEMENT PVT. LTD23
Turning Movement Count Surveys At ten locations Turning movement counts surveys were carried out for one days
round the clock. A detailed proforma having Auto Rickshaw, Bus, Mini buses,
Trucks, Two and Three wheelers, Cycles, Trucks etc. types of vehicles was used for
the data collection purpose. The enumerators were imparted through training
before conducting the surveys.
Table Intersection Survey Locations Location No. Intersection Locations
1 Mathura Road & Shershah Road 2 Mathura Road & Bhairon Marg 3 Mathura Road & Purana Quila Road 4 Mathura Rd & Bhagwan das Rd. 5 Bhairon Marg & Ring Rd 6 Subramanyam Marg & Mathura Rd. 7 W.Junction 8 C-HEXAGON -PURANA QUILA ROAD 9 C-HEXAGON- Shershah Road 10 Mathura Road (Near DPS)
At ten locations turning moment counts were carried out for one day. The summary
of turning movement count is given below in table 1.23 for all the intersections.

Integrated transit corridor development and street network/connectivity plan for the corridor/influence zone along with detailed design of all intersections & Mid sections based on traffic and feasibility studies for corridor/network.
Traffic Report ITPO
VKS INFRATECH MANAGEMENT PVT. LTD24
Table 1-33: Turning Moment Counts Survey at three/Four arms Intersection for 16 hrs at all locations
DAY Date FAST MOVING PASSENGER VEHICLES
Total Fast GOODS VEHICLES Total
Goods
SLOW MOVING VEHICLES Total Slow
Grand Total (Nos.)
Grand Total
(PCU's) Car/Jeep/Van Two Wheelers Auto Bus Mini Bus Truck LCV MAV Cycle Cycle
Rickshaw Others
Location:1-Mathura Road & Shershah Road
MONDAY 19-Dec-16 2045 36392 21310 6614 731 67092 1581 1 9 1591 10 6 3 19 68702 138640
Location:2- Mathura Road & Bhairon Marg
MONDAY 19-Dec-16 91251 52081 18633 4329 1353 167647 518 934 0 1452 1662 281 3 1946 171045 155158
Location:3- Mathura Road & Purana Quila Road
TUESDAY 20-Dec-16 55387 25648 14553 2779 712 99079 194 235 0 429 798 38 0 836 100344 93560
Location:4-Mathura Rd & Bhagwan das Rd.
FRIDAY 20-Dec-16 40948 31673 25745 2960 1041 102367 189 259 0 448 1175 284 17 1476 104291 94991
Location:5-Bhairon Marg & Ring Rd
WEDNESDAY 21-Dec-16 121436 43270 16807 2785 1263 185561 3976 3113 51 7140 487 132 140 759 193460 188626
Location:6-Subramanyam Marg & Mathura Rd.
WEDNESDAY 21-Dec-16 31485 18679 10898 1977 251 63290 353 77 45 475 1058 220 100 1378 65143 60679
Location:7-W.junction four arms junction
WEDNESDAY 21-Dec-16
58305 67982 25316 4729 673 157005 665 619 0 1284 1560 317 71 1948 160237 137201
Location:8- C-HEXAGON -PURANA QUILA ROAD
MONDAY 27-Mar-17 69760 26937 16484 776 296.3 114253 138 146 0 284 239 34 13 286 114823 103803
Location:9- C-HEXAGON- Shershah Road
MONDAY 27-Mar-17 20889 16231 8487 1806 484 47897 253 3 0 256 831 535 2 1368 49521 45977
Location:10-Mathura Road (Near DPS)
MONDAY 27-Mar-17 49737 15136 11479 1903 583 78838 198 193 118 509 347 42 87 476 79823 78277

Integrated transit corridor development and street network/connectivity plan for the corridor/influence zone along with detailed design of all intersections & Mid sections based on traffic and feasibility studies for corridor/network.
Traffic Report ITPO
VKS INFRATECH MANAGEMENT PVT. LTD25
The Intersection of Ring Road ,Mathura Road, Shershah road & Arterial road is
characterized by the significant movement of private modes like cars and two/three
wheelers and also buses, trucks etc. This is one of the main arterial in the Delhi. The
road offering good riding quality primarily functions as an arterial road.
Traffic Composition Table 1.24 to 1.30 shows traffic composition in percentage at the count station and
the same is presented in the form of pie chart in Fig 1.27 to 1.33
1. Mathura Road & Shershah Road Intersection Table 1.24: Traffic Composition
S. No. Vehicle Mode Composition 1 Two Wheelers 25.55 2 Three Wheelers/Auto 14.96 3 Car/ Jeep/Van 52.12 4 Mini Bus 0.51 5 Bus 4.64 6 LCV 0.98 7 Trucks 0.24 8 MAV 0 9 Non-Motorised Traffic 0.99
Fig. 1.27: Traffic Composition
Car 52.12% 2W
25.55%
Auto 14.96%
Bus 4.64%
Mini Bus Truck LCV MAV
0.00% Cycle Rick
0.10% Others 0.00%
Composition of traffic at Intersection Location: 01_Mathura Road & Shershah Road
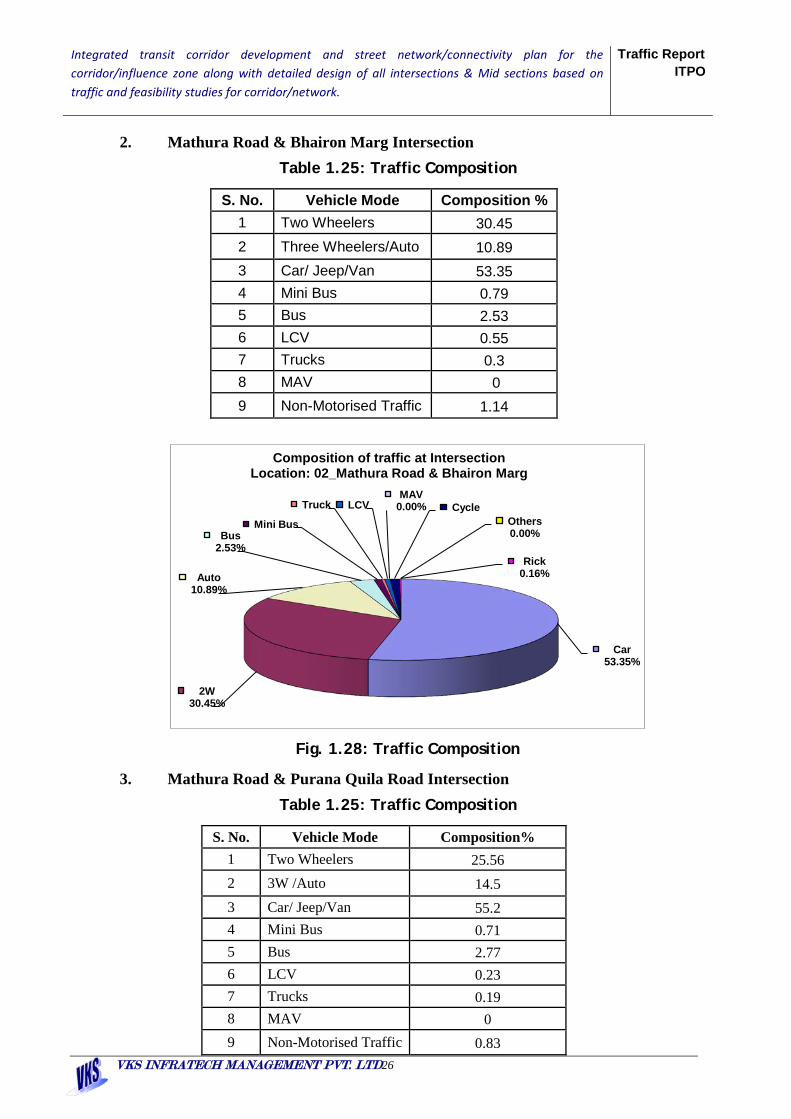
Integrated transit corridor development and street network/connectivity plan for the corridor/influence zone along with detailed design of all intersections & Mid sections based on traffic and feasibility studies for corridor/network.
Traffic Report ITPO
VKS INFRATECH MANAGEMENT PVT. LTD26
2. Mathura Road & Bhairon Marg Intersection Table 1.25: Traffic Composition
S. No. Vehicle Mode Composition % 1 Two Wheelers 30.45 2 Three Wheelers/Auto 10.89 3 Car/ Jeep/Van 53.35 4 Mini Bus 0.79 5 Bus 2.53 6 LCV 0.55 7 Trucks 0.3 8 MAV 0 9 Non-Motorised Traffic 1.14
Fig. 1.28: Traffic Composition
3. Mathura Road & Purana Quila Road Intersection Table 1.25: Traffic Composition
S. No. Vehicle Mode Composition% 1 Two Wheelers 25.56 2 3W /Auto 14.5 3 Car/ Jeep/Van 55.2 4 Mini Bus 0.71 5 Bus 2.77 6 LCV 0.23 7 Trucks 0.19 8 MAV 0 9 Non-Motorised Traffic 0.83
Car 53.35%
2W 30.45%
Auto 10.89%
Bus 2.53%
Mini Bus
Truck LCV MAV
0.00% Cycle
Rick 0.16%
Others 0.00%
Composition of traffic at Intersection Location: 02_Mathura Road & Bhairon Marg
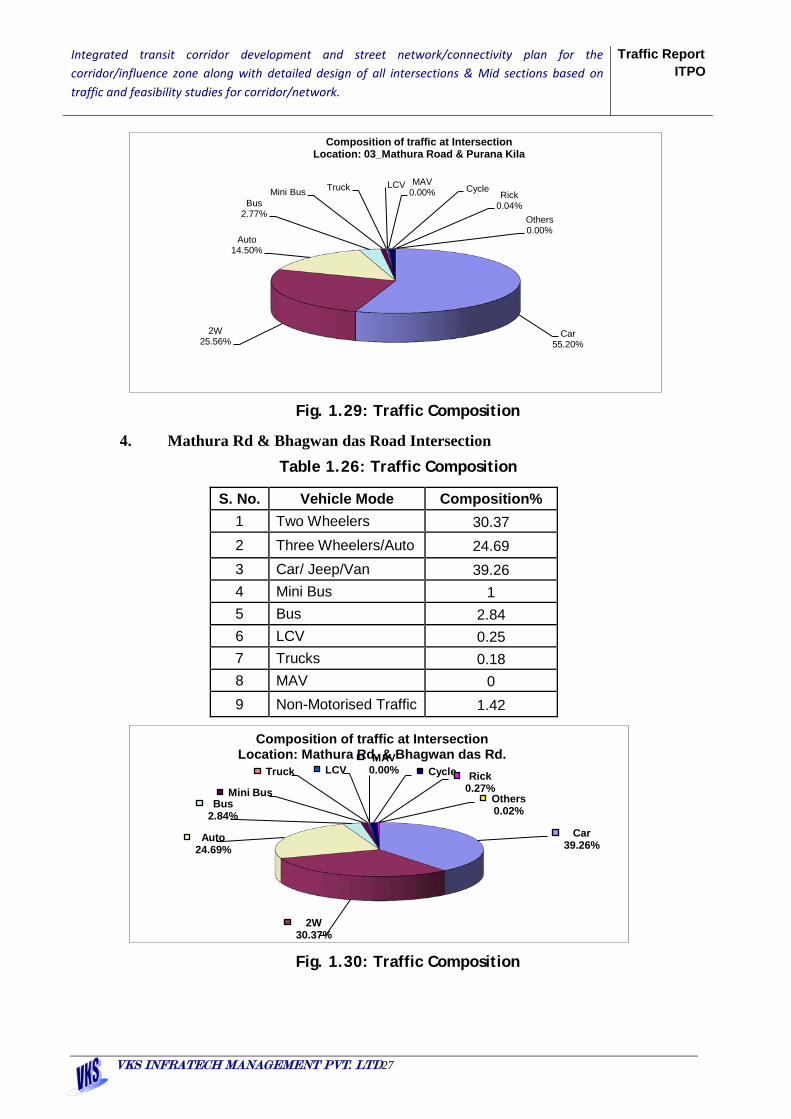
Integrated transit corridor development and street network/connectivity plan for the corridor/influence zone along with detailed design of all intersections & Mid sections based on traffic and feasibility studies for corridor/network.
Traffic Report ITPO
VKS INFRATECH MANAGEMENT PVT. LTD27
Fig. 1.29: Traffic Composition
4. Mathura Rd & Bhagwan das Road Intersection Table 1.26: Traffic Composition
S. No. Vehicle Mode Composition% 1 Two Wheelers 30.37 2 Three Wheelers/Auto 24.69 3 Car/ Jeep/Van 39.26 4 Mini Bus 1 5 Bus 2.84 6 LCV 0.25 7 Trucks 0.18 8 MAV 0 9 Non-Motorised Traffic 1.42
Fig. 1.30: Traffic Composition
Car 55.20%
2W 25.56%
Auto 14.50%
Bus 2.77%
Mini Bus Truck LCV MAV 0.00% Cycle
Rick 0.04%
Others 0.00%
Composition of traffic at Intersection Location: 03_Mathura Road & Purana Kila
Car 39.26%
2W 30.37%
Auto 24.69%
Bus 2.84%
Mini Bus
Truck LCV MAV
0.00% Cycle Rick 0.27%
Others 0.02%
Composition of traffic at Intersection Location: Mathura Rd. & Bhagwan das Rd.

Integrated transit corridor development and street network/connectivity plan for the corridor/influence zone along with detailed design of all intersections & Mid sections based on traffic and feasibility studies for corridor/network.
Traffic Report ITPO
VKS INFRATECH MANAGEMENT PVT. LTD28
5. Bhairon Marg & Ring Road Intersection Table 1.27: Traffic Composition
S. No. Vehicle Mode Composition % 1 Two Wheelers 22.45
2 Three Wheelers/Auto 8.67
3 Car/ Jeep/Van 62.7 4 Mini Bus 0.65 5 Bus 1.45 6 LCV 1.61 7 Trucks 2.05 8 MAV 0.03
9 Non-Motorised Traffic 0.39
Fig. 1.31: Traffic Composition
6. Subramanyam Bharti Marg & Mathura Road Intersection Table 1.28: Traffic Composition
S. No. Vehicle Mode Composition % 1 Two Wheelers 28.67 2 Three Wheelers/Auto 16.73 3 Car/ Jeep/Van 48.33 4 Mini Bus 0.39 5 Bus 3.03 6 LCV 0.12 7 Trucks 0.54 8 MAV 0.07 9 Non-Motorised Traffic 2.12
Car/Jeep/Van 63%
2-Wh 22%
Auto 9%
Bus 1%
M_Bus 1%
LCV 2%
Truck 2%
MAV 0%
Cycle 0%
Rick 0%
Other (S) 0%
Composition of traffic at Intersection Location:05- at Ring Road-Bhairon Marg

Integrated transit corridor development and street network/connectivity plan for the corridor/influence zone along with detailed design of all intersections & Mid sections based on traffic and feasibility studies for corridor/network.
Traffic Report ITPO
VKS INFRATECH MANAGEMENT PVT. LTD29
Fig. 1.32: Traffic Composition
7. W.Junction Table 1.29: Traffic Composition
S. No. Vehicle Mode Composition 1 Two Wheelers 42.43 2 Three Wheelers/Auto 15.8 3 Car/ Jeep/Van 36.39 4 Mini Bus 0.42 5 Bus 2.95 6 LCV 0.39 7 Trucks 0.42 8 MAV 0 9 Non-Motorised Traffic 1.2
Fig. 1.33: Traffic Composition
Car/Jeep/Van 48.33% 2-Wh
28.67%
Auto 16.73%
Bus 3.03%
M_Bus 0.39%
LCV 0.54%
Truck 0.12%
MAV 0.07% Cycle
1.62% Rick 0.34%
Other (S) 0.15%
Composition of traffic at Intersection Location:06 Subramanyam Marg & Mathura Road
Car 36.39%
2W 42.43%
Auto 15.80%
Bus 2.95%
Mini Bus Truck LCV MAV
0.00%
Cycle
Rick 0.20%
Others 0.04%
Composition of traffic at Intersection Location: 07_W.Juction

Integrated transit corridor development and street network/connectivity plan for the corridor/influence zone along with detailed design of all intersections & Mid sections based on traffic and feasibility studies for corridor/network.
Traffic Report ITPO
VKS INFRATECH MANAGEMENT PVT. LTD30
8. C-HEXAGON -PURANA QUILA ROAD
Table 1.30: Traffic Composition
S. No. Vehicle Mode Composition 1 Two Wheelers 23.46 2 Three Wheelers/Auto 14.36 3 Car/ Jeep/Van 60.75 4 Mini Bus 0.26 5 Bus 0.68 6 LCV 0.12 7 Trucks 0.13 8 MAV 0.00 9 Non-Motorised Traffic 0.25
9. C-HEXAGON- Shershah Road
Table 1.31: Traffic Composition
S. No. Vehicle Mode Composition 1 Two Wheelers 18.96 2 Three Wheelers/Auto 14.38 3 Car/ Jeep/Van 62.31 4 Mini Bus 0.73 5 Bus 2.38 6 LCV 0.25 7 Trucks 0.24 8 MAV 0.15 9 Non-Motorised Traffic 0.60
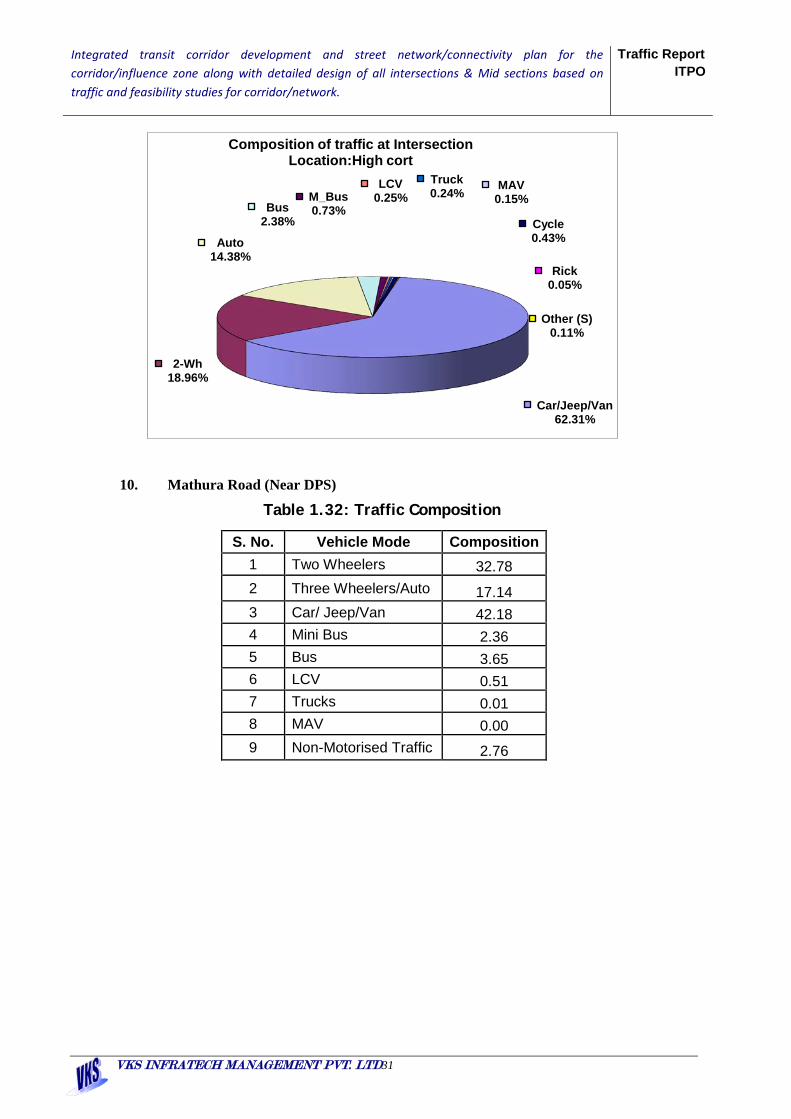
Integrated transit corridor development and street network/connectivity plan for the corridor/influence zone along with detailed design of all intersections & Mid sections based on traffic and feasibility studies for corridor/network.
Traffic Report ITPO
VKS INFRATECH MANAGEMENT PVT. LTD31
10. Mathura Road (Near DPS)
Table 1.32: Traffic Composition
S. No. Vehicle Mode Composition 1 Two Wheelers 32.78 2 Three Wheelers/Auto 17.14 3 Car/ Jeep/Van 42.18 4 Mini Bus 2.36 5 Bus 3.65 6 LCV 0.51 7 Trucks 0.01 8 MAV 0.00 9 Non-Motorised Traffic 2.76
Car/Jeep/Van 62.31%
2-Wh 18.96%
Auto 14.38%
Bus 2.38%
M_Bus 0.73%
LCV 0.25%
Truck 0.24% MAV
0.15%
Cycle 0.43%
Rick 0.05%
Other (S) 0.11%
Composition of traffic at Intersection Location:High cort

Integrated transit corridor development and street network/connectivity plan for the corridor/influence zone along with detailed design of all intersections & Mid sections based on traffic and feasibility studies for corridor/network.
Traffic Report ITPO
VKS INFRATECH MANAGEMENT PVT. LTD32
Hourly Variation and Peak Hour Traffic The hourly variation of traffic illustrates the distribution of traffic over the day. The
hourly variation of (vehicle-nos. and PCU) observed at the traffic survey locations are
given in Table 1.30 to 1.36
1. Mathura Road & Shershah Road Intersection Table 1.30: Peak Hour in (PCU) Observed at Traffic Count Locations
Sr. No. LOCATION NAME Total
(PCU's) Morning
Peak Time Evening Peak Time
1 Mathura Road & Shershah Road DIR 1: India gate To Nizamuddin 21938 1144 9:15 - 10:15 2190 5:00-6:00
DIR-2: India gate to ITO 8502 458 9:15 - 10:15 833 5:00-6:00
DIR-3: Nizamuddin to ITO 31523 2175 9:15 - 10:15 3113 5:00-6:00
DIR-4: Nizamuddin to India gate 3263 243 9:15 - 10:15 239 5:00-6:00
DIR-5: ITO to India gate 39833 3887 9:15 - 10:15 4415 5:00-6:00
DIR-6: ITO to Nizamuddin 33582 3042 9:15 - 10:15 2353 5:00-6:00
Sl. No.
Survey Location
Total (PCU's)
Morning Peak Hour
(9:15-10:15)
Evening Peak Hour
(17:00-18:00)
Date/Day)
1 Mathura Road & Shershah Road
138640 10948 13142 02-Jan-17,Tuesday
Car/Jeep/Van 41.61%
2-Wh 32.33%
Auto 16.90%
Bus 3.60%
M_Bus 2.33%
LCV 0.50%
Truck 0.01%
MAV 0.00% Cycle
1.66%
Rick 1.07% Other (S)
0.00%
Composition of traffic at Intersection Location:= MATHURA ROAD (NEAR DPS)

Integrated transit corridor development and street network/connectivity plan for the corridor/influence zone along with detailed design of all intersections & Mid sections based on traffic and feasibility studies for corridor/network.
Traffic Report ITPO
VKS INFRATECH MANAGEMENT PVT. LTD33
Fig. 1.34: Hourly Variation
2. Mathura Road & Bhairon Marg Intersection Table 1.31: Peak Hour in (PCU) Observed at Traffic Count Locations
Sr. No. LOCATION NAME Total
(PCU's) Morning
Peak Time Evening Peak Time
0
2000
4000
6000
8000
10000
12000
14000
16000
0600
-070
006
30-0
730
0700
-080
007
30-0
830
0800
-090
008
30-0
930
0900
-100
009
30-1
030
1000
-110
010
30-1
130
1100
-120
011
30-1
230
1200
-130
012
30-1
330
1300
-140
013
30-1
430
1400
-150
014
30-1
530
1500
-160
015
30-1
630
1600
-170
016
30-1
730
1700
-180
017
30-1
830
1800
-190
018
30-1
930
1900
-200
019
30-2
030
2000
-210
020
30-2
130
2100
-220
0
Vehi
cles
in N
os./P
CU
's
Time
Hourly variation of traffic at Intersection Location: 01_Mathura Road & Shershah Road
Nos. PCU's

Integrated transit corridor development and street network/connectivity plan for the corridor/influence zone along with detailed design of all intersections & Mid sections based on traffic and feasibility studies for corridor/network.
Traffic Report ITPO
VKS INFRATECH MANAGEMENT PVT. LTD34
1 Mathura Road & Bhairon Marg
DIR 1: Nizamuddin to Ring Road 38280 2475 10:30-11:30 5353 6:00-7:00
DIR-2: Nizamuddin to ITO 16249 1118 10:30-11:30 1295 6:00-7:00
DIR-3: Ring Road to ITO 21840 1645 10:30-11:30 1985 6:00-7:00
DIR-4: Ring Road to Nizamuddin 39077 4286 10:30-11:30 2630 6:00-7:00
DIR-5: ITO to Nizamuddin 16535 1027 10:30-11:30 1404 6:00-7:00
DIR-6: ITO to Ring Road 23178 1638 10:30-11:30 2473 6:00-7:00
Sl. No.
Survey Location
Total (PCU's)
Morning Peak Hour
(10:30-11:30)
Evening Peak Hour
(18:00-19:00)
Date/Day)
1 Mathura Road & Bhairon Marg
155158
12187
15140
02-Jan-17,Tuesday

Integrated transit corridor development and street network/connectivity plan for the corridor/influence zone along with detailed design of all intersections & Mid sections based on traffic and feasibility studies for corridor/network.
Traffic Report ITPO
VKS INFRATECH MANAGEMENT PVT. LTD35
Fig. 1.35: Hourly Variation
3. Mathura Road & Purana Quila Road Intersection Table 1.32: Peak Hour in (PCU) Observed at Traffic Count Locations
Sr. No. LOCATION NAME Total
(PCU's) Morning
Peak Time Evening Peak Time
1 Mathura Road & Purana Quila Road
DIR 1: Purana Quila to Nizamuddin 31258 2271 9:30-10:30 4186 5:30-6:30
DIR-2: Purana Quila to ITO 3321 320 9:30-10:30 366 5:30-6:30 DIR-3: Nizamuddin to ITO 23991 2636 9:30-10:30 2078 5:30-6:30
DIR-4: Nizamuddin to Purana Quila 8416 700 9:30-10:30 837 5:30-6:30
DIR-5: ITO to Purana Quila 3357 441 9:30-10:30 226 5:30-6:30
DIR-6: ITO to Nizamuddin 23218 2168 9:30-10:30 2394 5:30-6:30
Sl. No.
Survey Location
Total (PCU's)
Morning Peak Hour (9:30-10:30)
Evening Peak Hour (17:30-18:30)
Date/Day)
1 Mathura Road & Purana Quila Road
93560
8534
10086
03-Jan-17,Tuesday
0
2000
4000
6000
8000
10000
12000
14000
16000
18000
20000
0600
-070
006
30-0
730
0700
-080
007
30-0
830
0800
-090
008
30-0
930
0900
-100
009
30-1
030
1000
-110
010
30-1
130
1100
-120
011
30-1
230
1200
-130
012
30-1
330
1300
-140
013
30-1
430
1400
-150
014
30-1
530
1500
-160
015
30-1
630
1600
-170
016
30-1
730
1700
-180
017
30-1
830
1800
-190
018
30-1
930
1900
-200
019
30-2
030
2000
-210
020
30-2
130
2100
-220
0
Vehi
cles
in N
os./P
CU
's
Time
Hourly variation of traffic at Intersection Location: 02_Mathura Road & Bhairon Marg
Nos. PCU's

Integrated transit corridor development and street network/connectivity plan for the corridor/influence zone along with detailed design of all intersections & Mid sections based on traffic and feasibility studies for corridor/network.
Traffic Report ITPO
VKS INFRATECH MANAGEMENT PVT. LTD36
Fig. 1.36: Hourly Variation
4. Mathura Rd & Bhagwan das Road Intersection Table 1.33: Peak Hour in (PCU) Observed at Traffic Count Locations
Sr. LOCATION NAME Total Morning Time Evening Time
0
2000
4000
6000
8000
10000
12000
0600
-070
006
30-0
730
0700
-080
007
30-0
830
0800
-090
008
30-0
930
0900
-100
009
30-1
030
1000
-110
010
30-1
130
1100
-120
011
30-1
230
1200
-130
012
30-1
330
1300
-140
013
30-1
430
1400
-150
014
30-1
530
1500
-160
015
30-1
630
1600
-170
016
30-1
730
1700
-180
017
30-1
830
1800
-190
018
30-1
930
1900
-200
019
30-2
030
2000
-210
020
30-2
130
2100
-220
0
Vehi
cles
in N
os./P
CU
's
Time
Hourly variation of traffic at Intersection Location:03_Mathura Road & Purana Kila
Nos. PCU's
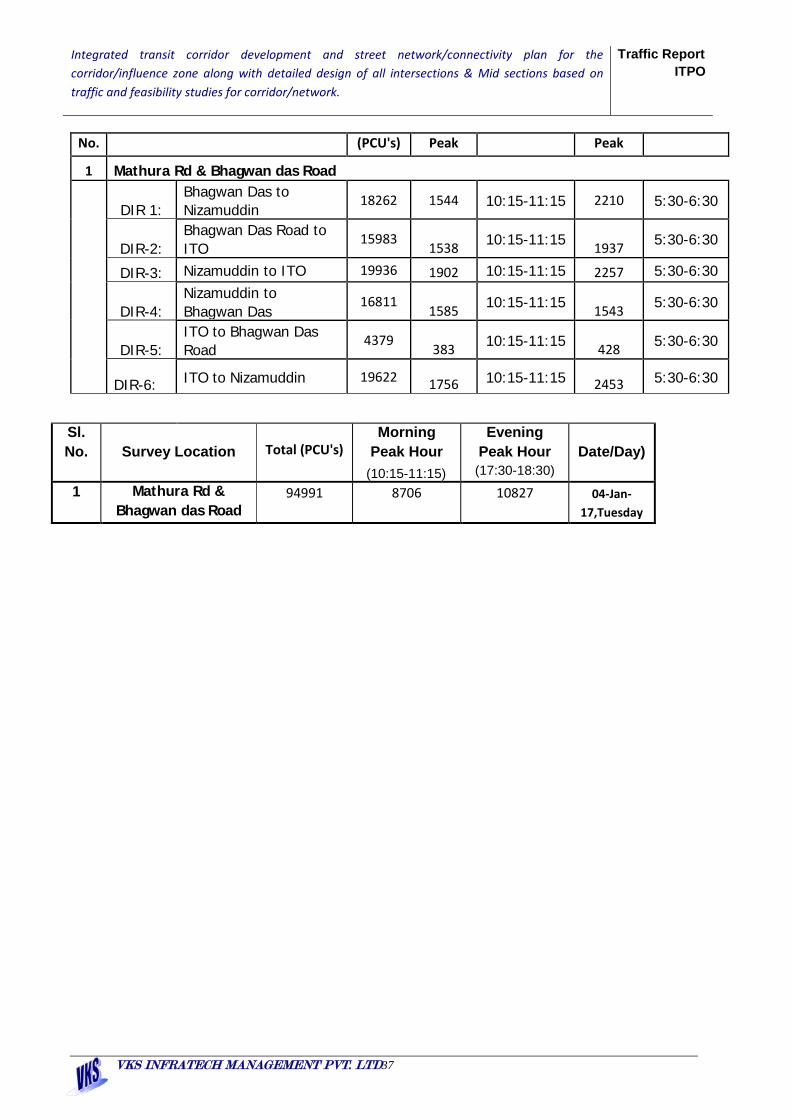
Integrated transit corridor development and street network/connectivity plan for the corridor/influence zone along with detailed design of all intersections & Mid sections based on traffic and feasibility studies for corridor/network.
Traffic Report ITPO
VKS INFRATECH MANAGEMENT PVT. LTD37
No. (PCU's) Peak Peak
1 Mathura Rd & Bhagwan das Road
DIR 1: Bhagwan Das to Nizamuddin 18262 1544 10:15-11:15 2210 5:30-6:30
DIR-2: Bhagwan Das Road to ITO 15983 1538 10:15-11:15 1937 5:30-6:30
DIR-3: Nizamuddin to ITO 19936 1902 10:15-11:15 2257 5:30-6:30
DIR-4: Nizamuddin to Bhagwan Das 16811
1585 10:15-11:15 1543 5:30-6:30
DIR-5: ITO to Bhagwan Das Road 4379 383 10:15-11:15 428 5:30-6:30
DIR-6: ITO to Nizamuddin 19622 1756 10:15-11:15 2453 5:30-6:30
Sl. No.
Survey Location
Total (PCU's)
Morning Peak Hour
(10:15-11:15)
Evening Peak Hour (17:30-18:30)
Date/Day)
1 Mathura Rd & Bhagwan das Road
94991
8706
10827
04-Jan-17,Tuesday

Integrated transit corridor development and street network/connectivity plan for the corridor/influence zone along with detailed design of all intersections & Mid sections based on traffic and feasibility studies for corridor/network.
Traffic Report ITPO
VKS INFRATECH MANAGEMENT PVT. LTD38
Fig. 1.37: Hourly Variation
0
2000
4000
6000
8000
10000
12000
14000
0600
-070
006
30-0
730
0700
-080
007
30-0
830
0800
-090
008
30-0
930
0900
-100
009
30-1
030
1000
-110
010
30-1
130
1100
-120
011
30-1
230
1200
-130
012
30-1
330
1300
-140
013
30-1
430
1400
-150
014
30-1
530
1500
-160
015
30-1
630
1600
-170
016
30-1
730
1700
-180
017
30-1
830
1800
-190
018
30-1
930
1900
-200
019
30-2
030
2000
-210
020
30-2
130
2100
-220
0
Vehi
cles
in N
os./P
CU
's
Time
Hourly variation of traffic at Intersection Location: 04_Mathura Rd & Bhagwan das Rd.
Nos. PCU's

Integrated transit corridor development and street network/connectivity plan for the corridor/influence zone along with detailed design of all intersections & Mid sections based on traffic and feasibility studies for corridor/network.
Traffic Report ITPO
VKS INFRATECH MANAGEMENT PVT. LTD39
5. Bhairon Marg & Ring Road Intersection Table 1.34: Peak Hour in (PCU) Observed at Traffic Count Locations
Sr. No. LOCATION NAME Total
(PCU's) Morning
Peak Time Evening Peak Time
1 Bhairon Marg & Ring Road DIR 1: ITO to Nizamuddin 34311 1959 11:00-12:00 5406 6:45-7:45 DIR-2: Nizamuddin to ITO 51126 5017 11:00-12:00 3614 6:45-7:45 DIR-3: ITO to Pragati Maidan 19775 1391 11:00-12:00 655 6:45-7:45 DIR-4: Pragati Maidan to ITO 13179 769 11:00-12:00 1717 6:45-7:45
DIR-5: Nizamuddin to Pragti maidan 33535 1813 11:00-12:00 3557 6:45-7:45
DIR-6: Pragti maidan to Nizamuddin 37156
2084 11:00-12:00 4190 6:45-7:45
Sl. No.
Survey Location
Total (PCU's)
Morning Peak Hour
(11:00-12:00)
Evening Peak Hour (18:45-19:45)
Date/Day)
1 Bhairon Marg & Ring Road
189081
13031
19139
04-Jan-17,Tuesday

Integrated transit corridor development and street network/connectivity plan for the corridor/influence zone along with detailed design of all intersections & Mid sections based on traffic and feasibility studies for corridor/network.
Traffic Report ITPO
VKS INFRATECH MANAGEMENT PVT. LTD40
Fig. 1.38: Hourly Variation
6. Subramanyam Bharti Marg & Mathura Road Intersection Table 1.35: Peak Hour in (PCU) Observed at Traffic Count Locations
Sr. No. LOCATION NAME Total
(PCU's) Morning
Peak Time Evening Peak Time
1 Subramanyam Bharti Marg & Mathura Road DIR 1: Bhogal to ITO 23559 1882 9:30-10:30 3115 5:45-6:45 DIR-2: ITO to NZM 23320 1429 9:30-10:30 1863 5:45-6:45
DIR-3:
Bhogal to Subramineyam Bharti Marg
2752 320
9:30-10:30 206
5:45-6:45
DIR-4: Subramineyam Bharti Marg to NZM 1659 71 9:30-10:30 115 5:45-6:45
DIR-5: ITO to Subramineyam Bharti Marg 2309
148 9:30-10:30 108 5:45-6:45
DIR-6: Subramineyam Bharti Marg to ITO 7081 491 9:30-10:30 740 5:45-6:45
Sl. No.
Survey Location
Total (PCU's)
Morning Peak Hour (9.30-10.30)
Evening Peak Hour (17:45-18:45)
Date/Day)
1 Subramanyam Bharti Marg & Mathura Road
60679
4340
6146
04-Jan-17,Tuesday
0
5000
10000
15000
20000
25000
Hourly variation of traffic at Intersection Location: 05 at Ring Road-Bhairon Marg
Nos.

Integrated transit corridor development and street network/connectivity plan for the corridor/influence zone along with detailed design of all intersections & Mid sections based on traffic and feasibility studies for corridor/network.
Traffic Report ITPO
VKS INFRATECH MANAGEMENT PVT. LTD41
Fig. 1.39: Hourly Variation
7. W.Junction Table 1.36: Peak Hour in (PCU) Observed at Traffic Count Locations
010002000300040005000600070008000
Hourly variation of traffic at Intersection Location: 06 Subramanyam Marg & Mathura road
Nos. PCU's
Sr. No.
LOCATION NAME Total (PCU's)
Morning Peak Time Evening
Peak Time
1 W.junction Four arms Junction
DIR-1: Nizamuddin to India gate 20833 71 9:00-10:00 78 6:15-7:15
DIR-2: India gate to ITO 1011 1477 9:00-10:00 2146 6:15-7:15

Integrated transit corridor development and street network/connectivity plan for the corridor/influence zone along with detailed design of all intersections & Mid sections based on traffic and feasibility studies for corridor/network.
Traffic Report ITPO
VKS INFRATECH MANAGEMENT PVT. LTD42
Fig. 1.40: Hourly Variation
8. C-HEXAGON -PURANA QUILA ROAD
Sr. No. LOCATION NAME Total
(PCU's) Morning
Peak Time Evening Peak Time
1 C-HEXAGON -PURANA QUILA ROAD
DIR 1: Pragati Maidan To India 8020 875 10.30-11.30 106 18:30-19:30
0
2000
4000
6000
8000
10000
12000
14000
16000
0600
-070
006
30-0
730
0700
-080
007
30-0
830
0800
-090
008
30-0
930
0900
-100
009
30-1
030
1000
-110
010
30-1
130
1100
-120
011
30-1
230
1200
-130
012
30-1
330
1300
-140
013
30-1
430
1400
-150
014
30-1
530
1500
-160
015
30-1
630
1600
-170
016
30-1
730
1700
-180
017
30-1
830
1800
-190
018
30-1
930
1900
-200
019
30-2
030
2000
-210
020
30-2
130
2100
-220
0
Vehi
cles
in N
os./P
CU
's
Time
Hourly variation of traffic at Intersection Location: 07_W.Juction
Nos. PCU's
DIR-3: ITO to India gate 14277 1566 9:00-10:00 1897 6:15-7:15
DIR-4: India gate to Mandi House 6888 94 9:00-10:00 120 6:15-7:15
DIR-5: Mandi House to India gate 831 110 9:00-10:00 133 6:15-7:15
DIR-6: Nizamuddin to ITO 25600 1005 9:00-10:00 1033 6:15-7:15
DIR-7: ITO to Nizamuddin 19985 1181 9:00-10:00 1551 6:15-7:15
DIR-8: Nizamuddin to Mandi House 12815 667 9:00-10:00 591 6:15-7:15
DIR-9: Mandi House to Nizamuddin 1018 535 9:00-10:00 606 6:15-7:15
DIR-10: ITO to Mandi House 7419 2484 9:00-10:00 2146 6:00-7:00
DIR-11: Mandi House to ITO 25745 2021 9:00-10:00 2834 6:15-7:15
Sl. No.
Survey Location
Total (PCU's)
Morning Peak Hour
(9:00-10:00)
Evening Peak Hour
(18:15-19:15)
Date/Day)
1 W.junction Four arms Junction
137201
11308
13239
21-Dec-2016 (Wednesday)

Integrated transit corridor development and street network/connectivity plan for the corridor/influence zone along with detailed design of all intersections & Mid sections based on traffic and feasibility studies for corridor/network.
Traffic Report ITPO
VKS INFRATECH MANAGEMENT PVT. LTD43
Gate
DIR-2: India Gate To Patiyala House 71562 4471 10.30-11.30 10229 18:30-19:30
DIR-3: India Gate To Pragati maidan 24221 1447 10.30-11.30 2590 18:30-19:30
9. C-HEXAGON –SHERSHAH ROAD
Sr. No. LOCATION NAME Total
(PCU's) Morning
Peak Time Evening Peak Time
1 C-HEXAGON –SHERSHAH ROAD
DIR 1: Mathura Road To India gate 19781 1296 11.00-12.00 1674 18:00-19:00 DIR-2: Patiyala house To Mathura Road 19202 1371 11.00-12.00 1914 18:00-19:00 DIR-3: Patiyala house To India gate 39297 3302 11.00-12.00 3875 18:00-19:00
0
2000
4000
6000
8000
10000
12000
14000
16000
Hourly variation of traffic at Intersection Location: 06 Subramanyam Marg & Mathura road
Nos.

Integrated transit corridor development and street network/connectivity plan for the corridor/influence zone along with detailed design of all intersections & Mid sections based on traffic and feasibility studies for corridor/network.
Traffic Report ITPO
VKS INFRATECH MANAGEMENT PVT. LTD44
10. Mathura Road (Near DPS)
Sr. No. LOCATION NAME Total
(PCU's) Morning
Peak Time Evening Peak Time
1 Mathura Road (Near DPS)
DIR 1: ITO To South x 19815 1307 10.30-11.30 2140 18:30-19:30 DIR-2: ITO To Ashram 7795 567 10.30-11.30 600 18:30-19:30 DIR-3: South x & Ashram To ITO 18368 1223 10.30-11.30 1978 18:30-19:30
\
Table 1.37 Daily Traffic Volume (16 Hours) at Intersection Locations
0
1000
2000
3000
4000
5000
6000
7000
8000
Hourly variation of traffic at Intersection Location: C-HEXAGON –SHERSHAH ROAD
Nos.
0
1000
2000
3000
4000
5000
6000
7000
8000
Hourly variation of traffic at Intersection Location: High Cort
Nos.

Integrated transit corridor development and street network/connectivity plan for the corridor/influence zone along with detailed design of all intersections & Mid sections based on traffic and feasibility studies for corridor/network.
Traffic Report ITPO
VKS INFRATECH MANAGEMENT PVT. LTD45
Loc.no.
Name of Location Total Vehicles
Total PCU’s Intersection
1 Mathura Road & Shershah Road 142428 138640 2 Mathura Road & Bhairon Marg 171045 155158 3 Mathura Road & Purana Quila Road 100344 93560 4 Mathura Rd & Bhagwan das Rd. 104291 94991 5 Bhairon Marg & Ring Rd 193986 189081 6 Subramanyam Marg & Mathura Rd. 65143 60679
7 W.Junction 160237 137201
8 C-Hexgon-Purana Quila 114823 103803
9 Mathura Road Near (DPS) 49521 45977
10 C-HEXAGON –SHERSHAH ROAD 79823 78277
PEDESTRIAN SURVEY
Pedestrian Survey

Integrated transit corridor development and street network/connectivity plan for the corridor/influence zone along with detailed design of all intersections & Mid sections based on traffic and feasibility studies for corridor/network.
Traffic Report ITPO
VKS INFRATECH MANAGEMENT PVT. LTD46
Table: Total Along-Across Intersection Pedestrian Name of Location Total Along - Across
Loc. No. Name of Pedestrian Time Along Across Total
1 Mathura Road & Shershah Road Xing 16
Hours 9888 6554 16442
2 Mathura Road & Bhairon Marg Xing 16
Hours 6895 1964 8859
3 Mathura Road & Purana Quila Road Xing
16 Hours 5373 2904 8277
4 Pargati Maidan Near Gate No. 7 16
Hours 6888 4018 10906
5 Ring Road & Bhairon Marg Xing 16
Hours 6750 4155 10905 35794 19595 55389
Table- Peak Hour Traffic at all pedestrian Intersection Survey
S.No. Name of Location Total Along
Total Across
Total Along
+ Acorss
Peak Time Peak Hour Along
Peak Hour
Across
Peak Hour
Along + Acorss
1 Mathura Road & Shershah Road Xing 9888 6554 16442 17:15-18:15 1230 1006 2236
2 Mathura Road & Bhairon Marg Xing 6895 1964 8859 17:15-18:15 1420 162 1582
3 Mathura Road & Purana Quila Road Xing 5373 2904 8277 09:00-10:00 897 485
1382
4 Pargati Maidan Near Gate No. 7 6888 4018 10906 17:00-18:00 911 563 1474
5 Ring Road & Bhairon Marg Xing 6750 4155 10905 09:30-10:30 839 652 1491
FOB Pedestrian Survey Table: FOB Pedestrian
S.No. Name of Location Total Along
Total Across
Total Along + Acorss
Peak Time Peak Hour Along
Peak Hour
Across
Peak Hour Along + Acorss
1 FOB_Mathura Road Near Bhairon Marg X-ing 0 58 58 17:45–18:45 0 6
6
2 FOB_Mathura Road Near Purana Quila X-ing 0 55 55 17:45–18:45 0 6
6
3 FOB_Mathura Road Near Supreme Court 0 70 78 17:00–18:00 0 11
11
BUS STOP BOARDING - ALIGHTING SURVEY
Table: Bus Stop Boarding-Alighting Summary Sheet S. Name of Bus Stops Total Total Total Peak Time Peak Peak Peak

Integrated transit corridor development and street network/connectivity plan for the corridor/influence zone along with detailed design of all intersections & Mid sections based on traffic and feasibility studies for corridor/network.
Traffic Report ITPO
VKS INFRATECH MANAGEMENT PVT. LTD47
No. Boarding Alighti
ng B+A Hour
Boarding
Hour Alightin
g
Hour B+A
1 National Stadium Bus Stand (Towards ITO) 545 606 1151 1100 - 1200 71 69 140
2 National Stadium Bus Stand (Towards Nizamuddin) 783 834 1617 1015 - 1115 113 127
240
3 Pargati Maidan Near Gate No. 5 Bus Stand (Towards ITO) 680 539 1219 1045 - 1145 99 63
162
4 Pargati Maidan Near Gate No. 5 Bus Stand (Towards Nizamuddin) 857 622 1479 1800 - 1900 124 98
222
5 ITPO Pargati Maidan Bus Stand (Towards ITO) 1302 1057 2359 1815 - 1915 145 100
245
6 ITPO Pargati Maidan Bus Stand (Towards Nizamuddin) 1367 1498 2865 0915 - 1015 205 194
399
7 Pargati Maidan Gate no-7 Bus Stand (Towards ITO) 2554 3840 6394 1830 - 1930 298 426
724
8 Pargati Maidan Gate no-7 Bus Stand (Towards Nizamuddin) 4959 1813 6772 0830 - 0930 570 248
818
9 Bus Stand on Bhairon Marg (Towards Ring Road) 159 120 279 1715 - 1815 32 26
58
10 Bus Stand on Bhairon Marg (Towards Nizamuddin) 205 132 337 1730 - 1830 35 17
52
METRO STATION BOARDING - ALIGHTING SURVEY
Table: Metro Station Boarding-Alighting Summary Sheet
S.No. Name of Metro Station
Total (IN)
Total (OUT)
Total Peak Time
Peak Hour (IN)
Peak Hour
(OUT)
Peak Hour IN+OUT IN+OUT
1 Pargati Maidan Metro Station 17346 17497 34843
0945 - 1045 2562 3248
5810
2 Inderprastha Metro Station 11023 10381 21404
1915 - 2015 1604 1600 3204
AUTO RICKSHAW STOP BOARDING - ALIGHTING SURVEY
AUTO & CYCLE RICKSHAW STOP (BOARDING – ALIGHTING) SUMMARY S. Loc Name of Auto/NMT Stops Total Total Total Peak Time Peak Peak Peak

Integrated transit corridor development and street network/connectivity plan for the corridor/influence zone along with detailed design of all intersections & Mid sections based on traffic and feasibility studies for corridor/network.
Traffic Report ITPO
VKS INFRATECH MANAGEMENT PVT. LTD48
No.
Boarding Alighting B+A
Hour Boarding
Hour Alighting
Hour B+A
1 1 Pragati Maidan on Mathura Road 1014 1389 2403 1700-1800 144 225 369
2 2 Inderprastha Metro Station on Ring Road 3866 625 4491 1700-1800 508 67 575

Integrated transit corridor development and street network/connectivity plan for the corridor/influence zone along with detailed design of all intersections & Mid sections based on traffic and feasibility studies for corridor/network.
Traffic Report ITPO
VKS INFRATECH MANAGEMENT PVT. LTD49
PARKING SURVEY Table: Parking Accumulation
S.No Location Mode Duration (Hours)
8:00-9:00
9:00-10:00
10:00-11:00
11:00-12:00
12:00-13:00
13:00-1400
14:00-15:00
15:00-16:00
16:00-17:00
17:00-18:00
18:00-19:00
19:00-20:00
1 Purana Quila Road Parking
Car 19 12 15 26 22 23 20 23 26 25 28 29 TW 2 12 10 14 15 22 27 31 32 29 35 35 Auto 0 0 0 0 0 0 0 0 0 0 0 0 ECS 19.5 15.0 17.5 29.5 25.8 28.5 26.8 30.8 34.0 32.3 36.8 37.8
2 Parking_Bhagwan Das Road (on) Left Side
Car 5 23 25 83 77 78 101 89 76 62 46 37 TW 2 6 7 2 5 1 6 4 6 9 5 6 Auto 3 13 5 2 1 1 1 1 4 1 1 1 ECS 8.5 37.5 31.8 85.5 79.3 79.3 103.5 91.0 81.5 65.3 48.3 39.5
3 Parking_Bhagwan Das Road (on) Right Side
Car 17 39 31 45 33 40 74 75 45 29 34 21 TW 10 31 35 34 18 24 1 4 5 4 5 2 Auto 0 30 6 0 0 0 0 2 0 0 0 0 ECS 19.5 76.8 45.8 53.5 37.5 46.0 74.3 78.0 46.3 30.0 35.3 21.5
4 Parking_Inderprastha Metro Station
Car 174 179 186 186 188 194 192 192 194 185 176 157 TW 100 112 129 128 126 131 128 130 134 124 115 108 ECS 199.0 207.0 218.3 218.0 219.5 226.8 224.0 224.5 227.5 216.0 204.8 184.0
5 Parking_Pargati Maidan Metro Station
Car 313 323 326 282 202 140 96 64 52 78 82 70 TW 424 416 394 371 337 298 266 234 187 135 85 30 ECS 419.0 427.0 424.5 374.8 286.3 214.5 162.5 122.5 98.8 111.8 103.3 77.5
6 Purana Quila Road Parking
Car 47 48 47 48 60 62 72 65 55 41 20 11 TW 15 5 2 5 1 1 2 3 6 13 12 12 ECS 50.8 49.3 47.5 49.3 60.3 62.3 72.5 65.8 56.5 44.3 23.0 14.0

Integrated transit corridor development and street network/connectivity plan for the corridor/influence zone along with detailed design of all intersections & Mid sections based on traffic and feasibility studies for corridor/network.
Traffic Report ITPO
VKS INFRATECH MANAGEMENT PVT. LTD50
Table: Parking Accumulation/Peak Time
S.N Parkin Type Location Name
Peak Accumulation Equivalent
Car Spaces (ECS) Peak Time Car 2-Whlr. Auto Bus
1 Off
Street Purana Quila Road Parking 19:00-20:00 29 35 0 0 37.8
2 On
Street Bhagwan Das Road (on) Left Side 14:00-15:00 101 6 1 0 103.5
3 On
Street Bhagwan Das Road (on) Right Side 15:00-16:00 75 4 2 0 78.0
4 Off
Street Indraprashta Metro Station 13:00-14:00 194 131 0 0 226.8
5 Off
Street Pragati Maidan Metro Station 09:00-10:00 323 416 0 0 427.0
6 Off
Street Prgati Maidan Metro Stn. Parking 13:00-14:00 95 38 0 0 104.5
7 Off
Street Purana Quila Road Parking 14:00-15:00 72 2 0 0 72.5
Table: Parking Durations (Hours)
SN Name of Location Parking Type Mode
Duration (Hours)
Total 0--2 2--4 4--6 6--8 >8
Short Term Medium
Term Long Term
1 Purana Quila Road Parking
Off Street
Car 8 14 7 12 10 51
% 15.7 27.5 13.7 23.5 19.6 100 2-Whlr. 10 7 15 7 5 44
% 22.7 15.9 34.1 15.9 11.4 100
2 Parking_Bhagwan Das Road (on) Left Side
On Street
Car 273 82 2 0 0 357
% 76.5 23.0 0.6 0.0 0.0 100 2-Whlr. 30 3 1 0 0 34
% 88.2 8.8 2.9 0.0 0.0 100
Auto 33 0 0 0 0 33
% 100.0 0.0 0.0 0.0 0.0 100
3 03_Parking_Bhagwan Das Road (on) Right Side
On Street
Car 245 12 0 0 0 257
% 95.3 4.7 0.0 0.0 0.0 100
2- 127 1 0 0 0 128

Integrated transit corridor development and street network/connectivity plan for the corridor/influence zone along with detailed design of all intersections & Mid sections based on traffic and feasibility studies for corridor/network.
Traffic Report ITPO
VKS INFRATECH MANAGEMENT PVT. LTD51
Whlr.
% 99.2 0.8 0.0 0.0 0.0 100
Auto 37 0 0 0 0 37
% 100.0 0.0 0.0 0.0 0.0 100
4 Parking_Inderprastha Metro Station
Off Street
Car 39 66 77 152 325 659
% 5.9 10.0 11.7 23.1 49.3 100 2-Whlr. 171 110 90 72 61 504
% 33.93 21.83 17.86 14.29 12.10 100
5 Parking_Pargati Maidan Metro Station
Off Street
Car 125 54 123 96 439 837
% 14.9 6.5 14.7 11.5 52.4 100 2-Whlr. 96 55 58 107 367 683
% 14.1 8.1 8.5 15.7 53.7 100
6 Prgati Maidan Metro Stn. Parking
Off Street
Car 196 81 64 52 66 459
% 42.7 17.6 13.9 11.3 14.4 100 2-Whlr. 113 56 60 38 49 316
% 35.8 17.7 19.0 12.0 15.5 100
7 Purana Quila Road Parking
Off Street
Car 93 45 35 39 52 264
% 35.2 17.0 13.3 14.8 19.7 100 2-Whlr. 103 72 51 34 40 300
% 34.3 24.0 17.0 11.3 13.3 100

Integrated transit corridor development and street network/connectivity plan for the corridor/influence zone along with detailed design of all intersections & Mid sections based on traffic and feasibility studies for corridor/network.
Traffic Report ITPO
VKS INFRATECH MANAGEMENT PVT. LTD52
46.2
22.9
30.9
Car Parking Duration (Hours)
Short Term
Medium Term
Long Term
47.5
26.5
26.0 Two wheeler Parking Duration
(Hours)
Short TermMedium TermLong Term

Integrated transit corridor development and street network/connectivity plan for the corridor/influence zone along with detailed design of all intersections & Mid sections based on traffic and feasibility studies for corridor/network.
Traffic Report ITPO
VKS INFRATECH MANAGEMENT PVT. LTD53
O-D MATRIX 16 HOUR UNEXPENDED MATRIX (MODE- CARS ONLY)
O\D 1 2 3 4 5 6 7 8 9 10 11 12 13 Total
1 0 4500 465 50 5 2400 260 30 25 28 250 0 445 8458
2 875 0 2086 205 27 102 25 18 15 13 11 0 1950 5327
3 635 635 0 215 46 23 11 15 16 12 10 0 13 1631
4 2745 275 340 0 0 289 39 22 15 19 41 0 35 3820
5 2050 330 55 0 0 210 35 45 14 11 23 0 32 2805
6 3315 385 75 35 15 0 65 415 35 10 890 0 105 5345
7 2154 240 55 42 31 213 0 1542 145 46 27 14 18 4527
8 230 75 35 25 19 1305 150 0 2560 1980 52 203 135 6769
9 130 91 18 36 24 121 801 2450 0 115 15 17 7 3825
10 0 0 0 0 0 0 0 2080 105 0 0 0 0 2185
11 220 2035 205 37 14 31 13 17 12 9 0 0 4050 6643
12 430 800 135 35 15 2600 275 55 10 0 8010 0 810 13175

Integrated transit corridor development and street network/connectivity plan for the corridor/influence zone along with detailed design of all intersections & Mid sections based on traffic and feasibility studies for corridor/network.
Traffic Report ITPO
VKS INFRATECH MANAGEMENT PVT. LTD54
13 0 0 0 0 0 0 0 0 0 0 0 0 0 0
Total 12784 9366 3469 680 196 7294 1674 6689 2952 2243 9329 234 7600 64510
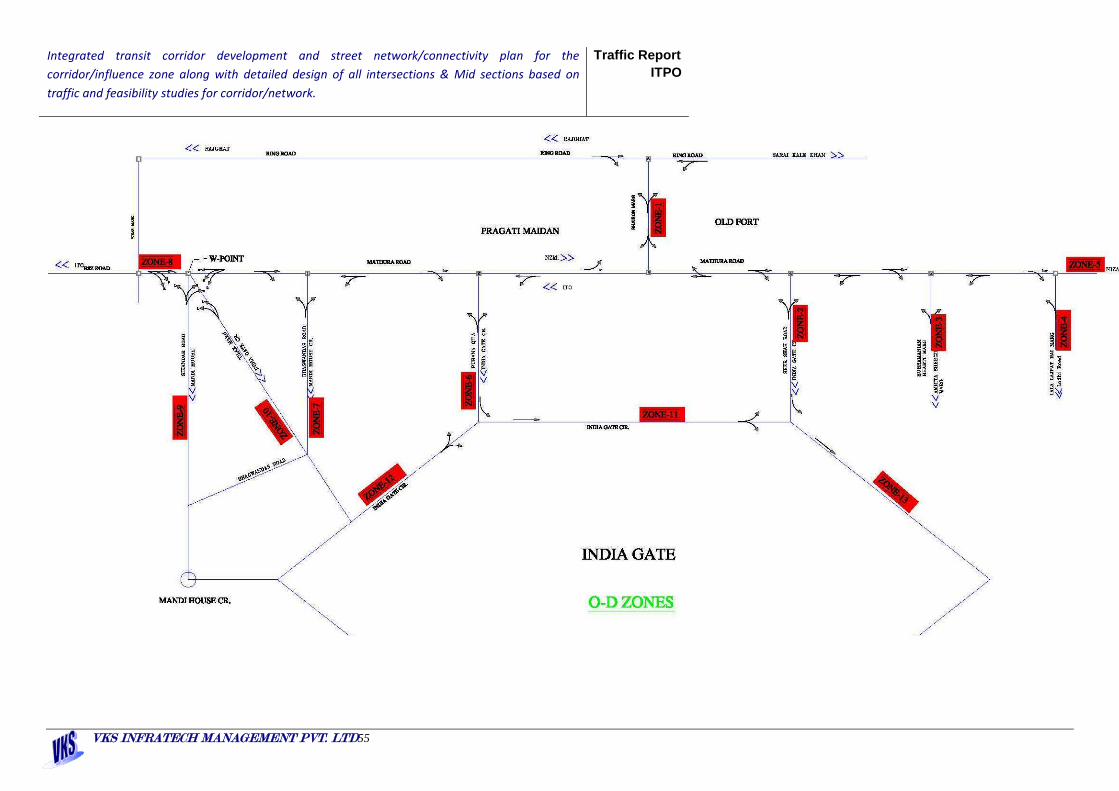
Integrated transit corridor development and street network/connectivity plan for the corridor/influence zone along with detailed design of all intersections & Mid sections based on traffic and feasibility studies for corridor/network.
Traffic Report ITPO
VKS INFRATECH MANAGEMENT PVT. LTD55

INTEGRATED TRANSIT CORRIDOR DEVELOPMENT AND STREET NETWORK/CONNECTIVITY PLAN FOR THE CORRIDOR/INFLUENCE ZONE ALONG WITH DETAILED DESIGN OF ALL INTERSECTIONS & MID SECTIONS BASED ON TRAFFIC AND FEASIBILITY STUDIES FOR THE CORRIDOR/NETWORK
PWD, Flyover Division
VKS INFRATECH MANAGEMENT PVT. LTD Page 56