uuuuuuuu - defense technical information center · i uuuuuuuu. urejort documentatrion page fr...
TRANSCRIPT
AD-AO2 526 TEXAS UNIV AT AUSTIN F/G 11/6bE IFLUENCE OF HOLD TIMES ON FATIGUE CRACK GROWTH OF ALULM Iq-fEC(U)FEB 80 H L MARCUS AFOSR-?6-2955
WCLASSIFIED AFOSR-TR-80-0233i 111111111111111111111111
I uuuuuuuu
UREJORT DOCUMENTATrION PAGE FR OPEIGFR
C7
(and~u tN~
-THE INFLUETCT NFUENCE OF !LOLD TIMES ON M 1 Jan X076- 31 Dec 79_.7A~dU CRCK ROWTrH Oir ALUMINUA CK - SUO~*~~.~O
4 ~LLOYS8, CONTRACT OR GRANT NUMBER(*)
AH'.Mru AOS R-76-29554
~9. PERFORING ORGANIZATION NAME A-40 ADDRESS 0. PROGRAM ELEMENT. PROJECT, TASK
00The University of Texas/6INUER
o Dept. of Mechanical Eng. and M.SICONTROLLING OFFICE NAME AND ADDRESSFe8
Department of the Air Force /eoC.. AFOSR/NE, Air Force Office of SLo iri
Research, Bolling AFBD.C. 20332014. MONITORING AGENCY NAME & ADORESS(if different from Controlling Office 1S. SECURITY CLASS. (of this report)
Unls4feAw V 15a DEC A reICTIOeOWGRSI
SCHDUL
hy.DISRBO AE ETo emr tlemaotentere trapp0,i. feetfrmReot
10. KEYSWORDT (Continue on revere side it necessary and Identify by block number)
fratheresutfte eerho fatigue crack growth, irc lsre niomnaaluminumdisoalloysswearendescribedllsinfthrelaea.e
firs ASRela(Cotines te siIfnflencern odnfy hyod timera) nudrodta
~. follows an overload on the fatigue crack growth retardationbehavior of the 7075 and 2219 aluminum alloys. A very dis-tinct effect on retardation with hold time is observed. Theeffect is microstructure dependent with the time dependence,
,~V, fCU~kITY CLASSIFICIATION 07TISA_ Womafb.

SECURITY CLASSIFICATION OF THIS PAOE("onw Data Enfored)
Block 20 con't.
Vbehavior extending over a longer period for the high strengthmaterials. This well-defined time dependence clearly showsthat lifetime predictions based on accelerated short hold timetests could be very non-conservative. The influence ofhumidity was also determined using vacuum as a referenceenvironment.
The second'aspect of the research investigated the natureof the residual displacement, d, that leads to the crack clo-sure phenomena. In this aspect of the study, d was determinedusing a compliance gage on the side of the specimen and thecrack tip was monitored simultaneously with an acoustic trans-ducer. Results for varying AK in a humid environment showedthe possiblility of measuring d, using it in a finite elementmodel to predict the crack closure load. This could then beused to predict AKeff and ultimately fatigue crack growth.This trend was not followed when the d value was determinedin a variety of environments. In fact an inverse correlationbetween d and crack closure and fatigue crack growth rate wasobserved. This was interpreted in terms of the unconstrainedplane stress surface region. Measurements are also reportedshowing that there is closure in the interior plane strainregion that is modified if the outer region is machined away.
ii The results in the d aspect of the study was to reduce thelikelihood of the use of surface measured d as a useful set ofdata to use in analytic lifetime predictions.
) The last major emphasis was to investigate how gaseousenvironments interact with fatigue crack growth in aluminumalloys. Combined AES/SIMS studies were made of fracture sur-faces taken from fatigue crack growth specimens fatigued invacuum and subsequently exposed to and fatigued in a range ofenvironments./ The environments included 02, 018, H2 , D2 , D2 0,H20 and N2. Ph results showed a deeper penetration.of oxygenduring fatigue. X.The deuterium was trapped near the surface
for the sample fatigued in D2 0 but not for the sample fatiguedin vacuum and subsequently exposed to D20. To help interpretthe results, deuterium was ion implanted into an aluminumspecimen with varied surface conditions including the fatiguefracture surface. The diffusion of the deuterium from theimplanted distribution was monitored by combined inert ionsputtering and SIMS. The deuterium profiles obtained in thefatigue studies were reproduced by the ion implantation exper-iments leading to the conclusion that many strong trappingsites were produced near the fracture surface during thefatigue crack growth. A model using an image force techniquewas developed to explain some of the observed diffusionresults for the ion implanted deuterium experiments.
sEC-URITY CLASSIFICAT1ON OF T--- PA E(IWien Date Erie,

ERFOSR-TR- 02~O 33m
I 4INDEX '' !, ," I ",
Page Title AP P o for puare eR sO
distribution unlimited.
1-2 I. Introduction
2-3 II. The Influence of Underload Time on overloadCrack Retardation
4-5 III. Ultrasonic Transmission Through a RoughInterface
5-8 IV. Evaluation of the Residual Displacement,d, Associated with Crack Closure
8-11 V. The Interaction of Gases with the Crack inAluminum during Fatigue Crack Growth
11-13 VI. Summary
14-16 Appendix A, "The Influence of Underload Time onCrack Growth Retardation of Aluminum Alloys."
17-31 Appendix B, "Effect of Hold Times on Crack Retar-dation in Aluminum Alloys."
32-35 Appendix C, "A Model for Fatigue Crack ClosureBased on Surface Roughness and ResidualStrain."
36-53 Appendix D, "Fatigue Crack Closure and ResidualStress Measurements on Aluminum Alloys."
54-57 Appendix E, "Edge Effects on Fatigue Crack Clo-sure of Aluminum Alloys."
58-62 Appendix F, "The Influence of Fatigue Crack Sur-face Roughness on Acoustic Wave Transmission."
63-79 Appendix G, "Development of a Model to PredictTrue Fatigue Crack Size Using Acoustic WaveTransmission."
80-82 Appendix H, "Oxygen Transport during FatigueCrack Growth."
83-85 Appendix I, "Application of SIMS and AES to
Environmental Studies of Fatigue Crack Growthin Aluminum Alloys."
86-101 Appendix J, "SIMS Study of Deuterium Trapping in
Ion Implanted Aluminum Alloys,"
102-103 Publication List

THE INFLUENCE OF HOLD TIMES ON
FATIGUE CRACK GROWTH OF ALUMINUM ALLOYS
FINAL REPORT
H.L. MarcusDepartments of Mechanical Engineering and
Materials Science and Engineering
The University of TexasAustin, Texas 78712
I. Introduction
This report will describe the results of a series of
*r experiments whose primary aim was to clarify the fatigue
crack growth behavior of aluminum alloys. The results are
presented in a condensed form in the main body of the report
with the details of the results in a series of appendices,
which in general are either preprints or reprints of papers
submitted for publication. The major literature references
are also included in the write-ups in the appendices.
There were several aspects of fatigue crack growth in
aluminum alloys that were investigated. The first was the
study of the influence of hold time at an underload after
an overload on the crack retardation behavior of the aluminum
alloys. As part of this effort, the crack closure behavior
of the material was observed using ultrasonic and compliance
techniques. To clarify the ultrasonic technique, a study on
the acoustic energy transmissions through an interface was
made. A second part of the study was an attempt to identify
AI. r..
A.
-2-
the cause of crack closure in terms of the nature of the
material in actual contact. An added incentive to getting a
direct measure of the origin of crack closure by a measure-
ment of the amount of residual displacement was its potential
use as a characteristic number for closure load prediction.
This could be used for crack growth prediction using finite
element methods to define AKeff -
In order to evaluate this behavior, a series of experi-
ments were performed in hard vacuum and a range of gaseous
environments. The aluminum alloys 2219-T851 and 7075-T651
were used in the studies in the above conditions and in the
lower strength level overaged condition.
To further characterize the fracture surfaces a series
of secondary ion mass spectroscopy (SIMS) and scanning
auger microscopy (SA4) experiments were performed on samples
fatigued in gaseous environments including 0 18, D2 0, D2 and
vacuum. Additional ion implantation SIMS studies were done
to assist in evaluating the observed fatigue results.
II. The Influence of Underload Time on Overload Crack
Retardation
It is well known that an overload during a constant
load amplitude fatigue crack growth study will greatly
retard the subsequent crack growth. In addition, an under-
load following the crack growth reduces the magnitude of
the retardation phenomenon. In this study the influence of
LN~-~~ 41 -'

-3-
hold time at an underload after an overload was investigated
in 7075-T651 and 2219-T851 and in their overaged condition
for a range of loading and environmental conditions. The
details of these results are presented in Appendices A and B.
The main results of the underload study were the following:
1) A significant reduction in retardation due to an overload
is observed for a zero load underload when the underload is
held for 24 to 48 hours. If this hold time effect is not taken
into account, the predicted lifetime based on the accelerated
short underload time tests can be more than twice the actual
life.
2) The time required for the underload to complete its relax-
ation is a function of the strength level of the material.
For both the 2219-T851 and the 7075-T651 alloys the relaxation
effect due to the underload is approximately complete after 24
* hours but is significantly less when the material is overaged
to significantly reduce the yield strength.
3) There is a difference in the underload hold time effect
humid air (relative humidity between 5 and 50%) with a
greater relaxation effect seen in humid air.
4) The retardation seems to be related to crack closure
resulting from the crack tip being enclosed by the residual
deformation and displacement from the overload. Hold time at
underloads apparently reduces the magnitude of the residual
displacements through some room temperature relaxation effect.
-4-
III. Ultrasonic Transmission Through A Rough Interface
In the studies reported here the measurement of crack
closure using ultrasonic transducers is heavily emphasized.
One of the major questions about this technique to identify
the closure load is how much force across the fracture surface
is required to transmit the acoustic wave. In principle, the
transmission across a very thin air gap can be significant.
To determine the stresses require a series of surfaces of
the aluminum alloys were prepared with a wide range in sur-
face roughness. The ultrasonic signal transmitted through
this interface was then measured as a function of applied
load. The results clearly demonstrated a normal stress of
1the order of five to twenty percent of the yield strength was
required for significant transmission of the ultrasonic wave.
Virtually no signal was transmitted when the blocks lay at
rest on each other. Based onthese results, the details of
which are given in appendix C, the ultrasonic closure measure-
ments were considered to be realistic since a significant com-
pressive stress was required for transmission of the signal.
No attempt was made to evaluate diffraction effects on the
transmitted ultrasonic wave associated with the change in
crack tip shape during the loading cycle.
As an outgrowth of these measurements a model was developed
to identify the true crack length using ultrasonic measurements
when the crack is partially closed. To accomplish this
-5-
nondestructive evaluation of the crack length, the stress and
roughness dependence of the transmitted acoustic energy is
integrated to give the measured ultrasonic intensity. This
approach could be used in either the transmitted or back-
scattered mode. The details of the model are given in
appendix D where several specific crack and transducer geo-
metries are discussed.
IV. Evaluation of the Residual Displacement, d, Associated
With Crack Closure
In the Elber model of crack closure the two fracture
surfaces can come in contact during the low end of the ten-
sion cycle only if displacement above the theoretical plane
of the crack exists. This residual displacement, d, has
several potential origins including surface roughness, volume
increase due to deformation including the constant volume
effect and formation of an oxide on the surface. The con-
stant volume effect associated with the plastic deformation
will be most significant in the vicinity where the crack tip
intercepts the surface of the sample. In this region the
plane strain condition is relaxed and the behavior is more
closely simulated by a plane stress description.
In considering how to analyze the residual displacement,
several approaches were taken. In the first approach, it was
assumed that if you could measure the d value, it would be
'07'

-6-
representative of the crack closure behavior. If this was
true, the crack closure load could be calculated using a finite
element model where the measured residual displacement was
introduced onto the idealized fracture surface. A description
of the measurement of d using surface clip-on gauges and the
finite element model is given in appendix E. In this case the
value of d was determined in a humid environment and the d
value determined was found to increase with the closure load.
Good agreement was found over a limited AK range between the
ultrasonically measured crack closure load and the crack clo-
sure load calculated from the finite element model.
If this correlation between d and the crack closure load
could be confirmed over a wide range of loading and environ-
mental conditions, the possibility would then exist to measure
d for any expected load history, and using the finite element
analysis predict the closure load and directly be able to cal-
culate life. In order to more closely examine this correlation
a series of measurements were performed in vacuum and in humid
air. The details of these experiments are given in appendix F.
There were several conclusions of interest coming from these
results. The first was the fact that the measured value of d
determined by running the crack in the compact tension specimen
through a clip-on gage mounted on the surface was inversely
proportional to the crack closure load measured ultrasonically
and the crack growth rate as a function of relative humidity.
-. . . ..- .

~-7-
This was totally opposite to what was expected. To evaluate
this, a series of experiments were run measuring d and crack
closure where the crack was grown in vacuum and then various
gaseous environments were introduced. It was found that the
d value increased dramatically when water vapor was introduced
but the ultrasonically measured crack closure load was lowered.
The introduction of N2 had no effect and 02 a very small effect.
The results led to the conclusion that the humidity influenced
the near surface plane stress region to a much greater extent
than the interior. A possible explanation is the oxide
strengthening of the asperities led to the increase in d.
This sequence of results clearly demonstrated that the
concept of using surface measured d values to predict overall
crack closure was not a viable approach. In fact it pointed
out the extreme caution that must be used in interpreting any
surface strain measurement.
Another factor in the measurement of crack closure is the
question of whether it is only a plane stress phenomena. To
clarify this point, crack closure was measured on a sample
using ultrasonic methods. The outsides of the sample were
then machined away and the closure load remeasured. The
details of these measurements are given in appendix G. Crack
closure was present in the ultrasonic measurements in the cen-
tral plane strain region of the specimen before machining.
The crack closure load was decreased when the outer plane

-8-
stress region with the high d was removed. This was due to
the lack of the high d outer region propping open the center
of the crack during the unloading cycle. The results clearly
demonstrate that crack closure occurs in the plane strain
region.
V. The Interaction of Gases with the Crack in Aluminum During
Fatigue Crack Growth
The final area of investigation probing the fatigue
crack growth in aluminum alloys was the attempt to evaluate
the interaction between the gaseous environments and the
fatigue crack. In this study an attempt was made to identify
where the elements went relative to the surface. The fatigue
experiments consisted of running a fatigue crack in vacuum
for a short way and then introducing the gaseous environment
and continuing the fatigue crack growth. The environments
studied included vacuum, 02, N 2, H20, D 20, 021 02 , and D2
The samples were removed from the mechanical test chamber
after fatigue crack growth was completed and transferred to
the SAM/SIMS system. The details for these studies are given
in appendices H, I and J. In all cases inert ion sputtering
combined with AES and SIMS was performed in the fracture sur-
face formed in vacuum and subsequently exposed to the gas and
on the surface formed in the gas. In the case of oxygen, it
was consistently found that the oxygen penetrated deeper into
the fatigue crack fracture surface than the normal oxide
-9-
thickness associated with diffusion (appendix H). This was
true for the oxide formed in both gaseous oxygen or in the
presence of water vapor. This extra penetration from dry
oxygen did not seem to enhance the fatigue crack growth rate
in the aluminum alloys, although it did in the Ti and Ni/Cu
alloys that were also tested. This lack of enhanced fatigue
crack growth in the aluminum alloys exposed to dry oxygen
even though the oxygen was deeper into the surface could be
an indication that in tb- case of water vapor the enhanced
crack growth rate is probably not associated with the enhanced
oxygen presence. This would leave the hydrogen originating
from the water as the element most likely enhancing the
fatigue crack growth of the aluminum alloys.
In order to evaluate the region of hydrogen interaction,
SAM/SIMS studies were performed on the fracture surface of
the alloys fatigued first in vacuum and then in D20. The
deuterium was used as a marker to control hydrogen contami-
nation arising during the transfer between the fatigue envi-
ronmental chamber and the SAM/SIMS vacuum chamber. The SAM
was used to monitor the oxygen peak and the SIMS the deuterium
peak during the inert ion sputtering (appendix I). The
results for the D20 measurements show a much greater penetra-
tion of deuterium into the fracture surface created during
exposure to D2 0 than the segment exposed to D20 after the
fatigue crack was formed.
-10-
The results were obtained about 24 hours after the
fatigue crack growth took place. If there were no strong
trapping sites available for the deuterium, it should have
diffused out of the aluminum alloys during the time of
fatiguing and transfer. In order to investigate the pres-
ence of trapping sites, a series of deuterium ion implanta-
tion experiments were performed on the 7075 and 2219 alloys
that were initially in the unrolled, rolled, fatigue frac-
ture surface and unrolled but damaged by high energy neon
£i ion implantation prior to the time of the deuterium ion
implantation. For the details of the results and analysis,
see appendix J. The deuterium profiles obtained could be
broken into two categories. The first was for the unrolled
specimen, with and without neon ion induced damage. In
these cases the results were controlled by the surface oxide
acting as a diffusion barrier. To interpret this behavior,
an image force model for diffusion across the oxide surface
was developed. The results of the model closely correlated
with the experimental results. The second type of result was
obtained for the fatigued fracture surfaces and the cold
worked surfaces. In this case, the deuterium profiles were
very similar in depth beyond the oxide to that found in the
samples fatigued in D20. The profiles in the fatigued frac-
ture surfaces associated with the implanted deuterium were
formed by diffusion toward the surface with the trapping sites
filling during the exit of the deuterium. The samples
fatigued in D20 resulted in deuterium profiles where the
deuterium originates at the crack tip. The fact that both
resulted in similar profiles can be interpreted to mean that
the observed distribution is representative of the strong
trapping sites distribution. This distribution during
fatigue can influence the fatigue crack growth rate, butIthe mechanism of its influence is not modeled at present..X VI. Summary
The results of the research on fatigue crack growth in
aluminum alloys are described in three general areas. The
11 first relates the influence of hold time at an underload that
* follows an overload on the fatigue crack growth retardation
behavior of the 7075 and 2219 aluminum alloys. A very dis-
tinct effect on retardation with hold time is observed. The
effect is microstructure dependent with the time dependence
behavior extending over a longer period for the high strength
materials. This well-defined time dependence clearly shows
that lifetime predictions based on accelerated short hold time
tests could be very non-conservative. The influence of
humidity was also determined using vacuum as a reference
environment.
The second aspect of the research investigated the nature
of the residual displacement, d, that leads to the crack clo-
sure phenomena. In this aspect of the study, d was determined

-12-
using a compliance gage on the side of the specimen and the
crack tip was monitored simultaneously with an acoustic trans-
ducer. Results for varying AK in a humid environment showed
the possibility of measuring d, using it in a finite element
model to predict the crack closure load. This could then be
used to predict AKeff and ultimately fatigue crack growth.
This trend was not followed when the d value was determined
in a variety of environments. In fact an inverse correlation
between d and crack closure and fatigue crack growth rate
* observed. This was interpreted in terms of the unconstrained
plane stress surface region. Measurements are also reported
showing that there is closure in the interior plane strain
14 region that is modified if the outer region is machined
__ away. The results in the d aspect of the study was to
reduce the likelihood of the use of surface measured d as a
useful set of data to use in analytic lifetime predictions.
The last major emphasis was to investigate how gaseous
environments interact with fatigue crack growth in aluminum
alloys. Combined AES/SIMS studies were made of fracture sur-
faces taken from fatigue crack growth specimens fatigued in
vacuum and subsequently exposed to and fatigued in a range of
environments. The environments included 0 02 8 , H2 , D2 , D20,
H2 0 and N2 . The results showed a deeper penetration of oxygen
during fatigue. The deuterium was trapped near the surface
for the sample fatigued in D20 but not for the sample fatigued
-13-
in vacuum and subsequently exposed to D20. To help inter-
pret the results, deuterium was ion implanted into an alumi-
num specimen with varied surface conditions including the
fatigue fracture surface. The diffusion of the deuterium from
the implanted distribution was monitored by combined inert
ion sputtering and SIMS. The deuterium profiles obtained in
the fatigue studies were reproduced by the ion implantation
experiments leading to the conclusion that many strong trapping
(: sites were produced near the fracture surface during the
.w fatigue crack growth. A model using an image force technique
was developed to explain some of the observed diffusion
results for the ion implanted deuterium experiments.
4 - -
-14-
Appendix A
THE INFLUENCE OF IINDERLOAD TIME ON CRACK GROWTII RETARDATION OF ALUMINUMALLOYS
GranviZe Sewell and H. L. MarcusMechanical Engineering/Materials Science and Engine'eringT/te University of Tc.xas at Austin
Austin, Texas 78712 USAtel: 512/471-1136
It is now well known that an overload applied during a metal fa-
tigue crack growth experiment causes crack growth retardation 11,2,31.In addition, underloads subsequent to the overload tend to reduce theretardation phenomena [11]. It has been reported that time at smallunderload does not seem to play a significant role in its influence onthe retardation behavior [3). The data presented here, however, wherethe underload is greater, do show such a time effect. This question isof particular significance in terms of relating accelerated laboratorytests to the actual loading seen during the service lifetime of a struc-ture designed to the fatigue crack growth behavior of the material.
Fatigue crack growth experiments were carried out on an Al 2219-T851 (o 50 ksi) compact tension specimen (B = 1 in, W = 4.25 in,11 = 2.0_ in). Baseline tension-tension loading consisted of a 10 Hz
sine wave whose mean value and amplitude are varied so that at eachpoint where an overload is applied (4 points per sample, spaced 3/8 inapart), Kmin = 4 ksi/in and K = 12 ksi/in. The overload is suchthat K . 30 ksi/n (Kl_ 40 ksi/in). Testing is done on anMTS close oop electro-hydraulic testing machine, in room air withrelative humidity between 30% and 55%.
Crack depth is plotted versus number of cycles. The extension ofthe steady-state growth lines before and after the overload should be
roughly parallel, with a separation of a certain number of cycles whichwe will call the delay.
The relative crack depth is measured by the attenuation of a trans-mitted longitudinal ultrasonic wave, transmitted and received by two2.25 Mi11: piezoelectric transducers. The received signal is convertedto a DC signal and is plotted against load. This plot is not only ameans of monitoring crack growth, but also shows the crack closure ef-fect reported in (2,3,41, that is, that the crack effectively closes atloads below some Pc > Pmin-
An underload of varying magnitude and duration was applied aftereach overload. Each test was repeated three times, never twice on the
same sample or at the same crack length. Results are summarized inFigs. I and 2.
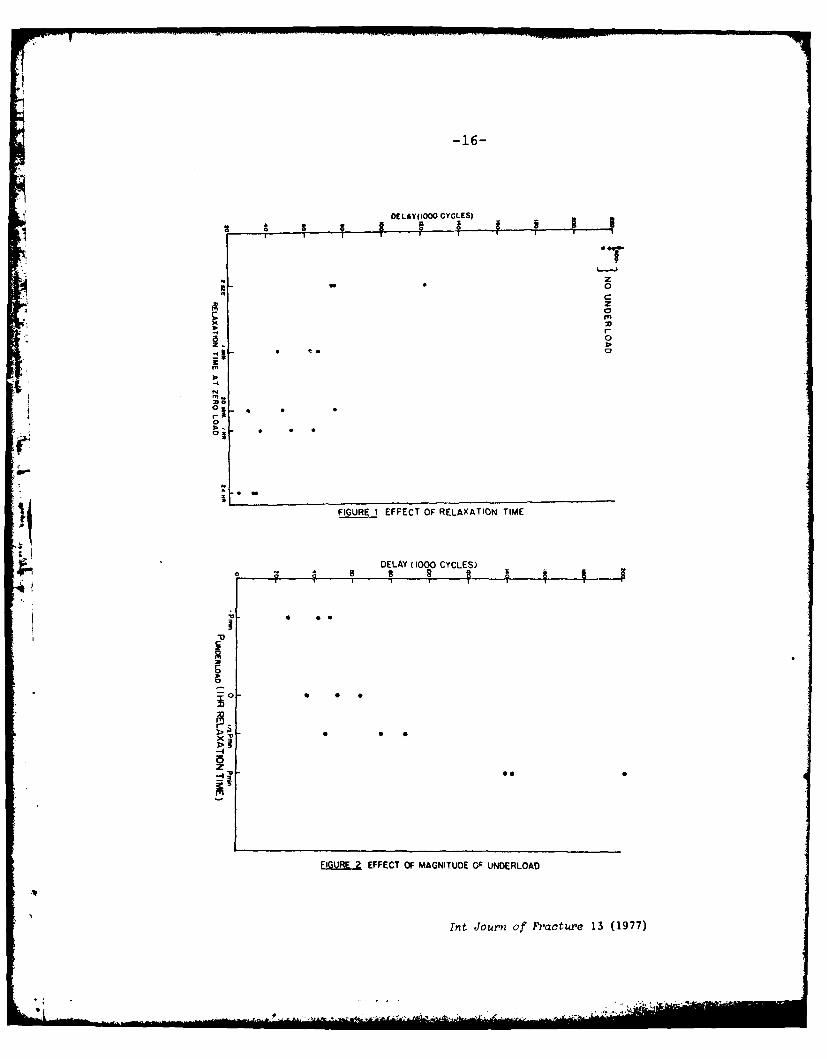
The extent of the retardation delay decreases with the time at zeroload (Fig. 1) and also with the magnitude of the underload (Fig. 2),The significant result shown here is the influence of holding time atzero load. A decrease of about 50% in retardation delay is caused by
an underload of about 2 sec. Extending the hold time to 24 hr reduces
this by about another 30%. The impact on design philosophy would beeven greater if the 2 sec hold time represents the accelerated testsand the 24 hr represents the real loading history.
mnt Journ of Fracture 13 (1977)
~-15-
tl.sing the crack closure model (2,41, what happens is that when base-line loading is rsumed, the crack is not fully open and the crackgrowth rate is reduced and will not return to the steady-state value un-til the two rough crack ,urfaces created during the overload becomesmooth through cyclic contact. During the underload, these two surfacesare smoothed as they are pressed together. Time at underload then in-creases this smoothing due to a strain relaxation process.
Additional experimental effort is now being performed to determinethe influence of strength level, microstructure, humidity, and otherloading histories on this relaxation behavior, and an attempt will bemade to model the strain relaxation phenomena.
icAcknowledgments: This research is sponsored by the Air Force Of-fice of Scientific Research, Air Force Systems Command, USAF, underGrant No. AFOSR 76-2955.
REFERENCES
(1] R. 1. Stephens, D. K. Chen, B. W. iom, Fatigue Crack Growth UnderSpectrum Loads, STP 595, American Society for Testing and Mater-ials, Philadelphia (1976) 27-40.
[2) Otto Buck, J. D. Frandsen, J. L. Marcus, Fatigue Crack Growth UnderSpectrum Loads, STP 595, American Society for Testing and Materials,1! Philadelphia (1976) 101-112.
[31 W. N. Sharpe, Jr., D. M. Corbly, A. F. Grandt, Jr., Fatigue Crack
Growth Under Spectrum Loads, STP 595, American Society for Testingand Materials, Philadelphia (1976) 61-77.
[4] W. Elber, Damage Tolerance in Aircraft Structures, STP 486,American Society for Testing and Materials, Philadelphia (1971)230-242.
79 January 1977
Int Journ of Frartuie 13 (1977)
64!
OELAYIIOOO CYCLES)
- z- 0
z
0
-4
0
FIGURE I EFFECT OF RELAXATION TIME
DELAY (1000 CYCLES)
S B - -
I *
-u
FIG~URE2 EFFECT OF MAGNITUDE OF UNDERLOAD
rmt Journ of Fracoture 13 (1977)
-17-
Appendix B
Effect of Hold Times on Crack Retardation
In Aluminum Alloys
W.P, Slagle, Deepak Mahulikarand H.L. Marcus
Department of Mechanical Engineering andMaterials Science and Engineering
The University of TexasAustin, Texas 78712
Introduction
The phenomenon of crack retardation following an over-
(1-41Iload has been studied extensively It is also reported
in the literature that an underload following an overload
tends to reduce the retardation phenomenon 14-6] Effects of
hold times on this reduction in delay have also been investi-
gated to a certain extent Such time effects could be
significant in correlating laboratory data from accelerated
life tests to real life fatigue performance of engineering
structures.
In this investigation, hold time effects on fatigue
crack retardation in two high strength aluminum alloys, 2219
and 7075, were studied. Influences of different metallurgical
conditions and different environments were examined.
Many of the observations in this research will be dis-
cussed in terms of crack closure model proposed by Elber[8 ]
and in terms of strain relaxation effects proposed elsewhere
[9,10]. It has been suggested that underloads following over-
loads reduce retardation due to strain relaxation at the crack
t L ___........ .... . .. ..___ <r 1

9-18-
tip [9 ]. This phenomenon can take place due to dislocation[lp10 ].
cross slip In that case longer hold times should cause
shorter delay periods which was observed by Sewell [6'9 ]. But
Sharpe et al [7 ] found only a slight correlation between hold
time at zero load and the number of delay cycles [ND] while
Chanani[11] reported no trend between N D and hold time at
mean load following an overload.
An aggressive environment can affect the extent of plastic
deformation. Retardation is expected to increase in vacuum or
dry atmospheres as compared to moist air. This trend was
owl reported by Sewell [1 41 Buck et al [1 2 ] observed lower
values of AKeff in dry nitrogen than in moist air.14 Mrcus[6]Sewell and Marcus report experiments where each over-
load was followed by one hour relaxation at an underload of
variable magnitude. The results indicated that there was a
reduction in delay with increasing magnitude of underload.
In low humidity (<5%RH) experiments, they observed that all
the phases of crack growth experiments slowed down. These
include steady state crack growth and crack growth following
any overload-underload combination. A decrease in delay with
increase in holding time at zero load was again evident.
Because of these conflicting results it became necessary
to study the effect of hold times on the retardation phenome-
non. This investigation concerns with hold time experiments
in vacuum and humid air for aluminum alloys with different
I . ,. .,-

-19-
metallurgical treatments. Crack growth and retardation data
was obtained for various hold times. The results are then
interpreted in terms of crack closure model.
Experimental Procedure
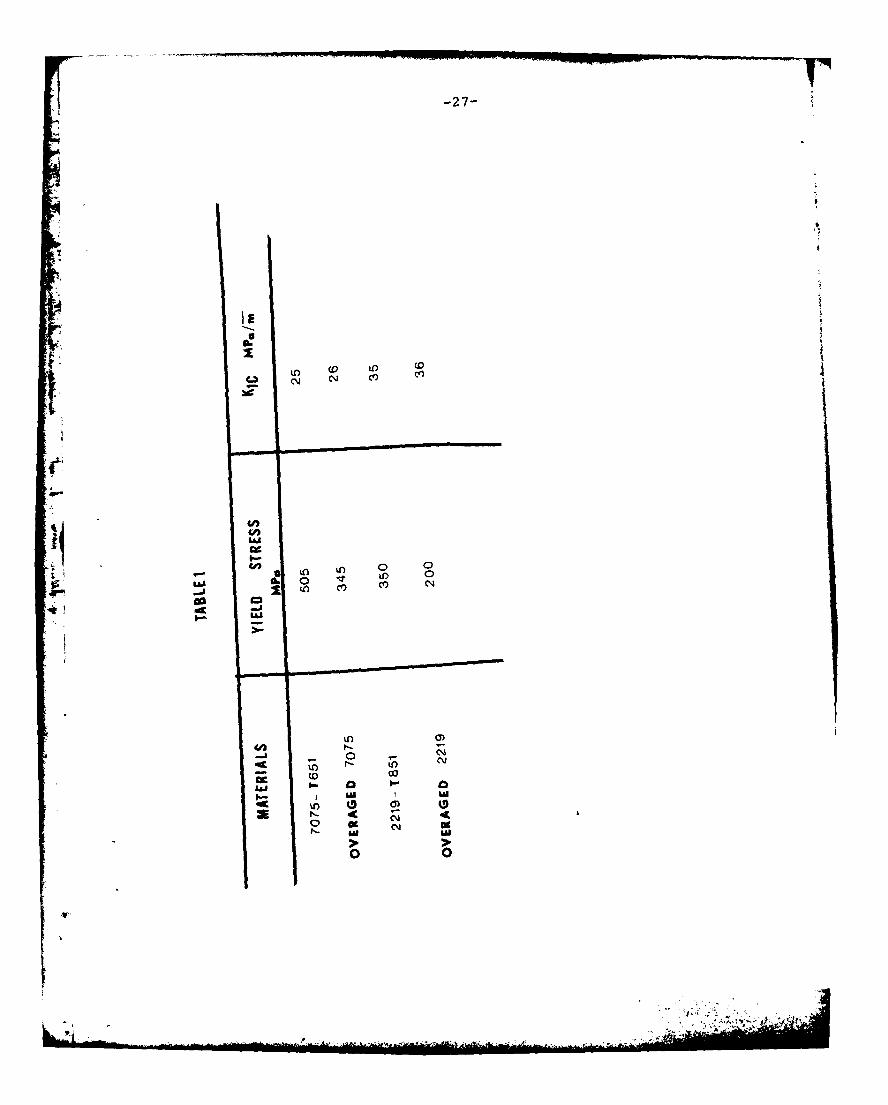
Experiments were performed on the aluminum alloys 7075-
T651 and 2219-T851, as well as overaged 7075 and 2219. The
mechanical properties are given in Table 1. Experiments
were carried out in humid air and in a hard vacuum systemn
(0.1 iPa).
The experiments were performed on compact tension speci-
mens with B = 2.54 cm., W = 10.8 cm and H = 5.3 cm. The
specimens had a T-L orientation. An MTS closed loop electro-
hydraulic fatigue testing machine was used for loading. All
the cycling was sinusoidal tension-tension at a frequency of
10 Hz for a constant range in stress intensity, AK, and load
ratio, R. Crack closure and crack growth was measured using
2.25 MHz longitudinal ultrasonic waves in transmission. The
details of the technique are described elsewhere [9'12 '13 ]
A clip on gage at the crack mouth was also used to monitor
closure and growth.
The actual relaxation experiments were performed by first
growing the crack for at least 48 mm before each overload.
This allowed the crack to reach its steady state crack growth
rate for the applied AK and allowed the plastic zone to sta-
bilize. During the preliminary growth, the ultrasonic intensity
-20-
was periodically recorded along with the number of cycles
N. At a predetermined crack length, an overload KOL, was
applied at approximately 0.1 Hz followed immediately by an
underload to zero. The load was maintained at zero for a
specified hold time and then raised to the mean load where-
upon baseline cycling was resumed. Immediately following
the overload, crack retardation was observed and the ultra-
sonic signal would remain constant. After several thousand
cycles crack growth would start again and the retardation
measurements would be made until steady state da/dN was
resumed. The number of delay cycles, ND, was then deter-
mined using a tangent method[l 0].
Four overloads spaced 9.5 mm apart were applied to each
specimen. This distance was chosen on the basis of observa-
tions by Wei 1 4 ] which indicates no interaction effect for a
distance greater than 13 times the size of the plastic zone.
To minimize any possible interaction effects, the tests were
varied so that no hold time was repeated on the same specimen
or at the same crack length. The overloads were applied at
crack lengths of 2.7 cm, 3.65 cm, 4.6 cm and 5.56 cm so that
all tests were performed in the range 0.25<a/w<0.51.
Load Parameters
1. Humid air: The 7075 alloy experiments were conducted with
loading parameters of Kmin = 3.3 MPa/mh, Kmax = 9.9 MPaVrm and
-21-
KOL = 22 MPaV/m. The 2219 alloy experiments were performed
with Kmin = 4.9 MPa/im, Kmax = 13.2 MPaiii and KOL = 29.7 MPa/im.
Hold times were with K = 0.
2. Vacuum: The retardation experiments were repeated in
0.1 pPa vacuum for 7075-T651 alloy. The load parameters
were Kmin = 1.1 MPa/ii, K ma x = 11 MPav/m and K OL= 22 MPa/m.
This larger value of AK was used since crack growth was
significantly slower in the vacuum environment.
Results and Discussion
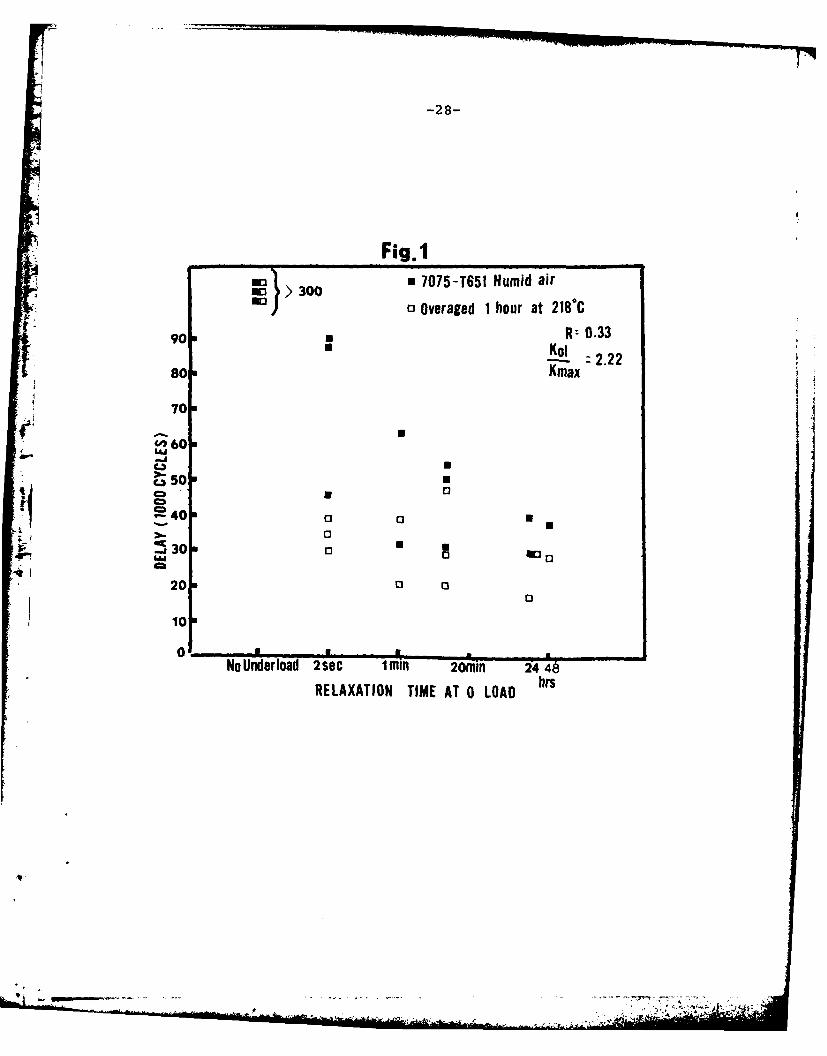
Humid air: The data from 7075-T651 alloy experiments appears
in Fig. 1. Without an underload, the delay times were so long
(over 300 K cycles) that the tests were aborted before the
crack started propagating again. These long delay times were
probably due to large plastic deformation at the crack tip
caused by the KOL which was very close to KIC of the material.
Application of an underload to zero immediately following an
overload caused a great reduction in the number of delay cycles,
and holding the 7075 specimen at the underload reduced ND even
more. A steady reduction in retardation was observed as the
hold time was increased, and it seemed to level off after 24
hours.
In the overaged 7075, most of the reduction in the retarda-
tion due to overload occurred immediately. A two-second hold
time at zero load caused a significant decrease in delay. Only
.. '21.
-22-
a small further decrease was observed as the hold time
increased. The indication was that relaxation effects occurred
more quickly in the lower strength 7075 overaged material.
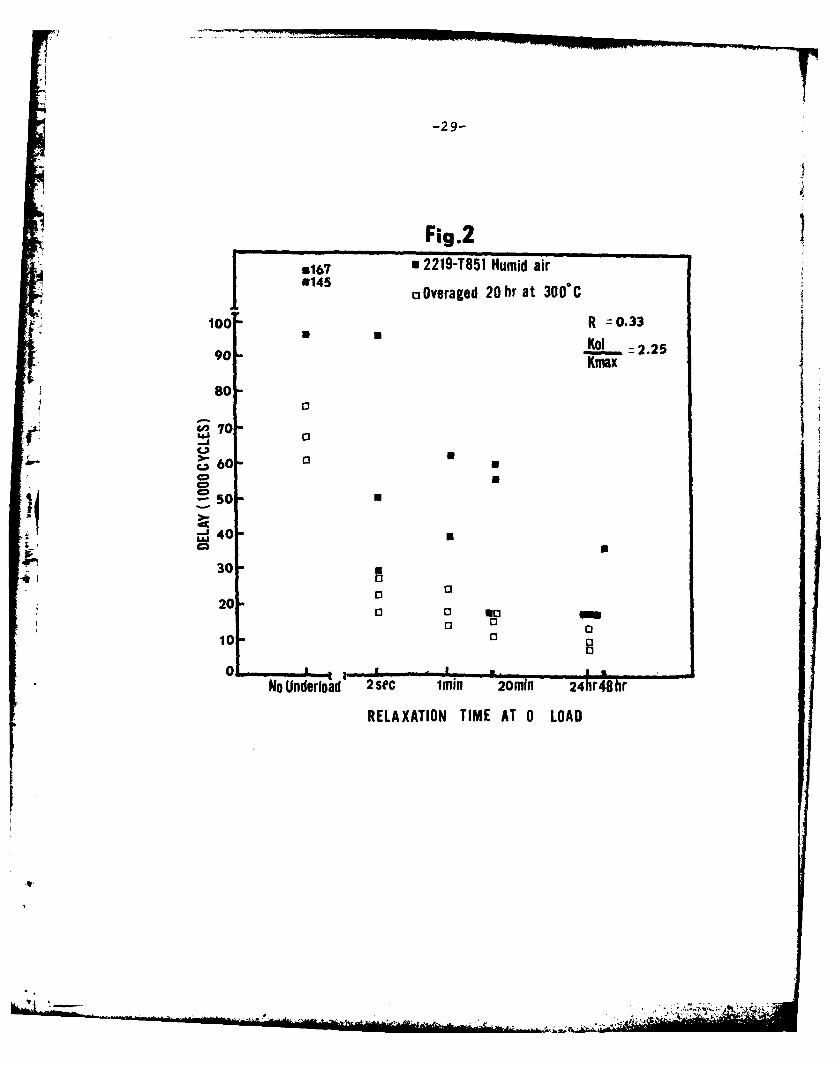
The data for 2219 alloys is presented in Fig. 2. The
results show that for both 2219-T651 and overaged 2219 alloys,
a substantial decrease in retardation due to the application of an
underload after the spike is observed. This trend was similar to
that in 7075 alloys. The ND values for no underload for the
overaged 2219 were less than those for the T851. Reduction in
ND for the hold tire experiments showed a similar trend.
Vacuum: The overload followed by zero load hold time data for
7075-T651 alloys in0.1iPa vacuum is presented in Fig. 3. Again,
as in the humid air tests, there was a significant reduction
in delay cycles with increasing time at underload.
More relaxation seemed to occur in humid air hold time
tests than in vacuum tests. This may have been partially due
to differences in loading conditions of vacuum and humid air,
but nevertheless the results do indicate that relaxation effects
are significant in vacuum but are not as great as in humid air.
Strain Relaxation
The above results can be explained in terms of strain
relaxation in the vicinity of the crack tip. The dislocation
cross slip mechanism which results in relaxation, is less
active in vacuum than in more aggressive environments like
humid air [B . Overaging causes a significant decrease in the
__________ - - ---- - -- 4
-.23-
delay times compared to the high strength probably due to
the residual strain at the crack tip relaxing out more
easily for the lower strength materials. Sanders et al [1 6 ]
suggest that because of coarsening of the dispersoids, over-
aging may reduce the number of secondary cracks at the maincrack front resulting from fracture at particle matrix inter-
face. This decrease in crack branching causes stress inten-
sity at the main crack tip to increase resulting in faster
Scrack propagation and decrease in delay.
Crack Closure
If strain relaxation is occurring in the vicinity of
r4 crack tip during overload-underload cycle, then it should
cause a noticeable change in crack closure load. To verify
this, experiments were carried out on overaged 2219 alloys with
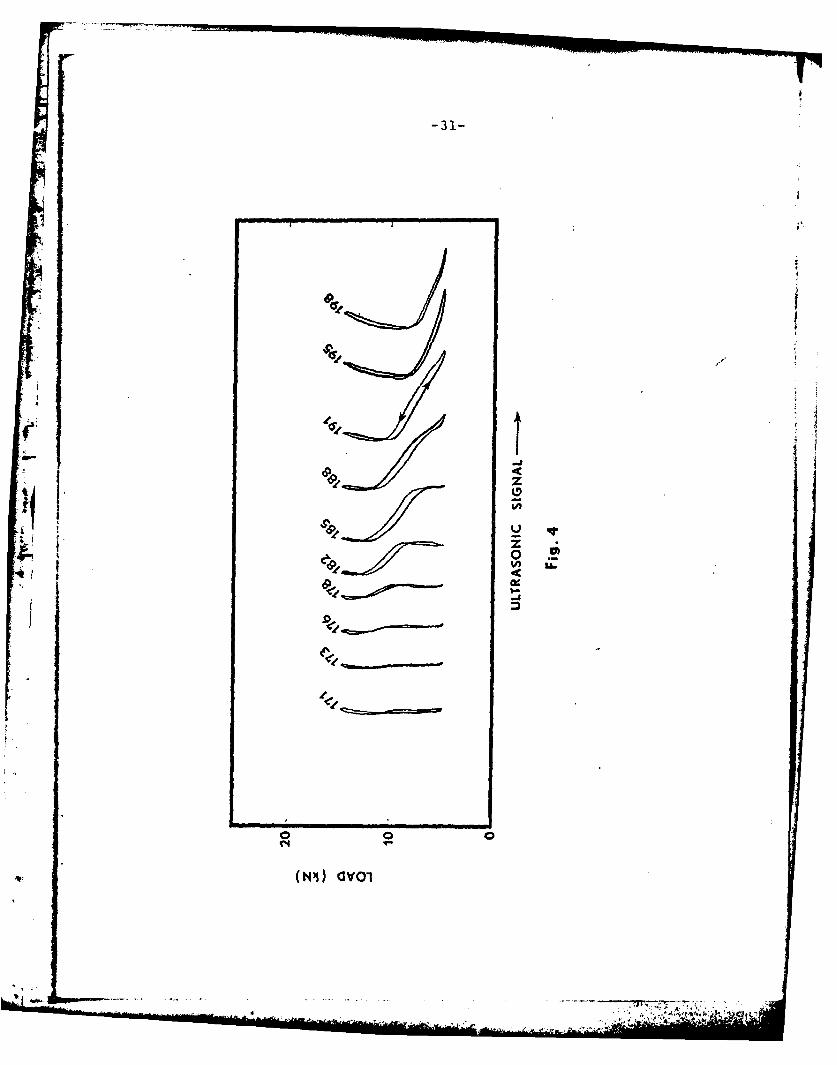
load parameters mentioned earlier. The ultrasonic observations
are shown in Fig. 4. These closure curves indicate that at the
beginning of the delay period immediately following the overload-
underload sequence, the closure curve is almost completely
vertical (N = 171000). Here the crack tip is completely closed,
but the material which has been plastically strained by the
overload is preventing the crack surfaces from closing any fur-
ther. As cycling continues, the shape of the curves begin to
change. The curves first begin to shift to the left indicating
that the tip is just beginning to open at the higher position
of the load cycle. Two inflexion points become apparent
-- -.. . .
--24-
indicating the crack closes a short distance. Soon the
bottom of the curve smooths out. A well defined closure load
becomes evident and it decreases with cycling to pre-overload
value.
The closure data presented here seems to indicate that
overload strained material which has been wedging the crack
I! surfaces apart has been gradually hammered down. If this
noticeable change in closure curves does imply hammering, it
should show up on the fracture surface also. To look for such
hammering, cross sections of the fracture surface of the 2219-
T851 specimen were examined with an optical microscope. The
overload region appears to be smoothed down or smashed down
as compared to fast fracture region. This gives some visual
evidence of hammering.
Thus delay after overload-underload cycle is associated
with noticeable change in closure behavior of the crack tip.
Although it is not clear whether the closure observations were
a cause or an effect of crack behavior, the measurements were
useful in studying changes at the crack tip during holding at
zero load.
Conclusions
1. As hold time at zero load increased the number of delay
cycles decreased for 7075-T651, 2219-T851 and overaged
7075 and 2219 alloys in humid air. This was also true
for 7075-T651 alloy in vacuum. This may be due to a
" .-.-. ,,. - - . '
-25-
time dependent strain relaxation of the residual strain
created by the overload.
2. The relaxation effects were greater in humid air than in
vacuum.
3. For the same load spectra, the overaged alloys exhibited
shorter retardation times than high strength alloys.
4. The delay periods for 7075-T651 in vacuum were signifi-
cantly higher than in humid air.
5. Changes in crack closure during retardation indicate that
surface hammering may be occurring during retardation.
Acknowledgement
This research was sponsored by the Air Force Office of
Scientific Research under Grant No. AFOSR 76-2955.
U:"Ii
I
-26-
References
* 1. Wei, R.P. and Shih, T., Int. J. of Fract., 10, 1974, p.77.
2. Buck, 0., J.D. Frandsen, H.L. Marcus, ASTM STP595, 1976,
P. 101.
3. D.M. Corbly, P.F. Packrnan, Engg. Fract. Mech., 5, 1973,
p. 479.__ _ _ _ _ _
4. Jonas, 0., R.P. Wei, Int. J. of Fract. Mech., 7, 1971, p. 116.
5. Stephens, R. I., D.K. Chen, B. W. Horn, ASTM STP595, 1976,
p. 27.
6. Sewell, G., H.L. Marcus, Int. J. of Fract. 13, (1977), p. 247.
j7. Sharpe, Jr. W.N., D.M. Corbly, A.F. Grandt Jr., ASTM STP595,
1976, p. 61.
8. Elber, W., ASTM STP 486, (1971), p. 230.
9. Sewell, G., Master's Thesis, The University of Texas at Austin,
1977.
10. Buck, 0., C.L. Ho, H.L. Marcus, Engg. Fract. Mech. 5, 1973,
p. 23.
11. Gallagher, J.P. and T.F. Hughes, AFFDL-TR-74-27, 1974.
12. Buck, 0., J.D. Frandsen, H.L. Marcus, Engg. Fract. Mech., 7,
1975, p. 167.
13. Slagle, W. Master's Thesis, The University of Texas at
Austin, 1979.
14. Wei, R.P., T.T. Shih, J.H. Fitzgerald, NASA CR-2239, 1973.
15. Hertzberg, R.W., Deformation and Fract. Mech. of Engg. Mat.,
John Wiley Press, 1976.
16. Sanders, J.H., Sawtell R.R., J.T. Staley, R.J. Bucci, A.B.
Thoakker, NADC N0019-76-C-0482, 1976.
-27-
U) C
I-'
I 0 Cf, Cf, C1
U))
Co CD
U)0 0
Q A( -I
-28-
Fig. 1~ > 300v 7075-T651 Humid air
o Overaged 1 hour at 2180C
901 R: 0.33
705
0160 :.2LUU
c.3 50
40a
20w
NoUnderload 2sec I M n 20omn 24 48RELAXATION TIME AT 0 LOAD hrs
-29-
Fig.2
[ 167 a 2219-T851 Humid air
a14 averaged 20Ohr at 300" C
100 R =0.33
90Ko 2 .2 5Kmax
go-C.,3
0 3
C.3 60 U
CU
'50-'4030-
20 0
10 0
of- -ANotinderload 2 SeC in 20mmn 24hr48hr
RELAXATION TIME AT 0 LOAD

-30-
Fig.3* 7075-T651 Vacuum
140R :0 l
Kmax1200
Co,
00 0
r 0
80 0
14 0600
No Underload 2sec 1ni omin 2 4 rsRELAXATION TIME AT 0 LOAD
-31-
e 00,e - -- - --- - - -
(NO avz
-32-
Scripill a VI I. .21 2.2. Vo'7; l'er11uS2)ot I're.. Inc.Printed iii th i ited ,t:tk,s
Appendix C
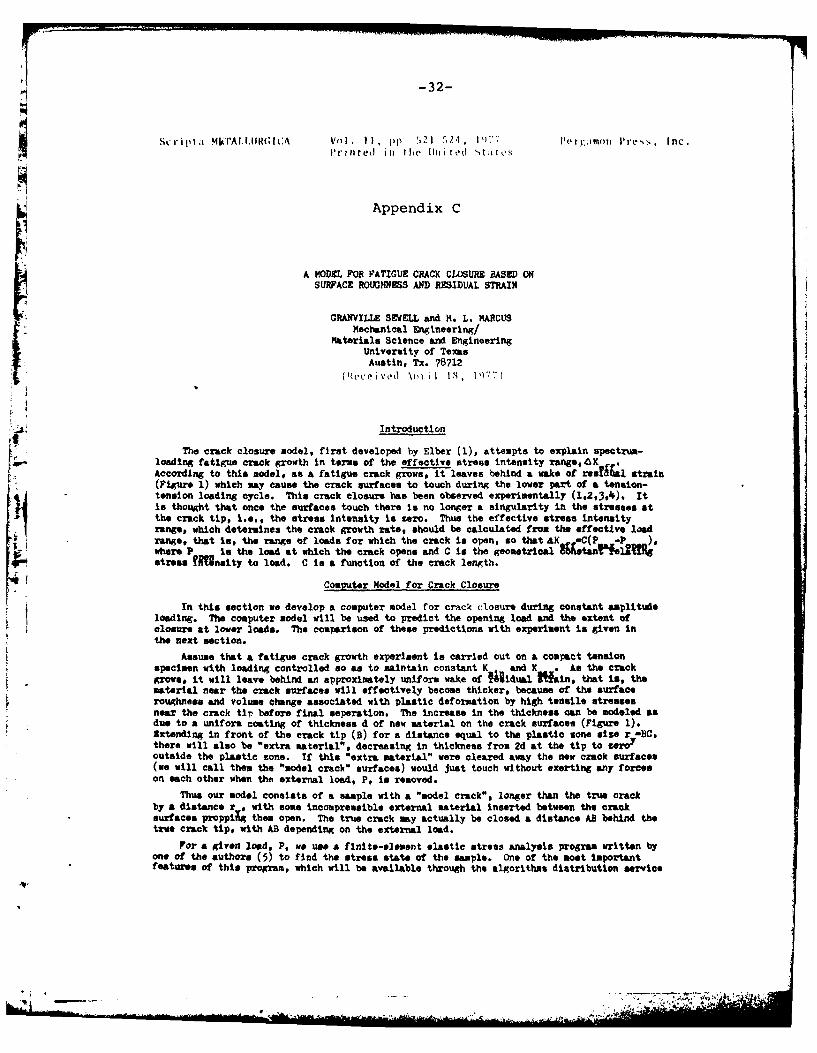
A MODEL FOR FATIGUE CRACK CLOSURE BASED ONSURFACE ROUGHNESS AND RESIDUAL STRAIN
GRANVILLE SEWELL and H. L. MARCUSMechanical Engineering/
Materials Science and EngineeringUniversity of TexasAustin, Tx. 78712
(1Z(., t' ive Vp ! N ti 1 1,8 , 11)77)
! : Introduction
s The crack closure odel, first developed by Elber (1), attempts to explAin pectrua-'4soding fatigue crack rowth in terms of the effective stress intensity rnge,4KAccording to this model, me a fatigue crack grws it leaves behind a wake of resfs&l strain(Figure 1) which may cause the crack surfaces to touch during the lower part of a tension-tension loading cycles This crack closure has been observed experimentally (1029304). itis thought that once the surfaces touch there is no longer a singularity in the stressed atthe crack tip, I.e., the stress Intensity Is zero. Thus the effective stress intensity
range, which determines the crack growth rate, should be calculated from the effective loadrange, that is, the range of loads for which the crack is open, so that AK -C(P -P ).where P in the load at which the crack opens and C Is the geometril 9fisant' aeltmstress 011sity to load. C is a function of the crack length.
Computer Model for Crack Closure
In this section we develop a computer model for cr-ck closure during constant amplitudeloading. The computer model will be used to predict the opening load and the extent ofclosure at loer loads. The comparison of these predictions with experiment Is given inthe next section.
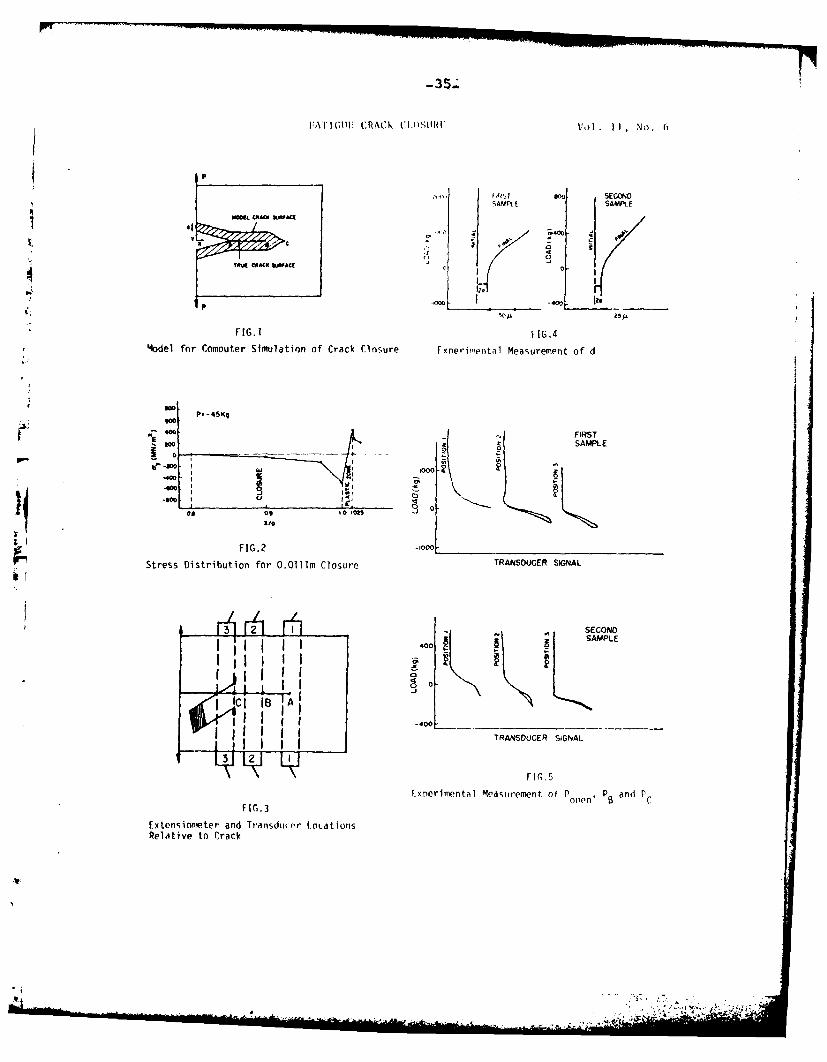
Assume that a fatigue crack growth experiment is carried out on a compact tensionspecimen with loading controlled so as to maintain constant K and K . As the crackgrows, it will leave behind an approximately uniform wake of 1iidual Min, that Is, thematerial near the crack surfaces will effectively become thicker, because of the surfaceroughness and volume change associated with plastic deformation by high tensile stressesnear the crack tip before final seperation. The increase in the thickness can be modeled asdue to A uniform coating of thickness d of new material on the crack surfaces (Figure 1).Extending in front of the crack tip (B) for a distance equal to the plastic sons size r -BC,there will also be "extra material", decreasing in thickness from 2d at the tip to zeroyoutside the plastic zone. If this "extra material" were cleared away the new crack surfaces(we will call then the "model crack" surfaces) would just touch without exerting any forceson each other when the external load, P. is removed.
Thus our model consists of a sample with a "model crack", longer than the true crackby a distance r , with some incompressible external material inserted between the cracksurfaces proppifg them open. The true crack may actually be closed a distance AB behind thetrue crack tip, with AB depending on the external load.
For a given load, P, we use s finite-slment elastic stress analysis program written byone of the authors (5) to find the stress state of the sample. One of the most importantfeatures of this program, which will be available through the algorithms distribution service

-33-
FATIG'M:I (U I A:K (A fSUIPF Vol. 11, No. 0
of (5), is its ability to efficiently handle crack problems. If we knew the closure distancebeforehand, we could give the following boundary conditions along the model crack surfaceseFrom the point of closure (A) on out away from the crack tip, we know that the surfaces arefree surfaces. From the point of closure on in towards the crack tip, we know thedisplacements, namely, from A to B the surfaces are displaced vertically by a distance d#
and from B to C the displacements decrease from d to 0. In our model they decrease ae acubic polynomial with zero slope at B and C, i.e., as d(3s
2-2s0) where s-(C-x)/(C-B).
Unfortunately we cannot determine the closure distance AB before solving the problem,so we proceed by an iterative method. If our guess for AB is short, this means we areallowing part of the crack surfaces to be free which would in reality be touching, so ourresulting calculations will show that the true crack surfaces uverlap behind the assumedpoint of closure. If our guess is long, this means we are glueing part of the surfacestogether that would in reality not be touching, so that the true crack will be open behindthe assumed point of closure. The assumed point of closure will be in compression or tensiondepending on whether the guess is short or long, respectively, but the stresses are notcalculated as accurately as the displacements, so we do not use them to guide the iteration.
A series of computations were made with the program, for a compact tension sample with
V-0.O8m, H-O.O5t, thickness-0.025a, E-7.3xlO /m2 and y-0 33 with plane strain conditions.
The true crack length was taken as a-0.056m with a plastic zone size of r -0.0014a and a
value for d of 25/Am was used. The loads corresponding to three closure listances are foundby iteration and tabulated below.
TABLE ILoads for Three Closure Distances (d-25/,s)
Closure (AB) Load (P)0.0111M W5 kg0.0056m 320 kg0 (Just open) 1840 kg
The linearity of the problem implies that the values of d and P may be multiplied by acommon factor without changing the closure distance. Thus for this problem, with the givencrack length, our model predicts an opening load of 7.23x10
7 *d kg, if d is in meters. Also,by interpolation, we see that the closure distance should be about 0.OlOm for zero appliedload, regardless of the value of d.
The vertical stress distribution along the closure surfaces and into the plastic zoneis shown for P- -45 kg in Figure 2.
Comparison of Computer Simulation with Experivental Results
To check the crack closure predictions given in the previous section, two Al-2219-T851compact tension specimens of the same dimensions and elastic properties as in the computersimulation were tested on an 5TS closed-loop electrohydraulic testing machine, afteroveraging for 20 hours at 300 C In air. Tensile specimens given the same heat treatmentwere found to have yield strengths of about 200 MN/m
2. One purpose of the lowering of the
yield strength was to give a larger and more easily seasureable value of d, the residualstrain parameter.
In each of the two saples tested, a fatigue crack was grown to a-O.056a with loadingcontrolled so that K -0 and K were held approximately constant. An extensiometer wasplaced so as to straR&e the crW (at a-0.0
44a, point C of Figure 3) as it was grown
through. The increase in distance between the legs of the extensiometer as the crack passedbetween them (distance always measured with the crack closed) is taken to be the residualstrain, 2d (Figure 4), since the legs are far enough apart to straddle all the plasticstrain and crack front roughness. To determine the opening load, P n and the loads PBand P at which the crack closes to points 1 and C of Figure 3 (repenting closure of0.005i. and 0.0111m respectively), ultrasonic transducers were placed in succession atpositions 1, 2 and 3. The two piezoelectric transducers transmit and receive a 2.25 sega-hertz longitudinal ultrasonic wave which ts converted to a DC signal. This signal isattenuated as the crack grows through the path of the wave (so reference 4), so that inposition 1, the signal increases when the crack first begins to close and in positions 2

-34-
Vol . 11, No. 0 A I ~I RFCRACK CLOS1110I.
or 3 the signal is zero until the crack closes to point B or C respectively. Figure 5 showsthe signal as a function of load for each position of the transducer. Both Figures 4 and 5are copied directly from the X-Y recorder output.
Leading of the first maple was a 2-hertz sine wave with K -26.4 ?4aE The plasticzone ese Is estimated as r -(x. ) 2 /,7, -0.00l0m (6). 40olu of d measured by theextensiometer was 8.,U a, eIi1 l it possible to calculate the computer predictions for
P Pand PC by linearity.%;n aB
The second sample was loaded with a 5-hertz sine wave with K -13.Z MF*47, and 4 viama.sured as 2.5 au. The experimental results for both samples are oapared with thecorresponding computer predictions below, Ignoring the fact that the plastic sone size forthe second sample Is four times smaller than for the first sample.
TABLE 2Experimental and Calculated Closure Loads
First Sample Experimental (+50 kg) Calculated (d..8. lIu a)_oen 450 kg -390 kg
P 100 kg 100 kg
* 'C0 -15 kgSecond Sample Experimental (+20 kg) Calculated (d-2.5,am)
p B150 kg 380kg
PC -100 kg -5 kg'V DiscussionThe computer predictions of the opening load and extent of closure at lover lod1 o
a crack in a compact tension specimen showed close agreement with the experimentalmeasurement.
The elastic analysis shows that the opening load Increases as d, a measure of theresidual strain and crack surface roughness, increases. This is consistent with the crackclosure model explanation of the well-known effects of overloads (3,4,7,8,9) and underloads(7910). The effect of an overload is to generate a large amount of residual strain (3.4)which causes the crack to close at a higher load whet baseline loading Is resumed and thusAK Is decreased and crack growth Is retarded. A subsequent underload has the oppositeeffilt, by decreasing the residual strain through compression, and thus Increasing &K offand the crack growth rate.
Acknowledgment
This research was sponsored by the Air Force Office of Scientific Research, Air ForceSystems Command , trAF# under Grant No. AFOSR 76-2955.
References
1. W. Elber, ASTM STP 486, 230 (1971).2. 0. Buck, C.L. Ho, II.L. Marcus, Engineering Fracture Mechanics 5, 23 (1973).3. 0. Buck, J.D. Frandsen, H.L. Marcus, ASTM STP 595, 101 (1976).4. W.R. Sharpe Jr., D.M. Corbly, A.F. Grandt Jr., ASTM STP 595, 61 (1976).5. 0. Seell, to appear in Transactions on Mathematical Software.6. F.As McClintock, G.R. Irwin, ASTM STP 381, 84 (1965).7. R.I. Stephens, D.K. Chen, S.W. Morn, ASTM STP 595, 27 (1976).8. 0.3. Wheeler, General Dynamics Report FZM 5602 (1970).9. C.M. Hudson, H.F. Hazdrath, NASA TN D-960 (1961).
10. R.I. Stephens, C.V. MoBurney, L.J. Oliphant# International Journal of Fracture 10,58? (1974).
9A
):A\j 1G.11 (RAC~k CLOS1-1Itt Vol. 11I, No.6
am SECONDSAMPt SAMPLE
IF,C4
T AChAAC J -,
P -
FIG. FIG.4
Model for Comouter Simulation of Crack Closure Fxnerinrental Measurement of d
404. FIRSTSAMPLE
FIG.? -r000 _____________________
Stress Distribution for O.Oll1m Closure TRANSDUJCER SIGNAL
r 311 1Jrf SECONDI ~ I I400 SAMPLE
-j
I I I ~~~~-400 ____________ _____-*--jI~f1 1 1TRANSDUCER SIGNAL
Experimental Measuirement of P on'P Band PC
FIG.3
Extensiometer and Tvransduj(r'r' Lotat totsRelative to rrack

-36-
Appendix D
Fatigue Crack Closure and Residual Displacement
Measurements on Aluminum Alloys
Deepak S. Mahulikar and H.L. MarcusMechanical Engineering and
Materials Science and EngineeringThe University of TexasAustin, Texas 78712
Introduction
*; During fatigue crack growth, plastic deformation is left
in the wake of the crack. As a result of this residual defor-
mation, the crack can physically close during the lower part
of the tensile crack unloading. This closure phenomenon has
been observed and studied extensively [ 1 Various measure
ment techniques have been employed to measure crack closure,
and many interesting observations are presented on the basis
of those measurements. With the help of potential drop measure-
ments Lindley and Richards(5 concluded that crack closure is
only a surface or edge effect. Potential drop measurements
have been used by other researchers [9 'I0 ]. Irving did
experiments in vacuum as well as humid air and observed crack
closure only in vacuum. Bachman and Munz [10 however, found
that closure is present in vacuum as well as at 760 Torr pressure
and that the crack opening stress intensity (K op) was indepen-
(12]dent of environment. Avery important conclusion of their

-37-
study was that in humid air environment, an oxide layer
develops on the crack surfaces, and this effect might give some
erroneous results in terms of the potential drop measurements.
They point out that earlier results based on the potential drop
measurements can be reinterpreted.
Mahulikar et al[7 ] have discussed edge effects on crack
closure. Because of the plane stress region at the edges of
the compact tension specimen, surface measurements are not repre-
sentative of the bulk behavior. Ultrasonic bulk measurements
have demonstrated that crack closure is a plane strain as well
as a plane stress effect[7 ,3 ]
Studies of the residual displacements left in the wake of
the crack, can give some important information about crack clo-
sure. The residual displacement is considered to be made up
of the nonuniform plastic strain on the surface, the small
change in volume due to the deformation process and the oxide
formed on the nonuniformly strained fracture surface. It was
demonstrated [1 1 ] that the residual displacements can be measured
by a clip on gage mounted on the side of the specimen. Sewell
and Marcus [I I ] measured the residual displacements, (d), for
different specimens in humid air and proposed a finite element
model to predict crack opening load (P op) using the 'd' measure-
ment.
In order to clearly define the relationship of d with
Pop' it was necessary to perform experiments in vacuum as well
-38-
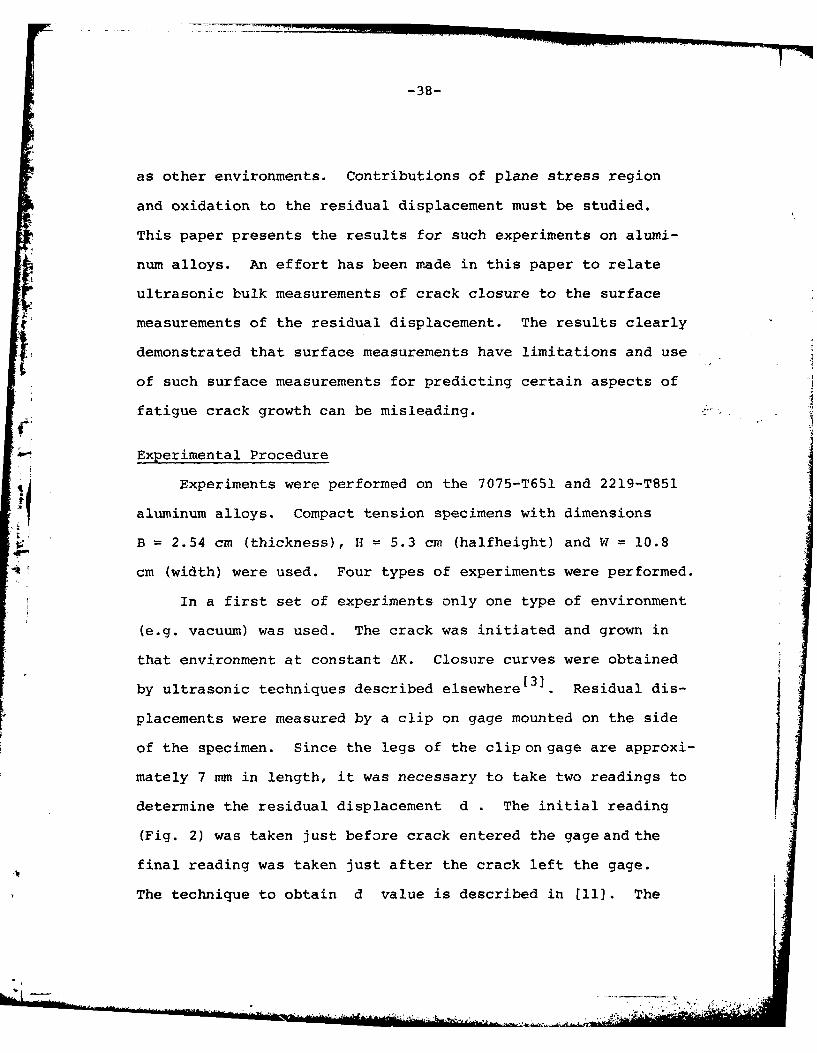
as other environments. Contributions of plane stress region
and oxidation to the residual displacement must be studied.
This paper presents the results for such experiments on alumi-
num alloys. An effort has been made in this paper to relate
ultrasonic bulk measurements of crack closure to the surface
measurements of the residual displacement. The results clearly
demonstrated that surface measurements have limitations and use
of such surface measurements for predicting certain aspects of
fatigue crack growth can be misleading.
Experimental Procedure
Experiments were performed on the 7075-T651 and 2219-T851
aluminum alloys. Compact tension specimens with dimensions
B = 2.54 cm (thickness), H = 5.3 cm (halfheight) and W = 10.8
cm (width) were used. Four types of experiments were performed.
In a first set of experiments only one type of environment
(e.g. vacuum) was used. The crack was initiated and grown in
that environment at constant AK. Closure curves were obtained
by ultrasonic techniques described elsewheret31 . Residual dis-
placements were measured by a clip on gage mounted on the side
of the specimen. Since the legs of the clip on gage are approxi-
mately 7 mm in length, it was necessary to take two readings to
determine the residual displacement d . The initial reading
(Fig. 2) was taken just before crack entered the gage and the
final reading was taken just after the crack left the gage.
The technique to obtain d value is described in [Il]. The
621
-39-
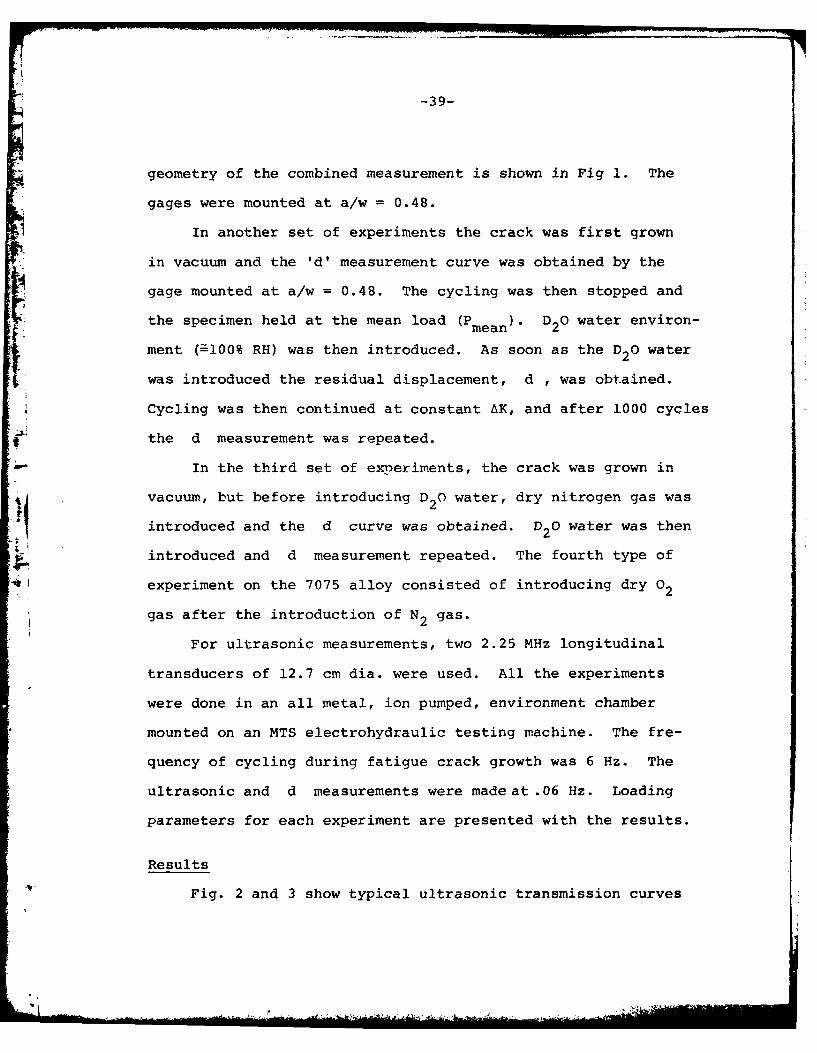
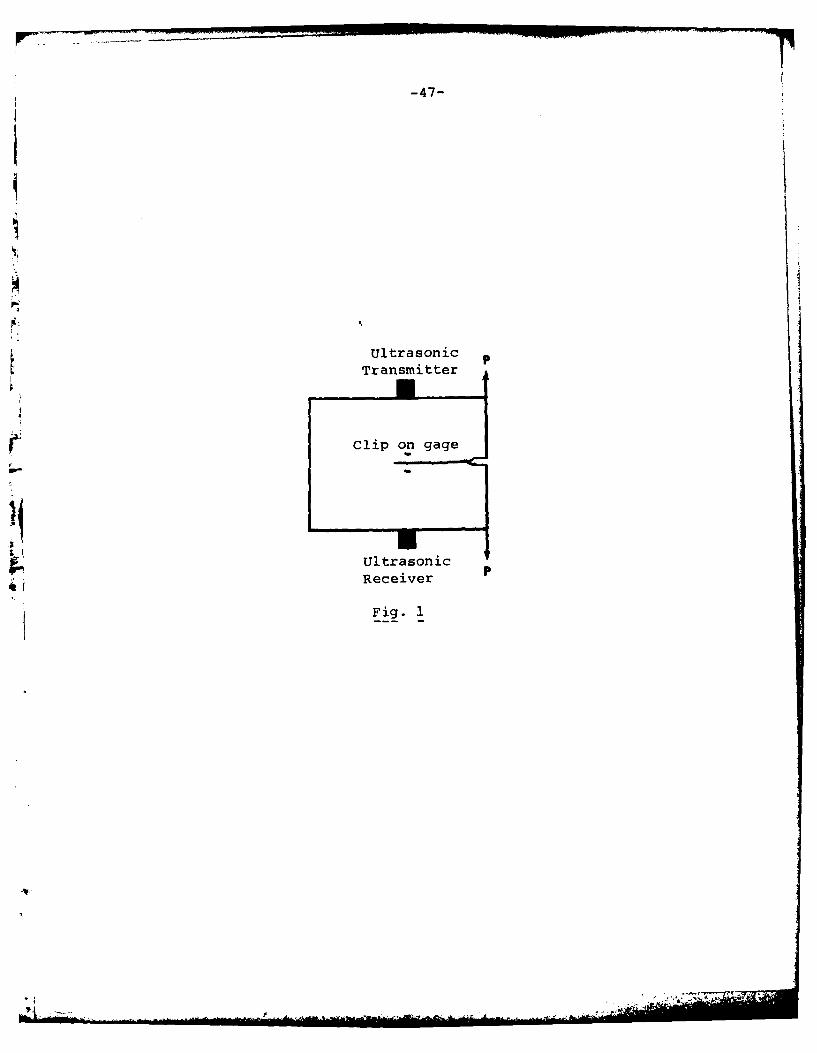
geometry of the combined measurement is shown in Fig 1. The
gages were mounted at a/w = 0.48.
In another set of experiments the crack was first grown
in vacuum and the 'd' measurement curve was obtained by the
gage mounted at a/w = 0.48. The cycling was then stopped and
the specimen held at the mean load (Pmean). D20 water environ-
ment ( I00% RH) was then introduced. As soon as the D20 waterIwas introduced the residual displacement, d , was obtained.
Cycling was then continued at constant AK, and after 1000 cycles
the d measurement was repeated.
In the third set of experiments, the crack was grown in
vacuum, but before introducing D20 water, dry nitrogen gas was
introduced and the d curve was obtained. D20 water was then
introduced and d measurement repeated. The fourth type of
experiment on the 7075 alloy consisted of introducing dry 02
gas after the introduction of N2 gas.
For ultrasonic measurements, two 2.25 MHz longitudinal
transducers of 12.7 cm dia. were used. All the experiments
were done in an all metal, ion pumped, environment chamber
mounted on an MTS electrohydraulic testing machine. The fre-
quency of cycling during fatigue crack growth was 6 Hz. The
ultrasonic and d measurements were made at .06 Hz. Loading
parameters for each experiment are presented with the results.
Results
Fig. 2 and 3 show typical ultrasonic transmission curves
• _ ....... . .. . .: ... .. .- .K- - -., '-V .... .. , , .. , :- -
-40-
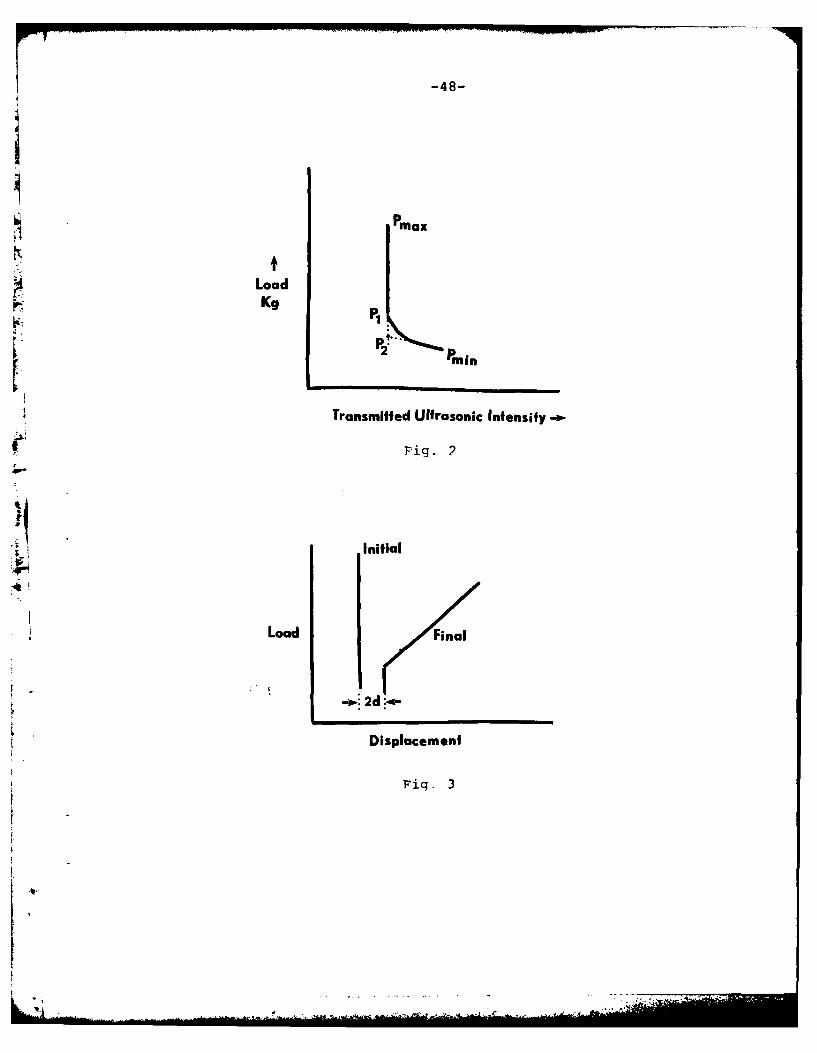
as a function of applied load for closure measurement and d
measurements respectively. In Fig. 1, P1 represents the load
• at which the curve deviates from linearity, while P represents2
the closure load obtained from the tangent method [3 ]. In Fig. 2
the initial d displacement curve represents the reading taken
before the crack enters the gage and the final curve representstthe reading taken just after the crack leaves the gage. The
I x-axis shift represents 2 d units since d is defined as the
residual displacement on one fracture surface.
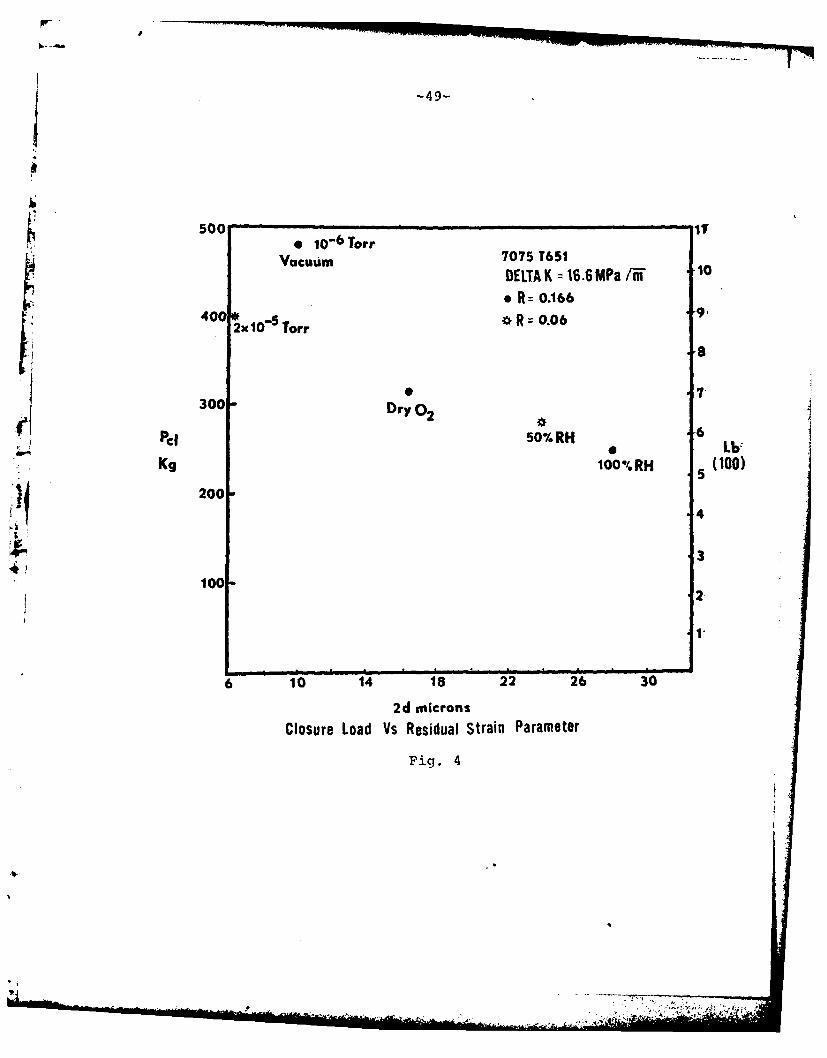
Fig. 4 shows the effect of environments on the closure
load (P2 ) and on the d values observed for 7075-T651 alloys.
Fig. 5 shows the same effect for the 2219-T851 specimens.
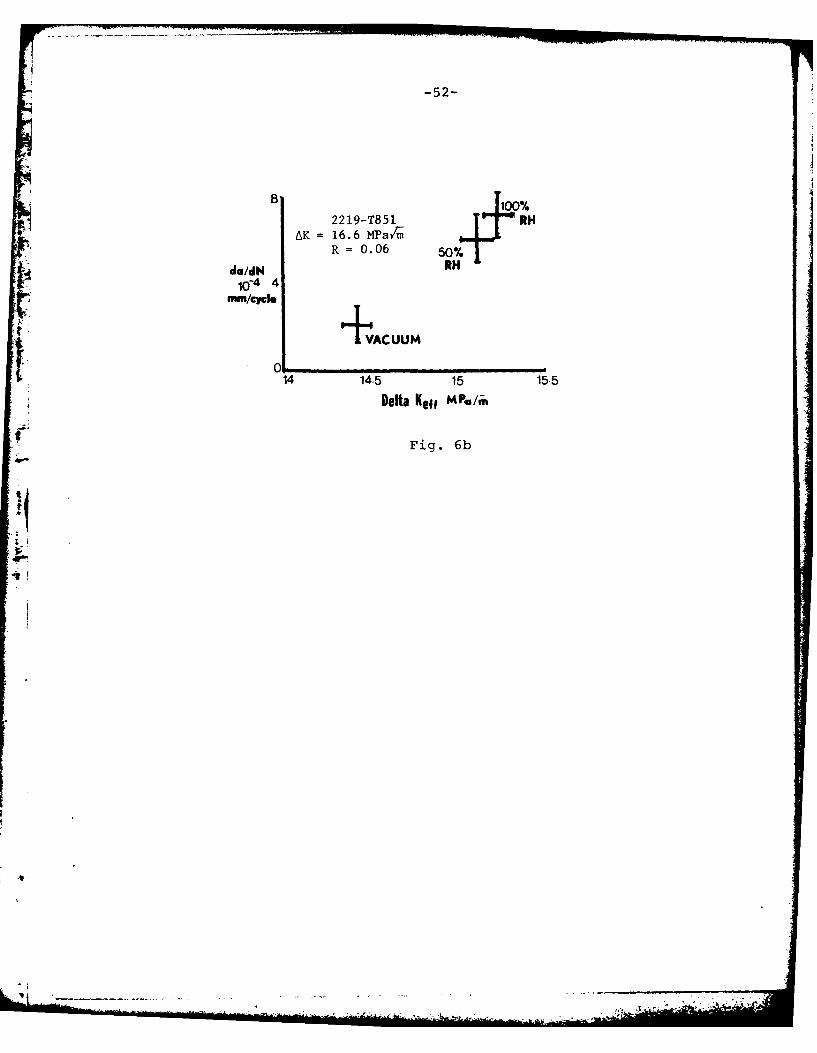
Fig. 6 plots the crack growth rates against the effective stressintensity AK as calculated from P2 for both the alloys.
inesiy eff2
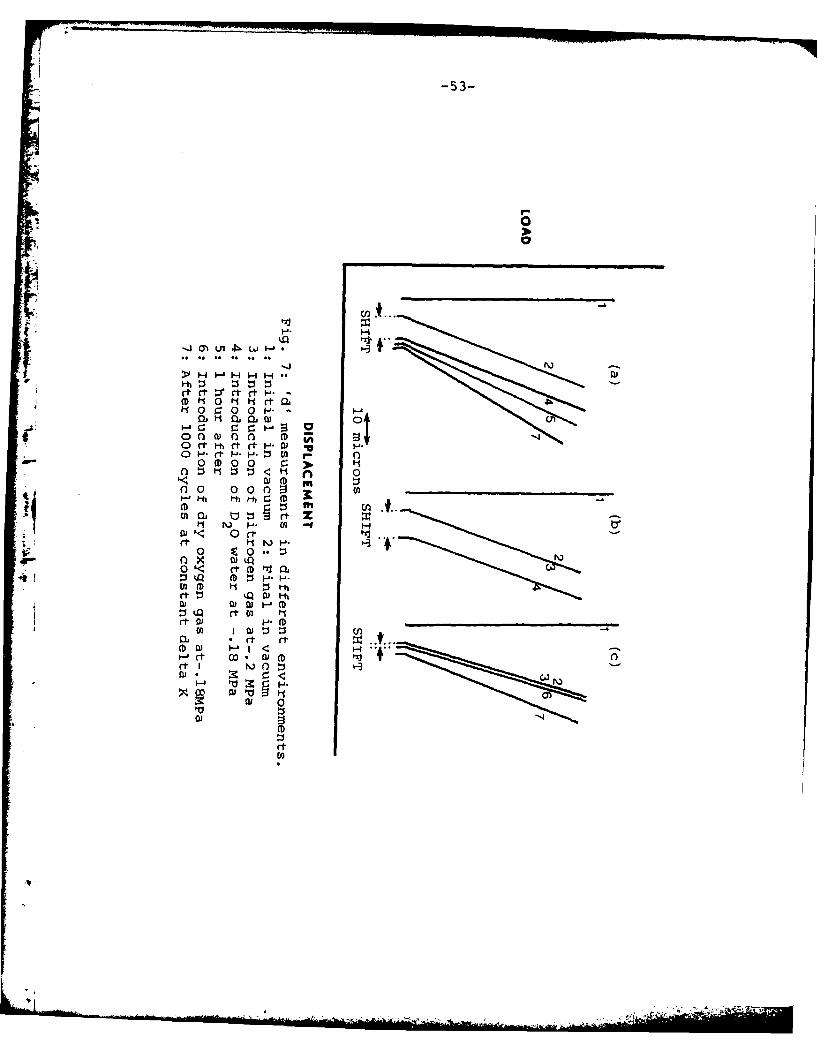
The d curves presented in Fig. 7 are for the four types
of experiments defined in the experimental procedure section.
Fig. 7 (a) is representative of the first type of experiment;
Fig. 7 (b) represents the third type of experiment and Fig. 7
(c) represents the fourth type of experiment.
Discussion
The following observations can be made from Figs. 3 and 4.
a) The closure load appears to decrease with increase in
humidity. It also decreases as the d value increases.
b) The value of d increases with the introduction of humidity.
c) The values of d for the higher strength 7075-T651 alloy

-41-
are higher than the 2219-T851 alloy; and so are the closure
loads.
Thus, it was observed that the closure load bears an
inverse relationship with the d values. This unexpected
result can be explained by the fact that d measurement is a
surface measurement and ultrasonic measurement of closure is
a bulk measurement. It should be noted that the ultrasonic
transducers of 1.27 cm dia. were mounted on a specimen 2.54
cm thick at the middle portion. Thus they were sampling a
columnar region of approximately 1.27 cm dia. in the center
of the specimen. The plane stress edge region of the speci-
men was not being sampled. On the edges, the residual dis-
placement was higher than the region sampled by the trans-
ducers. Thus even though closure occurred first on the edges,
the ultrasonics would not detect it until the inner portion
and largest portion of the crack front was compressed suffi-
ciently to touch the surfaces. On the other hand, the d
measurements shown are a surface measurement representative
of the plane stress plastic deformation at a distance behind
the crack tip. In humid air environment a faster buildup of
oxide layer on the surfaces of the crack occurs. This effect
can be expected to be more severe on the plane stress surface
region of the specimen. The 'extra' material consisting of
the oxide layer as well as mechanical strengthening of asperi-
ties by the oxide on the edges of the crack front results in
iA

-42-
increased d value in humid air beyond that of just the oxide
thickness. Therefore during the reverse loading more material
is available for contact on the edges of the specimen than in
the middle of the specimen. Therefore the crack front in the
middle of the sepcimen can only touch after the load is reduced
further and a lower closure load is observed on the ultrasonic
signal.
For 7075 alloy the 'd value in dry 02 gas is lower than
for humid air as would be expected due to the slower formation
of the oxide layer in dry 02 gas than in humid air. The crack
growth rate is seen to increase with the humidity (Fig. 6) as
does the AKeff calculated using P2.
II! An interesting observation was made during the second set
of experiments (Fig. 7a). The crack was grown through the clip
on gage in vacuum and the d curve was obtained as usual. The
cycling was then stopped and the specimen was held at the mean
load. D20 water vapor to 100% RH was then introduced in the
environment chamber. As soon as the water vapor was introduced,
the gage recorded a shift (Fig. 7a) in the displacement reading.
This shift was of the order of 3 to 10 pm for the 7075 alloys.
The shift increased slowly with time. After about an hour it
was about 12 Vm. After this cycling was continued for 1000
cycles and a d curve was recorded with a smaller further incre-
ment to the value of d. This shift in d value after the intro-
duction of the D20 water vapor is most likely due to the formation

-43-
of oxide layer which gives mechanical strengthening of the
asperities on the edge of the specimen. However, the magni-
tude of this shift is certainly not representative of oxide
layer thickness on aluminum surfaces which leads one to believe
that some additional mechanisms associated with the oxide for-
mation must be operating. The strengthening of the asperities
* is a possible mechanism.
- In order to establish that the change in pressure in the
system was not the cause of the d shift, the third set of
experiments were carried out. After the crack was grown in
vacuum but before introducing D20 water, dry N2 gas was intro-
duced (Fig. 7b). This showed no change or shift in 'd' reading.
is This eliminated the possibility of a strictly mechanical effect
from the pressure change to explain the change in d. D20 water
was then introduced, which again showed a significant shift in
the d value that increased even further on subsequent cycling.
The experiment was then repeated with dry 02 gas intro-24duced after the vacuum and N2 . The shift in d was very small
-1 Vm and further cycling in the dry 02 showed only a small
increase in d value, Fig. 7c.
Thus it was concluded that oxidation played a dominant
role in this shift. Oxidation in a dry 02 gas environment is
a very slow process when compared to oxidation in a humid
environment. This fast oxidation in a humid environment must
attack the plane stress surface portion of the crack
-44-
preferentially. This results in changes in the residual dis-
placement probably due to mechanical strengthening by the oxides
of asperities that are more dominant on the edge of the speci-
men. These effects yield the shift in d readings, while the
edge effect holding the crack open results in a lower closure
load in the center.
It was thus apparent that a lot of changes on the edgesor surfaces of the crack front take place when one goes from
vacuum to humid air. Surface readings can be entirely different
than the bulk readings because of effects of oxidation, such
as the strengthening of asperities. Surface clip on gage'4! measurements, thus, cannot be considered totally representative
of the bulk closure behavior. Thus the use of d surface measure-
ment for load predictions in a varying environment must be care-
fully evaluated. In fact using the data presented here, the d
measurements combined with a finite element analysis would pre-
dict a higher crack closure load, a lower AKeff and reduced
growth which is contradictory to experimental observations.
Conclusions
1. In 7075-T651 and 2219-T851 the closure load decreased with
the introduction of humid environments for both the alloys,
while residual displacement d values increased,
2. The decrease in the closure load with humidity is attributed
to buildup of extra material at the edges of the specimen
which the acoustic transducers do not sample.

-45-
3. The increase in d value when fatigued in humid environ-
ment compared to vacuum is attributed to the buildup of
oxides on the edges of the fracture surface.
4. The d value was observed to increase when D2 0 water
environment was introduced after the crack was grown in
vacuum. Dry 02 gas introduced after crack growth in
vacuum showed only a very small shift in d value.
5. The shift in d value resulting from the introduction of
D20 water vapor after the crack was grown in vacuum was
found to increase with time and additional cycling.
6. It is suggested that in addition to oxide formation itself,
preferential strengthening of asperities at the edge of
the specimen may explain the increase in d in humid air
environments.
7. Surface measurements are not always representative of the
bulk behavior and use of such measurements in predictive
analysis can be misleading.
Acknowledgement
This research was supported by the AFOSR, under contract
no. 76-2955. Experimental assistance given by Norman Williams,
Anna Zurek and Carlos Arias is highly appreciated.
-46-
References
1. Elber, ASTM STP 486, 230 (1971).
2. Schive, Eng. Fra(ut. Mech. V11 pp. 167-221 (1979).
3. Buck, Ho, Marcus. Eng. Fract. Mech. 5, 23 (1973).
4. Sharpe, Corbley, Grandt. ASTM STP 595, 61 (1976).
5. Lindley and Richards, Mat. Sci. Eng. 14, 281, (1974).
6. McEviley, "Current Aspects of Fatigue," presented atthe "Fatigue 1977 Conference" University of Cambridge,England (March 28-30, 1977).
7. Mahulikar, Slagle and Marcus, Scripta Met. 13, 867 (1979).
8. Bachmian and Munz. Int. J. Fract. 11, 713 (1975).
9. Irwing, Robinson, Beevers. Int. J. Fract 9, 264-282 (1973).
10. Bachmnan and Munz. Eng. Fract. Mech. 11, 61-7 (1979).
1411. Sewell and Marcus, Scripta Met. 11, 521 (1977).
12. Bachman and Munz, Int. J. of Fracture 11, 713 (1975).
-47-
UltrasonicTransmitter
clip on gage
14UltrasonicReceiver p
Fig. 1
-48-
Pmax
Load-t Kg
p.
Transmitted Ultrasonic Intensity -o-
r TtFig. 2
Initial
Load ( Final
Displacemenf
F~ig. 3
-49-
500 1.. ' '--•10 6 Torr
Vacuum 7075 T651DELTA K = 16.6MPa /N 10
. Rz 0.166400 0 ... " R 0.06 9.
2x 10 Torr
3007 7300 Dry 02
*n
PCI 50%RH 6,,., •Lb:
Kg 100% RH (100)5
200
4
3100 -~2,
1"
6 10 14 18 22 26 30
2d microns
Closure Load Vs Residual Strain Parameter
Fig. 4
4q
- -4 - .vJ ~-A~ (0

-50-
2219 7851DELTA K =16.6M0a/jj
41 R -06
sa. 10-5 Torr
002
0 p
3 4 5 6 78
2d microns
Fig. 5
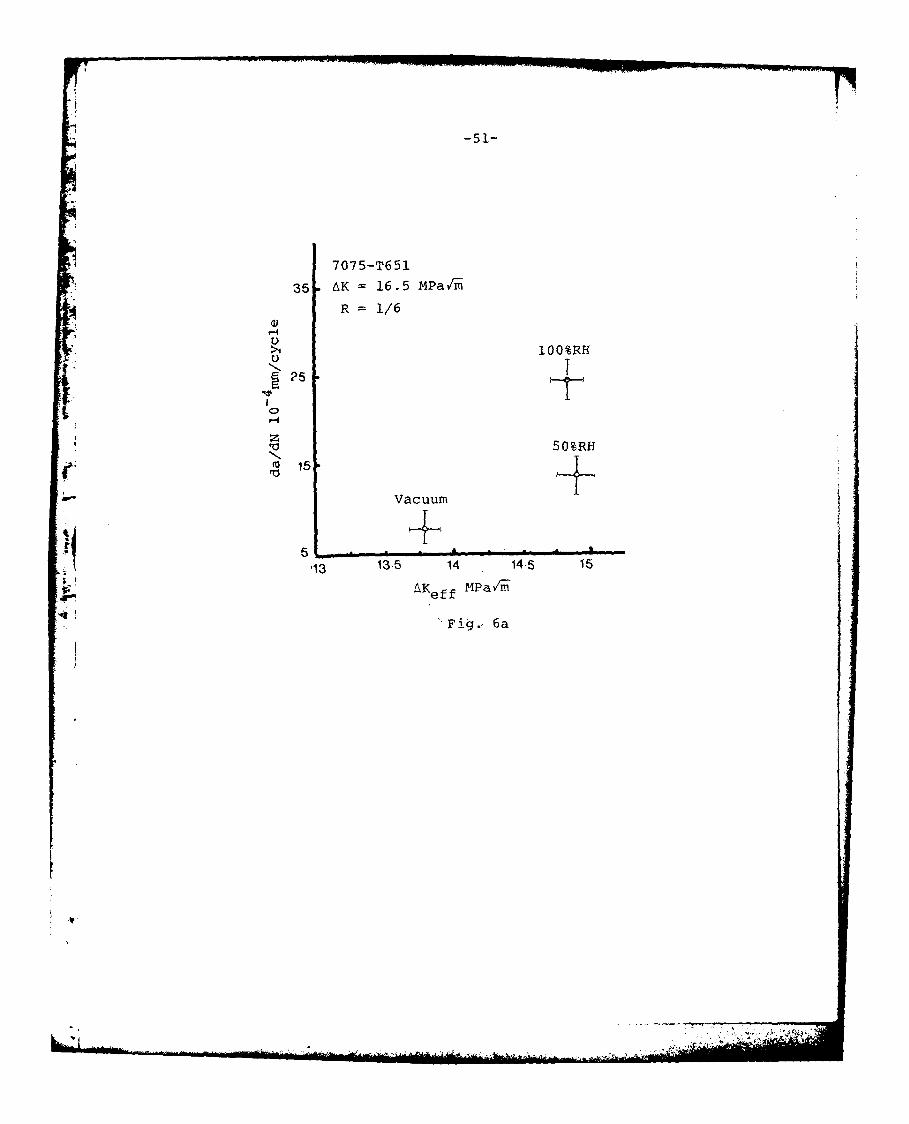
707 5-T6 51
35 AKI= 16.5 D4Pai/imi
R = 1/6
>1 100 %RH
V 50%RH
S15
Vacuum
13.5 14ef 14.5~ 15
Fi.6a
-52-
8 0
2219-T851 RH*AK =16.6 MParm
R=O0. 06 50%
do/dN RH
mm/cycle
I VACUUM
14 14.5 15 15.5
Delta Koff MPa/m
Fig. 6b
-53-
0 H f tJ HL H H
0rt c1 h ct rt P.40 tl 0 0I rQ
I-t H a
0H.I-~~- . (D -
001rt 00 0) (D
.V al 0(D0 r
00 00 0~z11t
-54-7F.
Scripta METALLURGICA Vol. 13, pp. 867-870, 197bi Pergamon Press Ltd.Printed in the U.S.A. All rights reserved.
Appendix E
EDGE EFFECTS ON FATIGUE CRACK CLOSURE OF ALUMINIUM ALLOYS
D.S. Mahulikar, W.P. Slagle* and H.L. MarcusMechanical Engineering/Materials Science and Engineering
University of Texas, Austin, Texas 78712
(Received June 18, 1979)
Introduction
The crack closure effect suggested by Elber (1) has been studied quiteextensively. The fact that the crack closes in the lower part of load cyclehas been observed and measured universally but the extent to which the closureaffects retardation phenomenon is not yet known clearly. There have beenspeculations that the crack closure effect is only a surface or edge effect.This was supported by experiments of Lindley and Richards (2). They usedpotential drop measurements as well as metallographic techniques to studyclosure effects in the steels. The) concluded that crack closure is only asurface or edge effect. This possibility is also discussed by other research-ers (3,4). It was suggested that the crack closes only at the surface or edgesof the specimen where plane stress conditions exist, while it may not close nthe central part where plane strain conditions exist. This paper reports onexperiments aimed at clarifying this point.
Experimental Procedures
Several experiments were performed to study this edge effect.Experiments were done on 7075-T651, 2219-T85t and overaged 2219 aluminiumalloys. The mechanical properties of these materials are listed in Table 1.Compact tension specimen with dimensions B=2.54 cm thick, H-5.3 cm halfheightand W-10.8' cm long were used.
Two types of experiments were performed on the 7075-T651, 2.54 cm thickspecimens. In the first set, the crack was grown up to 4.31 cm at a constantAK (16.5 MPaii) and the load ratio, R-0.17, on a closed loop hydraulic testingmachine. Closure measurement was made by two 1.27 cm diameter ultrasonictransducers mounted directly above and below the crack tip and centered on thewidth of the specimen. The ultrasonic technique of load and crack lengthmeasurement is described elsewhere (6). In our experiments, the ultrasonicwavelength was significantly longer than the crack tip radius, hence the pos-sibility of closure curve changes being only diffraction or scattering effectswas considered unlikely. The experiment was then stopped and two sides of thespecimen were machined down to a thickness of 1.75 cm. Again the closurereadings were taken at the same point. The cycling was resumed at the same AKvalue and the crack was grown to about 4.8 cm and closure reading were takendirectly above the crack tip. The same procedure was repeated by machiningdown the specimen to a thickness of 1.25 cm, taking closure measurement at thatpoint, and again after growing the crack to a length of 6.3 cm. The resultsare presented in Fig. I where the applied stress intensity is plotted against
the received acoustic intensity.
* Present address: Celanese Corporation, Corpus Christi, Texas.
8670036-9748/79/090867-04502.00/0
Copyright (c) 1979 Pergamon Press Ltd.
. ... .;. . ...

-55-
FATIGUE CRACK CLOSURE Vol. 13, No. 9
In a second set of experiments a specimen used for relaxation experi-ments (5) was used for edge effect experiments. A fatigue crack was grown ina 7075-T651 specimen to a length of 4.84 cm at a AK of 6.6 NIPa/m, R-0.33.It was allowed to rest at a zero load for a period of 77 hours for relaxationmeasurements. Closure measurements were made at the end of the zero load holdtime. Then the specimen was machined down to a thickness of 1.3 cm, thusinsuring that entire plane stress region was removed. Closure measurementswere made at this point. Cycling was resumed and the crack was grown toaround 5.4 cm length with continual measurement of closure.
Similar tests were performed on 2219-T851 and overaged 2219 alloys.In these tests the crack was grown at a frequency of 2 Hz, AK-26.4 MPa/m, andR=0 to a length of 5.6 cm. At this point cycling was stopped and closuremeasurements were made. Both sides of specimen were then machined off to athickness of 1.9 cm and closure was measured with the tra.isducers at sameposition over the crack tip. The specimen was then machined off from bothsides to a thickness of 1.3 cm and once more clasure measurements were made.
It should be noted that the original s'ecimen thickness was 2.54 cm,twice the diameter of the 1.27 cm ultrasonic transducers. The ultrasonic signaloutside this 1.27 cm columnar region does not contribute significantly to theamplitude of the output because of the method used in converting the signal inthe peak to peak detector. At a specimen thickness of 2.54 cm the signaltransmitted through the plane stress region does not contribute significantlyto the output signal intensity since the transducers are centered across thethickness of the specimen.
Results and Discussion
Closure curves are presented in Fig. 1. Two stress intensities K1 and
K2 were obtained from the curves. KI is the intensity at which the closurecurve deviates from linearity while K7 is the closure intensity determined bythe tangent method described by Buck et'al. (6). Tables 2, 3, 4 and 5 listall the values.
From the ultrasonic measurements for both the alloys and all cases,significant crack closure was still observed after machining off the planestress region as is evident from Fig. I and Tables 2, 3, 4 and 5.
• I For 7075 alloys, it was observed that machining off the sides did notchange the closure stress intensities significantly, However, as the crackwas grown further, the values of K1 and K2 increased. On the other hand for2219 alloys a significant increase in KI and KZ was observed after machining
* I off the sides.
These observations can be explained from the fact that 7075 is a high-strength, low K c alloy. Hence the plastic zone sizes encountered arerelatively smaller. Thus within the limits of ultrasonic measurements K1 , K2did not change significantly. When the crack was grown further, new planestress region developed indicating slight rise in K and K at a thickness of1.75 cm and a significant rise at a thickness of 1.15 cm. The significantrise can be understood by the fact that the thickness is very small, slightlygreater than allowable thickness for plane strain testing, and transducers arenow sampling the entire thickness of the specimen. Higher AK values were notused due to the limitations of the fracture toughness.
For 2219 alloys, machining off the sides of the specimens instanta-neously increased the values of K1 and K2 . 2219 has a lower a, and higher KIcthan 7075. The higher K. made it possible to use higher AK v lues forthe experiment. This com ined with the lower value of ay makes the plastic.one sizes significantly larger. When the specimen was at the originalthickness this large plastic strain in the plane stress region allowed thespecimen edges to close before the plane strain region. This served to propopen the interior and keep it from closing until the load was reduced enoughto sufficiently compress the plane stress region so the interior closed. Theresult was a lower closure stress intensity detected by ultrasonics. Once the
" . i:

-56-
Vol. 13. No. 9 FATIGUE CRACK CLOSURE
plane stress region was machined off the remaining plane strain region wouldclose at a higher value of K.
A brief mention should be made of the residual stresses. Residualstresses are introduced on the surface of the specimens because of heat treat-ments given to them and also because of machining. The extent to which thesestresses can affect the closure behaviour is not yet well understood, but arenot expected to be significant in these experiments.
Conclusions
1. Significant crack closure was ohserved for ultrasonic measurementsmade after machining off the plane stress region of the fatigue crack in 7075and 2219 aluminium alloys.
2. For high strength low Kic 7075 alloys closure stress intensitiesdid not change significantly after machining off the sides of the compacttension specimen, however Kl and 1., increased after the crack was grown further.
3. For relatively low strength high KA¢ 2219 alloys the value of K1 andK2 increased after machining off the sides. T is is attributed to relativelylarge plastic zone sizes in 2219.
4. Crack closure is not only associated with the edge of the specimen,but with the total crack front in compact tension specimens.
T A Jc SknowlelgementThis research was supported by the Air Force Office of Scientific
Research, NE Contract Number 76-2955.
References
1. W. Elber, ASTM STP 486, 230 (1971).Z. T.C. Lindley and C.E. Richards, Mat. Sci. Eng., 14, 281.3. A.J. McEvily, "Current Aspects of Fatigue," Presented at the "Fatigue 1977
Conference" Univ. of Cambridge, England (March 28-30, 1977).4. T.rT. Shih, and R.P. Wei, "A Study of Crack Closure in Fatigue," NASA
CR-2319 (1973).S. Slagle, W.P., M.S. Thesis at the Univ. of Texas at Austin (May, 1979).6. 0. Buck, C.L. Ho, H.L. Marcus, Eng. Fract. .lechanics,5. 23 (1973).
&K-16.5 MWavb R-0.17 7075-T651
20 B-2.54cm ,-1.75cm B-1.25c
a-4.3cm a-4.8cm a-6.3c=
15KMPag
10
5 K2.
0
Ultrasonic Signal .
FIG.IClosure Curves for 7075-T651 Alloy for DifferentThicknesses of the Compact Tension Specimen.
• 5" .. .. .....2 .-' * ".,.; . ..1
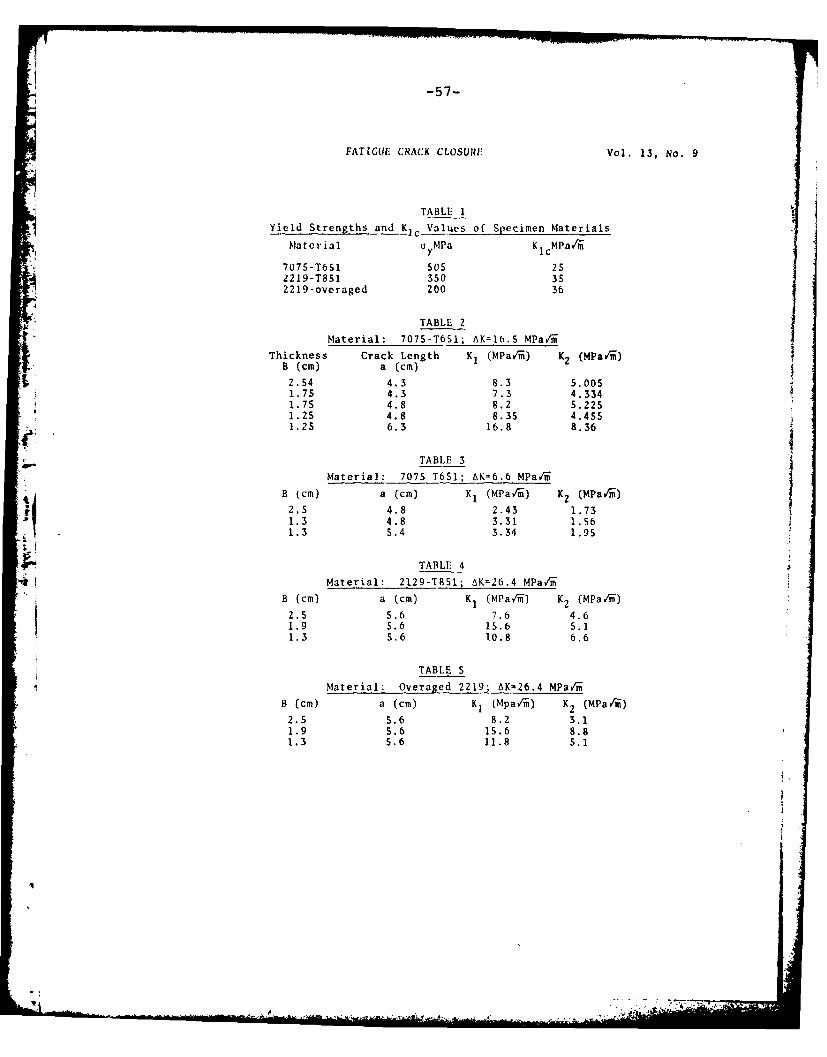
-57-
FATIGUE CR~ACK CLOSURE Vol. 13, No. 9
TABLE 14Yield Strengths and K,- Values of Specimen Materials
Material a MPa K cm P a vfti
7075-T651 505 252219-T851 350 352219-overaged 200 36
TABLE 2
Material: 7075-T651; AK=16.5 M'Parii
Thickness Crack Length K1 Ma~- K2 (MpC'mB (cm) a (cm) (~/i) z~m2.54 4.3 8.3 5.0051.75 4.3 7.3 4.3341.75 4.8 8.2 5.2251.25 4.8 8.35 4.4551.25 6.3 16.8 8.36
TABLE 3
Material: 7075 T651; AK=6.6 W~arm
B (cm) a (cm) K, (MPavii) K2 (MParii)
*12.5 4.8 2.43 1.73'11.3 4.8 3.31 1.56
1.3 5.4 3.34 1.95
TABLE 4
Material: 2129-T851; AK=26.4 MPavri-
B (cm) a (cm) K1 (MParii) K2 (MPavii)
2.5 5.6 7.6 4.61.9 5.6 15.6 5.11.3 5.6 10.8 6.6
TABLE 5
Material: Overaged 2219; AK-26.4 MPavii
B (cm) a (cm) K, (Mparii) K 2 (MPa'ini)
2.5 5.6 8.2 3.11.9 5.6 15.6 8.81.3 S.6 11.8 5.1
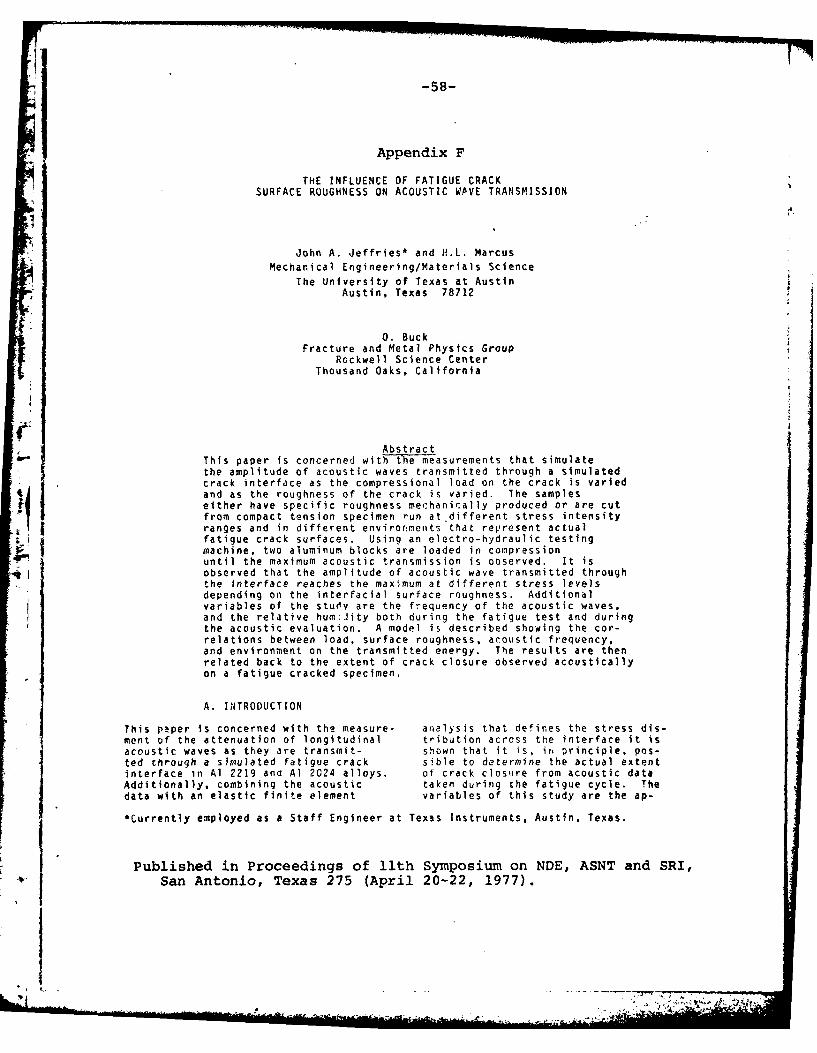
-58-
Appendix F
THE INFLUENCE OF FATIGUE CRACKSURFACE ROUGHNESS ON ACOUSTIC WAVE TRANSMISSION
John A. Jeffries* and H.L. MarcusMechanical Engineering/Materials Science
The University of Texas at AustinAustin, Texas 78712
0. BuckFracture and Metal Physics Group
Rockwell Science CenterThousand Oaks, California
AbstractThis paper is concerned with the measurements that simulatethe amplitude of acoustic waves transmitted through a simulatedcrack interface as the compressional load on the crack is variedand as the roughness of the crack is varied. The sampleseither have specific roughness mechanically produced or are cutfrom compact tension specimen run at different stress intensityranges and in different envirorments that represent actualfatigue crack surfaces. Using an electro-hydraulic testingmachine, two aluminum blocks are loaded in compressionuntil the maximum acoustic transmission is ooserved. It isobserved that the amplitude of acoustic wave transmitted throughthe interface reaches the maximum at different stress leve)sdepending on the interfacial surface roughness. Additionalvariables of the stu t y are the frequency of the acoustic waves,and the relative hum;Jity both during the fatigue test and duringthe acoustic evaluation. A model is described showing the cor-relations between load, surface roughness, acoustic frequency,and environment on the transmitted energy. The results are thenrelated back to the extent of crack closure observed acousticallyon a fatigue cracked specimen.
A. INTRODUCTION
This paper is concerned with the measure- analysis that defines the stress dis-ment of the attenuation of longitudinal tribution across the interface it isacoustic waves as they are transmit- shown that it is, ii principle, pos-ted through a simulated fatigue crack sible to determine the actual extentinterface in Al 2219 and Al 2024 alloys. of crack closure from acoustic dataAdditionally, combining the acoustic taken during the fatigue cycle. Thedata with an elastic finite element variables of this study are the ap-
*Currently employed as a Staff Engineer at Texas Instruments, Austin, Texas.
Published in Proceedings of llth Symposium on NDE, ASNT and SRI,San Antonio, Texas 275 (April 20-22, 1977).

-59-
plied load, surface roughness of the The machining led to a much coarsersimulated fatigue crack interface, and roughness than the grit blasting.frequency of the acoustic waves.
C. EXPERIMENTAL TECHNIQUE
B. SPECIMEN PREPARATION The blocks were placed in an MTS closed-loop electrohydraulic testing machine and
The aluminum blocks were cut from plate the upper and lower mandrels were slot-
stock and parallel ground to minimize ted so the longitudinal wave acousticany effects of rocking action between transducers could be placed directly onthe surfaces. After being ground, the the blocks. The interface between theblocks were metallurgically polished transducers and the blocks was of sil-on the surfaces that were to serve as icone based qrease. Compression springsthe simulated interface. Next, the pol- were used t- hold the transducers firmlyished surfaces were grit blasted with against the t.ocks. The acoustic signalvarying grits to produce the desired was generated by a standard pulse oscil-variations in surface roughness. The lator, travelled from the input trans-400 microinch(RMS) sample was cut from ducer through the simulated fatigue crackan actual fatigue crack grown in a to the output transducer, then to an AC-DCcompact tension specimen. The authors converter, and finally to an X-Y plotterfeel grit blasted surfaces closely ap- where it appeared on the ordinate axis.proximate the nature of a real fatigue The load signal was taken directly fromcrack surface where tearing and hammer- the MTS controller and appeared on theIng have occurred, thus preventing any abscissa axis. Thus the outputs of thematching of the surfaces on a micro- experiment could be directly plottedscopic scale (Fig.1). while the system was cycling (at 0.03 Hz.)
Typically about fifteen cycles were re-quired for the output signal to stabilizeand the data reported is from after stab-
I PZTilization of the signal had occurred.The loading cycles were from zero com-pressional load to a compressive load ofapproximately 30 percent of the yieldstrength of the material, based on the
DEFINED RMS apparent area of contact. To seperate- -SURFACES out the transducer coupling effect a
_s block with no interface was used.
AA 9.6cm D. EXPERIMENTAL RESULTS
In figure 2 the appearance of a typical
7PZT_1 - fatigue crack is shown. Note that partof the crack is open and part closedconsistent with the fatigue crack closuremodel (1.2) Typically acoustic tech-niques are used to discover cracks suchas this. Previously it has been impos-sible to determine the size of a fatiguecrack from acoustic data because no in-formation was available to determine theamount of acoustic wave transmitted ')through the closed portion of the crackwith crack topography as a variable.Figures 3 and 4 show the dramatic effect
DISCRETE CONTACT of interfacial surface roughness on the
POINTS amplitude of acoustic wave transmittedthrough the interface as a function ofload. Significantly, the difference intransmission between the grit blasted
U and machined surfaces for equivalentloading should also be noted. An in-teresting aspect of the results from
FIGURE 1. THE SIMULATED FATIGUE CRACK the grit blasted specimens is what appearsto be a saturation effect (Fig.5), how-ever, the authors feel further invest-
The Al 2024 specimens had the model sur- igation will be necessary to verify thisfaces machined to achieve the desired finding. Another variable of this'studyroughnesses, with the exception of the was frequency of the acoustic waves.4 microinch sample which was grit blasted. Comparison of data taken for two dif-

-60-
ferent model cracks shows essentially result reportej4 reviously by Lohanicno difference(Fig. 6). and Lipschultzr '.
E. ELASTIC FINITE ELEMENT ANALYSIS
rhe authors will now give a brief de-scription of the computer model forcrack closure using a finit ?slementprogram developed by Sewell . Assumethat a fatigue crack growth experimentis carried out on a compact tensionspecimen. As the crack grows, it willleave behind an approximately uniformwake of residual strain, that is, thematerial in the wake of the crack tipwill effectively become thicker becauseof the surface roughness and volumn
-----. ----- ------- change associated with the high tensilestrains near the crack tip before seper-
PZT / ation. Ibis increase in thickness ismodeled as a uniform coating of newmaterial on the crack surfaces. The
CRACK CLOSED normal stress distribution across the
CRACK OPEN crack interface is then established asa function of distance from the cracktip. The stress distribution obtained
FIGURE 2. A TYPICAL FATIGE CRACK by the analysis is then available tointerpret the transmitted acoustic data
Addionally, note the similarity in the from a fatigue crack( 2).4 microinch curves in figures 3 and 4.
'o o o , '
I I -CUSO-AOJ. SO
44
12
2.25 mhz COMPRESSIONAL WAVES
O .5a Ilay 0.l 5 6y O.2ayAPPLIED STRESS
FIGURE 3. ACOUSTIC WAVE AMPLITUDE VS. APPLIED STRESS (GRIT BLASTED SPECIMENS)
The acoustic wave frequencies used here F. DISCUSSION AND CONCLUSIONwere 2.25 MHz for the former and 1.0 MHzfor the latter. Thus the authors feel The authors have demonstrated that inthat there is little frequency effect order to evaluate the true extent ofin the 1.0 MHz to 5.0 MHz regime, a crack closure distance as a function
4.

-61-
1.4 Q
1.2-
J 1.0o
0.
0 K rms Roughness (,u inches)
* 16> 0.6 0 64
- 01250 250
cc0.4 ' 01 mhz Compressional Waves
0.2
0.10Y O.2ay 0.3oy 0.4,
APPLIED STRESS
FIGURE 4. ACPUSTIC WAVE AMPLITUDE VS. APPLIED STRESS (MACHINED SPECIMENS)AL no. M
of load it is necessary to consider thecompressive stress on the fracture sur-face, and the transmission factorwhich is a function of the stress andsurface roughness. Usi?9) the elastic
0% finite element analysis , the extentof closure and the closure stress havebeen determined allowing the calcula-
0% tion of the acoustic wave transmissionacross the interxfjce which s given by;
N*71Ut LtT O T.ETA,%j T(i(x)RMS)dx
where TAI= total acoustic transmissionaampvmacross the interface
FIGURE 5. THE SATURATION EFFECT ar true crack length
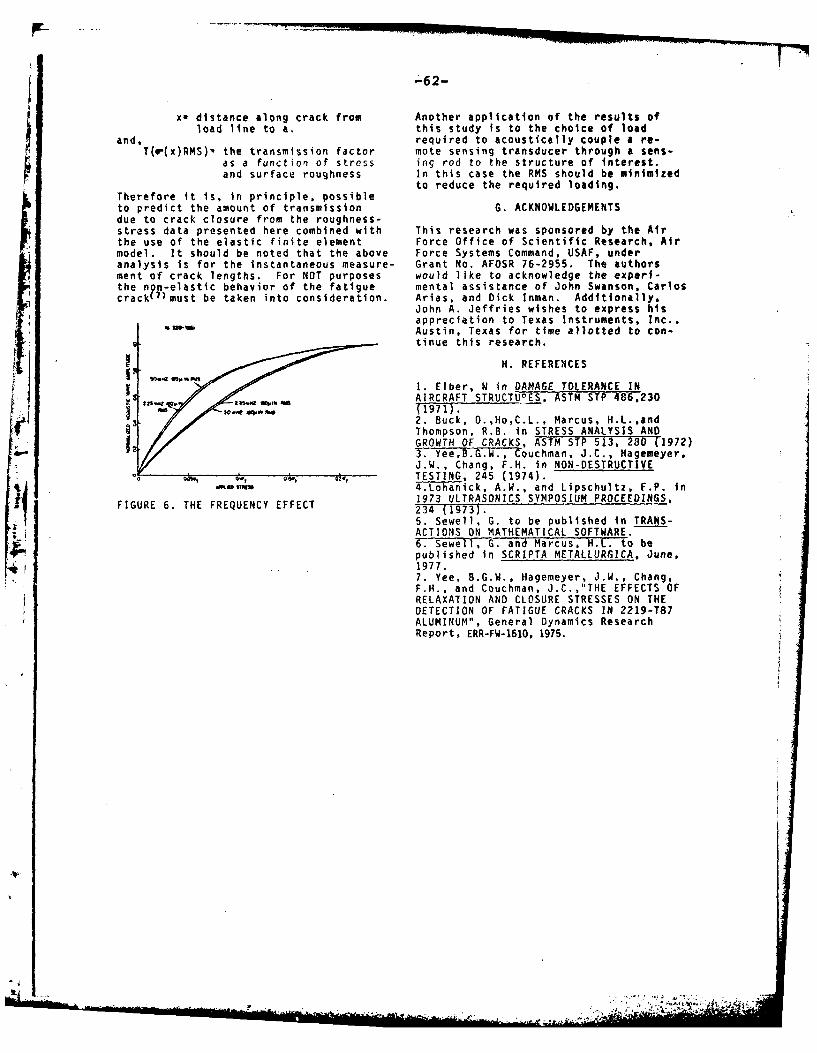
-62-
x- distance along crack from Another application of the results ofload line to a. this study is to the choice of load
and, required to acoustically couple a re-T(.(x)RMS) the transmission factor mote sensing transducer through a sens-
as a function of stress ing rod to the structure of interest.and surface roughness In this case the RMS should be minimized
to reduce the required loading.Therefore it is, in principle, possibleto predict the amount of transmission G. ACKNOWLEDGEMENTSdue to crack closure from the roughness-stress data presented here combined with This research was sponsored by the Airthe use of the elastic finite element Force Office of Scientific Research, Airmodel. It should be noted that the above Force Systems Command, USAF, underanalysis is for the instantaneous measure- Grant No. AFOSR 76-2955. The authorsment of crack lengths. For NOT purposes would like to acknowledge the experi-the non-elastic behavior of the fatigue mental assistance of John Swanson, Carloscrack(7 )must be taken into consideration. Arias, and Dick Inman. Additionally,
John A. Jeffries wishes to express hisappreciation to Texas Instruments, Inc.,Austin, Texas for time allotted to con-tinue this research.
H. REFERENCES
1. Elber, W in DAMAGE TOLERANCE INAIRCRAFT STRUCTURES, ASTM STP 486,230(1971).2. Buck, O.,Ho,C.L., Marcus, H.L.,andThompson, R.B. in STRESS ANALYSIS ANDGROWTH OF CRACKS, ASTM STP 513, 280 (1972)3. Yee,B.G.W., Couchman, J.C., Hagemeyer,J.W., Chang, F.H. in NON-DESTRUCTIVETESTING, 245 (1974).
4.Lohanick, A.W., and Lipschultz, F.P. in1973 ULTRASONICS SYMPOSIUM PROCEEDINGS.1 FIGURE 6. THE FREQUENCY EFFECT 234 (1973).5. Sewell, G. to be published in TRANS-ACTIONS ON MATHEMATICAL SOFTWARE.6. Sewell, G. and Marcus, H.L. to bepublished In SCRIPTA METALLURGICA, June,1977.7. Yee, B.G.W., Hagemeyer, J.W., Chang,F.H., and Couchman, J.C.,"THE EFFECTS OFRELAXATION AND CLOSURE STRESSES ON THEDETECTION OF FATIGUE CRACKS IN 2219-T87ALUMINUM". General Dynamics ResearchReport, ERR-FW-1610, 1975.
.~Kk.
- -. --,-. -. .4

-63-
Appendix G
MODEL FOR ULTRASONIC MEASUREMENT OF TRUE
CRACK LENGTH WHEN CRACK CLOSURE EXISTS
John A. Jeffries* and H.L. Marcus***Staff Engineer
Texas InstrumentsAustin, TX 78750
**Department of Mechanical Engineeringand Materials Science and Engineering
The University of TexasAustin, TX 78712
MODEL
The amplitude of acoustic wave transmission through the closed
portion of a fatigue crack is a function of two variables. These vari-
ables are the roughness of the fatigue crack interface and the compres-
sive stress distribution from the point of crack closure to the crack tip.
The model to be developed will encompass both of these variables.
In general, the curves described by the plots of acoustic wave
transmission versus applied stress (Fig. 4), are roughly approximated by
the form:A ,Amax(1-en ) -I-
where A = the amplitude of the transmitted acoustic wave normalized to the
maximum transmitted wave
Amax = maximum transmitted wave
n = a variable to be determined
and o = the stress across the interface which is always compressive.
For the roughnesses produced in the compact tension specimens,
it was found that the curve described by:

-64-
Lni
Lal
CD
0l
Ln
00 cn
0V) LA.
00
Ap..
A Aiax(l-e + 028) -2-
closely matches the acoustic wave amplitude versus applied stress curve
previously measured (Fig. 10). Here the units of A are arbitrary with a
maximum of very nearly Amax and a, the applied stress, is in units of
MN/r 2.
If it is assumed that the stress distribution is linear and
increases from zero at the point of closure to the yield strength of the
material at the crack tip then it is of the form:
a = mx -3-
where m is a constant dependent on x, the crack closure distance, and xvaries from zero at the crack closure point to x., the distance from the
closure point to the crack tip.'4 The expression:
+mnxA = Amax(-e x) -4-
describes the predicted transducer output curve. Next, the values of m
for the two"specimens must be determined. For specimen one:
at x = 0, = 0
at x = x= .018m, 3 = -380MN/m 2
o o_-380 _ 21oin m = xT .018 N
For specimen two:
at x = 0, o = 0
at x = x, M .005m, o= -380MN/m 2
Sm2 = - -380 76,0MN/m3o om2 x-1 .005
where the location of x = 0 and x x. have been determined experimentally
- .~,'
-66-
Thus the two equations describing the normalized predicted acoustic wave
output for the two specimens are:
A = Amax(-e mn x) Amax('e 0 0x) 5
and A2 = Amax(le+nx) = Aax(I-e2 x -6-
In order to determine the total normalized acoustic wave transmission
across the interface, TAI, the curves must be integrated from x = 0 to
x = x., orX=X. --It X=XTx= n T~* +n
TAI = Amax 1-e dx Arax x+ e j -7-mnx0
Evaluation of the integral for the two curves yields:
TAIl = .0163Amax
TAI2 = .0045Amax
•1 and the units for TAIl and TAI2 will be distance times the maximum wave
transmission.
In order to determine the perc ntage of acoustic wave transmis-
sion across the interface, TAI1 and TA12 must be divided by the integral
of the acoustic wave if all transmission began at the closure point, or:X=X
T
TAT f Amaxdxx=O
where T is the total acoustic wave transmission assuming all transmis-
sion began at the closure point and A represents the maximum trans-
mission across the interface. Thus
X=Xt X=XT
TAIl = fAmax dx=Amax I .01 8 Amax .9.
x=0r x=0t, X=X T X=Xl"
TAI 2 f Aadx=. maxX I = .005Aaxx=0 x=0
t---
-67-
where the units will again be distance times the maximum acoustic wave
transmission. Now the transmission percentage, T , can be obtained and
is equal to
T" TAI
TAT
Therefore
.0163AraxTAPI = .. 90 =90%
.008Arax
.0045Amax= .O5Aax .90= 90%
and the units of the numerator and denominator cancel each other. Thus
10% of the acoustic wave transmission is attenuated by the low stress
portion of the crack.
In the preceeding section of the model development it was
, assumed that the stress distribution from the crack closure point to the
crack tip was linear. However, it is better to model the stress distri-
bution as
a = mx2 -11-
where m is a constant and dependent upon the degress of crack closure.
This stress distribution approximates the results of an elastic finite
element analysis in Appendix E or that expected from beam theory.
The values of m for the nonlinear stress distribution model are obtained
in the same manner as for the linear model.
For specimen one:
at x= 0, o= 0

-68-
at x - x= .018m, o = -380MN/m 2
0 _2y -380M0 = = -1.17x10 6MN/mr
x2 (.018)2
and for specimen two:
at x = 0, a = 0
x = x = .005m, o = -380MN/m2
M2 = !.-380 -15.2x10⁶MN/m4, x (.005)2
The model can now be modified to reflect the non-linearity of the stress
distribution in the specimens.
n For normalized acoustic wave transmission in general the expres-
sion is -
+mnx 2A - Amax (1-e -12-
where mx2 has been substituted for a. The total normalized acoustic wave
transmission across the interface becomes
TA Aax (1-e+mnx -13-
The evaluation of this integral is in Appendix G1.
Since the value of n has already been determined, the expres-
sions for the normalized acoustic wave transmitted for each specimen are
A1 = Amax(1-e -14-
and 0.3110S2A2 = Amax(1-e xx) -15-
I
.. . ._ _ _ , • .;: " .

-69-
Therefore, the expression for the total normalized acoustic wave
transmission across the interface for the two specimens are
x=.018
TAIl = Amaxf (1-e 3"33x1Ox 2 )dx -16-
x= 0
x=.005
and TAI2 = AmaxJ (1-e4 )dx -17-
x=0
which, upon evaluation, yieldi2
TAIl = 1.31 x 10⁻² Amax
i andand TAI2 = 3.65 x 10- 3 Amax
The units of TAIl and TAI2 will again be distance times the maximum
acoustic wave transmitted. To obtain the percentage of wave transmission
across the interface, the amount of transmission that would occur if all
transmission began at the closure point must be determined. This quantity
TAT, is equal to that calculated in equations 8 - 10. Now the trans-
mission percentage, TAP, can be determined.
TAI1 1.110-2ATaP1TAIl 1.31x A .73 = 73% -18-
TAIT .018A
and r TAIl - 3.65x1O 3Amax .73 -73% 19-TAI2 .005Amax
-70-
Therefore, 27% of the acoustic wave transmission is attenuated
by the low stress portion of each crack. And it has been shown that the
percentage of acoustic wave transmission is independent of the crack
closure distance. Note that the percentage transmission obtained is only
for the conditions of o = mnx 2 stress distribution and a transmission co-
efficient, A, independent of surface roughness over the range of interest.
(!
111
I
-71-
DISCUSSION AND APPLICATIOMI OF THE MODEL
It was demonstrated in Appendix C that
acoustic wave transmission through a fatigue crack interface is virtually
independent of roughness in the 4.8 pmeter to 10 Pmeter rms range. In the
development of the model in the preceeding section, it was shown that the
percentage of acoustic wave transmission through a fatigue crack is inde-
pendent of closure distance for a fixed stress profile. This independence
(! of closure distance applies to both the linear and quadratic models of the
stress distribution normal to the surface along the closure distance. In
the prediction of true fatigue crack size the model can be used in several
First of all, it must be noted that when the crack analysis uses
measurement of reflected waves rather than transmitted waves, the pre-
dicted transmission quantity must be subtracted from one to give the
reflected wave quantity.
The two most general cases of crack interrogation occur when the
transducers are large relative to the closure distance and when point
transducers are used (See Fig. 2).
In the use of transducers large relative to the closure dis-
tance two different techniques may be used to account for the crack clos-
ure and to predict the crack size. The first of the two techniques
requires the use of the predicted percentage of acoustic wave transmis-
sion. Since the transducer is large relative to the closure distance the
output can be considered the integral of the acoustic wave transmitted
IMA

-72-
X=O X=XT
LARGE TRANSDUCER RELATIVE TO CLOSURE
0
x 0 x xt
POINT TRANSDUCER
o
FIGURE 2. THREE TRANSDUCER SIMES RELATIVE TO CRACKCLOSURE DISTANCE
-73-
When point transducers are used to examine a fatigue crack, the
procedure is essentially the same as that described for the large trans-
ducers. Instead of locating the point where the change in output becomes
linear, the point where transmission first reaches constant output corre-
sponds to the point, xc, where the stresses are high enough to make the
crack appear transparent to the acoustic waves. Now the distance from
the closure point to the crack tip may be determined just as in the pre-
ceeding section for large transducers.
When transducers are used in fatigue crack analysis that are
smaller than the closure distance, but larger than point transducers and
have a non-uniform front, the evaluation becomes more difficult. Now, not
only the acoustic wave transmission as a function of stress can be deter-
mined, but the geometry of the transducer itself may need to be considered.
There are two techniques that may be used with transducers in this size
range. The first technique is similar to that developed for large trans-
ducers when the predicted percentage of transmission is used. Since the
transducers are smaller than the crack closure distance, however, as the
transdicers are moved along the crack the outputs must be summed. This
summation should provide the equivalent of the integral of the acoustic
wave output that would be observed if large transducers were used when
the geometric effect is taken into account. The technique now is that
developed earlier for the large transducers.
The second technique for use with these transducers is essenti-
ally the same as the method described for use with the point transducers.
The point where transmission begins still corresponds to the crack closure
-74-
through the crack. The expected output of the transducer is shown in
Fig. 3. At some point along the output curve it becomes linear. This
linear portion of the curve corresponds to the increase in transducer
area parallel to the crack, past the point where the crack appears trans-
parent to the acoustic waves. If a line is constructed beginning at
x = 0, the closure point, with the same slope as the linear portion of
the output curve, this new curve represents the integral of acoustic wave
transmission if complete transmission occurred at the closure point (i.e.,
it is the integral of Amax). Thus, from the model, when the output
Icurve is the predicted percentage of the integral of the Amax curve the
crack tip has been located. An example of this is shown in Fig. 12.
The second technique for use with the large transducers requires
the location of the point along the output curve where the curve first
becomes linear. This point corresponds to the point along the crack
where transmission is complete. Experimentally, by knowing the point
where transmission begins (x = 0), the point (xe) and the stress (.24ay)
where transmission is 95% complete and assuming the stress at the crack
tip (x,) is equal to the yield strength of the material, the crack length
can be determined. To accomplish this, the assumed stress distribution
0 = nx2
is used where x is the distance from the closure point to the crack tip.
The value of n is then determined by the point where transmission is 950%
complete. Then the crack length can be determined from the stress of oy
at the crack tip.
..
P ..~ 4.A

-75-
MEASURED ACOUSTIC WAVE TRANSMISSIONILI
4J
0
0CL
J A u~
4J U u
> Lnif CC~ *- <
x uI Lix
0 06
5 - C)
-76-
point where the compressive stress is zero. To determine the point where
acoustic transmission is complete the location of the trailing edge of
the transducer must be known. When the acoustic transmission reaches a
constant value, the trailing edge of the transducer is at the point, xo,
where transmission is complete. Therefore, as in the case of the point
transducers, enough information is known about the crack to predict the
true crack length.
A model has now been developed and described which allows the4•4
prediction of fatigue crack size in aluminum alloys for three different
size transducers relative to the crack closure distance. The model should
also be applicable to fatigue crack analysis in other materials when the
required data are obtained.
-"

-77-
CONCLUSION
In this research, a model has been developed and described which
allows the prediction of true fatigue crack size based on acoustic trans-
mission analysis in aluminum alloys. Additionally, it has been shown that
the acoustic wave transmission through a fatigue crack interface as a
function of applied stress is very dependent on the interfacial surface
roughness when the roughness is below approximately 4.8 pmeters rms, and
independent of roughness in the 4.8 pmeter to 10 pmeter rms range. The
10 umeter rms roughness was the maximum roughness tested and corresponds
to measured values from samples fatigued with a constant stress intensity
range.
This model should be applicable to fatigue crack analysis in
other materials such as steel and titanium when the required data are
obtained. The model predicts the crack length independent of relaxation
of the crack as long as the general stress dependence across the crack
interface remains fixed and the crack surfaces are not totally in contact.

-78-
APPENDIX G-1
Evaluation of the integral
x 2A = J(I-e'x )dx
x= 0
The curve of 1-e describes a normal distribution and must be solved
by approximation.
A f (l-e-ax )dxx=0
Putting in the finite value of x for the upp~r limit of integration, let'1 the upper limit be n
A = n- J'(l-ea )dx
Let y= a~xthen y2 = aX2
and dy= r4dx
nl 1 ; re dyaA n-J -y2 dy n 12eY2d
Let z T2- then z =2y2
and dz =J-2 dy
A =n- =. f. z~' dz
n- -a f e /2

-79-
n e-Z /2dz
1 uw ,f eZ 2/ dz
t A = n (h n(n 2~
*ifJS* >! thn
14 () i ~150 then A nl 1
(25fi 0 then A n-- N(n F)
and N must be found in a >Ible for normal distributions.
In the development of the model, a is always greater than n2/50 so
the approximation (1) is used.
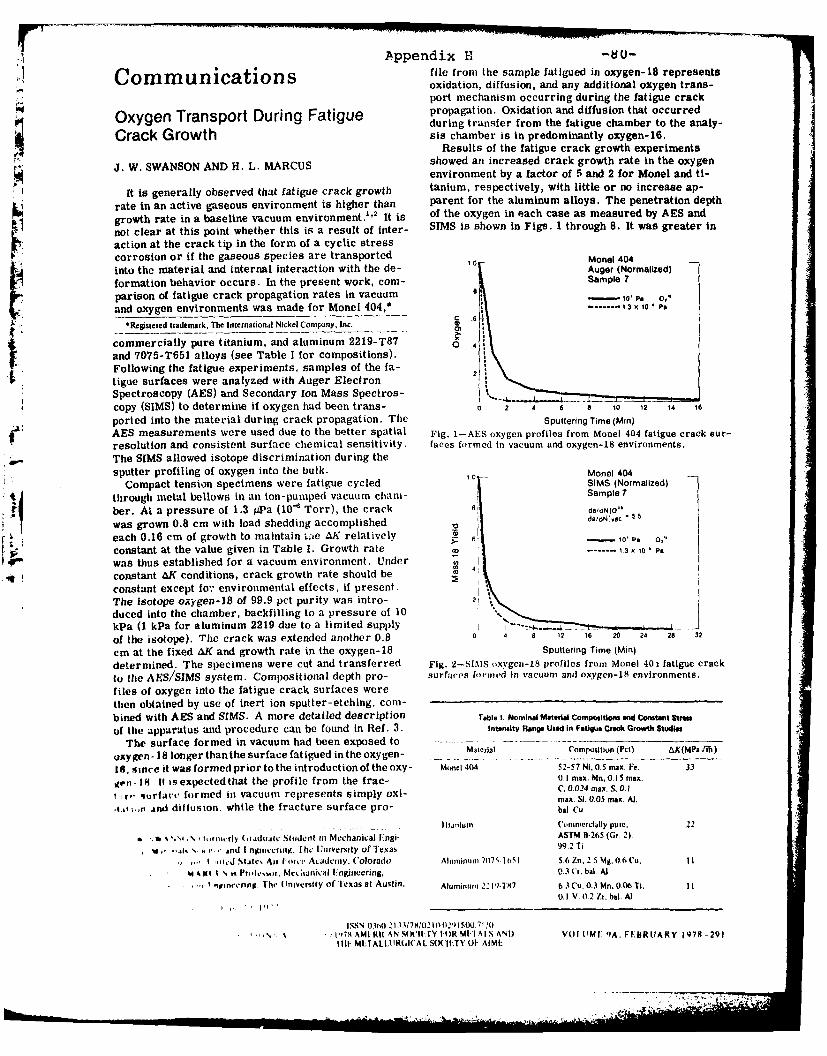
Cppendix HCommun.ic.atns file from the sample fatigued in oxygen-18 represents
oxidation, diffusion, and any additional oxygen trans-port mechanism occurring during the fatigue crack
Opropagation. Oxidation and diffusion that occurredduring transfer from the fatigue chamber to the analy-
Crack Growth sis chamber is in predominantly oxygen-16.Results of the fatigue crack growth experiments
showed an increased crack growth rate in the oxygen.Jw. SWANSON AND H. L. MARCUS environment by a factor of 5 and 2 for Monel and ti-
lt is generally observed that fatigue crack growth tanium, respectively, with little or no increase ap-
rate in an active gaseous environment is higher than parent for the aluminum alloys. The penetration depth
growth rate in a baseline vacuum environment.' 2 It is of the oxygen in each case as measured by AES and
not clear at this point whether this is a result of inter- SIMS is shown In Figs. 1 through 8. It was greater inaction at the crack tip in the form of a cyclic stresscorrosion or if the gaseous species are transported Mone 404
into the material and internal interaction with the de- Auger (Normalized)formation behavior occurs. In the present work, com- Sample 7
parison of fatigue crack propagation rates in vacuum 0 ,0 , o*"and oxygen environments was made for Monet 404,* .... 3 x 10 P'
.Registered trademark. The International Nickel Company, Inc., commercially pure titanium, and aluminum 2219-T87 o 0_. and 7075-T651 alloys (see Table I for compositions)." Following the fatigue experiments, samples of the fa-
tigue surfaces were analyzed with Auger Electron! Spectroscopy (AES) and Secondary Ion Mass Spectros-qcopy (SIMS) to determine if oxygen had been trans- 0 2 4 6 a 10 12 14 16
ported into the material during crack propagation. The Sputtering Time (Min)AES measurements were used due to the better spatial Fig. I-AES oxygen profiles from Monet 404 fatigue crack sur-resolution and consistent surface chemical sensitivity, faces formed in vacuum and oxygen-18 environments.The SIMS allowed isotope discrimination during thesputter profiling of oxygen into the bulk. Monel 404
Compact tension specimens were fatigue cycled SIMS (Normalized)
through metal bellows in an ion-pumped vacuum cham- Sample 7
ber. At a pressure of 1.3 APa (10-" Torr), the crack 0d8N10"
was grown 0.8 cm with load shedding accomplished da/ON!.ec
each 0.16 cm of growth to maintain ;,e AK relatively 5 6' .- ,1Ps 0 'constant at the value given in Table 1. Growth rate t . 3 X 10 Pe
was thus established for a vacuum environment. Under
constant AK conditions, crack growth rate should be
constant except I o,. environmental effects, if present.IThe isotope oxygen-18 of 99.9 pct purity was intro-
duced into the chamber, backfilling to a pressure of 10kPa (1 kPa for aluminum 2219 due to a limited supply * - l-,L -
of the isotope). The crack was extended another 0.3 0 4 8 1? 16 20 24 26 2
cm at the fixed AK and growth rate in the oxygen-18 Sputtering Time (Mini
determined. The specimens were cut and transferred Fig. 2-SIMS oxygcn-18 profiles from Monel 401 fatigue crack
to the AES/SIMS system. Compositional depth pro- surfaces formd in vacuum and oxygen-iS environments.
files of oxygen into the fatigue crack surfaces werethen obtained by use of inert ion sputter-etching, com-bined with AES and SIMS. A more detailed description Table 1. Nominal Material Compositions and Constant Stress
of tie apparatus and procedure can be found in Ref. 3. Intensity Range Used In Fatigue Cree Growth Studios
The surface formed in vacuum had been exposed to ..........
oxygen -18 longer than the surface fatigued in the oxygen- .. MteCrial Composition (Pct) AK(MPA -J)
IS. since it was formed prior to the introduction of the oxy- Monel 404 52-57 Ni. 0.5 max. Fe, 33
gen- il It isexpectedthat the profile from the frac- 0.1 max. Mn, O.15 mx.
t r,. surface formed in vacuum represents simply oxi- C. 0024 max. S, 0.1max. Si. 0.05 max, A).
,t.,',,, and diffusion, while the fracture surface pro- bat CuI lanjluIn ('wnnercially pure, 22
* .*i % " % t,rntrly (0raduatc Sludcnt fi Mechanical ingi- ASTM B265 (Gr. 2).
, l, , . . ,And tnjuncgcring. I he University of Texas 99.2 Ti
S .. J i.l , Air Polckv Acad.ml y. Colorado Alintinum 707 .1651 5.6 Zn. 2 5 Mg. 0.6 Cu. I I
m s i It ', is Prolc,,ur. Mlcorafnical nghinecrirg, 0.3 (r, bat. At
i nrim'ennmg. Ihe University of Texas at Austin. Aluminum 22 1 -TX7 6.3 Cu. 0.3 Mn, 0.00 T. I I
0.1 V. (,2 Zr, bal. Al
ISSN 03 0 21 n.7i20OI2 I$00.7'.'O
, I1-7M AMIRl('AN Sx'IITY I')R MEAIlS AND V(0 (MI. 9A, FIBRUARY 1978 -291
tIll" MLTIALLtURGI(AL SW(I;TY 01" AIML:
.- -..

toTitanium - Aluminum 2219 T 87-Auger (Normalized) SIMS (Normalized)Sample 9 7 aSample 10
*10 Pa -Io Pa-.
---- 3X10 PAK! -0 4 6 12 16 20 24 20 322 Sputtering Time (Min)
Fig. 6-SIMS oxygen-IS8 profiles from 2219 aluminum fatigueS crack SUrfat-es formed 'ivacuum and oxygen-iS environments.
0 6 12 18 20 24 26 X,
Sputtering Time (Min) Aluminum 70 75-T 651Fig. 3-AES oxygen profiles from titanium fatigue crack sur- Auger (Normalized)faces formed in vacuum and oxygen-i 8 environments. Sample 8
- 10' PO 0,1.0 Titanium -- ,3.131(, Ps
SIMS (Normalized) 6Sample 9 4
da/dN 0O'9
.10' Pa 0."CI -------- f.3 X10' Pa 2i.7 Aj~ r~:~i1~~2 22
Fig 7-AS poflesfrm 07 aluminum fatigue crack
_.~ L __- surfaces formed tn vacuum and oxygen-IS environments.0 4 a6 2 1 20 24 26 32 36
SpteigTime (Min) 10Aiuminum 7075 T 851Fig. 4-SIMS oxygen-IS profiles from titanium fatigue crack 10SIMS (Normalized)surfaces formed tn vacuum and oxygen-18 environments. Sample 8
~amp 4. aaJO
10-Aluminum 2219-T 87 U§1 ddNTI_*C 1.
Sapl 10 I4slO0
aSSia
1 ------- 13 X110P0ac )0 4 6 12 16 20 24 28 32
> Sputtering Time (Mmn)X.
Q 4~ Fig. H-SUMS oxygen-IS profiles from 7075 aluminkuml fatiguecrack surfaces formed in vacuum and oxygen-iS environments.
.2K From scanning electron micrographs, no change in
0 - ~ 32 fracture surface appearance was noted for the alumi-0 4 12 6 20 24 2 32 num alloys or titanium. The Monel exhibited a largeSputtering Time (Min) percentage of fracture of a crystallographic nature
Fig. 5-AES oxygen profiles from 2219 aluminum fatigue crack when fatigued in oxygen, in agreement with previouslysuriacce formed in vacuum and oxygen-18 environments, reported results.'
A model for Sweep- in of interstitial atoms that ori-all cases when the crack was grown in oxygen- 18. ginate in the gas phase by mobile dislocations duringThere is consistency between AES and SIMS in indi- fatigue crack propagation has been proposed"' andeating enhanced penetration. Limited sputter rate shows the plausibility of such transport for the smallcalibration prevents quantification oi transport depths, hydrogen atom. Using the bulk diffusivity of oxygen,however using an estimated 50 to I0OA for the natural this model is Insufficient to explain the present re-oxide thickness gives an estimate of the enhanced sults. If an enhanced oxygen diffusivity near the re-transport of 100 to 600A. laxed high dislocation density sur-face is postulated,
Samples of metallographieally polished Monel and then the dislocation mechanism is plausible.titanium were allowed to oxidize and were sputter pro- The interpretation of the fatigue crack growth re-filed using the same ion beanm parameters as for the sults by the authors is that gaseous environmentalfatigue samples. The profiles thus obtained demon- species, oxygen in this case, are transported into thestrated point by point agreement with the samples fa- metal during passage of a fatigue crack, possibly bytigued in vacuum. This would suggest that changes in mobile dislocations. The interstitial solute atoms insurface roughness associated with fatigue crack growth increased concentrations then interact with the basedid not contribute significant error to the measurement metal, significantly modifying the local plastic be-and could not explain the differences observed in the havior and fracture strain in the vicinity of the crackvacuum and oxygen-18 runs. tip. This interaction for oxygen is apparently the
19.1VOUL 9A, IIIORUAIHY P178 MVTAI,.LURG;ICAL TRANSACTIONS A

-82-
strongest for Monel 404 and minimal for the alloyedaluminum. The oxygen influence on fracture straincould be the cause for the increase in growth rate. Asecond possibility would be associated with the crackclosure concept ,'8 which is concerned with the factthat during part of Whe loading cycle the crack closesdue to a residual displacement pattern in the wake ofthe crack. In the case reported here the observedchange in oxygen penetration and postulated change in,plastic behavior due to the transport of the oxygencould be expected to result In a smaller residual dis-placement in the wake of the crack, increasing the ef-fective AK used in the crack closure model, conse-quently increasing the growth rate. A great deal ofadditional research will be required to establish thevalidity of these hypotheses.
This research is sponsored by the Air Force Officeof Scientific Research, Air Force Systems Command,USAF, under Grant No. AFOSR 76-2955. The authorswant to thank Dr. P. Lindfours of Physical Electronicsfor the AES and SIMS analyses.
1. J. D. Frandsen, N. E. Paton, and HI. L. Marcus: Bin. Trans. 1974. vol. 5,pp. 16561.
2. H. L. Marcus. J. C. Williams. and N. E. Paton: Corrosion Fatigue, NACE-2.0. F. Deveraux, A. J. McEvily, and R. W. Stachle, eds., 1972, pp. 346-58.
3. J. W. Swanson: "Dislocation Transport of Oxygen During Fatigue CrackGrowth." master's thesis, The University of Texas at Austin. May 1977.
4. W. L. Morris, J. D. Frandsen, and H. L. Marcus: Fracrography, ASTM STP,* I V 7t,. vol. WO, lip. 49-6 i.
5. J. K. Tien. A. W. Thompson. 1. M. Bernstein. and R. J. Richards: Met. Trans A.~197(,. vol. 1. pp. H21-29.4r" .l . l. ien, R. 9. Richards, 0. Buck, and II. L. Marcus: Scripta Met.. 1975,
vol 9. pp 1197-11017. W. kIber: hg. Fract. Meets, 1970, vol. 2, p. 37.8 W Flber: IDadnage Tierance in Aircraft Sirurtures. ASTM STP. 147 1. vol. 49f,.
pp. 230-42.
I.i
wt
-83-
Appendix I
APPLICATION OF SIrS AND AES TO ENVIRONMETAL STUDIESOF FATIGUE CRACK GROWTH IN ALUMINUM ALLOYS
Anna K. Zurek and H.L. MarcusDepartment of Mechanical Engineering/
Materials Science and Engineering Pr3gramThe University of Texas at Austin
Austin, Texas 78712
1. Introduction
The purpose of this investigation was to study the effect of hydrogen, deuter-ium, water vapor and oxygen on the fatigue crack growth of high strength alu-minum alloys. Fatique crack growth tests in a controlled environment werefollowed by Secondary Ion Mass Spectroscopy (SIMS) and Auger ElectronSpectroscopy (AES).
Influence of humid air on fatigue crack growth in high-.strength aluminumalloys is an important practical problem well documented in literature [1-5].The studies shov' an increase of crack growth rate of aluminum alloys in watervapor. In many cases it is attributed to hydrogen embrittlement. On theother hand gaseous hydrogen has no effect on fatigue crack growth [4].
Several models of hydrogen embrittlement for various materials have beenconsidered [6-10]. The sweep-in mechanism during fatigue crack growth pro-poses combination of diffusion and dislocation sweeping of hydrogen into theplastic zone. This results in a hydrogen penetration deeper than o-, thecharacteristic depth for diffusion, and a consequent increase in hydrogenconcentration that in some manner weakens the material [9,10]. The hydrogeneffect is even more pronounced in the presence of various trapping sitessuch as particle interfaces, which are made more effective by the deformationassociated with the propagating crack [9,10,11].
2._ Experimental Procedure
The age hardenable aluminum alloys used in this study are 7075-T651 (chemicalcomposition weight percent: 5.6% Zn; 2.5% Mig; 1.6, Cu; 0.3% Cr;,and c =505 MPa;KIS=25 MPavm) and 2219-T851 (chem comp.: 6.3% Cu; 0.3% Mn; 0.18% Zn; 6.1% V;0.06% Ti; and Oy=350 MPa; KIC=35 MPav-m). The compact tension fracture mechan-ics type specimens were use in the faticue crack growth experiments [12].The fatigue crack was first grown in a I pPa vacuum at a constant LK (rangingfrom 10 to 21 MPavF,) and frequency (6 or 10 Hz). The chamber was then filledwith one of the gases hydrogen, water vapor, oxygen-18, Jeuteriurated watervapor or deuterium gas. Fatigue crack growth was then continued in the en-vironment, up to a certain crack length and then the specimen was fast frac-tured. Crack propagation rate was monitored optically. Specimens cut fromthe fracture surfaces were then transferred to AES/SIMS vacuum system. Hydro-gen, deuterium and oxygen 18 concentration profiles normal to the fracturesurface were investigated by inert ion sputtering combined with SIMS. Nega-tive SIMS was utilized in case of deuterium due to the higher yield of D overD+ ions. For oxygen AES was used in paral'el. In addition deuterium ion

-84-
implanted standards were prepared using a high energy ion implantation. Thesewere used for calibration purposes of the SIMS system and as a source ofmeasuring induced trapping effects.
3. Results and Discussion
Experimental difficulties were encountered in measuring the atomic hydrogenprofile with SIMS in the presence of the 3x -5 torr argon sputtering gas.Therefore, oxygen 18 and deuterium as isotope markers in SIMS profiling wereused.
Fatigue crack propagation rate for dry oxygen 18 did not significantlyincrease in comparison to vacuum (1.1 times). The ion sputtering profilesdetermined by AES and SIMS for 2219 and 7075 aluminum alloys have been pub-lished elsewhere [12,13]. A significant enhancement of the thickness of theoxygen for the region fatigued in oxygen 18 by a factor of about 2 to thatfatigued in vacuum and subsequently exposed to oxygen 18 occurred in bothcases. Dry hydrogen or deuterium also show no change in fatigue crack growthrate when compared to vacuum.
Water vapor (H20 or D20) strongly influences the fatigue crack growth rate.The ratio of crack growth rate in water vapor to that in vacuum varied from1.8 to 3.6 depending on the AK value. The effect was more pronounced forintermediate AK values.
The SIMS profile of deuterium in the fracture surface for the specimentested in vacuum represents deuterium for which diffusion occurred when thissurface was exposed to D20 atmosphere subsequent to the fatigue crack growth
(Fig.l, curve 1). The surface profile for the segment cracked in the D20vapor represents diffusion and any additional deuterium transport mechanismoccurring during the fatigue cycling process (Fig.l, curve 2). Deeper pene-tration of deuterium for the portion of specimen where fatigue crack growthwas in D20 vapor to that in vacuum was observed (Fig.l). This is in quali-tative agreement with dislocation sweeping mechanism [9,10].
SIMS Profiles I1 "d-AL -2219 T851
.. 8
Iwo days
2 C4
I
.2 .2 four day aer
1 2 2 5 10 is 20 25 30Spufferng time (mi) SpuiferIng fime (min)
Fig.l SIMS profiles of D in Al- Fig.2 D_ SIMS profiles of deuterium2219 T851 alloy on fractured ion implanted Mg-base Mg-Zn alloy.surfaces and dummy specimen.
The deuterium background level in the AES/SIMS system was obtained usingthe dummy specimen. This specimen was exposed to D20 environment for the same
4. i.

-85-
period of time as the others but was not fatigued and only a prior existingoxidized surface was exposed. The deuterium SIMS profile frcm the dummy spec-imen is initially only about 10% of the signal obtaincd from the D90 andvacuum fractured specimens and disappears within 3 tc 4 minutes of-sputteringtime (Fig.1, curve 3). This shows that deuterium contamination from theAES/SIMS vacuum is very low.
* Preliminary attempts at calibrating the SIMS system were done on the Mg-base Mg-Zn alloy ion implanted specimens., To simulate the fatigue fracturesurface conditions, the specimens were ion bombarded with neon at energies130 keV and 150 keV. By such multi-implantation, radiation damage was deepand uniform. Then a known dose of deuterium was implanted into the specimenwithin the damaged region.. The profiles of deuterium determined by SIMS areshown in Fig.2. Fig.2 provides two other profiles taken two and four dayslater. These experiments will be repeated in the near future using aluminumalloys of our interest. Hydrogen implanted into the single crystal of alu-minum has been reported to diffuse out within half an hour [15]. Therefore,presence of trapping sites is required for retarding the diffusion of hydrogenand/or deuterium atoms [11,14]. During the deformation associated with theplastic zone of propagating crack in fatigue fractured specimens large amountsof various types of trapping sites are created. Using radiation damage we
*1 hope to simulate the destruction of the material of the character created in, fatigue fracture. This could then be used to evaluate the hydrogen present
and its transport mechanism.
4. Conclusions
(1) SIMS can be applied to study the influence of water vapor on the fatiguecrack growth of aluminum alloys. (2) Dry hydrogen (or deuterium) does notaffect fatigue crack growth in 2219 and 7075 aluminum alloys. (3) Oxygenpenetrates deeper in surfaces formed during fatigue than vacuum fatigued andoxygen exposed surfaces. It does not play a significant role in fatiguecrack growth. (4) Hydrogen (or deuterium) from water vapor influences thefatigue crack growth rate and increases penetration of hydrogen and/or deuter-ium into the material. (5) Ion implanted specimens can be used for the SIMScalibration and for the trapping analysis.
Acknowledgement: This research was sponsorcd by the Air Force Office ofScientific Research, NE Contract AFOSR 76-2995. The authors want to thankDr. R. Walser for discussions, Mr. Joe Cecil for preparing the ion implantedspecimens and D. Mahulikar for assistance in experimental procedure.
ReferencesT M. Nageswararao and V. Gerold, 1976, Metallurgical Transactions 7a, 1847.2. W.L. Morris, 1977, Met. Trans, 8A, 589.3. J. Steven Enochs and Owen F. Devereux, 1975, Met. Trans. 6A, 391.4. M.O. Speidel, 1973, Proc. of an Inter. Conf., Champion, Pa., AIME.5. J. Albrecht, et al., 1977, Scripta Metallurgica V.11, 893.6. R.A. Oriani, 1972, Technological Aspect 8, 8487. J. Schijve, 1979, Eng. Fracture Mechanics, V.11, 167.8. C.D. Beachem, 1972, Met. Trans, 3.9. J.K. Tien, 1975, Proc. of an Inter. Conf., Moram, Wyoming, AIME.10. J.K. Tien, et al., 1975, Scripta Metallurgica, 9, 1097.11. C.A. Wert, 1978 Topics in Applied Physics 29, 3U512. J.W. Swanson and H.L. Marcus, 1977, Met. Trans, 9A, 291.13. H.L. Marcus, 1977, Environmental Degradation of Eng. Materials Conf., Va.14. W.M. Robertson, 1979, Met. Trans., 1OA, 489.15. J.P. Bugeat, et al., 1976, Physics Letters, 58A, 127.
-86-
Appendix J
SIMS STUDY OF DEUTERIUM TRAPPING IN ION
IMPLANTED ALUMINUM ALLOYS
A.K. Zurek*, H.L. Marcus*,J.N. Cecil** and R. Powers**
*Department of Mechanical Engineering andMaterials Science and Engineering
The University of TexasAustin, Texas 78712
**Accelerators IncorporatedAustin, Texas 78712
Introduction
The aim of this paper is to report on a deuterium in
aluminum trapping inversion experiment. Deuterium ions,
deposited at a sharply defined depth by cyclotron irradia-
tion undergo diffusion with reversible trapping. This leads
to a gradual redistribution of the deuterium atoms within
the metal and their slow evaporation from its surface - an
inverse of the usual adsorption and transport mechanism.
In this paper, we report and discuss deuterium and oxygen
atomic distribution profiles followed by means of SIMS and
Auger electron spectroscopy.
The influence of hydrogen on fatigue crack growth in
structural aluminum alloys is discussed widely in the liter-
[1-6]ature I . It has been shown that humid air and water
vapor increases crack propagation rate in aluminum alloys
but dry hydrogen has no effect [7 '8 ] At room temperatures,
diffusivity of hydrogen in metals is extremely high and exceeds
that of heavy interstitials like oxygen and nitrogen by 15 to
[9]20 orders of magnitude [ . Penetration of hydrogen during

-87-
fatigue crack growth could be deeper than the predicted depth
for simple diffusion using the sweep-in concept [I0 'I I ]. The
time scale of hydrogen presence in the metal during fatigue
is certainly much longer than characteristic time for hydrogen
diffusion [8 ]. Therefore, a presence of trapping sites for
hydrogen must be expected in various forms such as Cottrell
atmospheres, interfaces, vacancies, voids, etc.[914] It
has been reported that hydrogen implanted into the single
crystal of aluminum diffuses out within half an hour[15]
less time than it would take to run the fatigue experiment,
thereby confirming the need for trapping sites to explain
the longer presence of the deuterium. In consequence, a con-
centration of hydrogen higher than the solubility level in
the aluminum alloy associated with trapping sites could be
related to the observed increase in the crack propagation rate
during the fatigue tests [8 ]
Materials and Experimental Approaches
Specimens of 2219-T87 and 7075-T6 aluminum alloys were
prepared in four different ways. The preparation prior to
deuterium implantation included as received unrolled, cold
rolled 7-10%, radiation damaged and the fracture surfaces of
a sample fatigued in 50% RH laboratory air. Surfaces of the
as received unrolled, cold rolled and specimens prepared for
the radiation damaged received light polish finish using a
soft cloth polishing wheel. The radiation damaged samples
-88-
were subjected to the neon irradiation with a beam of 130 KeV
and a dose 8 x 10¹⁵ ions/cm2 at a projected range of 0.23 pm.
Such high energy ion radiation produces point defects (inter-
stitials, vacancies) and vacancy clusters [16 ] Slightly
higher doses of impinging neon atoms into the prepared aluminum
alloy thin disks caused overheating, melting and destruction
of the specimen. The specimens were cooled to room temperature
before the deuterium implanting process to be described below.
Cold rolling produces deformed giains, higher dislocation
density, and modified precipitate matrix interfaces. Thus,
as a result of increased dislocation density and modified
interfaces a cold worked material has a higher possibility of
trapping hydrogen than an unrolled one. The fracture surfaces
from the fatigued specimens represent a graded deformation
process with the largest deformation and corresponding trapping
sites expected to be closest to the surface.
Due to the high background level of hydrogen in the AES/
SIMS system vacuum chamber, deuterium as an isotope was used
to study the trapping mechanism. The deuterium, (D+) implan-
15. 2tation (beam of 25 KeV, and a dose 6 x 10 ions/cm , at a
projected range of 0.24 Um) was done in an AIM 210 Accelerator
with 900 magnetic analyzer and energy resolution of 0.04% FWHM.
The beam was perpendicular to the implanted surfaces. The
deuterium implanted specimens were transferred into the AES-
SIMS vacuum chamber. Penetration and time dependent diffusion
-89-
profiles of implanted ions and oxygen were obtained using
SIMS and Auger Electron Spectroscopy. Due to the experimen-
tally observed higher yield of D- as compared to D+ , negative
SIMS was utilized. The relative yield phenomenon depends on
many factors such as ion energy as was observed by others[17]
In addition, platinum masks were used over the specimens to
minimize the contribution to the SIMS signal from non-uniformly
sputtered edges.
Results and Discussion
The results of the diffusion of the ion implanted
deuterium as determined by inert Ar ion sputtering are shown
in Figs. 1 and 2. In all cases the concentration after 24
hours is greater in the vicinity of the surface than in the
interior. However, there was a small increase in con-
centration at a certain depth from the surface for neon
predamaged samples. Assuming an average inert ion sput-
tering rate of 200A per min., this depth closely corresponds
to the projected range of both implanted ions. This increase
in concentration of deuterium at a projected range is due to
the locally induced traps formed by the high energy neon irra-
dation. It is highly unlikely that near surface trapping
sites were filled starting from the surface during the implan-
tation since no such attenuation process is known to exist for
the high energy incident deuterium ions. The binding energies
of trapping sites with deuterium for different metals are
typically five orders of magnitude smaller than the kinetic
-90-
energy of impinging ionsm 12 '1 3 '18 '1 9 ]. Moreover, a maximum concen-
tration at the expected penetration depth for the neon predamaged
specimens is well defined (Fig. 1,2]. Therefore, the initial
implanted distribution is that expected by their penetration
to the projected range and diffusion of deuterium after
implantation must be responsible for the ultimate observed
distribution. The relative differences in the final concentra-
* tions for the different specimens must be due to the differences
in trapping potential. Some quantitative data on trapping
energies of different trapping sites is available in litera-
ture .1 3 1 9 1 Second phase particles, solute atoms, low angle
grain boundaries and microvoids homogeneously distributed have
been considered as strong traps for hydrogen with the highest
trapping energies on the order of -1 eV. Microcracks, large
particles and high angle grain boundaries usually heterogeneously
distributed are considered as localized traps for hydrogen
having an increasing anmage effect on the material and trapping
energies lower than 0.6 eV. Dislocation and lattice sites are
very reversible diffusion sites and are poor traps for the
hydrogen with a trapping energy of approximately 0.2 eV. The
reported trapping energies [13 ,1 9 are not for aluminum alloys.
In the case of aluminum the strongest traps should be voids or
microcracks where a gas can form which would not tend to dis-
sociate on aluminum resulting in the highest trapping energy.
Fatigue fractured surfaces are expected to have the highest
density of microvoids, microcracks, grain boundaries and
-91-
dislocations with an increasing density of these traps towards
the surface. The accumulation of these traps at the surface
is expected because of the large strain field formed in the
vicinity of the propagating crack due to the crack opening
displacement and reverse yielding. In case of cold rolled
specimens, near surface accumulation of microcracks, damaged
boundaries, precipitate particles and high dislocation density
are known to be sinks for hydrogen. The observed lower con-
centration of deuterium for cold rolled specimens in comparison
to fatigue fracture is not surprising due to the presence of
lower trapping energy sites. The as received unrolled speci-
mens with fewer and uniformly distributed trapping sites such
as second phase particles, small dislocation density and veryreversible diffusion lattice sites fall in the third category
of the surfaces capable to trap implanted deuterium. The
unrolled specimens and the neon radiation predamaged specimens
seem to behave identically in terms of the observed near sur-
face concentration profile for deuterium. The light mechanical
polishing of the unrolled specimens with and without neon pre-
damage, would be expected to introduce limited amounts of nea;r
surface trapping sites.
To explain the results shown in Figs. 1 and 2, sam-
ples can be separated into two categories. The first category
includes the unrolled specimens with and without neon pre-
damage. In this case the source of the observed profile is
- - V. . . .
-92-
associated with the oxide surface layer acting as a diffusion
barrier. The second case is for the fracture surfaces and the
cold rolled specimens. In these cases there is a significant
introduction of strong traps near the surface but extending
interior to the oxide layer. The two cases are discussed
separately below.
In the first approximation we can consider the oxide
layer formed at the surface of the unrolled and neon pre-
damaged specimens as a barrier for the outdiffusing deuterium.
The initial distribution of the deuterium just after the implan-
tation can be represented by:
(xDx ) 6 (p(x,t= 0) lim exp ((x-x ()"r t 0 / 4 D t
The increase in the local trapping at the projected range in
the neon predamaged specimens would lower the total flux of
the diffusing deuterium towards the surface. In further steps
we will ignore this local trapping in order to simplify
general form of the solution.
We seek solution to the Fick's equation
2
(x,t) = -D - 2_P (2)
with the initial condition (1) and a reflecting barrier at
x = 0:
A.. .....................................
-93-
aQ(~t (3)~x=0
It is customary to dispose of the cumbersome boundary pro-
blem by introducing "mirror image" of the initial distribu-
tion. This yields as a solution the sum of two Gaussians:
p(x,t) 1 {exp( (x-xo) 2(x 4Dt2 (4)Dt t 4Dt + exp 4Dt
which satisfies boundary condition (3). In the region signifi-
cant for us x>0, p(x,t) evolves with time in a manner shown
in Fig. 3. The solution for time t4 is what we observed for
near surface behavior of the unrolled and neon predamaged
specimens first day after the implantation. The second day
after the deuterium implantation no traces of deuterium were
detected in inrolled and neon predamaged surfaces. Therefore
we presume that near surface traps in these specimens must be
almost uniformly distributed, reversible and very weak allowing
fast diffusion of implanted deuterium within the specimen.
Furthermore, the thin oxide formed at these surfaces is a
strong barrier for the outdiffusing deuterium.
In the second case as the deuterium diffuses towards the
surface in the cold rolled and fatigued specimens it gets trapped
in the high binding energy traps extending their presence much
deeper than just the oxide layer. Therefore the preceding
II
7FA06AD2 526 TEXAS UNIY AT AUSTIN F/0 11/6THE INFLUENCE OF HOLD TIMES ON FATIGUE CRACK GROWTH OF ALUINU-ETC(U)FEB 80 N L MARCUS AFOSR-76-2955
UNCLASSIFIED AFOSR-TR-80-0233 NL
2 * f l f l f l f f l f l f f l 7N
-94-
analysis will no longer predict the diffusion profile but
a more complex analysis including the nonuniform distribu-
tion of traps must be used.
Traces of implanted deuterium were observed in the cold
rolled specimens up to the fifth day after implantation took
place. Afterwards, up to the 14th day, only fatigue frac-
tured specimens showed remaining concentrations of deuterium.
Previously discussed strong traps present in the surfaces of
these two specimens are responsible for such a long lasting
presence of the implanted deuterium. Deuterium profiles
obtained with SIMS have been shown [8) for the segment of spec-
11 imen fatigue fractured in a deuteriunated water vapor environ-
ment. In this case, dissociated deuterium entered into the
bulk of the material through the free metal surface exposed
during the fatigue process. Deuterium gets trapped in a num-
ber of high energy trapping sites created during the fatigue
fracture process. The immediate formation of the oxide layer
slows down the back transport of the deuteriu to the surface
where evaporation takes place. Deuterium concentration pro-
files obtained from these specimens and fatigue fractured
implanted specimens showed detailed similarities. Both show
a high concentration of deuterium at the surfaces and a signi-
ficant concentration level of deuterium extending into the
material much deeper than the observed oxide layers.
*" This observation suggests that the final distribution of
deuterium in the specimens fatigue fractured in the D20

-95-
. environment and ion implanted fatigue fractured surfaces
strongly depends on trapping sites formed in the fatigue
process.
The oxide-metal interface seems to play another impor-
tant role for deuterium trapping which is especially pro-
nounced for the fatigue fractured specimens of the 7075-T6
alloy. Fig. 4 shows the correlation between oxygen sputtering
profile obtained using AES parallel to deuterium profile
utilized from SIMS. At the oxide metal interface a signifi-
cant buildup of deuterium ions was observed suggesting again
an oxide to be a barrier and a oxide-metal interface serving
as a strong trap.
Conclusions
1. Large amounts of strong deuterium trapping sites close
to the surface are created during the deformation associated
with fatigue crack propagation process in aluminum alloys.
2. Deuterium profiles of D20 vapor fatigue fractured specimens
were closely duplicated by trapping inversion experiment.
Strong dependence of deuterium distribution with the pres-
ence of trapping sites created during the fatigue fracture
process was observed.
3. Surface oxides and the oxide-metal interface trap deuterium
slowing down the transport to the surface where evaporation
takes place.

-96-
4. High energy neon radiation induced damage produces weak
trapping sites for deuterium.
Acknowledgements
This research was sponsored by AFOSR grant number 76-
2955. Discussions with Dr. W.H. Zurek, Dr. R.M. Walser and
Dr. J.P. Stark are greatly appreciated.
ii

-97-
References
1. J. Albercht, et al: Scripta Met, 1977, vol. 11, p. 893.
2. J. Steven Enochs and Owen F. Devereux: Met. Trans. A,1975, vol. 6A, p. 391.
3. W.L. Morris: Met. Trans. A., 1977, vol. 8A, p. 589.
4. M. Nageswararao and V. Gerold: Met. Trans. A., 1976,vol. 7A, p. 1847.
5. J.D. Frandsen and H.L. Marcus: Proc. of an InternationalConference - AIME, Moram, Wyoming, pp. 233-249, 1975.
6. H.H. Johnson: Hydrogen in Metals, ASM: Metals Park, Ohio,pp. 35-49, 1974.
7. M.O. Speidel: Proc. of an International Conference - AIMEChampion, PA, pp. 249-277, 1973.
8. A.K. Zurek and H.L. Marcus: Proc. of an InternationalConference, Stanford, CA, pp. 163-166, 1979.
9. J. Volkl and G. Alefeld, Hydrogen in Metals I, pp. 321-348,Springer-Verlag, 1978.
10. J.K. Tien, et al: Proc. of an International Conference-AIMEMoram, Wyoming, pp. 309-321, 1975.
11. J.K. Tien et al: Scripta Met, vol. 9, p. 1097, 1975.
12. G.M. Pressouyre and I.M. Bernstein: Met. Trans. A., vol.9A, p. 1571, 1978.
13. Ch. A. Wert: Hydrogen in Metals II, pp. 305-330, Springer-Verlag, 1978.
14. W.M. Robertson: Met. Trans. A., vol. 10A, p. 489, 1979.
15. Y.P. Bugeat et a1: Physics Letters, vol. 58A, p. 127, 1976.
16. M. Wiedrsick and P.R. Okonato: Interfacial Segregation,pp. 405-432, ASM: Metals Park, OH, 1977.
17. Ming L. Yu: Nuclear Instruments and Methods, 1978.
18. Anton J. West and MacIntyre R. Louthan, Jr.: Met. Trans.A., vol. 10A, p. 1723, 1979.
19. G.M. Pressouyre and I.M. Bernstein: Acta Met., vol.27,p. 89, 1979.

-98-
14
0 E-4 4
rvri
4J
0 ri4 O
0rd
0)41
o 0 0 0 0 H
o co
..G JO SNOIILV~aoNoo aAIJN'UUg
aim,

-99-
4 r4
0 E-4 4011 4 44
r- *,i
.4.i$4 9
0- 0 11 0E~J~X ~ 0~ S.4-E-4
H>1
r-4-4
E-44o~- o 0ro) Is 5 3
ri $ 9r,4... Ur- WO WNIVL~'O aAI Lv'Ia0
41 (

4
0 0-40
4W'* 4
00r
U.r
444

44'U) -101-
AIJE
-11 -r4 r-4 I
4) -4 4) 44
0) (%0 4J * t0
It 4L n r4) 4 I
o ~co
E- 0
40 *
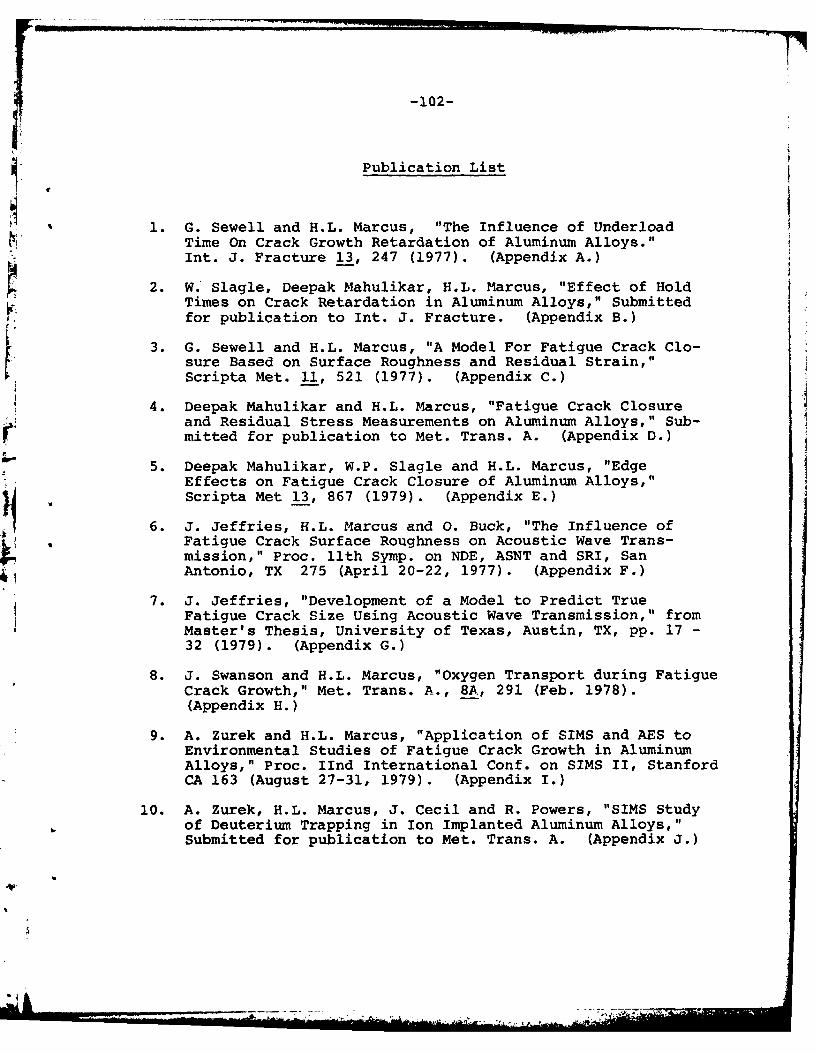
I I I I J I I t _ II I I I II I I I I I I + .. .. . .[+ -T..... .. _....
-102-
Publication List
1. G. Sewell and H.L. Marcus, "The Influence of UnderloadTime On Crack Growth Retardation of Aluminum Alloys."Int. J. Fracture 13, 247 (1977). (Appendix A.)
2. W. Slagle, Deepak Mahulikar, H.L. Marcus, "Effect of HoldTimes on Crack Retardation in Aluminum Alloys," Submittedfor publication to Int. J. Fracture. (Appendix B.)
3. G. Sewell and H.L. Marcus, "A Model For Fatigue Crack Clo-sure Based on Surface Roughness and Residual Strain,"Scripta Met. 11, 521 (1977). (Appendix C.)
4. Deepak Mahulikar and H.L. Marcus, "Fatigue Crack Closureand Residual Stress Measurements on Aluminum Alloys," Sub-mitted for publication to Met. Trans. A. (Appendix D.)
5. Deepak Mahulikar, W.P. Slagle and H.L. Marcus, "EdgeEffects on Fatigue Crack Closure of Aluminum Alloys,"Scripta Met 13, 867 (1979). (Appendix E.)
6. J. Jeffries, H.L. Marcus and 0. Buck, "The Influence ofFatigue Crack Surface Roughness on Acoustic Wave Trans-mission," Proc. llth Symp. on NDE, ASNT and SRI, SanAntonio, TX 275 (April 20-22, 1977). (Appendix F.)
7. J. Jeffries, "Development of a Model to Predict TrueFatigue Crack Size Using Acoustic Wave Transmission," fromMaster's Thesis, University of Texas, Austin, TX, pp. 17 -32 (1979). (Appendix G.)
8. J. Swanson and H.L. Marcus, "Oxygen Transport during FatigueCrack Growth," Met. Trans. A., 8A, 291 (Feb. 1978).(Appendix H.)
9. A. Zurek and H.L. Marcus, "Application of SIMS and AES toEnvironmental Studies of Fatigue Crack Growth in AluminumAlloys," Proc. IInd International Conf. on SIMS II, StanfordCA 163 (August 27-31, 1979). (Appendix I.)
10. A. Zurek, H.L. Marcus, J. Cecil and R. Powers, "SIMS Studyof Deuterium Trapping in Ion Implanted Aluminum Alloys,"Submitted for publication to Met. Trans. A. (Appendix J.)
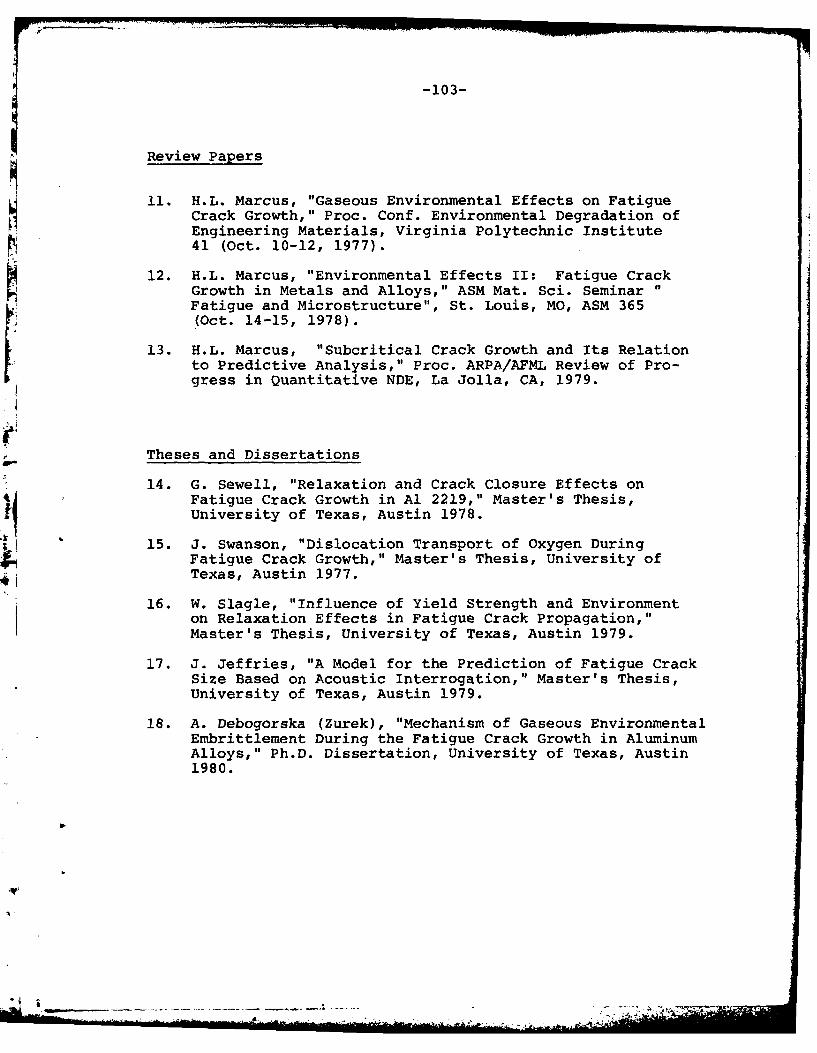
-103-
Review Papers
11. H.L. Marcus, "Gaseous Environmental Effects on FatigueCrack Growth," Proc. Conf. Environmental Degradation ofEngineering Materials, Virginia Polytechnic Institute41 (Oct. 10-12, 1977).
12. H.L. Marcus, "Environmental Effects II: Fatigue CrackGrowth in Metals and Alloys," ASM Mat. Sci. Seminar "Fatigue and Microstructure", St. Louis, MO, ASM 365(Oct. 14-15, 1978).
13. H.L. Marcus, "Subcritical Crack Growth and Its Relationto Predictive Analysis," Proc. ARPA/AFML Review of Pro-gress in Quantitative NDE, La Jolla, CA, 1979.
Theses and Dissertations
14. G. Sewell, "Relaxation and Crack Closure Effects onFatigue Crack Growth in Al 2219," Master's Thesis,University of Texas, Austin 1978.
15. J. Swanson, "Dislocation Transport of Oxygen DuringFatigue Crack Growth," Master's Thesis, University ofTexas, Austin 1977.
16. W. Slagle, "Influence of Yield Strength and Environmenton Relaxation Effects in Fatigue Crack Propagation,"Master's Thesis, University of Texas, Austin 1979.
17. J. Jeffries, "A Model for the Prediction of Fatigue CrackSize Based on Acoustic Interrogation," Master's Thesis,University of Texas, Austin 1979.
18. A. Debogorska (Zurek), "Mechanism of Gaseous EnvironmentalEmbrittlement During the Fatigue Crack Growth in AluminumAlloys," Ph.D. Dissertation, University of Texas, Austin1980.
II