uv measurement basics - uv-technik
TRANSCRIPT
Page 1/18 uv measurement basics - E v2.1.0.docx, AR, 2020-08-21
Änderungen vorbehalten / All data are subject to alteration.
Information Sheet
Dipl.-Ing. Andreas Renzel
UV Measurement Basics of UV measurement and solutions for UV curing applications
Contents:
1 Introduction …………………………………………….…………………………………………….………..… 1 2 The electromagnetic spectrum …….…….……………………………..…………………..…….……….… 2 3 Radiation sources for UV curing applications and their spectra ……..…….……..………………….. 3 4 Radiometric measured quantities ….……………….……………………………….………………….…… 3 5 Radiation sensors for measuring UV radiation …..…………………………………..……………………. 5
5.1 Directional dependence of the sensor response.……………………………………..………….……… 5
5.2 Temporal behaviour – Sampling rate ……………………….………………………………….........….. 5
5.3 Wavelength-specific sensitivity ……………..……………..…………………………………………..… 6
6 Intensity meters and dosimeters …..………………………………………………………….…………… 6
6.1 Wavelength sensitivity ….………….……………………………………..……………………..……… 6
6.2 UV measuring equipment in practice………………….…………………………………..................….... 8
6.2.1 UV integrators ……………………………………………………………………………………… 9
6.2.2 UV spectrometers …………………………………………………………………………………. 11
6.2.3 UV measuring instrument for UV intensity short-term measurements………….…………….. 12
6.2.4 UV online measuring instrument QSO 3 ……………...………………………………………….. 13
6.2.5 UV online measuring instrument QWO ……………………………………………………………. 14
6.2.6 Customer-specific solutions ………..…………………………………………………………...… 15
6.2.7 UV measuring strips Test UV strip ……………………………………………………………….. 16
7 Calibration of UV measuring equipment ………………………………………………………………….... 17 1. Introduction As a user of UV curing systems, you wonder about the quality of the UV irradiation and, consequently, about the quality of the curing of the ink or varnish. This issue consists of two different questions: on the one hand, the question regarding the “required UV power”, and, on the other hand, the question concerning the result of the application of the UV power, i.e. the curing based on the UV power. Therefore, in practice, many customers proceed as follows. They restrict themselves to testing the result, i.e. the more or less cured ink (or varnish), by applying various methods (cross-cut test, tape test, FINAT test methods, etc.). However, it makes more sense to measure the amount of UV that reaches the substrate. This means carrying out a quantitative measurement before the ink or varnish has been cured in order to avoid production rejects. There is a trend showing that users increasingly focus on the measurement of UV. It is simply too costly to produce rejects. Apart from that, quality management systems require that processes be documented. Those who are deeply involved in UV measurement technology often notice that measuring equipment made by different manufacturers provide different measurement results. What is the reason for this? This is the question that is explored more thoroughly in the following sections. I will explain some basics of physics. Furthermore, I will show some solutions regarding the use of UV measurement tasks in practice.
Page 2/18 uv measurement basics - E v2.1.0.docx, AR, 2020-08-21
Änderungen vorbehalten / All data are subject to alteration.
Information Sheet
2. The electromagnetic spectrum As we all know, the light of the sun contains the entire colour spectrum, from short-wave violet (wavelength = 400 nm) to long-wave red (700 nm). Therefore, sunlight is also called white light. However, this range only represents part of the electromagnetic spectrum. Apart from the solar spectrum, there is even longer-wave radiation, the so-called infrared
radiation (IR, > 400 nm), and shorter-wave radiation, the ultraviolet spectrum (UV,
> 400 nm). Infrared is known to us as heat radiation, and anybody who has ever been sunburnt knows what UV radiation is. The individual wavelength ranges are defined as follows according to CIE [1]:
UV-C = 200 to 280 (100 to 200 nm vacuum UV) (200 to 280 nm far UV) UV-B = 280 to 315 nm UV-A = 315 to 400 nm UV-VIS = 400 to 450 nm (frequently indicated from 395 to 445 nm) Light (VIS) = 400 to 780 nm
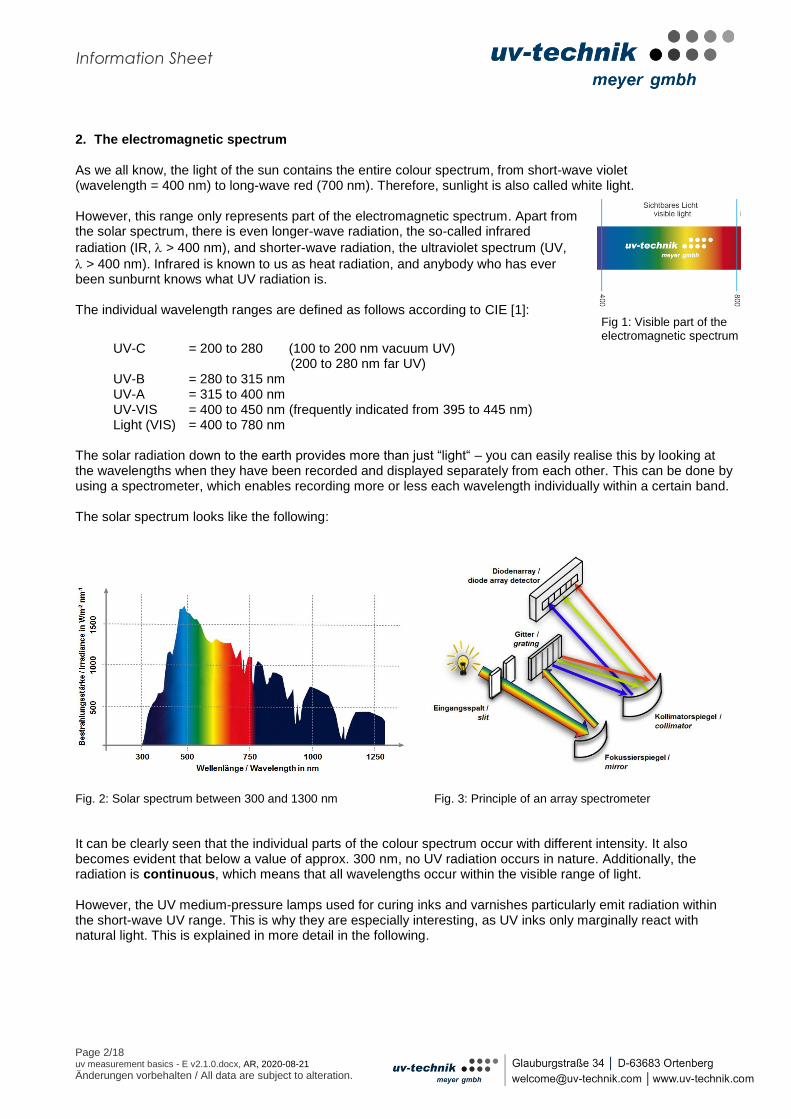
The solar radiation down to the earth provides more than just “light“ – you can easily realise this by looking at the wavelengths when they have been recorded and displayed separately from each other. This can be done by using a spectrometer, which enables recording more or less each wavelength individually within a certain band. The solar spectrum looks like the following:
Fig. 2: Solar spectrum between 300 and 1300 nm Fig. 3: Principle of an array spectrometer
It can be clearly seen that the individual parts of the colour spectrum occur with different intensity. It also becomes evident that below a value of approx. 300 nm, no UV radiation occurs in nature. Additionally, the radiation is continuous, which means that all wavelengths occur within the visible range of light. However, the UV medium-pressure lamps used for curing inks and varnishes particularly emit radiation within the short-wave UV range. This is why they are especially interesting, as UV inks only marginally react with natural light. This is explained in more detail in the following.
Fig 1: Visible part of the electromagnetic spectrum
Page 3/18 uv measurement basics - E v2.1.0.docx, AR, 2020-08-21
Änderungen vorbehalten / All data are subject to alteration.
Information Sheet
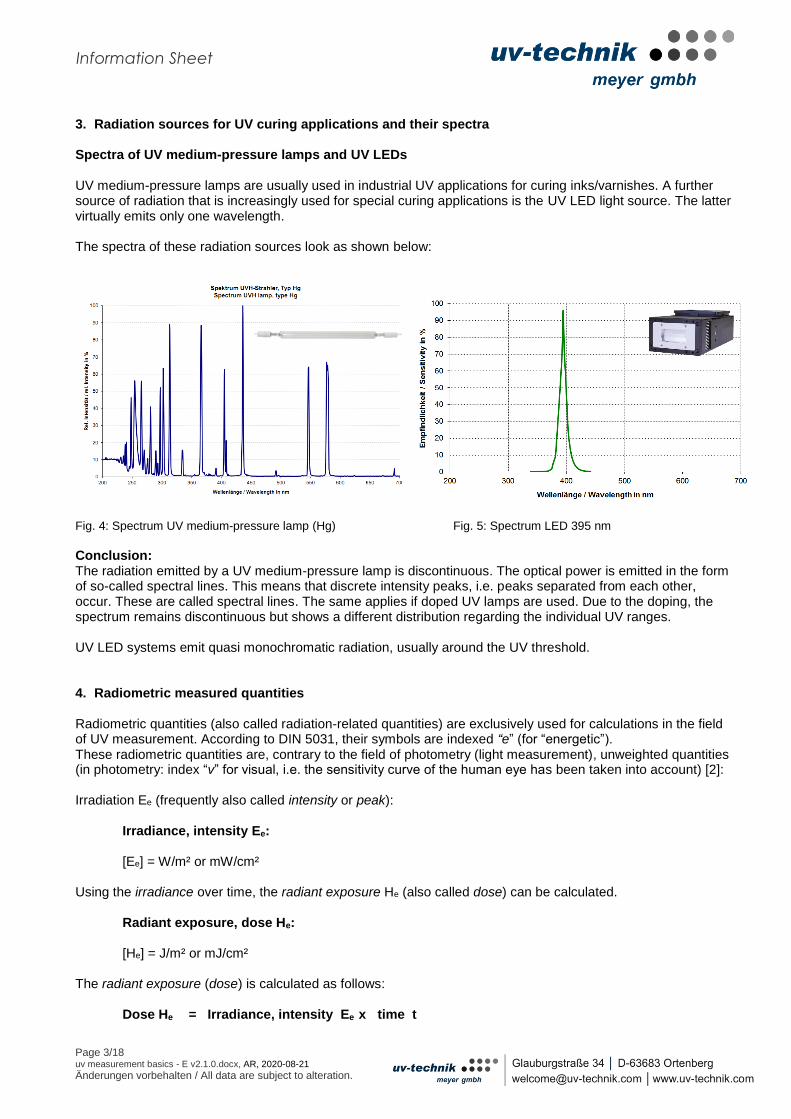
3. Radiation sources for UV curing applications and their spectra Spectra of UV medium-pressure lamps and UV LEDs UV medium-pressure lamps are usually used in industrial UV applications for curing inks/varnishes. A further source of radiation that is increasingly used for special curing applications is the UV LED light source. The latter virtually emits only one wavelength. The spectra of these radiation sources look as shown below:
Fig. 4: Spectrum UV medium-pressure lamp (Hg) Fig. 5: Spectrum LED 395 nm
Conclusion: The radiation emitted by a UV medium-pressure lamp is discontinuous. The optical power is emitted in the form of so-called spectral lines. This means that discrete intensity peaks, i.e. peaks separated from each other, occur. These are called spectral lines. The same applies if doped UV lamps are used. Due to the doping, the spectrum remains discontinuous but shows a different distribution regarding the individual UV ranges. UV LED systems emit quasi monochromatic radiation, usually around the UV threshold. 4. Radiometric measured quantities Radiometric quantities (also called radiation-related quantities) are exclusively used for calculations in the field of UV measurement. According to DIN 5031, their symbols are indexed “e” (for “energetic”). These radiometric quantities are, contrary to the field of photometry (light measurement), unweighted quantities (in photometry: index “v” for visual, i.e. the sensitivity curve of the human eye has been taken into account) [2]: Irradiation Ee (frequently also called intensity or peak):
Irradiance, intensity Ee:
[Ee] = W/m² or mW/cm² Using the irradiance over time, the radiant exposure He (also called dose) can be calculated.
Radiant exposure, dose He:
[He] = J/m² or mJ/cm² The radiant exposure (dose) is calculated as follows:
Dose He = Irradiance, intensity Ee x time t
Page 4/18 uv measurement basics - E v2.1.0.docx, AR, 2020-08-21
Änderungen vorbehalten / All data are subject to alteration.
Information Sheet
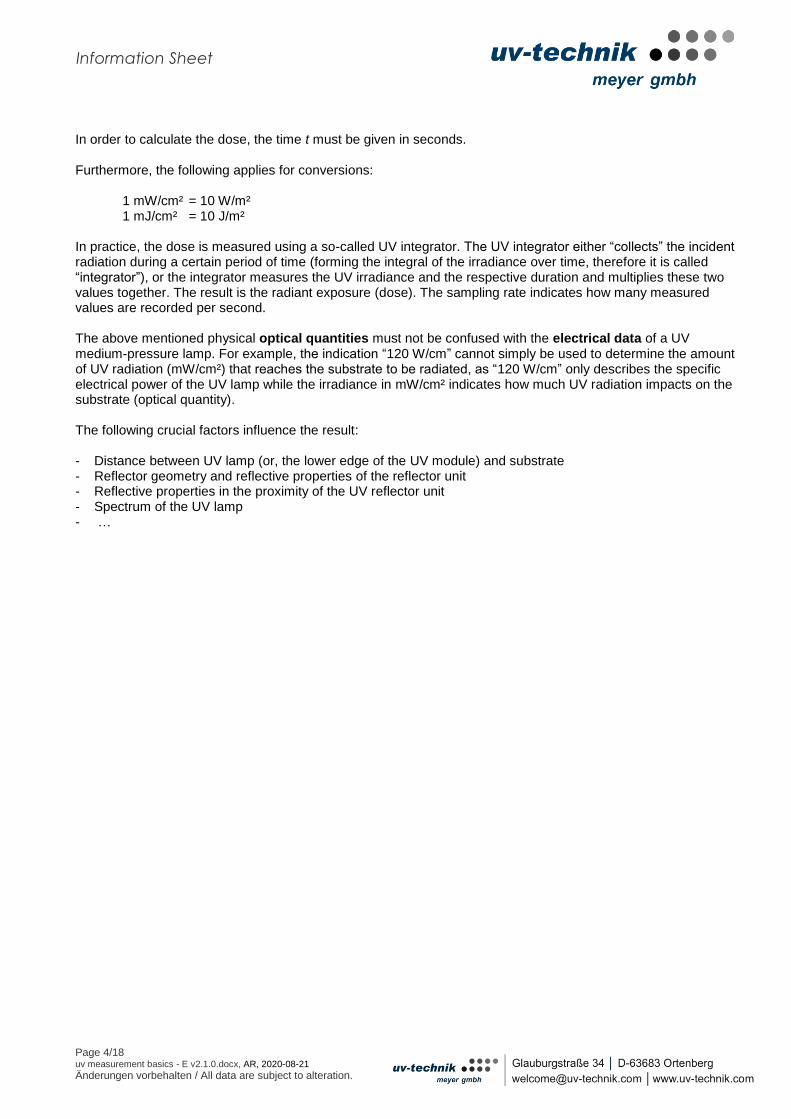
In order to calculate the dose, the time t must be given in seconds. Furthermore, the following applies for conversions:
1 mW/cm² = 10 W/m² 1 mJ/cm² = 10 J/m²
In practice, the dose is measured using a so-called UV integrator. The UV integrator either “collects” the incident radiation during a certain period of time (forming the integral of the irradiance over time, therefore it is called “integrator”), or the integrator measures the UV irradiance and the respective duration and multiplies these two values together. The result is the radiant exposure (dose). The sampling rate indicates how many measured values are recorded per second. The above mentioned physical optical quantities must not be confused with the electrical data of a UV medium-pressure lamp. For example, the indication “120 W/cm” cannot simply be used to determine the amount of UV radiation (mW/cm²) that reaches the substrate to be radiated, as “120 W/cm” only describes the specific electrical power of the UV lamp while the irradiance in mW/cm² indicates how much UV radiation impacts on the substrate (optical quantity). The following crucial factors influence the result: - Distance between UV lamp (or, the lower edge of the UV module) and substrate - Reflector geometry and reflective properties of the reflector unit - Reflective properties in the proximity of the UV reflector unit - Spectrum of the UV lamp - …
Page 5/18 uv measurement basics - E v2.1.0.docx, AR, 2020-08-21
Änderungen vorbehalten / All data are subject to alteration.
Information Sheet
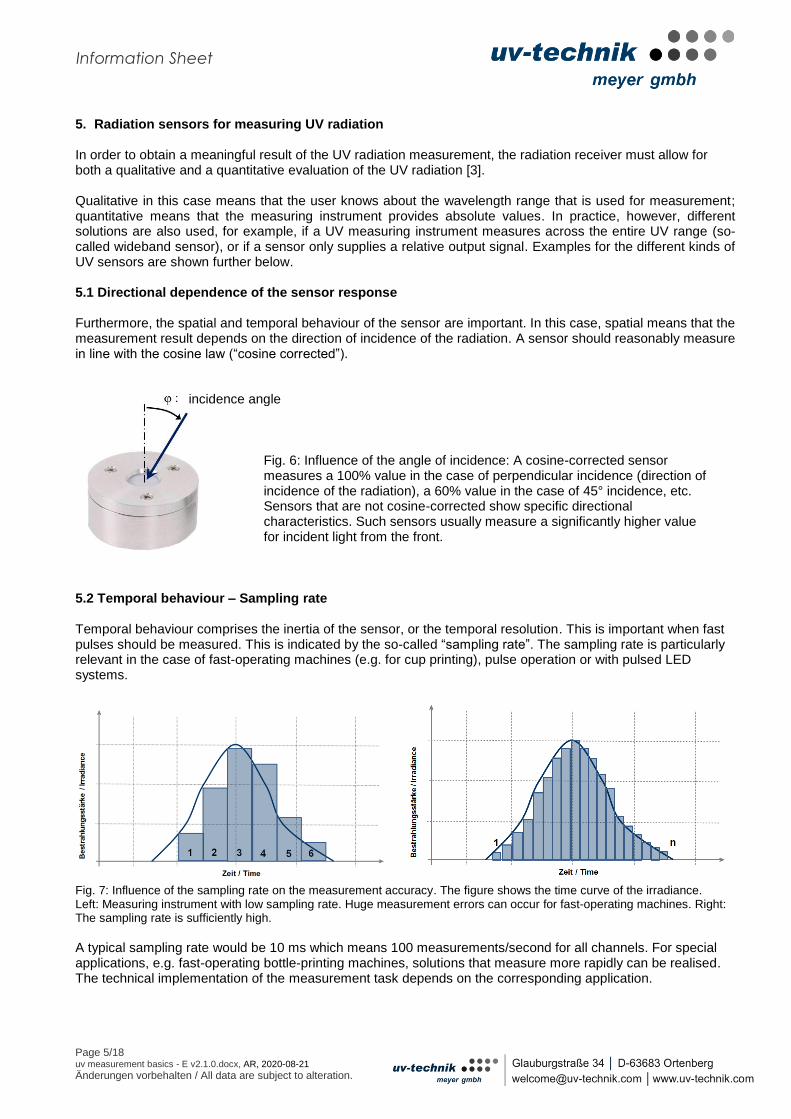
5. Radiation sensors for measuring UV radiation In order to obtain a meaningful result of the UV radiation measurement, the radiation receiver must allow for both a qualitative and a quantitative evaluation of the UV radiation [3]. Qualitative in this case means that the user knows about the wavelength range that is used for measurement; quantitative means that the measuring instrument provides absolute values. In practice, however, different solutions are also used, for example, if a UV measuring instrument measures across the entire UV range (so-called wideband sensor), or if a sensor only supplies a relative output signal. Examples for the different kinds of UV sensors are shown further below. 5.1 Directional dependence of the sensor response Furthermore, the spatial and temporal behaviour of the sensor are important. In this case, spatial means that the measurement result depends on the direction of incidence of the radiation. A sensor should reasonably measure in line with the cosine law (“cosine corrected”).
5.2 Temporal behaviour – Sampling rate Temporal behaviour comprises the inertia of the sensor, or the temporal resolution. This is important when fast pulses should be measured. This is indicated by the so-called “sampling rate”. The sampling rate is particularly relevant in the case of fast-operating machines (e.g. for cup printing), pulse operation or with pulsed LED systems.
Fig. 7: Influence of the sampling rate on the measurement accuracy. The figure shows the time curve of the irradiance. Left: Measuring instrument with low sampling rate. Huge measurement errors can occur for fast-operating machines. Right: The sampling rate is sufficiently high. A typical sampling rate would be 10 ms which means 100 measurements/second for all channels. For special applications, e.g. fast-operating bottle-printing machines, solutions that measure more rapidly can be realised. The technical implementation of the measurement task depends on the corresponding application.
Fig. 6: Influence of the angle of incidence: A cosine-corrected sensor measures a 100% value in the case of perpendicular incidence (direction of incidence of the radiation), a 60% value in the case of 45° incidence, etc. Sensors that are not cosine-corrected show specific directional characteristics. Such sensors usually measure a significantly higher value for incident light from the front.
incidence angle
Page 6/18 uv measurement basics - E v2.1.0.docx, AR, 2020-08-21
Änderungen vorbehalten / All data are subject to alteration.
Information Sheet
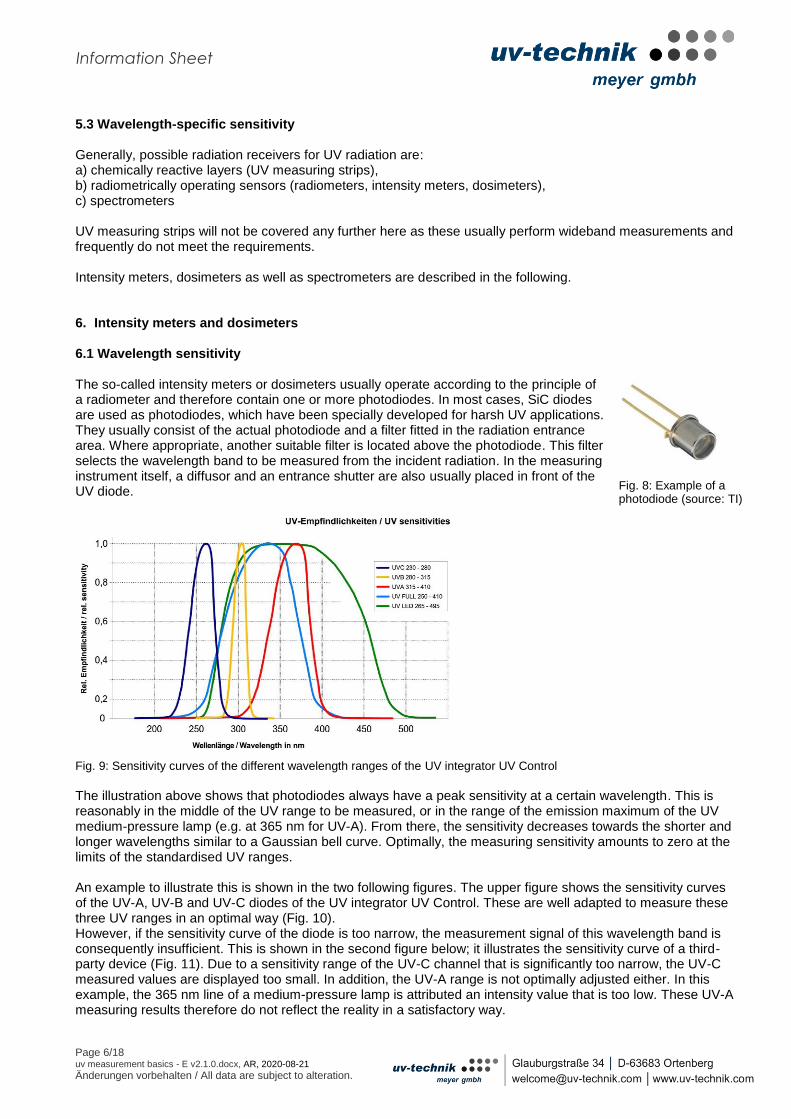
5.3 Wavelength-specific sensitivity Generally, possible radiation receivers for UV radiation are: a) chemically reactive layers (UV measuring strips), b) radiometrically operating sensors (radiometers, intensity meters, dosimeters), c) spectrometers UV measuring strips will not be covered any further here as these usually perform wideband measurements and frequently do not meet the requirements. Intensity meters, dosimeters as well as spectrometers are described in the following. 6. Intensity meters and dosimeters 6.1 Wavelength sensitivity The so-called intensity meters or dosimeters usually operate according to the principle of a radiometer and therefore contain one or more photodiodes. In most cases, SiC diodes are used as photodiodes, which have been specially developed for harsh UV applications. They usually consist of the actual photodiode and a filter fitted in the radiation entrance area. Where appropriate, another suitable filter is located above the photodiode. This filter selects the wavelength band to be measured from the incident radiation. In the measuring instrument itself, a diffusor and an entrance shutter are also usually placed in front of the UV diode.
Fig. 9: Sensitivity curves of the different wavelength ranges of the UV integrator UV Control
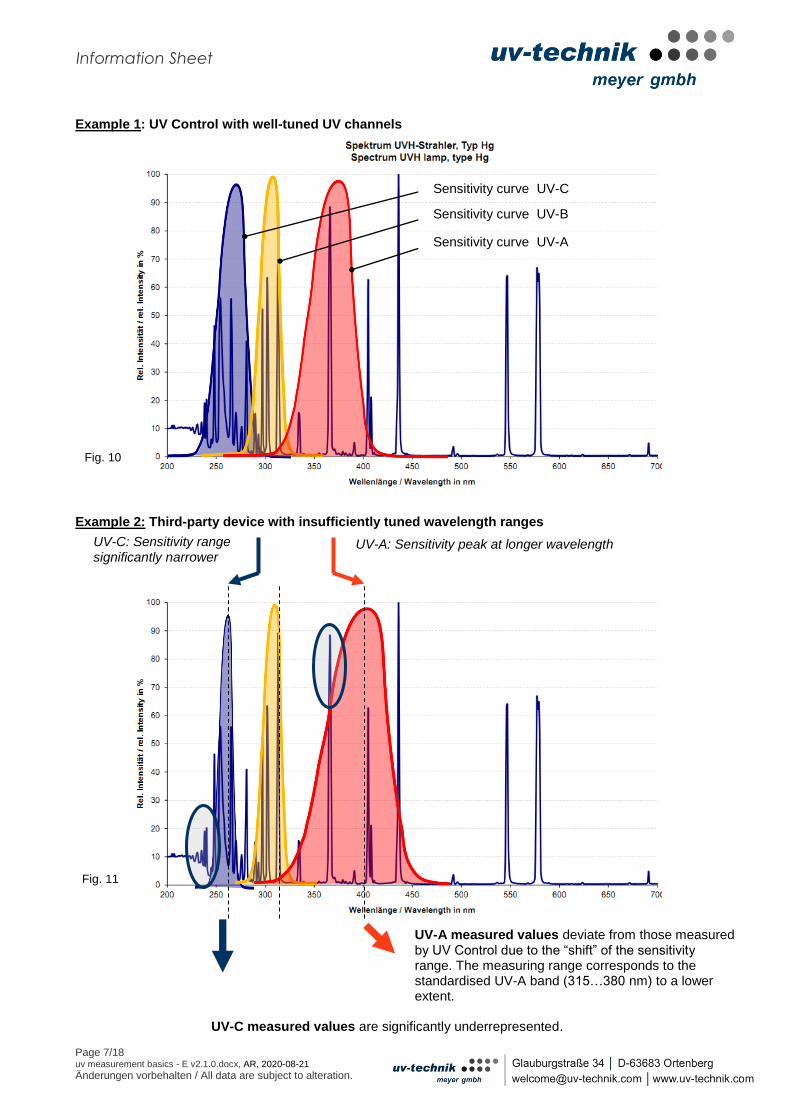
The illustration above shows that photodiodes always have a peak sensitivity at a certain wavelength. This is reasonably in the middle of the UV range to be measured, or in the range of the emission maximum of the UV medium-pressure lamp (e.g. at 365 nm for UV-A). From there, the sensitivity decreases towards the shorter and longer wavelengths similar to a Gaussian bell curve. Optimally, the measuring sensitivity amounts to zero at the limits of the standardised UV ranges. An example to illustrate this is shown in the two following figures. The upper figure shows the sensitivity curves of the UV-A, UV-B and UV-C diodes of the UV integrator UV Control. These are well adapted to measure these three UV ranges in an optimal way (Fig. 10). However, if the sensitivity curve of the diode is too narrow, the measurement signal of this wavelength band is consequently insufficient. This is shown in the second figure below; it illustrates the sensitivity curve of a third-party device (Fig. 11). Due to a sensitivity range of the UV-C channel that is significantly too narrow, the UV-C measured values are displayed too small. In addition, the UV-A range is not optimally adjusted either. In this example, the 365 nm line of a medium-pressure lamp is attributed an intensity value that is too low. These UV-A measuring results therefore do not reflect the reality in a satisfactory way.
Fig. 8: Example of a photodiode (source: TI)
Page 7/18 uv measurement basics - E v2.1.0.docx, AR, 2020-08-21
Änderungen vorbehalten / All data are subject to alteration.
Information Sheet
Example 1: UV Control with well-tuned UV channels Example 2: Third-party device with insufficiently tuned wavelength ranges
UV-A measured values deviate from those measured by UV Control due to the “shift” of the sensitivity range. The measuring range corresponds to the standardised UV-A band (315…380 nm) to a lower extent.
UV-C measured values are significantly underrepresented.
Sensitivity curve UV-A
Sensitivity curve UV-B
Sensitivity curve UV-C
UV-A: Sensitivity peak at longer wavelength
UV-C: Sensitivity range significantly narrower
Fig. 10
Fig. 11
Page 8/18 uv measurement basics - E v2.1.0.docx, AR, 2020-08-21
Änderungen vorbehalten / All data are subject to alteration.
Information Sheet
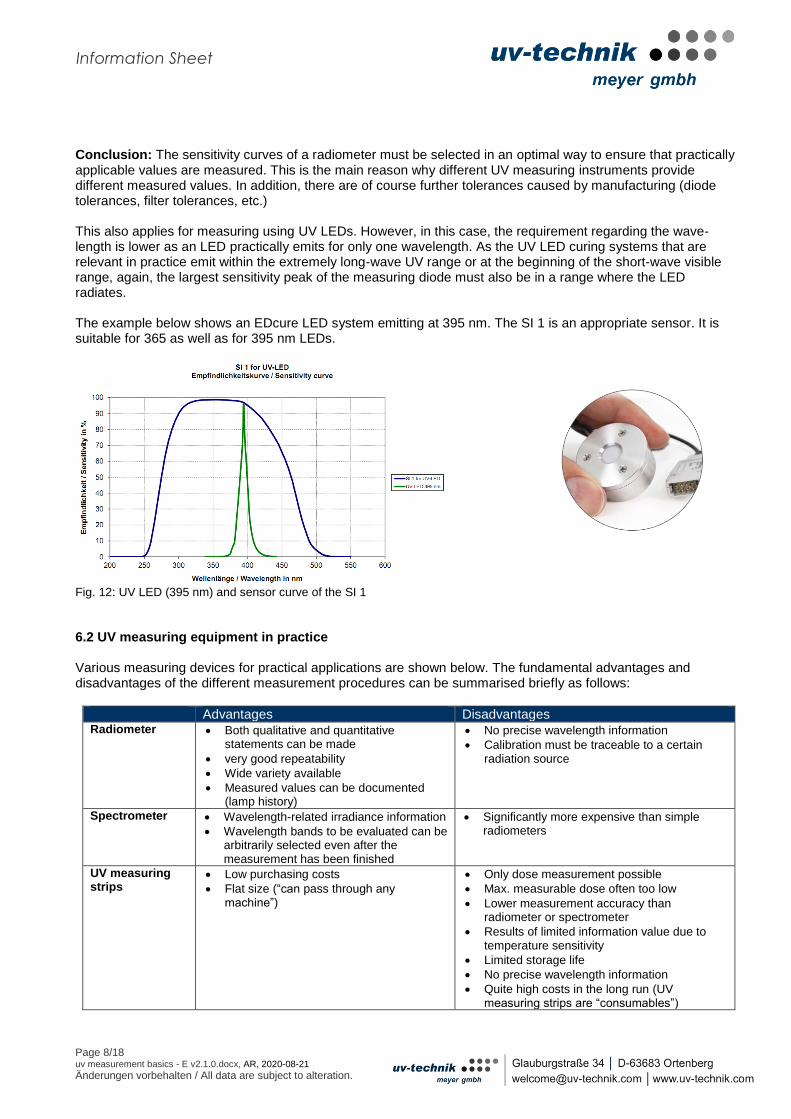
Conclusion: The sensitivity curves of a radiometer must be selected in an optimal way to ensure that practically applicable values are measured. This is the main reason why different UV measuring instruments provide different measured values. In addition, there are of course further tolerances caused by manufacturing (diode tolerances, filter tolerances, etc.) This also applies for measuring using UV LEDs. However, in this case, the requirement regarding the wave-length is lower as an LED practically emits for only one wavelength. As the UV LED curing systems that are relevant in practice emit within the extremely long-wave UV range or at the beginning of the short-wave visible range, again, the largest sensitivity peak of the measuring diode must also be in a range where the LED radiates. The example below shows an EDcure LED system emitting at 395 nm. The SI 1 is an appropriate sensor. It is suitable for 365 as well as for 395 nm LEDs.
Fig. 12: UV LED (395 nm) and sensor curve of the SI 1
6.2 UV measuring equipment in practice Various measuring devices for practical applications are shown below. The fundamental advantages and disadvantages of the different measurement procedures can be summarised briefly as follows:
Advantages Disadvantages Radiometer Both qualitative and quantitative
statements can be made
very good repeatability
Wide variety available
Measured values can be documented (lamp history)
No precise wavelength information
Calibration must be traceable to a certain radiation source
Spectrometer Wavelength-related irradiance information
Wavelength bands to be evaluated can be arbitrarily selected even after the measurement has been finished
Significantly more expensive than simple radiometers
UV measuring strips
Low purchasing costs
Flat size (“can pass through any machine”)
Only dose measurement possible
Max. measurable dose often too low
Lower measurement accuracy than radiometer or spectrometer
Results of limited information value due to temperature sensitivity
Limited storage life
No precise wavelength information
Quite high costs in the long run (UV measuring strips are “consumables”)
Page 9/18 uv measurement basics - E v2.1.0.docx, AR, 2020-08-21
Änderungen vorbehalten / All data are subject to alteration.
Information Sheet
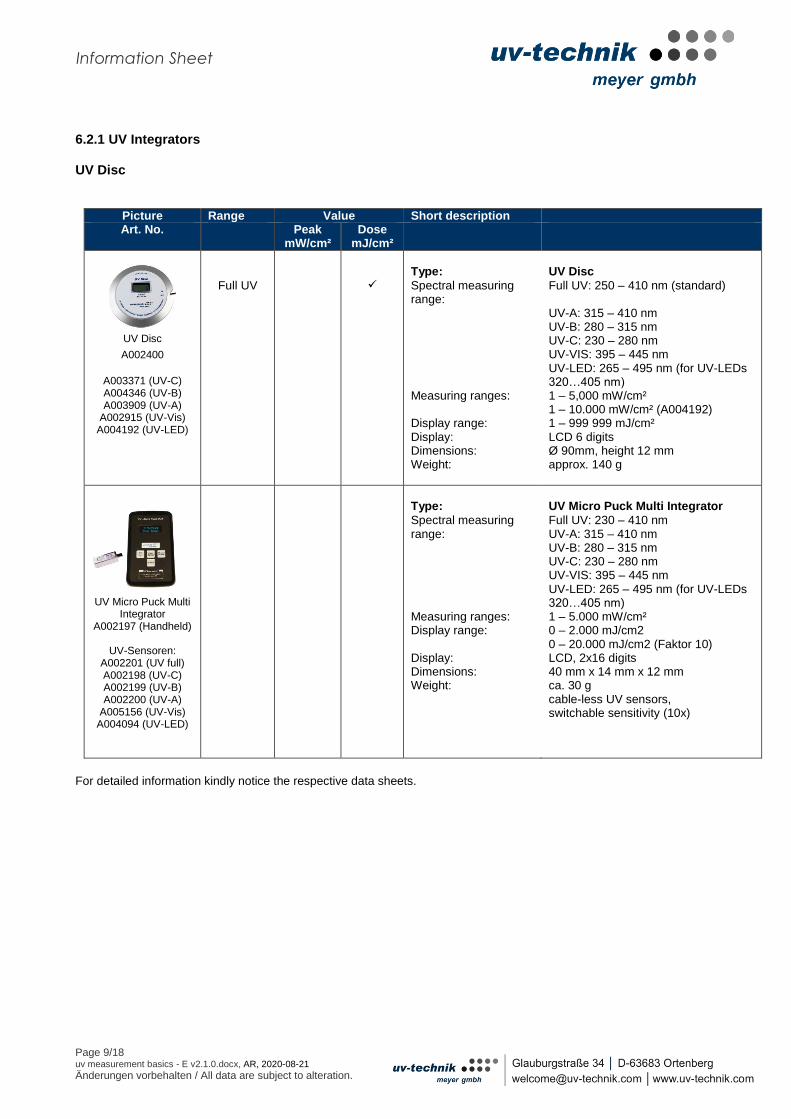
6.2.1 UV Integrators UV Disc
Picture Range Value Short description Art. No. Peak
mW/cm² Dose
mJ/cm²
UV Disc
A002400
A003371 (UV-C) A004346 (UV-B) A003909 (UV-A)
A002915 (UV-Vis) A004192 (UV-LED)
Full UV
Type:
Spectral measuring range: Measuring ranges: Display range: Display: Dimensions: Weight:
UV Disc
Full UV: 250 – 410 nm (standard) UV-A: 315 – 410 nm UV-B: 280 – 315 nm UV-C: 230 – 280 nm UV-VIS: 395 – 445 nm UV-LED: 265 – 495 nm (for UV-LEDs 320…405 nm) 1 – 5,000 mW/cm² 1 – 10.000 mW/cm² (A004192) 1 – 999 999 mJ/cm² LCD 6 digits Ø 90mm, height 12 mm approx. 140 g
UV Micro Puck Multi Integrator
A002197 (Handheld)
UV-Sensoren: A002201 (UV full) A002198 (UV-C) A002199 (UV-B) A002200 (UV-A)
A005156 (UV-Vis) A004094 (UV-LED)
Type:
Spectral measuring range: Measuring ranges: Display range: Display: Dimensions: Weight:
UV Micro Puck Multi Integrator
Full UV: 230 – 410 nm UV-A: 315 – 410 nm UV-B: 280 – 315 nm UV-C: 230 – 280 nm UV-VIS: 395 – 445 nm UV-LED: 265 – 495 nm (for UV-LEDs 320…405 nm) 1 – 5.000 mW/cm² 0 – 2.000 mJ/cm2 0 – 20.000 mJ/cm2 (Faktor 10) LCD, 2x16 digits 40 mm x 14 mm x 12 mm ca. 30 g cable-less UV sensors, switchable sensitivity (10x)
For detailed information kindly notice the respective data sheets.
Page 10/18 uv measurement basics - E v2.1.0.docx, AR, 2020-08-21
Änderungen vorbehalten / All data are subject to alteration.
Information Sheet
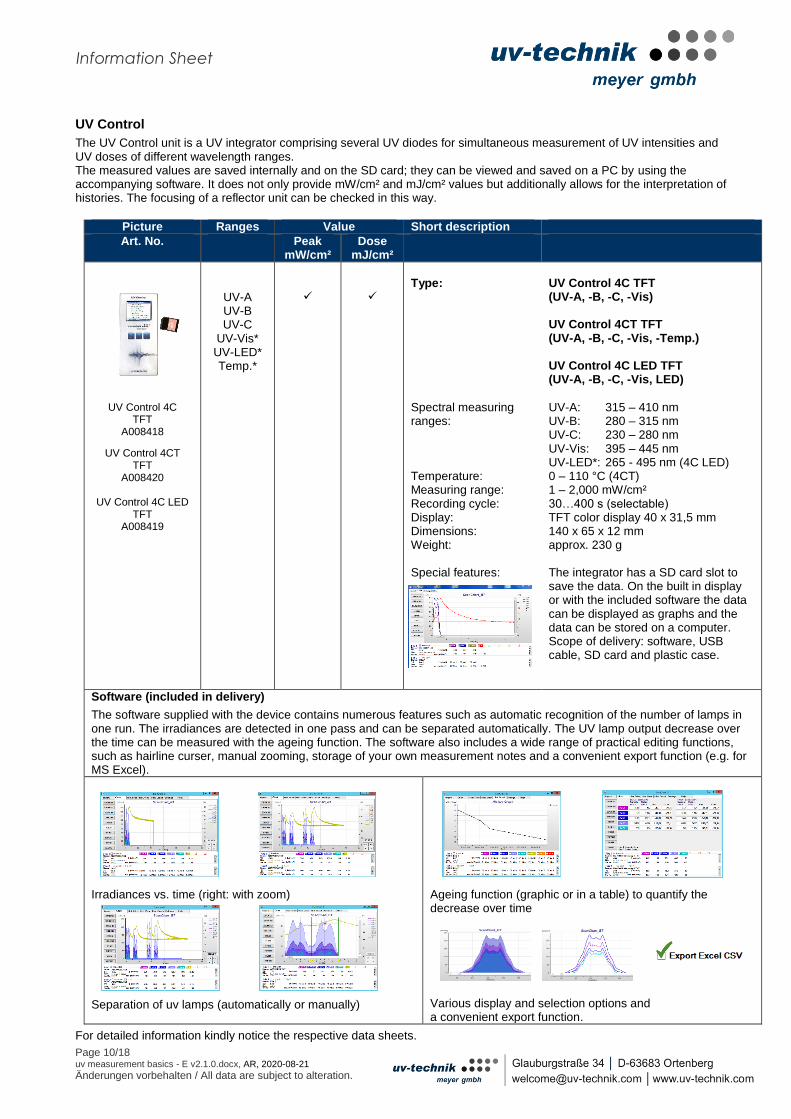
UV Control
The UV Control unit is a UV integrator comprising several UV diodes for simultaneous measurement of UV intensities and UV doses of different wavelength ranges. The measured values are saved internally and on the SD card; they can be viewed and saved on a PC by using the accompanying software. It does not only provide mW/cm² and mJ/cm² values but additionally allows for the interpretation of histories. The focusing of a reflector unit can be checked in this way.
Picture Ranges Value Short description
Art. No. Peak mW/cm²
Dose mJ/cm²
UV Control 4C TFT
A008418
UV Control 4CT TFT
A008420
UV Control 4C LED TFT
A008419
UV-A UV-B UV-C
UV-Vis* UV-LED* Temp.*
Type:
Spectral measuring ranges: Temperature: Measuring range: Recording cycle: Display: Dimensions: Weight: Special features:
UV Control 4C TFT (UV-A, -B, -C, -Vis) UV Control 4CT TFT (UV-A, -B, -C, -Vis, -Temp.) UV Control 4C LED TFT (UV-A, -B, -C, -Vis, LED)
UV-A: 315 – 410 nm UV-B: 280 – 315 nm UV-C: 230 – 280 nm UV-Vis: 395 – 445 nm UV-LED*: 265 - 495 nm (4C LED) 0 – 110 °C (4CT) 1 – 2,000 mW/cm² 30…400 s (selectable) TFT color display 40 x 31,5 mm 140 x 65 x 12 mm approx. 230 g The integrator has a SD card slot to save the data. On the built in display or with the included software the data can be displayed as graphs and the data can be stored on a computer. Scope of delivery: software, USB cable, SD card and plastic case.
Software (included in delivery)
The software supplied with the device contains numerous features such as automatic recognition of the number of lamps in one run. The irradiances are detected in one pass and can be separated automatically. The UV lamp output decrease over the time can be measured with the ageing function. The software also includes a wide range of practical editing functions, such as hairline curser, manual zooming, storage of your own measurement notes and a convenient export function (e.g. for MS Excel).
Irradiances vs. time (right: with zoom)
Separation of uv lamps (automatically or manually)
Ageing function (graphic or in a table) to quantify the decrease over time
Various display and selection options and a convenient export function.
For detailed information kindly notice the respective data sheets.
Page 11/18 uv measurement basics - E v2.1.0.docx, AR, 2020-08-21
Änderungen vorbehalten / All data are subject to alteration.
Information Sheet
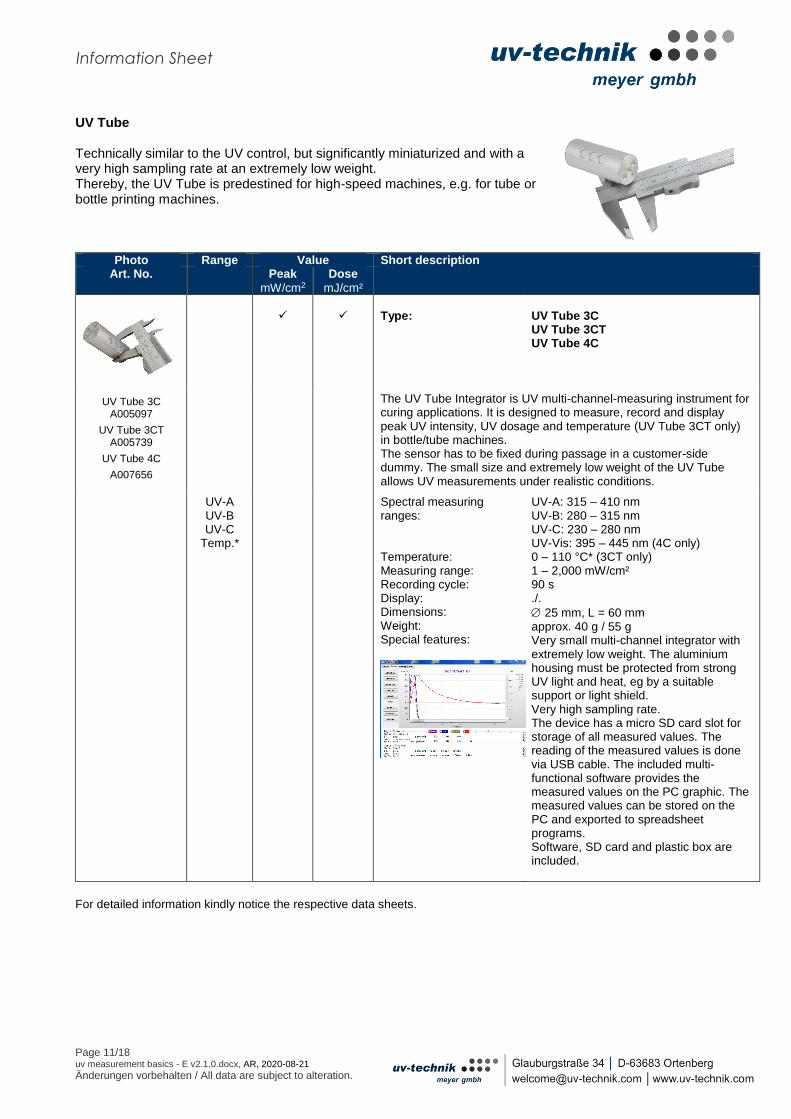
UV Tube Technically similar to the UV control, but significantly miniaturized and with a very high sampling rate at an extremely low weight. Thereby, the UV Tube is predestined for high-speed machines, e.g. for tube or bottle printing machines.
Photo Range Value Short description Art. No. Peak
mW/cm2
Dose
mJ/cm²
Type:
UV Tube 3C UV Tube 3CT UV Tube 4C
UV Tube 3C A005097
UV Tube 3CT A005739
UV Tube 4C
A007656
The UV Tube Integrator is UV multi-channel-measuring instrument for curing applications. It is designed to measure, record and display peak UV intensity, UV dosage and temperature (UV Tube 3CT only) in bottle/tube machines. The sensor has to be fixed during passage in a customer-side dummy. The small size and extremely low weight of the UV Tube allows UV measurements under realistic conditions.
UV-A UV-B UV-C
Temp.*
Spectral measuring ranges: Temperature: Measuring range: Recording cycle: Display: Dimensions: Weight: Special features:
UV-A: 315 – 410 nm UV-B: 280 – 315 nm UV-C: 230 – 280 nm UV-Vis: 395 – 445 nm (4C only) 0 – 110 °C* (3CT only) 1 – 2,000 mW/cm² 90 s ./.
25 mm, L = 60 mm approx. 40 g / 55 g Very small multi-channel integrator with extremely low weight. The aluminium housing must be protected from strong UV light and heat, eg by a suitable support or light shield. Very high sampling rate. The device has a micro SD card slot for storage of all measured values. The reading of the measured values is done via USB cable. The included multi-functional software provides the measured values on the PC graphic. The measured values can be stored on the PC and exported to spreadsheet programs. Software, SD card and plastic box are included.
For detailed information kindly notice the respective data sheets.

Page 12/18 uv measurement basics - E v2.1.0.docx, AR, 2020-08-21
Änderungen vorbehalten / All data are subject to alteration.
Information Sheet
6.2.2 UV spectrometer UV Spectro The UV Spectro operates according to the diode array principle (see fig. 3). Its special feature is the flat design so that it can be used as a “pass-through” unit. Irradiance values between 200 and 440 nm are measured. Thus, both the UV-C band of an Hg medium-pressure lamp as well as the UV-VIS band of Ga-doped UV lamps can be measured correctly. The UV Spectro is also suitable for measuring UV LEDs. It is easy to evaluate the measured values within the usual UV spectral ranges. Weighting functions can optionally be stored. The change in intensity over time is also recorded (as with an integrator). Thus, it is also possible to read out the dose values of the spectral bands.
Photo Ranges Unit Short description Art. No. Peak
mW/cm2
Dose
mJ/cm²
A003650 A003667
A004452 A004453
Spectro-
meter
Type:
UV Spectro
200 – 440
nm The UV Spectro is a flat diode array spectrometer designed as a
pass-through unit. It can therefore be used as a spectrometer for the quantitative and qualitative measurement of the irradiances of the individual wavelengths. As the measuring values are stored internally, the doses can also be calculated. The wavelength ranges can be freely selected, and weighting functions can optionally be stored.
Spectro-meter
200 – 440 nm
with USB interface
Spectral range: Spectral bandwidth: Measurement range: Measurement range: Display range: Display range: Display: Dimensions: Weight: Calibration: Special feature: Type:
Measurement range: Measurement range: Special feature:
200 – 440 nm 2 nm 2 – 5,000 mW/cm² (A003650) 25– 35,000 mW/cm² (A003667) 1 mJ/cm² – 600 J/cm² (A003650) 25 mJ/cm² – 42,000 J/cm² (A003667) LCD 6 digits 160 x 100, height 14.4 mm approx. 375 g Traceable to PTB Both UV medium-pressure lamps and UV LEDs can be measured within the spectral range. One or more effect-related weighting functions or sensitivity curves can be stored. UV Spectro USB
ditto but with USB interface 2 – 5.000 mW/cm² (A004452)
25 – 35.000 mW/cm² (A004453)
50 measurements can be recorded, edited and exported via USB (the software is inclusive).
Page 13/18 uv measurement basics - E v2.1.0.docx, AR, 2020-08-21
Änderungen vorbehalten / All data are subject to alteration.
Information Sheet
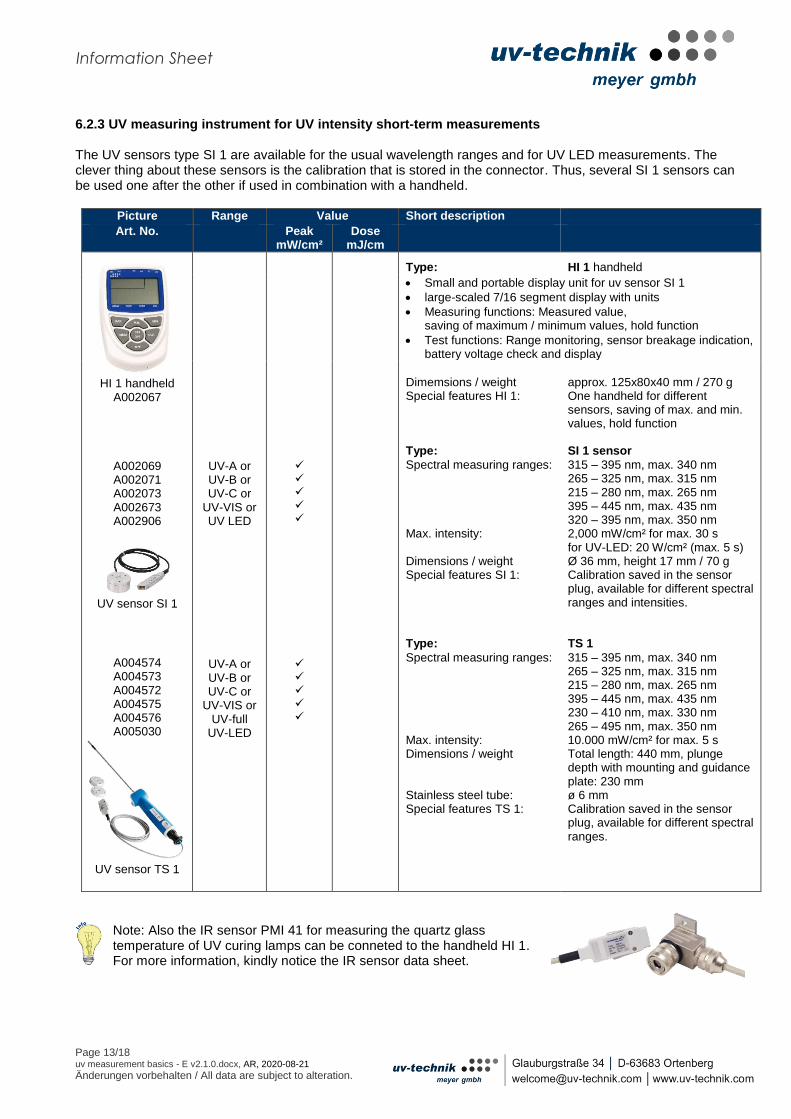
6.2.3 UV measuring instrument for UV intensity short-term measurements The UV sensors type SI 1 are available for the usual wavelength ranges and for UV LED measurements. The clever thing about these sensors is the calibration that is stored in the connector. Thus, several SI 1 sensors can be used one after the other if used in combination with a handheld.
Picture Range Value Short description Art. No. Peak
mW/cm² Dose
mJ/cm
HI 1 handheld A002067
A002069 A002071 A002073 A002673 A002906
UV sensor SI 1
A004574 A004573 A004572 A004575 A004576 A005030
UV sensor TS 1
UV-A or UV-B or UV-C or
UV-VIS or UV LED
UV-A or UV-B or UV-C or
UV-VIS or UV-full
UV-LED
Type: HI 1 handheld
Small and portable display unit for uv sensor SI 1
large-scaled 7/16 segment display with units
Measuring functions: Measured value, saving of maximum / minimum values, hold function
Test functions: Range monitoring, sensor breakage indication, battery voltage check and display
Dimemsions / weight Special features HI 1: Type:
Spectral measuring ranges: Max. intensity: Dimensions / weight Special features SI 1: Type:
Spectral measuring ranges: Max. intensity: Dimensions / weight Stainless steel tube: Special features TS 1:
approx. 125x80x40 mm / 270 g One handheld for different sensors, saving of max. and min. values, hold function SI 1 sensor
315 – 395 nm, max. 340 nm 265 – 325 nm, max. 315 nm 215 – 280 nm, max. 265 nm 395 – 445 nm, max. 435 nm 320 – 395 nm, max. 350 nm 2,000 mW/cm² for max. 30 s for UV-LED: 20 W/cm² (max. 5 s) Ø 36 mm, height 17 mm / 70 g Calibration saved in the sensor plug, available for different spectral ranges and intensities. TS 1
315 – 395 nm, max. 340 nm 265 – 325 nm, max. 315 nm 215 – 280 nm, max. 265 nm 395 – 445 nm, max. 435 nm 230 – 410 nm, max. 330 nm 265 – 495 nm, max. 350 nm 10.000 mW/cm² for max. 5 s Total length: 440 mm, plunge depth with mounting and guidance plate: 230 mm ø 6 mm Calibration saved in the sensor plug, available for different spectral ranges.
Note: Also the IR sensor PMI 41 for measuring the quartz glass temperature of UV curing lamps can be conneted to the handheld HI 1. For more information, kindly notice the IR sensor data sheet.

Page 14/18 uv measurement basics - E v2.1.0.docx, AR, 2020-08-21
Änderungen vorbehalten / All data are subject to alteration.
Information Sheet
6.2.4 UV online measuring instrument QSO 3 The QSO 3 is suitable for continuous intense UV irradiation. It emits a sensor signal that is proportional to the measured UV radiation in the form of a DC 0…10 V signal. The photodiode is located outside the actual radiation zone. The UV radiation incident on the quartz glass window is damped by total reflection in the quartz glass rod and thus reaches the photodiode. As a result, the temperature load of the photodiode is also minimised. Most customers use this sensor in order to detect the lamp ageing, or they use the sensor signal to control the ballast via a machine controller. The purpose is to realise constant UV radiation by adjusting the electrical power of the lamp.
Photo Ranges Unit Short description Art. No.
Peak
mW/cm² Dose mJ/cm²
QSO 3 UV-A: A002179 UV-B: A002178 UV-C: A002177
UV-A or UV-B or
UV-C
by DC
0 – 10V
Type:
Spectral ranges: Sensitivity range: Intensification factors: Max. permissible intensity: Max. permissible temperature: Power supply: Output: Dim. / weight sensor box: Stainless steel tube: Special feature:
QSO 3
315 – 395 nm, max. 340 nm 265 – 325 nm, max. 315 nm 215 – 280 nm, max. 265 nm 20 – 2,000 mW/cm² 1, 10, 100, 1000; x 0.3 10,000 mW/cm² for max. 10 min ~ 300° C at the quartz glass window External DC 24V, 5mA DC 0-10 V, proportional to UV approx. 45 x 45 x 34 mm / approx. 200 g ø 8 mm Purging air connection 1/8”
For detailed information kindly notice the respective data sheets.
6.2.5 UV online measuring instrument QWO The QWO is suitable for continuous intense UV irradiation at UV curing applications. It emits a sensor signal that is proportional to the measured UV radiation in the form of a DC 0…10 V signal. Typically, the QWO is mounted temperature decoupled directly on a UV reflector unit and looks through an opening directly at the UV lamp. Most customers use this sensor in order to detect the lamp ageing, or they use the sensor signal to control the ballast via a machine controller. The purpose is to realise constant UV radiation by adjusting the electrical power of the lamp.
Picture Range Value Short description Art. No.
Peak
mW/cm² Dose mJ/cm²
QWO
UV-A: A001976 UV-B: A002394 UV-C: A001975
UV-Vis: A008133
UV-A oder UV-B oder UV-C oder
UV-Vis
mittels DC
0 – 10V
Type:
QWO
Spectral measuring ranges: Sensitivity range: Amplification factor: Max. permissible intensity: Max. permissible temp.: Supply: Output: Dim./weight sensor: Special feature:
315 – 395 nm, max. 340 nm 265 – 325 nm, max. 315 nm 215 – 280 nm, max. 265 nm 380 – 445 nm, max. 405 nm 50 – 5,000 mW/cm² 1, 10, 100, 1000; x 0,3 5.000 mW/cm² for max. 10 min ~ 60° C (cont. operation) External by DC 24V, 5mA DC 0-10V, proportional to UV Approx. 45 x 45 x 34 mm / 135 g Air purging connection 1/8”
For detailed information kindly notice the respective data sheets.
Page 15/18 uv measurement basics - E v2.1.0.docx, AR, 2020-08-21
Änderungen vorbehalten / All data are subject to alteration.
Information Sheet
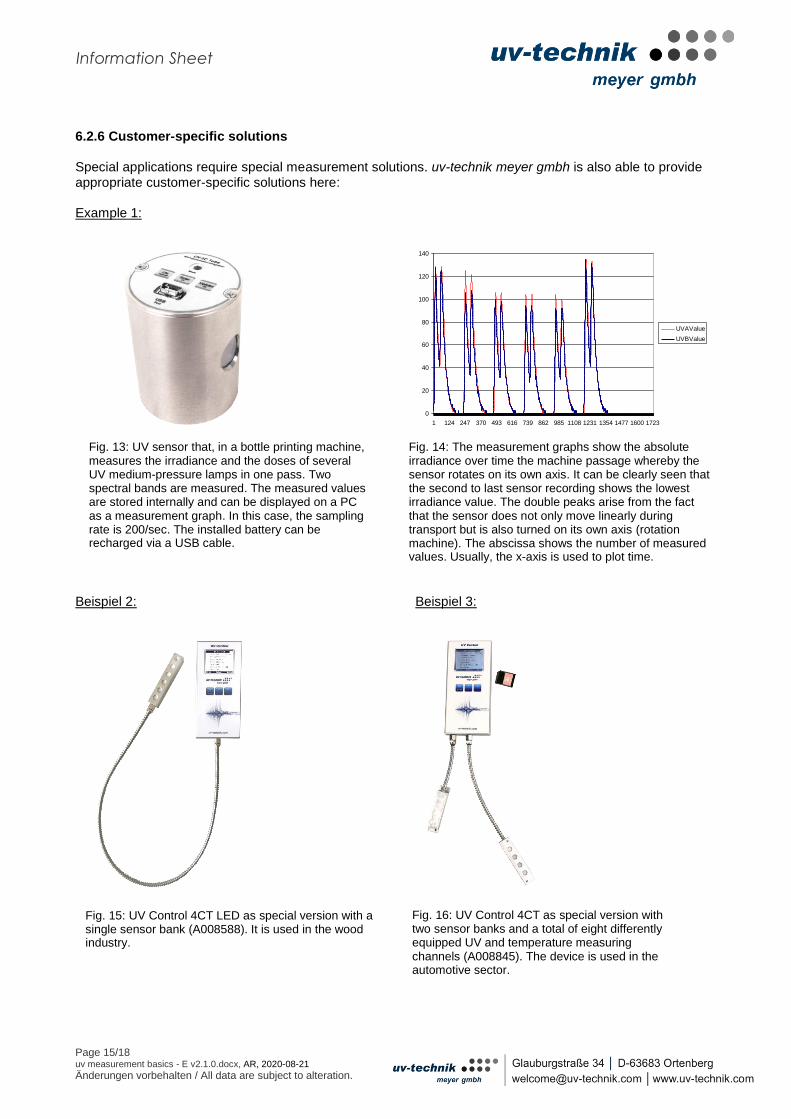
6.2.6 Customer-specific solutions Special applications require special measurement solutions. uv-technik meyer gmbh is also able to provide appropriate customer-specific solutions here: Example 1:
Beispiel 2: Beispiel 3:
0
20
40
60
80
100
120
140
1 124 247 370 493 616 739 862 985 1108 1231 1354 1477 1600 1723
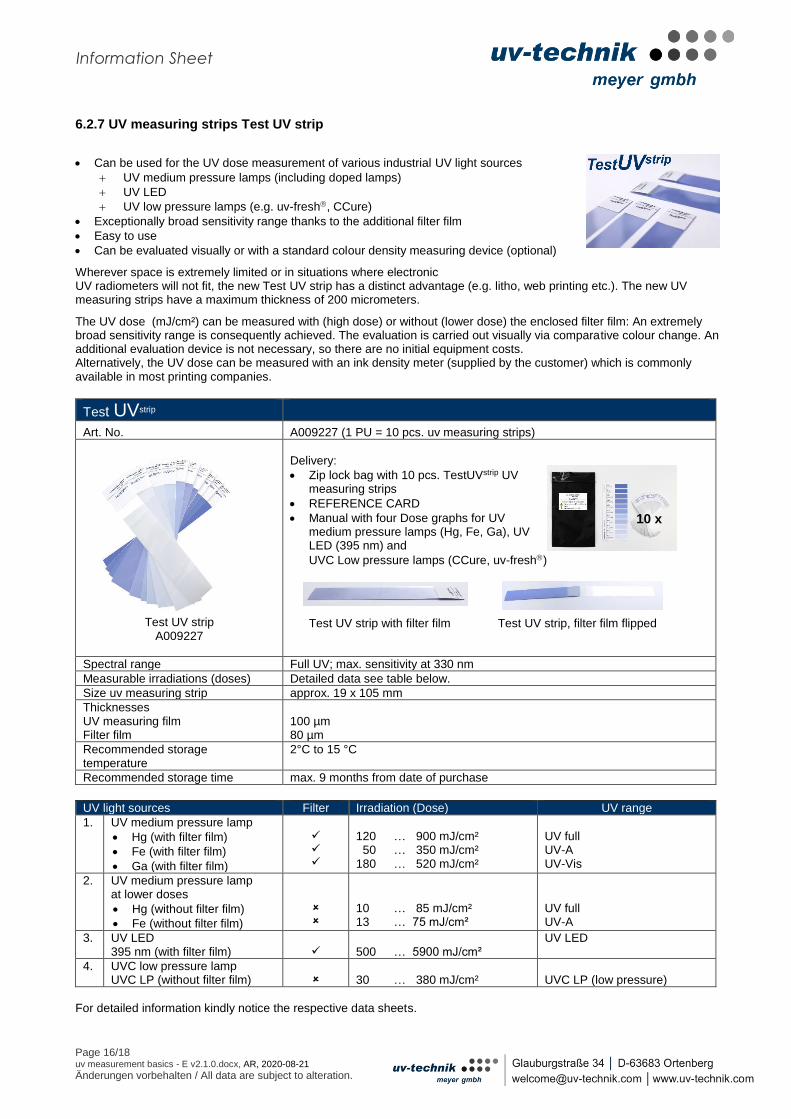
UVAValue
UVBValue
Fig. 13: UV sensor that, in a bottle printing machine, measures the irradiance and the doses of several UV medium-pressure lamps in one pass. Two spectral bands are measured. The measured values are stored internally and can be displayed on a PC as a measurement graph. In this case, the sampling rate is 200/sec. The installed battery can be recharged via a USB cable.
Fig. 14: The measurement graphs show the absolute irradiance over time the machine passage whereby the sensor rotates on its own axis. It can be clearly seen that the second to last sensor recording shows the lowest irradiance value. The double peaks arise from the fact that the sensor does not only move linearly during transport but is also turned on its own axis (rotation machine). The abscissa shows the number of measured values. Usually, the x-axis is used to plot time.
Fig. 16: UV Control 4CT as special version with two sensor banks and a total of eight differently equipped UV and temperature measuring channels (A008845). The device is used in the automotive sector.
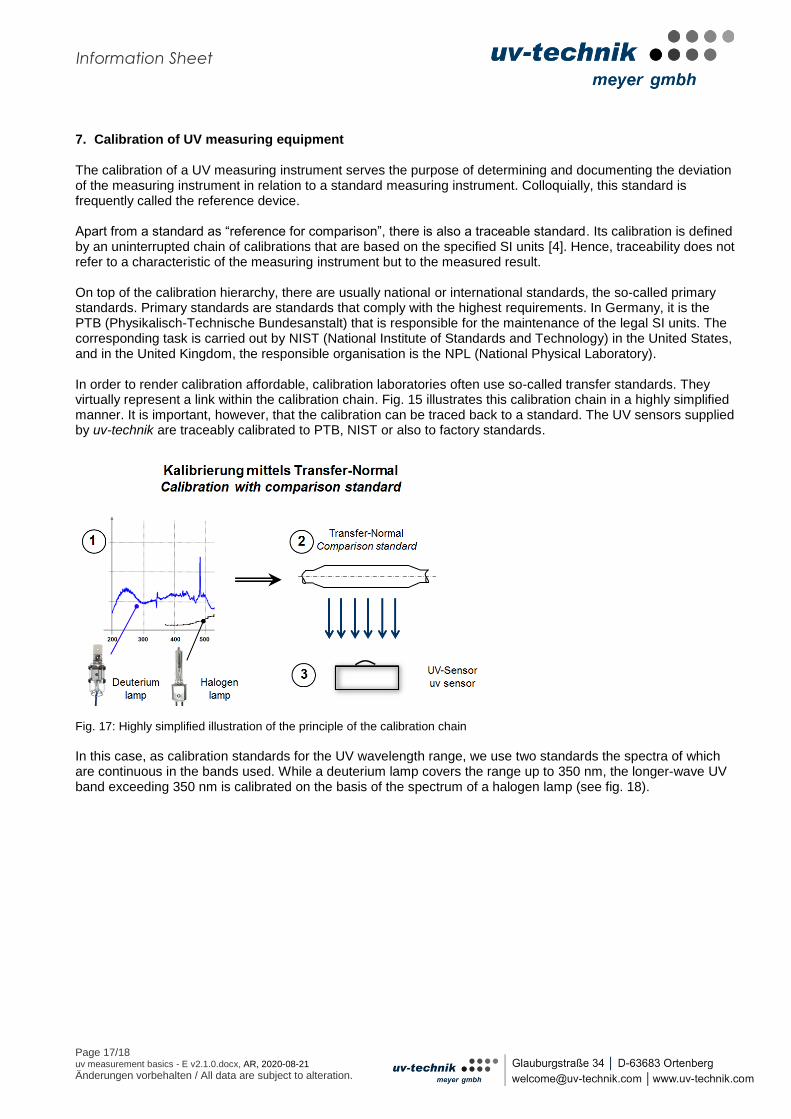
Fig. 15: UV Control 4CT LED as special version with a single sensor bank (A008588). It is used in the wood industry.
Page 16/18 uv measurement basics - E v2.1.0.docx, AR, 2020-08-21
Änderungen vorbehalten / All data are subject to alteration.
Information Sheet
6.2.7 UV measuring strips Test UV strip
Can be used for the UV dose measurement of various industrial UV light sources
UV medium pressure lamps (including doped lamps)
UV LED
UV low pressure lamps (e.g. uv-fresh, CCure)
Exceptionally broad sensitivity range thanks to the additional filter film
Easy to use
Can be evaluated visually or with a standard colour density measuring device (optional)
Wherever space is extremely limited or in situations where electronic UV radiometers will not fit, the new Test UV strip has a distinct advantage (e.g. litho, web printing etc.). The new UV measuring strips have a maximum thickness of 200 micrometers.
The UV dose (mJ/cm²) can be measured with (high dose) or without (lower dose) the enclosed filter film: An extremely broad sensitivity range is consequently achieved. The evaluation is carried out visually via comparative colour change. An additional evaluation device is not necessary, so there are no initial equipment costs. Alternatively, the UV dose can be measured with an ink density meter (supplied by the customer) which is commonly available in most printing companies.
Test UVstrip
Art. No. A009227 (1 PU = 10 pcs. uv measuring strips)
Test UV strip
A009227
Delivery:
Zip lock bag with 10 pcs. TestUVstrip UV measuring strips
REFERENCE CARD
Manual with four Dose graphs for UV medium pressure lamps (Hg, Fe, Ga), UV LED (395 nm) and
UVC Low pressure lamps (CCure, uv-fresh)
Test UV strip with filter film Test UV strip, filter film flipped
Spectral range Full UV; max. sensitivity at 330 nm
Measurable irradiations (doses) Detailed data see table below.
Size uv measuring strip approx. 19 x 105 mm
Thicknesses UV measuring film Filter film
100 µm 80 µm
Recommended storage temperature
2°C to 15 °C
Recommended storage time max. 9 months from date of purchase
UV light sources Filter Irradiation (Dose) UV range
1. UV medium pressure lamp
Hg (with filter film)
Fe (with filter film)
Ga (with filter film)
120 … 900 mJ/cm² 50 … 350 mJ/cm² 180 … 520 mJ/cm²
UV full UV-A UV-Vis
2. UV medium pressure lamp at lower doses
Hg (without filter film)
Fe (without filter film)
10 … 85 mJ/cm² 13 … 75 mJ/cm²
UV full UV-A
3. UV LED 395 nm (with filter film)
500 … 5900 mJ/cm²
UV LED
4. UVC low pressure lamp UVC LP (without filter film)
30 … 380 mJ/cm²
UVC LP (low pressure)
For detailed information kindly notice the respective data sheets.
10 x 10 x
10 x
Page 17/18 uv measurement basics - E v2.1.0.docx, AR, 2020-08-21
Änderungen vorbehalten / All data are subject to alteration.
Information Sheet
7. Calibration of UV measuring equipment The calibration of a UV measuring instrument serves the purpose of determining and documenting the deviation of the measuring instrument in relation to a standard measuring instrument. Colloquially, this standard is frequently called the reference device. Apart from a standard as “reference for comparison”, there is also a traceable standard. Its calibration is defined by an uninterrupted chain of calibrations that are based on the specified SI units [4]. Hence, traceability does not refer to a characteristic of the measuring instrument but to the measured result. On top of the calibration hierarchy, there are usually national or international standards, the so-called primary standards. Primary standards are standards that comply with the highest requirements. In Germany, it is the PTB (Physikalisch-Technische Bundesanstalt) that is responsible for the maintenance of the legal SI units. The corresponding task is carried out by NIST (National Institute of Standards and Technology) in the United States, and in the United Kingdom, the responsible organisation is the NPL (National Physical Laboratory). In order to render calibration affordable, calibration laboratories often use so-called transfer standards. They virtually represent a link within the calibration chain. Fig. 15 illustrates this calibration chain in a highly simplified manner. It is important, however, that the calibration can be traced back to a standard. The UV sensors supplied by uv-technik are traceably calibrated to PTB, NIST or also to factory standards.
Fig. 17: Highly simplified illustration of the principle of the calibration chain
In this case, as calibration standards for the UV wavelength range, we use two standards the spectra of which are continuous in the bands used. While a deuterium lamp covers the range up to 350 nm, the longer-wave UV band exceeding 350 nm is calibrated on the basis of the spectrum of a halogen lamp (see fig. 18).

Page 18/18 uv measurement basics - E v2.1.0.docx, AR, 2020-08-21
Änderungen vorbehalten / All data are subject to alteration.
Information Sheet
Fig. 18: The spectra of a deuterium lamp and of a halogen lamp are required in practice in order to cover the UV range for a calibration. Note: The spectral curves of the two radiation sources shown must only be considered qualitatively with regard to the respective irradiance.
The national standards are comparable. This is reviewed at regular intervals by means of a complex key comparison which the well-known national institutions (such as, for example, PTB, NIST, etc.) take part in [5]. References [1] CIE (Commission Internationale de l‘Eclairage; International Commission on Illumination) [2] Naumann, Schröder - Bauelemente der Optik, 6th edition, Carl Hanser Verlag, 1992 [3] Bergmann, Schaefer – Lehrbuch der Experimentalphysik Band III Optik, 8th edition, Springer Verlag, 1987 [4] EU Directive 80/181/EEC [5] Report of the CIPM Key Comparison CCPR-K1.b; Spectral Irradiance 200 nm to 350 nm; Physikalisch-Technische Bundesanstalt, 2008