uva-dare (digital academic repository) spectroscopic ... · chapter 9. a new bright 3 cephei star:...
TRANSCRIPT
UvA-DARE is a service provided by the library of the University of Amsterdam (http://dare.uva.nl)
UvA-DARE (Digital Academic Repository)
Spectroscopic diagnostics of pulsation in rotating stars
Schrijvers, C.
Link to publication
Citation for published version (APA):Schrijvers, C. (1999). Spectroscopic diagnostics of pulsation in rotating stars
General rightsIt is not permitted to download or to forward/distribute the text or part of it without the consent of the author(s) and/or copyright holder(s),other than for strictly personal, individual use, unless the work is under an open content license (like Creative Commons).
Disclaimer/Complaints regulationsIf you believe that digital publication of certain material infringes any of your rights or (privacy) interests, please let the Library know, statingyour reasons. In case of a legitimate complaint, the Library will make the material inaccessible and/or remove it from the website. Please Askthe Library: http://uba.uva.nl/en/contact, or a letter to: Library of the University of Amsterdam, Secretariat, Singel 425, 1012 WP Amsterdam,The Netherlands. You will be contacted as soon as possible.
Download date: 20 Oct 2018

9
A new bright (3 Cephei star: line-profile variability in cul Scorpii
J.H. Telting, C. Schrijvers
Appeared in Astronomy & Astrophysics 339,150-158 (1998)
Abstract
We present a time series of high-resolution spectra, showing the line-profile variations in the Sim triplet (A 4552, 4567, 4574 A) of the rotating early-type star w1 Sco. The profile variations can be explained by a non-radial pulsation mode. We analyse the spectral time series by making Fourier transforms for each position in the line profile. Significant power is found only at a frequency of 15.0 cycles/day, suggesting that the profile variations are due to one dominant pulsation mode. From the difference in phase of the variations of the blue and the red wings of the profiles we infer that the star pulsates in a mode with pulsational degree i=9±l. From comparison with model calculations we estimate the velocity amplitude of this pulsation to be ^10km/s at the stellar surface.
9.1 Introduction
The influence of rotation on the excitation of particular pulsation modes is unknown. Rapidly rotating 3 Cephei stars (v sin i ̂ 70km/s) are rarely found to pulsate in radial or low-order non-radial modes (£ < 3). This might be due to intrinsic rotational damping of low-order modes, to observational selection effects, or to the fact that rotation modifies the shape of the eigenfunctions. To investigate this problem we are searching for new ,3 Cephei stars using high-resolution spectroscopy, focusing on stars that have high vslni. This way we hope to complement the group of /3 Cephei stars that have been found photometrically, and hence have low-order pulsations, with new variables that might have higher-order pulsations. Ultimately, we intend to establish the
203

Chapter 9. A new bright 3 Cephei star: w'1 Scorpii
differences in the pulsational properties between rapidly-rotating and slowly-rotating 0 Cephei stars.
For rapidly rotating stars, pulsation modes with intermediate pulsational degrees, 3 ^ t & 20, show up as line-profile variations in which alternate 'emission' bumps and 'absorption' troughs move from red to blue through the line profiles (Vogt & Penrod 1983). These variations are due to the combined effects of the pulsational velocity field (Doppler shifts, e.g. Kambe & Osaki 1988, or Gies & Kullavanijaya 1988) and the pulsational temperature fluctuations (equivalent width and surface brightness variations, e.g. Lee et al. 1992). The line-profile variations hold information on the pulsation modes that are present; good estimates of the pulsational degree I, the azimuthal order m and the velocity amplitude of the pulsations can be derived (see Chapters 2, 3 and 4, or Schrijvers et al. 1997, Telting & Schrijvers 1997a, Schrijvers & Telting 1999).
Here we present a spectral time series of a new, bright, rapidly rotating 0 Cephei star: w1 Sco (HD144470, mv=3.9, B1V (Hoffleit & Jaschek 1982), Hipparcos parallax 7r=7.7±0.9mas). This star, a member of Sco OB2 association (Upper Scorpius, Blaauw 1964; Brown & Verschueren 1997), has served as the primary standard star of the Walraven photometric system (Lub & Pel 1977), and is therefore expected to show no photometric variations with an amplitude higher than ~3mmag in the visual. In the Hipparcos catalogue a;1 Sco is marked as constant with a standard error of the median of 51 observations of <7Hp=0.7mmag, with Hp=3.92 and 77p=3.94 as 5th and 95th percentiles. Besides being a photometric standard, this star is also one of the rotational velocity standards used by Slettebak et al. (1975, v sin i=110km/s; usin i=100km/s, Brown & Verschueren 1997). No line-profile variations have been reported to date, however.
In Sect. 9.2 we will discuss the data taking and data reduction. In Sect. 9.3 we present the Fourier analysis of the time series, and in Sect. 9.4 we identify the mode that is causing the line-profile variations. Our concluding remarks are in Sect. 9.5.
9.2 The data
The high-resolution spectra (R=65000) were obtained at ESO La Silla, with the CAT telescope and the CES spectrograph with its long camera, over a period of 6 nights (21-26 April 1996) that was not free of bad weather. On about 2600 useful columns of ESO CCD #38, the spectra sample the wavelength region of the Sim triplet (A 4552, 4567, 4574 A, see Fig. 9.2), and have a S/N ratio typically between 500 and 1000. With the exception of a few spectra, the exposure time was kept shorter than 20 minutes (typically 15 minutes).
The spectra were reduced using standard packages in IRAF running on a Linux PC. Wavelength calibration was done from ThAr calibration spectra. We used the CCD overscan region to determine the bias level. CCD pixel-to-pixel variations were removed by flat fielding with dome flats; dome flats also provided a first rough correction for the continuum shape which is heavily affected by vignetting of the light beam. Bad columns were removed by linear interpolation of pixel intensities in adjacent columns. One-dimensional spectra were extracted after subtracting a global fit to
204

9.2. The data
HJD 2450199.9362
4548 4550 4552 4554 4556 4558
Wavelength [Angstrom]
Fig. 9.1. One night of data, showing the variation in the Sim 4552 A line. Spectra are offset according to acquisition time
background and scattered light. All spectra were shifted to, and acquisition times were transformed to, the heliocentric frame.
At first we normalized the spectra by fitting a cubic spline with typically 10-15 segments to the regions in between the obvious absorption lines in the extracted spectra. Since the line profiles are rather broad and the instrumental setup is not stable with respect to continuum shape, this normalization technique gives considerable scatter in the equivalent width of the lines. Therefore we employed a different strategy as well: we used a spectrum with very high S/N as a template and divided this into each individual spectrum. Then we 'normalized' these quotient spectra by fitting similar functions as mentioned above; it turned out that the continuum in the quotient spectra is much easier to fit than in the raw spectra. Then we constructed, using the fits to the quotient spectra and a normal continuum fit of the template spectrum, a final set of normalized spectra. For this final set the scatter in the equivalent width of the lines is reduced by about 50% with respect to the results of the first normalizing method.
9.2.1 Line profile variations
During the six observing nights a total of 30 spectra were taken, most of them in the last three nights of the run. In Fig. 9.2 we present a grey-scale representation of the data of a,-1 Sco taken on these three nights.
From Figs. 9.1 and 9.2 it is obvious that the line-profile variations in u1 Sco closely
205

Chapter 9. A new bright 0 Cephei star. ^ J Scorpii
ESOCAT/CES April 1996 (D 1 Sco Si III
4550 4560 Wavelength (A)
4570 4580
Fig. 9.2. Top: Mean of all 30 spectra. Middle: All 30 residual spectra (mean subtracted). Bottom: Grey scale representation of the residuals of the spectra collected in the last 3 nights of the observing run. Spectra are offset according to acquisition time. Note that only for one night the time resolution is high enough to see individual bumps move from blue to red
206

9.2. The data
resemble that of known non-radially pulsating early-type stars (e.g. ( Oph, Vogt & Penrod 1983; 6 Sco, Smith 1986; c Per, Gies & Kullavanijaya 1988; etc.), and that these spectra appear as if they were the result of NRP model calculations (e.g. Kambe & Osaki 1988, Townsend 1998, see also Sect. 9.4 and Chapter 2). Given the spectral type of the star, the observed pulsation frequency (see Sect. 9.4.2) and the above findings, we conclude that w] Sco is most probably a new /3 Cephei star (see also Sect. 9.5).
9.2.2 Equivalent width and line centroid variations
Figure 9.3 shows the measured equivalent width (EW) variations, and the variations of the centroid velocity of the A 4552 A line (computed for 4552.6 A rest wavelength). The errors on the points are derived from the S/N of the spectra, and do not include an estimate of continuum misplacement. For the equivalent width we suspect that the main part of variability is caused by errors in the normalization of the spectra. The overplotted equivalent width measurements of the A 4567 A line confirm this: there is no relation between the equivalent width variations of the two lines that are of the same triplet.
The line centroid measurements show a change of about 1 km/s between the beginning and the end of the night (see Fig. 9.3). The other lines of the triplet show similar behaviour. For our spectra the 1 km/s change corresponds to a spectral shift of just less than one CCD pixel, whereas the slit (2.5 arcsec width) was imaged onto approximately four pixels. Given the complicated light path from the telescope to the slit we cannot exclude that the gradual line shifts are the result of an hour-angle dependent observational effect.
The above arguments and the lack of temporal correlation of the variability of these quantities with the main pulsation period of the star (see below), suggest that these EW and centroid variations might well be instrumental.
- l
c v u
- 4
0.175
lO 5 o r/> -<
0.17
0.165
196 198 300 HJD [-2450000]
Fig. 9.3. Centroid velocity of the A 4552 A line (top) and equivalent width of the A 4552 A (dots) and 4567 A (circles) lines (bottom). For the equivalent width the error bars, which do not include an estimate of continuum misplacement, are similar in size as the dots
0.145 ,
0.14 £ ,
0.135
207

Chapter 9. A new bright ,j Cephei star: -.•' Scorpii
40 4551 4552 4553 4554 4555
30
CO
c
^ 2 0
o 5 O
Hf 1 0
0
I I I I I
I ' " 1 1 1 1 I I I I ' ' " I
» I» • I
.Jin T5»**' ,
« g '•. M
|> I i , | I I <u I • II '
H i i I i H I I I I 'T I I-1! I I 1 'l I I ' l I l l 1 1 I l l I I I
4551 4552 4553 4554 4555
0.96
0.92
i M " i I I i i I i I I I I I I i -
i 1 1 . . . i . . . . i . . . . i
wavelength [Angstrom]
Fig. 9.4. Top: CLEANed Fourier analysis. For every wavelength bin (horizontal axis) a Fourier analysis of all the spectra is done. The power resulting from the Fourier analysis is plotted as a grey-value as a function of temporal frequency (vertical axis). Grey-scale cuts: 0-2-1CT'. A periodic signal with a frequency of 15.0cycles/day, is detected throughout the line profile. Power is found at one-day aliases of the above frequency, and also near the harmonic frequency. Bottom: Mean of all 30 spectra
208

9.3. Fourier analysis
9.3 Fourier analysis
To find the frequencies of the pulsations that cause the line-profile variations we analysed the time series with the method as described by Gies & Kullavanijaya (1988). For each wavelength bin in the line profiles we did a Fourier analysis of the variable signal: we computed the Fourier components for frequencies between 0 and 50 cycles/day, with a frequency spacing of 0.01 cycles/day. Then we CLEANed the resulting Fourier spectrum of each wavelength bin, in order to remove the temporal window function (which is due to incomplete temporal sampling of the variational signal). We used CLEAN parameters iViterations=400 and a gain of 0.2 (Roberts et al. 1987).
Frequency [Cycles per day]
Fig. 9.5. Summed Fourier spectrum. The amplitudes (i.e. two times the square root of the power values) of the periodogram of the A 4552 line (Fig. 9.4) have been summed over the line profile. The results for the other two lines have been offset by 0.3 for clarity
For the Sim A 4552 A line the result is plotted in Fig. 9.4. Figure 9.5 shows the one-dimensional periodogram that results from summing the variational amplitudes of the two-dimensional periodogram over the A 4552 A line profile. Variational power is mainly found at frequency 15.0 cycles/day, a smaller peak is found at 13.6 cycles /day. Some of the power has leaked to one-day aliases, which shows that the CLEAN algorithm was not able to fully correct for the window function.
209

Chapter 9. A new bright 3 Cephei star: ^ ' Scorpii
For the two other lines in our spectra we also find most power at 15.0 cycles/day (see Fig. 9.5 and Table 9.1). A broad peak is found at 13.8 cycles/day; the broadness probably reflects a combination of a periodic signal with frequency ~13.6 cycles/day and the one-day alias of the main frequency. Our dataset is not extensive enough to separate these frequencies: the HWHM of the main power peak in the window function is 0.09 cycles/day
The shortest timespan between subsequent exposures of this dataset corresponds to a Nyquist frequency (as defined for equidistant data sets) of ~ 25 cycles/day. Nevertheless, we find power at frequencies higher than that. Some power appears around the harmonic of the main frequency which is expected for high amplitude line-profile variations (see Schrijvers et al. 1997, Telting & Schrijvers 1997a, 1997b). Note that this does not directly imply that the pulsation itself is non-sinusoidal (or non-linear), since the harmonic frequencies are expected to show up in the line-profile variations of linear (i.e. sinusoidal) pulsations as well. The power found at frequency 27.9 cycles/day (see Table 9.1) could be the first harmonic frequency of the main frequency, if the true apparent main frequency is 14.0 cycles/day (a one day alias of our previously determined main frequency). Also, if the 13.6 cycles/day frequency is real, the 27.9 cycles/day could be its harmonic. A more extensive data set is required to test these hypotheses.
We have also Fourier analysed the variations in equivalent width (EW) and centroid velocity, and find that both periodograms are noisy and do not have a maximum at frequency 15.0 cycles /day We calculated these Fourier transforms (not CLEANed) for the A 4552 A and 4567 A lines, on a frequency domain of 0-50 cycles /day and with a frequency step of 0.01 cycles/day. The highest peaks in the frequency interval [13-17] cycles/day of each of these periodograms correspond to a maximum amplitude of the EW and centroid variations of 0.8% and of 350 m / s respectively, which are the observed constraints of the contribution to the EW and centroid variations of the main pulsation mode.
Table 9.1. Strongest power peaks in the summed periodograms (see Fig. 9.5). Frequencies are given in cycles/day
A 4552 A
15.00 13.55
27.90
27.01
12.46
A 4567 A
14.99
13.78
12.51 26.97
27.92
A 4574 A
14.99 13.95
26.98
27.93
12.45
We conclude that the observed line-profile variations in uil Sco are mainly due to one dominant pulsation mode with an apparent pulsation frequency of 15.0 cycles/day Our dataset is not extensive enough to find other modes, nor to exclude the existence of other modes.
210

9.4. Mode iden tilica tion
9.4 Mode identification
9.4.1 Pulsational degree of the mode
Apart from direct model fits to the spectra (e.g. Campos & Smith 1980, Vogt & Pen-rod 1983, Smith 1986), two distinct techniques of deriving a mode identification from time series of spectra have been developed: the analysis of the velocity moments of the variable profiles (Balona 1986; Aerts et al. 1992; Aerts 1996), and the analysis of the variations of the normalized intensity as a function of position in the line profile, through either one-dimensional Fourier analyses (Gies & Kullavanijaya 1988) or a single two-dimensional Fourier transform (Kennelly et al. 1992, Kennelly et al. 1998). The moment method can primarily be used for the identification of low-degree modes (£ ̂ 3). As the number of bumps in the profiles of a;1 Sco suggests a higher t value, and as we do not measure significant profile shifts (Sect. 9.2.1), we have chosen to use the method described by Gies & Kullavanijaya (1988) and further explored in Chapter 2 and 3.
(I 93
0.96
0.94
0.92
5
8x10"
6x10"
4x10"
2x10"
Average profile
Phase at frequency 15.0 c /d
-+ -r- -+- •+•
Power at frequency 15.0 c /d
4552 4553 4554 Wavelength [Angstrom]
4566 4567 4568 4569
Wavelength [Angstrom]
Fig. 9.6. Power and phase as a function of position in the line profiles of Sim A 4552 A and 4567 A . Top: Mean profiles. Middle: Fourier phase at frequency 15.0 cycles/day as a function of position in the line profile. Small dots have power less than 3x 10⁻⁸. Bottom: Fourier power at frequency 15.0 cycles/day as a function of position in the line profile (see also Fig. 9.4)
Figure 9.6 shows the distribution of Fourier phase and power at 15.0 cycles/day in the periodogram of Fig. 9.4. The power distribution is very noisy, which is probably due to the poor time sampling of the pulsation period (only 30 spectra, with hardly enough time-resolution). Nevertheless, the distribution of the phase is well determined. We read off the phase difference between the blue and the red wings of the profile as ~8±1 radians, which with Equation 3.9 corresponds to a pulsational degree ^=9±1. For the different lines we get consistent results. As the line-profile variations are mainly caused by a single pulsation mode, the blue-to-red phase difference
211
Chapter 9. A new bright 3 Cephei star: a,-1 Scorpn
corresponds to the number of bumps and troughs in the individual line profiles (see Fig. 9.1).
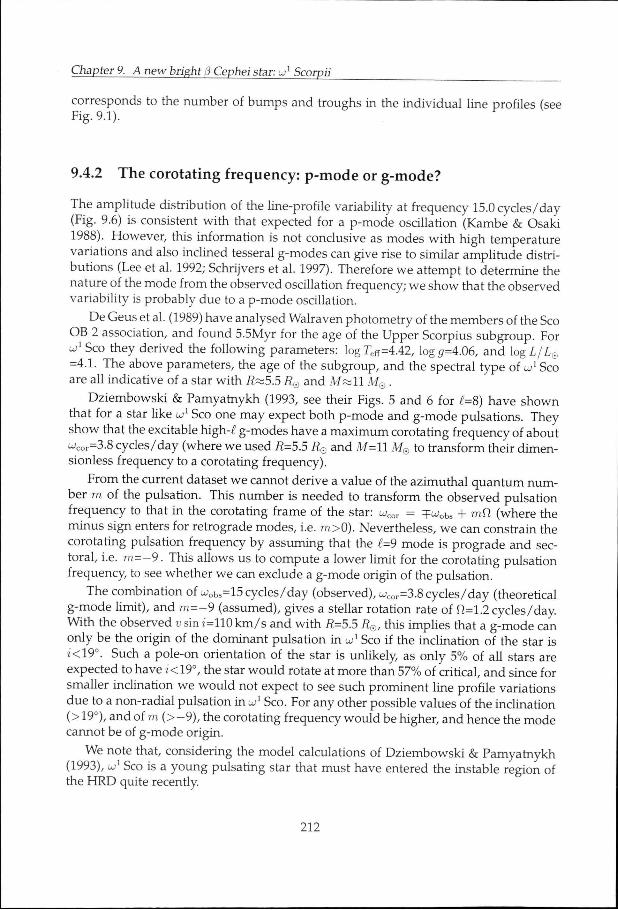
9.4.2 The corotating frequency: p-mode or g-mode?
The amplitude distribution of the line-profile variability at frequency 15.0 cycles/day (Fig. 9.6) is consistent with that expected for a p-mode oscillation (Kambe & Osaki 1988). However, this information is not conclusive as modes with high temperature variations and also inclined tesseral g-modes can give rise to similar amplitude distributions (Lee et al. 1992; Schrijvers et al. 1997). Therefore we attempt to determine the nature of the mode from the observed oscillation frequency; we show that the observed variability is probably due to a p-mode oscillation.
De Geus et al. (1989) have analysed Walraven photometry of the members of the Sco OB 2 association, and found 5.5Myr for the age of the Upper Scorpius subgroup. For w1 Sco they derived the following parameters: log Teff =4.42, log #=4.06, and log L/L@
=4.1. The above parameters, the age of the subgroup, and the spectral type of to1 Sco are all indicative of a star with /?«5.5 R@ and M « l l M© .
Dziembowski & Pamyatnykh (1993, see their Figs. 5 and 6 for f.=8) have shown that for a star like u,'1 Sco one may expect both p-mode and g-mode pulsations. They show that the excitable high-^ g-modes have a maximum corotating frequency of about u>cor=3.8 cycles/day (where we used R=5.5 Re and M=ll M@ to transform their dimen-sionless frequency to a corotating frequency).
From the current dataset we cannot derive a value of the azimuthal quantum number m of the pulsation. This number is needed to transform the observed pulsation frequency to that in the corotating frame of the star: wcor = =fu;obs + mfi (where the minus sign enters for retrograde modes, i.e. m>0). Nevertheless, we can constrain the corotating pulsation frequency by assuming that the f=9 mode is prograde and sectoral, i.e. m = - 9 . This allows us to compute a lower limit for the corotating pulsation frequency, to see whether we can exclude a g-mode origin of the pulsation.
The combination of wobs=15 cycles/day (observed), ^cor=3.8 cycles/day (theoretical g-mode limit), and m=-9 (assumed), gives a stellar rotation rate of Q=1.2 cycles/day With the observed v sin £=110 km/s and with 72=5.5 R@, this implies that a g-mode can only be the origin of the dominant pulsation in LC1 SCO if the inclination of the star is 2<19°. Such a pole-on orientation of the star is unlikely, as only 5% of all stars are expected to have i<19°, the star would rotate at more than 57% of critical, and since for smaller inclination we would not expect to see such prominent line profile variations due to a non-radial pulsation in UJ1 Sco. For any other possible values of the inclination (> 19°), and of m (> -9) , the corotating frequency would be higher, and hence the mode cannot be of g-mode origin.
We note that, considering the model calculations of Dziembowski & Pamyatnykh (1993), w1 Sco is a young pulsating star that must have entered the instable region of the HRD quite recently.
212

9.4. Mode identification
= 85 = 65 45 25
AEW =0.003
LU, =0.001
AEW =0.001
iV, =0.001
« AEW =0.000
Atf, =0.001
AEW =0.000
AJf, =0.000
AEW =0.001
Atf, =0.002
AEW =0.003
W, =0.002 AEW =0.001
CJl, =0.002
AEW =0.000
AV, =0.000
AEW =0.002
LM, =0.008
AEW =0.002
AJf, =0.002
AEW =0.000
AV, =0.001
AEW =0.001
LU. =0.008
AEW =0.000
AV, =0.000
Fig. 9.7. Model calculations of time series of spectra of to1 Sco for different values of the inclination and the azimuthal number m. The surface velocity amplitude is 15 km/s and the temperature variations have an amplitude of 2% of the surface temperature. We used 1=9. Next to the profiles the change in EW (thick curve) and first moment (radial velocity, thin curve) is plotted. The amplitudes are given in percent and km/s respectively
213
Chapter 9. A new bright 3 Cephei star: uj1 Scorpii
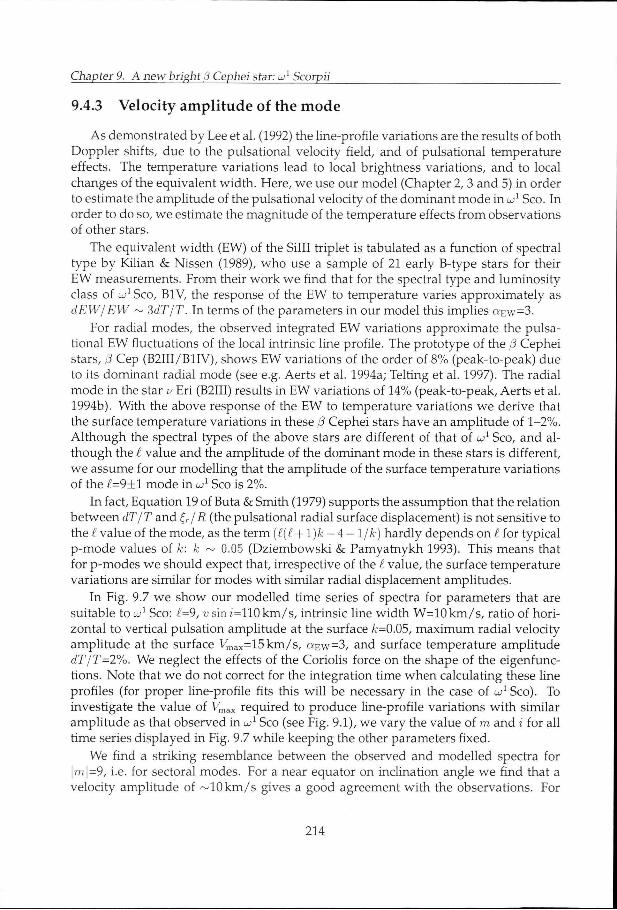
9.4.3 Velocity amplitude of the mode
As demonstrated by Lee et al. (1992) the line-profile variations are the results of both Doppler shifts, due to the pulsational velocity field, and of pulsational temperature effects. The temperature variations lead to local brightness variations, and to local changes of the equivalent width. Here, we use our model (Chapter 2,3 and 5) in order to estimate the amplitude of the pulsational velocity of the dominant mode in a;1 Sco. In order to do so, we estimate the magnitude of the temperature effects from observations of other stars.
The equivalent width (EW) of the Silll triplet is tabulated as a function of spectral type by Kilian & Nissen (1989), who use a sample of 21 early B-rype stars for their EW measurements. From their work we find that for the spectral type and luminosity class of UJ1 Sco, B1V, the response of the EW to temperature varies approximately as dEW/EW ~ 3dT/T. In terms of the parameters in our model this implies QEVV=3.
For radial modes, the observed integrated EW variations approximate the pulsational EW fluctuations of the local intrinsic line profile. The prototype of the (3 Cephei stars, 0 Cep (B2III/B1IV), shows EW variations of the order of 8% (peak-to-peak) due to its dominant radial mode (see e.g. Aerts et al. 1994a; Telting et al. 1997). The radial mode in the star v Eri (B2III) results in EW variations of 14% (peak-to-peak, Aerts et al. 1994b). With the above response of the EW to temperature variations we derive that the surface temperature variations in these p Cephei stars have an amplitude of 1-2%. Although the spectral types of the above stars are different of that of u1 Sco, and although the £ value and the amplitude of the dominant mode in these stars is different, we assume for our modelling that the amplitude of the surface temperature variations of the £=9±1 mode in a;1 Sco is 2%.
In fact, Equation 19 of Buta & Smith (1979) supports the assumption that the relation between dT/T and £r/R (the pulsational radial surface displacement) is not sensitive to the £ value of the mode, as the term (£(£+l)k — 4 — l/k) hardly depends on £ for typical p-mode values of k: k ~ 0.05 (Dziembowski & Pamyatnykh 1993). This means that for p-modes we should expect that, irrespective of the £ value, the surface temperature variations are similar for modes with similar radial displacement amplitudes.
In Fig. 9.7 we show our modelled time series of spectra for parameters that are suitable to to1 Sco: £=9, v sin z=110km/s, intrinsic line width W=10km/s, ratio of horizontal to vertical pulsation amplitude at the surface fc=0.05, maximum radial velocity amplitude at the surface Vmax=15km/s, QEW=3, and surface temperature amplitude dT/T=2%. We neglect the effects of the Coriolis force on the shape of the eigenfunc-tions. Note that we do not correct for the integration time when calculating these line profiles (for proper line-profile fits this will be necessary in the case of ui1 Sco). To investigate the value of Vmax required to produce line-profile variations with similar amplitude as that observed in to1 Sco (see Fig. 9.1), we vary the value of m and i for all time series displayed in Fig. 9.7 while keeping the other parameters fixed.
We find a striking resemblance between the observed and modelled spectra for \m\=9, i.e. for sectoral modes. For a near equator on inclination angle we find that a velocity amplitude of ~10km/s gives a good agreement with the observations. For
214

9.4. Mode identification
85 (>:") 45 25
AEW =0.006 LM, =0.103
r
AEW =0.000 LM, =0.000
W_yJ AEW =0.007 Atf , =0.082
AEW =0.003 till, =0 .060
Wr W^yJ 4EW =0.000
At f , =0.002
AEW =0.013 4 V , =0.166
AEW =0.000 At f , =0.011
M AEW =0.008 Ut, =0.071
AEW =0.001 Ut, =0.003
\ \ ^ y j AEW =0.014 Atf . =0.198
Fig. 9.8. As Fig. 9.7. Here, the velocity amplitude is 0.08 km/s and the temperature variations have an amplitude of 10% of the surface temperature. The time series have been shifted half a phase to match those in Fig. 9.7
215

Chapter 9. A new bright >3 Cephei star: ^ ' Scorpii
i=45° we have to increase the amplitude to ~15 km/s to get a similar amplitude of the line-profile variations. We also find some cases with low inclination angles, \m\-8, and an amplitude of ~20km/s that describe the data well. For the other combinations of m and i in Fig. 9.7 the generated profiles do not match the observed profiles, regardless of the value of the pulsation amplitude.
In this case with small temperature variations, there is a clear difference between the line profile variations of the modes with different values of \m\ (see Fig. 9.7). This difference can be quantified by analyzing the harmonic content of the line-profile variations (see Chapter 2 and 3). The observed set of profiles do not have sufficient coverage of the pulsation phase to make such an analysis possible. However, visual inspection of the generated time series for non-sectoral modes suggests that the mode in iv1 Sco is (near-)sectoral.
In Fig. 9.8 we show the case where the temperature effects dominate the line-profile variability. We used the same set of parameters as for Fig. 9.7, but diminished the velocity amplitude and increased the temperature variation to dT/T=W%. One can see that for all values of m the line profiles look similar, and hence in this case it is virtually impossible to retrieve a value of \m\ from the observations. The similarity is due to the lack of harmonic terms in the line-profile variations, which in the case of high velocity amplitudes carries information on the m value of the mode.
With this high value for the temperature variations the magnitude of the line-profile variations of the near-equator on sectoral mode is similar to what we observe in u1 Sco. For smaller inclination angles and lower values of \m\ even higher surface temperature fluctuations are needed to fit the observations.
From the magnitude of the expected variability in the EW and the centioid velocity of the profiles (see Figs. 9.7 and 9.8), it is clear that the observed constraints on these quantities (Sect. 9.2.2) are not strict enough to give guidance in determining whether the line-profile variations are mainly due to velocity or temperature effects.
9.5 Concluding remarks
We have obtained and analysed a set of 30 spectra of the early B-type main sequence star UJ1 Sco. We found the absorption lines of the Silll triplet to be variable with a dominant periodicity of 15.0 cycles/day. The line-profile variations can be modelled by non-radial pulsations, with a dominant mode of l'=9±\. We estimate the surface velocity amplitude of this mode to be at least ~ 10 km/s , provided that the surface temperature variations are small (~ 2%). The observed frequency of the mode with t=9±\ is consistent with that of a p-mode if the inclination of the star is larger than -20° .
Traditionally, a variable early-B type star can only be labelled a (3 Cephei star, if pulsational brightness variations have been detected photometrically. Now that spectroscopic detections of non-radial modes have become feasible, we find stars of the same spectral type with pulsations that are excited by the same mechanism, but for which brightness variations cannot (yet) be detected because the pulsational degree is
216

.References
too high. Although photometric variability is not detected in the case of w1 SCO, we can certainly label the star a p Cephei star on theoretical grounds (see Dziembowski & Pamyatnykh 1993). This raises the question whether we should relax the traditional definition of p Cephei stars to allow spectroscopic detection as well as photometric detection.
We are currently gathering more spectroscopic data of LO1 SCO, which will be presented in future work. A more extensive dataset is needed in order to derive more conclusive constraints on the m value of the dominant pulsation mode , and might reveal other modes as well. This will also enable to determine the contribution of the surface temperature variations to the line-profile variations in to1 Sco.
References
Aerts C , De Pauw M., Waelkens C. 1992, A&A 266, 294 Aerts C , Mathias P., Gillet D., Waelkens C. 1994a, A&A 286,109 Aerts C , Waelkens C, De Pauw M. 1994b, A&A 286,136 Aerts C. 1996, A&A 314,115 Balona L.A. 1986, MNRAS 219, 111 Blaauw A. 1964, ARA&A 2, 213 Brown A.G.A., Verschueren W. 1997, A&A 319, 811 Buta R.J., Smith M.A. 1979, ApJ 232, 213 Campos A.J., Smith M.A. 1980, ApJ 238, 250 De Geus E.J., De Zeeuw P.T, Lub J. 1989, A&A 216, 44 Dziembowski W.A., Pamyatnykh A.A. 1993, MNRAS 262, 204 Gies D.R., Kullavanijaya A. 1988, ApJ 326, 813 Hoffleit D., Jaschek C. 1982, 'The Bright Star Catalogue', Yale University Observatory, electronic
version 5 Kambe E., Osaki Y. 1988, PASJ 40, 313 Kennelly E.J., Walker G.A.H., Merryfield W.J. 1992 ApJ 400, L71 Kennelly E.J., et al. 1998, ApJ in press Kilian J., Nissen PE. 1989, A&A Suppl. Series 80, 255 Lee U., Jeffery C.S., Saio H. 1992, MNRAS 254,185 Lub J., Pel J.W. 1977, A&A 54,137 Roberts D.H., Lehar J., Dreher J.W. 1987, AJ 93, 968 Schrijvers C, Telting J.H., Aerts C , Ruymaekers E., Henrichs H.F. 1997, A&A Suppl. Series 121,
343 (Chapter 2) Schrijvers, C, Telting, J.H., 1999, A&A, 342,453 (Chapter 5) Slettebak A., Collins G.W., Boyce P.B., White N.M., Parkinson T.D. 1975, ApJ Suppl. Series 281,
29,137 Smith M.A. 1986, ApJ 304, 728 Telting J.H., Schrijvers C. 1997a, A&A 317, 723 (Chapter 3) Telting J.H., Schrijvers C 1997b, A&A 317, 742 (Chapter 4) Telting J.H., Aerts C , Mathias P. 1997, A&A 322, 493 Townsend, R.H.D. 1998, submitted to MNRAS Vogt S.S., Penrod G.D. 1983, ApJ 275, 661
217

Chapter 9. A new bright 3 Cephei star: „•' Scorpii
218