uva-dare (digital academic repository) the ... dth epinea lglan dwa sablate db ysuction .th esquar...
TRANSCRIPT
UvA-DARE is a service provided by the library of the University of Amsterdam (http://dare.uva.nl)
UvA-DARE (Digital Academic Repository)
The suprachiasmatic nucleus generated rythm in blood glucose. A role for theautomatic nervous systemla Fleur, S.E.
Link to publication
Citation for published version (APA):la Fleur, S. E. (2001). The suprachiasmatic nucleus generated rythm in blood glucose. A role for the automaticnervous system
General rightsIt is not permitted to download or to forward/distribute the text or part of it without the consent of the author(s) and/or copyright holder(s),other than for strictly personal, individual use, unless the work is under an open content license (like Creative Commons).
Disclaimer/Complaints regulationsIf you believe that digital publication of certain material infringes any of your rights or (privacy) interests, please let the Library know, statingyour reasons. In case of a legitimate complaint, the Library will make the material inaccessible and/or remove it from the website. Please Askthe Library: http://uba.uva.nl/en/contact, or a letter to: Library of the University of Amsterdam, Secretariat, Singel 425, 1012 WP Amsterdam,The Netherlands. You will be contacted as soon as possible.
Download date: 19 Aug 2018

CHAPTERR 6
RoleRole for the pineal and melatonin in glucose homeostasis: pinealectomypinealectomy increases night-time concentrations
Susannee E. la Fleur, Andries Kalsbeek, Joke Wortel, Jan van der Vliet and Ruud M. Buijs
Submitted Submitted
Abstract t
Thee effects of melatonin on glucose metabolism are far from under-stood.. In rats, the biological clock generates a 24h-rhythm in plasma glucosee concentrations, with declining concentrations in the dark pe-riod.. We hypothesized that, in the rat melatonin enhances the dark sig-nall of the biological clock, decreasing glucose concentrations in the darkk period. We measured 24h-rhythms of plasma concentrations of glucosee and insulin in pinealectomized rats fed ad libitum with and withoutt melatonin-treatment and compared them with data of intact ratss fed ad libitum. Pinealectomy abolished the nocturnal decline in plasmaa glucose concentrations, resulting in increased 24h-mean plasma glucosee concentrations, while plasma insulin concentrations did not change.. These findings suggest a decreased insulin sensitivity. Mela-toninn replacement restored 24h-mean plasma glucose concentrations inn pinealectomized rats, but interestingly it did not restore the 24h-rhythm.. Melatonin treatment also resulted in higher meal-induced in-sulinn responses, probably mediated via an increased sensitivity of the P-cells.. Taken together, our data demonstrate that the pineal hormone melatonin,, influences both glucose metabolism and insulin secretion fromm the pancreatic P-cell. The present paper also demonstrates that removall of the pineal gland cannot be compensated by mimicking plasmaa melatonin concentrations only.
79 9

CHAPTERR 6
Introduction n
Inn mammals, circadian rhythms are generated by the biological clock, located in the su-
prachiasmaticc nucleus of the hypothalamus (SCN)176. Recently, we have shown that the
SCNN generates a 24-h rhythm in plasma glucose concentrations in the rat, which is inde-
pendentt from the SCN generated rhythm in feeding activity. Plasma glucose concentra-
tionss rise towards the end of the light period just before awakening and the onset of the
rats'' main activity period and then decrease again during the dark period106. Time infor-
mationn from the SCN is transmitted to the rest of the organism by way of SCN projec-
tionss to neuronal, neuroendocrine and autonomic hypothalamic output centers. One of
thee best known SCN output signals is the pineal hormone melatonin. Effects of mela-
toninn on glucose metabolism have been suggested for both humans199 and rodents4,51,
butt the exact mechanism of its actions has not yet been identified. It is thought that me-
latoninn acts directly on its target cells, e.g. hepatocytes and pancreatic (3-cells1,14\ which
aree known to contain melatonin-binding elements. It is also possible that melatonin in-
fluencesfluences glucose metabolism via its modulatory action on SCN activity125. The data con-
cerningg the effects of melatonin on glucose metabolism in rodents are rather contradic-
tory.. Removal of the endogenous source of melatonin in rodents, i.e. pinealectomy, causes
aa decrease in hepatic and muscular glycogenesis128, it increases plasma concentrations of
glucosee and glucagon, and decreases insulin concentrations52, it exacerbates
hyperglycemiaa to an alloxan treatment42 and recently, it has been suggested that
pinealectomyy causes glucose intolerance and impairs insulin secretion and action119.
However,, the effects of melatonin administration are less clear, i.e. some studies have
suggestedd that it has no effect on insulin release and glucose metabolism10,60, whereas
otherss have described either an inhibitory4 or a stimulatory74 effect. A possible reason
forr these different results is that experiments were executed at different time-points of
thee day/night-cycle. Many investigators focus on one time point in the light/dark-cycle
orr execute their experiments during the light phase only10,42,52,'19,12S, while melatonin is
releasedd during the dark period.
Inn our view the main (circadian) function of melatonin in rats is to enhance the dark
signall of the SCN, through a combination of inhibition of the firing rate of SCN neu-
rons1255 and peripheral effects. As one function of the SCN is to lower night-time glucose
concentrationss in the rat106, we hypothesized that removing the pineal gland, and thus
thee source of melatonin, results in higher plasma glucose concentrations during the dark
period.. Therefore, we measured 24h-profiles of plasma concentrations of glucose and
insulinn in pinealectomized (PNx) rats. As melatonin modulates the SCN, which in turn
alsoo generates a daily rhythm in feeding behavior, changes in the 24h-rhythm in plasma
glucosee concentrations may result from indirect effects of melatonin on the daily rhythm
inn feeding behavior. To suppress the influence of the SCN on feeding behavior, we exam-
inedd 24h-prof!les of plasma concentrations of glucose and insulin in PNx rats and in
80 0

PINEALECTOMY Y
melatonin-treatedd PNx rats that were subjected to a scheduled feeding regimen with six
identicall meals equally distributed over the light/dark-cycle.
Materialss and methods
AnimalsAnimals and Food Intake
Malee Wistar rats (Harlan) were used in all experiments. Rats were housed in separate cagess (35 x 35 x 40 cm) at a room temperature of 20 °C, on a 12h/12h light-dark regimen (lightss on at 5.00 PM). For experiment 2&3, rats were entrained to a feeding schedule. Foodd pellets were available in metal food hoppers. A rat could gnaw off pieces of food throughh vertical stainless steel bars situated at the front of the food hopper. Access to the foodd could be prevented by a sliding door situated in front of the food hopper. Door openingg and door closing were activated by an electrical motor and controlled by a clock. Duringg all experiments, water was available ad libitum. All experiments were performed inn the rat's home cage. All experiments were conducted under the approval of the Local Animall Care Committee.
Pinealectomy Pinealectomy
Eighteenn rats (175-190 gr) were anesthetized with Hypnorm® (0.04ml/100 gr, i.m.; Janssenn Pharmaceutical Ltd., Oxford, England) and Dormicum® (0.08 ml/100 gr, s.c; Rochee Nederland B.V., Mijdrecht, The Netherlands). A square section of bone covering thee sinus confluence was removed. With a sharp needle, an incision was made in the duraa mater next to the sinus confluence. The tip of a suction tube was inserted under the sinuss and the pineal gland was ablated by suction. The square section of bone was placed backk in its original position and fixed with tissue glue. Buprenorphine hydrochloride (Temgesic®)) (0.03 ml/100 gr, s.c; Schering-Plow, Amstelveen, The Netherlands) was given forr pain relief. When their body weight had reached 250 gr, blood was withdrawn from thee tail vein at ZT 17 (when melatonin levels are normally high) and plasma melatonin concentrationss were measured. Those rats that showed plasma melatonin concentra-tionss > 25 pg/ml were considered to be not totally pinealectomized. Three rats that showed normall concentrations of plasma melatonin were excluded from the experiment.
FirstFirst experiment
Ann intra-atrial silicone catheter was implanted through the right jugular vein according
too the method of Steffens174 in six PNx rats that were fed ad libitum when their body
weightt had reached 300gr. After surgery, the animals were given two weeks to recover.
Duringg the experiments, the animals were connected permanently to the blood-sam-
plingg catheter which was attached to a metal collar and kept out of reach of the rats by
meanss of a counterbalanced beam. This allowed all manipulations to be carried out out-
81 1
CHAPTERR 6
sidee the cages without the need to handle the animal. The complete circadian profile of
plasmaa concentrations of glucose and insulin were determined by taking 0.2 ml of blood
oncee every hour for 12 consecutive hours on 2 different occasions within a period of 2
weeks.. The 2 runs started at ZT6.5 and ZT18.5.
SecondSecond experiment
Sixx PNx rats were entrained to a feeding schedule of six, 10-min-meals spaced equally
overr the light/dark-cycle. Food became available at ZT2, ZT6, ZT10, ZT14, ZT18 and
ZT22.. Rats had two weeks to adapt to this feeding schedule. Adaptation was considered
completee when rats had learned to consume 3.5 gr during every meal. Rats adapted
readilyy to this feeding schedule and resumed growth (2.5 gr/day). A jugular vein cath-
eterr was implanted and after two weeks of recovery, the complete circadian profile of
plasmaa concentrations of glucose, insulin and corticosterone was determined by taking
0.22 ml of blood once every hour for 12 consecutive hours on 2 different occasions within
aa period of 2 weeks. The 2 runs started at ZT6.5 and ZT18.5.
ThirdThird experiment
Fivee PNx rats were entrained to the same feeding schedule as described above. After one
weekk of adapting to the feeding schedule, PNx rats received melatonin (100 ng/ml)
throughh their drinking water from ZT15.5 until ZT23.5 (during the remaining hours
normall water was available) every day until the end of the experiment. One week later a
jugularr vein catheter was implanted and the rats were allowed to recover for two weeks.
Thee complete circadian profiles of plasma concentrations of glucose, insulin and corti-
costeronee were determined as described for the first two experiments. To verify whether
drinkingg a melatonin solution resulted in high plasma melatonin concentrations 1 ml
bloodd was taken at ZT 1, ZT 14.5, ZT 16 and at ZT 21.5 one week after the final experi-
ment. .
Melatonin Melatonin
Crystallinee melatonin (Sigma, St. Louis, MO) was dissolved in absolute alcohol (and
storedd at -20° C). This solution was subsequently diluted with water to a final concentra-
tionn of 100 ng/ml melatonin in 0.1% alcohol solution. Melatonin solutions were freshly
preparedd every morning.
AnalyticalAnalytical methods
Bloodd samples were immediately chilled at 0 °C and centrifuged at 4 °C, and the plasma
wass stored at -20 °C until analysis. The plasma glucose concentrations were determined
usingg a Glucose/GOD-Perid method (Boehringer Mannheim, GmBH, Germany). Plasma
immunoreactivee insulin concentrations in experiment 1 were determined with a radio
82 2

PINEALECTOMY Y
immunoassayy kit (ICN Biochemicals, Costa Mesa, CA, USA) and in experiment 2 and 3 withh a different radio immuno-assay kit (Linco Research, St. Charles, MO). Since the plasmaa controls used in these radio-immuno assays were not the same, insulin concen-trationss of experiment 1 may not be compared with those of experiment 2 and 3. The sampless were measured in duplicate. The lower limi t of the assay was 10 jlU/ml and the coefficientt of variation of the immunoassay was < 8%. Plasma corticosterone concen-trationss were determined with a radio immuno-assay kit (ICN Biomedicals, Costa Mesa, CA);; samples were measured in duplicate. From the samples, 10 MJ was taken and diluted inn 4 ml of assay buffer. The lower limit of the assay was 1 ng/ml and the coefficient of variationn of the immunoassay was < 4%. Plasma melatonin concentrations were meas-uredd in duplicate by radio immunoassay (RIA) using (125I) melatonin (Amersham Bucks.,UK;; specific activity 2,000 Ci/mmol) and a rabbit antiserum (AB/R/03, Stockgrandd Ltd., Guilford, UK) at a final dilution of 1:160,000. Stock melatonin (Sigma Chemicals)) was stored at a concentration of 1 mg/ml. Melatonin was extracted from plasmaa samples (250 JLÜ.) in 5 ml dichloromethane and dried by vacuum evaporation. Next,, samples were reconstituted in 150 (il assay buffer and two 50 |ul aliquots were taken forr assay. Standards were diluted in assay buffer to give a range of dilutions from 0.5 to 2000 pg/ml. The minimum detection level for the assay was 10-15 pg/ml plasma.
ComparisonComparison with previous data
Wee were able to compare plasma concentrations of glucose, insulin and corticosterone
inn PNx rats with those in intact rats that we have published previously106, because the
experimentss in PNx rats were performed with similar experimental procedures and un-
derr similar conditions as for those in intact rats (i.e. same source of animals and food,
samee experimental room, same experimenter). Plasma concentrations of glucose, insu-
linn and corticosterone in PNx rats and in intact rats were measured with similar analysis
methods;; the inter-assay variations were respectively < 2.5%, <8% and < 5%. The plasma
insulinn concentrations in PNx rats subjected to a scheduled feeding regimen were deter-
minedd with a analysis method from a different company (Linco Research, St. Charles,
MOO instead of ICN Biochemicals, Costa Mesa, CA). However, the data from both PNx
ratss and intact rats maybe compared because the inter-assay variation (comparing meth-
odss of the two companies) was <7%.
Recentt measurements (unpublished results from 2000) and measurements from 1998l06
illustratee the remarkable stability of the plasma concentrations of glucose and insulin in
intactt rats subjected to a scheduled feeding regimen, i.e. no significant differences were
detected106.. Furthermore, for the daily rhythm in plasma corticosterone concentrations
inn intact rats we demonstrated a similar stability comparing data from 1992 with those
fromm 199593. Thus, over the years the control values remain stable as measured in our
experimentss and we, therefore, believe we are justified in using historical data. Concen-
83 3

CHAPTERR 6
trationss of glucose, insulin and corticosterone of intact rats from the previous study106
aree shown as gray background in the figures, and these data sets were used for statistical
analysis. .
DataData analysis
Plasmaa concentrations of glucose, insulin and corticosterone were expressed as mean
SEM.. Statistical analysis was conducted using a repeated-measures analysis of variance
(ANOVA)) to test for an effect of time. If ANOVA detected a significant effect of time,
pairedd t-tests were used to detect differences between peak and trough values. In addi-
tion,, a single cosinor analysis was performed, using the fundamental period (24 h) for
thee individual sets of data points. The statistical significance of the cosine fit is expressed
ass F statistic. The fitted function is defined by its mesor (rhythm-adjusted mean), ampli-
tudee (50% of the difference between the maximum and the minimum), and acrophase
(timee of the maximum). The software package Table-Curve (Jandel Scientific GmbH,
Erkrath,, Germany) was used for fitting cosine functions to the data. ANOVA and the
Student'ss t-test were used to detect significant differences between intact rats and PNx
rats.. For the ANOVA and (paired) t-tests, p<0.05 was considered to be a significant
difference. .
Results s
GrowthGrowth profiles, food and water intake in PNx rats
Thee growth patterns of PNx rats in all three experiments were comparable to those of
intactt rats. In between the pinealectomy and the jugular vein implantation, the average
dailyy growth rate was 3.7 0.3 gr; this rate was not significant different from that of
intactt rats (3.8 0.4 gr; p>0.05). The body weights of PNx rats and intact rats at the
beginningg of the experiments were not significantly different (PNx: 334 gr 3; intact
3388 gr 4). PNx rats had no difficulties adapting to the scheduled feeding regimen (Ex-
perimentt 2&3), but PNx rats (with and without melatonin treatment) consumed smaller
amountss of food as compared to intact rats in our previous study, respectively 2.7 0.2
gr/meall and 3.3 0.1 gr/meal (p<0.01), however their growth rates were not signifi-
cantlyy different (PNx: 2.5 gr/day 0.2; intact: 2.7 gr/day 0.2, p>0.06)). Under ad libi-
tumtum feeding conditions food intake of PNx rats (experiment 1) was similar to that of
intactt rats (respectively 21.2 1.1 gr/24h and 20.1 1.0gr/24h (p>0.05)).
PlasmaPlasma concentrations of glucose and insulin in PNx rats on ad libitum feeding
Fig.. 1 shows the daily variation in plasma glucose concentrations in PNx rats as well as in
intactt rats (in grey106). Plasma glucose concentrations in PNx rats fed ad libitum showed
84 4

PINEALECTOMY Y
9rr A
o o E E
<D D <n <n O O o o _g g O O
jj ^ K
ii i
1000 r B
E E
3 3 75 5
.EE 50 3 3
C C
25 5
Lx.lA A V / ~
12 2
ZTT (hours)
16 6 20 0 24 4
Fig.. 1 Plasma glucose concentrations (A) and plasma insulin concentrations (B) across the light/ dark-cyclee in PNx rats (n = 6) fed ad libitum. The black bars indicate the night-time. The gray areass indicate the plasma glucose concentrations (A) and plasma insulin concentrations (B) in intactt rats as measured in our previous study106.
significantt fluctuations over the light/dark-cycle (ANOVA, F(23,93)= 3.4, p<0.001). Sets off data points of all rats could be fitted with the single cosinor analysis so that the fitted curvee was not significantly different from the curve of the individual rat (Table 1). The amplitudee of the rhythm in PNx rats was significantly smaller as compared to that in intactt rats and the peak of the rhythm occurred later than the peak in intact rats (Table 1).. Statistical analysis of 24h-profiles of plasma glucose concentrations indicated that thosee of PNx rats and intact rats differed significantly and that plasma glucose concen-trationss in PNx rats were significantly higher than those in intact rats (7.1 mmol/1 0.1 inn PNx rats vs. 6.3 mmol/1 0.1 in intact rats). ANOVA detected a significant effect of timee (F(22,264)= 8,2,p<0.001), of 'group x time' (F(22,253)= 0.7,p<0.001) and of group (F(l , l l )=47,p<< 0.001).
85 5
CHAPTERR 6
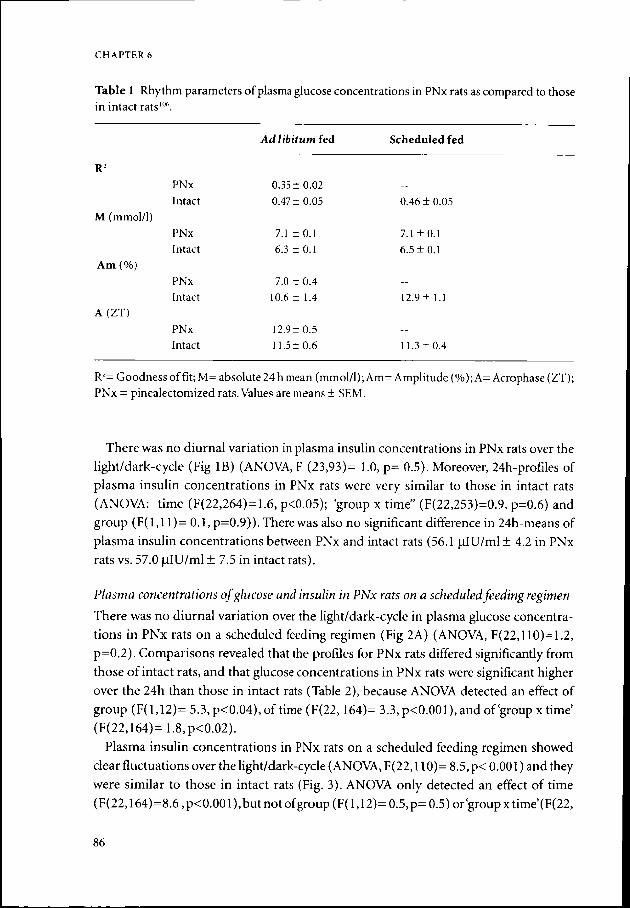
Tablee 1 Rhythm parameters of plasma glucose concentrations in PNx rats as compared to those inn intact rats106.
AdAd libitum fed Scheduled fed
MM (mmol/1)
Amm (%)
A(ZT) )
PNx x Intact t
PNx x Intact t
PNx x Intact t
PNx x Intact t
0.355 2 0.47++ 0.05
7.11 1 6.33 1
7.00 0.4 10.66 1.4
12.99 5 6 6
--0.466 0.05
7.11 + 0.1 6.510.1 1
---12.9 1.1
--11.33 4
RJ== Goodness of fit; M= absolute 24 h mean (mmol/1); Am= Amplitude (%); A= Acrophase (ZT); PNxx = pinealectomized rats. Values are means SEM.
Theree was no diurnal variation in plasma insulin concentrations in PNx rats over the light/dark-cyclee (Fig IB) (ANOVA, F (23,93)- 1.0, p= 0.5). Moreover, 24h-profiles of plasmaa insulin concentrations in PNx rats were very similar to those in intact rats (ANOVA:: time (F(22,264)=1.6, p<0.05); group x time" (F(22,253)=0.9, p=0.6) and groupp (F(l,l 1)= 0.1, p=0.9)). There was also no significant difference in 24h-means of plasmaa insulin concentrations between PNx and intact rats (56.1 u,IU/ml 4.2 in PNx ratss vs. 57.0 jiIU/ml 7.5 in intact rats).
PlasmaPlasma concentrations of glucose and insulin in PNx rats on a scheduled feeding regimen
Theree was no diurnal variation over the light/dark-cycle in plasma glucose concentra-
tionss in PNx rats on a scheduled feeding regimen (Fig 2A) (ANOVA, F(22,110)=1.2,
p=0.2).. Comparisons revealed that the profiles for PNx rats differed significantly from
thosee of intact rats, and that glucose concentrations in PNx rats were significant higher
overr the 24h than those in intact rats (Table 2), because ANOVA detected an effect of
groupp (F(l,12)= 5.3, p<0.04), of time (F(22,164)= 3.3,p<0.001),andof 'group xtime'
(F(22,164)=1.8,p<0.02). .
Plasmaa insulin concentrations in PNx rats on a scheduled feeding regimen showed
clearr fluctuations over the light/dark-cycle (ANOVA, F(22,l 10)= 8.5,p< 0.001) and they
weree similar to those in intact rats (Fig. 3). ANOVA only detected an effect of time
(F(22,164)=8.6,p<0.001),butnotofgroup(F(l,12)=0.5,p=0.5)or'groupxtime'(F(22, ,
86 6

P1NEALECTOMY Y
O O E E E ^ CD D <n <n O O ü ü _2 2 O O
A/*W\ \
i i
ZTT (hours)
Fig.. 2 Plasma glucose concentrations across the light/dark-cycle under scheduled feeding con-ditionss in (A) PNx rats ( , n = 6) and in (B) melatonin-treated PNx rats ( o, n=5). The black bars indicatee the night-time. The gray areas indicate the plasma glucose concentrations in intact rats as measuredd in our previous study106. The straight line (B) indicates the plasma glucose concentra-tionss in PNx rats, the same as depicted in (A)
Tablee 2 24h-mean plasma concentrations of glucose and insulin in intact rats and PNx rats on a scheduledd feeding regimen with and without melatonin
Intact t PNx x PNxx + mel
Glucosee (mmol/1) Insulinn (ulU/ml)
6.55 1 1111 6
7.11 + 0.1*t 1066 4
6.66 0.1 1522 16*$
++ mel = melatonin treated, * P< 0.01 for comparison with intact rats, t P< 0.02 for comparison with "PNxx rats + mel", $ P< 0.001 for comparison with intact rats
87 7

CHAPTERR 6
250 0
200 0
150 0
100 0
E E 5 5
/V/-4--AA.-.,,-A A
250 250
200 200
150 0
100 0
122 16
ZTT (hours)
20 0
Fig.. 3 Plasma insulin concentrations across the light/dark-cycle under scheduled feeding condi-tionss in (A) PNx rats ( , n = 6) and in (B) melatonin-treated PNx rats ( o , n=5). The black bars indicatee the night-time. The gray areas indicate the plasma insulin concentrations in intact rats as measuredd in our previous study106. The straight line (B) indicates the plasma insulin concentra-tionss in PNx rats, the same as depicted in (A)
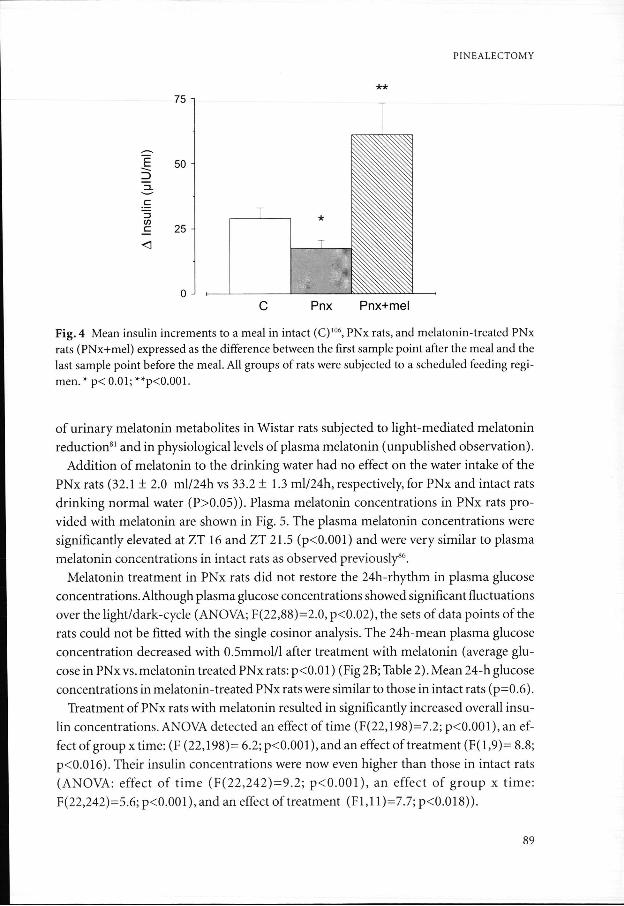
164)== 1.3, p= 0.15). Insulin concentrations rose after most meals in PNx rats. This in-creasee in insulin (expressed as the difference with the last sample point before a meal) reachedd significance for ZT 2,10 and 22 (p<0.05). Mean insulin increments in PNx rats weree significantly lower as compared to those in intact rats (p<0.01) (Fig 4).
MelatoninMelatonin treatment in PNx rats on scheduled feeding regimen
Wee wanted to mimic normal levels of plasma melatonin during the dark period. We, therefore,, chose to provide melatonin in the drinking water in a 100 ng/ml concentra-tions,, since experiments showed that this concentration resulted in physiological levels
PINEALECTOMY Y
** * 75 5
.££ 50 -
C C
00 - . CC Pnx Pnx+mel
Fig.. 4 Mean insulin increments to a meal in intact (C)106, PNx rats, and melatonin-treated PNx ratss (PNx+mel) expressed as the difference between the first sample point after the meal and the lastt sample point before the meal. All groups of rats were subjected to a scheduled feeding regi-men.. * p< 0.01; **p<0.001.
off urinary melatonin metabolites in Wistar rats subjected to light-mediated melatonin reduction811 and in physiological levels of plasma melatonin (unpublished observation).
Additionn of melatonin to the drinking water had no effect on the water intake of the PNxx rats (32.1 2.0 ml/24h vs 33.2 1.3 ml/24h, respectively, for PNx and intact rats drinkingg normal water (P>0.05)). Plasma melatonin concentrations in PNx rats pro-videdd with melatonin are shown in Fig. 5. The plasma melatonin concentrations were significantlyy elevated at ZT 16 and ZT 21.5 (p<0.001) and were very similar to plasma melatoninn concentrations in intact rats as observed previously86.
Melatoninn treatment in PNx rats did not restore the 24h-rhythm in plasma glucose concentrations.. Although plasma glucose concentrations showed significant fluctuations overr the light/dark-cycle (ANOVA; F(22,88)=2.0, p<0.02), the sets of data points of the ratss could not be fitted with the single cosinor analysis. The 24h-mean plasma glucose concentrationn decreased with 0.5mmol/l after treatment with melatonin (average glu-cosee in PNx vs. melatonin treated PNx rats: p<0.01) (Fig 2B; Table 2). Mean 24-h glucose concentrationss in melatonin-treated PNx rats were similar to those in intact rats (p=0.6).
Treatmentt of PNx rats with melatonin resulted in significantly increased overall insu-linn concentrations. ANOVA detected an effect of time (F(22,198)=7.2; p<0.001),an ef-fectt of group x time: (F (22,198)= 6.2; p<0.001), and an effect of treatment (F( 1,9)= 8.8; p<0.016).. Their insulin concentrations were now even higher than those in intact rats (ANOVA:: effect of time (F(22,242)=9.2; p<0.001), an effect of group x time: F(22,242)=5.6;p<0.001),, and an effect of treatment (Fl,ll)=7.7;p<0.018)).
89 9

CHAPTERR 6
O) ) Q. .
soo r
40 0
30 0
SS 20
10 0
12 2 16 6 20 0
ZTT (hours)
Fig.55 Plasma melatonin concentrations in PNx rats during the first experiment ( o ) and second experimentt ( o ) and in melatonin-treated PNx rats ( ). The gray area indicates the plasma melatoninn concentrations in intact rats as measured in a previous study86.
Forr melatonin-treated PNx rats, insulin increments after a meal reached significance forr ZT 2,14,18 and 22 (p<0.05). Insulin increments after a meal in melatonin treated PNxx rats were significantly higher than those in PNx rats (p<0.02) and in intact rats (p<0.01). .
PlasmaPlasma corticosterone concentrations in PNx rats subjected to a scheduled feeding regimen
Ass changes in plasma corticosterone concentrations influence glucose metabolism,
changess in the 24h-rhythm in plasma glucose concentrations may result from indirect
effectss of pinealectomy on the 24h-rhythm in plasma corticosterone concentrations.
Therefore,, plasma corticosterone concentrations were measured in PNx rats subjected
too a scheduled feeding regimen. They showed a clear 24h-rhythm in plasma corticoster-
onee concentrations (Fig. 6). This rhythm did not differ from the one observed previ-
ouslyy in intact rats106.
Discussion n
Thee present data provide evidence that removal of the pineal gland dampens the ampli-tudee of the 24h-rhythm in plasma glucose concentrations in rats fed ad libitum,but abol-ishedd it completely in rats subjected to a scheduled feeding regimen. Most importantly, pinealectomyy increased plasma glucose concentrations at the end of the dark period irrespectivee of whether rats were fed ad libitum or subjected to a scheduled feeding regi-men.. The higher glucose concentrations confirm previous observations52,12S and appeared
90 0

PINEALECTOMY Y
CT> CT>
c c <D D C C
e e 03 3 "co o O O o o
' t t o o O O
150 0
M ii j
ZTT (hours)
Fig.. 6 Plasma corticosterone concentrations across the light/dark-cycle under scheduled feed-ingg conditions in PNx rats (n = 6). The black bars indicate the night-time. The gray area indicates thee plasma corticosterone concentrations in intact rats as measured in our previous study106.
nott to have resulted from a higher food intake, because we did not find effects of pinealectomyy on the total amount of food consumed when rats were fed ad libitum. These findingss are consistent with the results of previous studies reporting no effects of pinealectomyy on the rhythm of food intake or the amount of food intake155186. In addi-tion,, we observed that PNx rats subjected to the scheduled feeding regimen consumed smallerr meals than intact rats. The increased plasma glucose concentrations, especially duringg the dark period and the early light period, led to a strong dampening of the 24h-rhythm.. Removal of a second time cue, i.e. the nocturnal feeding rhythm, completely abolishedd the endogenous rhythmm in plasma glucose concentrations. This appeared not too be the result of a general disturbed rhythm in PNx rats, as a clear 24h-rhythm in corticosteronee concentrations was observed in PNx rats (Fig 6) and there was also no disturbancee in their rhythm in locomotor activity or food intake155'186.
Measuringg the glucose concentrations over a period of 24-hours enabled us to provide aa more detailed description of the effects of pinealectomy on plasma glucose concentra-tionss than previous studies42,52. An increase of the average glucose concentrations may havee resulted from decreased insulin concentrations after pinealectomy. However, we didd not find an effect of pinealectomy on insulin concentrations under both ad libitum
feedingg conditions and scheduled feeding conditions. Therefore, the higher glucose con-centrationss together with the unchanged insulin concentrations suggests a decreased glucosee tolerance after pinealectomy as a result of an increased insulin insensitivity. This iss supported by the study of Lima and colleagues, who showed a reduced insulin action afterr pinealectomy and observed a down regulation of the GLUT-4 transporter, which is
91 1

CHAPTERR 6
ann insulin-dependent glucose transporter'19. In addition, in PNx rats subjected to a sched-
uledd feeding regimen we also observed a decrease in insulin increments after a meal in
thee dark period as compared to those in intact rats in our previous study106, indicating
thatt pinealectomy also decreases the ability of the pancreas to respond to a meal. This
observationn is in agreement with the data of Lima and colleagues "9.
Too examine whether the observed changes in glucose metabolism were solely due to
thee lack of melatonin, we administered melatonin via the drinking water during the hours
thatt the pineal normally releases melatonin. This resulted in plasma melatonin concen-
trationss in PNx rats very much comparable to those described previously for intact rats
(Fig5,86)) purthermore, a different study showed that replacing melatonin via drinking wa-
terr restored urinary 6-sulphatoxymelatonin in Wistar rats subjected to a light-mediated
melatoninn reduction81. In the present study, a long-term replacement strategy was cho-
senn to enable a restoration of the down-regulated melatonin receptor, because melatonin
receptorss in the SCN appear to be down regulated after pinealectomy64.
Threee weeks of melatonin replacement did not restore the 24h-rhythm in plasma glu-
cosee concentrations. However, it did lower the 24h-mean concentrations to a level com-
parablee to those in intact rats106. This suggests that the underlying mechanisms respon-
siblee for these two effects may be different. The reduction in glucose concentrations may
bee explained by the higher meal-induced insulin increments observed after melatonin
replacement,, suggesting a much higher responsiveness of the pancreas. Indeed, meal-
inducedd insulin increments were significantly higher in melatonin-treated PNx rats.
However,, the elevation of meal-induced insulin was so pronounced that with a normal
tissuee sensitivity to insulin we would have expected a pronounced hypoglycemia. Ap-
parently,, melatonin replacement in PNx rats did not abolish the insulin insensitivity that
resultedd from the pinealectomy.
Whetherr the process of maintaining homeostasis, under influence of the exogenous
melatoninn in PNx rats, is regulated at the level of the central nervous system, for example
att the level of the SCN as was suggested by Shima and colleagues163, or at a peripheral
levell is as yet unclear. A peripheral regulation alone, i.e. melatonin binding to peripheral
organss including the liver1 and the P-cells in the pancreas145, is not likely since the effects
off pinealectomy, and melatonin replacement are not restricted to dark period, i.e. the
timee window in which melatonin is normally secreted. In addition, administration of
melatoninn to PNx rats did not result in restoration of the 24h-rhythm in plasma glucose
concentrations.. These effects may be due to changes in the central nervous system as a
consequencee of the relatively long period between the pinealectomy and the melatonin
administration.. Indeed, Peschke observed changes in the ventromedial hypothalamic
nucleuss (VMH) after pinealectomy144. It is not known whether these changes are tran-
sientt or permanent even after melatonin replacement. The VMH is known to be involved
inn glucose regulation by influencing the autonomic nervous system166. Also other central
92 2

PINEALECTOMY Y
sitess that influence the autonomic nervous system, for example in the hypothalamus and brainstem,, may be changed as a consequence of pinealectomy.
Thee observation that the rhythm in plasma glucose concentrations and the insulin insensitivityy in PNx rats were not restored following melatonin replacement, suggests thatt pinealectomy has more severe effects on the organism than only removing the source off melatonin. The pineal is richly innervated by the autonomic nervous system, and re-movingg the pineal may result in degeneration of neurons in the superior cervical ganglia thatt innervate the pineal gland. This may result in changes in the autonomic nervous systemm innervating other organs, and may modify the level of activity of the autonomic nervouss system33-34. The assumption that pinealectomy changes the autonomic nervous systemm is supported by the observation that melatonin treatment only partly reversed thee increments in heart rate observed in PNx rats72. In addition, the high insulin re-sponsess in melatonin-treated PNx rats may be explained by a change in the reactivity of thee parasympathetic nervous system that innervates the (3-cells of the pancreas. We ob-servedd elevated meal-induced insulin responses after all 6 meals, and not only during thee period melatonin was provided. This may only be explained assuming that mela-toninn acts indirectly on meal-induced insulin responses and that the autonomic nervous systemm is affected over the total 24 hours. In addition, in pancreatic islets maintained in vitroo melatonin reduces the insulin response to a glucose application146, suggesting that ourr finding of elevated insulin responses after melatonin treatment results from changes outsidee the pancreas. Further experiments are needed to clarify this issue.
Inn conclusion, the present study showed that pinealectomy prevents the nocturnal declinee in plasma glucose concentrations resulting in increased 24h-mean glucose con-centrations.. In addition, melatonin replacement in PNx rats restored 24h-mean glucose concentrations,, but did not restore the 24h-rhythm. As the 24h-mean insulin concentra-tionss did not change after pinealectomy our finding suggests an increased insensitivity too insulin. Melatonin treatment of PNx rats resulted in higher meal-induced insulin re-sponses,, suggesting an increased sensitivity of the (3-cells. These data suggest that the pineall hormone melatonin influences both glucose metabolism and the pancreatic p-cell.. However, other mechanisms also changed due to pinealectomy are probably respon-siblee for the disappearance of the 24h-rhythm in plasma glucose concentrations.
93 3
