Уважаеми съмишленици на идеята за устойчиво развитие,
TRANSCRIPT

CONTENTS FROM EDITORS ……………………………………………………………………………..………………….. 3
INNOVATION MODELLING METHODS USING FOR INVESTIGATION OF BEHAVIOUR OF REAL SOCIO-ECONOMICAL SYSTEMS …………………………………………………………………………….. Vitalijs Jurenoks, Vladimirs Jansons, Konstantins Didenko
4
A USER-ORIENTED FRAMEWORK FOR DESIGN OF WEB-BASED SUSTAINABLE DEVELOPMENT INFORMATION SYSTEMS ………………………………………………………………………………………Alexander Nikov, Shanaz Wahid, Koffka Khan, Alexi Danchev
8
RIDING THE SIXTH WAVE: RENEWABLE ENERGY AND NANOTECHNOLOGY PATENTS ………… Dora Marinova
12
PARTICIPATION OF MIGRANT WOMEN IN THE ENVIRONMENTAL MOVEMENT: THE NATURE OF FEMINIST VALUES …………………………………………………………………………………………. Silvia Lozeva, Dora Marinova
20
SERVICES FOR SUSTAINABLE FOREST TIMBER SUPPLY CHAIN PLANNING AND CONTROL: DEVELOPMENT, IMPLEMENTATION AND USAGE ……………………………………………………….. Mike Wasche, Ina Ehrhardt
28
COMPETENCE APPROACH IN EDUCATION OF MANAGERS …………………………………………… Alla Sorokina
34
THE IDEA OF SUSTAINABLE DEVELOPMENT AND HUMAN RESOURCES MANAGEMENT ………. Krystyna Kmiotek
39
PERSONNEL FUNCTION SOLUTIONS AS A TRIGGER OF EMPLOYEE SATISFACTION ……………. Dagmara Lewicka, Anna Wziatek-Stasko
45
DISCRIMINATION AT WORK – UNFORTUNATELY NOT ONLY IN THEORY …………………………. Dagmara Lewicka, Anna Wziatek-Stasko
52
HAZARDOUS WASTE INFLUENCE ON LATVIAN FORESTRY ECONOMIC RESULTS ………………. Nora Dubro, Anatoly Magidenko
59
MOST IMPORTANT FACTORS INFLUENCING ROAD TRAFFIC ACIDENTS AND EFFECTIVENESS OF PUBLIC INVESTMENTS IN ROAD TRAFFIC ACCIDENT REDUCTION PROJECTS IN LATVIA ….Liena Adamsone, Dace Parupa
67
IMPORTANCE OF GUARANTEED MARKET IN ESTABLISHMENT AND FUNCTIONING OF A CO-OPERATIVE INNOVATION SYSTEM ……………………………………………………………………..Andro Roos, Eve Tomson
74
REASONS FOR AND PREVENTION OF TAXI PIRACY IN ESTONIAN PUBLIC TRANSPORT ………..Meelis Tomson
79
ARE THE EARLY–WARNING METHODS USEFUL FOR PREDICTION OF ECONOMIC CRISIS OF POLISH STOCK-LISTED WOOD COMPANIES? (1) ………………………………………………………… Justyna Biernacka
85
ARE THE EARLY–WARNING METHODS USEFUL FOR PREDICTION OF ECONOMIC CRISIS OF POLISH STOCK-LISTED WOOD COMPANIES? (2) ………………………………………………………… Justyna Biernacka
88
ENTREPRENEURSHIP, INNOVATION AND BALANCED DEVELOPMENT ……………………………….Teresa Piecuch
92

EDUCATION AND SCIENCE RESEARCH IN THE FIELD OF FORESTRY IN POLAND ………………… Marcin Nawrot, Marek Szymanski
96
FOREST UTILIZATION IN CONTEXT OF SUSTAINABLE DEVELOPMENT OF SOME REGIONS …… Marek Szymanski, Marcin Nawrot
98
MANAGEMENT OF INDUSTRIAL SAFETY IN WOOD PROCESSING COMPANIES – SOCIAL AND ECONOMIC ASPECTS ………………………………………………………………………………………….. Kornelia Polek – Duraj
101
ACTIVITY BASED COSTING AND EFFICIENCY OF THEIR APPLICATION IN THE WOOD HOUSES PRODUCTION AS THE INSTRUMENT OF THE BUSSINESS PERFORMANCE INCREASING ……….. Rastislav Rajnoha
106
ECONOMIC VALUE ADDED AS PERFORMANCE MEASURE IN SLOVAC MANUFACTURERS ……. Jaroslava Kadarova, Rastislav Rajnoha, Jan Dobrovic
115
POSSIBILITIES OF USING STRUCTURAL FUNDS EU FOR SLOVAK ENTERPRISES ………………… Andrea Sujova, Jan Dobrovic
121
PROBLEMS IN FORMING OF COMMUNICATIVE FOREIGN LANGUAGE COMPETENCE OF STUDENTS-ECONOMISTS IN THE PROCESS OF PROFESSIONAL TRAINING ……………………….. Nataliya Razenkova
127
WORLD FINANCIAL CRISIS: CONSEQUENCES FOR THE CIS’S AGRIMARKET ………………………Olena Lytvyn
130
REMARKS ON THE ROLE OF TERRITORIAL MARKETING IN ECO-DEVELOPMENT OF RURAL COMMUNES ……………………………………………………………………………………………………… Lukasz Poplawski
134
SUSTAINABLE EDUCATIONAL ACTIONS FOR PRE-UNIVERSITY AND UNIVERSITY LEVELS IN IRAQ ………………………………………………………………………………………………………………. Alava Serafim, Nidal Shaban, Lisa Rodrigo, Eman Kadhum, Ali Michael
142
THE PLACE OF THE AGRARIAN SECTOR IN THE NATIONAL ECONOMY-VEGETABLE PRODUCTION ……………………………………………………………………………………………………. Eman Kadhum, Messar Tabit, Nidal Shaban
151
INNOVATION - AS A GROWTH FACTOR FOR THE COMPETITIVENESS OF ENTERPRISES IN A UNIFIED EUROPEAN MARKET …………………………………………………………………………………Tadeusz Trocikowski
158
TRANSLATING THE NAMES OF BULGARIAN UNIVERSITIES IN ENGLISH …………………………… Bilyana Ovcharova
167
KEYSHOP – PLATFORM FOR E-LEARNING, COLLABORATIVE WORK, KNOWLEDGE SHARING AND ELECTRONIC MATERIALS ……………………………………………………………………………… Mariya Monova-Zheleva, Yanislav Zhelev, Dimitar Minchev
171
УПРАВЛЕНИЕ РЕИНЖИНИРИНГОМ ПЕРСОНАЛА В ОРГАНИЗАЦИЯХ КАК ОСНОВА УСТОЙЧИВОГО РАЗВИТИЯ БИЗНЕСА ………………………………………………………………………Андрей Блинов, Ольга Рудакова
177
ПОДХОДЫ К ОПРЕДЕЛЕНИЮ ТЕХНИКО-ТЕХНОЛОГИЧЕСКОЙ СОСТАВЛЯЮЩЕЙ УСТОЙЧИВОГО РАЗВИТИЯ ОБЛАСТЕЙ УКРАИНЫ …………………………………………………….. Сергей Войтко
181

Dear followers of idea for sustainable development, Dear readers, Dear authors and friends,
You hold serial 23-th volume (number 2/2009) of scientific journal “Management and sustainable
development”, published since 1999 from Faculty of Business Management at the University of For-estry, Sofia, Bulgaria.
In this volume you can find the integral text of the part of presented papers before the XI-th In-ternational Scientific Conference “Management and Sustainable Development”, held in Yundola in the period 20-22.03.2009. From received for participation 238 aplications, with paper abstracts and post-ers in Conference took part 152 scientists, practical experts, post-graduate students from 32 universi-ties from Bulgaria, 7 universties from Europe, 3 scientific institutes of Bulgarian Academi of Science, 2 coleges, experts from State Agency of Forests at Ministry Council, 4 NGO’s and 5 enterprises. In 1 plenary and 4 parallel thematic sections were presented 86 scientific papers and 17 posters.
The important issues of management and sustainable development in an EU accession context were discussed. Some main aspects could been summarized as follows: multifunctional forest man-agement have to be developed and encouraged in Bulgarian forests, because of their high importance for environment improvement and biodiversity conservation, there are a high potential to encourage utilization of revenuwble energy sources, based on the forest biomass; contemporary practical and theoretical issues in human resources management; more attention have to be pointed out to the social aspects for sustainable management; presentation and implementation of the best practices and inno-vations; the practice for sustainable development shaping have to be reestablished; more atention have to be intended to the students and post-graduated students investigations; the more important issues have to be separated and have to be discussed into a suitable approach – for example, order of round tables, unformal discussions etc.; the all thematic fields have to be protected and the conference have to be approved as a forum for ideas exchange.
The Faculty of “Business Management” leadership and the Editorial Board of Scientific Journal “Management and Sustainable Development” have managed with the obligation to publish all presented before the Conference papers and posters, but in 3 volumes - 22, 23 and 24 (1/2009; 2/2009 and 3-4/2009) of the Journal. All papers and presentations could be find in the Internet site of the Confer-ence and of the Scientific Journal “Management and Sustainable Development” http://ltu.bg/conferences/uur/2009/index_en.html
In the same time we offer of all of you not only to read published papers. You could send to our journal results of your investigations, ideas and papers on the issues of management and sustainable development.
Kind regards of all our readers!
Editorial board
3

УПРАВЛЕНИЕ И УСТОЙЧИВО РАЗВИТИЕ 2/2009(23) MANAGEMENT AND SUSTAINABLE DEVELOPMENT 2/2009(23)
INNOVATION MODELLING METHODS USING FOR INVESTIGATION OF BEHAVIOUR
OF REAL SOCIO-ECONOMICAL SYSTEMS
Vitalijs Jurenoks, Vladimirs Jansons, Konstantins Didenko Riga Technical University, Latvia
Abstract
Economical researches using imitation statistical modelling methods have numerous challenges and opportu-
nities in the waiting for the twenty-first century, calling for increasing numbers of non-traditional statistical ap-proaches. Imitation statistical modelling is one of the most widespread methods of research of economic systems. Imitation modeling is usually applied for researching economic processes and systems. The selection of methods of modelling of the economic systems under consideration depends on a great number of conditions (modeling com-ponents), e.g. complexity of the system being researched: the character of behavior of the system; the character of behavior and the impact of the factors on the changes of the entity or economic system being investigated; other similar conditions. The method of imitation modelling allows developing (imitate) different scenarios of func-tioning of the investigated economic systems. Imitation modeling may be used for tackling a wide range of eco-nomic problems (design and analysis of industrial systems, stock management, balancing of production capacities, allocation of investment funds, optimization of investment funds, optimization of flows of services etc.). Imitation modeling is frequently associated with the factor of uncertainty, whose description goes outside the confines of the traditional statistical modeling, which, in its turn, complicates the imitation modeling process. However, most of the economic processes and systems are complex entities, consisting of a great number of interrelated sub-systems (which in their turn also are complex objects and require a detailed study), changing their positions in space and time. For researching such economic systems it is impossible to create an absolutely accurate effective model by applying analytical methods. In such cases it is necessary to use the methods of imitation modeling. In the process of imitation modelling the most frequently method used to model multivariate distribution incidental values is the parametric method of modelling. In this case it is necessary to establish parameters of common dis-tribution of incidental values characterizing the factors under consideration. Usually this is done by means of evaluation of parameters of multivariate distribution, i.e. by establishing the most suitable distribution (copula), deriving from the available empirical data. The main objectives of the paper are: to describe the main ideas of us-ing of imitation statistical modelling methods for investigation of economical systems; to describe imitation statis-tical modelling methods using for investigation of economical systems functioning process. Key words: innovation, imitation statistical modeling, economical systems, behavior
Traditional methods of imitation statistical mod-eling for investigation of economical systems
Using traditional methods of imitation statis-tical modelling for investigation of economical systems it is possible to set the task of creating an efficient procedure for generating incidental parameter values constituting factors of an imita-tion model, to consider the asymmetric distribu-tion of model factors, to create an adequate model of non-linear dependence between the factors, to effectively use up-to-date information technologies, to ensure continuous control of the behaviour of the specific economic system that is being researched. Fig. 1 presents a process of creation of an imitation model.
In economic systems models, where the re-lations between separate components forming the model are comparatively simple and can be accurately described (fig.1), analytical models can be used for obtaining the required informa-tion.
Fig. 1. Process of creation of an imitation model
4

Vitalijs Jurenoks, Vladimirs Jansons, Konstantins Didenko
The traditional scheme of imitation model-ling is the formation (generation) of a mass of incidental parameter values featuring the changes of model factors.
The algorithm of generation of incidental continuous value X, having continuous distribu-tion function F, can be described in the following steps:
1. Let us generate, within an interval (0.1), an evenly distributed incidental parame-ter u ~U(0.1).
2. Let us calculate X = F-1(u). The value of F-1(u) will always be definite,
since , but the area of defining the func-tion F is the interval [0,1]. The figure below pre-sents the essence of the algorithm graphically; here incidental value may be assumed to be ei-ther positive or negative. This depends on the specific value of parameter u. In the figure, the value of parameter u
10 << u
1 produces a negative inci-dental value X1, but parameter u2 yields a posi-tive incidental value X2.
Fig. 2. Scheme of reverse transformation The method of reverse transformation may
be also used if value X is discrete. In this case the distribution is as follows:
{ } ∑
≤
=≤=xx
ii
xpxXPxF )()( , (1)
where p(xi) is probability . { }ii xXPxp ==)( It is admitted that incidental parameter X
may have only such values as x1, x2, ..., for which x1 < x2 < ....
Thus the algorithm of developing the values of incidental parameter X will have the following consequences:
- Let us generate, within the interval (0.1), uniform distributed incidental pa-rameter u ~ U (0. 1);
- Let us establish the least positive round value I, for which u < F(xi), and assume that X=xi.
Both options of the method of the reverse transformation for continuous and discrete val-ues (at least formally) can be combined in one formula:
{ }UxFxPX ≥= )(:min , (2)
which is true also for mixed distributions
(i.e., containing both continuous and discrete components). In contrast to commonly used direct methods of generating incidental values (the method of the reverse transformation composition and implosion), for imitating the factors of the imitation model it is recommended to use the so-called indirect methods, namely, the acceptance-refusal method. This method may turn out to be suitable if due to certain reasons it is impossible to apply direct methods or if these methods are inefficient.
The “acceptance-refusal” principle is rather common. If the aforementioned algorithm is looked upon from a slightly different perspective, it is clear that it may be extended for generating incidental points in areas having higher dimen-sions – i.e. in multi-dimensional areas.
This is relevant in modeling real economic systems by applying the Monte Carlo method. When using the MS Excel program, users usually apply standard functions for modeling incidental parameter values in a dynamic regime. Example of stochastic modeling of industrial stock in nonlinear case
The purposes of modeling are: 1. To define an optimum strategy of up-
dating of industrial stocks and reduc-tions of the expenses connected to their storage;
2. To combine the modeling process with the real information describing the process of industrial stocks manage-ment in real time;
3. To take to account the nonlinearity de-pendences of factors of the model;
4. To construct the management process in online regime.
In the first scenario for incidental values modeling is used traditional methods, in particu-lar, the method of the reverse transformation the Bellman’s method (receipt-refusal). In the second scenario of modeling the authors have used
5

INNOVATION MODELLING METHODS USING FOR INVESTIGATION OF BEHAVIOUR OF …
modeling methods that allow to consider specific characteristics of changes of value P - order fre-quency (is measured as units of orders per unit of time), namely, irregularity of consumption in-tensity, different lengths of intervals between order points, inability to select an appropriate rule of distribution of value P for the whole mod-eling time interval.
For resolving the problem under given con-ditions, traditional methods of statistical model-ling was applied, which allows to develop (imi-tate) different options of organization of the process of stock management, taking into ac-count the specific characteristics of the particu-lar scenario. The above algorithm of optimization and calculation of order point is traditionally and most frequently used in real-time planning. In reality the function, from the point of view of order TCU (total cost per unit time), is to a great extent dependent on the value of P – frequency of orders. In order to consider this impact, the authors make an assumption about the incidental character of behavior of value P. Two modelling scenarios are considered: Given the value P, the rule of distribution is known as F, i.e. P~F (F – distribution function). There is the following in-terdependence:
),,,( 0 ωttPTCU Φ= , (3)
where: to – order cycle time (measured in units of time); t – modelling time; w – incidental parameter.
The rule of distribution of value P is not
known and it is necessary to model a different character of behavior of value P. In the first sce-nario there is a sufficiently well developed mathematical mechanism of modeling and it is necessary only to implement and analyze the data obtained to meet the goals of optimization. When modeling incidental values, traditional methods are applied; in particular, the method of the reverse transformation the Bellman’s method (receipt-refusal). For theoretical modelling the authors have used MS Excel and the special pro-grams for modelling. The analysis of the model-ing results allows to choose the most optimum dynamic mode of replenishing the stock, required raw materials and materials, as well as to mini-mize total costs TCU, i.e. to choose an optimum strategy for stock management in a stochastic case (the first modeling scenario). In the second
scenario of modeling the authors have used modeling methods that allow considering specific characteristics of changes of value P, namely, irregularity of consumption intensity, different lengths of intervals between order points, inabil-ity to select an appropriate rule of distribution of value P for the whole modeling time interval. The process of development and implementation of the imitation model implies the following simpli-fied algorithm (see fig. 3):
Fig. 3. Algorithm of the implementation of the second
scenario The modern economic analysis basing on
the using of information technologies shows that in the real systems the parameters describing the economic objects, not always have the Gauss distribution. The nonlinear dependence exists between various factors. In these cases it is im-possible to use the linear correlation coefficient for evaluation of measure of dependences be-tween factors. It requires using another method for evaluation the measure of dependences be-tween factors.
Conclusion
In our days, designing real economic sys-tems very much popular is becoming the use of copulas, which fully characterizes the nonlinear connection between main factors of the model and allows uniting margin functions into multi-variate distribution function.
6

Vitalijs Jurenoks, Vladimirs Jansons, Konstantins Didenko
The application of modelling is connected with the fact that frequently it is not possible to provide a definite description of the behaviour of the economic system being investigated. When investigating the dynamic behaviour of the eco-nomic system, i.e. by making definite changes of parameters of the system under investigation, we frequently observe the existence of incidental factors affecting the character of the behaviour of the system. In addition, it should not be for-gotten that the very character of the research also brings its incidental elements into the re-search process. The modelling process of eco-nomic system stability is implemented using a set of alternative strategies of economic system performance applying the dynamic programming and benchmarking method. The introduction of a set of alternative strategies supports stable func-tioning of economic system in the conditions of uncertainty.
Reference:
1. Jurenoks, V., Jansons, V., Didenko, K., Modelling of financial stability in logistics in conditions of uncertainty. 21-st European Conference on Model-ling and Simulation, Prague, Czech Republic, June 4 – 6, 2007.
2. Jurenoks V., Jansons V., Didenko K. Modelling of Stability of Economic Systems Using Benchmark-ing and Dynamic Programming X International Conference on Computer Modelling and Simula-
tion EUROSIM/UKSim Cambridge, United King-dom, 1-3 April, 2008.
3. Bellman, R., Some applications of the theory of dynamic programming to logistics, http://www3.interscience.wiley.com/cgi-bin/jhome/112693581, 11. Oct. 2006.
4. Jansons, V., Didenko, K., Jurenoks, V., Insurance as a tool for steady development of agriculture. VIII International scientific conference, Manage-ment and Sustainable Development Bulgaria, 2006.
5. Jurēnoks V., Jansons V. Stochastic modeling and optimization of industrial stock. 19th European Conference on Modelling and Simulation © ECMS, 2005, Rīga, Latvija. ISBN 1-84233-112-4(Set)/ ISBN 1-84233-113-2 (CD), 6 p.
6. Jurenoks, V., Jansons, V., Didenko, K., Modelling of multidimensional flows in logistics using non-parametric method. International Mediterranean Modelling Multikonference, Bergeggi, Italy, Octo-ber 4 – 6, 2007.
7. Lindskog F., “Modelling Dependence with Copu-las”, Master Thesis-MS-2000-06, Department of Mathematics, Royal Institute of Technology, Stockholm, Sweden, 2000.
8. Sklar, A., “Random variables, joint distributions, and copulas”, Kybernetica 9, 1973 – p.449-460.
9. Clemen, R. T., Reilly, T. Correlations and copulas for decision and risk analysis. Management Sci-ence, 1999, vol. 45, 208-224.
10. Embrechts, P., Lindskog, F., McNeil, A. Modelling dependence with copulas and applications to risk management. In: Handbook of Heavy Tailed Dis-tributions in Finance, Ed. E. Rachev, 2003. El-sevier, 329-384.
7

УПРАВЛЕНИЕ И УСТОЙЧИВО РАЗВИТИЕ 2/2009(23) MANAGEMENT AND SUSTAINABLE DEVELOPMENT 2/2009(23)
A USER-ORIENTED FRAMEWORK FOR DESIGN OF WEB-BASED SUSTAINABLE
DEVELOPMENT INFORMATION SYSTEMS
Alexander Nikov1, Shanaz Wahid1, Koffka Khan1, Alexi Danchev2 1 University of the West Indies, St. Augustine, Trinidad and Tobago (W.I.)
2 Fatih University, Istanbul, Turkey
Abstract A framework for user-oriented evaluation and design of web-based information systems for sustainable de-
velopment (ISSD) integrating usability, personalization and emotional aspects of ISSD is proposed. It supports sus-tainable development information processing towards a more comprehensive goal. For measuring ISSD usability a checklist is developed. Usability dimensions and checklist items are selected using computational intelligence model. The main advantage of the framework is the selection of most critical usability, personalization and emo-tion-oriented dimensions and items and thus supporting user-oriented design of ISSD.
Key words: sustainable development, information systems, evaluation and design, usability, personalization,
emotion-oriented computing
Introduction Information systems play a significant part
in the formation of the policy of sustainable de-velopment. They are used to support human ac-tivities towards sustainability in the following areas [1, 14, 21, 22, 17]:
- Economic Systems - Culture, society - Education, training - Agriculture - Industry - Trade - Transport - Finance, investment - Business, technology - Labour - Demography - Biology, food, health - Environment - Earth sciences User-oriented development of ISSD is a
relatively new area. It is used in many areas, for example [14], regarding web-based healthcare management institutional infrastructures, which are transforming the configuration of user-oriented services, clinical collaboration and deci-sion making, financial and administrative transac-tions, public health services, medical and other professional education and training, and research in medicine and all related activities. In these sectors, the active participation of consumers in the system is facilitated by user-oriented discus-sion and support groups for patients sharing common questions and problems.
Peteves [14] shows how telecommunica-tions and Internet with other information tech-nologies can contribute to interactive, integrated, and user-oriented services as well as equitable resource distribution depending upon forms of control and market ideologies. Usability chal-lenges represent a major barrier to widespread diffusion of ISSD, for example, with automobiles the industry has learnt to transform complex technologies into user-friendly systems, creating a need for similar innovations in computer-communication systems [3]. Usability of modern spatial systems is encouraging the collection of much more information and its availability. The map-mashing trend following Google Earth and other major international applications shows a high public take up and popularization of spatially enabled systems. Higher quality, more integrated and accessible information assists governments and other institutions to design and implement land policy. The services available to business and public sectors, and to community organiza-tions and citizens, are expected to improve con-siderably.
Ideally these processes are interrelated: with modern information and communication technology, the engagement of users in design of suitable services, and the adaptability of new applications mutually influencing each other [4]. The understanding that there is a positive rein-forcing relationship between sustainable devel-opment, geographical information systems (GIS) and development information has led a number of governments to increase budgets for GIS de-
8

Alexander Nikov, Shanaz Wahid, Koffka Khan, Alexi Danchev
partments at a local level. As a result the general usability and awareness of this technology is increasing [5].
Another example of ISSD usability is the community development process based on the idea of combining usability and sociability by constantly assessing and supporting community needs [7]. ISSD usability has good potential to integrate decision processes in the policy of sus-tainable development and its implementation [8].
Personalization or adaptivity is a system, which changes its own characteristics automati-cally according to user’s needs [9]. Web-based information systems can be adapted to their us-ers, providing improved personalization for the individuals. In the past few years the personal-ization through ISSD has become a significant trend in the museum world, where more and more institutions are introducing it to comple-ment their collections and to better out-reach their visitors [10].
Other examples of personalized ISSDs are personalization in eHealth information systems concerned with the negotiation of user require-ments and device abilities [11]. Personal Reader [12] supports constructing the user interface, mediating between user requests and currently available personalization web services, user modeling, and offering personalization functional-ity. Personal Reader architecture is providing the user with the possibility to select services, which provide different or extended functionality, e.g. different visualization or personalization services, and combine them into a Personal Reader in-stance. The cost-effective agricultural informa-tion dissemination system [13] is supporting the maximization of crop productivity by using per-sonalization.
Emotion is a key aspect in user experience since measuring emotions helps us understand the user’s engagement and motivation; that is how they are challenged, excited or interested [16]. The affective state of users can be meas-ured by using heuristics [17] resulting in the de-velopment, both cost-effectively and cross-culturally, of more efficient, effective and satis-fying ISSD. [20] introduces a tool that allows the collecting and aggregating of users’ physiological data, which could be applied taking into account the emotional dimension of human-computer in-teraction. This approach takes into consideration the design of affective interfaces and their as-sessment so will impact on the development of ISSD.
Taking into account the indicated above considerations we can sum up that usability, personalization and emotion-oriented develop-ment of ISSD is very important for the success-ful ISSD. Till now the few studies in this area are not comprehensive enough. Therefore in this pa-per we propose a framework for user-oriented evaluation and development of ISSD taking into account usability, personalization and emotional aspects of ISSD. Framework description
An ISSD is supposed to provide a founda-tion for supporting human activities and help us-ers focus on the work they are trying to accom-plish [1]. Two important questions should be an-swered [8]:
1. Which are the characteristics of ISSD-initiatives that are influencing the usabil-ity of ISSD in decision situations? and
2. Can we identify a key which allows read-ing and analyzing these characteristics, i.e. constructing the usability-profile of ISSD-processes, with respect to the con-figuration of the decision situation?
For solving these problems we propose a framework. The architecture is shown on Fig. 1 and its steps on Fig. 2.
Fig. 1. Framework architecture
For measuring the usability, personalization
and emotional (UPE) dimensions of ISSDs a checklist should be created (steps one and two). Step three includes collecting data from users
9

A USER-ORIENTED FRAMEWORK FOR DESIGN OF WEB-BASED SUSTAINABLE …
Data gathering from ISSD users
CI training
Determining dimensions of ISSD usability
Determining of UPE checklist items
Selection of most critical dimensions and items
Generation of ISSD design improvement measures
CI-based usability evaluation
7
6
5
4
3
2
1
Fig. 2. Framework steps
interacting with ISSD. At step four a computa-tional intelligence-based model (e.g. fuzzy logic, neural networks, swarm optimization, ant colony algorithms) [5, 18] is created. At step five, based on weighting coefficients determined by this model, personalization and emotion-oriented quantitative usability indices are determined. By means of these indices at step six the most criti-cal dimensions and checklist items to ISSD us-ability are defined. Depending on critical check-list items at step seven, relevant measures for improving ISSD usability are determined. With the implementation of the resulting improvement measures the personalization and emotion-oriented usability index would be maximized. Fi-nally, from the user viewpoint better ISSD are expected to be developed. Conclusions
As a result of our study a framework for usability evaluation and design of information systems for sustainable development is pro-posed. It includes a checklist and a computa-tional intelligence model for usability evaluation of information systems for sustainable develop-ment taking into account usability, personaliza-
tion and emotion-oriented dimensions of ISSD. Based on evaluation results the most important usability problems and relevant ISSD design im-provements for ISSD are determined.
The proposed framework can contribute significantly to ISSD improvement by [23]:
- Addressing Environmental Crises - Bringing Information to Life and Putting
It to Good Use - Enabling Collaborative Problem Solving - Democratizing Global Commerce and
Ensuring the Integrity of Markets - Broadening Access to Healthcare, Edu-
cation and Financial Services Such a framework can enhance product
strategies, product services and create roadmaps to identify potential ISSD usability issues that would result in reaching higher sustainability in many decisions.
References:
1. Bauler T. 2007. Indicators for Sustainable Devel-opment: A Discussion of their Usability, PhD the-sis, Université Libre de Bruxelles, Faculté des Sci-ences, Institut de Gestion de l’Environnement et d’Aménagement du Territoire, Accessed: 05 January, 2009, Available from Internet: http://theses.ulb.ac.be/ETD-db/collection/available/ULBetd-05102007-104144/unrestricted/tbauler-these_envi.pdf.
2. Baumgartner R., Enzil C., Henze N., et al.. 2005. Semantic Web Enabled Information Systems: Per-sonalized Views, In: Computational Science and Its Applications – ICCSA 2005, Lecture Notes in Computer Science, Berlin/Heidelberg: Springer-Verlag. pp. 988-997.
3. Chateau N., Mersiol M. 2006. AMUSE: A Tool for Evaluating Affective Interfaces. Workshop on In-novative Approaches for Evaluating Affective Sys-tems, Stockholm, January 9-11, 2006, Accessed: 05 January, 2009. Available from Internet: www.sics.se/~kia/evaluating_affective_interfaces/Chateau.pdf
4. Dabaghi E.F. 2005. AWIIS: An Adaptive Web-Integrated Information System for Water Re-sources Modelling and Management, ERCIM News, No. 61, pp. 33-34, Accessed: 05 January, 2009. Available from Internet: http://www.ercim.org/publication/Ercim_News/enw61/EN61.pdf.
5. Engelbrecht A. P. 2007. Computational Intelli-gence: An Introduction, Wiley.
6. Fantoni, F. S. 2002. Visiting with a personal touch: a guide to personalization in museums, Maastricht McLuhan Institute, Accessed: 05 January, 2009. Available from Internet: www.mmi.unimaas.nl/userswww/baerten/personalmuseum.doc.
10

Alexander Nikov, Shanaz Wahid, Koffka Khan, Alexi Danchev
7. Germanakos P., Mourlas C., Samaras G. 2005. A Mobile Agent Approach for Ubiquitous and Per-sonalized eHealth Information Systems, Proc. Workshop on 'Personalization for e-Health' of the 10th International Conference on User Modeling (UM'05), Edinburgh, July 29, 2005, pp. 67-70. Accessed: 05 January, 2009. Available from Internet: http://www.media.uoa.gr/~pgerman/ publicaions/published_papers/A_Mobile_Agent_ Aproach_for_Ubiquitous_and_Personalized_eHealth_Information_Systems.pdf.
8. Hadžić, O. 2004. Tourism And Digitization Of Cul-tural Heritage. Review of the National Center for Digitization, Faculty of Mathematics, Belgrade, Is-sue 5, pp. 74–79, Accessed: 05 January, 2009. Available from Internet: http://elib.mi.sanu.ac.rs/ files/journals/ncd/5/d011download.pdf.
9. Helander G.M., Tham P.M. 2003. Hedonic-affective human factors design, Ergonomics, Vol. 46, 13-14.
10. Hicken E. 2009. GIS (Geographical Information Systems) as a facilitation tool for sustainable de-velopment In Africa), Accessed: 05 January, 2009. Available from Internet: www.state.gov/documents/organization/110920.pdf
11. Lera E., Domingo M.G. 2007. Ten emotion heuris-tics: Guidelines for assessing the user’s affective dimension easily and cost-effectively, Proc. 21st BCS HCI Group Conference HCI 2007, Vol. 2, British Computer Society, Lancaster University, 3-7 September, 2007, Accessed: 05 January, 2009. Available from Internet: www.bcs.org/uplo-ad/pdf/ewic_hc07_popaper2.pdf
12. Lorenz M.H., Seifert K.E., Treibert R. 2005. In-formation Systems for Sustainable Development, London: Idea.
13. Meadows D. 1998. Indicators and Information Systems for Sustainable Development, Interna-tional Institute for Sustainable Development, Ac-cessed: 05 January, 2009. Available from Inter-net: www.iisd.org/ic/classification.asp
14. Peteves S. D. 2009. Sustainable Energy Tech-nologies Reference and Information Systems (SETRIS), European Commission, EC - DG Joint Research Centre, Institute for Energy, Petten, Netherlands, Accessed: 05 January, 2009. Avail-able from Internet: www.ie.jrc.ec.europa.eu/publications/info_sheets_docs/Info Sheet SETRIS.pdf
15. Preece, J. 2000. Online Communities: Designing Usability and Supporting Sociability. Wiley.
16. Reddy, P.K., Ankaiah, R. 2005. A framework of information technology-based agriculture informa-tion dissemination system to improve crop pro-ductivity, Current Science, Vol. 88, No. 12, pp. 1905-1913, Accessed: 05 January, 2009. Avail-able from Internet: www.ias.ac.in/currsci/jun252005/1905.pdf
17. Report of the World Commission on Environment and Development. Our common future. 2009. Ox-ford: Oxford University Press, Accessed: 05 January, 2009. Available from Internet: www.un-documents.net/wced-ocf.htm
18. Rutkowski L. 2008. Computational Intelligence: Methods and Techniques, Springer,
19. Seror, A. 2001. The Internet, Global Healthcare Management Systems, and Sustainable Develop-ment: Future Scenarios, Electronic Journal on In-formation Systems in Developing Countries, Vol. 5, Nr. 1, pp. 1-18, Accessed: 05 January, 2009. Available from Internet: www.ejisdc.org/ojs2/index.php/ejisdc/article/view/26/26
20. Software Accelerates Sustainable Development, 2008. Business for Social Responsibility, Soft-ware Working Group, Accessed: 05 January, 2009. Available from Internet: www.bsr.org/reports/BSR_Software_Accelerates_Sustainable_Development.pdf
21. Tongia R., Subrahmanian E., Arunachalam V. S. 2005. Information and Communications Technol-ogy for Sustainable Development, Defining a Global Research Agenda. Carnegie Mellon Univer-sity, Pittsburgh and Indian Institute of Science, Bangalore. Allied Publishers Pvt. Ltd., Bangalore, India, Accessed: 05 January, 2009. Available from Internet: www.cs.cmu.edu/~rtongia/ICT4SD_Full_Book.pdf
22. Williamson I., Enemark S., Wallace D., Wallace J. 2006. Incorporating Sustainable Development Ob-jectives into Land Administration, Governance and Land Administration. Shaping the Change, XXIII FIG Congress, Munich, Germany, October 8-13, 2006, Accessed: 05 January, 2009. Available from Internet: www.fig.net/pub/fig2006/papers/ts22/ts22_01_williamson_etal_0260.pdf
23. Yao J. T., Liu W. N., Fan L., Yao Y. Y. and Yang X. D. 2006. Supporting Sustainable Communities with Web-based Information Systems, Journal of Environmental Informatics, Vol. 7, Nr. 2, pp. 84-94.
11

УПРАВЛЕНИЕ И УСТОЙЧИВО РАЗВИТИЕ 2/2009(23) MANAGEMENT AND SUSTAINABLE DEVELOPMENT 2/2009(23)
RIDING THE SIXTH WAVE: RENEWABLE ENERGY AND NANOTECHNOLOGY PATENTS
Dora Marinova
Curtin University Sustainability Policy (CUSP) Institute, Perth, Australia
Abstract
The paper explores the hypothesis of the 6th technological wave associated with the development of sustain-able technologies. Based on 1975-2007 data from the US Patent and Trademark Office (USPTO), it analyses the emerging patterns in two classes of sustainable technologies, namely renewable energy and nanotechnology. The surge in activities related to nanotechnologies is in contrast with a much lower interest in inventions related to renewable energy technologies. The paper argues that the imperatives of climate change would not allow enough time for the global community to ride the 6th wave and urgent policy measures are needed to speed up the process of technology development. They require a global green system of innovation that represents community values and encourages sustainable behaviour.
Key words: climate change, global green innovation system, sustainable development, sustainable technology
Introduction Technological development seems to hap-
pen along certain clusters of technical solutions where a particular concept becomes dominant over a period of time and guides the majority of innovative ideas [24]. Abernathy and Utterback [1] and Dosi [10] referred to these practices as establishing of a technological paradigm which according to Dosi is: “a ‘pattern’ of solutions of selected technoeconomic problems based on highly selected principles derived from the natu-ral sciences, jointly with specific rules aimed at acquiring new knowledge and safeguarding it, whenever possible, against rapid diffusion to the competitors” [12]. The patenting system which has been in existence for more than 200 years in the Western world [25] is an example of the mechanisms that society has put in place to pro-tect and encourage innovation.
Dosi [9], Perez and Freeman [13] also point out that over the period of time when a certain technological paradigm is dominant, innovations tend to happen along technological trajectories which follow more or less a Bell distribution curve (see Figure 1). At the early stage of the trajectory, the number of new technologies is relatively small but as the paradigm is adopted in full force the inventions keep coming (many of them improve or replicate earlier innovations) until they reach a level of stabilisation and then slowly vanish. The period when the innovative activities along the old technological paradigm start to disappear is also the time when a new technological paradigm is being born. This is manifested by the emergence of a new cluster of technologies.
Fig. 1. Technological trajectories
Source: Abraham and Knight (2001)
12

Dora Marinova
The history of technology shows that since
the late 18th century we have experienced 5-6 such significant major technological trajectories which in the tradition of Kondratieff, economists starting with Schumpeter [34] describe as waves of innovation [e.g. 32, 7, 38, 36, 8]. According to Lynch [21], each wave represents technologi-cal solutions to problems that once were thought intractable. Aligned with the dominant technolo-gies of the wave are methods of production, socio-institutional frameworks, government poli-
cies, political and economic organisation of soci-ety [31, 39].
The current 5th wave is associated with the development and uptake of information and digi-tal technologies as well as biotechnology and the new media. There are also important signs that the 6th wave has already begun and many ana-lysts associate it with the development of sus-tainable technologies [e.g. 17; see also Figure 2].
Fig. 2. Technological long waves
Source: Hargroves and Smith (2005)
This paper examines how much progress
has been made along the 6th technological wave taking into considerations the imperatives of cli-mate change and the overall policy environment. It argues that the urgency for reducing green-house gas emissions leaves a very small window of opportunity which is much shorter than the witnessed technological pace. The global com-munity will not have the luxury to ride the 6th wave and urgent policy measures are needed to speed up the process of technology development
The remainder of the paper is organised as follows. The first section analyses empirical evi-dence for technological development based on US patent data. This is followed by a discussion of the policy environment against the findings provided by the science of climate change. The last section draws some policy conclusions em-phasising the need for a global green innovation system (GGIS) for climate change response.
Sustainable technologies
The nature of sustainable technologies us such that they simultaneously and synergistically include environmental considerations, market profitability and social accountability [23]. They require an understanding of the interactions be-tween technology and the social, ecological, economic, cultural, political and governance sys-tems within society. The paper explores the de-velopment of two groups of such technologies using the patenting patterns in the USA, namely renewable energy (patented solutions in solar, wind, wave, tide, geothermal, hydro and biogas energy technologies) and nanotechnology.
The choice of renewable energy technology is not surprising given that fossil fuels are being proven to be the main cause for the constantly increasing levels of greenhouse gas emissions in the earth’s atmosphere [19]. Nanotechnology on the other hand is considered inherently environ-mentally friendly because it has the potential to
13

RIDING THE SIXTH WAVE: RENEWABLE ENERGY AND NANOTECHNOLOGY PATENTS
reduce the total volume of material per product function (less material waste); to reduce energy costs during the use-phase of products; allows for efficient energy conservation and storage and also includes nanoscale processes for environ-mental improvement, such as screening, treat-ment, remediation, benign manufacture, used in solar and fuel cells [33]. Despite these positive characteristics, the Centre for Responsive Nanotechnologies raises the following concerns about their sustainability (www.crnano.org/dangers.htm): there is the possibility of economic oppression from artifi-cially inflated prices; personal risk from criminal or terrorist use; personal or social risk from abu-sive restrictions; social disruption from new products and lifestyles; unstable arms race; envi-ronmental damage or health risks from unregu-lated products; free-range self-replicators; and black market in nanotechnology. The list can be expanded to include further possible environ-mental damage, such as nanoscale contamina-tion of water and air, and as with most types of technologies their development and application will depend on the policy decisions and moral value held within society. Therefore the envi-ronmentally friendly applications are also de-scribed as green nanotechnology; however the line that distinguishes them is often very blurred. By comparison, if economically viable renewable energy technology (excluding nuclear energy) is unquestionably sustainable.
Despite the many flaws of the patenting system [11] and many recommendations for its improvement [27], it remains one of the best sources (if not the best source) of information that we have about new technology develop-ment. Its growing importance within society is manifested with the larger and larger numbers of new applications and consequently new patents issued. The Patent and Trademark Office in the US (USPTO) alone receives more than 300,000 of patent applications per year [27]. Patent in-formation has been extensively used to describe innovation activities and new trends in technol-
ogy [30, 2, 4]. This paper uses patent data from the USPTO for the 1975-2007 period (by date of patent application1) retrieved on the basis of key words, to describe trends in patenting renewable energy technology (excluding nuclear energy) and nanotechnology. The renewable energy pat-ents cover technical solutions in solar, wind, wave, tide, geothermal, hydro and biogas tech-nologies. A patent is identified as belonging to the class of renewable energy if the key words (or truncated key word expressions) related to the range of renewable energy technologies are found in the patent’s abstract, description or claims. Similarly, a patent is identified as cover-ing nanotechnology if a truncated key word ex-pression containing “nano” (but not nanosecond or nano.) is found in the patent’s abstract, de-scription or claims.
Figures 4 and 5 present the annual numbers of US patents issued on the basis of applications from 1975 to 2005 in absolute (Figure 4) and relative terms (Figure 5). As it takes more than two years for a patent to be issued after an ap-plication is being made (in some cases it can take much longer and delays of 7-8-10 years are not unknown), it is likely that the number of ap-proved applications in more recent years will in-crease2. Despite the apparently increasing trends of US renewable energy patents since the early 1990s (see Figure 4), their relative share in total US patents remains very low at below 1% (see Figure 5). The number of new renewable patents issued reached 1668 for applications lodged in 2002 but even in that year their relative share was only 0.77% of total US patents.
It is estimated that more than 70% of the US renewable patents are domestic [24], a much higher share than the average of 50% for all technology classes [15]. Apart from the fact that the predominant capacity in renewable energy still remains with American inventors, this could also mean that the US market was less attractive to foreign technology developers during the 31-year period. This is not surprising taking into ac-count the fact that the
1 There are pros and cons of using date of application as the time dimension for the patent trends. The main advantage (which is the basis for the preference here) is that the date of application more accurately represents the timing of the innovative activities while the date of issue can be affected by organisational delays within USPTO beyond the control of the inventors who have lodged the application. The main disadvantage of using date of application is that the number of patents per year, particularly for more recent years, fluctuates depending as to when the data are accessed. The standard waiting time for an application to be processed and, if found that it satisfies the criteria, approved is three years. In some cases however the process can take much longer; although rare, delays of up to 10 years are also witnessed. As new patent applications are being approved the number of patent issued increases. 2 The tail end of the time series graphs for absolute patent numbers always exhibits a drop for most recent years, e.g. from 2002 onwards in this case. The effect of this however is more or less negated when relative numbers are used.
14

Dora Marinova
American economy remained highly reliant, in fact dependent, on oil. There were no policies in place to encourage the uptake of renewable en-ergy which was in stark contrast with countries such as Japan and Germany (for more informa-tion about their innovation environment, refer to [5, 6]). Japan was in fact the country with the highest number of renewable energy patents, a leader among all foreign countries patenting in
the US in this class. Between 1975 and 2007 Japan had a total of 3178 renewable energy patents issued (or only 0.45% of all US renew-able energy patents). Germany was second but this country has only around a third of the num-ber of Japanese patents and overall the impact of these two countries on the largest and most technologically advanced market was small.
0
200
400
600
800
1000
1200
1400
1600
1800
19
75
19
76
19
77
19
78
19
79
19
80
19
81
19
82
19
83
19
84
19
85
19
86
19
87
19
88
19
89
19
90
19
91
19
92
19
93
19
94
19
95
19
96
19
97
19
98
19
99
20
00
20
01
20
02
20
03
20
04
20
05
Fig. 3. US renewable energy patents, 1975–2005
(by date of application, as of 16.10.2008)
0.00
0.20
0.40
0.60
0.80
1.00
1.20
1.40
1.60
19
75
19
76
19
77
19
78
19
79
19
80
19
81
19
82
19
83
19
84
19
85
19
86
19
87
19
88
19
89
19
90
19
91
19
92
19
93
19
94
19
95
19
96
19
97
19
98
19
99
20
00
20
01
20
02
20
03
20
04
20
05
Fig. 4. Relative shares of US renewable energy patents (%), 1975–2005
(by date of application, as of 16.10.2008) The relatively low numbers of US renewable
energy patents at less than 1% is indicative of the fact that this area has not yet taken speed. If we compare the graphs from Figures 3 and 4 with the S-curve describing technological trajec-tories, it is clear that this class of technologies is still at the beginning stage. We are yet to see a surge in patenting activities in the US that could define the 6th wave of innovations.
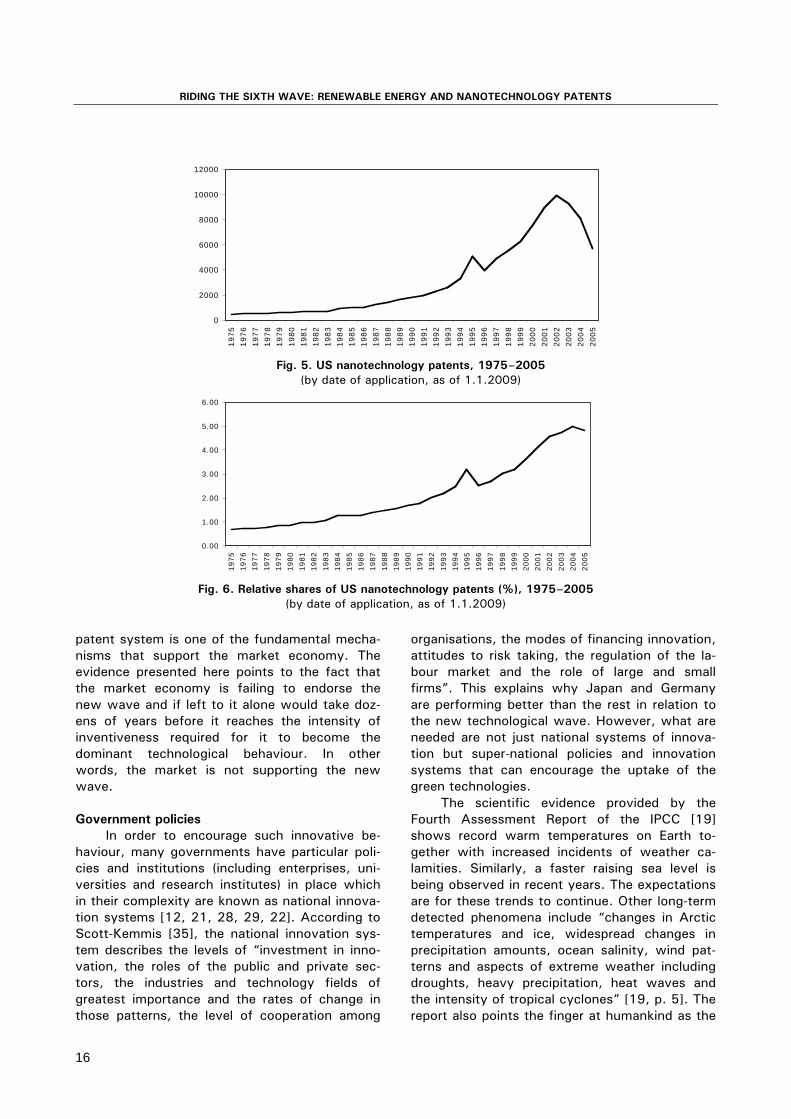
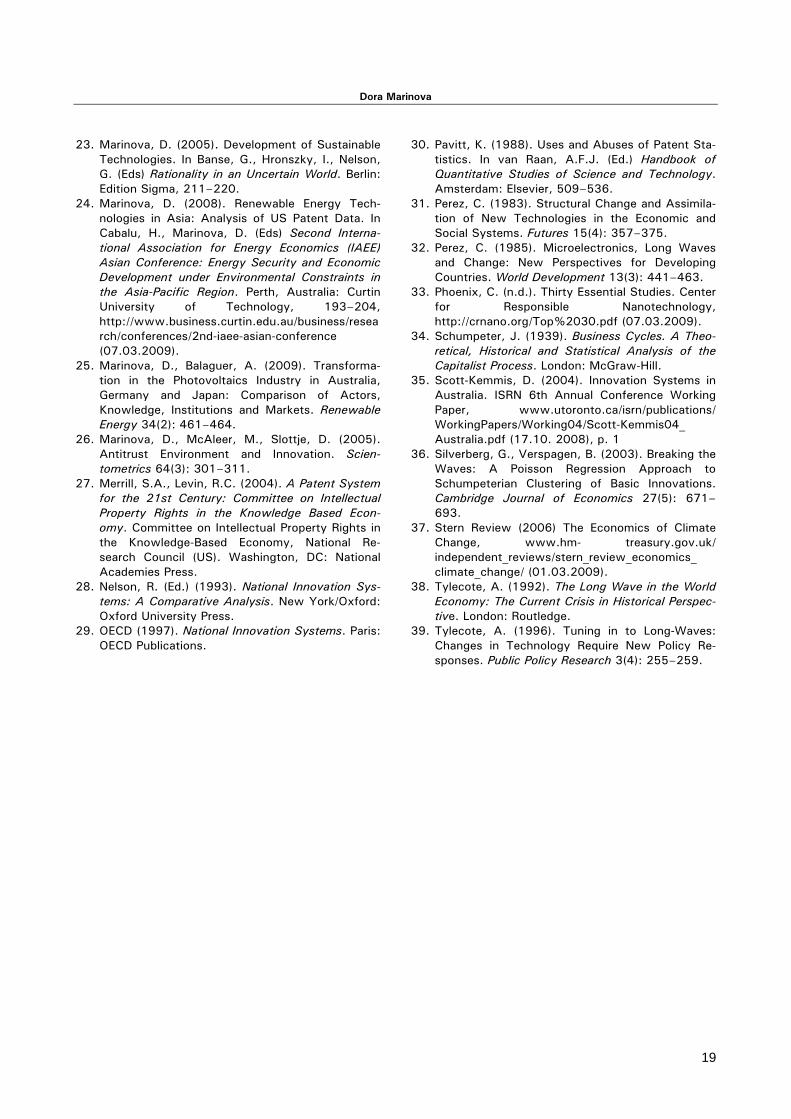
Compared to renewable energy, patented nanotechnologies exhibit a striking different trend (see Figures 5 and 6). They are clearly on a steep increase with absolute numbers reaching as high as 9908 in 2001 and a relative share just
below 5%. This is a good indication that the nanotechnology trajectory is taking shape. Japan again is the leader but in this case the country holds an impressive 39% of all nanopatents is-sued in the USA.
The analysis of patent trends as presented in the US market shows that there is evidence for the 6th wave to be associated with the raise of nanotechnologies, however the uptake of re-newable energy is very slow. As the potential applications of nanotechnology are across all sectors, there is not enough evidence yet for a green, i.e. environmentally friendly, 6th techno-logical wave to be occurring. In many ways the
15
RIDING THE SIXTH WAVE: RENEWABLE ENERGY AND NANOTECHNOLOGY PATENTS
0
2000
4000
6000
8000
10000
12000
19
75
19
76
19
77
19
78
19
79
19
80
19
81
19
82
19
83
19
84
19
85
19
86
19
87
19
88
19
89
19
90
19
91
19
92
19
93
19
94
19
95
19
96
19
97
19
98
19
99
20
00
20
01
20
02
20
03
20
04
20
05
Fig. 5. US nanotechnology patents, 1975–2005
(by date of application, as of 1.1.2009)
0.00
1.00
2.00
3.00
4.00
5.00
6.00
19
75
19
76
19
77
19
78
19
79
19
80
19
81
19
82
19
83
19
84
19
85
19
86
19
87
19
88
19
89
19
90
19
91
19
92
19
93
19
94
19
95
19
96
19
97
19
98
19
99
20
00
20
01
20
02
20
03
20
04
20
05
Fig. 6. Relative shares of US nanotechnology patents (%), 1975–2005
(by date of application, as of 1.1.2009)
patent system is one of the fundamental mecha-nisms that support the market economy. The evidence presented here points to the fact that the market economy is failing to endorse the new wave and if left to it alone would take doz-ens of years before it reaches the intensity of inventiveness required for it to become the dominant technological behaviour. In other words, the market is not supporting the new wave.
Government policies
In order to encourage such innovative be-haviour, many governments have particular poli-cies and institutions (including enterprises, uni-versities and research institutes) in place which in their complexity are known as national innova-tion systems [12, 21, 28, 29, 22]. According to Scott-Kemmis [35], the national innovation sys-tem describes the levels of “investment in inno-vation, the roles of the public and private sec-tors, the industries and technology fields of greatest importance and the rates of change in those patterns, the level of cooperation among
organisations, the modes of financing innovation, attitudes to risk taking, the regulation of the la-bour market and the role of large and small firms”. This explains why Japan and Germany are performing better than the rest in relation to the new technological wave. However, what are needed are not just national systems of innova-tion but super-national policies and innovation systems that can encourage the uptake of the green technologies.
The scientific evidence provided by the Fourth Assessment Report of the IPCC [19] shows record warm temperatures on Earth to-gether with increased incidents of weather ca-lamities. Similarly, a faster raising sea level is being observed in recent years. The expectations are for these trends to continue. Other long-term detected phenomena include “changes in Arctic temperatures and ice, widespread changes in precipitation amounts, ocean salinity, wind pat-terns and aspects of extreme weather including droughts, heavy precipitation, heat waves and the intensity of tropical cyclones” [19, p. 5]. The report also points the finger at humankind as the
16

Dora Marinova
main culprit for these changes: “Most of the ob-served increase in globally averaged tempera-tures since the mid-20th century is very likely due to the observed increase in anthropogenic greenhouse gas concentrations” [19, p. 8].
The 2006 Stern Review in the UK which examined the economics of climate change dem-onstrated that it will be cheaper for society to act on reducing greenhouse gas emissions now rather then postpone this to future generations. Despite the evidence from science and econom-ics, we are yet to see serious changes. The Aus-tralian Garnaut Report characterises the current international political environment where meas-ures for arresting climate change need to be taken as captured in a “diabolical” problem that can only be resolved through collaboration: “Ef-fective international action is necessary if the risks of dangerous climate change are to be held to acceptable levels, but deeply problematic. In-ternational cooperation is essential for a solution to a global problem. However, such a solution requires the resolution of a genuine prisoner’s dilemma: each country benefits from a national point of view if it does less of the mitigation it-self, and others do more. If all countries act on this basis, without forethought, communication and cooperation, there will be no resolution of the dilemma. Future generations will judge the outcome to have been insufficient and unsatis-factory” [14].
Such cooperation has started to appear in sections of the market (as witnessed in the pat-ent trends) and in government (as manifested in the Carbon Reduction Trading Scheme in Austra-lia and the $150 billion climate change package introduced by the new US administration) but this will not be enough to trigger the new tech-nological wave. There is a need for a global in-novation system in which all countries, including China, India, Brazil and Russia, endorse a vision for a greener world. The developing world should not be seen as the problem as there is ample evidence that these countries are on the right track in their efforts to integrate economic pros-perity with social advancement and protection of the natural environment. Under the constant pressure for energy demand from its fast grow-ing economy, China is likely to soon turn into renewable options at a mach greater scale. Al-though still centralised, China’s innovation sys-tem is very much geared towards practical appli-
cations with fast economic outcomes [e.g. 16]. India is already a global research and develop-ment centre for major international corporations. The government has played a major role and in most cases singularly in the development of In-dia’s innovation system [18] and it is hoped that this huge potential will soon translate into impor-tant renewable energy solutions.
A global green innovation system (GGIS) for climate change response would require reas-sessment as to how things are being done cur-rently and a move towards a faster development and application of sustainable technologies. A move towards such a global innovation system is already happening with the recently released United Nations Environmental Program’s report “A Global Green New Deal”3 which sees a re-covery from the current global crises of food, fuel and finances by taking up this opportunity to reduce carbon dependency [6]. The report also suggests a list of international actions that can help make the Global Green New Deal a reality. Conclusion
The empirical evidence from the patenting of renewable energy technologies in the US shows that the 6th wave of innovation is only in its infancy. Nanotechnologies (which have the potential to be sustainable) are surfacing as the main trigger of the new technological wave. They however cannot cause the change of be-haviour and direction that is required to respond to the urgency and imperatives of the anthropo-genically induced climate change as energy technologies are the ones that are mainly re-sponsible for the large greenhouse emissions. Left to the individual countries’ innovation sys-tems, as it has been the case until now, the world will be facing with the impossible solution of a “diabolical” problem with no precedence in human history. Cooperation can be the only way to resolve the inherent conflicts and weaknesses of the market and governance.
In order for such collaboration to happen, a super-national or even global climate change in-novation system is needed which will combine the power of science, research and development with the financial institutions across societies and attitudes towards risk. It will generate the skills and labour force that can implement this new vision across all sectors of society in indi-
3 South Korea has already announced a Green New Deal plan of U$36 over 2009 to 2012.
17

RIDING THE SIXTH WAVE: RENEWABLE ENERGY AND NANOTECHNOLOGY PATENTS
vidual countries, including industry, government and education. The determining factor for cli-mate change innovation to be endorsed globally and become the new 6th wave of innovation is for community to adopt a vision for a sustainable world. This will translate into changes in values and everyday practices as well as in a surge of activities in relation to patenting human inven-tiveness to support the transition towards a more sustainable future.
Acknowledgement
The author wishes to acknowledge the fi-nancial support of the Australian Research Council. She is also grateful to the feedback re-ceived from the participants and referees in the 2nd International Association for Energy Eco-nomics (IAEE) Asian Conference, Perth, Australia in November 2008 where some of the original data and related findings were first presented.
References:
1. Abernathy, W.J., Utterback, J.M. (1978). Pat-terns of Industrial Innovation. Technology Review 80(7): 40–47.
2. Acs, Z.J., Audretsch, D.B. (1989). Patents as a Measure of Innovative Activity. Kyklos 42(2): 171–180.
3. Abraham, J.L., Knight, D.J. (2001). Strategic In-novation: Leveraging Creative Action for More Profitable Growth. Strategy & Leadership 29(1): 21–27.
4. Archibugi, D., Pianta, M. (1992). The Technologi-cal Specialisation of Advanced Countries. Dordretech: Kluwer.
5. Balaguer, A., Marinova, D. (2006). The Develop-ment of Photovoltaics in Australia: Co-evolution of Actors, Knowledge, Institutions and Markets. Prometheus 24(3): 323–339.
6. Barbier, E. (2009). A Global Green New Deal. United Nations Environmental Programme. http://www.unep.org/greeneconomy/docs/GGND_Final%20Report.pdf (14.03.2009).
7. Bessant, J. (1991). Managing Advanced Manu-facturing Technology: The Challenge of the Fifth Wave. Manchester, UK: NCC/Blackwell.
8. Devezas, T. (Ed.) (2006). Kondratieff Waves, Warfare and World Security. NATO Science Se-ries. Amsterdam: ISO Press.
9. Dosi, G. (1982). Technological Paradigms and Technological Trajectories. Research Policy 2(3): 147–162.
10. Dosi, G. (1988). Sources, Procedures, and Micro-economic Effects of Innovation. Journal of Eco-nomic Literature 26: 1120–1171.
11. Edgerton, D. (2006) The Shock of the Old: Tech-nology and Global History Since 1900. Oxford: Oxford University Press.
12. Freeman, C. (1988). Japan: A New National Sys-tem of Innovation. In Dosi, G., Freeman, C., Nel-son, R., Soete, L. (Eds) Technical Change and Economic Theory. London: Pinter, 330–348, р. 1127
13. Freeman, C., Perez, C. (1988). Structural Crises of Adjustment, Business Cycles and Investment Behaviour. In Dosi, G., Freeman, C., Nelson, R., Soete, L. (Eds) Technical Change and Economic Theory. London: Pinter, 38-66. Reprinted in Ha-nusch, H. (Ed.) (1998). The Economic Legacy of Joseph Schumpeter. London: Elgar.
14. Garnaut, R. (2008) Garnaut Climate Change Re-view. Draft Report. Canberra: Commonwealth of Australia, p. xviii
15. Griliches, Z. (1990). Patent Statistics as Economic Indicator: A Survey. Journal of Economic Litera-ture 28(4): 1661–1707.
16. Gu, S. (1997) China’s National Innovation System Approach to Participating in Information Technol-ogy: The Innovative Recombination of Techno-logical Capability. Institute for New Technologies, United Nations University, www.intech.unu.edu/ publications/discussion-papers/9701.pdf (02.01.2009).
17. Hargroves, K., Smith, M.H. (Eds) (2005). The Natural Advantage of Nations: Business Opportu-nities, Innovation and Governance in the 21st Century. London: Earthscan.
18. Herstatt, C., Tiwari, R., Ernst, D., Buse, S. (2008). India’s National Innovation System: Key Elements and Corporate Perspectives. Technology and Innovation Management Working Paper, Ham-burg University of Technology, www.tu-harburg.de/tim/downloads/arbeitspapiere/ Working_Paper_51.pdf (01.01.2009).
19. Intergovernmental Panel on Climate Change (IPCC) (2007). Summary for Policymakers. In Cli-mate Change 2007: The Physical Science Basis, Contribution of Working Group I to the Fourth As-sessment Report of the Intergovernmental Panel on Climate Change. Cambridge: Cambridge Uni-versity Press.
20. Lundvall, B-Å. (Ed.) (1992). National Innovation Systems: Towards a Theory of Innovation and In-teractive Learning. London: Pinter.
21. Lynch, Z. (2003). Neurotechnology and Society (2010-2060). Lifeboat Foundation Special Report, http://lifeboat.com/ex/neurotechnology.and.society (07.03.2009).
22. Marceau, J., Manley, K. (2001). Australia’s Sys-tem of Innovation. In Dow, G., Parker, R. (Eds) Business, Work, and Community: Into the New Millennium. Melbourne: Oxford University Press, 81–100.
18
Dora Marinova
23. Marinova, D. (2005). Development of Sustainable Technologies. In Banse, G., Hronszky, I., Nelson, G. (Eds) Rationality in an Uncertain World. Berlin: Edition Sigma, 211–220.
24. Marinova, D. (2008). Renewable Energy Tech-nologies in Asia: Analysis of US Patent Data. In Cabalu, H., Marinova, D. (Eds) Second Interna-tional Association for Energy Economics (IAEE) Asian Conference: Energy Security and Economic Development under Environmental Constraints in the Asia-Pacific Region. Perth, Australia: Curtin University of Technology, 193–204, http://www.business.curtin.edu.au/business/research/conferences/2nd-iaee-asian-conference (07.03.2009).
25. Marinova, D., Balaguer, A. (2009). Transforma-tion in the Photovoltaics Industry in Australia, Germany and Japan: Comparison of Actors, Knowledge, Institutions and Markets. Renewable Energy 34(2): 461–464.
26. Marinova, D., McAleer, M., Slottje, D. (2005). Antitrust Environment and Innovation. Scien-tometrics 64(3): 301–311.
27. Merrill, S.A., Levin, R.C. (2004). A Patent System for the 21st Century: Committee on Intellectual Property Rights in the Knowledge Based Econ-omy. Committee on Intellectual Property Rights in the Knowledge-Based Economy, National Re-search Council (US). Washington, DC: National Academies Press.
28. Nelson, R. (Ed.) (1993). National Innovation Sys-tems: A Comparative Analysis. New York/Oxford: Oxford University Press.
29. OECD (1997). National Innovation Systems. Paris: OECD Publications.
30. Pavitt, K. (1988). Uses and Abuses of Patent Sta-tistics. In van Raan, A.F.J. (Ed.) Handbook of Quantitative Studies of Science and Technology. Amsterdam: Elsevier, 509–536.
31. Perez, C. (1983). Structural Change and Assimila-tion of New Technologies in the Economic and Social Systems. Futures 15(4): 357–375.
32. Perez, C. (1985). Microelectronics, Long Waves and Change: New Perspectives for Developing Countries. World Development 13(3): 441–463.
33. Phoenix, C. (n.d.). Thirty Essential Studies. Center for Responsible Nanotechnology, http://crnano.org/Top%2030.pdf (07.03.2009).
34. Schumpeter, J. (1939). Business Cycles. A Theo-retical, Historical and Statistical Analysis of the Capitalist Process. London: McGraw-Hill.
35. Scott-Kemmis, D. (2004). Innovation Systems in Australia. ISRN 6th Annual Conference Working Paper, www.utoronto.ca/isrn/publications/ WorkingPapers/Working04/Scott-Kemmis04_ Australia.pdf (17.10. 2008), p. 1
36. Silverberg, G., Verspagen, B. (2003). Breaking the Waves: A Poisson Regression Approach to Schumpeterian Clustering of Basic Innovations. Cambridge Journal of Economics 27(5): 671–693.
37. Stern Review (2006) The Economics of Climate Change, www.hm- treasury.gov.uk/ independent_reviews/stern_review_economics_ climate_change/ (01.03.2009).
38. Tylecote, A. (1992). The Long Wave in the World Economy: The Current Crisis in Historical Perspec-tive. London: Routledge.
39. Tylecote, A. (1996). Tuning in to Long-Waves: Changes in Technology Require New Policy Re-sponses. Public Policy Research 3(4): 255–259.
19
УПРАВЛЕНИЕ И УСТОЙЧИВО РАЗВИТИЕ 2/2009(23) MANAGEMENT AND SUSTAINABLE DEVELOPMENT 2/2009(23)
PARTICIPATION OF MIGRANT WOMEN IN THE ENVIRONMENTAL MOVEMENT:
THE NATURE OF FEMINIST VALUES
Silvia Lozeva, Dora Marinova Curtin University Sustainability Policy (CUSP) Institute, Perth, Australia
Abstract
Public participation in the environmental movement is affected by our ethics, values and care for future gen-
erations. The ethics of our cultural background and the intrinsic value of nature contribute to the ways we reflect and engage with the environment in its various forms. The focus of this paper is to explore the role of recent migrants, and particularly migrant - women in contributing to building civil society by their engagement with the environmental movement.Growing evidence indicates that more and more migrants are motivated by social factors in moving from one country to another in the pursuit of a better way of life. According to Europa Newsletter’, the main factors that inspires Europeans to move to another country are love: following a partner and being with family (EUROPA, 2006, p. 25). There is also mounting evidence, that in addition to economic factors and pursuit for financial success, migrants today are motivated by better environmental and social prospects for themselves and their children. Concerns about the health of the natural environment are part of this process. Drawing on semi-structured interviews with first generation migrants the objective of this paper is to produce a mosaic model of civically active migrants in the environmental movement which includes their contribution to civil society and social sustainability. It looks at the importance of social capital among migrants and their contribution to building a stronger civil society, particularly by examining the role of women in grassroots environmental organizations. The main focus is linking three major concepts together - these of gender, migration and sustainability- adequately together and interrogating the role of public participation of migrants. Linking adequately together the three major concepts – these of gender, migration and sustainability, it interrogates the role of public participation of migrants in civil society.
Key words: Migrants, Public Participation, Sustainability, Environmental Movement
Introduction The subject of public participation of mi-
grants and their contribution to civil society has now attracted much interest among a wide range of different agencies: academia, policy-makers, governmental and community organizations [1, 17, 19]. In the European Union the very concept of building a civil society through public involvement has previously been referred to, by the Commis-sion’s Directorate General for Social Affairs, as a civil dialogue serving the purpose of improving the effectiveness and legitimacy of policy-making in the social sector by including social and envi-ronmental NGOs (in addition to the agencies already involved in this dialogue)1. It is within this civil dialogue, from which migrants are often excluded, that a means for engaging in the public sphere needs to be provided.
This paper explores some of the reasons and motivations in the civic engagement of migrants in their pursuit for a better life for themselves and their families through engaging with the envi-ronmental sector. It is based on the theory that
social factors and social capital play more im-portant role in migration processes and in the engagement with civil society than economic benefits. In the process of transitioning to the public engagement process women may play special part by taking the leading role in pursuing more sustainable democratic practices leaded by care for the others and the traditionally perceived feminist values of nurturing, mothering and care for the environment which have been called either natural or socially constructed to explain the complexity of the connection between women and nature [4, 9, 13].
Many studies before have tried to explain and subsequently justify the difference between the sexes, but they sought to establish those differ-ences invoked by “nature”. “The nature “of women has been then established by legal means and by circular logic the “essence” of men and women has become the basis for legal and policies measures, while in fact those “essences” were a subsequent development of the same laws and
1 The public participation debate at a European level did not begin until two decades ago (Smismans, 2006) although the con-temporary traditions of civil society and involvement of the public are rooted in the Rome Treaty (25 March 1957) which developed a particular discourse on civil society by creating the European Economic Community (EEC) which later became a pillar in establishing the European Union.
20
Silvia Lozeva, Dora Marinova
policies [16]. Feminism developed asa way to eliminate those “sexual differences” in the public arena and to protest against the political and public exclusion of women. The very goal of the feminist movement- the elimination of the sexual difference- then became the standpoint for the same protest; in order to protest against political exclusion, the women had to make claims on behalf of “women”. This is what Joan Walter Scott [16] refers to as paradoxical and imbedded deeply in the roots of the feminist movement.
The argument which we are making extends further in the field of the public participation of women. The arena we have chosen is the envi-ronmental movement, because it has often been described that women have a strong connection and association with the natural environment and the Earth. Ecofeminists claim that women have a special role to play in regards to nature .Some scholars approach it from “essentialist” point of view claiming those women’s connections comes naturally through deep connection with mother Earth and the moon cycles [13]. The social con-struction of gender reveals that gender has been culturally and historically manipulated notion and it is only though recognising the political and social background of the construction of gender that the women’s closer connection with the natural environment exists [9].
Similarly, women’s participation in the po-litical and public arenas is also being challenged by the discourse of sexual difference. Women came into the public participation arena as outsiders and “sexual difference was established not only as a natural fact, but also as an ontological basis for social and political differentiation.” [16]. Nature being a difficult notion to challenge meant that women faced a difficult journey: the need to both accept and refuse “sexual difference”.
Studying migrant-women and their en-gagement with the environmental movement offers an insight into the values and perception of women themselves. Many migrants are inherently acting in society as mediators for cultural norms and belief systems for them to survive in another place and another time; migrant-women take with themsleves not only labour skills, but what is more important – their culture, their beliefs and with them their perception of the environment. Trying to understand their motivation for engagement with the public sphere offers an insight into the role of traditionally associated with women values in everyday life. Moreover, it offers an opportunity
to track and to follow those values in different geographic regions and to see how they are being portrayed and developed. Are they still the same in their place of origin and their country of migration? And is there such phenomen as “feminist values” which carries on with women as they travel across the world? If those values are existent in everyday life, then how are they being portraited into the public life, especially when it comes to engage-ment with the environmental movement?
In order to attempt to answer these complex questions, the authors have devided this paper in three parts.The first part looks at the importance and the role of active citizenship historically and in contemporary terms; it examines the definition of active citizenship by the Government on a policy level while it shows a great deal of discrepancy between its definition and its implementation. The second part looks at the nature of migrants, and more specifically at migrant-women and their contribution to civil society through engagement with the environmental movement. The third part explores the complex relationship between the natural environment and the migrants, which is the main focus of this research.
This study is a preliminary part of a larger research PhD project. The research demanded a combination of methodologies. It relied on inter-view analysis, policy reviews and focus groups. Interviews were collected utilising a snow-ball technique in order to capture a diverse sample of first generation migrants. The research investi-gates the possibility that social factors are playing a more significant role in motivating the public engagement of migrant women in environmental movement than economic modes of production or need satisfaction. For this paper five interviews were conducted, three face to face, one online survey and one backgound interview with the son of one of the participants. The interviews relied on open-ended semi-structured questionaries and all of the participants were of Non-English Speaking Background (NESB). The interview schedule was designed to explore the life history, public and private life of the interviewee including their social and political backgrounds and their engagement with the environmental sector and their perception of the environment. They all contributed to the diverse sample of migrants in Western Australia. Active Citizenship
Claiming migrant –women as active citi-
21

PARTICIPATION OF MIGRANT WOMEN IN THE ENVIRONMENTAL MOVEMENT: THE NATURE OF FEMINIST VALUES
zenship has to overcome a long history of op-pression and elimination of women. To represent women as any kind of citizens was a long struggle by the feminist movement before they gained the rights to vote. Representation of women is about political and philosophical meanings of represen-tation. A fundamental document - Declaration of the Rights of Woman and Citizen, published by Olympe de Gouges in 1791- insisted both that women, by nature, had all the rights men did and that they individuals as well. This was not the first declaration to articulate the same idea, but it is “arguably the most comprehensive call for women’s rights in this period [The French Revo-lution]” (Olympe de Gouges in [16]). For long time has been accepted that due to so-called natural facts women were not allowed to participate in the public life. Men were seen as citizen- the conqueror of nature, while women were nurturers. Active citizenship has been traditionally attributed to men; the denial of women to gain the rights to vote was argued historically in the following way:” it is difficult to believe that women will be called to exercise political rights. It is beyond me to think that, taking all into account, men and women would gain anything good from it” (Jean Denis Lanjuinais in [16]). Other rejection of the appeal of women to participate actively in the public sphere based on the nature of women read:
“Since when is it permitted to give up one’s sex? Since when it is decent to see women abandoning care for household, the cribs of their children, to come to public places, to harangues in the galleries, at the bar of the Senate? Is it to men that nature confided domestic cares? Has he given us breasts to feed our children?” (Chaumette on behalf of the Commune of Paris in [16].
It is within these traditions that women had to fight for their own rights to participate in the public sphere. It wasn’t until much later, when the feminist movement proclaimed that women should be cherished not for their men-like char-acteristics, but indeed for their differences, the very same sexual differences which they were trying to simultaneously accept and reject [9].
For migrant-women to participate in the public sphere, means that the social policies and the quality of public life is powerfully influenced by the inclusion of all social groups and all agents
in society. The stronger the networks in civic engagement are the stronger their connection and influence on the political and civic life [14]. There are increasing empirical evidence that the rise of non-government organisations, non-for profit organisations and support groups, including women’s organisations are acting as main pillars of civil society. What is more, is that those are the countertrends of “traditional forms of civic en-gagement” [14] and vibrant new ways of public participation. Our preliminary research shows that migrant-women are passonatelly active in various organisations despite any or very little economic benefits. The people who were intervied have been in Australia between a year and a year and a half and none of them was a native Engish –speakers.
The need for public participation of migrants is also defined in the Western Australian Citi-zenship Strategy (2004-2009) as an inclusive and self-reinforcing process that helps cultivate new types of behavior across governments, the community and the private sector:”Active Citi-zenship2 and broader public participation often turns a group of, sometimes insolated, individuals into a strong and vibrant community working towards the achievement of a shared vision for the future.”3.
The nature of migrants
The question of the nature of migrants starts with an even more important question: Who is a migrant? The main definitional issues relevant to migrant research are the two main concepts, often polarized to each other: native population and migrants. On the other hand, the concept of native is split into two categories: those who were born in a country of their residence, native by birth and those who are indigenous to the land. In Australia, a country of migration, native indigenous popula-tion is being associated with a negative connota-tion of oppressive history and native means in digenous. Below we are discussing briefly some of the main problems and challenges in trying to define migrants.
According to the Thesaurus Dictionary (Dic-tionary, 2008), a migrant is “a person who mi-grates” for work, study, tourism, religious reasons
2 It must be noted that the Office for Multicultural Interests uses the term active citizens in the same way in which I refer to civically active migrants. 3 Quoted in A Voice for All: Strengthening Democracy, 2004-2009.
22

Silvia Lozeva, Dora Marinova
or as a refugee”. The international Organization for Migration estimates that there are more than 200 million migrants around the world today. Nothing has been said about what legal status a person should have in order for them to be considered as migrants. This depends entirely on the purpose and the objectives of the research. For the pur-pose of this inquiry, the authors have chosen to select those migrants, who have arrived to Aus-tralia in the last 10 years. The reason for this is to be able to observe the role of their values in en-gaging with the public sector, and more specifi-cally with the environmental movement.
A fascinating aspect of defining who is a migrant is the perception of migrants themselves. According to Andrea Vargas, 45 years old, from Columbia who arrived in Western Australia one and a half years ago ‘immigrant is someone who moves to Australia permanently and who has gained a Permanent Residence’. Andrea did not think of herself as a migrant and was concerned that her interview will therefore not be relevant to the research project. It is clear that migrant is very much a floating notion of perception of yourself, not necessarily defined by legal measures. In the context of Australia, given the history of isolation in the last century due to vast distance from the Anglo-Saxons, who populated to a large extend “the new” continent, the idea of a immigrant was very much that of a permanent settler. People came here to stay, either bringing their own families with them or finding their new life in Australia. “Australia invites you” was a famous slogan used by the Department of Information and the Department of Immigration’s Information Branch, established in 1955 in order to promote overseas migration after the second world war [12]. Until recently, a large proportion of migrants also came to Australia on labour contracts for at least several years to work in various sectors. The reason for migrating were not only displacement from the Second World War, but immigrants indicate a great range of reasons for arriving in Australia, at least half of which “sought a better future” [12]. Nature and migrants
The political economy of the neoliberal state has resulted in global warming, water and air
pollution, toxic waste, soil depletion and decline in biodiversity due to increased rate of industry production and high level of consumption. Women’s engagement with the environmental movement, often fuelled by the traditional family and communal values has expanded the envi-ronmental movement beyond their communities to the wider public sphere. It is no longer considered a woman’s right to have control over their own bodies, to live in a clean environment and to raise children in safe and healthy environment: these have become universal human rights adopted and proclaimed by the Universal Declaration for Hu-man Rights [18]. Women have begun to be seen “as the participants and participants and partners in the environmental protection and conservation programs” [15]. In many cases as it is evident from the interviews below migrant-women are acting as agents for change on a grassroots en-vironmental level. A link between gender, migra-tion and sustainability is also evident from their engagement with the environment.
Since the mid 1990s, there have been a growing number of studies4devoted to the par-ticipation of migrant women in the public sphere. Contemporary studies are investigating the knowledge developed from the women’s move-ment, which has claimed the right to have equal pay for equal work, shared responsibility in childrearing and the right to vote. This knowledge has now expanded to what is known as “cultural feminism” [7] which does not restrict itself to particular objectives, but rather broadens the understanding of such notions as work, home, the public and the private, and continues to strive for a more gender-balanced world by including also those women who are excluded or marginalised on the basis of race and class. Similarly, other women’s movements, such as feminist environ-mentalism and socialist feminism have tended to treat class and race as subservient in the same ways as left-wing political movements have often defined gender as being of secondary importance [5]. Such a decentered approach is also used in a relatively new synthesis of ideas – consisting of feminist cultural ecology, political ecology and feminist political economy - known as feminist political ecology [15] which
4 For example, International Migration policies and the status of female migrants, United Nations, New York, 1995; The Polity Reader in Gender Studies, Blackwell Publishers, 1994; The Immigrants, Wendy Lowenstein and Morag Lee, Hyland House Melbourne, 1995; Migration, Immigration and Social Policy, edited by Catherine Jones Finer, Blackwell, Oxford, 2006;
23
PARTICIPATION OF MIGRANT WOMEN IN THE ENVIRONMENTAL MOVEMENT: THE NATURE OF FEMINIST VALUES
emphasises the uneven distribution of the politics of decision - making and power, based on dif-ferences of gender, race, class, ethnicity and culture. What is distinctive about the feminist political ecology approach is that it sees the social, political and economic contexts as influential over the environmental policies and practices and over the women’s struggle for sustainable community development. [6]. Feminist Political Ecology also reads gender as a “meaning system” that is produced not only through economic relations and cultural and social institutions, but also as under negotiation as a result of ecologically based struggle [15].
Migrants have played an essential role in Australia not only historically, but also recently as founder of many civic organisations, not only based on ethnicity, but also political, community, religious as well as environmental. “All over the world it seems, immigrants have been seen as a group who founded numerous organisations” [8].
Findings
Preliminary research shows that there a few streams for migrant women to participate in en-vironmental activism. Recently arrived migrants are struggling to make a living, to settle, prioritise and re-prioritise their work and social commit-ments. From a Governmental perspective infor-mation for recent migrants is focused around education, housing, health and family services, and the community organisations5 that provide other services aimed at helping newly-arrived migrants. The Directory of Services for New Arrivals in Western Australia published by the Office of Multicultural Interests [10] provides a comprehensive list of all agencies, community organisations and services considered important for newly arrived migrants. However, this publi-cation and others issued by the Government of Western Australia do not provide any links to environmental organisations, which may point the new migrants (or any migrants in this regard) to issues concerning the environment: such as local problems with climate change, pollution, ways to protect their rights to live in a clean environment, free from (toxic/hazard/ radioactive) waste or simply information on how to engage with local environmental organisations. Little is done to raise
the migrants’ awareness about the new natural environment or encouraging them to attend local events, such as the Kings Park Festival in spring, wildflower tours or tree planting. Consequently migrants are left to their own initiative to start engaging with Australia’s natural environment.
However, the participants in this research have shown a great deal of enthusiasm and have established ways for public participation despite the difficulties they face with housing, language and economic survival. One of the participants does not have any paid employment and for over a year since her arrival in Western Australia has been working only voluntary for a number of different environmental organisations. Another participant has only a part-time weekend job, but nevertheless activelly support and help her son in his pursuit for environmental activism. In the one case, where one of the participants did have a full time job in the environmental sector, she also was engaged voluntary in campaigning against climate change.
Migrant women are passionate and enthu-siastic when talking about their environmental activites6: “Oh, it was absolutelly fantastic!” (Andrea 44, fabout gorilla gardening).” It is very rewarding” (Ditte about screening a film about climate change from students of Al Gore, de-signed to raise global awareness). All of the in-terviews were desinged to be half an hour long and in some cases they took over two hours. At one occasion, we were so engaged in the con-versation that we were the last ones to leave the café after we were asked by the shop assistants and to continue in another place only so the same situation repeated. Many more following up meetings and e-mail communiccation showed the enthusiasm of these migrant –women. The par-ticipants were also recruited voluntary with no insentives offered, which also showed their ea gerness to share their experience about envi-ronmental activism. Main reasons were personal values, children and their safety, opportunities for advancement. Suprisingly, economic insentives is not the main driving factor, unless it was part of self-growth (Table 1).
5 For example the Health Consumers’ Council WA, The western Australian Council of Social Service, Community Housing Coalition, Union WA, Western Australian Local Government Association and others. 6 Participant’s observation formed an important part of the methodoly.
24

Silvia Lozeva, Dora Marinova
Motivation for enagement with environ-
mental activism includes a wide range of reason. 1. Personal values Ani from the Phillipines, 44, found that de-
spite widely promoted values of equality and transparency, values in the legal system do not correspond with the personal values of women.
“No one can feel the injustice as much as
women” “There is definitely a clash of values in the
legal system and migrant-women themselves. There is no other way to describe it except as a war of values, a war of principles. The legal system does not make sense from a logical point of view. (Anibeth Desiro at the First National Conference on Migration and Refugees, Australia).
2. Children Having children was pointed out as one of the
main motivation factor for engaging with the environmantal activities. One of the participants started her gorilla gardening and involvement wih other organisations only through Benjamin, her 14
years old son: I am very supportive of Benjamin. It give us something to talk about and somehting to discuss, it bring us closer”. Andrea also adds that she feels very happy that she can feel safe with him to do what he is interested in without wor-rying about him (like in Columbia).
“Love to our hildren is our biggest motiva-
tion…mothers in Australia try to stop the de-struction of social fabric in our society” sais Ani on a public talk at the First National Migration and Refugee Conference in Perth, Western Australia.
3. Self growth and job opportunities Ditte from Denmark finds rewards in work-
inng for the environmental sector also in future prospects for work in this are, which she strongly feels about: “I want to have a job I this area, constantly impoving myslef” (Ditte). Anna from Mexico, 38, also works for a project on clean water, but additionally works as a volunteer, screening a documantary movie produced by Al Gore to interested groups. It must be noted, however, that job opportunity is not the main goal, but rather a consequesnce or a natural path for those migrants.
Table 1. Motivation factors for engaging of migrant women with the environmental movement.
Motivation Factors for engaging of mi-grant-women with the environmental movement
Individual Family Society
Factors enabling engaging of mi-grant-women with the environmental movement
Individual Family Society
safety and children X education X economic factors X network-building
abilities X
personal and family values X X Upbringing in the wilderness X
Another interetsing aspect of the preliminary
research was getting the participants to reflect over their own connection with the nevironment. Below are listed some of the main ideas commu-nicated by those migrants.
1. Close connection between women and the
environment “I was interested if you find any men in the
environmental organisations. Because in our group in University there are mostly women” (Ditte Strebel).
Andrea thinks that “women have more sense
or reality, [they] are more connected to the ne-cesities; for exaple people who are more con-nected to the environment, are more particular, more connected...this is the experience I have from working with other people in this area.”
2. Women often exhibit the ability to connect
with other people, to connect resources and to provide grounds for ideas; serve as mediators: “Sometimes I just feel a facilitator for providing good grounds” (Andrea).
3. Different power structure Participants in this study escaped the di-
25

PARTICIPATION OF MIGRANT WOMEN IN THE ENVIRONMENTAL MOVEMENT: THE NATURE OF FEMINIST VALUES
chotomy of weak and strong, black and white or emplyee-employers. In Andrea’s words, they are more cooperatative and supportive as opposed to individualistic and competative.
“I have seen a lot of good examples, where
people work together, where the role of a woman is crutial. The feeling of the power is diiferent.”
As a whole lot, the norms, cultural beliefs
and values, which play role in migrant’s public participation forms a complex net of interrelated relations. They act on an individual, family and societal level to create a unique set of motivation factors and factors which enable civic engage-ment (Fig. 1.)
Society
Family
Individual
Fig.1. Individual, Family and Society
Conclusion
Migrant women who are active in the envi-ronmental movement in Western Australia have a lot of commonalities, despite their diverse ethnic backgound. The participants in this study were with a master level of education. Before they have arrived in Australia, they have all been active in their home country at various organisations. It is logical to conclude that although they have lost their networks at their home country, they still keep their network-building skills (Vogel, 2008).
Main motivation factors among the migrant who were interviewd were children and their safety. Pursue for a more sustainable world for the future generation is a main pursuit for envi-ronemntal civic enagament. It was evident that women are mostly involved in environmental activism and family values are promoting such activism.
On the third palce, they provide good envi-
ronment for generating of ideas. Women are acting as mediators. On the fourth place, the power relationship is different when women are taking pat in organisation of environmenatla work. Migrant-women are striving towards moving away from the dichotomy of weak and strong, black and white or emplyee-employers. In Andrea’s words, “the feeling of power is different”, more cooper-atative and supportive as opposed to individual-istic and competative.
One of the participants was enagaged in a wider range of civic activities due to her attach-ment with her child and have refered to a phe-nomenon called “ a war of values” when it comes to legal justice and women’s values.
The theorethical research reveals that by combining feminism in the area of environmental protection and by examining the motivation and inspiration behind civic engagement can be mapped the process in which processes of power, class and civic participation in being shaped in the migrant communities.
My preliminary research indicates that im-migrants, and more specifically migrant women, are bridging the gap between the private and the public and are bringing about increased awareness of environmental problems. Understanding these changes is the precondition for political action to deal with problems and conflicts linked to migra-tion and civic participation.
References:
1. Castles, S., & Davidson, A. (2000). Citizenship and migration : globalization and the politics of be-longing. Basingstoke: Macmillan.
2. Dictionary. (2008). Thesaurus. from http://dictionary.reference.com/browse/native
3. EUROPA. (2006). Europeans move for love and better quality of life. Retrieved 16 Septemebr 2008, 2008, from http://europa.eu/newsletter/archives2006/issue79/index_en.htm
4. Gaard, G. C. (1993). Ecofeminism : women, ani-mals, nature. Philadelphia, Temple University Press.
5. Gunew, S. M. (1991). A Reader in feminist knowledge. London: Routledge.
6. Harrison, F. V. (2004). Global apartheid, environ-mental degradation, and women's activism for sustainable well-being: A conceptual and theo-retical overview. Journal, 33(1), 1-35. doi:711546891
7. McMahon, E., & Olubas, B. (2006). Women making time : contemporary feminist critique and cultural analysis. Crawley, W.A.: University of Western Australia Press.
8. Moya, J. (2005). Immigrants and Associations: A
26

Silvia Lozeva, Dora Marinova
global and Historical Perspective Journal of Ethics and Migration Studies 31(5), 833-864.
9. Irigaray, L. (1993). An ethics of sexual difference. London, Athlone.
10. OMI. (2005). Directory of Services for New Arrivals in Western Australia. Perth OMI, Government of Western Australia.
11. OMI. (2003). A Voice for All: Strenghening De-mocracy, Western Australian Citizenship Strategy 2004-2009. In OMI (Ed.). Perth.
12. Peters, N. (2001). Milk and honey but no gold : postwar migration to Western Australia, 1945-1964. Crawley, W.A.: University of Western Australia Press, p. 25
13. Plumwood, V. (1993). Feminism and the mastery of nature. London, Routledge
14. Putman, R. D. (1995). Bowling Alone: America's Declining Social Capital. Journal of Democ-
racy(6.1). 15. Rocheleau, D., Barbara Thomas -Slayter, and Eshter
Wangari. (1996). Gender and Environment: A feminist Political Ecology Perspective. New York: Routledge.
16. Scott, J. W. (1996). Only paradoxes to offer French feminists and the rights of man. Cambridge, Mass.: Harvard University Press, p. 3, 48
17. Tilbury, F., & Wilding, R. (2004). A changing People: Diverse Contribution to the State of Western Australia
18. UnitedNations. (1948). Universal Declaration of Human Rights. from http://www.un.org/Overview/rights.html
19. Vogel, D. (2008). Highly Active Immigrants: A resource for European civil societies. Frankfurt am Main, Berlin, Bern, Bruxelles, New York, Oxford, Wien, Peter Lang.
27

УПРАВЛЕНИЕ И УСТОЙЧИВО РАЗВИТИЕ 2/2009(23) MANAGEMENT AND SUSTAINABLE DEVELOPMENT 2/2009(23)
SERVICES FOR SUSTAINABLE FOREST TIMBER SUPPLY CHAIN PLANNING AND
CONTROL: DEVELOPMENT, IMPLEMENTATION AND USAGE
Mike Wasche, Ina Ehrhardt Fraunhofer Institute for Factory Operation and Automation IFF, Magdeburg, Germany
Abstract
Economic pressure on timber industries, increased European timber imports and exports and growing demand
for forest biomass as a renewable energy are compelling forestry operations to optimize value added processes to generate savings. Since the supply chain from the forest to the factory incurs the most costs, efficient organiza-tion of logistics is an important secondary aspect. The Fraunhofer IFF and Landesforstbetrieb Sachsen-Anhalt have developed an approach to planning and controlling logistics processes in the forest timber supply chain that inte-grates small and medium-sized service enterprises. The extended open concept enables service providers to ex-change a forestry operation’s logistics information bidirectionally (good practice approach). As service providers endeavor to enhance value added and minimize resource consumption while protecting business interests, ap-proaches and solutions have been applied to optimize forestry operation processes with service providers and cli-ents. An example from the field illustrates the positive effect standardized interfaces and open services and solu-tions have on internal and external processes by increasing value added and improving resource management. Nonetheless, the supply chain is rife with potential risks, particularly for micro and small enterprises, e.g. new technology use, changing processes and shifting cost types and shares. International research projects have ap-plied alternatives for action to minimize and prevent risk.
Key words: Timber Logistics SCM, Information Exchange, Partner and Process Integration
Introduction
The German forestry and wood processing industries have been experiencing a process of continuous change for some years now, in part because the good global market situation until 2006/2007 induced the timber industry to in-crease production capacity. More than 1.7 billion Euros have been invested in Saxony-Anhalt alone. Moreover, the overall demand for forest biomass has increased as the volume of Euro-pean imports and exports has risen and the utili-zation of renewable energies has intensified [4].
The attendant pressure of demand is par-ticularly placing new demands on the forestry industry. Global competition and sustainable forestry measures are compelling forestry opera-tions to produce more cost effectively and effi-ciently. If they are to survive internationally, German forestry operations will specifically have to optimize their processes throughout the value added chain from the forest to the factory to cover the mounting demand for timber and real-ize potential savings. They will also have to make the unused biomass potentials in the pri-vate forest sector identified by the Bundeswald-inventur 2 accessible [2]. Private forests pre-dominantly have small and greatly fragmented structures. The overwhelming majority of the over two million forest owners only supply small
quantities of timber and frequently have insuffi-cient machinery or none at all. These factors hamper the mobilization of private forest owners’ reserves of raw materials for material and energy recovery.
National and state laws in Germany that re-quire owners to manage their private forests sustainably complicate these challenges even more. The forest is not only regarded as a source of raw material but also as the basis for the pro-tection of species, soil, climate and water as well as a site for public recreation. Hence, for-estry industry measures are constantly balancing economic and ecological interests to satisfy the different claims on a forest [1]. The variety of profit-oriented forest management scenarios geared toward nature and nature conservation possible in conjunction with this will directly influence the future availability of the raw mate-rial timber and the certainty of supply for future industry demand [4].
In the context of comprehensive structural changes in Germany entailing downsizing of for-estry personnel, the aforementioned aspects of mandatory sustainability, mounting demand and international competitive pressure underscore the new challenges forestry operations have to tackle. Thus, cost effective and on schedule timber deliveries are increasing becoming a com-
28

Mike Wasche, Ina Ehrhardt
petitive factor for forest owners, forestry opera-tions, the wood processing industry and even service providers. The technical possibilities in the material flow, e.g. improved harvesting and transport technologies, have largely been ex-hausted. Therefore, analyses are needed to de-termine how and above all where productivity can be increased and the supply process organ-ized more efficiently. 1. The Problem
Managing a total of over 3.2 million hec-tares of forest and 246,000 hectares on aver-age, German and Austrian forest management agencies have downsized personnel considerably in recent years. For the most part, administrative staff has been transferred from business opera-tions to other domains. Various indices from the annual German Federal Government Agriculture Report and the individual forest management agencies’ annual reports reveal that, among other things, the mechanization of harvesting and the outsourcing of work with high labor costs approximately halved the share of labor costs from its original 40% to a good 20%. However, indirect labor costs rose so much in the same period that staff reductions did not result in any savings and labor costs even rose [Sek02].
Trends discernible in the reforms and ra-tionalization in Germany indicate forest manage-ment agencies will continue to concentrate on their core competence of organizing and supply-ing timber and to downsize administrative and forestry staff [7]. This has been recommended by diverse cluster studies conducted in various German states, which identified labor costs as a particular weakness in SWOT analyses and a commensurate need for action [3].
The steadily rising demands on the actors in the supply chain to react rapidly and flexibly to ever more complex external market influences makes efficient and transparent planning and monitoring of the supply chain essential. There-fore, various national and regional projects have been initiated in Germany in recent years to sys-tematically identify existing problem areas and possible solutions. The outcome has been the identification of basic conditions for organiza-tional and operational structuring as factors that actively influence a timber value added chain free of format changes (Landesforstverwaltung NRW, 2003). Moreover, the standards ELDAT [5] and GeoDat ShapeForst [6] have been devel-
oped for select aspects of data exchange related to timber logistics.
Numerous studies and projects have dem-onstrated that cross-actor and sustainable infor-mation and data processing, i.e. electronic in-formation exchange, facilitate more efficient organization of logistics. Specifically, solutions that eliminate format changes, fundamentally improved planning and control processes, optimi-zation algorithms for routing and return cargo, spatial data and mobile technologies have been employed to achieve the desired effects. How-ever, general and wide ranging implementation of project results and standards has been thwarted as much by attempts by states and organizations to go it alone as by
- Heterogeneous IT infrastructures, - Inadequate interface standards for
cross-actor and cross-system timber lo-gistics,
- Hardware and software incompatibilities and
- Unacceptable sales and cost concepts from IT service providers.
Such obstacles not only diminish accep-tance among the smaller partners being inte-grated during the development of such projects, i.e. SME, but also increase the reluctance among larger companies to invest in and implement them.
2. Solutions
The intensified use of electronic data ex-change to optimize internal company processes also constitutes a great risk. The implementation of or the pressure to implement electronic data exchange may generate costs for service provid-ers and customers, i.e. costs in the supply chain may be shifted from one actor to another.
Various approaches may be considered to identify sustainable solutions for this and the aforementioned problems of acceptance and readiness to invest. They must be compared bearing in mind the constraints on the actors involved who have their own priorities when it comes to electronic data exchange and ensuring service providers are properly equipped with I&C equipment. Three approaches with own advan-tages and disadvantages are conceivable:
- An industry solution - An integrated solution or - An integrative solution. Unlike in the automotive industry for in-
stance, a complex industry solution would not
29

SERVICES FOR SUSTAINABLE FOREST TIMBER SUPPLY CHAIN PLANNING AND CONTROL: …
function here in light of the number of actors acting as timber providers, service providers or timber buyers. The technical requirements are too complex and could not be implemented for every actor involved. In addition, there are other major challenges, e.g. creating a user and rights concept that meets with acceptance.
Integrated solutions, so-called platforms, have minimal user requirements. An Internet connection usually suffices to be able to utilize such solutions. The challenge of creating an ac-cepted user and rights concept is the drawback
here too. Moreover, the time and labor required and thus the costs to operate and update the platform, e.g. by connecting other actors’ sys-tems through new interfaces, and to secure data and transmission are indeterminate.
An integrative infrastructure based on inter-faces and services represents an alternative solu-tion all actors can use to employ specific ser-vices geared toward their core processes to elec-tronically exchange data on the one hand and to improve their own processes on the other hand.
Fig. 1. Overview of alternative solutions
The implementation of these solutions con-
fronts service providers, with the great challenge of preparing themselves to handle IT, especially if they have never implemented IT. At any rate, a cross-actor solution necessitates a well con-ceived concept that factors in the integration of such solutions in internal company processes and existing IT structures. 3. Implementation
Landesforstbetrieb Sachsen-Anhalt was one of the first public forestry operations induced by structural changes accompanied by radical downsizing to make new demands pertaining to communication and coordination on its remaining staff and its service providers. Since the reduced staff is supposed to organize even more logging, efficient information exchange free of format changes has become indispensible.
Initial projects aimed at producing solutions and applications to achieve these goals devel-oped and piloted a complete technical system for Saxony-Anhalt’s forestry and wood processing
industries. Originally designed purely as a plat-form, the suggestions and expectations of nu-merous actors involved in the timber logistics process were incorporated to produce the first ever approach to an integrative platform for the planning, control and monitoring as well as con-trolling of timber supply chains. It constituted the basis for a concept to coordinate processes be-tween the actors involved in the supply chain from the forest to the factory. The complete solution not only served as the core system for the roll-out of technical equipment and IT appli-cations for different target groups but also the operation of an integrative platform and the pro-vision and further development of individual ser-vices.
In many cases, the actors combined the rig-orous use of complete integrative systems in their daily routine with the organization or reor-ganization of their internal workflows or even the upgrading and customization of their IT systems with interfaces and applications for mobile ter-minals. This especially occurred among individual
30

Mike Wasche, Ina Ehrhardt
actors who intended for their already existing sophisticated internal systems to exchange data with the overall system in the future.
This was the impetus to begin progressively implementing high value added solutions to util-ize existing technical options and, above all, pro-vide every partner access. The individual mod-ules of the complete system were prioritized and implemented within the integrative approach, i.e. existing solutions were adapted and equipped with appropriate interfaces for cross-actor infor-mation exchange. By quickly taking advantage of the technical options at its disposal, this ap-proach enabled Landesforstbetrieb Sachsen-Anhalt to generate appropriate models that are conducive to its own internal processes (direct benefit) and provide every (direct) partner access (indirect benefit). Ultimately, initial improvements were made in cross-actor communication and the logistics process was modified.
Obstacles included the forestry sector’s lack of any integrated cross-actor and cross-industry infrastructure that might aid in combining ser-vices geared toward core processes. Conse-quently, there is still not any substantial elec-tronic data exchange. The implementation of solutions for electronic data exchange creates an opportunity to convince service providers who
have little or no technical equipment at their disposal of the value added of a solution and electronic data exchange and, where necessary, to invest in equipment on the service provider side.
Exchanging electronic data with every client is but one way transport service providers may take advantage of the practicable solutions with value added. Given the current market and eco-nomic situation, route planning solutions with efficient scheduling of one’s own drivers’ and routing including driver instructions are ex-tremely interesting economically. The results of planning can also be transmitted through elec-tronic channels. Furthermore, vehicles can be monitored with localization technologies and, where applicable, provided new job orders at short notice. Information on the status of the execution of transport orders can additionally be obtained when the driver utilizes appropriate software solutions, e.g. off-road-navigation sys-tems, or hardware solutions, e.g. telematic boxes with status keys. Status information can in turn be incorporated in carriers’ planning proc-esses and, as an overview of electronic data exchange in an integrative infrastructure illus-trates (Fig. 2), are also interesting for the Lan-desforstbetrieb.
Fig. 2. Value added through extended solutions for carriers
Not only transport service providers but also
actors with other jobs and functions in the sup-ply chain are clamoring for such solutions for implementation in their organizations. Nonethe-less, they will only invest in such systems and only incorporate them in their operations when they maximize value added and, for example, the job order data from every client can be transmit-ted electronically. This presupposes data is ex-
changed through standardized interfaces to keep costs to a minimum. 4. Use in the Field
Electronic data exchange based on the con-cept of an IT infrastructure integrating various actors’ solutions and applications has been im-plemented in Saxony-Anhalt. The actors in-volved, existing interfaces and implemented solu-tions interact in a variety of ways (Fig. 2).
31

SERVICES FOR SUSTAINABLE FOREST TIMBER SUPPLY CHAIN PLANNING AND CONTROL: …
The Landesforstbetrieb, forest service pro-viders and the timber industry have implemented internal information systems for internal process planning, control and accounting (1 and 2 in Fig. 3). These stationary central systems are supple-mented by mobile solutions (3 and 4) used by staff on site to collect and process information, e.g. applications to capture data on harvester harvests, register decks or navigate. Data or machinery captured and being captured by com-pany staff on site is exchanged with the central system through interfaces.
Standardized interfaces are particularly im-portant where the process shifts to the carriers. While the ELDAT standard was already defined earlier for data exchange between forestry en-
terprises and the wood processing industry (7), universally valid rules for the exchange of logisti-cal information were and still are nonexistent. Therefore, a process has been initiated in Saxony-Anhalt to reach agreement with trans-port service providers on standardized formats for the purpose of efficient data exchange (5 and 6). This is a significant competitive aspect espe-cially for smaller (transport) service providers since they have neither complex internal systems with professional data import and export func-tions at their disposal nor the necessary person-nel and financial capacities to create and main-tain the numerous data interfaces generated by business relations with normally several forestry enterprises and processing companies.
Fig. 3. Efficient logistics with electronic information exchange
Once they have imported electronic data on
the execution of outbound transportation job orders from the Landesforstbetrieb or wood processing industry’s central systems through standardized interfaces case by case, the carriers employ internal solutions (8) to schedule trans-portation orders and manage the outbound transportation of timber. Technical and human resources’ time and capacity are planned, sup-ported by functions for routing and transport optimization. Prior electronic capture of informa-tion on the timber’s geographic location (3 and 4) and its transmission to the carrier makes this possible. Dispatched transport orders are then no longer handed over to the assigned drivers on paper since their mobile systems (normally a
PDA or tablet PC) usually furnish them with functions for navigation and transport order status reporting (9). Navigation that also allows off-road driver route guidance to a specified deck coordinate can significantly reduce time spent searching for or being shown the way – a clear gain in efficiency both for the carrier and the client.
The functions for reporting the status of transport orders generates another advantage from drivers’ use of mobile systems. By captur-ing the information whether a deck is fully out-bound, can be driven to again for a complete load or has been reduced to a small load, the dispatcher obtains a prompt and up-to-the-minute overview of the status for internal plan-
32

Mike Wasche, Ina Ehrhardt
ning. Moreover, relevant for control and account-ing purposes, the electronic exchange of this information with clients (10) can likewise gener-ate more transparency and efficiency. Conclusion and Outlook
Work on providing applications and services to improve logistics in timber supply processes from the forest to the factory has reached a point where initial applications such as deck management, route management and off-road navigation have already been implemented among actors in Saxony-Anhalt and other sup-plementary value added solutions with great potential are being developed further. At the same time, existing solutions are being rolled out further and interfaces refined and adapted. Other German state forestry operations and wood processing industries have initiated projects modeled on the approaches from Saxony-Anhalt and aimed at implementing preparatory measures to utilize these solutions. Among others, this includes processing data for navigation and im-plementing interfaces for data exchange. These activities are accompanied by a desire to develop interstate cooperation that will ultimately be instrumental in establishing acceptance among small and medium-sized service providers. Cur-rent research activities related to the solutions for information exchange and improved logistics are, for instance, focusing on the use of ad-vanced identification technologies (RFID). Among others, the goal is to make essential information pertaining to the timber, e.g. provenience and quality, clearly available at every point in the material flow so that there can be no mix-ups.
The development of a basic infrastructure is a fundamental basis for implementing and rolling out the developed solutions, particularly among the smallest actors in the timber supply chain. The Fraunhofer IFF is also addressing this aspect in its development work and endeavoring to es-tablish appropriate collaborative relations with hardware and software providers and distribu-tors.
An important success factor of the ap-proach thus far has been the well-conceived IT
concepts matched to the processes and the col-laborating parties (internal staff, service provid-ers, clients, etc.). Actors will only be moved to invest when they are convinced they will benefit directly and indirectly, i.e. through value added.
Another aspect that has led to the success of the approaches from Saxony-Anhalt was the intention to produce not high end solutions in the first stage but practicable implemented solutions with high value added instead.
References: 1. Bundesministerium der Justiz (2006). Bundes-
waldgesetz. Berlin. 2. Bundesministerium für Verbraucherschutz,
Ernährung und Landwirtschaft (2002). Die zweite Bundeswaldinventur – BWI 2, Das Wichtigste in Kürze. Bonn.
3. Landesforstverwaltung NRW (2003). Clusterstudie Forst & Holz. In: Schriftenreihe der Landes-forstverwaltung Nordrhein-Westfalen; Ministerium für Umwelt und Naturschutz, Landwirtschaft und Verbraucherschutz des Landes Nordrhein-Westfalen August 2003; ISBN: 3-9809057-2-1, Heft Nummer 17.
4. Rüther B., Hansen J., Spellmann H., Nagel J., Möhring B., Schmidt-Waller P., Dieter M.: Cluster-studie Forst und Holz Sachsen-Anhalt. Nordwest-deutsche Forstliche Versuchsanstalt (NW-FVA), Göttingen, 2008.
5. Holzabsatzfonds, Absatzförderungsfonds der deutschen Forst- und Holzwirtschaft: www.infoholz.de Wirtschaftsfaktor Forst & Holz ELDAT Forst & Holz Projekt ELDAT Software. In: http://eldat.infoholz.de (10.01.2009).
6. Kuratorium für Waldarbeit und Forsttechnik e.V. KWF: Formatbeschreibung zur Erstellung einer forstspezifischen Navigationsdatenbasis – Prag-matisches Shape Forst- Version 3.0. In: http://www.kwf-online.de/deutsch/arbeit/geodat/ Spezifikation_pragmatischesshapeForst_3_0.pdf (10.01.2009).
7. Ripken H.: Developments in the cost of personnel and personnel reduction within the German state forest administrations. Forst und Holz; Germany, 2000, v. 55(20) p. 643-647.
8. Sekot W.: Wirtschaftliche Entwicklung des Großwaldes 1977-2002. Forstzeitung; Ausgabe 12/2002.
33
УПРАВЛЕНИЕ И УСТОЙЧИВО РАЗВИТИЕ 2/2009(23) MANAGEMENT AND SUSTAINABLE DEVELOPMENT 2/2009(23)
COMPETENCE APPROACH IN EDUCATION OF MANAGERS
Alla Sorokina
Belarusian National Technical University, Minsk, The Republic of Belarus
Abstract
The article is devoted to updating managers’ education in sustainable development. In the period of integra-tion when different national economies are coming closer in their activities, when capital of different countries is implicated in more attractive and profitable business, when cooperation between different companies is becoming deeper the content of higher education of managers demands to be renewed. The situation causes the adoption of new Education Standard and the revision of old curricula, development of new ones based on a competence ap-proach. An application of a competence approach in education of managers will upgrade the effectiveness of edu-cational process; will help to develop different competences in future managers. We pay much attention to a communicative competence. The term a communicative competence comprises “linguistic competence”, “sociolin-guistic competence”, “discourse competence”, “strategic competence”, “sociocultural competence” and “social competence”. A manager should possess a communicative competence in order to perform his responsibilities in communication with foreign partners, foreign employees.
Key words: education of managers, competence approach, professional communicative competence. Globalisation continues to confront citizens
of any country with new challenges. That’s why each citizen needs a wide range of key compe-tences to adapt flexibly to a rapidly changing world. European Reference Framework for Key Competences for Lifelong Learning identifies the key competences that citizens in every country require for their personal fulfillment, social inclu-sion, active citizenship and employability in our knowledge-based society. [5]
The rapid pace of change means that citi-zens of any country should not only possess the generic competences that will help them to adapt to change, they should develop up-to-date job- related competences that contribute to the motivation, innovation, productivity, competi-tiveness, job satisfaction and affect the quality of work. Education and training systems should support the development of competences for all young people, should give real opportunities to all adults to learn and maintain competences. Education in every country should make lifelong learning a reality for all citizens.
“Lifelong learning has become a necessity for all citizens. We need to develop our skills and competences throughout our lives, not only for our personal fulfillment and our ability to actively engage with the society in which we live, but for our ability to be successful in a constantly changing world of work. [5]
To follow the necessity of development of up-to-date job-related competences the Republic of Belarus has done its best to modernize higher education. In 2008 New Educational Standard of
First Degree (sphere of social subjects and the humanities) was adopted. [3, 10]
Standard promotes specialization of higher education: transition from higher academic, fun-damental education to professional education that will meet the demands of the future profes-sional activity of students. It caused revision of old curricula, development of new ones to up-grade the effectiveness of educational process.
Educational Standard of First Degree is based on the principle of a competence approach in education and training of managers. The key component of a competence approach is the term “competence”. N. Homsky proposed the term «competence» firstly in 1965 (Massachu-setts) conformably to transformation grammar and language teaching theory. Nowadays it is widely used in all spheres of our life. We con-sider it as a combination of knowledge, skills and attitudes appropriate to the context.
I work at the Faculty of Marketing, Man-agement, Entrepreneurship of Belarusian National Technical University. We are responsible for education and training of future managers.
According to Educational Standard of First Degree managers by the end of education and training must develop the following competences to the level that equips them for further learning and working life. A range of competences for managers are grouped into three key manage-ment areas: understanding business organisation, managing resources, managing people.
1. Understanding business organization includes
34

Alla Sorokina
- understanding the structure and behav-iour of organization,
- understanding business and organisa-tional strategy,
- developing management strategy. 1.1. The competence understanding the
structure and behaviour of organisation covers understanding the ways in which an organisation is structured (public, private, institutional, multi-national, etc.) and how it operates to achieve its objectives, the decision making process within the organization; company culture; the business lifecycle from start-up to maturity; the principles, tools and techniques of continuous improvement and the benefits these can bring.
1.2. Understanding business organisation includes the competence understanding business and organisational strategy, both to support their relationship with their customers and to apply to their own areas. This competence covers the way an organisation sets strategies for business.
1.3. The competence developing man-agement strategy of this management area means that managers need to be able to evaluate and assimilate new ideas and to implement the appropriate ones for their own organisation.
2. Managing resources includes - procurement, - risk management, - financial management, - quality management, - information management. 2.1. The competence procurement covers
purchasing strategy for goods and services; de-velopment of standard specifications; under-standing contract types, use of standard terms and conditions, evaluation and cost comparisons; keeping up with contract legislation and practice.
Managers need to be able to develop a pur-chasing strategy for goods and services. They need to understand the different contractual ar-rangements available and select the most appro-priate one for each area. They need to make rea-sonable decision about the most appropriate pro-curement option, term contract, and understand the benefits and risk of each. Managers need to be able to write specifications for the procure-ment of both goods and services. They need to minimize risk by ensuring that our suppliers work to our terms wherever possible. Managers need to understand all the elements that make up the cost of contracts or goods.
2.2. The competence risk management covers the application of risk management tech-
niques; risk analysis; reducing risk; understand-ing risk transfer.
2.3. The competence financial management covers understanding financial systems and process; managing capital and revenue budgets; managing cash-flow, understanding VAT and tax regulations.
2.4. The competence quality management covers the principles of quality strategy, assur-ance and control; the application of quality man-agement principle to initiate improvements; the design of management of quality systems and procedures; understanding quality accreditation schemes.
2.5. Information management is the compe-tence that covers successful implementation of IT systems. Managers need the information management competence to analyse data in the most appropriate way; to manage information flow; to select the information and use it at the right time for supporting good decision-making.
3. The next management area is managing people. It includes
- people management, - communication. 3.1. The competence people management
helps managers to plan and manage workload, to ensure adequate resource availability. As manag-ers, they must be able to recruit people with right skills and experience. Selecting and recruit-ing appropriate people is a very important com-ponent of the competence as personnel is the main company’s resource to bring it to success.
To get the best from their team, managers must be able to identify training needs to make staff more qualified.
The next component of this competence is understanding the importance of motivation, rec-ognition and reward. Managers must recognize the importance of motivation, recognition and reward in improving team and individual per-formance and retraining staff. They need to im-plement and manage appropriate policies for their employees.
When staff leaves, a manager must mini-mize the negative impact on both the organisa-tion and individuals. That’s why managers need to manage dismissal, resignation, redundancy and retirement not to fail business. Moreover they must be familiar with relevant legislation and ensure it is correctly implemented and man-aged.
3.2. Managing people includes communica-tion competence. Managers must communicate
35

COMPETENCE APPROACH IN EDUCATION OF MANAGERS
with a wide range of people including staff, su-periors, clients, customers, suppliers and the general public. This competence covers the benefits of good communication; written, pres-entation and listening, negotiation skills.
Face-to-face communication skills enable them to handle a range of situations from meet-ings with suppliers to presentations and confer-ence speeches. Good communication skills can help minimize conflict and maximize perform-ance, achieve the desired result from the target accidence, lead effective meetings, discussions.
Managers need to communicate clearly and concisely in written documents: e-mail, memos, letters, proposals, etc. They need to be able to write in a style appropriate to the audience.
Managers must demonstrate good listening skills. These skills are very valuable for managers when dealing with staff, clients, customers, suppliers and are a useful technique for conflict resolution.
Moreover managers conduct a lot of nego-tiations. They should understand the win-win concept of negotiation and apply it consistently to achieve attractive resolution.
Managing people includes communication in foreign languages. In the period of integration when different national economies are coming closer in their activities, when capital of foreign companies is united and when it is impossible to get and extend market and foreign-economic re-lations without the knowledge of foreign lan-guage. The communicative competence [17] is becoming very vital. It is the very instrument that will help a manager to feel free in the pre-sent-day world, accurately perform his profes-sional duties and easily widen his outlook by dif-ferent information sources.
Chomsky introduced the term «compe-tence» in 1965 (Massachusetts University). It applied to linguistics and denoted the knowledge of language system but not using it in a real communication. Later on in contrast to Chom-sky’s linguistic competence a new term of com-municative competence appeared in foreign and soviet methodology (methods of teaching). By this term they understood the ability to commu-nicate in different situations in the process of interaction with other participants, use the lan-guage system and speech norms correctly and choose the right communicative behavior, ade-quate to authentic communicative situations [7].
Later on the term “communicative compe-tence” is used not only in the methods of lan-
guage teaching but also in the sphere of higher education for achieving professional levels in administration, government (leadership) and management [12, 1, 10, 4, 11]. We will talk about communicative competence [17] con-nected with a foreign language communication in the sphere of profession and will later on call it professional communicative competence. It con-sists of several competences: linguistic, sociolin-guistic, sociocultural, strategic and discourse competences.
Linguistic competence by which we assume the acquirement of the definite general knowl-edge and adequate to it skills, related to different language aspects such as vocabulary, phonetics, grammar should be enriched by the knowledge of economic terms and notions. Besides, apart from linguistic competence a sociolinguistic competence is necessary for adequate solving communicative problem in each and every case. By sociolinguistic competence we understand the ability to choose the right language form ac-cording to the situation that has place and time, is characterized by peculiarities of communica-tive partners, aim of communication and etc. For this, one should know the semantic peculiarities of words, word combinations and what influence they can have on interlocutors. One can learn it by knowing the lifestyle and way of thinking that is formed by centuries, national character of con-trasting parties, behavior patterns of business partners, rules of speech norms in a business situation, polite expressions, etc. Very often the latter have a decisive importance for establishing contacts and have successful impact on inter-locutors in the process of communication.
All mentioned above leads to the necessity of forming sociocultural competence. But to solve the problems of communication in business sphere correctly and to achieve good results one should have definite abilities and skills in organiz-ing the speech, be able to make it logical, con-sequent and convincing, use verbal and nonver-bal strategies if some difficulties in communica-tion occur. All this is a completely new level of communicative competence that in EU materials is called strategic and discourse competence. And the last element of communicative compe-tence is social competence. By it we assume the willingness of a manager to interact with others, ability to communicate, show tolerance to other people’s views.
Thus, by professional communicative com-petence we understand the ability to communi-
36

Alla Sorokina
cate in different situations with business part-ners, accurately use the language system and speech norms and choose communicative behav-ior in accordance with the authentic situation of communication.
Willingness to use English in business com-munication or acquirement of professional com-municative competence becomes an important factor of a manager’s professional level.
Since manager’s personality reveals in activ-ity and is considered as a subject, several ap-proaches should be the basis of professional communicative competence teaching: learner-centred approach (manager is an active subject of his own administrative activity) [2, 15, 16]; activity approach (education of a manager is real-ized through activity that imitates professional sphere) [6, 9]; communicative approach (the pe-culiarity of professional activity of a manager implies establishing numerous business contacts with partners) [8, 13, 14]; integrated approach (interrelated teaching of all kinds of communica-tion: listening, speaking, reading and writing) and competence approach.
The demand in highly skilled experts forces to make foreign language teaching in profes-sional spheres very relevant. This can be achieved through using special methods that al-low teachers to make the process of education closer to reality by plunging students into the atmosphere of their future profession.
Case-method is one of them [18]. The es-sence of this method is presenting the main as-pects of economic problem. After studying ana-lytical and statistic materials students get in-volved in the process of searching different deci-sion-making strategies of the suggested eco-nomic problem. All the actions done by students are driven by the desire to participate in the ac-tivity and not to get knowledge or skills. The work is finished by general discussion of a deci-sion-making strategy.
Foreign language communication in profes-sional spheres is realized through case-method in different forms: monologue (presentation, public speaking); dialogue (business talk, discussion, interview, phone talk); polilogue (negotiations, meeting, business game, seminar, conference, symposium). In real communication all these forms are interconnected.
Case-method gives opportunities to apply all theoretical knowledge of economic subjects, al-lows to get experience in solving real problems in the sphere of management, improves communi-
cative competence, develops the culture of busi-ness communication, teaches to work in a team, forms management capabilities, teaches effec-tive methods of presentation.
In the process of teaching foreign language communication in professional spheres the fol-lowing skills are necessary for getting profes-sional communicative competence. The key ele-ments of professional communicative compe-tence are:
1. (speech) communicative skills, which are formed on the bases of language knowledge and skills, and linguistic as-pect of cross-cultural studies;
2. strategic skills: to participate in profes-sional communication, using different speech strategies (negotiations, public speaking, discussion, report); to lead your own strategy; to adhere to earlier expressed way of behavior; to build a clear and logical structure of the state-ment; to establish connections between facts in the process of discussing busi-ness matters; to single out the most valuable information.
On the advanced level of teaching foreign language communication in professional spheres students’ statements can be regarded as a mix-ture of prepared speech (search for information, thinking of decision-making strategy, making a plan of the statement, writing theses and etc.) and unprepared speech because in the process of business communication students will have to solve the tasks, using the covered language ma-terial, both in familiar and unfamiliar situations relying on the knowledge of economic subjects that were acquired earlier.
The success of building professional com-municative competence in the process of teach-ing communication in professional spheres is achieved through professional authentic materi-als: newspaper and magazine articles, press re-leases, catalogues, booklets, advertisements. They are necessary information sources, related to a professional occupation. Authentic materials contribute to learning and studying professional terminology. They help to find the way out of the suggested problem. Moreover, authentic ma-terial is a carrier and source of culture-specific information that can be obtained through the Internet.
For teaching foreign language communica-tion in professional spheres such software pack-ages as Power Point (for making presentations)
37
COMPETENCE APPROACH IN EDUCATION OF MANAGERS
and Excel (for building tables, diagrams, making mathematical tasks) are used. The application of the set of methodological approaches leads to a success in mastering professional communicative competence. Moreover foreign language teachers should take care of tools to be a success in lan-guages teaching.
Computer-mediated communication (CMC) tools are just the tools which allow foreign lan-guage teachers to teach future managers to es-tablish and to support contacts with their future business partners. Computer-mediated communi-cation (CMC) has taken on different forms: from (Web 1.0) e-mail, chat and online forums to so-cial software (Web 2.0) such as blogs, wikis, podcasts, audio and video conferencing, etc. These new forms of communication are becom-ing an integral part of our modern life and taking their right place in the language classrooms en-gaging learners in authentic language learning experiences. Through the use of CMC language learners can develop professional and intercul-tural communicative competence, lifelong learn-ing skills and digital literacy for becoming com-petitive managers.
These 3 competences: understanding busi-ness organisation, managing resources, manag-ing people are considered equally important, be-cause each of them contribute to a successful life and career in a knowledge society. A man-ager should possess them in order to perform his responsibilities. Implementation of a competence approach in education and training of managers will upgrade the quality and effectiveness of educational process.
References:
1. Байденко, В.И. Компетенции: к освоению компетентностного подхода / В.И. Байденко. М., 2004; Байденко, В.И. Концептуальная модель государственных образовательных стандартов в компетентностном формате / В.И. Байденко. М., 2005; Байденко, В.И. Компетентностный подход к проектированию государственных образовательных стандартов высшего профессионального образования (методологические и методические вопросы) / В.И. Байденко. М., 2005.
2. Бим, И.Л. Личностно-ориентированный подход – основная стратегия обновления школы // Иностранные языки в школе. – 2002. - № 2.
3. Высшее образование. Первая ступень. Цикл социально-гуманитарных дисциплин. Вышэйшая
адукацыя. Першая ступень. Цыкл сацыальна-гуманітарных дысцыплін. – Минск: Министерство образования Республики Беларусь, печ., 2006. – IV, 26с. – (Образовательный стандарт) (Руководящий документ Республики Беларусь).
4. Делор, Ж.. Образование: сокрытое сокровище / Ж. Делор. ЮНЕСКО, 1996.
5. Eigel Ján, Key competences for lifelong learning. European References Framework. Luxembourg: Office for Official Publications of the European Communities. 2007-12, p.1.
6. Жук, А.И., Кашель, Н.Н. Деятельностный подход в повышении квалификации: активные методы обучения. – Минск: ИПК образования, 1994. -93с.
7. Колесникова, И., Долгина, О. Англо-русский терминологический справочник по методике преподавания иностранных языков. – СПб.: Изд-во «Русско-Балтийский информационный центр «БЛИЦ», «Cambridge University Press», 2001г. – 224с., p. 29
8. Концепция коммуникативного обучения иноязычной культуре в средней школе / Под редакцией Е.И. Пассова, В.Б. Царьковой. М.: Просвещение, 1993.
9. Леонтьев, А.Н. Деятельность, сознание, личность. – М.: Политиздат, 1975. – 304с.
10. Макаров, А.В. Проектирование стандартов высшего образования нового поколения: компетентностный подход // Вышэйшая школа. 2006. №5.
11. Проблемы качества образования. Кн. 2. М.; Уфа, 2003, p. 7-8
12. Равен, Дж. В современном обществе. Выявление, развитие и реализация / Дж. Равен. М., 2002.
13. Brumfit, Ch. and Jonson, K. The Communicative Approach to Language Teaching. Oxford: Oxford University Press, 1979.
14. Brumfit, Ch. Communicative Methodology in Language Teaching: The Roles of Fluency and Accuracy. Cambridge: Cambridge University Press, 1992.
15. Hutchinson, T., Waters, A. English for Specific Purposes: A Learning – centred Approach. Cambridge: Cambridge University Press, 1993.
16. O’Malley, J.M. and Chamot, A.U. Learning Strategies in Second Language Acqusition. Cambridge: Cambridge University Press, 1995.
17. Sheils, J. Communication in the Modern Lan-guages Classroom. Strasbourg: Council of Europe Press, 1993, pp.1-2.
18. Uber-Grosse, C. The Case Study Approach to Teaching Business English. English for Specific Purposes 7/2.
38

УПРАВЛЕНИЕ И УСТОЙЧИВО РАЗВИТИЕ 2/2009(23) MANAGEMENT AND SUSTAINABLE DEVELOPMENT 2/2009(23)
THE IDEA OF SUSTAINABLE DEVELOPMENT AND HUMAN RESOURCES
MANAGEMENT
Krystyna Kmiotek Rzeszow University of Technology, Poland
Abstarct
The aim of the article is the analysis of the relation between sustainable development and human resources
management in companies. The first step in the analysis is to compare these two theories and to point out the similarities as well as the differences between them. The next step of the author is to show how personal man-agement supports the handling of balance between interests of employers and employees. It is also necessary to show that personnel procedures, i.e. selection, evaluation of employees, development and motivation systems, are created not only for the employer’s but also for the employee’s satisfaction. The author is going to show that human resources management is used to reconcile interests of employers and employees. Finally, human resources management provides a tool of applying the idea of sustainable development in the area of employment.
Key words: sustainable development, human resources management, employee satisfaction, partnership
Introduction Recently the issues related to human re-
sources management in a company as well as entrepreneurship or innovativeness have consti-tuted one of the areas of greater importance for managers who incessantly seek new opportuni-ties for the development of business. Seeking new prospects for development takes place in every changing environment which dictates spe-cific conditions and more often imposes very demanding requirements. One of such require-ments is the necessity of incorporating the fea-tures of sustainable development into the devel-opment of a company, which exerts a significant influence on the area of human resources man-agement within a company.
The aim of the article is to analyze the links between human resources management and the idea of sustainable development, the similarities and differences between these theories. The author strives to substantiate the theory that human resources management is a tool of im-plementation of the idea of sustainable develop-ment into the area of employment. The tools applied in human resources management fulfil the function not only of the improvement of the organization at work and an increase in effi-ciency but also quality improvement in life of the staff and the reconciliation of the interests of employers and employees.
1. The theory of human resources management and the idea of sustainable development
In order to explain the essence of human resources management one could use the defini-tions applied by various authors. L.E. Boone and D.L. Kurtz understand human resources man-agement as a process of acquiring, training, de-veloping, motivating and evaluating the objec-tives of an organization as well as undertaking specific activities and creating a proper climate for an organization, which is favourable to the increase in the employees’ satisfaction and their efficiency [2]. Human resources management defined by M. Armstrong is a strategic and co-herent approach to the management of an or-ganization’s most valued assets – the people working there, who individually and collectively contribute to the achievement of its objectives [1]. Also Polish authors present a similar ap-proach. For instance T. Listwan defines person-nel management as a set of activities related to people, aimed at achieving the objectives of an organization and satisfying the employees’ needs (employees’ development) [12]1.
In the presented interpretations it was ex-plicitly emphasized that human resources man-agement constitutes a tool of achieving the ob-jectives of an organization. However, this area of company management should not be viewed
1 It could be assumed that in the interpretation of T. Listwan the terms of personnel management and human resources man-agement have the same meaning because the author uses the term “personnel management” to define the modern approach to the personal function. A similar, more elaborate though, interpretation of human resources management is presented also by A. Pocztowski, [8]
39

Krystyna Kmiotek
only from one vantage point, from which only business goals can be perceived and attained. After all, a series of arguments can be put for-ward, which testify that in the theory of human resources management much appreciation is given to the vital role of an employee in achiev-ing company’s goals and to the necessity of the subjective treatment of the specific type of capi-tal – the human capital.
Such an approach to an employee is indi-cated by the characteristics of human resources management identified by authors who study these issues. According to M. Armstrong the characteristics of human resources management are as follows [1]:
- diverse, - strategic, with an emphasis on integra-
tion, - commitment-orientated, - based on the belief that people should
be treated as human capital, - unitarist rather than pluralist, individual
rather than collective, with regard to employee relations,
- a management-driven activity – the de-livery of HRM is a line management re-sponsibility,
- focused on business values. Apart from business values in human re-
sources management also ethical, moral values are of importance: the treatment of employees not as a production factor but as human capital and the management of such capital in a respon-sible way. Although an inexhaustible source of controversy as to their actual practical applica-tion in management [1], these propositions es-tablish certain principles, according to which tools of the management of people in companies are created. It is worth observing that such an approach is the corollary of the evolutionary changes in management, which, according to W.F. Cascio, occurred in three stages [3]:
- file maintenance stage – at this stage the human resources department per-formed the tasks in the scope of people management, which consisted mainly in the recruitment and the selection of employees and the administration of employment,
- government accountability – at this stage changes in legal regulations in the scope of the protection rights of the employees and the transformations in
the social environment resulted in the extension of the scope of activities con-cerning the workers and the efficiency of people management was evaluated from the point of view of the whole company,
- gaining and sustaining a competitive ad-vantage – at this stage the tasks in the scope of human resources management come within the joint responsibility of experts from the human resources de-partment, who are units closely cooper-ating with managers implementing HRM principles in the area of their activity.
If W.F. Cascio focuses on the practical di-mension of human resources management, the evolution in the philosophy of the approach to employees is also visible in the classification based to a large extent on the theory of man-agement, in which also three stages were distin-guished: the traditional model, the model of the relations of interactions and the model of human resources [10]. This particular perspective visibly demonstrates the transformation from the treat-ment of an employee as „an element of the pro-duction process” who focuses on satisfying his existential needs, then as a member of a group who is oriented toward satisfying social needs and finally as a person who finds self-fulfilment in work and by means of work seeks opportuni-ties for self-development.
Therefore, the analysis of the theoretical principles of human resources management al-lows to state in general terms that it is the area of management, the main purpose of which is seeking “the golden mean” between the interests of employees and employers; it is a tool of shap-ing the social balance in a company. This very aspect constitutes the main nexus between the human resources management and the idea of sustainable development.
The sustainable development of companies thanks to pro-ecological inspiration is frequently associated with the concept of eco-development. According to Agenda 21 sustainable develop-ment is a social and economic development which ensures the satisfaction of the needs of contemporary societies without denying the pos-sibility to satisfy the needs of future generations [5]. The fundamental aspect of such a develop-ment is to seek balance and to harmonize diver-sities, which will allow to reconcile three goals: economic (material), environmental (nature) and
40

THE IDEA OF SUSTAINABLE DEVELOPMENT AND HUMAN RESOURCES MANAGEMENT
social (human) [11]. As a consequence, all these efforts are supposed to boost prosperity but rather as an improvement of the ecological con-ditions of life. This means that the main goal of sustainable development is the increase of the level and, first of all, the quality of life [7].
From the microeconomic point of view a company becomes the subject of development and sustainable development and can be defined itself according to A. Witek-Crabb as a social and economic development of companies, which allows current achievement of aspirations and attainment of goals without denying the possibil-ity to achieve aspirations and attain goals in the future [11]. It is this author’s opinion that such a development is only possible if a company takes into consideration all the circumstances, in which it operates, if it can resist the temptation to gain short-term benefits and if it adheres to basic principles of sustainable development:
- Acquiring the knowledge of the com-plexity and diversity of the activities concerning both internal and external environment, i.e. understanding their circumstances in a very general sense. The rationale behind is that a long-term development of a company depends on numerous essential factors and it is the task of managers to follow any changes in the environment, to do research into the needs of various groups of stake-holders, to fathom the interrelations be-tween diverse factors and to predict changes.
- Harmonizing the complexity and diver-sity, which means opening the owners and managers to participation, partner-ship, negotiations and building long-lasting relations based on trust and hon-esty. The search for compromises pre-vents conflicts, which could hamper the development of a company.
The comparison of the principles of the the-ory of human resources management and the concept of sustainable development allows to draw the conclusion that human resources man-agement is a concept, which allows to imple-ment the idea of sustainable development in the area of personal function. As part of human re-sources management various tasks are carried out and procedures are prepared, the aim of which is to acquire knowledge about the internal environment segment, the management of the employees, to do research into the interrelations
and links and then to harmonize the complexity and the diversity typical of this area. It is a tool, which allows the reconciliation of interests, find-ing “the golden mean” in the employee-employer relations but also in the relations between em-ployees themselves.
2. The practice of human resources management and sustainable development
Sustainable development of the whole com-pany requires the implementation of its principles and its philosophy in all the areas of the opera-tion of the company, in the marketing depart-ment, the financial department, logistics or in the scope of human resources management [4]. At present in the literature of the subject one can encounter a series of concepts, which fit into the philosophy of sustainable development, including the social responsibility of business, business ethics, eco-development of a company, triple bottom line or stakeholder analysis. Each of them constitutes a certain proposition, which serves the purpose of understanding and harmonizing the complexity and diversity, encountered by companies in various areas of their activity.
Human resources management can also be such a tool, the purpose of which is to introduce the philosophy of sustainable development. Ac-tions and procedures from this scope allow to obtain and provide information indispensable for proper personal decisions but also give the op-portunity to look for compromise between the employees’ and the employers’ interests, com-peting as they very often may turn out to be. The personnel procedures can support the phi-losophy of sustainable development in the fol-lowing ways presented in the table 1.
Activities performed as part of human re-sources management can constitute a tool for implementing the concept of sustainable devel-opment in the area of employment, where they will facilitate mutual recognition and understand-ing. From the point of view of an employer it seems extremely important at the very beginning of cooperation to get to know not only the quali-fications, skills of the employee but also his plans and aspirations. On the other hand the candidate for a job should be aware of the op-portunities that are created for him by the com pany he wants to work for. First of all, the ex-pectations as to the character of the job, promo-tion opportunities and the rules of cooperation
41

Krystyna Kmiotek
Table 1. Personnel procedure and sustainable development Procedure Tools Relation with the philosophy of sustainable development Recruitment and selection
The tools of selection: questionnaires, inter-views, references, psychological contract, legal basis for the employment
Looking for a person not with the best qualifications but a person who meets the expectations of the employer but also a person whose expectations concerning the job can be met by the com-pany; the tools used in the selection should be used for mutual recognition of expectations and the negotiations of terms which facilitate long-term cooperation.
Development of employees
Trainings, the creation of organizational cul-ture
Increase in the competitiveness of the employees – this means the development of an employee, an opportunity of self-fulfilment and an advantage for the company; in the organizational culture the promotion of values consistent with the philosophy of sustainable development (in the economic, social and ecological aspect)
Evaluation of employees
Techniques of evalua-tion, psychological contract, research into the expectations of employees
The opportunity to recognize the changes in the mutual expecta-tions and renegotiations of psychological contract, monitoring of mutual expectations of the employer and the employee
Motivation salaries, material moti-vation/non-salary benefits, research into the satisfaction of employees
Decent salary, which provides the employee with social security, conditions for development, the recognition of the needs and expec-tations of the employees, the choice of motivation tools adjusted to the potential of a company and the employees, motivating the em-ployees to develop; motivating the employees to adopt pro-ecological attitudes and conduct; compliance with legal regulations as the prerequisite of trust and honesty in mutual relations, monitor-ing of the employees’ satisfaction
Dismissals outplacement, the research into the opin-ions of employees
Help to the dismissed employees, compliance with legal regulations by both parties,
Source: Own analysis
are concerned here. A long-term, mutually fa-vourable cooperation facilitates agreements con-cerning the most important expectations of both parties. This agreement gives voice to not only the terms and conditions stipulated in accor-dance with legal regulations in the employment agreement concerning e.g. the amount and the conditions of earnings, the extent of working time. The conclusion of an agreement is usually accompanied by an agreement concerning other aspects of work (prospects for development, promotion, the conditions of work, the rules of cooperation), which are called a psychological contract. It is vital to balance this contract in order to strengthen and harmonize the relations between the employer and the employee and the breach of the agreement means that the parties to the contract do not have (or have never had) common set of values or goals [9].
An important aspect of work, both for the employees and the organization is training and development. The very fact of performing work provides the employee with experience thus im-proving his position on the job market. The em-ployer investing in training pays attention to the
updating his employees’ knowledge and to their better work results. On the other hand, he cre-ates favourable conditions for satisfying the need for self-fulfilment, the development of employees or their self-esteem. In the aspect of sustainable development this element of human resources management concerns first of all the improve-ment of the quality of the lives of the employees and constitutes a prerequisite for a harmonious, long-term cooperation. It is worth mentioning that this very idea should also be the subject of training to instill into the employees’ minds a way of thinking in the categories of sustainable development.
For the employee the procedure of employ-ees’ evaluation provides feedback concerning the evaluation of his work, whereas for the employer it is an important source of information about the potential of the employed workers. It is also an opportunity to get to know the changes in the mutual expectations of the employee and the employer. As a result, from the perspective of the concept of sustainable development the evaluation of employees is a tool of getting to
42

THE IDEA OF SUSTAINABLE DEVELOPMENT AND HUMAN RESOURCES MANAGEMENT
know the employees and creates conditions for harmonizing the cooperation.
It seems that motivation is one of the most important aspects of introducing the idea of sus-tainable development in the area of employment. Starting from the salary, which not only moti-vates employees but also determines their level of life because for most employees it is the only source of income. The motivating instruments applied by the company give the employees the opportunity to satisfy various needs thus influ-encing their quality of life. Therefore the system of motivation should be built on the basis of the research into the expectations of the employees and that is why it will be an efficient system, which performs its function well and, on the other hand, which increases the satisfaction of the employees. In this way the conditions for sustainable development are fulfilled.
The last stage of the personnel process, i.e. the dismissal of the employees, can also serve the purpose of application of the ideas of sus-tainable development. At this stage the mutual cooperation ends and that is why the goal of long-term cooperation is not important any more, but it is still vital to pay attention to the quality of relations and the responsibility of both parties, the employee and the employer. Companies use here the surveys of the employers’ opinions in order to get to know and understand some proc-esses and to be able to deal with them. More-over, companies offer help to the dismissed em-ployees in the form of outplacement schemes.
Every action being the part of human re-sources management is strictly regulated by the provisions of labour law, which specifies the scope of the freedom of negotiations between the employer and the employee. Starting from the choice of the type of an employment agree-ment, which to a bigger or smaller degree guar-antees the security of the employee’s employ-ment and by means of salary conditions (the minimal pay), the guarantee of safe and hygienic work conditions, working time or work condi-tions (e.g. the prohibition of discrimination) to a great extent influences the quality of the em-ployee’s life.
The procedures form the scope of human resources management and can be used for im-plementing the concepts of sustainable develop-ment but even here some problems cannot be avoided. At the stage of looking for a new em-ployee, the candidates very often pass over their expectations or choose not to speak openly
about them because their main aim is to get a job, this being their most urgent need at that moment. At times, the intentions and goals in the scope of occupational development of an employee do not overlap with the direction of the development of the company. The research on the training needs may be useless so as a perfectly organized procedure of employee train-ing. In each of these personnel procedures it has to be taken into consideration that we deal here with a person who, on the one hand, is driven by the calculation of benefits and contributions but, on the other hand, emotional factors play the decisive role in his choices.
Conclusion
For managers one of the most important and at the same time the most burdensome fea-tures of the contemporary business environment is indefiniteness and uncertainty. “Stormy times” as they were defined by P. Drucker bring with themselves not only a fast pace of changes but also their character is difficult to predict. It is connected with the fact that the uncertainty to a lesser extent comes from the world of nature and to a greater extent from the social world, which is the creation of man. It seems that the concept of sustainable growth constitutes a proposition how to deal with the uncertainty of the environment. Human resources management provides tools, which can limit the uncertainty and unpredictability characteristic for the social capital of a company. Getting to know the mu-tual expectations, understanding the limited ca-pabilities and the consensus between the em-ployee and the employer are possible with the support of human resources management.
The scope of human resources management is an especially difficult area because of the changeability of the human nature. The expecta-tions, aspirations very important for an employee at the stage of searching for a job or at the very beginning of employment may change after some time. And the company cannot change that. What lies within the scope of capabilities of managers is the issue of following the changes in such a way that they can suitably change what they are able to.
Some reservations as to the usefulness of personnel procedures in the implementation of the idea of sustainable development may be put forward because of the quality of these proce-dures and their scale of use. Formal personnel procedures function in big, developed compa-
43
Krystyna Kmiotek
nies, which act on a large scale. The majority of companies from the SME sector2, which consti-tute a significant percentage of business entities, do not have such procedures. It concerns mainly small business entities and micro companies, where the tasks from the scope of personnel management come within the duties of the owner, who also performs the duties of a single-person personnel manager. In such situations, the application of the idea of sustainable devel-opment in the area of employment depends ex-clusively on the awareness and the policy of the owners. In companies, where personnel proce-dures function, their quality is not always at the highest level and the principles of the theory of human resources are often not properly adhered to.
Economic circumstances are a barrier to the implementation of the idea of sustainable devel-opment in the area of employment. The eco-nomic conditions of companies to a large extent exert influence on the amount of expenditures on personnel service and all the financial problems are usually solved first and foremost by means of cost-cutting in the area of employment. That is why another barrier appears, i.e. the knowl-edge, the awareness and the motivation of man-agers. They are the first to decide whether the ideas of sustainable development should be used as the criteria of taking decisions or whether should be considered another utopia, to which only scant attention should be paid.
References:
1. Armstrong M., Strategic Human Resource Man-agement. A guide to action, 3th edition, Kogan Page, London and Philadelphia 2006, p. 3. 8-14
2. Boone L.E., Kurtz D.L., Contemporary Business, The Dryden Press, Chicago 1990, pp. 209-324.
3. Cascio W.F., Managing Human Resources. Pro-ductivity, Quality of Work Life, Profits, McGraw-Hill Book Co., New York 1989, pp. 47-50.
4. Human resources and sustainable development. Driving success, http://www.cpi.cam.ac.uk/pdf/FHR_briefing.pdf , 02.12.2008
5. Keating M., Szczyt Ziemi. Globalny program dzia-łań. Agenda informacyjna „GEA” sp. z o.o., War-szawa 1994.
6. Krajowa Strategia Zatrudnienia na lata 2007 – 2013, Dokument towarzyszący realizacji Naro-dowego Planu Rozwoju na lata 2007-2013, Minis-terstwo Gospodarki i Pracy, p. 13.
7. Pakulska T., Poniatowska-Jaksch M., Rozwój zrównoważony – „szeroka i wąska” interpretacja, stan wiedzy, www.sgh.waw.pl/katedry/kge/BADANIA_NAUKOWE/rozwoj%20zrownowazony-strona%20www_1.pdf, 16.12.2008
8. Pocztowski A., Zarządzanie zasobami ludzkimi. Strategie-procesy-metody, PWE, Warszawa 2007, p. 33.
9. Sims R.R., Human resources management’s role in clarifying the new psychological contract, “Human Recourses Management” 1994, 33(3), p. 373-382
10. Stoner J. A. F., Wankel Ch., Kierowanie, PWE, Warszawa 1992, p. 359 – 361
11. Witek-Crabb A., Zrównoważony rozwój przedsię-biorstw – więcej niż ekorozwój [w:] Zrównowa-żony rozwój przedsiębiorstw a relacje z interesa-riuszami, ed. H. Brdulak, Oficyna Wydawnicza SGH, Warszawa, p. 562, 566
12. Zarządzanie kadrami, ed. T. Listwana, Wydaw. CH Beck, Warszawa 2002, p. 1
2 In Poland companies which employ more than 250 people are only 0,2% of all the employers, [6, p.13]
44

УПРАВЛЕНИЕ И УСТОЙЧИВО РАЗВИТИЕ 2/2009(23) MANAGEMENT AND SUSTAINABLE DEVELOPMENT 2/2009(23)
PERSONNEL FUNCTION SOLUTIONS AS A TRIGGER OF EMPLOYEE SATISFACTION
Dagmara Lewicka1, Anna Wziatek-Stasko2
1 AGH University of Science and Technology, Krakow, Poland 2 Silesia University, Chorzow, Poland
Abstract
The article analyzes influence of personnel functions solutions on employees satisfaction. In the article,
results of empiric research carried out on a sample of more than 666 persons, employees of 12 Polish enterprises, are presented. The concept of job satisfaction refers to the status of balance between employee’s needs and expectations towards work and their satisfaction. Personnel procedures eg. motivating system, performance appraisal system are an important factors which creating satisfaction of employees. The satisfaction is connected with a difference between expectations and the current perception of the situation. Owing to the research results, we have better understanding of an impact that HRM practices and procedures have on employee satisfaction. Assuming that the satisfaction is largely connected with organisational factors, recommendations based on the research results will be presented for the analysed organisations how to improve some aspects of their personnel policy affecting employee satisfaction.
Key words: human resources management, job satisfaction, personnel function, personnel procedures, Poland
Introduction
To ensure that an organisation uses its hu-man resources at their full capacity, a consisten management system based on personnel policy tools must be created. A continuous competitive advantage is created owing to a unique configuration of resources, and human resources in particular. An increasing global competition and ever-higher costs of knowledge development necessary to keep pace with standards imposed by market leaders enforced changes in strategy and organisation of enterprises. Conditions of enterprise operation require new competences to succeed on the market. Consequently, modern enterprises increasingly appreciate knowledge and information. It is the human capital which is crucial for competitiveness of enterprises i.e. its knowledge, skills, competences, innovation of employees as well as an organisation’s ability to create, draw from and use these resources. This paper has been written to show relations existing between implementing some aspects of the per-sonnel function in an enterprise and personnel satisfaction.
1. The concept of job satisfaction
Job satisfaction can be affected by a variety of factors, eg. the quality of one's relationship with their supervisor, the way how one is motivated, the quality of the physical environment in which they work etc. Other influences on the satisfaction include the employee involvement, empowerment and autonomous work groups. As the phenomenon
of satisfaction is a largely subjective category, dependant on an individual perception of a subject matter, specification of all its indicators and strength of their impact is considerably difficult. According to conservative estimations, 10 to 30% of an individual satisfaction is explained by personality-related factors, 40 to 60% is explained by situation-related factors and the remaining percentage is explained by the interaction between these two categories of variables [7]. A degree of employee satisfaction, which is also the level of motivation and involvement in the performance of tasks is affected by relations with superiors, clarity of rules in an organisation, access to and availability of information on its strategy and developmental perspectives as well as on developmental opportunities. Appropriately followed HR management procedures seem to be the core factor ensuring clarity and transparency of rules and increasing employee motivation. However, note that Vroom’s theory of expectations indicates that employees will not work to their full potential if they perceive that the organization does not appreciate their efforts and fails to reward them adequately. It signifies that, by introducing fair and adequate employee motivating and appraisal procedures, we may likely affect job satisfaction and its level. Miller [6] found that participation in the decision making process affects satisfaction of higher rank needs, resulting in increased employee motivation and productivity. Kreitner and Kunicki [3] indicate only to a partial convergence of job
45

Dagmara Lewicka, Anna Wziatek-Stasko
satisfaction and work performance level. Job satisfaction has a very distinctive impact on employee’s organisational and citizenship behaviour. Therefore, we may expect that organisational practices and HRM procedures will affect employee satisfaction. In addition, satisfaction, as a very likely factor affecting job motivation, should also affect work performance.
2. The importance of satisfaction survey to an organisation
Satisfaction surveys are carried out in en-terprises in order to collect employees’ opinion on the operation of the enterprise and employ-ees’ feelings and atmosphere prevailing in the working environment. The surveys are also to identify whether actions taken by management support building of staff commitment and moti-vate it. The very fact that there is a survey in an enterprise demostrates to the employees that they are considered partners who strongly con-tribute to the organisation’s success and shows the management’s interest in learning staff opin-ion.
They survey may provide the management with much valuable information, including infor-mation about the internal image of the enter-prise. In addition, the management can learn about the employees’ perception of the enter-prise and its activities. In addition, during such surveys, employees’ opinion on any current or planned projects can be collected and employ-ees’ suggestions in relation to such projects can be encouraged. Furthermore, through such sur-veys management can learn about factors affect-ing employee dissatisfaction, which may possibly result in their lower commitment and effective-ness. They also show factors motivating, inte-grating and disturbing the personnel, which is the first step towards their elimination or limita-tion.
Conclusions from such surveys may con-tribute to improvement in many areas of activity of an organisation, including HRM. Information collected in the survey should be analysed care-fully and serve as the basis for developing pro-grammes introducing changes and shaping direc-tions of future development. If the management reacts positively to problems or needs identified in the survey, the personnel will put more trust in any future surveys and voice its more open and frank opinions. According to Robbins [11], organisations with more satisfied employees tend to be more effective then organisations with less
satisfied employees. These conclusions indicate that it is more reasonable to analyse employee satisfaction and identify fields for improvement, introduction of changes to generate better performance.
3. Aim and metodology of the research
In the light of the above, it was assumed that there is a relationship between job satisfaction and degree, to which specific aspects of the personnel function and other HRM-related areas are achieved in an organisation. An attempt was made to determine, which areas of personnel policy or organisational practices have the largest effect on employee satisfaction. Note that the research was performed among employees in enterprises – leaders in HRM and knowledge management. Researchers analysed groups of employees working in enterprises following contemporary approaches to HR management.
The research covered more than 600 ( 666) persons employed in 12 companies operating in the Małopolska and Podkarpacie Region, selected from the “list of 500” published by Rzeczpospolita daily, which is a ranking of the largest enterprises operating in Poland (such criterion of enterprise selection allows to analyse leaders with competitive edge on the market). Four of the analysed enterprises ranked in the first 100 of the ranking, one ranked in the second hundred of the larges enterprises, two more were listed in the third hundred, three in the fourth and two in the fifth. As regards type of business, the majority of the enterprises (9 of out 12) are production companies, 2 are trade companies and one is a service company. However, these enterprises come from very different sectors, including: fuel sector, telecommunication, car, tobacco, chemical, power, steel producing and electromechanical sectors. According to the research time, this section of the sample was justified for the purpose of analysing methods and techniques applied by the top enterprises.
The questionnaire presented in this study included evaluation of employee satisfaction based on at least 10% sample of employees. Employees of the analysed enterprises responded to 60 questions related to various aspects of HRM in an organisation, such as: recruitment, communication and relations with superiors, motivation, appraisal, training and development, sharing knowledge, managing variety, etc.
46

PERSONNEL FUNCTION SOLUTIONS AS A TRIGGER OF EMPLOYEE SATISFACTION
Within these areas, attempts were made to establish internal dependencies by using Gamma correlation. Next, specific areas were correlated with general job satisfaction.
4. Relations between personnel function and employee satisfaction
The results of the research shows clearly that personnel policy solutions applied by
enterprises affects employee satisfaction. By determining the average sum of ranks of the analysed areas (a material gamma correlation) in the analysed enterprises, a general hierarchy of impact that specific areas had on general satisfaction, could be established. Correlation of areas against general satisfaction is shown in table 1.
Table 1. Correlation of areas against general satisfaction (gamma correlation for p<0.05 materiality level)
Gamma correlation I IX V XI III X VII VI
Recruitment -0.600000 0.186992 0.093307 0.400697 0.154613 0.221837 0.466557 0.361911
Training and development
0.285714 0.289617 0.242359 0.418719 0.236538 0.381427 0.342105 0.401039
Appraisal -0.032258 0.350515 0.242874 0.371758 0.336032 0.309661 0.484871 0.450057
Responsibilities -0.416667 0.400000 -0.059137 0.246073 0.191941 0.175573 0.374252 0.179728
Motivation -0.153846 0.510917 0.188094 0.353383 0.352449 0.345365 0.430828 0.387570
Superior-subordinate relation
0.062500 0.513228 0.208782 0.551622 0.301486 0.256778 0.162192 0.273473
Employee approached as the subject
0.388889 0.333333 0.259864 0.479798 0.454100 0.424242 0.554318 0.317724
Communication -0.357143 0.348624 0.153298 0.331683 0.302144 0.244120 0.340408 0.410095
Knowledge-sharing 0.200000 0.403974 0.203875 0.461078 0.322468 0.401051 0.273718 0.280782
Diversity management
0.230769 no data 0.219251 -0.078947 0.325991 no data no data 0.192094
Conflict-solving methods
-0.290323 0.268571 0.208511 0.296296 0.334957 0.086104 0.054337 0.040087
Source: own research
0,0
0,5
1,0
1,5
2,0
2,5
3,0
3,5
4,0
Mot
ivat
ion
Sup
erio
r-su
bord
inat
ere
latio
n
Kno
wle
dge
shar
ing
Trai
ning
and
deve
lopm
ent
App
rais
al
Sub
ject
ivity
Com
unic
atio
n
Rec
ruitm
ent
and
sele
ctio
n
Sco
pe o
fre
spon
sibi
litie
s
Man
agin
gdi
vers
ity
Con
flict
-so
lvin
gm
etho
ds
Fig. 1. Hierarchy of factors affecting general satisfaction (the sum of correlated values – gamma correlation)
Source: own elaboration
47

Dagmara Lewicka, Anna Wziatek-Stasko
Analysing outcomes of the research, three
areas having different effect on the employee satisfaction can be found:
Area I – motivation procedures, superior-subordinate relation, knowledge-sharing in an organization.
Area II – training and development policy, performance appraisal, feeling of subjectivity and quality of communication in an organization.
Area III – effectiveness of recruitment and selection procedures, clear formulation of responsibilities, variety management and preventing discrimination, conflict-solving.
According to expectations, motivation is the area with the highest impact on employee satis-faction. Knowledge-sharing procedures and relations between superiors and their subordinates and knowledge-sharing procedures came as other important factors, the latter area being partially connected with the realisation of personnel policy and organisational culture of a company. Areas of slightly lower importance in the respondents' perception were: training and development policy, performance appraisal, feeling of subjectivity and quality of communication in an organization. The lowest effect on employee satisfaction in the analysed enterprises is attributed to the recruitment and selection procedures and to using job responsibilities as a HRM tool. Note that employees of all enterprises covered by the analyses assess effectiveness of recruitment and selection procedures in their companies as at least satisfactory. In addition, according to the employees, their job descriptions are clear and precise and expectations towards subordinates are clearly defined. Employees in the half of analysed organisation believe that their organisation have effective training and development policies. Employees in the remaining 50% of enterprises assessed the effectiveness as average (25%) or negative (25%). The effectiveness of appraisal procedures was assessed by employees in nearly 50% of the analysed enterprises. Unfortunately, in as much as in 40% of enterprises, the procedures were assessed negatively. Motivation procedures were graded even lower by the employees. They were assessed as positive by employees of as few as three enterprises, while employees of two enterprises assessed them as satisfactory and of three enterprises as negative. Unfortunately, a negative assessment of
appraisal and motivation procedures was given in three enterprises with Polish capital. Employees of the enterprises ranking top in terms of general job satisfaction, are of high opinion on the effectiveness of the motivating policy, appraisal, training and development.
5. Conclusions and recommendations based on the results
In the light of changes in the economic reality, modern enterprises show an increasing appreciation of the role played by intangible knowledge and information resources. It is the human capital that decides about competitiveness of enterprises, i.e. knowledge, skills, competences, innovation of employees as well as an organisation’s ability to create, draw from and use these resources. The majority of organisations is well-aware of the increasing role of the non-tangible resources in the added value creation. It is also emphasised by the importance of employee commitment, which is a direct product of effective motivation skills. Many re-searches emphasize that the commitment should be deeply rooted and based on a number of vari-ous factors instead of "tying down" an employee by offering him high salary and promotion oppor-tunities [10]. Many motivation theories, including theories formulated by F. Herezberg, C. Alderfer, S. Adams and V. Vroom indicate a relation exist-ing between motivation and work satisfaction. A need to ensure satisfaction from work, which arises from good performance of a task, achievement of goals or solving problems, may also form the basis for activities aimed at enriching and extending one’s work.
When analysing motivation systems in shaping the feeling of satisfaction from work, a particular importance should be assigned to tools used when identifying employees’ needs and to diversification of the motivation tools with respect to positions/jobs. In addition, effective motivation in an organisation requires an increased scope of responsibilities of personnel functions, which are approached as a strategic partner, and a joint commitment and cooperation of line managers in designing and implementing effective motivation tools. It is also material to identify irregularities in the existing procedures and introduce corrective actions. Here a very important role is played by the employee satisfaction survey, which should result in evaluation of actions in the area of motivation.
48

PERSONNEL FUNCTION SOLUTIONS AS A TRIGGER OF EMPLOYEE SATISFACTION
In addition to the above, leadership competences should be redefined because of developments occurring in contemporary world. These competences are no longer strongly based on the principles of stability and control connected with power and authority, but rather on partnership, trust and advice. Even more importance will be attached to social competences of managers, to the skill of shaping mutual relations between employees, creation of the atmosphere of cooperation and dialogue, their openness and “quiet determination.” New trends require the so-called “intellectual leadership”, which consists in evoking both enthusiasm and a passion for learning, finding new solutions and questioning schemes. A clear and distinctive change in roles played by managers can be observed. The change was rather well portrayed by the results of motivation factor analysis performed under the leadership of one of the authors in a production and trade promotion company operating in the SME sector in the Malopolska Region. According to the evaluation of effectiveness of motivation tools, out of 31 analysed factors, the most effective is a competent superior (scored 8.07 out of 10) and the least effective was an autocratic style of management (scored 1.86 out of 10).
Furthermore, it is worthwhile to analyse outcomes of research performed by R.M.Kanter [2005] which indicate that innovative managers preferred to convince people rather than give orders, they formed teams, solicited commitment of other persons and were willing to share awards and recognition. Such actions are not only innovation-supportive, but they are also excellent general motivating factors. In this context, a need arises to introduce some changes to competence models and to the manager training and development system. Promotion criteria should also be modified. Furthermore, R.M Kanter [8] points out that projects are typically managed not by the best leaders but by the best professionals, who:
- tend to emphasise tasks instead of interpersonal bond creation,
- are not always able to identify with collective goals and objectives and share their knowledge,
- in many cases, do not care sufficiently for creating positive attitudes towards inter-company innovation as well as for creating interpersonal bonds and communication with the outside.
M Amstrong [1] listed 7 dimensions of an organisational climate material in terms of employee perception. Their majority: independence, trust, support, fair treatment and innovation are strictly related to the quality of leadership in an organisation.
6. Importance of knowledge management in organisations
Knowledge management and HR management are very closely related. Some knowledge management functions are realised on the basis of the personnel function i.e. em-ployee recruitment, development and retention [12]. The importance of the factor is determined by changes on the labour market in the knowledge-based society. Instead of searching for security and long-term employment, employees have begun to focus on developing their own competence, flexibility in adapting to new circumstances. Acting as managers of their own carrier, they think about their future and about ways of increasing their attractiveness to their future employer. This shows the importance of the factor, which has been disclosed in the research. Questions about knowledge-sharing in the research referred to an indication of a positive attitude presented by superiors and colleagues towards knowledge-sharing. On the one hand, employees appreciate it when they can learn new things and improve their competence; however, on the other hand, a loss of one’s monopoly for knowledge may come from one’s fear of losing one’s position and power. In the superior-subordinate relations, knowledge sharing is about increasing autonomy and independence of employees. Its open transfer is an appreciated and desirable value, which, according to the majority of respondents, is largely connected with the feeling of satisfaction.
It should be emphasised that mutual trust in an organisation is one of preconditions for developing culture of a knowledge-oriented organisation, which can be approached as competences of the organization or its leaders. In a long-term context, personnel policy has an impact on the culture and culture shaping by stressing desirable values and behaviours, etc. According to T.H. Davenport and L. Prusak [2], it is possible to build trust once employees are convinced that this approach is worthwhile and should be rewarded to the employee's satisfaction. Krogh G. von, K. Ichijo, Nonaka I.
49

Dagmara Lewicka, Anna Wziatek-Stasko
[4] point out that trust is a natural element of interpersonal behaviour and they suggest that trust should be increased through interpersonal training, development of skills such as focusing on another person including empathy, active listening and building trust when acting. Irrespective of our approach, note that it is the personnel department that is typically responsible for building relations, training or remuneration. For this reason, actions taken by the department, starting from a diagnosis of the status quo through introduction of changes and working out procedures and standards, is material both in the knowledge-management process and for creating conditions favourable for sharing these resources in the organisation.
7. Importance of other analysed areas
In consideration of consecutive areas selected in the research in terms of their impact, a close connection between training and development policy and performance appraisal with motivation should be proved. Opportunities of improving one’s qualifications through participation in training and practical application of knowledge as well as planning and development of own career with one's experienced superior acting as one's mentor are factors affecting work satisfaction of the majority of respondents. Performance appraisal-related attitude and responses were similar. It is very important for employee's satisfaction to receive reliable and development-supporting feedback. Question arises why the factor including communication ranked as low as 8th? Traditionally, we know that an effective and efficient information exchange and circulation system in an enterprise affects operation of the enterprise as a whole and it could be expected that respondents would have more appreciation of the factor. However, one explanation of the sequence is that the communication-related aspect which is the most important for employees is realised in the superior-subordinate relation. According to most studies [5] shows that superiors are the most preferred information source for employees.
The issue of managing a diversified work environment, material for the Western world and the USA, is not emphasized enough in Poland and is rarely included in the action plans of HR managers. The above may explain the low ranking of this factor. Diversity management programmes foster increase of professional
satisfaction, improve employee attitudes towards their company and work [1]. Several international concerns participating in the research implement diversity and exclusion-preventing programmes. However, Polish environment displays ethnic homogeneity and it has long history of female employment. In spite of the above, the issue of diversity and, in particular, preventing discrimination of women and the elderly seems a considerable problem issue.
Summary
The research shows that the quality of personnel procedures affects employee satisfaction level. Research result confirms the importance of a correctly structured system of motivating employees towards work satisfaction. In addition, the results demonstrate the importance of factors for creating a friendly and effective work environment, they set out the scope and points of emphasis for actions to be taken by HR managers. They are also likely to show partially the areas enjoying current interest of HR managers in the enterprises covered by the research. For this reason, enterprises should maintain a careful and on-going monitoring of their personnel’s opinions and suggestions and introduce changes. Furthermore, it is also important to measure the weight of factors indicating areas where changes are required.
Reference:
1. Armstrong M.(2002) Zarządzanie zasobami ludzkimi, Oficyna Ekonomiczna, Kraków
2. Davenport T.H., Prusak L.(2000) Working Knowledge. How Organizations Mange What They Know, Harvard Business School Press, 2000
3. KreitnerR., Kinicki A. (1992) Organizational Be-haviour. IRWIN.
4. Krogh G.von Ichijo K., Nonaka I.(2004) Enabling Knowledge Creation How to unlock the Mystery of Tacit Knowledge and Release the Power of Innovation, Oxford University Press, 2004
5. Lewicka D, Kandefer M.(2005) Komunikacja w trakcie fuzji na przykładzie BP Polska Sp. z o.o. in : ed. Markiewicz K. Wawer M. Problemy społeczne we współczesnych organizacjach, Difin
6. Miller, K. I. (1999) Organizational communication: Approaches and processes. Belmont, CA: Wadsworth Publishing Co.
7. Makin P, Cooper C, Cox Ch. (2000) Organizacja a kontrakt psychologiczny. Zarządzanie ludźmi w pracy. Warszawa PWN.
50

PERSONNEL FUNCTION SOLUTIONS AS A TRIGGER OF EMPLOYEE SATISFACTION
8. Moss Kanter R. Innowacje są specjalnością menedżerów średniego szczebla „ Harvard Business Review” 3/ 2005 s. 120-135
9. Moss Kanter R.: Innowacje – klasyczne pułapki, „Harvard Business Review” 2/2007 s. 68-89
10. Pocztowski A.(2006) funkcja personalna w przedsiębiorstwach funkcjonujących w nowej gospodarce in ed. Wiśniewski Z. Pocztowski A.
Zarządzanie zasobami ludzkimi w warunkach nowej gospodarki, Oficyna Ekonomiczna
11. Robbins S.P.(2001) Organizational Behaviour, Upper Saddle River, NJ: Prentice Hall Inc
12. Steinmann A., Schreyogg G.,(1995) Zarządzanie, koncepcje, funkcje, przykłady. Oficyna Wydawnicza Politechniki Wrocławskiej, Wrocław
51

УПРАВЛЕНИЕ И УСТОЙЧИВО РАЗВИТИЕ 2/2009(23) MANAGEMENT AND SUSTAINABLE DEVELOPMENT 2/2009(23)
DISCRIMINATION AT WORK – UNFORTUNATELY NOT ONLY IN THEORY
Dagmara Lewicka1, Anna Wziatek-Stasko2
1 AGH University of Science and Technology, Krakow, Poland 2 Silesia University, Chorzow, Poland
Abstract
There are many managers who say that women and men have the same laws in the workplace, but is it
really true ? Is it not only a theory? What does it show the practice? In many countries of the world, I think that in all countries, most women are treated as the socond quality workers , that discrimination because of the gender is a still really very big social problem . Maybe managers are afraid of women? Completely unnecessarily. According to Tom Peters- well known managing guru- “Women are fantastic and so far unused possibility. Ignoring their leading skills is unbelievable stupidity and short-slightness of men. In opposite to these latter ones, who like to compete, make hierarchies and order, women are the real leaders: ready to co-operate, team work, communica-tion, exchange of ideas. They can be long-sighted and consequent in searching and developing their talents”. According to the research enterprises managed by women are more efficient than by man.
Key words : Management , gender , diversity , organisation , discrimination
Discrimination - Where is it coming from?
Moving in a contemporary world inevitably we notice, that our civilization has put women aside of social life. Stereotypes, religion and wide-spread for a long time, anachronistic for civilised society habits, limit women’s rights and burden them with obligations practically without a possibility of choice. It is visible in both, pro-fessional work and family life. Women submis-sively bear all humiliations connected with many obligations, which seems to arise from definition defined by the society (often underdeveloped and dominated by men for ages) in their compe-tence. Sources of these stereotypes are not hard to mention when analysing the history of socie-ties, in which these were men, who constituted power, were playing war, educating solely them-selves. The matter of behaviour and habits is whether given woman can rebel against it or not. If in her family house there were continued old fashioned rules and her mother was a proverbial „homebody”, then she will not go beyond con-ventions in her behaviour, because she simply thinks this the way it should be.
Where do differences between women and men come from? There are three theories about this subject. The first – diversity of socialisation – assumes, that the differences result from cul-ture standards. In our, until recently andocentric, culture masculinity and feminity are treated as opposite poles in the same dimension. Depen-dently on gender, children get different toys, they are dressed differently, for different things
punished, to different things encouraged. Al-ready 80% of two-year-old can recognise gender in scope of hairstyle and clothes.
According to evolutionary conception, men dealt with hunting, that is why their supremacy in spacious skills, and women dealt with collect-ing, that is why they have good memory for lo-calizing small items. David Buss’s theory ex-plains why men want different things from women than women from men. Gents aim at contacts with several partners „the best if they are young and attractive, because such strategy allows them to spread their genes, and burden of taking care of children lays mainly on a woman anyway.
According to structural-social theory, differ-ences of gender result from different position of women and men in society and from various roles performed. Women give birth to children and take care of them. Men earn money for maintaining family and climb the power ladder [1]. Never-ending propagating the view, that a woman is the weaker one, who should be taken care of (so worse one, because weaker than men, who strengthen this way the feel of own superiority) caused, that for long years women believed it is so. Not many contemporarily re-members, that former societies living in Mediter-ranean Sea area, in Middle East, in India wor-shiped the GODDESS not GOD- as the highest creator. From Egyptian papyruses we learn about women, who performed as parties in civil court cases, commercial transactions. Unfortu-
52

Dagmara Lewicka, Anna Wziatek-Stasko
nately, „pushed aside from the mainstream of social life, woman has been sent to kitchen, where she started living her poor existence as exemplary house wife. Everything was announc-ing that home should be embodiment of dreams, kitchen should be a temple, marriage- the only carrier, cleaning – ritual full of mystic sense. The share of roles was simple: man is manufacturing and earning, wife is the receiver and consumer of manufactured goods” [4].
Ancient rules, apart from passage of hun-dreds years, seems not to disappear. „Physically stronger, brought up in belief that, masculinity is an attribute, which should be highly appreciated, seemed to be predispositioned to dominance. They were hunters, warriors, prophets and phi-losophers, legislators and great builders, sup-porters of the family and husbands of their sub-ordinate wives. They have created civilisation and given it male image and themselves created subjects, shared the roles of gender as they per-ceived it their own way, and their privileges took in form of social standards” [4].
Woman still underetimated
European Union membership countries, as well as applying countries obliged themselves to practise policy longing for deleting discrimination of women on a labour market. From the last report published in March 2006 („Report on equality between a woman and a man, 2006”) it results, that unemployment in Union is decreas-ing, however still the problem concerns dispro-portions in area of salaries. Ladies earn on aver-age 15% less than men, though these differ-ences are changeable in different countries. The biggest differences in both sexes income are found in Estonia (24%), Slovakia (24%) and Cyprus (25%). The smallest differences are found in Portugal (5%) and Malta (4%). Poland has the highest index of unemployed women in UE, which is 19,2%, which means that more than 9% more than Union average, which is 9,8%. The smallest unemployment is found in Ireland (3,9%) and Great Britain (4,3%). The growth of employment among women in UE still concerns feministic professions. Almost 40% of women are employed in public administration, education, health services, social institutions. In private sector women usually work in services.
Men earn much more than women in spe-cialistic professions and on managing and clerical positions, on higher rank positions. In industry and services women earn best in Switzerland
and Luxemburg. In Poland women’s salary is 7-8 times less than in Switzerland (5506 EUR).
Differences in salaries due to sex are spe-cifically high on manual positions, in professions seen as typically male. Much less women’s sala-ries are noticeable in new EU members. Salary disproportions on these positions reach 45%. The level of education is also influential on sala-ries – men with higher education earn almost 45% more than similarly educated women. In most EU countries more women than men re-ceives minimum salaries. In Poland it concerns 3,9% of women and 4% of men. Women earn most in age of 30 – 39 (average 1923 EUR), men in the age of 50 – 59 (about 46% more than women). In France, Poland, Slovenia and Cyprus mostly exposed to unfair salary differ-ences are women after 60 (acc. to report dated 12.12.2006 Sedlak&Sedlak on)
In most countries women come across many obstacles on their way to employment and promoting to higher positions. Research concern-ing the way of leading job interviews before hir-ing to work in Warsaw proved, that in 1/3 of the national state owned companies and ¼ of private companies women were asked different ques-tions than men. These questions concerned their marital status, having children and family obliga-tions, they also influenced decision about em-ployment [Mroczkowski T., 1997, 25]. Discrimi-nation during recruitment process is only a be-ginning of the hard way women must take in the world of business. If they manage to go through the jungle of difficulties on the selection level and they receive the job, still they are in danger of discrimination. Eurostat research show, that work performed by women and men in Union is not the same. In the researched group of people working full time, 30% of women and only 10% of men do office work. 47% of men work as manual workers or in industrial companies, whereas among women the same work is per-formed by 18%. On average, manual workers are paid better in EU than office workers or clerks. Moreover, over-hours are usually paid to manual workers, which is mostly men. Women however, constitute majority among low paid retail trade salesmen. Working women usually are generally younger, 44% of them is under the age of 30. Among men under 30, there is 32% of employees [7].
Problem of discrimination in scope of sex is confirmed also by results of research made by World Economic Forum. When implementing the
53

DISCRIMINATION AT WORK – UNFORTUNATELY NOT ONLY IN THEORY
research in 60 countries of the world, there were taken into considerations five criteria:
1. Do women receive same amount as men on the same positions?
2. Do women have same access to the la-bour market?
3. Do women have same representatives as men do in authority structure and administration?
4. Do women have identical access to education?
5. Do women have same kind of health and social service?
In scale from 1 to 7, the highest position is taken by Scandinavian ladies– Swedish (>5,5 points), Finnish a bit more than 5 points), Nor-wegian, Icelanders and Danes, so citizens of countries, with liberal society, protecting the rights of minority and having versatile caring system. Polish ladies got 4,36 points, which gave them 19th position. Closer to Scandinavian countries were Lithuania, Latvia and Estonia. In first ten there were also New Zealand, Canada, Australia, Great Britain and Germany. Only on 13th position behind Latvian and Lithuanian women, there were placed French. Far places were taken by countries with consolidated ‘pa-triarchal culture’ – Malta (43rd place), Italy (45th place) and Greece (50th place). The list is closed by ladies from Islam countries– Trukese and Egyptians (far below 3 points) [5].
Women in business according to The Catalyst Report
According to the Catalyst report : 1. Women held 14,7 percent of all Fortune
500 board seats , compared with 13,6 percent in 2003 and 9,6 percent in 1995.
2. Women of color held 3,4 percent of board seats.
3. Sixty-four companies had 25 percent or more women board directors, compared with 54 companies in 2003.
4. Women were underrepresented as chairs of auditing, compensation and nominating governance committees.
5. In 2005 women held 16.4 percent of corporate officer positions, compared to 15,7 percent in 2002 , and 8,7 percent in 1995.
6. Women held 6,4 percent of top earner positions up from 5,2 percent in 2002.
7. Women of color held 1,7 percent of corporate officer positions.
8. Women of color were 1,0 percent of Fortune 500 top earners.
9. Women held 9,4 percent of clout titles up from 7,9 percent in 2002 .
10. In 2005 eight Fortune 500 companies were led by a woman CEO up from six in 2002.
The key findings show that in the last ten years growth has averaged just 0,5 percentage points per year for women board directors and 0,8 points per year for women corporate offi-cers. The situation is far worse for women of color. Furthermore, even among the highest lev-els of leadership , women are segregated into less powerful and prestigious positions – they hold proportionately fewer board committee chairs , clout titles and line positions . Generally we can observe an interesting situation ( but still not optimistic for women ) on the labour market – the higher business position , the fewer quan-tity of women [16]!
Management , professional and related occupations - 50,6% F500 corporate officers - 16,4 % F500 Board seats - 14,7 % F500 highest titles - 9,4 % F500 top earners - 6,4 % F500 CEOs - 1,6 %
Equal in work – It is Possible?
According to the European Committee re-port [17] – 85% of respondents – in companies using diversity management – confirmed its posi-tive influence on both, personal and financial politics. Over 80% of them noticed changes for better in work organisation rules and in recruit-ment process. As many – over 75% of surveyed companies noticed positive influence of consider-ing diversity in the management process aimed at professional development, raising qualification and promoting employees (women and men). The quality of services increased according to respondents for about 40%, sale over 25%. There were also measured such arguments as, relations with the local society and inside the teams, marketing strategies and internal proce-dures of management. It turned out, that in each area diversity management improved the com-pany image and increased its income. Definite leaders in European Union in scope of introduc-
54
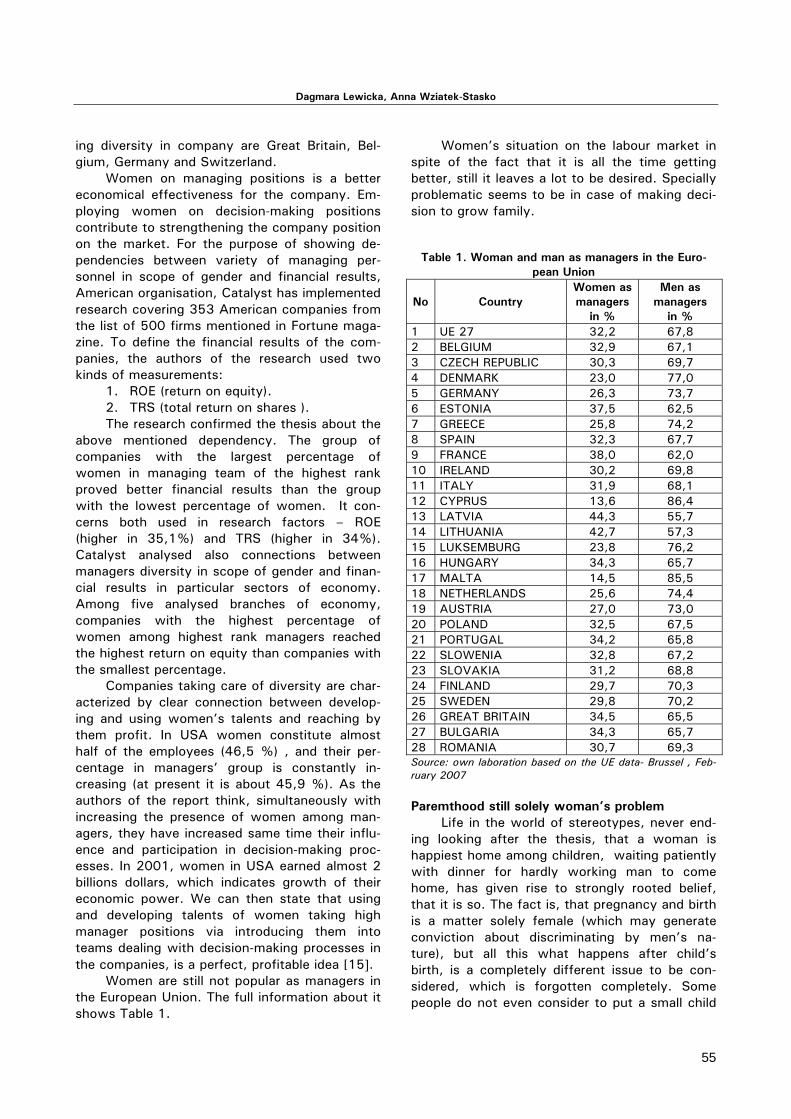
Dagmara Lewicka, Anna Wziatek-Stasko
ing diversity in company are Great Britain, Bel-gium, Germany and Switzerland.
Women on managing positions is a better economical effectiveness for the company. Em-ploying women on decision-making positions contribute to strengthening the company position on the market. For the purpose of showing de-pendencies between variety of managing per-sonnel in scope of gender and financial results, American organisation, Catalyst has implemented research covering 353 American companies from the list of 500 firms mentioned in Fortune maga-zine. To define the financial results of the com-panies, the authors of the research used two kinds of measurements:
1. ROE (return on equity). 2. TRS (total return on shares ). The research confirmed the thesis about the
above mentioned dependency. The group of companies with the largest percentage of women in managing team of the highest rank proved better financial results than the group with the lowest percentage of women. It con-cerns both used in research factors – ROE (higher in 35,1%) and TRS (higher in 34%). Catalyst analysed also connections between managers diversity in scope of gender and finan-cial results in particular sectors of economy. Among five analysed branches of economy, companies with the highest percentage of women among highest rank managers reached the highest return on equity than companies with the smallest percentage.
Companies taking care of diversity are char-acterized by clear connection between develop-ing and using women’s talents and reaching by them profit. In USA women constitute almost half of the employees (46,5 %) , and their per-centage in managers’ group is constantly in-creasing (at present it is about 45,9 %). As the authors of the report think, simultaneously with increasing the presence of women among man-agers, they have increased same time their influ-ence and participation in decision-making proc-esses. In 2001, women in USA earned almost 2 billions dollars, which indicates growth of their economic power. We can then state that using and developing talents of women taking high manager positions via introducing them into teams dealing with decision-making processes in the companies, is a perfect, profitable idea [15].
Women are still not popular as managers in the European Union. The full information about it shows Table 1.
Women’s situation on the labour market in spite of the fact that it is all the time getting better, still it leaves a lot to be desired. Specially problematic seems to be in case of making deci-sion to grow family.
Table 1. Woman and man as managers in the Euro-pean Union
No Country Women as managers
in %
Men as managers
in % 1 UE 27 32,2 67,8 2 BELGIUM 32,9 67,1 3 CZECH REPUBLIC 30,3 69,7 4 DENMARK 23,0 77,0 5 GERMANY 26,3 73,7 6 ESTONIA 37,5 62,5 7 GREECE 25,8 74,2 8 SPAIN 32,3 67,7 9 FRANCE 38,0 62,0 10 IRELAND 30,2 69,8 11 ITALY 31,9 68,1 12 CYPRUS 13,6 86,4 13 LATVIA 44,3 55,7 14 LITHUANIA 42,7 57,3 15 LUKSEMBURG 23,8 76,2 16 HUNGARY 34,3 65,7 17 MALTA 14,5 85,5 18 NETHERLANDS 25,6 74,4 19 AUSTRIA 27,0 73,0 20 POLAND 32,5 67,5 21 PORTUGAL 34,2 65,8 22 SLOWENIA 32,8 67,2 23 SLOVAKIA 31,2 68,8 24 FINLAND 29,7 70,3 25 SWEDEN 29,8 70,2 26 GREAT BRITAIN 34,5 65,5 27 BULGARIA 34,3 65,7 28 ROMANIA 30,7 69,3 Source: own laboration based on the UE data- Brussel , Feb-ruary 2007
Paremthood still solely woman’s problem
Life in the world of stereotypes, never end-ing looking after the thesis, that a woman is happiest home among children, waiting patiently with dinner for hardly working man to come home, has given rise to strongly rooted belief, that it is so. The fact is, that pregnancy and birth is a matter solely female (which may generate conviction about discriminating by men’s na-ture), but all this what happens after child’s birth, is a completely different issue to be con-sidered, which is forgotten completely. Some people do not even consider to put a small child
55

DISCRIMINATION AT WORK – UNFORTUNATELY NOT ONLY IN THEORY
under father’s care. Their reluctance for diapers, soups, child’s cry, walks, and what is impossible to omit, not so ambitious house works, men craftily explain that women have much better competence in this area. Certainly it is extremely comfortable. They leave home early in the morn-ing and they do not have to worry about any-thing. First of all they are not touched by stress (so common among women at present), con-nected with fear of loosing job or taking holiday, in case of child’s sickness. Full comfort of life. Meanwhile, this is exactly sign of discrimination. Many women quite late, but realised that and took fight against equality of rights. Unfortu-nately, no one knows why, all trials of searching for the ways of liberalising labour codes, in rela-tion to work time, concern only women, not both parents. Speaking about flexible work time. In EU countries, where flexible work time has been promoted for a long time, they have started to perceive alarming tendencies, which concern women again. In part-time job there are working 32,6% women in EU and only 7,4% men. [14] Definitely work time is a leading category, which should be taken into consideration when search-ing for effective methods of reconciling contem-porarily family life with work life. It is important however that these methods concern parents of both gender, so that they are chosen not im-posed, because it is comfortable for someone. The point is that women themselves decide what is best for them, not men! So far legal standards – law was favouring men. Why? The answer is simple– because these were men who dominated in bodies, which have estabilished them, that is Parliament for example. Well, actually they still dominate.
Flexible work forms – How to increase effective-ness of diversity management
There are many proven practises, which are supposed to adjust the labour market to social expectations and reconcile woman with a man. It is enough to have at least good will on em-ployer’s side and getting rid of egoism by hus-band and wife, and „ everyone will be happy”. The problem is that, so that a woman and a man can realise themselves in work, so that no one has to scarify anything for the partner (this leads solely to constant excuses, bad atmosphere and feeling guilty). We can try to use new forms of work. Some of them are as follow:
1. Flexi-time – allows employees to choose the time of work beyond contract ar-
rangements. Employees may start, fin-ish and use break in a chosen moment of the day.
2. Staggered hours – means, that employ-ers may begin and finish work in agreed time. It enables employers to lengthen time of company operating, and em-ployees have a possibility of adjusting the moment of beginning and finishing work to other terminal obligations. For example to the partner’s time work.
3. Compressed working hours – creates possibility of limiting working days per week, in cost of lengthening daily work time. Such solution enables employer to lengthen time of operating machinery, even to 24/7.
4. Shift swapping – allows employees for choosing shifts and time of work be-tween each other, considering the needs of company functioning in a given pe-riod. It gives a chance for adjusting to partner’s work time and organising child care system.
5. Time off lieu – in cooperation with the manager, employee is using free time in scope of performed over-hours.
6. Self-rostering – enables adjusting the number of employees with particular qualifications and skills to daily needs. The need is confronted with the team preferences and on its basis there is created the work schedule.
7. Annualised hours – means accounting work time not in a week or month scale but in a year scale. It gives possibility of lengthening work time in critical periods and shortening in lower need periods.
8. Job-sharing – means, that two people share obligations and work time, usually performed by one person. Partners share the work, salary, free time and work time.
9. Working from home – enables perform-ing work outside company, for example assembling, sewing, etc. It is a way of working using new technologies, such as internet, where work may be realized at home and sent to company.
10. Tele-working – means work outside company using information and tele-communication technology. It gives possibility of connecting work with tak-ing care of children or older people and
56

Dagmara Lewicka, Anna Wziatek-Stasko
avoiding everyday traveling to the com-pany.
11. Time accounts – system of registering and accounting work time in different time frames. Gives possibility of gather-ing and free use of time save.
12. Part-time working – offered by the em-ployer, possibility of work in shorter time [Materials from scientific confer-ence: „Equal at work – it is profitable” , Warszawa 2007]
Above mentioned solutions become con-temporary more and more fashionable and popu-lar. Unfortunately not in demanded scale. Many employers are skeptic about them, but also not all employees are astonished by them. We can find below couple of disadvantages of flexible work forms:
1. Inefficient safety of employment. 2. Fear of loosing livelihood. 3. Lack of enough legal norms. 4. Lack of efficient legal protection con-
nected with salaries (salary is often ne-gotiated by the employer and employee each time separately and is not regu-lated either by labour code or company salary system).
5. Huge difficulties in assuring continuity of performed work.
6. Small possibility of uniting employees. 7. Lack of social connection important for
professional development and helping in performing work and eliminating difficul-ties with it associated.
8. Large load of employers connected with their own professional development, trainings and gaining crucial skills.
9. Difficulties in management, connected with substantial and time coordination of the performed work.
10. Misusing private house for performing professional work, limiting family free-dom.
11. Risk of low level identification of an employee with the company.
12. Increasing requirements in relation to the performer (knowledge of a job, self-dependence, internal discipline, respon-sibility, etc.)
13. Inability of controlling employee’s work during its performance at home.
Apart from some disadvantages, which can be attributed to flexible work time, we should perceive them as an alternative for the present
offer on a labour market. Actually, their effec-tiveness depends solely on a human being, on both employer and an employee. With lack of employer’s goodwill and lack of honesty and reliability on employee side, no method will ever be effective.
Summarizing family –friendly employment brings profits for both, employers and employ-ees.
Arguments for treating variety managing se-riously [own elaboration based on [11]]:
1. Profits for an employer - employment stabilisation - limiting costs of hiring new employees - reduction of stress - improvement of motivation to work - improvement of productivity - reduction of absence - soothing difficulties resulting from break
in work on family reasons - bigger loyalty towards employer 2. Profits for an employee - enabling reconciling family obligations
with professional. - limiting threats of loosing job - greater motivation to work - soothing conflict work – family life - better creativity - future-like thinking, strategic - smaller competition between employees - focusing attention on the quality of work
and not threats and problems
Reference: 1. Dobroczyński B.( 2007) : Zmierzch Bogów, czyli
nikt nie rodzi się mężczyzną.„Charaktery- magazyn psychologiczny” , nr 4 , s. 12
2. Mroczkowski T.( 1997): Women as Employees and Entrepreneurs in the Polish Transformation. “Industrial Relations Yournal” , no 28, s. 25
3. Rosener J.B.( 1995 ): America’s Competitive Secret . Utilization of Women as a Management Strategy. New York, Oxford University Press , 56
4. Sękalska D.( 1982 ):Kobieta wyzwolona . W-wa 5. Sołtyk R. (2005): Dyskryminacja w pracy.
www.kariera . com.pl 6. http://www.wynagrodzenia.pl 7. www.kariera.wprost.pl 8. www.europarl.eu.int/news/expert 9. Report for www.genderindex.pl , Scientific con-
ference : „ Equal rights – better effectiveness” , Kraków , 06/2006
10. Report for www.genderindex.pl , Scientific con-ference: „Equal rights – better effectiveness” , Kraków , 06/2006
57

DISCRIMINATION AT WORK – UNFORTUNATELY NOT ONLY IN THEORY
11. Report for www.genderindex.pl na : Scientific conference: „ Equal at work – it is profitable” , Kraków , 03/2007
12. „Poznaj swoje prawa na rynku pracy”. Poradnik prawny dla kobiet. Centrum Praw Kobiet . War-szawa 2002
13. www.stop-discrimination.info/index.php? id=#65913246
14. acc. to: Eurepean Committee Report for Commit-tee and European Parliament, Economic-Social
Committee and Committee of the Regions con-cerning women’s and men’s equality– 2006 r.
15. Catalyst The Bottom Line : Connecting Corporate Performance and Gender Diversity for www.genderindex.pl
16. Catalyst Report 2005 – Women in Business – www.catalyst.org
17. European Committee Report (The Business case for Diversity . Good Practices in the Workplace from the 2005 )
58

УПРАВЛЕНИЕ И УСТОЙЧИВО РАЗВИТИЕ 2/2009(23) MANAGEMENT AND SUSTAINABLE DEVELOPMENT 2/2009(23)
HAZARDOUS WASTE INFLUENCE ON LATVIAN FORESTRY ECONOMIC RESULTS
Nora Dubro, Anatoly Magidenko Riga Technical University, Latvia
Abstract
Forestry and development of sustainable forest management system today are becoming one of the most
important socio-economic and environmental issues world-wide. For Latvia, where forests are one of the most im-portant natural resource, forestry management is one of the essential issues in economics. Ecosystems of forests are under continuously impact from substantial natural and anthropogenic influence. One of the most important aspects of forestry economical results is forest pollution with waste, inter alia, hazardous waste so as heavy met-als and pesticides. In Latvia are actual so problems as illegal dumping in forests, what being indicatively reflected on the quality of natural resources and labor force, influences national well-being in general and particularly eco-nomical indexes of forestry. For rationalization of Latvian national economy regulation it’s worth to review impact of hazardous waste generation and management on forestry economical results, considering as forests economical input, as ecological benefits, which directly ensure conditions for sustainable economy development. Assuming that there exists direct relationship between hazardous waste amount and forestry benefits, is supposed that it’s possible to to have an impact on economical results, basing on so indicators as level of forests quality and rate of potential hazardous waste generators in national economy. Formulation of methodic approach for national econ-omy regulation basing on diversification of gaining on production, what results in hazardous waste generation, manufacturing and exploitation and forestry development in intensive way, restricting hazardous waste flow is the goal of the stage of the research. The results of hazardous waste economical impact on forestry results measure-ment could be putted into practice in process of making efficient decision about national economy structure and possibilities of improvement economic indexes.
Key words: forestry, hazardous waste management, economic benefits, ecological efficiency
Introduction For Latvia, where forests are one of the
most important natural resources, forestry is one of the essential issues in economics. Forests are a characteristic element of Latvian landscape. Latvia has one of the richest forest resources in Europe covering more than 50.4% of the country (1.5 times higher than the world average) with a total of 648 million cubic meters of growing stock. Accordingly, forests play a significant role in the development of rural areas and for recrea-tional purposes [1].
Ecosystems of forests are under continu-ously impact from substantial natural and an-thropogenic influence. One of the most impor-tant factors affecting forestry economical input is forest pollution with waste, inter alia, hazard-ous waste so as heavy metals and pesticides. In Latvia so problems as illegal dumping, inter alia, dumping of hazardous waste, in forests are ac-tual still, what being indicatively reflected on the quality of natural resources and labor force influ-ences national well-being.
Formulation of methodic approach for na-tional economy regulation basing on diversifica-tion of gaining on production, what results in hazardous waste generation, manufacturing and
exploitation and forestry development in inten-sive way, restricting hazardous waste flow is the goal of the stage of the research the results of which are creation of demonstrative models and formulation of parameters for hazardous waste economical impact on forestry measurement and forestry ecological benfits transformation into economical value. Methods of systematic analy-sis, logics and synthesis were used in this re-search.
The results of hazardous waste impact eco-nomical measurement could be putted into prac-tice in process of making efficient decision about national economy structure and possibilities of improvement economic indexes.
1. Economical importance of forest sector in Lat-via’s Economy
Forest in Latvia is an ecologically stable ecosystem that secures a balanced maintenance of the environment. Latvia's forests and wood-lands covered 2.9 million ha (7 million acres), or approximately 47% of the total land area in 2000 (up from 24.7% in 1923). Before World War II (1939–45), the timber and paper indus-tries accounted for 29% of employment; by 1990, the number had fallen to 9%. In 1939,
59

Nora Dubro, Anatoly Magidenko
the timber industry contributed 53.5% to total exports; in 1990, wood and paper exports ac-counted for 2.2% of total exports. The timber cut in 2000 was 14,488,000 m³ (511 million cu ft), with 12% used as fuel wood. Production amounts in 2000 included: sawn wood, 4,030,000 m³ (142 million cu ft); particleboard, 102,000 cu m (3.6 million cu ft); plywood,
156,000 cu m (5.5 million cu ft); and paper and paperboard, 16,000 tons. Exports of forest products amounted to $625.9 million in 2000 . In that way, forest industry takes an important position in economics, providing wood products (Fig. 1) and insuring value-added development (Fig. 2) [2, 3].
Fig. 1. Forest industry input in Latvian economics [4] Fig. 2. Value-added development of forestry dynamics
in Latvia from 2000 till 2004 year [4] Forest sector export in Latvia in the first
half of 2008 dropped by 12% in terms of money. The most significant impact was left by the rapid decrease in sawnwood export, and there was a decrease in the income by 35,9%. Since sawnwood export till now had the biggest share in the export of the sector (approximately 1/3 from total income), the decrease reduced the performance indicators of the sector [5].
Besides of direct economical importance of forest sector can be distingueshed majority of ecological factors wich make forests by one of instruments of economical indicators regulator. For example, forests, having huge sanitary and hygienic and curative value, because of natural forest air contains more than 300 kinds of vari-ous chemical compounds. As well forest, espe-cially coniferous trees, allocates fitoncids — the flying substances with bactericidal properties, which kill pathogenic microbes and well influ-ence nervous system, strengthen impellent and secretion functions of a gastroenteric path, im-prove metabolism and stimulate action of the heart. Fitoncids of aspen tree bud, Antony ap-ples, eucalyptus destroy flu virus. Oak leaves destroy bacteria of abdominal typhus and a dys-entery [6].
Besides, transforming atmospheric pollution, especially gaseous, actively absorb industrial pol-lution, in particular dust and hydrocarbons, for-ests make favorable conditions for sustainable living and economy. As well it’s possible to dis-
tinguish following basic directions of use of for-ests in economic purposes: a food source, the energy source, the building material, raw materi-als for manufacture [6].
Ecological input, which produce forest as regulator of natural processes by photosynthesis, water, oxygenous cycle and lithosphere regula-tor, as well as influencing people health, must be transformed in economical values. Damaging for-ests national economy lose considerable part of NDP, what implicitly expresses in total resource market aggravation.
In that way forest sectors impact results ex-ist as direct benefits – economical, as in indirect - ecological benefits.
Ecological benefits is possible to define as input of forests, what expresses as benefits what society obtain by exploiting forests natural resources and favours.
Economical benefits are financially evalu-ated input of forests by exploiting forests natural resources and favours as instruments of economy.
Ecological benefits is possible to appreciate through costs of lost possibility of exploiting for-ests natural resources and favours in result of forest damage.
2. Hazardous waste influence on Latvian forestry
One of major factors affecting the function of ecosystems is environmental pollution and flows of nutrients from the atmosphere. The
60

HAZARDOUS WASTE INFLUENCE ON LATVIAN FORESTRY ECONOMIC RESULTS
most important factors influencing forests vitality is pollution with hazardous waste.
The organic layer of forest soils accumu-lates atmospheric pollution over a long-term pe-riod. The impact of environmental pollution on forest soils has decreased during the past ten years, and the distributions of concentrations of metals have significantly changed. The concen-trations of Cu, Cd, Pb, Zn, V, Ni, Cr, Fe Ca, Mg and K were determined in the organic soil layer
of pine forests in Latvia. The concentrations were expressed on a mass, volume and surface area basis [7].
It’s worth to notice, that hazardous waste are connected with forestry in two aspects:
1. forestry is the source of hazardous waste;
2. hazardous waste from forests internal and external sources are the cause of forests pollution.
FORESTS
Ecological benefits
Economical benefits
Forestry Hazardous waste Hazardous waste
1) 7.5 % of GDP; 2) 41 % of the total export; only sector with positive export – import balance. This figure is decreasing; 3) 5-6 % of total employment, about 440 000 “permanently employed“, at least 10,000 directly in reģions; 4) wood-working industry makes up to 25 % of manufacturing; 5) timber makes up to 13 % of all cargos in harbors, and 91 % of “small harbors”. [8]
Forest - regulator of natural processes
1) unused fertilisers and pesticides; 2) empty fertiliser and pesticide containers; 3) used oils and hydraulic fluid; 4) empty fuel containers; 5) used spill kits; 6) firefighting waste
- illegal dumps in/nearby forests- technical forests pollution - industrial air pollution - hazardous waste processing/ transportation - former Soviet Army’s military waste
Source of natural resources
Fig. 3. Model of reciprocity between hazardous waste flow and forestry development It's important to notice reciprocity between
hazardous waste amount and forestry develop-ment (Fig. 3). The relationship is dual: hazardous waste influence forest quality and forestry gen-erate hazardous waste what, in turn, effect for-ests, as well as other related sector and sustainable living in wholl.
Notable sources of hazardous waste pollu-tion are illegal dumps in or nearby forests, the issue of what is not managed in appropriate way still. Besides, harzarous waste flow into forests is providing by diffrent technical works. So, raw materials for construction (limestone, gypsum, clay, sand etc.) and peat are the main geological resources of Latvia. Only 20 percent of resource extraction sites are managed in accordance with environmental requirements. About 17 percent
of the quarries have unmanaged waste dumps [9].
Also considering that byproducts of enter-prises majority are hazardous waste, it’s obvi-ously that conditions of forest resources are in-fluenced by industrial sector in process of economic activity.
Legislating for extensive expansion of waste components by the way of contacting with envi-ronment, is obvious, that important factor affect-ing the function of ecosystems is environmental pollution and flows of nutrients from the atmos-phere. Accordingly, inevitable threat for forests health is presented as by hazardous waste sources which situated exactly in forests/nearby forests, as distant from it. So, condition of forest resources are affected in great scale. Depending on source location and category of danger haz-
61

Nora Dubro, Anatoly Magidenko
ardous waste of this group could influence for-ests health in various degrees:
1. sources, what present potential threath for forests healts;
2. sources, what present inevitable threath for forests healts;
3. sources, what present improbable threath for forests healts (Fig. 4).
Hazardous waste, which present potencial and inevitable
threath for forests healts
potencial threath for forests healts
inevitable threath for forests healts
improbable threath for forests healts
Category of danger Factors: generated volume, dangerous components
Factor: location of source in relation to
forests
CA CB Ci …
Hazardous waste
Degree of danger A B i ...
Amount of waste of each degree of danger QA QB … Qi
Level of danger of waste
100 90 10 …
Unit of base danger of waste
Financially expreseed potencial damage of waste to forests
Costs of unit of base danger of waste
Factor: Potencial damage for forests
healts
Fig. 4. The model of evaluation hazardous waste potencial economical damage for forests healts The most serious environmental and eco-
nomic damage was done to agriculture and for-est lands by the former Soviet Army’s military firing grounds, airfields, rocket bases, fillingsta-tions and fuel depots. The Army had firing grounds for every kind of weapon in Latvian ter-ritory. The buildings in these areas are not usu-ally suitable for conversion to civil use. The larg-est Soviet military firing range and aviation tar-gets covered 24 500 hectares of farmland and forest at Zvarde. Diffuse contaminants such as aircraft fuel, burning wastes, and explosives have rendered the soil unusable [9].
In turn, forestry operations can produce a number of different hazardous materials (Fig.3). Assuing that costs flow connected with forests damage by hazardous waste wouldn’t be gener-ated, hazardous waste influence could be ex-pressed as reduction of forests potencial eco-nomical benefits (Fig. 5).
Forests potencial benefits
Forests economical benefits HW influence
Fig. 5. Hazardous waste influence on forests sector
profitableness Evaluation of forest ecological benefits, as
well as ecological forests damage by hazardous waste influence are significant questions. In the basis of economical evaluation is establishing of forest ecological benefits evaluation standards and, accordingly, upbuilding economic account-ment system of forest ecological benefits and forests damage by hazardous waste.
Transforming all possible costs into poten-tial gainings we can formulate financially ex-pressed forests ecological benefits as the sum of current and potential costs and losses. Evaluat-
62

HAZARDOUS WASTE INFLUENCE ON LATVIAN FORESTRY ECONOMIC RESULTS
ing forests damage by hazardous waste, it’s necessary to take into account, that whatever pollutant provokes not only losses, but also
costs. As well losses, costs could be current and potential (Fig. 6).
FORESTS DAMAGES ECONOMICAL CONSEQUENCES
Costs Losses:
Current Potencial
Potencial forests economical benefits
natural resources renovation costs
people costs property costs
atmospheric pollution elimination costs, soil acidification elimination costs
costs, connected whith worsening of labour force quality (medical attention costs, allowances, connected whith people health problems)
property renovation and saving costs
losses of natural
resources
losses of
labour force
Fig. 6. The model of forests damage by hazardous waste economical consequences The rate of hazardous waste produced eco-
nomical consequences, which is exactly is related to forests damage must be evaluated by special coefficients, taking into account factors:
1. location of source in relation to forests; 2. category of waste danger. So, in base of economical benefits evalua-
tion are costs and losses, connected with forest damage by hazardous waste. In other words we must evaluate benefits which would be taken away in case of forest damage. 3. Model of national economy regulation on base of reciprocity between hazardous waste flow and forestry development
In case of Latvian state, taking into account forestry great significance, the issue of selection of optimal national economy development strat-egy could be based on diversity of hazardous waste rate, searching for optimal proportion be-tween producing and exploiting of hazardous production amount and forests protection. This proposal could be defined by hypothesis: Latvian foresty economical benefit is function of gener-ated hazardous waste flow, what is described by formula (1).
B(F)=f(qHW), (1) where B(F) - forestry economical benefits, EUR;
qHW - volume of hazardous waste, kg. This hypothesis is practically demonstrable
by tendency of forestry specific weight in GDP in dependence of generated hazardous waste vol-ume. It’s necessary to take into consideration, that forestries economical indexes are effected as by generated hazardous waste volumes in current, as in previous periods of time. It ex-plains a little grouth of forestry input during in-crease of hazardous waste volume (Fig. 7).
0
50
100
150
200
250
300
82136 72250 25670 27488 27934 45047 41606
Generated hazardous waste volume, t
GD
P fr
om fo
rest
ry, m
ilj, L
VL
GDP from forestry, milj, LVL
Fig. 7. Tendency of forestry specific weight in GDP in dependence of generated hazardous waste volume [9]
Regulating hazardous waste generated
amount we can regulate GDP. The determinant is
63

Nora Dubro, Anatoly Magidenko
the issue: what is more profitable - producing and exploiting of production what rezults in haz-ardous waste generation or abandonment and restriction of hazardous waste producing by dif-ferent ways (integration of less hazardous tech-nologies, restrictions and bans) and gaining on foresry. To answer this question must be evalu-ated not only forestry input and forests damage by hazardous waste, but also benefits from haz-ardous production exploiting and costs of tech-nologies modification, as well as losses from re-strictions and bans.
There must be compared forests economical benefits in different levels of hazardous waste influence and losses in order to make a choise of optimal national economy development strategy. Basing on strategy must be selected appropriated instruments for regulation.
Optimal model for state economical policy development is in the maximal locus of total economics effetiveness, what confirm to upper possible limit of forest quality (Fig. 8).
0,00
2,00
4,00
6,00
8,00
10,00
12,00
0 0,1 0,2 0,3 0,4 0,5 0,6 0,7 0,8 0,9 1
Forest quality, %
Tot
al e
ffec
tiven
ess,
EU
R
Total benefit, EUR Fig. 8. Relation between total effectiveness and forest
quality level [9] Forest quality is index, appreciated basing
on system of indicators, evaluating so areas as development, maintenance and improvement of forest resources including their contribution to global carbon cycles, conservation and en-hancement of biological diversity in forest eco-systems, maintenance and enhancement of for-est ecosystem health, vitality and integrity, maintenance and enhancement of productive functions of forests and other wooded lands, maintenance and improvement of environmental and conservation functions of forests and other wooded lands and combating land degrada-tion/desertification.
To identical indicators of forests quality there can correspond different levels of total economical effectiveness that are assumed bene-fits from hazardous production exploitation and benefits from forests sector. Accordingly, the choose of optimal model for state economical policy development leades to total benefts, that
includes as forestry economical and ecological benefits, as benefits of generation of hazardous waste, maximization.
,
0qHP Q(F),constP(HP)
P(HP)] f[(qHP),=B(HP) I(HW)] f[B(HP),B(HW)
f(qHW)Q(F)f[Q(F)]B(F)
maxB(HW)-B(F)TB
⎪⎪⎪⎪
⎩
⎪⎪⎪⎪
⎨
⎧
>=>==
===
>+=
(2)
where TB - total benefits, EUR;
B(HW) - benefits of generation of haz-ardous waste, EUR; Q(F)- forests quality , %; B(HP) - benefits of exploiting/producing hazardous production, EUR; I(HW) - incomes from hazardous waste, EUR; qHP - rate of hazardous production, %; P(HP)- price of hazardous production , EUR. MAX
Benefits are repsresented as diference be-
tween economical incomes and costs, connected with economical activities.
B=I-C , (3)
where B – benefits, EUR;
I – incomes of sector, EUR; C–current and potencial costs, con-nected with sector of economical activ-ity, EUR.
For more understanding about models,
benefits are assembled into components in for-mulas (4) – (13) below. All component are evaluated only in relationship with forestry. Costs connected with forestry include losses in result of abandonment or restriction of hazardous production exploitation.
I(F)=I(F)econ+I(F)ecol, (4)
where I(F) – incomes from forestry, EUR;
I(F)econ – forestry economical incomes, EUR; I(F)ecol - forestry ecological incomes, EUR;
64

HAZARDOUS WASTE INFLUENCE ON LATVIAN FORESTRY ECONOMIC RESULTS
I(F)econ= P(FP)+I(FP), (5) where P(FP) – price of forestry production, EUR;
I(FP) – incomes from forestry production exploiting , EUR;
I(F)ecol= I(LF)+I(NR), (6)
where I(F)ecol - forestry ecological incomes,
EUR; I(LF) - financially expressed incomes from healthy labour fource, EUR; I(NR) - financially expressed incomes from healthy natural resources, EUR.
As people health of definite generation more
or less depends on previous generation health and influence operational capability of next gen-eration, we can suppose, that economical in-comes have the same relation. So, evaluating potential incomes from labor force we must in-clude both factors.
I(LF)=f[I(LF)prev, I(LF)next], (7)
where I(LF)prev – incomes from labour force of
previous generation, EUR; I(LF)next - incomes from labour force of next generation, EUR.
C(F)=Cmain+Cmanag_FHW+L_ab/restr,(8)
where C(F) - costs connected with forestry,
EUR; Cmain - forests maintenance costs, EUR; Cmanag_FHW - forestry hazardous waste management costs, EUR;
L_ab/restr - losses in result of abandonment or restriction of HW production producing, EUR.
Incomes from hazardous waste generation
include potential losses in forestry. I(HW)=I(HW)reg+ I(HP), (9)
where I(HW) - incomes from HW, EUR;
I(HW)reg - incomes from hazarous waste regeneration and exploiting as alternative source of energy, EUR;
I(HP) - incomes from exploiting/realization hazardous production in current volumes, EUR;
C(HW)=L(LF)+L(NR)+C(HW)reg+
+L_dam, (10) where C(HW) – costs connected with hazard-
ous waste generation, EUR; L(LF) – losses connected with labour fource worsening, EUR; C(NR) - losses connected with natural re-sources worsening, EUR; C(HW)reg - costs connected with hazarous waste regeneration and exploit-ing as alternative source of energy, EUR; L_dam - current losses connected with forests natural resources damage, EUR.
L(LF)= C_med+C_allow+L_phys, (11)
where C_med - current and potencial medical
attention costs, EUR; C_allow - current and potencial allowances, connected with people health problems, EUR; L_phys - current and potencial physical losses of labour fource, EUR.
L(NR)= L_atm.pol+ L_s.acid+ L_anim+ + C_elim, (12)
where L(NR) – losses connected with natural
resources worsening, EUR; L_atm.pol - losses connected with at-mospheric pollution, EUR; L_s.acid - losses connected with soil acidification, EUR; L_anim - losses connected with disappearance of animals kinds, EUR; C_elim - pollution elimination costs, EUR.
L_dam = L_fs+ L_es+L_rms, (13)
where L_fs - food source diminishing/losses, EUR; L_es - energy source diminishing/losses, EUR; L_rms - raw materials for manufacture source diminishing/losses, EUR.
Summarizing and evaluating information
about hazardous waste economical influence on Latvian forests, as well as studying changes of forestry input into Latvian national economy de-pending on hazardous waste amount in length of time is possible to achieve optimal economics results in existent circumstances.
65

Nora Dubro, Anatoly Magidenko
Conclusion Created model of national economy regula-
tion, based on calculation of economical input and output of hazardous production manufacturing and exploitation and comparison it with forestry economical results in different lev-els of potential influence of hazardous sub-stances from forestry and other sectors of eco-nomical activity, make possible to define eco-nomical role of forests ecosystems in Latvian national economy, as well as sketch scenario for efficient working out and development of sus-tainable forest management system.
According to model for regulation of main Latvian economics indexes is necessary to pro-vide limitation of external forests pollution, as well as have to manufacture cost effective and reliable high performance enviromentally friendly forestry equipment which let to reduce internal forests pollution.
All conmopents of optimization model are presented in form of dependency functions, which factors could be specified in result of ac-tual tendencies of main components in definite periodds of time research.
References:
1. Key figures in the Latvian economy [Electronic re-source] – Read 01 November 2008 - http://www.netherlandsembassy.lv/data/file/Sector_Fact_Sheets_Latvia_2008.pdf (in English).
2. Forest biodiversity [Electronic resource] – Read 01 November 2008 -
http://www.lva.gov.lv/daba/eng/biodiv/mezu_e.htm (in English).
3. Latvia - Forestry – Read 01 November 2008 - http://www.nationsencyclopedia.com/Europe/Latvia-FORESTRY.html (in English).
4. Some aspects of Forest-based sector technology 5. platform development in Latvia [Electronic resource]
– Read 01 November 2008 - 6. http://www.forestplatform.org/easydata/customer
s/ftp/files/Admont_speeches/admont_latvia_nsg.pdf (in English).
7. MARKET STATEMENT 2008 [Electronic resource] – Read 01 November 2008 -http://www.unece.org/timber/mis/market/market-66/latvia.pdf (in English).
8. Лес [Electronic resource] – Read 01 November 2008 http://ru.wikipedia.org/wiki/%D0%9B%D0%B5%D1%81 (in Rushian).
9. Use of the O Horizon of Forest Soils in Monitoring Metal Deposition in Latvia [Electronic resource] – Read 01 November 2008 -http://www.ingentaconnect.com/content/klu/wate/2002/00000135/F0040001/00352728;jsessionid=jnzcytv6vaf7.alice?format=print (in English).
10. Forestry Management as Latvia grapples with the EU [Electronic resource] – Read 01 November 2008 -http://www.archnetwork.org/modules.php?name=News&file=article&sid=90 (in English).
11. COUNTRY REPORT ON THE PRESENT ENVIRON-MENTAL SITUATION IN AGRICULTURE – LATVIA [Electronic resource] – Read 01 November 2008 - http://www.fao.org/docrep/X3413E/x3413e15.htm (in English).
12. Latvijas statistika datubāzes [Electronic resource] – Read 01 November 2008 -http://www.csb.gov.lv/csp/content/?cat=355 (in Latvian).
66

УПРАВЛЕНИЕ И УСТОЙЧИВО РАЗВИТИЕ 2/2009(23) MANAGEMENT AND SUSTAINABLE DEVELOPMENT 2/2009(23)
MOST IMPORTANT FACTORS INFLUENCING ROAD TRAFFIC ACIDENTS AND
EFFECTIVENESS OF PUBLIC INVESTMENTS IN ROAD TRAFFIC ACCIDENT REDUCTION PROJECTS IN LATVIA
Liena Adamsone, Dace Parupa
Riga Technical University, Latvia
Abstract
Transport industry plays a very important role in each country's development. An efficient industry that facili-tates the movement of commodities, products and people is therefore vital to the growth of the country. In the European Union transport industry makes up about 7% of the European gross domestic product, about 7% of all jobs, 40% of investments by member states and 30% of energy consumption. However, notwithstanding trans-port industries positive influence of the nation's economic welfare, the automobilization causes also such negative externalities as the air pollution, noise, traffic jams and road traffic accidents (RTA). According to statistics, in 2007, 43000 people had died in road traffic accidents in the European Union - looking at it another way, it is the equivalent to a five medium-sized airplane disaster happening in Europe per week. Also in Latvia during the recent years, the number of the registered RTAs has increased. During four years it had grown by more than 25%. The greatest increase was in the period from 2006 till 2007, when the number of RTAs grew by 17%. In 2006, RTAs caused economic damages in the amount of LVL 217,12 million (EUR 152,6 million). High number of RTA has become one of the major problems in European Union. The aim of this article is to identify and analyze the factors, influencing road traffic accidents, and analyze the efficiency of the investments into the reconstructed road sec-tions. For better interpretation there is: elaborated a model of interaction between factors which influence road traffic accidents and efforts which should be made to reduce amount of RTAs; there is also made an analyze about the change of RTA in some reconstructed road sections in Latvia. An analyze showed that no road recon-structions with the aim to reduce the number of RTAs are as effective as the change of the traffic participants' behavior. At the end of the paper are given proposals for minimizing the number of RTAs. Given analysis can be used in future planning of needed investments for reconstructing of motorways and investments for changing hu-man behavior.
Key words - Transport industry, road traffic accidents, losses of national economy, factors influencing road
traffic accidents.
European Union (EU) market is built on four freedoms of movement – the freedoms of movement of goods, services, persons and capi-tal. At least two of these freedoms depend largely on physical mobility. The increasing mo-bility of people and goods has played an essen-tial role in EU economic growth, and our social and regional cohesion. Over the last decades, increasing mobility has been at the core of eco-nomic growth in the EU. Also competitiveness of the European manufacturing and services indus-tries is directly dependent upon the mobility of goods and persons. After a prolonged period of stagnation, the transport policy of the European Union (EU) has developed very rapidly during the last 15 years. In view of the growth of economic welfare, entailing the increase of the number of vehicles and intensity of traffic, one must take into consideration also the increase of the num-ber of RTAs [1]. In this respect, the EU member states have set the aim to minimize the number of accidents and fatalities- target is to reduce the
number of road fatalities by 50% by 2010 com-pared with 2001.
During the last seven years, the overall population in Latvia has decreased by 4%, but at the same time the number of passenger cars reg-istered during the same time has increased by 72.2%. As the result of increase of the number of vehicles, the annual average traffic intensity on the state motorways has increased by 97%, including freight transport by 36%. Based of the abovementioned statistics, Latvia has reached the level of automobilization 300 vehicles per 1000 people. According to the opinion of the specialists of Swedish Road and Transport Insti-tute, the level of automobilization, exceeding 300 cars/1000 people, is to be considered a relative saturation level of automobilization. In such circumstances, for instance, in Sweden road safety alongside with environment protec-tion is made state priority.
The increase of the number of vehicles and drivers entails also negative consequences, such as:
67

Liena Adamsone, Dace Parupa
- increase of environment pollution; - increase of the number of road traffic
accidents. The worst situation in Latvia, in traffic
safety was in the year 1991, when 923 people died in road traffic accidents (RTAs). This tragic statistics and rapidly developing contacts of Lat-via with the European countries, made more acute the issue of ensuring European level safety on Latvian motorways. In 1994, in Latvia, within the framework of the Transport Development Program, the first Road Traffic Safety Program was developed. Implementing the activities in-cluded therein, already in 1998, the number of fatalities decreased 1.47 times, compared to the year 1991.
However, even if the number of RTAs has decreased since 1991, still the number of the registered RTAs has steadily increased during the last four years (2003–2007). During these four years, it has grown by more than 25%, and the greatest increase has been in the period from 2006 till 2007 – during one year the number of RTAs has grown by 17%. Even if the number of RTAs has grown in the recent years, the total number of fatalities in RTAs has fallen by 18% during the last four years. The total number of injured also has decreased by 5% during the last four years.
Road crashes cost approximately 1 to 3 percent of a country's annual Gross National Product (GNP). These are resources that no country can afford to lose, especially those with developing economies. Economic damages, re-sulting from RTAs, in Latvia amount to 1.55% of the Gross Domestic Product.
Based on the overall increase of automobili-zation and the aims set by the EU in the promo-tion of road safety, the Ministry of Transport has given a special importance and priority to the issue of road safety. The achievable objective is safe traffic on safe roads, where qualified drivers drive technically safe vehicles. In further docu-ment there will be described each of 3 safe traf-fic elements (factors):
1) Motorway infrastructure, its condition and the organization of traffic (safe roads). Un-der term “safe roads” we understand such road factors: lighting, view obstructions, recognizabil-ity, signs, signals, surface character, dimensions and protective devices. All factors are subject to modification by outside influences such as the road surface that becomes slick from rainfall. The total density and coverage of motorway
network in Latvia is sufficient, and the length and situation of motorways allows to reach populated places. However, it must be admitted that the technical condition of the motorways is unsatisfactory and inadequate to the require-ments of safe and continued traffic. At the cur-rent insufficient level of motorway maintenance and development financing, along with the in-crease of the actual intensity of traffic flow and the proportion of heavyweight vehicles, the qual-ity of the motorways significantly decreases each year, and a continuing degradation of the motorway network is going on. As the shortage of financing hinders the restoration of black road surfaces in the normative amount, the quantity of road surfaces in poor condition increases each year, accordingly increasing the amounts of the postponed renovation works. Along with the in-crease of the actual intensity of vehicle traffic flow, exceeding the predicted increase, and the lack of funds for renovation and reconstruction of road surfaces, as well as the construction of new roads, the qualitative indicators of the mo-torways significantly decline each year. State and municipal road maintenance costs are fi-nanced from the state and municipal budgets, but the wish expressed by Latvia to be one of the EU member states and its participation al-lows and will allow to receive additional co-financing for the road investment projects (ISPA, Cohesion Fund, European Regional Development Fund). In 2008, the state budget expenditures for the state motorway fund program are set al-ready at the amount of LVL 236.4 million. 30% of this financing are allocated for special purpose subsidies for financing of municipal streets and roads, but the remaining 70% or LVL 165.5 mil-lion – for financing of state motorways. This sum in its turn is divided into maintenance and management of state motorways (LVL 73.6 mil-lion) and capital expenditures for the renovation of state motorways (LVL 91.9 million, 12 mil-lions of which are provided for state 2nd grade motorways and regional support). It is planned that starting from 2009, as much as LVL 35 mil-lion will be channeled for state 2nd grade mo-torways. In the period from 2008 till 2013 it is planed that transport infrastructure projects will be realized for the total amount of LVL 2.5 bil-lion, including LVL 724.8 million investments into motorways, LVL 727.1 million – into rail-way, LVL 269.3 million – into aviation, LVL 494.7 million – into ports [2]. Even with the in-crease of the financing of state motorways from
68

MOST IMPORTANT FACTORS INFLUENCING ROAD TRAFFIC ACIDENTS AND EFFECTIVENESS …
the principal state budget in the last eight years, still, in view of the current growth of traffic in-tensity, the reconstruction of roads proceeds too slowly. According to the calculations by the Min-istry of Transport, the financing, allocated for the maintenance of state motorways, including their renovation, during the last 15 years, has been significantly smaller than normatively necessary. The overall condition of the motorways becomes worse each year, causing dissatisfaction among people – drivers, taxpayers and local authorities. The accumulated repair deficit, calculated in the prices of the year 2006, exceeds LVL 4.26 bil-lion, but the projection of the state motorways financing for the state budget subprogram 23.06.00 "Management, Maintenance and Renovation of State Motorways" in the period from 2007 till 2013 will allow to channel only LVL 1.29 billion for the state motorways. Evalu-ating the actual situation in the road traffic infra-structure, as well as the projection of the state budget financing for motorways, one has to ad-mit that there are good prerequisites for the use of public-private partnership models for the de-velopment and maintenance of motorways and their infrastructure. It is further confirmed by the existing practice in other countries and a positive experience in the realization of public-private partnership projects especially in the transport industry.
2) Technically safe vehicles. Under term “technically safe vehicles” we understand such vehicle factors: equipment condition, view ob-structions, distractions, instruments, signaling devices, control sensation, comfort, automatic controls and devices, weight, performance, di-mensions and stability, automatic cruise control, navigation systems, existence of seat belts, air-bags. In Latvia new transport vehicles compiled 18% of total amount of first time registrated ve-hicles in year 2000, but in year 2006 it was al-ready 26%. The number of transport vehicles is growing with economic growth across Europe, leading to increased environmental impact. But with Europe’s economic recession transport ve-hicles selling industry has stopped. Amount of new transport vehicles effect average age of a car. In Europe average age of a car is eight years old [3], but in Latvia it is 11 years old. The aver-age age of a car speaks also about the cars owner possibility to repair car. Many car owners are not prepared to pay the premium rates of the authorized repair network to maintain their vehi-cles. Car repair and maintenance are key cost
issues for most motorists, and it is normal that car owner have choice to choose affordable ser-vice price for his pocket. To ensure better ser-vice quality, there should be more regulations for services about the individual qualities of cars. A well-designed and well-maintained vehicle, with good brakes, tires and well-adjusted suspension will be more controllable in an emergency and thus be better equipped to avoid collisions. It is interesting, that the color of a car also plays a role in determining whether the vehicle will be involved in a crash. A study of 31,000 crashes in Sweden found that black cars were involved in 22.5% of the crashes even though black cars made up only 4.4% of the vehicle population. This means that black cars were 5 times more likely to crash. According to the same study, the safest car color was pink [4]. However there are no countries where black cars are illicit in usage.
3) Human factor Under term “human fac-tor” we understand such factors: decision mak-ing, driving skills, demographics (age- very young people may see something sooner than older people, younger drivers tend to drive fast, but older drivers tend to drive slow; gender), distrac-tion, drugs and alcohol, driving experience, driver training, sensory capabilities, judgment, attitude, alertness, health, poor eyesight, customs, habits, familiarity with vehicle and environment, fatigue, inattention, response to the unexpected, risk-taking behaviors, stress, panic, and hyper vigi-lance. Several conditions can work together to create a much worse situation, for example [5]: combining low doses of alcohol and cannabis has a more severe effect on driving performance than either cannabis or alcohol in isolation, or taking recommended doses of several drugs to-gether, which individually will not cause impair-ment, may combine to bring on drowsiness or other impairment. This could be more pro-nounced in an elderly person whose renal func-tion is less efficient than a younger person's. Human factors are without doubt the most com-plex and difficult to isolate as they are almost all very temporary in nature. What existed at the time of the accident may not exist moments later. There are made some investigations about human behavior, but information of its impact and importance is not enough. For example, higher speed increases risk of occurrence of an accident because it shortens the period of time for drivers to take decision in critical situation and to perform manoeuvre of escape. In the ac-cident with pedestrians the possibility that the
69

Liena Adamsone, Dace Parupa
pedestrian will be killed increases rapidly if the speed at the moment of crash is higher. For ex-ample, if the speed of the vehicle at the moment of crash is 50km/h instead of 40km/h the risk that the pedestrian will be killed increases 2,5 times [6]. If speed is 80 km/h, in reaction time (1 second) driver can make approximately 22m. Cars travel to stop is 35m. In whole- 57m. It means that if somebody runs 35 m afore a car – there will be a crash with a victim. But if a speed in this situation would be 50 km/h - in reaction time car makes14m, but cars travel to stop is 13m. It means in whole 27m- and in this situa-tion there is no accident. European statistics shows that approximately 1/3 of all RTA with killed persons happen because of breaking speed limit [7].
To evaluate impact of above mentioned fac-tors the authors of this paper have made an ana-lyze to some reconstructed road sections. An analyze in reconstructed road sections is made upon the changes of number of RTAs. Authors of this paper analyzed such reconstructed road sections in a period 2005 - 2007:
- in 2005, was made reconstruction of Ba-lozi crossing (installation of traffic-lights) on motorway A7 Riga- Bauska- Lietuvas border)10 km (Figure 1);
- In 2006, was build a regulated pedes-trian crossing at Aizkraukle railway sta-tion on the motorway A6 Riga–Daugavpils–Kraslava–Byelorussian border (Paternieki) 89-90km (Figure 2).
0
2
4
6
8
10
12
14
16
2001 2002 2003 2004 2005 2006 2007 2008
RTA RTA with injured persons Lost lifes Injured persons
Fig. 1. RTAs on the motorway 10km (Balozi crossing) in period 2001 – 07.2008
1
2
0
1 1
0 0
1
0 0 0 0 0 0 0
2
1
0 0
1
8
7
3
4 4 4
33
11
2
00
1
2
3
4
5
6
7
8
9
2001 2002 2003 2004 2005 2006 2007 2008*
RTA RTA with injured persons Lost lifes Injured persons
Fig. 2. RTAs on the motorway A6 89-90km (Aizkraukle) in period 2001 – 07.2008
70

MOST IMPORTANT FACTORS INFLUENCING ROAD TRAFFIC ACIDENTS AND EFFECTIVENESS …
Analyzing RTA dynamics in the abovemen-
tioned crossings (Figures 1 and 2), we can see that the overall number of RTAs in both recon-structed road sections has decreased from 2001 till 2008. However, evaluating the number of RTAs which was right before the making of the investment (burden line), we can see that the number of RTAs has not fallen dramatically, but – quite the opposite – has remained on the pre-vious level or even slightly grown. But, analyzing the statistics of RTAs with victims and injuries, we can see that the severity of accidents falls. Although the actual data show that the number of RTAs has not changed after the making of investments, still, considering the increase of the number of vehicles and road traffic intensity, it can be considered that the reconstruction of the pedestrian crossing has given a positive result. The same situation is in most of all reconstructed road sections in Latvia.
However, on the basis of the abovemen-tioned, as well as on the State Audit Office of Latvia, Audit Report Nr. 5.1-2-7R/2005 (09.06.2006.), it can be concluded that in most cases in comparison with the situation before reconstruction, the number of persons, injured in road traffic accidents decreases, but the number of accidents has not decreased.
Two hypotheses can be put forward: 1. the quality and effectiveness of the
reconstruction works are not sufficient. 2. conditions each year controls Road
Traffic Safety Directorate of Latvia and it can’t be the main factor causing RTA.
The abovementioned leads to the conclu-sion that no road reconstructions with the aim to reduce the number of RTAs are as effective as the change of the traffic participants' behavior.
A 1985 report based on British and Ameri-can crash data, found that driver error, intoxica-tion and other human factors contribute wholly or partially to about 93% of crashes [8].
Nowadays human factor is involved in be-tween 70 and 90% of traffic accidents, well above environmental factors, which are involved in 15 to 35%, or directly vehicle-related causes, which account for 4 to 10% [9]. It must be in the centre of attention of all society as well as in the centre of attention of particular sciences.
Most of accidents result from human error and carelessness on the part of the derivers or pedestrians. However, the probability of occur-rence, and its severity, can often be reduced by
the application of proper traffic control devices, and good roadway design features. The success or failure of such control devices and design specifications however, depends extensively upon the analysis of traffic accident records at specific locations. It has long been recognized that the most effective means towards accident reduction lies in a systematic and scientific ap-proach based on the use of accurate and reliable traffic accident data.
On the basis of the abovementioned, the authors of this publication have made a model which could help specialists to work with this problem and to prevent RTAs (figure 3).
Needed efforts, which have to be made to reduce amount of RTAs (explanation to figure 3):
1. Increasing of drivers subjective factor: a. It is important to construct more roads
with circular movement; b. to realize wide control on roads (Pres-
ence of real or dummy policemen, photo and video radars)
c. perform road safety audits 2. Perform more activities & campaigns
with purpose to change drivers and pedestrians behavior:
a. To educate and to train road users to be-have safe – crate new instructional materials for schools and integrate this materials in obligatory school subjects. Teaching safety skills to chil-dren can provide lifelong benefits to society, but should be seen as a long term intervention strat-egy;
b. To create public opinion about safe be-havior based on actual investigations about each factors importance;
c. To enforce the road users to behave safe;
d. Parents should speak with their children about road traffic and how to act in special situations;
e. Train how to afford first aid to injured persons;
3. Improve technical construction of vehi-cles:
a. To advance brake dynamometers work; b. Improve car lighting elements c. Improve cars safety elements 4. Reduce old cars on Latvian roads- it is
needed to work out countenance and motivation system for drivers to change old cars on new cars;
71

Liena Adamsone, Dace Parupa
Main factors which affect RTAs
Wro
ng c
hoi
ce o
f sp
eed
Drive
r’s
inat
tent
ion
(ino
bser
van
ce o
f dis
tan
ce,
eating
, sm
okin
g,
usi
ng p
hone
w
hile
driv
ing)
Drivi
ng u
nde
r in
flue
nce
of
alc
oho
l, d
rug
s or
ot
her
into
xica
ting
subs
tan
ces
Bad
tec
hnic
al c
ond
itio
n of
veh
icle
Inad
equa
te
qual
ity
of
road
infr
a-st
ruct
ure
Tw
iligh
t an
d d
ark
time
of d
ay
Insu
ffic
ient
tec
hni
cal
equ
ipm
ent
for
traf
fic
orga
niza
tion
and
op
timiz
atio
n
N
egat
ive
effe
cts
of
envi
ron-
men
t
A C T I V I T I E S
1. In
crea
sing
of
driv
ers
sub
ject
ive
fact
or
2.
Org
aniz
ing
acti
vitie
s &
ca
mp
aign
s w
ith p
urp
ose
to
chan
ge t
raff
ic u
ser
beh
avio
r
3.
Impr
ove
tec
hnic
al
con
stru
ctio
n of
veh
icle
s
4. R
educ
tio
n of
old
car
s o
n ro
ads
(mo
re t
han
15
yea
rs)
5 I
mpr
ove
qua
lity
of
regu
lar
tech
nica
l mai
nte
nan
ce
6. S
tren
gthe
ning
of
vehi
cles
in
spec
tion
7. D
evel
opm
ent
of r
oads
dai
ly
mai
nten
ance
and
rec
onst
ruct
ion
8. I
mp
rov
emen
t of
lig
htin
g &
es
tabl
ish
ad
diti
ona
l tra
ffic
lig
hts
9.
Re
build
ing
of
“bla
ck s
pot
” cr
ossi
ngs
10
. En
gin
eerin
g to
impr
ove
st
reet
s an
d ve
hicl
es
11
. D
evel
op c
oord
inat
ion
bet
wee
n r
espo
nsib
le s
ervi
ces
Decrease of RTAs & RTAs severity
Fig. 3. The model of reduction of the amount of RTAs
5. Improve quality of regular technical main-tenance:
a. Guarantee for repayments; b. Licensing of services; 6. Strengthen vehicle inspection. It is
needed also in future to carry on vehicle techni-cal control, registration and certification;
7. To carry on roads daily maintenance and reconstruction:
a. To carry on reciting of “black spots” and improve their determination;
b. To carry on audit of roads always and af-ter reconstruction of roads, establish regular au-dit groups;
c. Detect and correct of locations with a high incidence of wet weather accidents utilizing
8. Improve lighting and establish additional traffic lights to improve quality of roads – Swed-ish example shows that full lightning of road helps to avoid from RTA for more than 62%,
because more than ½ of RTA happens in dark time of day.
a. Build new pedestrian crossings only with extra lightning;
b. To produce new designs of reverberates so that each person wants wear them;
c. To place more self reflecting elements on roads so that each person can see where are road borders, crossings, or other important ele-ments and warning signs;
d. State and municipalities have to ensure their citizens with qualitative roads where are enough space far cars and pedestrians so that each of tem feel safe.
Important to establish additional traffic lights on crossings of important roads and where pedestrians walks frequently:
e. All traffic lights in one common net where person in charge can regulate it;
72

MOST IMPORTANT FACTORS INFLUENCING ROAD TRAFFIC ACIDENTS AND EFFECTIVENESS …
f. To hew out trees and bushes which grows next to roads so that visibility of road is burden;
9. Rebuilding of “accident black spot” crossings and installation of needed road signs. Make new pedestrian crossings. For example, the use of road signs and markings to channelise traffic through complex intersections or to pro-vide safe waiting areas for turning vehicles can often result in substantial reductions in acci-dents.
10. Engineering to improve streets and ve-hicles. For example, 1) there are no seat belts specifically designed for children, 2) most pedes-trians are hit by the front of the car, so the most common sites of injury are the head and lower limbs. The bumper contacts the lower limbs, and the body then wraps itself around the car with the head finally hitting the lower windscreen or bonnet. One proposal is to set bumpers lower, so that the femur and tibia rotate together on impact, avoiding the lateral stress on the knee that can result from femoral rotation alone. Bumpers should also contain an extra layer of energy absorbing material to reduce the impact force. Bonnets should be more than 10 cm clear of underlying structures to ensure flexibility if struck by a head. Other ways to provide clear-ance are airbags in the region of the lower wind-screen and pop-up bonnets [10].
11. Develop coordination between respon-sible services (roads police, emergency medical services, fire-brigades, etc.) and coordination between them:
a. Road police isn’t just for giving adminis-ter punishment, but also for improvement of traf-fic management to help drivers and pedestrians to get to needed destination;
b. Improve technical equipment of respon-sible services (also communication network);
c. Improve location of responsible services, because first 25 minutes after RTA are most im-portant;
d. To ensure enough personal in each sta-tion/ brigade.
It is also important to improve communica-tion system on roads:
e. To ensure all motorways with telephone communications in solitary cases;
f. To establish integrated database with geographical data, where catching telephone signal ambulance or police can get information about the precise place of RTA. In this system there should be an option were ambulance car can change signal of traffic lights to get faster to needed place.
Realization of above mentioned activities in
the field of road safety is significant, because these activities will reduce not only the amount of RTAs, but also traffic accident costs of the expected loss of net production of persons killed or crippled in traffic accidents, hospital treatment of injured victims and costs caused by the road users themselves.
It is also important to realize all mentioned activities together all the time so that all factors, which affect RTAs can be prevented
References:
1. Potočnik J., Making the European transport indus-try "greener, safer and smarter" to boost our in-dustrial competitiveness, Ljubljana, 21 April 2008 http://209.85.229.132/search?q=cache:jM1OUJPNQosJ:ec.europa.eu/commission_barroso/potocnik/news/docs/20080421_speech_transport.pdf+Trans-port+industry+in+EU&hl=lv&ct=clnk&cd=3&gl=lv
2. http://www.ldz.lv/dc/lv/aktuala_informacija/Trans-porta_nozares_preses_apskats/newspapers_in_latvian/Neatkariga_rita_avize/19854
3. Zabalaga C., FIA Response to the Commission Report on Block Exemptions, Fédération Interna-tionale de l'Automobile, Brussels, 29 May 2008
4. http://www.landtransport.govt.nz/fascinating-facts/safe-vehicle-colours.html
5. http://en.wikipedia.org/wiki/Car_accident#cite_note-trl1-18#cite_note-trl1-18
6. Lāma A., Influence of human factor on road traffic safety in Latvia, presentation, Riga, 2007
7. ADONIS Final Report, 1998. 8. http://en.wikipedia.org/wiki/Car_accident 9. Montoro L., The human factor is present in at
least 70% of traffic accidents, Madrid, 27 May 2008
10. http://jrsm.rsmjournals.com/cgi/content/full/96/10/475
73

УПРАВЛЕНИЕ И УСТОЙЧИВО РАЗВИТИЕ 2/2009(23) MANAGEMENT AND SUSTAINABLE DEVELOPMENT 2/2009(23)
IMPORTANCE OF GUARANTEED MARKET IN ESTABLISHMENT AND FUNCTIONING
OF A CO-OPERATIVE INNOVATION SYSTEM
Andro Roos, Eve Tomson University of Tartu, Estonia
Abstract
Our article studies importance of guaranteed market in establishment and functioning of co-operative
innovation system. In our article we will bring out our concept of granted market in the context of co-operative banking cluster. The methodology of the article is comparative theoretical discussion over innovation and its connectivity to the theory of co-operatives and co-operative banking. In the article we will show our logic behind the proposed discourse through the figure and academic argumentation.
A co-operative bank can apply principle of guaranteed market when giving out loans or making investments to its members. Financing its members, co-operative bank may not require traditional collateral (mortgage etc.) first, rather it requires that borrowing members should consume each others goods, services or labor force. This kind of requirement will establish guaranteed market between members of co-operative bank and will make borrowers cash flows more stable. This kind of granted market will therefore function as extra collateral for a co-operative bank. Latter can also function as innovation facilitator of the cluster, so that the guaranteed market functions as a motivation system for members-borrowers to co-operate more intensive.
Key words: co-operative bank, national innovation system, guaranteed market, linear approach, financing
Introduction The term innovation comes from Latin word
innovare, which means „to do something new” [9]. In the context of economics science the term innovation comes from economics philosophy of Joseph Schumpeter. According to Schumpeter innovation is oriented to dynamic and change-oriented approach to topics of economics.
Scumpeter defined economic innovation in “The Theory of Economic Development” in 1934 [4]:
- The introduction of a new good — that is one with which consumers are not yet familiar — or of a new quality of a good.
- The introduction of a new method of production, which need by no means be founded upon a discovery scientifically new, and can also exist in a new way of handling a commodity commercially.
- The opening of a new market, that is a market into which the particular branch of manufacture of the country in question has not previously entered, whether or not this market has existed before.
- The conquest of a new source of supply of raw materials or half-manufactured goods, again irrespective of whether
this source already exists or whether it has first to be created.
- The carrying out of the new organization of any industry, like the creation of a monopoly position (for example through trustification) or the breaking up of a monopoly position.
Charles Edquist [2] has defined the term of innovation system as all important economical, social, political and organizational factors which influence the development of innovation, its spreading and usage. Hence, in the case of innovation systems we are dealing with systems of networks. The theory is based on standpoint that the there exist relationships between organizations and institutions which function as the sources of innovation.
In the case of Estonia, we recommend to put a co-operative bank to the centre of national innovation system, as in our opinion co-operative principles support the definition of innovation system. Also co-operation is the main presumption in creating innovation and functioning of the innovation systems efficiently. Creating a functioning innovation system monetary funding is also a premise. Hence we propose co-operative banking channel to fund the creation and development of national innovation system. The co-operative bank as innovation facilitator would have to create the centre for cooperative network, e.g. a cluster
74
Andro Roos, Eve Tomson
which would unite monetary resources and competence of the cooperatives operating in different fields and create Estonian national innovation system.
1. Path-dependence of development of co-operative banking, the need and the possibilities for innovation
Michael Porter [11] has approached the term of innovation in the broadest context. His definition embraces both, new technologies and new functionality of thoughts and inventions, and it comes from his discussion that through innovational activity enterprises can achieve advantage in competition. Innovational activities all together form the process of innovation and their outcome if innovation [3].
As Estonian research and development strategy for 2007-2013 states, innovation in-cludes both, implementation of latest outcome of scientific research as well as already existing knowledge, skills and technologies in an innova-tive manner [15]. Hence, in the case of innova-tion we are dealing with implementation aspect and applying inventions, technological develop-ment, new thinking into every-days life. Innova-tion therefore is not inventing a new technology, but implementing it into uniform usage. Innova-tion is also based on more efficient usage of ex-isting knowledge or technology. It has to be pointed out that for innovation it is enough to be innovative for an enterprise, not necessarily for the entire market [6].
Often innovation is distinguished in conventional manner as inventing new technologies or applications, which are going to be implemented in business afterwards. This kind of comprehension could be interpreted as linear approach of innovation. According to the linear approach new discoveries come first through science, after which implementation follows and only in the end of the process innovation and economical benefit will emerge [3]. In fact, only very few innovations is materialized that way. Most innovations emerge in middle stages of the process. This kind of comprehension could be held systematical approach of innovation, which is considered more accurate in modern days. Innovation is induced by entrepreneurs, who generate and push development of the economy.
The essence of innovation can be classified according to the nature or the scope of innovation. According to the nature, innovation
is classified as technological innovation, organizational innovation, process innovation and marketing innovation. [10]. According to the scope there can be brought out two classifications: incremental or step-by-step innovation and radical innovation. Incremental innovation emerges usually unexpectedly in the process of research and development and it prefigures small improvements. Radical innovation on the contrary has long-run effect and will change the basis of society [1].
Additionally to the mentioned classification, Lundvall´s [8] definition of innovation is vitally important due to the fact it reifies terms as diffusion and absorption in the context. The essence of co-operative banking to financial and entrepreneurial innovation can be both, incremental and radical.
2. Co-operative banking as a possible element of national innovation system
Hereinbefore we discussed over definition of innovation and innovation system. We concluded that Edquist [2] has defined the term of innovation system as all important economical, social, political and organizational factors which influence the development of innovation, its spreading and usage. Hence, in the case of innovation systems we are dealing with systems of networks. The theory is based on standpoint that the there exists relationships between organizations and institutions which function as the sources of innovation.
Systems usually consist of two inputs: participants of the system and relationships between the participants. Also the reason or goal why and on which basis (factors) individuals form homogeneous entities and how or in which scope they are different from other individuals forming other systems (entities) or being unsystematic is specific to every system. Concerning with innovation systems two important components can be brought out: institutions and organizations.
On one hand, institutions fix the context of creating and existing of organizations. On the other, existing organizations affect on creation of new institutions or reforming existing ones. Also in the case of innovation systems there is a great importance on the interdependency between organizations and institutions. For instance: how different institutions and institutional changes predispose or retard innovation procedures in or between organizations.
75

IMPORTANCE OF GUARANTEED MARKET IN ESTABLISHMENT AND FUNCTIONING …
Organizations conduct activities in innovations systems, which according to their essence are connected to implementation of innovation in manufacturing and also preceding and succeeding procedures of generating innovation. Liu and White [7] have been pointed out five activities in innovation systems: research and development (R&D), implementation, end-use, education and linkage.
Different institutions exist, have and will be formed to enthuse and guide organizations to participate in desired activities. Institutions as collective standards and principles form individuals´ values, attitude, behavior etc. Hence, they affect on the ability of learning of the economy and through that they encompass entire innovation system. According to preceding academic discussion we handle co-operative bank or co-operative banking system not as an organization, but institution.
Johnson and Jacobson (2000: 3-4) have pointed out five main functions of institutions in innovation systems:
1. generating new knowledge; 2. R&D and its management; 3. supplying with different resources; 4. predisposing positive externality; 5. accelerating formation process of
markets. We will show through figure 1 the role and
the importance of guaranteed market in establishment and functioning of a national (co-operative) innovation system. We will show as follows by the figure and following discussion that co-operative banking system as institution can enforce at least three functions pointed out by Johnson and Jacobson (2000: 3-4). Directly and independently functions 3-5. The theoretical basis of figure 1 is quotation of Roelandti and den Hertog 1999: 9 “…/ a cluster can be defined as/ … strongly inter-dependent production networks of enterprises …, knowledge creating agents (universities, R&D centers), institutions (brokers, consultants), which are connected one and other in the value added chain.” Technological development through an open model approach of Kordel [5] is also the terminus a quo in our approach.
Fig. 1. The role of co-operative banking as institution
in the context of creating and existing of organizational networks and its importance in the
national innovation system. (by the Authors)
3. Guaranteed market concept as inducer of innovation in the context of a co-operative bank as the innovation facilitator
Taking the cooperative theory into account, the purpose of the co-operative bank as the innovation facilitator is to offer loans to its clients on the best terms possible. It has been empirically proven that in the initial stage the target group of co-operative activity (co-operative banking) consists of small entrepreneurs (on figure 1, crossed balls) or those who have just started their businesses and lack the needed capital, guarantees of a traditional bank or credit value in the eyes of the banks to activate and develop their activities. These entrepreneurs can establish a co-operative bank (on figure 1 the central ball without cross) with the purpose to satisfy their credit needs. Of course the issue of funding the co-operative bank arises immediately, but this is not the issue of the article and can be solved through roping in some super-investors. With their support it will be possible to activate the co-operative bank and quickly start satisfying their credit needs.
With financing on the part of its members the co-operative bank will not at first demand traditional security collateral (mortgage, deposit, guarantee and so on) but will require that member who received a loan or investment to provide or consume whenever possible services, goods and information of members belonging to the cluster (on figure 1 marked with thin arrows). This will create a guaranteed market
76

Andro Roos, Eve Tomson
among the co-operatives and their members (who are mostly companies or natural persons) belonging to the cluster and make inner-cluster money flow stable and, to an extent, possible to plan. This, in turn, will increase the capacity of entrepreneurs belonging to the cluster to grant loans and will act as collateral for the co-operative bank. Settlements and clearing (on figure 1 marked with bold arrow) functions in addition to loaning and investing activities of the co-operative bank and affords the bank control over the money flow and boosts the money stock remaining within the system to direct it back into circulation in the cluster. The growth of the money stock through boosting allows to lower the amount and price of the money directed into the cluster; therefore, entrepreneurs who until then remained outside the cluster will start to join in. Because of the growth of money stock and the drop in money price, entrepreneurs belonging to the cluster (belonging to the cluster is marked with tight relationship (arrows) on figure 1) can invest into the development of their businesses more than before. Additional joining of entrepreneurs from different areas of business with the cluster and growth of enterprises will increase the flow of goods, services and money – the possibility of creating a guaranteed inner-cluster market increases and the capacity of entrepreneurs to acquire loans and investments from the co-operative bank improves. Hence, there is potential for a so called snowball effect [13].
The motivation system operates by allowing co-operation with market participants outside the cluster (not belonging to the cluster is marked with random networks (arrows) on figure 1); however, it favors and creates conditions for closer co-operation inside the cluster. Therefore, co-operation with state institutions, commerce-based enterprises, foreign companies, universities and other educational and development institutions takes place similarly to the exchange in goods, services and money within the system. Since the co-operative bank requires if possible to co-operate economically with other members of the cluster when it grants loans or investments, and there is a need (to improve security collateral and loaning) and a goal to expand this co-operation, the co-operative bank induces and finances the circulation of inner-cluster information, knowledge, vision, competence and so on [14]. The end result is innovation. Motivation for this
comes from the requirement of as close as possible inner-cluster co-operation which motivates the enterprises belonging to the cluster to seek possibilities for innovation to achieve the highest possible level of competitiveness (for ex. better price and quality relationship) comparing to outer-cluster entrepreneurs. Otherwise the trade and exchange of information would go on with organizations outside the system and the cluster would lose clear borders and collapse. In the context of figure 1 it would mean that tight relationships (arrows) will change into random relationships (arrows) – the co-operation between cluster participants will be random and hence, the network will be week and random.
Conclusions
A co-operative bank can apply principle of guaranteed market when giving out loans or making investments to its members. Financing its members, co-operative bank may not require traditional collateral (mortgage etc.) first, rather it requires that borrowing members should consume each others goods, services or labor force. This kind of requirement will establish guaranteed market between members of co-operative bank and will make borrowers cash flows more stable. This kind of granted market will therefore function as extra collateral for a co-operative bank. Latter can also function as innovation facilitator of the cluster, so that the guaranteed market functions as a motivation system for members-borrowers to co-operate more intensive.
References:
1. Carayannis, E.G.; Gonzalez, E., Wetter, J. The Nature and Dynamics of Discontinues and Disrup-tive Innovations from a Learning and Knowledge Management Perspective. – The International Handbook on Innovation. Edited by L.V. Shavin-ina. Amsterdam: Pergamon, 2003, pp. 115-138.
2. Edquist, C. Johnson, B. Institutsions and Organi-zations in Systems of Innovations. – Systems of Innovation: Technologies, Institutions and Organi-zations. Edited by Edquist, C. Routledge, 1997, pp. 41-63.
3. Grupp, H. Foundations of the Economics of Inno-vation: Theory, Measurement and Practice. North-ampton: Edward Elgar, 1998, 521 p.
4. Innovation. Wikipedia. [http://en.wikipedia.org/wiki/Innovation]. 15.01.2009
5. Kordel, P. The Regional Technology Development Structures as Essential Parts of Regional Innova-
77

IMPORTANCE OF GUARANTEED MARKET IN ESTABLISHMENT AND FUNCTIONING …
tive Systems: the Outcome of Comparative Study in Silesia Region. s.l., 2008, 12 p.
6. Kurik, S.; Lumiste, R.; Terk, E.; Heinlo, A. Innova-tiivne tegevus Eesti ettevõtetes 1998-2000. Tal-linn: Ettevõtluse Arendamise Sihtasutus, 2002, 99 lk. [http://www.eti.ee/user_uploas/innovatiivne_tegevus_eesti_ettevtetes.pdf].
7. Liu, W.; White, S. Comparing Innovation Systems: a Framework and Application to China´s transi-tional Context. – Research Policy, 2001, No. 30, pp. 1091-1114.
8. Lundvall, B-A. National Innovation Systems: His-tory and Theory. Aalborg: Aalborg University Press, 2003, p. 12
9. Marxt, C.; Hacklin, F. Design, Product Develop-ment, Innovation: All the Same in the End? A Short Discussion on Terminology. – Journal of Engeneering Design, 2005, Vol. 16, No. 4, pp. 413-421.
10. Oslo Manual: Guidelines for Collecting and Inter-preting Innovation Data. 3rd ed. Paris: OECD Pub-
lications, 2005, 163 p. [http://www.oecd.org/document/1/0 ,3343,en_2649_37417_33847553_1_1_1_37417,00.html].
11. Porter, M.E. The Competitive Advantage of Na-tions. New York: Free Press, 1990, 855 p.
12. Roelandt, T.; den Hertog, P. Cluster Analysis and Cluster-Based Policy Making: The State of the Art. – OECD, Boosting Innovation: The Cluster Ap-proach, Paris: OECD, 1999.
13. Roos, A.; Pisuke, E. Ühistupank kui Eesti finantsinnovaator. – Hea Eesti Idee (HEI), 2008, No. 5(14), pp. 9-11.
14. Roos, A.; Riiner, M.; Pisuke, E.. Ühistupangandus on Eesti majanduse arenguvõti – MaksuMaksja, 2008, No. 11(129), pp. 28-30.
15. Teadmistepõhine Eesti: Eesti teadus- ja aren-dustegevuse ning innovatsiooni strateegia 2007-2013. Tartu: Haridus- ja Teadusministeerium, 2007, 50 lk.
78

УПРАВЛЕНИЕ И УСТОЙЧИВО РАЗВИТИЕ 2/2009(23) MANAGEMENT AND SUSTAINABLE DEVELOPMENT 2/2009(23)
REASONS FOR AND PREVENTION OF TAXI PIRACY IN ESTONIAN PUBLIC
TRANSPORT
Meelis Tomson European College, University of Tartu, Estonia
Abstract
The main objective of article is to investigate the possibilities of preventing taxi piracy in Estonia. The thesis
aims at giving a systematized overview of taxi services, competition in taxi service, problems caused by taxi piracy and their solution possibilities.On of the main reasons of taxi piracy is tax evasion and receiving so-called net in-come. Also, former taxi drivers who have been punished for violating the taxi service rules and are not issued taxi licenses anymore drive illegal taxies. The gaps in the Public Transport Act only provides for punishing a person carrying passengers for a reward without a relevant license. As drivers of illegal taxies cannot be qualified as taxi drivers, the taxi service rules do not apply to them and their punishment is difficult. It is also worrisome that illegal taxi drivers cannot be punished under the recent procedure Therefore, a suggestion was made to the Minister of Economic Affairs and Communication for amending the Public Transport Act. According to the planned amend-ment, the driver of a vehicle can be punished for the use of taxi attributes or attributes imitating them on a vehicle with a fine of up to 300 fine units (i.e. 18,000 kroons), unless the driver has a required licence card. On the legal level, taxi traffic and its organisation is regulated by the Public Transport Act, General Rules for Regular Carriage of Passengers by Bus, Occasional Carriage by Bus, Taxi Service and Carriage of Baggage, as well as municipal taxi service rules. Passing the Public Transport Act by the parliament in 2000 brought along a new development in the Estonian taxi services. Taxi drivers became self-employed persons. This in turn created a need for an organisation uniting taxi drivers and enabling protection and warden of all their professional and economic interests. The main objective of national regulation is to increase economic and social welfare, and ensure competitiveness of compa-nies. Regulation is an important instrument in the hands of the government in order to achieve desired results in the state’s policy as well as economic policy. At the same time, regulations hindering innovations, investments and economic efficiency become a serious obstacle in implementing a successful national policy.
Key words: Public transport, Taxi regulation, Taxi piracy, Prevention of piracy
Introduction The main purpose of public transport is to
establish transport opportunities for satisfying the movement needs of people. Another purpose is to decrease the traffic load of roads and streets – the people using private means of transport use up dozens of times as much city space, create more traffic jams and accidents and harm the environment much more. The pro-portion of public transport in the organisation of life in the Estonian society is higher than as-sessed so far and the lowering of it will cause serious negative processes to come about in regional and social policy, land use, traffic secu-rity and environment protection. The purpose of the article is to explore the opportunities for pre-venting taxi piracy. The author has established the following research tasks in order to achieve the goal:
- Identify the peculiarities of the operation of taxis and the national regulation thereof in comparison with other types of public transport.
- Identify the general reasons for the ap-pearance of taxi piracy.
- Learn about the experience of other countries in regulating the operation of taxis.
The operation of taxis has been formed as a result of the special needs of individual people regarding the selection of route and location of destination. Thus, taxi service is a type of public transport aimed at individual persons who wish to drive to the destination selected by them-selves. However, transport service is always related to potential risks, which is why it can be treated as a field of business with special re-quirements. Thus, the local government in coop-eration with the ministry has established certain requirements for both vehicles and service pro-viders for the provision of taxi services. The goal is to ensure high-quality service for people. The main laws that taxi companies have to follow are the Competition Act and the taxi transport rules established by the local government.
Although generally, the state supports pub-lic transport, the providers of taxi services still
79

Meelis Tomson
receive no state support, although the taxi is also a type of public transport. As the taxi re-ceives no support from the state, private compa-nies may set prices and working times at their own discretion. Of course, adherence to nation-ally established special requirements generally brings higher costs and prices to companies. Such conditions provide an ideal opportunity for the appearance of the so-called black market in which pirate taxis operate.
1. Taxi service as a type of public transport
Public transport means the fee-charging car-riage of passengers organised on the basis of an activity licence in road, railway, water and air transport, which is provided by way of regular services, occasional services or taxi services. Public transport services are provided by public transport vehicles that provide regular services, occasional services or taxi services to all resi-dents.
Types of public transport mean various ve-hicles that correspond to the requirements estab-lished in the legislation on public transport. If most types of public transport drive on a certain route, the peculiarity of a taxi is that it drives to the destination selected by the customer.
The arrangement and supervision of public transport on the national level has not been or-ganised sufficiently, mainly due to the lack of resources and the divisibility of work tasks be-tween different structural units. The solving of simple running issues has mainly been dealt with, which, in turn, has not allowed to develop the public transport systematically and as a whole. The cooperation between carriers and ordering parties at the coordination of public transport is also insufficient. The operation of taxis is not only the issue of local life as taxis take their customers to the territories of different local government units and the customers are not only local residents.
In case of overloaded roads where traffic jams are the main problem, price regulation can be used for adjusting the need for taxis with regard to other means of transport [9]. Indirectly, this reaches to the establishment of road taxes, and to justify for these, external effects and side effects are referred to. But there are also several more traditional economic arguments that reason the need to adjust prices. The demand for taxi services is rigid as the customer who stops a vacant taxi looking for a customer cannot com-pare the offered price to that of another service
provider. The same is also valid for taxi stops as there is a scheme that the taxi that first entered the stop gets the customer. In addition, the price agreed upon for the taxi drive may be exceed-ingly high or allowing the service provider to take advantage of the customer according to their own interests [5].
Of course, such statements are not true when a taxi is ordered by phone or any other means of pre-booking. So, a separate order without the adjustment of price (and entry to market) could be applied for the vehicles that are not allowed to disturb customers waiting for taxis on the street or in queues with the proposal for a drive. The procedure for selecting a taxi at taxi stops could also be changed, giving the cus-tomer free hands to choose a vehicle. This would allow decreasing state intervention with pricing on the precondition that the customers have enough information about the valid tariffs before entry into a specific vehicle, which could be or-ganised by making prices public [5].
2. The need for state regulation of taxi service
The main purpose of state regulation is to increase economic and social welfare and ensure the competitiveness of companies. Regulation is a powerful means for the government in order to achieve the desired results in politics and also in economic policy.
One of the options of state regulation is the enforcement of activity licences and licences. The main risks in abolishing licensing could be loss of control and overview of the behaviour of the parties to the market, the uncontrolled entry of products and services harmful to the consum-ers to the market, and illegal provision of taxi services. On the basis of the categorisation and systematisation of the enforcement of activity licences and licences, the following conclusions can be made:
- there are activity licences for which sev-eral purposes have been applied for when enforcing. The diversity of pur-poses arises questions about the partial overlapping and transparency of regula-tion of the issuers of the activity li-cences;
- there are activity licences and licences the purposes of which have been worded by the issuer as the perform-ance of given activities, work or ser-vices;
80

REASONS FOR AND PREVENTION OF TAXI PIRACY IN ESTONIAN PUBLIC TRANSPORT
- the satisfaction of the demand of the consumers as a purpose of the activity licence is not a reasoned and sufficient purpose for enforcing an activity licence as the existing demand by consumers is the prerequisite for starting business [3].
The customers who use taxis and get into a taxi at a taxi stop or by booking it beforehand usually have little information about the security and quality of the specific vehicle and the skills of the driver. The passengers who are willing to drive in an illegal taxi put themselves in great danger as this vehicle is not governed by any legal systems. When sitting in the car, they never know whether the driver has a driver’s licence at all, whether the car is technically in order and in what condition the safety equipment is. There have been cases in which taxi services are offered by people with criminal background, who can be a great danger to the passenger.
There are some quantitative measures that appear to be working on the presumption that the provision of taxi services on the free market does not meet the demand, although economists have difficulties trying to find evidence in sup-port of this statement. Periods of top demand can be brought as examples. It is almost impos-sible to solve the problem by regulating supply because on an unregulated market, the vehicles which in periods of minimum demand perform other functions can enter the market to satisfy the demand, which will result in the decrease of costs and drop in prices [1].
Regardless of whether quantitative limits are applied or not, regulation systems always demand that both taxis and taxi drivers have licences. This is why before legally providing taxi services, many standards related to verifying the quality of the vehicle and the skills of the driver must be harmonised. The costs related to the upkeep of such a comprehensive control system are very high. Also, theoreticians dealing with regulations have on several occasions mentioned the risk that the standards applied in such a sys-tem are used for limiting the number of service providers, although these are supposedly only meant for quality control [6].
3. International experience in the regulation of taxi transport
The limiting of the number of taxis is the most direct way to regulate the taxi services launched on the market. This has characterised
most organisational systems and is still in force in many jurisdictions including London and New York. The unfavourable effects, which are gen-erally thought to accompany quantitative regula-tion and which mean the limitation of the avail-ability and diversity of the services provided to customers and the opportunity to make profit outside competition, need strong arguments to be justified from the viewpoint of public interest. The so-called excessive competition on its own is not that meaningful and if it is rather a poten-tial deterioration in service quality, it can be di-rected with the help of other means than quanti-tative regulation. The same apples to the results of such significant external factors as the over-load of roads, traffic jams and pollution of the environment [2].
The regulation of transport has been inter-national in its nature for a long time now. This is one of the reasons for the appearance of prob-lems in finding a suitable place for a common transport policy between the international rules created by operating organisations on the one hand and protectionist domestic rules on the other hand.
In some jurisdictions, all licensed taxis must be joined to a centre where an advance booking system is used by way of radio communication. The main argument presented by Teal and Ber-glund (1987) by relying on the empirical research concerning the decrease of the restrictions on taxi transport in the USA is the saving on volume and diversity. They proved that due to the cus-tomer-oriented nature of taxi transport, large and experienced companies have significant advan-tages with regard to cost-saving over small com-panies, especially private taxi drivers. Another regulative option would be to issue taxi transport permits only to the taxi companies whose activ-ity complies with certain standards and who use a minimum number of taxis.
The general framework of the regulation of taxi transport can often be found in the legisla-tion of a country and sometimes, but not al-ways, it includes the standards that determine the quality and regulate the “systems“. A de-mocratically elected body is engaged in the elaboration of these and the procedures per-formed are unreliable, and principles that are often vague have risen into view, leaving the local legislator the right to act at their own dis-cretion. For example, in North-America, where the standards are specified in the legal instru-ments of the local government, the procedures
81
Meelis Tomson
are more believable and the standards more de-tailed. The national legislative framework may include criteria on the provision of permits, but the local regulative body is always of crucial importance when examining the applications and making a decision.
Traditionally, it has been presumed that in order to protect public interests, the authorities should be completely independent of production. In London, which is rather an example of devia-tion from the general standard, the police regard this function completely self-evident.
France wishes to exempt the petrol and gas oil used as taxi fuel from taxation with an annual quota of up to 5,000 litres per vehicle. In addi-tion, the liquefied petroleum gas (LPG) and lique-fied natural gas (LNG) used as taxi fuel are wished to exempt from taxation with the annual quota of up to 9,000 litres per vehicle. Accord-ing to the application, the aim of the measure is to support transport similar to public transport.
France mainly stresses the fact that the op-eration of taxis contributes to the achievement of the goals of the environment policy and terri-torial development. In rural areas with no public transport, taxis replace public transport, espe-cially for people who have no cars. In addition to this, taxis are used in some communes with no public transport for school transport. In urban areas, taxis help decrease the total number of passenger cars in the traffic. In France, the posi-tion is that taxi services support the health care policy as in some regions, taxis replace ambu-lance cars (in some rural areas, such an activity may make up almost 80% of the turnover of a taxi) [4].
On the Island of Rhodes, the operation of taxis is subject to the municipal authority and all prices are fixed, which is why there are no taxi-meters. In the evening when there are a lot of people outside, there are municipal policemen there to help at the gates of the mediaeval old town, regulating the queues and directing taxis to those who wish.
4. The development and organisation of taxi service in Estonia
Private taxi transport in Estonia began in the year 1986 when a permit was given to allow the first passenger cars owned by private persons on the line as taxis with the sign “Ekspress“ on the roof. In a year, there were about 150-180 taxis with the "Ekspress" sign in Estonia. At that time, taxis had no taximeters; the price of the trip was
calculated according to the reading of the speed-ometer. In 1987, “Esra“, the first cooperative providing taxi services in the Soviet Union was established. The cooperative “Esra“ was the first to be allowed to install wireless stations to pri-vate cars in the private sector of the Soviet Un-ion, and the taxi operator service was created. The provision of taxi services was started with almost 300 Volgas and 40 RAF-buses. At the beginning of 1990, experimental privatisation was conducted, which was organised via the work collective [8].
The national “Taxi park“ which did not want to see any competitors proved to be a great re-sistance to the appearance of private taxi trans-port at that time. Regardless of this, new opera-tors of cooperative taxi services kept appearing. The demand for private taxi transport was high as inflation was gaining momentum and the number of cars of private persons was small [8].
On the legislative level, taxi traffic and the organisation thereof is organised by the Public Transport Act, the general rules for regular car-riage of passengers by bus, occasional carriage by bus, taxi service and carriage of baggage, also, the rules for carriage of passengers by taxi established by local governments. The adoption of the Public Transport Act at the Riigikogu brought a new development direction to the op-eration of taxis in Estonia. A taxi driver became a self-employed person. This, in turn, brought about a need for an organisation that joins taxi drivers, which would allow taxi drivers to protect themselves and stand for their vocational and economical interests.
In April 2001, the conclusion was reached that in the course of the further development of the operation of taxis, the time has come to es-tablish an organisation for taxi drivers. The non-profit association was named the Estonian Asso-ciation of Taxi Drivers, the members of which are taxi drivers who are self-employed and pro-vide taxi services under various operators. Self-employed drivers in taxi service, according to law, are carriers who can be compared to small companies. So the association is a social organi-sation joining carriers.
Many proposals of the Estonian Association of Taxi Drivers have been approved by the Riigikogu and taken into account in the law. Un-fortunately, certain parts of the proposals with regard to the regulation of taxi service was ne-glected, among these, the proposal to elaborate a separate taxi service act. The Finnish Ministry
82

REASONS FOR AND PREVENTION OF TAXI PIRACY IN ESTONIAN PUBLIC TRANSPORT
of Transport and Communications, for example, has regarded it rational to start elaborating the Taxi Act in order to regulate the taxi service in Finland. The reason for this is that taxi service needs regulations that differ from those of other forms of public transport such as buses, trams, etc [8].
During its operation, the Estonian Associa-tion of Taxi Drivers has made proposals for amending the Public Transport Act, participated in the Economic Affairs Committee of the Riigikogu in order to explain the nature of the job of a taxi driver, organised a round table in au-tumn 2004 with the help of the Association of Estonian Cities in order to elaborate a sample regulation of taxi transport rules for local gov-ernments. On 25 November 2003, the Act that amends the Public Transport Act that was adopted by the Riigikogu came into force; in the course of the proceeding of this Act, the Esto-nian Association of Taxi Drivers also made its proposals. Many proposals of the Association have been approved by the Riigikogu and also taken into account in laws.
In addition to the Estonian Association of Taxi Drivers, there are several other social or-ganisations dealing with the problems in taxi service, but the weakness of all these organisa-tions is that they are very closely related to the private interests of some entrepreneurs and do not proceed from the development of taxi service as a whole, not to mention the interest of the local government, but try to make the taxi driver bound to a certain place, exclusively subjected to one private entrepreneur.
The author of the article thinks that one of the opportunities for developing the taxi service is a joint operator of taxi companies, which is implemented in several European cities, including Helsinki, Madrid and Stockholm. This means that if a customer calls Tulika Taxi, for example, but they do not have any vacant taxis there at the moment, the operator will put the customer through to another taxi company. This method could be used in various Estonian towns during the peak hours of the need for taxi services.
Since the beginning of 2007, all truck, bus and taxi drivers must carry a certificate for pass-ing occupational training. If so far, the drivers were trained, examinations organised and certifi-cates issued by the training companies who had received a relevant certificate from the Ministry of Economic Affairs and Communications, then since 2008, the Estonian Motor Vehicle Registra-
tion Centre is issuing occupational certificates of competency.
5. Taxi piracy and the prevention thereof in Es-tonia
While many local governments demand taxis to be registered and have a licence, many taxis without a licence are providing taxi ser-vices. Some of these do look like taxis from the outside, but provide the taxi service as an ordi-nary vehicle, sometimes even for incidental passers-by.
Pirate taxis are vehicles that provide a fee-charging taxi transport service without possess-ing a vehicle card required by law. The taxi driv-ers who use accelerators on taximeters, i.e., increase the taxi bill illegally, are deemed dishon-est drivers. A pirate taxi does not issue cheques and has no taximeter, taxi sign or permissions issued by the Transport Board that allow the provision of taxi services.
The passenger pays for a taxi drive accord-ing to the reading of the taximeter; it is forbidden to ask a higher price from the customer than shown on the taximeter. A taxi driver must give a printed cheque to the user of the taxi service. If the taximeter and printer are out of order, the customer has the right to refuse payment – it is forbidden to provide taxi services with a defec-tive taximeter or printer.
If a taxi driver uses a multiplier in the taxi, it is also considered taxi piracy. A multiplier is an electronic attachment sending impulses to the taximeter, thus making it move faster, so that at the end of the drive, the meter will show the customer a longer distance and the customer will have to pay more. A multiplier can be located almost anywhere in the taxi – it has even been found in the tail-lights of a vehicle. A multiplier is mostly used when transporting foreigners or at night when people are under the influence of alcohol and cannot exactly understand every-thing. Taxi drivers do not really dare use the multiplier when providing taxi service to sober people [9].
The existence of multipliers in taxis is checked in cooperation with the police. Raids are organised on a daily basis. During the raids, all taxis in city traffic are checked. Also, more at-tention is paid on the companies the taxis of which have had the most violations.
83

Meelis Tomson
Summary The main reason for taxi piracy is tax eva-
sion and the receipt of “pure profit”. Pirate taxi services are also provided by former taxi drivers who have been punished for violating the taxi service rules and cannot receive a taxi service permit from Tallinn Transport Board anymore. Currently, the gaps in the Public Transport Act allow punishing a taxi driver who has provided taxi services without having a relevant permit. As a pirate taxi driver cannot be qualified as a taxi driver, the rules of taxi service do not apply to them, so this makes punishments more com-plicated.
The quality security of public transport re-flects the general quality of life in a city. Well operating public transport saves resources and lowers the effect of transport on both the local and global environment. The development of taxi service should not be a mandatory goal, but a means for providing efficient public transport for all groups of the society and achieving a more environment-friendly living environment.
There are many problems that must be ad-dressed seriously. To demand good service from entrepreneurs, the author thinks that the state must establish an environment operating on the grounds of fair competition. The drivers without permits must be removed from the taxi market. This can be done by elaborating laws and adding control. If the law-abiding entrepreneurs see that there is no control and legal, but also illegal taxi drivers can offer taxi services, it questions the validity of the existence of a legal base. Local governments must ensure equal opportunities for all to operate regardless of the company, make of car or nationality of the driver.
Taxi service can be regarded as a consider-able type of public transport. Just like in bus transport, there are many shortcomings in the organisation of taxi services, which need ad-justments. In the author’s opinion, a separate development plan for taxi service organisation
should be elaborated, in which the work already done as well as what must be changed should be determined. The development plan should be compiled on the ministry level, not just the local government level. Of course, the heads of local governments and specialists of the field of trans-port should be involved in the elaboration of the development plan. In addition to efficient control, the regulations regarding taxi service must also be revised as they directly organise the market and improve quality.
References:
1. Australian Trade Commission, Regulation of the Taxi Industry, Productivity Commission Working Paper No. 1605, 1999. [http://papers.ssrn.com/sol3/papers.cfm?abstract_id=324620] 06.05.2008.
2. Breyer, S. Regulation and its Reform. Workshop on studies for Northern Dimension, Government Institute for Economic Research, 2002, 247.
3. Eerma, D. Reguleerimisest majanduspoliitikas tegevuslubade ja litsentside näitel-Euroopa Liidu lii-tumisega mõju Eesti majanduspoliitikale. Tallinn, Berlin: Mattimar OÜ, Verlag Arno Spitz: 2002, pp 473-482
4. Commission of the European Communities, Brus-sels 30.11.2006 [http://eur-lex.europa.eu/LexUriServ/LexUriServ.do?uri=COM:2006:0741:FIN:ET:HTML]
5. Frankena, Mark W; Pautler Paul A. Analysis of Taxicab Regulation and Deregulation, [http://www.ftc.gov/be/econrpt/233832.pdf] 21.04.2008.
6. Ogus, A. Regulation: Legal Form and Economic Theory, Oxford, Clarendon Press, 355.
7. Suviste, M. Kuidas taksojuht sadamas kliente noolib; [http://www.sloleht.ee/index.aspx?id=274547] 13.03.2008
8. Estonian Association of Taxi Drivers; history; [http://www.taksoliit.ee/history.php]; 11.02.2008
9. Yang H.; Lau Y.W; Wong S.C; Lo H.K, A macro-scopic taxi model for passenger demand, taxi utilization and level of services, Transportation, Volume 27, Number 3, 2000
84

УПРАВЛЕНИЕ И УСТОЙЧИВО РАЗВИТИЕ 2/2009(23) MANAGEMENT AND SUSTAINABLE DEVELOPMENT 2/2009(23)
ARE THE EARLY–WARNING METHODS USEFUL FOR PREDICTION OF ECONOMIC
CRISIS OF POLISH STOCK-LISTED WOOD COMPANIES? (1)
Justyna Biernacka Warsaw University of Life Sciences (SGGW), Poland
Abstract
Are the early-warning methods useful for prediction of economic crisis of polish stock-listed wood compa-
nies? (1). It is risky decision whether to invest in a selected stock-listed company. Each stock market investor consider numerous conditions while making share purchase decisions. Besides the basic methods of economic condition analysis, such like economic indicator analysis and the technical analysis, there are a number of different methods based on the discrimination analysis; such methods evaluate bankruptcy option for the company in-volved, and they make it with a considerable probability. There are many of early-warning methods. Altman’s 83 and Holda’s polynomials applied in calculations are useful in stock-listed wood companies analysis. Both of poly-nomials are similar shape course. In both cases of analysing companies applied polynomials suggests, that in last quarters of analysis economic condition of this wood sector companies getting worse. It could help potential in-vestor take decision to invest or not to invest in this companies.
Key words: early warning methods, bankruptcy prediction, wood sector companies.
Introduction It is always a risky decision whether to in-
vest in a selected stock-listed company. Each stock market investor should consider numerous conditions while making share purchase deci-sions. The economic indicator analysis and the technical analysis are the tools used most fre-quently for the economic and financial status evaluation. Besides, there are a number of differ-ent methods based on the discrimination analy-sis; such methods evaluate bankruptcy options for the company involved, and they produce results with a considerable probability. Most of this models have a polynomial structure, using several indicators. Value of global indicator sug-gests one of several classification groups – bankruptcy hazard or no bankruptcy hazard.
1. Models and study
Among numerous early warning models based on polynomial formula, the following mod-els deserve special attention:
a). the Altman’s 83 model (developed in the U.S., in 1983): Z83=0.717x1+0.847x2+3.107x3+ +0.420x4+0.998x5,
where:
x1= (current assets – short-term liabili-ties)/total assets, x2= (mandatory capital + reserve capi-tal)/total assets x3= profit and loss account before taxes and interest payment (EBIT)/total assets x4= entity book value/total liabilities book value, x5= sales receipts – remaining operating in-come/total assets. b). the Hołda’s model (developed in Poland): ZH=0.681x1- 0.0196x2+0.00969x3+ +0.000672x4+0.157x5+0.605,
where: x1 = current assents short-term liabilities, x2 = total liabilities/total assets*100%, x3 = net profit and loss account/yearly av-erage assets *100%, x4 = average short-term liabilities /(sold products cost + sales costs + overhead costs)*360, x5 = sales receipts/yearly assets values. Classification to the appropriate group of
bankruptcy risk are shown on figure 1.
85

Justyna Biernacka
Fig. 1. Graphic illustration of classification to the bankruptcy risk group
In this paper two representative wood
stock-listed polish companies were tested – Forte SA and Paged SA. Quarter data from financial reports were used, from 1st quarter 2004 to 2nd quarter 2006. Received values for companies are presented in tables (1 and 2) and shown in figures (2 and 3).
2. Companies characteristic
Forte SA is one of the top furniture produc-ers in Poland. The company is listed on Warsaw Stock Exchange since 1996. Forte SA was formed from government-owned company – furniture factory created in 1976. Most of pro-duction is exported – Forte’s production goes to over 30 countries and over 60% of it’s produc-tion goes to West Europe, especially Germany. Since 2005 Forte’s production goes to British, Irish, French, Spanish and Portuguese market.
Company has got 5 manufactures in Poland (in Ostrow Mazowiecka, Suwalki, Bialystok, Ha-jnowka and Przemysl), one in Ukraine and one in Russia.
Paged SA at present is a main part of Paged Capital Group, which consist of: Paged Handel (Paged Trade), Paged Meble (Paged Furniture) and Paged Sklejka (Paged Plywood). Paged SA, just like Forte SA, was formed from government-owned company – Centrala Handlu Zagranic-znego “Paged” (Central Office of Foreign Trade “Paged”), which has exported wood products (wood, sawn wood, plywood, particleboard and others), furniture and paper products and im-ported cellulose and machines for industry. The company was quoted for the first time on the Warsaw Stock Exchange in 1996.
Table 1. Values of Altman’s 83 and Holda’s polynomials for Forte SA
Quarter 1 2004 2 2004 3 2004 4 2004 1 2005 2 2005 3 2005 4 2005 1 2006 2 2006Z83 1,297 1,634 1,666 1,877 1,789 1,647 1,568 1,495 1,471 1,386 ZH 1,130 1,817 1,694 1,644 1,659 1,532 1,361 1,369 1,372 1,265
Source: author’s own calculations
Table 2. Values of Altman’s 83 and Holda’s polynomials for Paged SA Quarter 1 2004 2 2004 3 2004 4 2004 1 2005 2 2005 3 2005 4 2005 1 2006 2 2006
Z83 1,422 1,416 1,588 1,530 1,399 1,529 1,611 1,741 1,640 1,620 ZH 1,116 1,171 1,342 1,216 1,164 1,232 1,238 1,252 1,228 1,191
Source: author’s own calculations
3. Results Diagram 1 analysis allow to determine that
shapes of Altman’s 83 and Holda’s polynomials curves are similar.
Values of Altman’s 83 and Holda’s polynomials suggests, that there is no bankruptcy risk for Forte SA, but in both polynomials (cases) retrograde tendency is observed. Clearly downward nature of the Z83 values can be seen in the beginning of 2005, decrease of ZH values are noted down since 2nd
quarter 2004 to last analysed quarter. Lowest polynomials values are noted only in the beginning and the end of analysed period, especially in 1st quarter 2004 (adequately – Altman’s value: 1,297 and Holda’s value: 1,130) and in 2nd quarter 2006 (adequately: 1,386 and 1,265). Tendencies in both polynomials that economic situation of this enterprises is getting worse, but they do not suggest bankruptcy risk.
LLOOWW BBAANNKKRRUUPPTTCCYY
RRIISSKK
HHIIGGHH BBAANNKKRRUUPPTTCCYY
RRIISSKK
ZZ8833
ZZHH
1,2 2,9
UUNNCCEERRTTAAIINNTTYY
-0,3 0,1
86
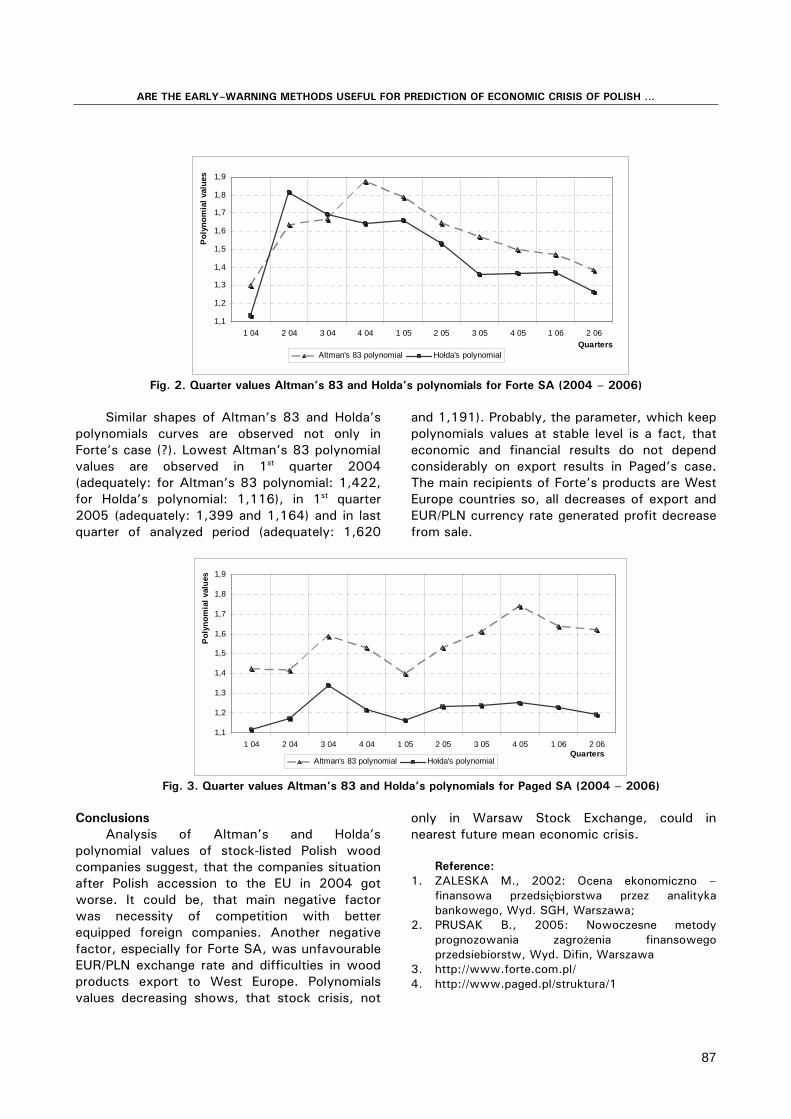
ARE THE EARLY–WARNING METHODS USEFUL FOR PREDICTION OF ECONOMIC CRISIS OF POLISH …
1,1
1,2
1,3
1,4
1,5
1,6
1,7
1,8
1,9
1 04 2 04 3 04 4 04 1 05 2 05 3 05 4 05 1 06 2 06Quarters
Pol
ynom
ial v
alue
s
Altman's 83 polynomial Hołda's polynomial
Fig. 2. Quarter values Altman’s 83 and Holda’s polynomials for Forte SA (2004 – 2006)
Similar shapes of Altman’s 83 and Holda’s
polynomials curves are observed not only in Forte’s case (?). Lowest Altman’s 83 polynomial values are observed in 1st quarter 2004 (adequately: for Altman’s 83 polynomial: 1,422, for Holda’s polynomial: 1,116), in 1st quarter 2005 (adequately: 1,399 and 1,164) and in last quarter of analyzed period (adequately: 1,620
and 1,191). Probably, the parameter, which keep polynomials values at stable level is a fact, that economic and financial results do not depend considerably on export results in Paged’s case. The main recipients of Forte’s products are West Europe countries so, all decreases of export and EUR/PLN currency rate generated profit decrease from sale.
1,1
1,2
1,3
1,4
1,5
1,6
1,7
1,8
1,9
1 04 2 04 3 04 4 04 1 05 2 05 3 05 4 05 1 06 2 06Quarters
Pol
ynom
ial v
alue
s
Altman's 83 polynomial Hołda's polynomial
Fig. 3. Quarter values Altman’s 83 and Holda’s polynomials for Paged SA (2004 – 2006)
Conclusions
Analysis of Altman’s and Holda’s polynomial values of stock-listed Polish wood companies suggest, that the companies situation after Polish accession to the EU in 2004 got worse. It could be, that main negative factor was necessity of competition with better equipped foreign companies. Another negative factor, especially for Forte SA, was unfavourable EUR/PLN exchange rate and difficulties in wood products export to West Europe. Polynomials values decreasing shows, that stock crisis, not
only in Warsaw Stock Exchange, could in nearest future mean economic crisis.
Reference:
1. ZALESKA M., 2002: Ocena ekonomiczno – finansowa przedsiębiorstwa przez analityka bankowego, Wyd. SGH, Warszawa;
2. PRUSAK B., 2005: Nowoczesne metody prognozowania zagrożenia finansowego przedsiebiorstw, Wyd. Difin, Warszawa
3. http://www.forte.com.pl/ 4. http://www.paged.pl/struktura/1
87

УПРАВЛЕНИЕ И УСТОЙЧИВО РАЗВИТИЕ 2/2009(23) MANAGEMENT AND SUSTAINABLE DEVELOPMENT 2/2009(23)
ARE THE EARLY–WARNING METHODS USEFUL FOR PREDICTION OF ECONOMIC
CRISIS OF POLISH STOCK-LISTED WOOD COMPANIES? (2)
Justyna Biernacka Warsaw University of Life Sciences (SGGW), Poland
Abstract
Are the early-warning methods useful for prediction of economic crisis of polish stock-listed wood
companies? (2). It is risky decision whether to invest in a selected stock-listed company. Each stock market investor consider numerous conditions while making share purchase decisions. Besides the basic methods of economic condition analysis, such like economic indicator analysis and the technical analysis, there are a number of different methods based on the discrimination analysis; such methods evaluate bankruptcy option for the company involved, and they make it with a considerable probability. There are many of early-warning methods. Altman’s 83 and Hołda’s polynomials applied in calculations are useful in stock-listed wood companies analysis. Both of polynomials are similar shape course. In both cases of analysing companies applied polynomials suggests, that in last quarters of analysis economic condition of this wood sector companies getting worse. It could help potential investor take decision to invest or not to invest in this companies.
Key words: early warning methods, bankruptcy prediction, wood sector companies
Introduction It is always a risky decision whether to
invest in a selected stock-listed company. Each stock market investor should consider numerous conditions while making share purchase decisions. The economic indicator analysis and the technical analysis are the tools used most frequently for the economic and financial status evaluation. Besides, there are a number of different methods based on the discrimination analysis; such methods evaluate bankruptcy options for the company involved, and they produce results with a considerable probability. Most of this models have a polynomial structure, using several indicators. Value of global indicator suggests one of several classification groups – bankruptcy hazard or no bankruptcy hazard.
1. Models and study
Among numerous early warning models based on polynomial formula, the following models deserve special attention:
a) the Altman’s 83 model (developed in the
U.S., in 1983): Z83=0.717x1+0.847x2+3.107x3+ +0.420x4+0.998x5, where:
x1= (current assets – short-term liabilities)/total assets, x2= (mandatory capital + reserve capital)/total assets x3= profit and loss account before taxes and interest payment (EBIT)/total assets x4= entity book value/total liabilities book value, x5= sales receipts – remaining operating income/total assets. b) the Hołda’s model (developed in Poland): ZH=0.681x1-0.0196x2+0.00969x3+ +0.000672x4+0.157x5+0.605, where: x1 = current assents short-term liabilities, x2 = total liabilities/total assets*100%, x3 = net profit and loss account/yearly average assets *100%, x4 = average short-term liabilities /(sold products cost + sales costs + overhead costs)*360, x5 = sales receipts/yearly assets values. Classification to the appropriate group of
bankruptcy risk are shown on figure 1.
88

Justyna Biernacka
Fig. 1. Graphic illustration of classification to the bankruptcy risk group
In this paper two representative wood
stock-listed polish companies were tested – Grajewo SA and Oborniki SA. Quarter data from financial reports were used, from 1st quarter 2004 to 2nd quarter 2006 (except Oborniki SA). Received values for companies are presented in tables (1 and 2) and shown in figures (2 and 3).
2. Companies characteristic
The Grajewo SA company history dates back to 1974 when the state-owned Zakłady Płyt Wiórowych in Grajewo (Grajewo Chipboard Plant) was established. In 1997 the company was privatized. Since 1997 the established joint stock company was listed with the Warsaw Stock Exchange as Zakłady Płyt Wiórowych S.A. w Grajewie. In 1999 the majority share package was acquired by European leader of the wood-derivative products sector, Pfleiderer AG from Germany. The main customer is the furniture industry, where almost 100% of sales is sold.
Thanks to the established position in the country, Grajewo SA is exporting a significant part of its production (raw chipboards, melamine-faced chipboards, foiled chipboards, HDF boards, kitchen worktops, furniture foils, melamine films, edge bandings and others) to eastern markets. The production capacity of the company amount to approx. 650,000 m³ annually.
Oborniki SA was a producer and seller of furniture and wood products. Addicionaly the company was focused on interior design. Main market for company’s furniture was Germany (about 85% of exported production), Scandinavia, Holland, Slovakia and Russia. In 1999 Obroniki SA employed over 1500 people – to 2004 employment was reduced to 300 persons because of economic problems. On November 2005 business failure was declared, and in 21 December 2005 shares of company were excluded from Warsaw Stock Exchange.
Table 1. Values of Altman’s 83 and Hołda’s polynomials for Grajewo SA
Quarter 1 2004 2 2004 3 2004 4 2004 1 2005 2 2005 3 2005 4 2005 1 2006 2 2006Z83 3,780 0,956 2,699 4,875 5,447 2,477 2,089 1,779 1,532 1,183 ZH 2,698 1,116 2,261 3,576 4,304 3,068 3,290 2,903 2,899 3,059
Source: author’s own calculations
Table 2. Values of Altman’s 83 and Hołda’s polynomials for Oborniki SA
Quarter 1 2004
2 2004
3 2004
4 2004
1 2005
2 2005
3 2005
4 2005
1 2006
2 2006
Z83 -0,710 -0,539 -0,786 -0,860 -0,093 -0,833 -0,982 bankruptcy bankruptcy bankruptcyZH 1,893 0,460 0,894 1,262 2,986 2,183 1,375 bankruptcy bankruptcy bankruptcy
Source: author’s own calculations
3. Results Shapes of Altman’s 83 and Hołda’s
polynomials for Grajewo SA curves are similar. Lowest polynomial values is observed in 2nd quarter 2004 (adequately: for Altman’s 83 polynomial: 0,956 and for Hołda’s polynomial: 1,116). In the end of the last year of analysis of
Altman’s 83 values retrograde tendency is observed. It could mean deterioration of economic situation of enterprise. Different situation can be observed for Hołda’s polynomial values. In the end of analysis period values of Hołda’s polynomial are near constant. Differences in polynomials curves are caused by
ZZ83 8
LLOOWW BBAANNKKRRUUPPTTCCYY
RRIISSKK
HHIIGGHH BBAANNKKRRUUPPTTCCYY
RRIISSKK
3
ZZHH
1,2 2,9
UUNNCCEERRTTAAIINNTTYY
-0,3 0,1
89

ARE THE EARLY–WARNING METHODS USEFUL FOR PREDICTION OF ECONOMIC CRISIS …
various variables' weights. For example largest negative meaning for Altman’s 83 polynomial is total liabilities and sales receipts – for Hołda’s
polynomial this meaning is insignificant. Through that, the Hołda’s values for Grajewo SA seem positive.
0
1
2
3
4
5
6
1 04 2 04 3 04 4 04 1 05 2 05 3 05 4 05 1 06 2 06Quarters
Poly
nom
ial v
alue
s
Altman's 83 polynomial Hołda's polynomial
Fig. 2. Quarter values Altman’s 83 and Hołda’s polynomials for Grajewo SA (2004 – 2006)
Analysis of Hołda’s polynomial values for
Oborniki SA allow to classify the enterprise to the group without bankruptcy hazard. Highest values of Hołda’s polynomial are observed in 1st quarter 2004 (1,893) and in 1st quarter 2005 (2,986). Nearest value of enterprise classification to the bankruptcy risk is 0,460, noted in 2nd quarter 2004. Only in two last quarters of analysed period values of Hołda’s polynomial are downward, however not alarming. Different
situation for Altman’s 83 polynomial values is observed. The data allow to classify the company to the bankruptcy hazard group. The nature of the data has its confirmation in reality – the business failure was declared in the end of 2005. Lowest values of Altman’s 83 model are noted in: 4th quarter 2004 (-0,860), in 2nd quarter 2005 (-0,833) and finally in 3rd quarter 2005 (-0,982)
.
-1,5
-1,0
-0,5
0,0
0,5
1,0
1,5
2,0
2,5
3,0
3,5
1 04 2 04 3 04 4 04 1 05 2 05 3 05
Quarters
Pol
ynom
ial v
alue
s
Altman's 83 polynomial Hołda's polynomial
Fig. 3. Quarter values Altman’s 83 and Hołda’s polynomials for Oborniki SA (2004 – 2006)
Conclusions
Analysis of Altman’s 83 and Hołda’s polynomials values for Grajewo SA and Oborniki SA shows, that better predictor of future difficulties in companies solvency is Altman’s 83 model. Long-term analysis shows, that deterioration in economic situation of Oborniki SA could be seen for over 20 quarters before
real business failure declaration. This long prediction time could allow the involved stock market players to gradually withdraw from investment in this particular company.
Analysis of Stowarzyszenie Inwestorów Indywidualnych (Association of Individual Investors) shows, that 40% of investors in its decisions are directed in technical analysis, 20%
90

Justyna Biernacka
are directed in intuition, 7% using psychology market data, only one of four investors is using fundamental analysis and the rest trusts in analysts opinions or in press articles. Data shows, that significantly low is a proportion of people using fundamental analysis, which, despite time-consuming, is very effective.
Reference:
1. DOMINIAK J., 2007: Czym inwestorzy kierują się
przy podejmowaniu decyzji o transakcjach?, Gazeta Prawna, 15.12.2007;
2. PRUSAK B., 2005: Nowoczesne metody prognozowania zagrożenia finansowego przedsiebiorstw, Wyd. Difin, Warszawa;
3. ZALESKA M., 2002: Ocena ekonomiczno – finansowa przedsiębiorstwa przez analityka bankowego, Wyd. SGH, Warszawa;
4. http://www.pfleiderer.pl/page,113.html
91

УПРАВЛЕНИЕ И УСТОЙЧИВО РАЗВИТИЕ 2/2009(23) MANAGEMENT AND SUSTAINABLE DEVELOPMENT 2/2009(23)
ENTREPRENEURSHIP, INNOVATION AND BALANCED DEVELOPMENT
Teresa Piecuch
Rzeszow Technical University, Poland
Abstract Entrepreneurship is perceived nowadays as a key production factor, the condition necessary to develop not
only enterprises but also regions and entire economies. The driving force of entrepreneurship are innovations. Implementing innovative solutions, enterprises strengthen their competitive position what contributes to creating a unique, exceptional image of a company. The notion of entrepreneurship and innovativeness is directly connected with the category of balanced development. This notion is the basis for several studies and many strategies. It is grounded on many solutions which allow to reach a satisfactory pace of growth which is not, at the same time, threat to the outside in terms of environment or society. The new, innovative solutions being very often imple-mented are the basis for reaching balanced development – they contribute to gaining far greater results and at the same time decreasing a possible negative influence on the environment. In the literature there are doubts whether entrepreneurship, innovativeness and competitiveness stand in contradiction to the assumptions of balanced de-velopment. These issues are the basis for this study.
Key words: entrepreneurship, entrepreneurs, innovations, sustainable development
Introduction Entrepreneurship is an unique, incorporeal
force and most desired occurrence of contempo-rary management processes. In fact it makes for a success in any field. Similarly inventions make for tools used by enterprising people; the basis for a process of change; grounds for companies development as well as for the whole economy. Furthermore it stimulates economic development, contributes to competitiveness of companies, regions, economies.
Many authors doubt if really entrepreneur-ship, innovation do not contradict balanced de-velopment. These problems have been the sub-ject of the following study.
1. Nature and meaning of entrepreneurship and innovation
Entrepreneurship is perceived at present as key production factor, prerequisite for develop-ment of companies, as well as regions and whole economies. Entrepreneurship development makes for basic prerequisite for overcoming adverse economical trends. It is a factor that makes for transformation of economy and the world in a way beyond our grasp. In fact it provides basis for success practically in all fields. It is entre-preneurship and innovation that features market economy and it stimulates boom and provides
for high standard of living not only for entrepre-neurs but the whole societies as well.
Entrepreneurship is driven by innova-tion1.Companies introduce inventive solutions to consolidate the position on the market. It also makes the image of the firm unique. Innovations means changes and modifications, introduction of new solutions, development of used products and breaking through stereotypes. As a result the above mentioned shall be essential factor of entrepreneurship theory and management as well.
Inventions are inseparable linked with (and shall be linked with) entrepreneurship that in fact is carried out with inventions. Although entre-preneurship may follow without inventions, still they are very beneficial for entrepreneur as they make for company development, expansion into new markets and consequently enable efficient competition with rivals, maintenance of strong position in given field. If possessed by enterpris-ing persons inventions are real asset, resource and tool for changes. Only entrepreneurs are capable of making effective use of them and generate new configurations to create new utili-ties.
Inventions make for real tool of entrepre-neurs and entrepreneurship “…means to turn a change into possibility for launching a new ac-
1 It shall be noted that term “Innovation” includes a lot. Besides this term is difficult to define and not precisely defined until now. Still it stirs up many controversies mainly to the fact as it is very difficult to determine precisely level of invention and a point of reference and who shall make an assessment. Invention may refer to: new technique, technology, or cultural values. Mostly this term refers to objects and activities. In case of the first one it refers to a new thing (a material object, process, idea) and in case of the second it refers to activities relating to introducing of something new [1, 2]
92

Teresa Piecuch
tivity and offer new services (…), operation that provides resources with new capabilities to gen-erate wealth...” [3]. Inventions are in particular essential in case of those companies that want to compete and maintain advantage over other entities on the market. Besides the more com-plex becomes the situation the more enterprising companies shall be, and more inventions and unique solutions they shall introduce.
So inventions shall constitute a basic part “...of strategy for companies under good man-agement with reference to both offensive opera-tions like capture of new markets as well as de-fensive operation providing for protection against real and potential competitors...” [4]. Innovative companies shall demonstrate “innovative dyna-mism” [4], perceived as receptiveness to any new ideas, searching for new technologies, unique solutions, products, production methods and prompt introduction of the above mentioned. This includes also development of currently used solutions, introducing in new fields, breaking through barriers, stereotypes, taking a chance and not avoiding challenges, etc.
Innovative entrepreneurs are capable of cre-ating new things and using old things in a new way. They may shape client needs and meet them making profits at the same “…and they turn threats into possibility to develop new ac-tivities and achieve success on the market pur-suant to business ethics” [4]. Furthermore it is entrepreneurship and entrepreneurs that decide on competitiveness of not only owned compa-nies but whole regions, the world economy as well and consequently wealth of a country. En-trepreneurs or production organizers and innova-tors who are willing and ready to take a risk in fact fulfill important functions in the economy: they launch new products on the market and find new markets, discover new resources and de-velop new technologies, provide for new, crea-tive reorganization of companies”[5].
2. Balanced development characteristics
Balanced development makes for economic growth including requirements regarding envi-ronmental protection2. Optimal use of available
resources including humans and capital shall follow to provide for continuous development and innovations. As a result prosperity shall be achieved [7]. In fact it is development with main-tained balance regarding nature, economy and a social order. This may be obtained along with current and future needs. In fact it provides pos-sibility to bring together a desire to achieve good economic results and concern about society and nature. “It emphasizes human needs and meeting needs by one and next generations” [8]. The idea of sustainable development is based on the following three pillars [6]:
1. economic effectiveness – therefore, gain that allows for social and environmental costs,
2. care for the environment – it means pro-tection of natural, non-renewable re-sources, minimization of negative influ-ence on the environment,
3. social balance – it means new work places and active actions aiming to in-crease the quality of life.
The problem of sustainable development not only refers to self-governmental, state or interna-tional institutions. Even more entrepreneurs, running a business activity, voluntarily carry out their assumptions. Whereby, it is worth mention-ing that this idea does not concentrate only on ecological problem. Respect for the environment is only one of its consequences, which cannot be separated from other important contemporary issues [8]. In case of company management, sustainable approach to development manifests in discontinuity of natural environment’s damag-ing, with rational usage of non-renewable re-sources, with their rational consumption, as well as the ability to perceive complex relations, as-sociations and conditioning, in which the com-pany operates; in understanding of the system of interaction between its internal and external ele-ments, as well as the ability to harmonize and search for the right proportions between differ-ent dimensions of the activity: economic, social, ecological, technical, spatial, etc [6].
2 Problem of international character of environmental issues was raised at the end of 1960 and 1970. In particular during United Nation Organization Conference regarding Environment of Human in Stockholm in 1972. During United Nation Organization Con-ference known as Earth Peak in June 1992 in Rio de Janeiro representatives of 173 countries signed documents establishing rules for balanced development. Among them was Behaviour Rules Catalogue called also Agenda 21 with reference to introduc-tion and execution behavior rules contributing to introduction of balanced development concept [6]
93

ENTREPRENEURSHIP, INNOVATION AND BALANCED DEVELOPMENT
3. Position of sustainable development in the process of entrepreneurship
Entrepreneurship may be understood as the ability to make use of the possessed resources and natural resources of the environment. There-fore, isn’t development of entrepreneurship con-tradictory to the assumptions (requirements, rigour) of sustainable development, which formu-lates various limitations connected with the need to protect the most precious elements of the environment? Is it possible to benefit from de-velopment of entrepreneurship (similarly, innova-tiveness), keeping the assumptions of sustain-able development? Many authors form specific doubts in this field and emphasize that durable and sustainable development in case of entre-preneurship is difficult to achieve, mainly be-cause it is such an activity, where “…domination of economic rights over other…” [7]. Profit is very important to entrepreneurs and it is often achieved at the cost of overuse of natural re-sources, damaging of natural environment or abuse of manpower.
However, it is possible to implement new, innovative solutions by entrepreneurs, in such manner that they would give the basis to achieve sustainable development, that they contribute in achievement of even better results with simulta-neous decrease of negative influence on the en-vironment. Therefore, entrepreneurs ought to consider the aspects of sustainable development in their business activities. It may cause particu-lar benefits, not only to the enterprise, being the property of the entrepreneur. Respecting of rig-ours for the benefit of environmental protection and local societies “…may contribute in im-provement of relations with local administration and social partners, and in growth of attractive-ness and reliability of enterprises in the interna-tional market (…). In a longer perspective, it may also result in growth of the competitiveness level of regions and creating the investment-, innova-tion- and enterprise-friendly environment” [9].
Already, whilst establishing a company, when the problem of location appears, the entre-preneur must (ought to) consider the require-ments of the natural environment. However, even the existence of natural, precious areas, does not exclude running of business activity – but it must be adjusted to the requirements of the environment. It allows keeping the assump-tions of sustainable development and avoiding the potential problems in the future. It also com-
plies with the assumptions of endogenous devel-opment.
According to H. Kruk, also implementation of innovations by entrepreneurs may be recon-ciled with the concept of sustainable develop-ment, if [7]:
1. innovative products and services shall be adjusted to the requirements of envi-ronmental protection and (or) shall con-tribute in decrease of emission of pollu-tion or neutralization of its negative ef-fects,
2. the innovative technologies applied in the process of production and gathering of raw materials, shall be environmental-friendly.
Contemporary, responsible entrepreneurs should not build the strategies of their compa-nies only on economic aspects. Their functioning in a particular environment – in order to be effec-tive, in order to gain social approval – should reconcile economic effectiveness with execution of the principles of social justice, with observa-tion of the aspects of durable and sustainable development. Their activity not only should con-tribute in growth of the level, but more to the quality of life of local societies. Limiting the negative influence of an enterprise to the envi-ronment should constitute one of the strategic developmental goals of the company. Entrepre-neurs also should undertake voluntary commit-ments for the benefit of the environment and gather different certificates confirming this.
It is worth emphasizing that not all entre-preneurs are interested in voluntary commit-ments resulting from sustainable development. It may result mainly from low level of their knowl-edge in this field, and as a result, lack of faith in advantages connected with it. According to A. Zielinska, entrepreneurs ought to be trained in this scope. Her opinion is that there should be created much a richer financial offer for entities, which agree for implementation of one of the systems or participation in one of the programs in scope of environmental protection. An impor-tant mobilizing incentive could also be more ac-tive promotional and marketing campaigns. There also should be created a certain “plane for ex-change of experiences” between different busi-ness entities. These and other incentives could be an encouragement, mobilizing entrepreneurs to implementation of the assumptions of sus-tainable development [10].
94

Teresa Piecuch
Conclusion
Undoubtedly, entrepreneurs should imple-ment innovations and search for their sources. They ought to manage their own enterprises in a manner, which allows for taking advantage of the opportunities to implement innovations. However, this should be made not only for own sake, but also for the sake of other people, in-cluding the condition of natural environment. If entrepreneurs shall not obey the basic principles of sustainable development, then “…the effect of such actions might be the costs, which shall be borne by the future generations…” [7]. There-fore, it is necessary to allow for the “new phi-losophy” and “new approach” in innovative ac-tivity of entrepreneurs, where social and eco-nomic development is harmonized with the re-spect to the natural environment.
Running of business activities by entrepre-neurs, which allows for durable and sustainable development is not easy, it is a great challenge, which eventually may (and should) be met.
References:
1. Entrepreneurship and Firm Development edited by J. Targalski, published by AE in Cracow, Cracow 1999, page 115
2. T. Krasnicka Around Entrepreneurship Concept “Organization Overview” 2002, No. 6 , page 15.
3. Drucker P. F. – Inspiration and luck, i.e. innova-tion and entrepreneurship, published by „Studio Emka”, Warszawa 2004 page 21, 34
4. Penc J., Management in practice. Manager’s thinking and activity, published by „Infor”, War-szawa 1998 J., p. 5, 154.
5. Blawat F.- Entrepreneur in theory of entrepreneur-ship in small companies’ practice, published by Gdanskie Towarzystwo Naukowe, Gdansk 2003 page 14.
6. T. Pakulska. M. Poniatowska-Jaksch, Balanced Development- “open and limited “interpretation, scope of knowledge
http://www.sgh.waw.pl/katedry/kge/BADANIA_NAUKOWE/rozwoj%20zrownowazony- webpage 20 www_1.pdf, as of 16. 12. 2008; http://www.kogeneracja.com.pl/coctent.php?id=37, as of 16.12.2008.
7. H. Kruk, Innowacyjnosc jako czynnik konkurency-jnosci regionu a rozwoj trwały i zrownowazony, [w:] „Przedsiębiorczosc, innowacyjnosc, foresight. Aspekty ekonomiczne, społeczne i ekologiczne”, t. 1, pod red. L. Wozniaka, Oficyna Wydawnicza Politechniki Rzeszowskiej, Rzeszow 2006, p. 325-328
8. Reichel J., Time of the Earth: nature – the human – economy. Essays, articles, polemics, published by „Zielone Brygady”, Cracow 2006, page 34, 36
9. Social responsibility of business – source: http://www.mg.gov.pl/Gospodarka/Zrownowazonyrozwoj/Spoleczna+Odpowiedzialnosc+Biznesu, of 16. 12. 2008 r.
10. A. Zielinska, Participation of enterprises in imple-mentation of the assumptions of sustainable de-velopment, [w:] Sustainable development on state, regional and local level – Polish experiences and possibilities and their application in Ukraine; edited by S. Kozlowski, A. Haladyj, published by KUL, Lublin 2006, page 270.
11. http://www.mg.gov.pl/Gospodarka/Zrownowazonyrozwoj/Spoleczna+Odpowiedzialnosc+Biznesu
12. Krasnicka T. – Around the concept of entrepre-neurship “Overview of Organization” 2002, No. 6
13. Entrepreneurship and company development, edited by J. Targalski, published by Cracow Uni-versity of Economics, Cracow 1999
14. Entrepreneurship, innovativeness, foresight. Eco-nomic, social and ecological aspects., vol. 1, ed-ited by L. Wozniak, Publishing Department of the Rzeszow University of Technology, Rzeszow 2006
15. Sustainable development on state, regional and local level – Polish experiences and possibilities and their application in Ukraine; edited by S. Kozlowski, A. Haladyj, published by KUL, Lublin 2006
95

УПРАВЛЕНИЕ И УСТОЙЧИВО РАЗВИТИЕ 2/2009(23) MANAGEMENT AND SUSTAINABLE DEVELOPMENT 2/2009(23)
EDUCATION AND SCIENCE RESEARCH IN THE FIELD OF FORESTRY IN POLAND
Marcin Nawrot, Marek Szymanski Department of Forest Utilization, Poznan University of Life Science, Poland
Abstract
The quality of education in human resource in forestry is important element of sustainable forest husbandry
in all over the world. Education at the level of University has a great matter in civilization development of each person, in communities, their social, moral, and ethic environment. It is worth to stressful necessity of construction and realization of educational program for the community, who is accented their needs from forest and forestry. It is also important to recognize some natural limitation. Polish forestry is in front of dinamical transformations caused by economic and social changes. Forestry in Poland needs also continuous advancement of methods of management in forest husbandry. It create possibility to develop activity in the field of science, university activity, and experimental.
Key words: scientific centers, actual stand of science, scientific discipline
Introduction Specificity and dissimilarity of forestry as a
direction of studies has never raised any doubt. A clearly characterised profile, figure of a future forestry graduate as well as the subject and scope of the study cause that the direction “forestry” is intended for a fairly narrow group of candidates of precisely defined interests. Unlike other directions of studies, forestry faculties have their own centres of practical training in the form of forest experimental stations [1]. The fate and future of Polish forestry depends much on the level of education of foresters as well as scientific investigations in this field and it is not possible to agree here with the opinion that future directions of the development of forest disciplines will be determined entirely by economic considerations. Universal accessibility of university education in Poland caused that in the case of many directions, including forestry, the number of graduate students is higher than the supply of free work posts in a given sector. According to Grzywacz [3], Poland can boast almost 190-year long tradition and achievements in university education and research in the field of forestry well known and appreciated in the world forestry achievements.
1. University forestry education in Poland
Non-public high-education institutions: - Higher School of Environmental
Management in Tuchola. The Higher School of Environmental Management in Tuchola is self-government, non-public higher school. In the academic year 2005/2006, it opened a direction of
studies called ‘Forestry’ as an 8-semester day and extramural engineer studies. State universities – faculties with full academic rights, including the right to grant scientific titles of ‘doctor’ and ‘habilitated doctor’ of forest sciences:
- Warsaw – Faculty of Forestry, the Main School of Rural Economy which has been operating continuously since 1918 until now. Graduates obtain the title of ‘master engineer of forestry’.
- Poznań - Faculty of Forestry, University of Life Sciences in Poznań (formerly, until mid-2008 – August Cieszkowski Agricultural University). Graduates obtain the title of ‘master engineer of forestry’.
- Krakow - Faculty of Forestry, Agricultural University in Krakow (formerly, until 2008, H. Kołłątaj Agricultural University). Graduates obtain the title of ‘master engineer of forestry’.
2. Forestry scientific journals in Poland
First publications presenting results of scientific investigations were published in Poland in the second half of the 18th century and the work of the National Education Commission made it possible to publish scientific works of priest Krzysztof Kluk. His book entitled: “On wild herbs, forests and their utilisation” was the first handbook of forestry in Poland and only the second in the world which was published several
96

Marcin Nawrot, Marek Szymanski
years earlier in France by H. Duhamel du Monceau [1].
3. Forestry journals:
- SYLWAN: it is the oldest forest scientific journal in the world published continuously from 1820. This journal is published by the Polish Forest Society, a specialist organisation established with the aim to initiate and support the development of sciences in the area of forestry and wood science, to disseminate scientific achievements among the public at large, to cooperate in the implementation of scientific achievements into practice and to work together with similar organisations abroad. The SYLWAN journal is indexed by the Science Citation Index Expanded (Sci Search®), Journal Citation Reports/Science Edition, CAB International as well as by the Polish Scientific Journal Contents. In addition, in 2008 SYLWAN was entered onto the so called ‘Philadelphia List’ which will result in increased point score for the authors of articles who will decide to publish their articles in the SYLWAN Journal. It is published as a monthly journal in Polish with summaries and Table and Figure headings in English.
- FOREST RESEARCH PAPERS: a scientific quarterly of the Forestry Research Institute, a continuation of Forestry Research Institute Papers, series A published since 1933,
- FOLIA FORESTALIA POLONICA, SERIA A – Forestry – Scientific Annals of SGGW-PAN. The Annals are published jointly by SGGW and the Committee of Forest Sciences of the Polish Academy of Sciences (PAN). Original research papers are published in English.
- ACTA SCIENTIARUM POLONORUM, SILVARUM COLENDARUM RATIO ET INDUSTRIA LIGNARIA series (Forestry and Wood Science). A scientific journal established in 2001 by Polish
agricultural universities. Silvarum Colendarum Ratio et Industria Lignaria (Forestry and Wood Science) is published as one of in 15 series.
- EJPAU (Electronic Journal of Polish Agricultural Universities), series ‘Forestry’. It was established in 1998 by agricultural universities and is published in English in electronic form.
Recapitulation
Considerable fragmentation of research teams and their scattering in several dozen scientific and research centres in Poland makes it difficult to develop large, integrated research programs. Therefore, special responsibility for the creation of new directions of research in the area of forest sciences in Poland rests on the largest, integrated research teams working in the Forest Research Institute and three Forestry Faculties in: Krakow, Poznań and Warsaw [1]. It is to be hoped that sprouting seeds of the developing crisis in university education at forestry faculties observed in 1990s which, to a certain extent, led to a slump in the labour market as well as to frustration and feeling of wasted time will soon be things of the past.
References:
1. Paschalis-Jakubowicz Piotr. 2004. Polskie leśnictwo w Unii Europejskiej. Wydano na zlecenie Dyrekcji Generalnej Lasów Państwowych. Centrum Informacyjne Lasów Państwowych. Warszawa 2004.
2. Grzywacz A. 2003. Studia leśne w systemie szkolnictwa wyższego w Polsce. Potrzeby przeobrażeń studiów leśnych w Polsce. Warszawa. Materiały konferencji 27-28 lutego 2003. Siemianowice.
3. http://www.ejpau.media.pl/. Strona internetowa czasopisma naukowego EJPAU.
4. http://www.wszs.tuchola.pl/. Strona internetowa Wyższej Szkoły Zarządzania Środowiskiem w Tucholi.
5. http://www.ibles.waw.pl/sylwan/ Strona internetowa czasopisma naukowego Sylwan.
6. www.lp.gov.pl. Witryna Państwowego Gospodarstwa Leśnego Lasy Państwowe.
97

УПРАВЛЕНИЕ И УСТОЙЧИВО РАЗВИТИЕ 2/2009(23) MANAGEMENT AND SUSTAINABLE DEVELOPMENT 2/2009(23)
FOREST UTILIZATION IN CONTEXT OF SUSTAINABLE DEVELOPMENT OF SOME
REGIONS
Marek Szymanski, Marcin Nawrot Department of Forest Utilization, Poznan University of Life Science, Poland
Abstract
In the economy of some regions importance matter have two different area of activity. Keeping their cultural,
historical, natural character of the landscape is first. Second whereas providing with the possibility of the balanced development societies in order to provide with the access to all essential goods and stores. From the another hand we have to remember about the principle: it is imposing on us an obligation to leave at least such conditions of the development, which we found to future generations. In the light of the last examinations, a lot is pointing at the fact that the forest management together with the dynamically growing sector of tourist services can combine these two opposing currents.
Key words: wood as renewable material, natural resource management, forest husbandry, sustainable devel-
opment
Introduction In the climatic-geographic zone in which Po-
land is situated, forests are the most obvious natural formation. They provide an essential fac-tor influencing ecological balance, life continuity, landscape diversity as well as neutralisation of contamination and, by doing so, counteract envi-ronmental degradation. Forest conservation is one of the crucial preconditions which limit soil erosion processes, preserve water resources, regulate water conditions and preserve land-scape. Forests are inseparably associated with one of the forms of land utilisation ensuring bio-logical production of a definite market value but they are also a social good affecting the quality of human life [5].
The importance of forest utilisation in-creases continually but the perception of this significance grows slowly together with changes taking place in our understanding of this re-source as a source and place of wood produc-tion, on the one hand, and a place for recreation and rest, on the other. From the economical point of view, the importance of forests is rela-tively easy to assess in the case of timber utilisa-tion by calculating its volume or value. Difficul-ties arise when it is necessary to estimate the value of non-timber forest raw materials as well as recreational “utilisation”. Monitoring the size of quantitative tourists’ flows during a given tourist season between forested and non-forested areas could be one of the ways of com-
parison and quantitative evaluation of the impor-tance of forest areas for tourism. 1. Methodology
The presented article is based on the analy-sis of statistical data published by the Main Sta-tistical Office. In order to obtain a wider picture of the current state of affairs, the authors also carried out the analysis of data provided by the State Enterprise “State Forests” in the form of information under the title “Report on the condi-tion of forests” published annually for the past year. 2. Perspectives of the traditional forest utilization
Possibilities of the utilisation of biomass de-rived both from agricultural as well as forest (wood) raw material, in the region of Wielkopol-ska, are considerable. When considering the overall structure of land utilisation in this region, arable lands take up the greatest area. The greatest resources of timber biomass can be found in the northern part of the voivodeship [2].
Wood still continues to occupy the fifth po-sition on the list of the most important commodi-ties in the world. It is quite probable that in fu-ture, due to intensively developing cellulose-chemical industries, this raw material can replace a number of sectors of the petrochemical indus-try. For these reasons, appropriate and wise utilisation of wood resources is of huge impor-tance for the entire modern civilisation [3].
In Polish conditions, the volume of the har-vested large timber is presented in Table 1.
98

Marek Szymanski, Marcin Nawrot
Table 1. The volume of the harvested large timber in Poland in individual years (Forestry 2008) Details 1995 2000 2003 2004 2005 2006 2007
Total [m3] 22492 27659 30836 32733 31945 32384 35935
Large timber 20651 26025 28737 30427 29725 30228 34146
Medium size bimber 1840 1634 2099 2306 2200 2156 1789 Stump wood 0.7 0.3 0.2 0.2 0.2 0.1 0.1
For the sake of comparison, the volume of
the harvested wood (large timber) in Wielkopol-ska in 2007 amounted to 2934 cubic meters.
In the case of forests which fulfil protective or recreational functions, the questions of timber production are of lesser importance because even if timber is harvested, it is only of comple-mentary nature in relation to the remaining func-tions [6]. It is evident from the analysis of statis-tical data [4] that timber harvesting in National Parks remains on a similar level in individual years and fluctuates around the level of about 200 thousand cubic meters a year.
Timber resources depend, primarily, on the State Forest Enterprise “State Forests” as it manages approximately 75% of the forest area in Poland. In 2007, the area of forested land amounted to about 9 255 million ha of which forests occupied 9 047 million ha and the fores-tation of the country amounts to 28.8%.
Table 2 presents the harvested levels of some non-timber products reported in forests administered by the State Forests, whereas Ta-ble 3 collates levels of harvested products in years 2006 and 2007 in the region of Wielkopol-ska.
Table 2. Harvest levels of some secondary forest products in forests administered by the State Forests
(Forestry 2007 – modified)
Details 1995 2000 2003 2004 2005 2006 2007
Norway spruce (Christmas-tree) x 1000 pcs
317 188 111 103 49 61 59
tons 6832 5597 9965 11834 10061 9147 Berries
thousands of PLN ld
51533 31195 46867 86414 102464 87022
tons 3295 8354 6519 7304 4448 7295 Forest fruit
thousands of PLN ld
2573 7579 6827 7194 4346 10511
tons 1705 2764 5187 4186 6133 6922 Mushrooms
thousands of PLN ld
17649 44731 58038 39113 60861 64687
Game animals worth of carcass in thousands of PLN ld ld ld ld ld 49042 81801
ld – lack of data Table 3. Harvest levels of some non-timber products in Wielkopolska in years 2006 and 2007 (Forestry
2007) Details 2006 2007
tons 556 144 Berries thousands of PLN 4702 1581 tons 141 165 Forest fruit thousands of PLN 376 546 tons 1105 1446 Mushrooms thousands of PLN 11399 16930
It is evident from the above-presented data
that Wielkopolska is a region of rich base of for-est raw materials, both timber and non-timber. They constitute one of the elements which sup-port the development of rich tourist base. The “State Forests” enterprise spends considerable
amounts of money building various facilities aid-ing tourism. These include, among others, [1]:
- 22 728 km of foot paths, - 20 591 km of cycling routes, - 2798 km of horse tracks, - 307 forest camping fields, - 620 camping sites, - 1107 forest parking plots, - 2760 resting sites for vehicles, - 216 camps, 86 station roofs in nurser-
ies, - 92 sport facilities, - 645 other objects.
99

FOREST UTILIZATION IN CONTEXT OF SUSTAINABLE DEVELOPMENT OF SOME REGIONS
3. Impact of traditional and alternative methods of forest utilization on its condition
There is no doubt that timber harvesting re-sults in changes in the conditions of forest bio-cenosis initiating forest regeneration. Forest utili-sation in the context of tourism development requires some investment in appropriate facilities and their influence on the forest itself as well as on forest management is, by no means, com-pletely clear. On the one hand, it is a way allow-ing better control of touristic traffic and its moni-toring but, on the other, it is frequently associ-ated with considerable expenses incurred on individual units of State Forests.
Forest administration employs a number of measures connected with the so called ‘tour-istic forest management’. It is thanks to newly established (at the expense of State Forests) forest parking areas, station roofs as well as other facilities of ‘small infrastructure’ that we can speak about touristic forest management. These are valuable initiatives and activities which contribute to the improvement of the forest space value in the context of tourism. In addi-tion, it also supports activities of commercial recreational centres. The above-mentioned activi-ties obviously change the conditions of forests but in long-term perspective, this will lead to better utilisation of the recreational values of the natural environment in forests and, simultane-ously, protect the most valuable nature frag-ments from destruction.
In the course of four years of observations, it was demonstrated that the wettest forest sites (boggy coniferous forests, riparian forest etc.) require special protection, including resignation from touristic utilisation. On the other hand, typical commercial forests, especially from the Molinio-Arrhenatheretea and Rudero-Secalietea
class, appear to be less affected by burdens as-sociated with touristic traffic [7].
Generally speaking, moderate utilisation of non-timber raw materials does not disturb the reserves of the base of these materials in the consecutive years.
References: 1. Raport z działalności edukacyjnej Lasów
Państwowych w 2006 roku. Państwowe Gospo-darstwo Leśne „Lasy Państwowe” Warszawa 2007. http://www.lp.gov.pl/media/biblioteka/edukacja/raport_edukacja_2006/view data dostępu 29.11.2008r.
2. Uwarunkowania środowiska przyrodniczego dla rozwoju energetyki odnawialnej w Wielkopolsce. Wielkopolskie Biuro Planowania Przestrzennego w Poznaniu 2008.
3. Plomion Ch., Leprovost G., Stokes A. 2001. Wood formation in trees. Plant Physiology, Vol. 127, USA.
4. Leśnictwo 2008. Rocznik Statystyczny – pobrany ze strony internetowej: http://www.stat.gov.pl/gus/45_1540_PLK_HTML.htm , data dostępu: 19.01.2009.
5. Raport 2007 o stanie lasów w Polsce. Państwowe Gospodarstwo Leśne „Lasy Państwowe”. War-szawa 2008. http://www.lp.gov.pl/media/biblioteka/raporty/raport-o-stanie-lasow-2007.pdf/view data dostępu 29.11.2008r.
6. Lacaze J.-F. 2000. Forest management for recrea-tion and coservation: new challenges. Forestry, Vol. 73, No. 2 pp. 137-141.
7. Połucha I. 2002. The tourism and recreational evaluation of the flora of selected areas within the Mazurian Landscape Park. Part I. The attractive-ness end resistance evaluation of the groups of plant communities in the tourism and recreation. Sylwan No 12/2002.
100

УПРАВЛЕНИЕ И УСТОЙЧИВО РАЗВИТИЕ 2/2009(23) MANAGEMENT AND SUSTAINABLE DEVELOPMENT 2/2009(23)
MANAGEMENT OF INDUSTRIAL SAFETY IN WOOD PROCESSING COMPANIES -
SOCIAL AND ECONOMIC ASPECTS
Kornelia Polek – Duraj University of Technology in Opole, Poland
Abstract
Industrial safety, health and occupational risk are influenced by diverse human, technical, organisational and
economic factors. Companies willing to compete on European and global markets have to undertake consistent activities in the range of industrial safety. The effectiveness of these activities requires them to be led in the frames of coherent system of industrial safety and health management. The following survey conducted in selected sawmill companies facilitated the collection of significant information which confirmed the need of implementing OSHMS in wood processing companies. It enables an effective use of possessed resources, provides notable economic benefits which occur as the decreased costs of industrial accidents, professional diseases and sick leaves.
Key words: industrial safety, wood processing companies, social aspect, economic aspect
Introduction The issue of maintaing the industrial safety
of employees ought to be of no small importance for every employer [1]. Safe and healthy work conditions are essential in the process of company's management. Industrial safety, health and occupational risk are influenced by diverse human, technical, organisational and economic factors. Companies willing to compete on European and global markets have to undertake consistent activities in the range of industrial safety. The effectiveness of these activities requires them to be led in the frames of coherent system of industrial safety and health management. This comes from the fact that good management is the most effective way of ensuring the industrial safety and health on the level high enough according to obeying the legally binding low, social expectations and the possibility of achieving the positive economic effects for the company.
The management of industral health and industral safety - Polish realities (the current situation)
The development of industrial safety management systems has a quite long history. Its origins are strongly correlated with the development of industrial production and the process of democratisation and evolvement of the societies [2]. In Poland the issue of managing the industrial safety is relatively young. The need of defining and normalizing the systemic management in Polish companies has been
observed since the first half of the 90's. It was the period of popularization the concept of both systemic quality management (ISO 9000) and environmental management (ISO 14000). At that time Polish government established Strategic Governmental Programme (SGP) „The Human Safety and Health Protection in Work Environment”, and its basic goal according to the domestic social and economic policies was to create an effective system of human safety and health protection in the work environment in the aspect of integration between Poland and European Union. Establishment of this programme was the beginning of systemic development of proper work conditions. The next stage was establishing the Normalizing Problem Commission (NPC) of Industrial Safety and Health Management. It is worth mentioning that many requirements in Polish legislation were formulated according to the different aspects of managing the safety but they do not require creating the system directly as it may be observed in some EU countries [4].
Despite the high level of accidental risk, industrial diseases and the low quality of work conditions Polish companies did not trust the implementation of Occupational Safety and Hygiene Management System (OSHMS). It was mainly connected with the slow flow of information about the benefits of this system both for the employee (the improvement of work conditions, which also means the decrease of number of people working in risk conditions, industrial accidents and industrial diseases) and
101

Kornelia Polek – Duraj
the company (the increse of accidental costs, industrial diseases, sick leaves and the costs of work in harmful and onerous conditions).
The first companies which paid attention to the high quality and to hold good position on the market, started to implement this system before NPC was established. It were mainly the big companies with the recognizable brand on the domestic market applying to enter the foreign markets. They undertook certain activities without waiting for creating and implementing an appropriate Polish standards (i.e Częstochowa Steelworks created and implemented its own standard for the company. [5]. However, in the most of the Polish companies the implementation of OSHMS has just begun. The basic impetus for implementing these systems was the establishment of 3 Polish Norms by NPC which included requirements for OSHMS. (PN-N-18001, PN-N-18002, PN-N-18004). Its goal was to enable the employers to fulfill the requirements contained in the general outline (89/391/EEC) concerning the improvement of work conditions and the necessity of creating the elements needed for both accomplishing formal requirements and essential for effectiveness of OSHMS (i.e managers involvement).
The spread of OSHMS on a larger scale occurred at the end of 1999 and the beginning of 2000, when Work Standards and Safety Inspectorate with the help of UE PHARE Fund implemented in both sawmill and building companies Pilot Contest of Industrial Safety Management in accordance with the requirements of 89/391/EEC Directive. Its aim was to encourage Polish production and service companies to applay the innovative methods of management according to industrial safety and hygiene. As part of the contest, the process of implementing OSHMS was initiated and monitored in 25 chosen companies.
Unfortunately, despite of undertaken efforts according to the spread of the safety management systems, only small amount of companies (especially small and medium sized) decided to implement it. In many cases this may be due to the lack of safety standards in the aspect of OSHMS and the costs of providing optimal working conditions suffered by the employer. Very often the companies are not aware that the costs of industrial safety and
hygiene (such as industrial accidents, sick leaves caused by work conditions, industrial diseases) decrease significantly after implementing OSHMS (Polek).
Own research
The views on effectiveness of OSHMS are diverse. This may be due to the fact that it may be both efficiently working management tool which may provide notable economic benefits and it may also be just a set of documents with no reference to practical activity. It is worth remembering that implemented OSHMS will work correctly only when its assumptions and rules are obeyed and used by both employers and employees.
The data used in the first part of the survey concern the quality of work conditions and the number of industrial accidents collected in 4 chosen wood processing companies of Opole Silesia region. In the second part of the survey the comparison was made between 2 companies which implemented OSHMS and the companies from south western Poland which did not.
The main intent of this survey was to compile data about "the number of people working in the health-threatening conditions", the number of industrial accidents". Presentation of these data enables an objective presentation of this issue among the companies which did not implement OSHMS in both micro and macro scale. It may also serve as a source of general knowledge about the trends and dynamics of this occurrence. However, it should be remembered that every change of the method used to collect the data about industrial accidents and the number of employees may substantially influence this measurement. At the beginning of the 90's both situations took place, when statistic record of industrial accidents was introduced, the sudden decrease of number of employees was observed. The record is a very detailed document which requires professional preparation and is laborious so it may be assumed that many employers (mostly representatives of small-sized companies) fail in reporting small industrial accidents. TThe results of statistical research studies also support this conclusion. The examination of Opole companies is present in table 1.
102

MANAGEMENT OF INDUSTRIAL SAFETY IN WOOD PROCESSING COMPANIES - SOCIAL AND ECONOMIC ASPECTS
Table 1. Employed in life threating conditions in the chosen wood processing companies of Opole Silesia
in 2006-2008 ( %)
Threat connected with Wood processing companies
All employed in health threatening conditions work environment strenuous work mechanical factors
Company 1 65,98 59,80 5,20 35,00 Company 2 61,20 63,25 3,55 33,20 Company 3 52,22 52,40 3,55 27,05 Company 4 63,21 63,90 4,10 31, 00
Source: Own calculations based on information from examined companies More than half of the employees in the
companies studied work in conditions which do not meet the requirements of industrial safety. Among the deleterious factors which may be health-threatening, the most significant factors are those connected with the substantive work environment. Undoubtedly, it is correlated with the specificity of this field (operating of dangerous and often complicated machines, excessive noise and dust) and significantly influence the health condition of the employees. The results obtained clearly show that in company 3 which was the only one to implement OSHMS (it owns the PN–N–18001 certificate), the lower number of employees work in health-threatening conditions.
The data provided in Table 2 show the rates of intensity of industrial accidents which indicate the number of accidents per 1000 employed. This data is an reasonable source of knowledge as they reflect the real image of this problem.
Table 2. The number of industrial accidents per 1000 employees (rate of frequency) in sawmill industry in
Opole Silesia region 2006-2008 Item 2006 2007 2008 Company 1 57 60 64 Company 2 60 56 39 Company 3 39 23 10 Company 4 56 59 61 Source: Own calculations based on information taken from examined companies
When analysing Table 2 it may be
concluded that between years 2006 and 2008, in companies 1 and 4 the increase of industrial accidents can be observed.
In companies 2 and 3 the number of accidents is consistently decreasing. It is worth noticing however, that company 3 is characterized by much lower rate. What can be alarming is the rate of frequency of industrial accidents in companies 1 and 4. In 2008 it is
over 6 times higher than in company 3. In company 3 what is not indicated, in 2007 one person was killed but it was not the company's worker. The person was responsible for delivery of goods and did not obey the industrial safety rules.
On the basis of the data provided above it may be concluded that the frequency of industrial accidents per 1000 employees apart from company 3 is far too high. The rates of frequency in companies 1, 2 and 4 are very different from the average number of industrial accidents in the sawmill industry. It is mostly resulting from the specificity of analysed companies. The survey was conducted in these sawmill companies where the highest level of health-threatening factors is observed.
Table 3. The causes of industrial accidents in
examined companies in 2006–2008 (%)
Item Technical factor
Organisational factor
Human factor
Company 1 30,1 26,4 45,5 Company 2 34,3 21,2 44,5 Company 3 27,0 18,7 54,3 Company 4 31,1 22,8 46,1 Source: Own calculations based on information from examined companies
When analysing the data presented above,
it may be concluded that the biggest industrial risk is caused by negligence and irresponsibility of employees, disobeying industrial safety rules, inattention of employees and defective machines and devices. It is worth mantioning however that in company 3 which implemented the OSHMS the smallest number of industrial accidents caused by technical and organisational factors can be observed.
Moreover, age, work experience and education of employees, who suffered from industrial accidents, were studied and it occurred that in the examined period of time, with no
103

Kornelia Polek – Duraj
reference to OSHMS the biggest number of accidents took place among young workers ( in the 18 to 24 age band the number of accidents came to 20% of all and in the 25-40 came to 63%). At the same time it was noticeable that these workers are the least experienced (up to 3 years of work experience) and the lowest education (primary 25% and vocational 59%).
Additionally, in the company in which OSHMS was implemented the benefits and costs of industrial safety were analysed both in economic and social aspects. According to economic aspect since the OSHMS has been implemented (2001) the significant improvement of the quality of work conditions was observed. It resulted in the decrease of industrial accidents, decrease of sick leaves, decrease of costs of medical treatment and other services, limitation
of production loss and the increase of the work quality and efficiency. The costs of services for the workers employed in health threatening conditions and costs resulting from defective design of work place were also decreased. The positive changes were also observed according to social aspects. In the anonymous questionnaire employees highly assessed the social activity of the company according to industrial safety rules and health protection. The relationships between the employers and employees were also improved. The comparison between Opole company which implemented the OSHMS (company 3 from the previous analysis| and the companies from Southwestern Poland without OSHMS in the same field is present in table 4.
Table 4. The rate of frequency of industrial accidends per 1000 employees in examined companies
Item 2000 2001 2002 2003 2004 2004 2005 2006 2007 2008 Company3 78 80 69 67 61 59 48 39 23 10
Other companies 84 91 88 88 83 81 78 68 56 41 Source: Own calculations based on information from examined companies
In the light of statistic data OSHMS in company 3 may be considered as effective at least according to the number of industrial
accidents. The chart presented below indicates this clearly.
2000 2001 2002 2003 2004 2 005 2006 2 007 20080
10
20
30
40
50
60
70
80
90
100
7880
6967
6159
48
39
23
84
9188 88
8381
78
68
56
z ak lad 3po zost ale zak lady
Fig. 1. The rate of frequency of industrial accidents in company 3 and other companies
Source: Own calculations based on Table 4
The survey conducted both in Opole
Silesia region and south eastern Poland clearly indicate better position of these wood processing companies which implemented OSHMS. In some cases implementing OSHMS do not guarantee lack of industrial accidents
but it is caused by lack of company's full involvement in this process. Recently more and more companies try to implement OSHMS.
104

MANAGEMENT OF INDUSTRIAL SAFETY IN WOOD PROCESSING COMPANIES - SOCIAL AND ECONOMIC ASPECTS
Conclusion The following survey conducted in
selected sawmill companies facilitated the collection of significant information which confirmed the need of implementing OSHMS in wood processing companies. It enables an effective use of possessed resources, provides notable economic benefits which occur as the decreased costs of industrial accidents, professional diseases and sick leaves. What is more the employer's care for providing the quality of work conditions positively influences the work culture and the involvement of the employees what also results in increasing their efficiency At the same time it creates a positive image of the company as far as public opinion is concerned which may influence the positive assessment of the quality of manufactured products or provided services and increases the number of customers.
However, it should be remembered that implementing OSHMS alone is not enough. Both employers and employees should be fully involved in this process in order to make it effective and to avoid generating unnecessary costs.
Reference: 1. Borysiewicz M., Lisowska-Mieszkowska Żurek E,
Integrated Systems of Process Safety Management in the Industrial Company, Health Protection and Inflencing the Environment. CIOP, Warszawa 2001.
2. Fuławka J., The Humanization of Work According to the Challanges of the 21st Century in the Sawmill Industry (in:) „Przemysł Drzewny” 2001, no3
3. Karczewski T, J., The System of Industrial Safety Management ODDK, Gdańsk 2000
4. Markowski A.S. (ed.), Avoiding the Loss in Industry. Part 2: Management of Occupational Safety and Hygiene System, Technical University of Łódź, Łódź 1999.
5. Podgórski D., The Modern Concepts of Managing Industrial Safety and Hygiene (in:)Współczesne koncepcje zarządzania bezpieczeństwem i higieną pracy, w: Labour Science – Safety, Hygene, higiena, Ergonomy, CIOP, Warszawa 2000.
6. Polek K., Changes in the quality of working conditions in the sawmill industry of Opole Silesia during economic transformation (social and economical aspects), Doctoral dissertation, Adviser Prof. R. Rauziński, University of Economics in Katowice 2006.
105

УПРАВЛЕНИЕ И УСТОЙЧИВО РАЗВИТИЕ 2/2009(23) MANAGEMENT AND SUSTAINABLE DEVELOPMENT 2/2009(23)
ACTIVITY BASED COSTING AND EFFICIENCY OF THEIR APPLICATION IN
THE WOOD HOUSES PRODUCTION AS THE INSTRUMENT OF THE BUSSINESS PERFORMANCE INCREASING
Rastislav Rajnoha Technical University, Zvolen, Slovac Republic
Abstract
An important tool for the costs management under changed conditions becomes calculations based on per-
formed activities and processes – so called Activity-Based-Costing (ABC). In this paper we would like to present results reached at the comparison of economic efficiency in traditional calculation system and modern calculation oriented on processes and activities by used of specific methodology in the chosen Slovak wood processing com-pany. On the base of our designed methodology and reached results we can recommend implementation of an alternative calculation system based on performed processes and activities.
Key words: wood processing industry, wood houses production, process management, planning, perform-
ance measurement, budgeting, costing, controlling
Introduction The present times can be characterized by
significant changes almost in all spheres of life including the economic life. An increasing com-petition will requires a wide range of innovation activities, related to the product’s life cycle shortening and the competition will be more re-lated to prices of products and services. The radical problem of many industrial countries re-sides in 30% higher products prices which de-creases its competition advantage in the interna-tional market. In the last years we can see at the same time strong change in company costs structure, which occurred with implementing of integration production systems into the compa-nies. From the costs structure point of view the lower share of direct costs and increasing of indirect costs (overheads) are noticed. The share of indirect costs is often more than 50% from total company costs and their further growth in the future is supposed. One of the possibilities, how to increase the profitability, enterprise proc-esses efficiency, competitiveness and to obtain maximal customer satisfaction all at once, is the possibility to manage the costs via the Activity-Based-Costing Method (ABC).
In the Slovak Republic conditions the appli-cation of new access or knowledge from the cost area is strong dependent on transformation process of the whole economy. We can already see the companies, which are able to react promptly on the changed conditions, and they apply this method of calculation. But there are also many companies, where the costing and calculation are used only as a tool for costs monitoring according to calculation formula and
they do not use another possibility which these calculations offer, such as calculation of indirect costs or Activity Based Costing. Therefore in these companies the elements of strategic man-agement cannot be implemented and in depart-mental accounting the tasks are not observed as they should be. The implementation of Activity Based Costing and its further utilize in practice gives to companies a possibility to reach consid-erable economic benefits, but at the same time it causes the costs increasing on information sup-port, too. As Foltinova – Kalafutova says, the calculation with several cost drivers is much far difficult than the traditional calculation and there-fore it demands more administration and it is more expensive. Owing to above mentioned it is not suitable for general application in such com-panies where supporting activities do not play a significant role. Activity based costing is a proc-ess of accumulating and tracing costs and per-formance data to a firm's activities and providing feedback of actual results against the planned costs to initiate corrective action where re-quired. It is a tool for understanding costs. An activity based costing system assigns costs as they actually exist at a point in time, not as they should or could be performed.
We can say that there are mainly large companies where the ABC was implemented but with various final effects. First, there are the companies, where managers think that they ex-pend appropriate costs on ABC implementation comparing with the benefits reached from this implementation. Secondly, there are many com-panies, where in spite of the lack of exact calcu-lations they consider costs expected in such
106

Rastislav Rajnoha
calculation systems for extremely high and not inadequate to reached effects and they think that the whole process of implementation will be a failure.
This paper presents chosen results reached upon the comparison of traditional calculation system effects and Activity based costing ef-fects in the chosen Slovak wood-processing company1.
1. The goal of study
Therefore the goal of this study on the bases of the theoretical outcomes is to propose a scientific analyse and the syntheses of knowl-edge the specifically costing model for the condi-tions of family houses produced from the wood (on the EU legislative is the producer ranging in the SMEs – small and medium enterprises) with a specific accent to the area of overhead costs, that will reflect the newest scientific knowledge in this area of enterprise economy science and at the same time it will take into account the particularities of such production type in the conditions of market-oriented economy as well as the requirements of their economical effi-ciency. Following partial steps of solution has come from the present goals, it was their goal on the basis of the scientific procedures and meth-ods:
- Analyse the contemporary costing model, that is used in the selected enterprise of wood-processing industry and to identify their weaknesses.
- Define a costing model with the primary accent on the area of overhead costs management, that takes into account the newest trends and the specific conditions and requirements that will be given by the conditions of selected wood-processing enterprise.
- Identify the selected economical contri-butions from the implementation of an al-ternative costing model and to compare it with the contemporary state.
- Propose and verify the methodical of economical efficiency evaluation by im-plementation of an alternative costing model with the use of specialized infor-mation software support by given spe-cific conditions.
2. Material and Methods In a dynamically expanding and changing
condition of the market economy – more com-plexly production environment, but mainly the competitive environment – the traditional access to the costing is insufficient [18]. With the in-creasing intensity of competition on the world markets the pressure on the prices of the sup-plied products and services are constantly raising which effects consequently, that it will search the new ways of cost management. We can classify the „Process oriented cost accounting and calculations“ or „Goal oriented cost ac-counting and calculations“. Both of these ap-proaches are oriented towards customer re-quirements satisfaction, through the products and services that have not only the required at-tributes, but the costs or prices, too.
Vollmuth cites as the next thing that with the growing competition and constantly increas-ing ratio of overhead costs on the full costs there is a further application of a classical costing methods possible only in the limited span. Key-note consists in the change of cost management philosophy. The primary task to determine is the cost to produce a product, but how much does it mostly costs on market. The classic overhead rates costing as a tool of price making so in the areas with a strong competition wanes. The price is specified by market and the product can-not be therefore offered for a higher price. Then the enterprise must produce the products with costs that are covered through such price: Target costs = Target price on the market – Required profit
- Goal oriented cost accounting and calcu-lations (Target costing) are sometime substitutes for the term of a goal ori-ented management (Target manage-ment), because neither is about the technique of cost accounting, but more as the tool of the transformation process optimalisation with the goal to obtain the allowable costs and to satisfy customer requirements with product functionality and the price. Through the goal oriented cost management the amount of single
1 Company belongs to the group of SME with 150 employees dealing with the wood houses production
107

ACTIVITY BASED COSTING AND EFFICIENCY OF THEIR APPLICATION IN THE WOOD HOUSES ...
product costs, processes and acticities that are realised on the enterprise cannot be directly influenced. The necessary changes firstly in the enterprise areas with a high contribution of overhead costs are possible to realize only with the process oriented cost accounting (Activ-ity – Based - Costing), that can be taken as a market-oriented cost accounting and calculation system, with its help it can survive in the segments with a strong competition about all [18].
- Process-oriented cost accounting, calcu-lations and budgets have as the only task to recover the level of an overhead costs on the single enterprise activities and al-locate then directly to the cost owners. It can be said that the indirect costs will be calculated as quasi direct. The radical change is in accounting of the cost cen-tres and owners, who instead of the abandonment of overhead costs through the charges of an overhead cost centres, will use so called “rates of single activity costs”. Such approach is desirable to ap-ply the enterprise areas with a high con-tribution on the total enterprise costs about all, that have also a high contribu-tion of an overhead costs (for example research and development, production process planning, enterprise administra-tion, logistics etc.). Instead of the corre-lation values, used in the differentiated overhead rates costing (for example pro-duction salaries, machine hours, produc-tion material, etc.) the following correla-tion values will be used: number of parts, customers, product alternatives, special customer requirements, product changes, etc.
It must be said, that it doesn’t talk about a new area of cost accounting. It handles only the application of more objective monitoring and overhead cost calculating in the framework of cost arts accounting, centres and owners, with the goal to modify the cost accounting on the conditions of differentiated customers and mar-kets satisfaction. As Däumler – Grabe mentions, by the use of process oriented calculation it will be handled about the modification of traditional overhead rate costing, whereby the overhead costs are more objective contribute to the single products and services. By the classical overhead
rate costing it can’t be misseing to the propor-tional adding of fixed costs. The proportional adding of overhead costs to the products isn’t real, because it doesn’t take into account the influence of fixed costs. With the help of proc-ess-oriented calculation this effect can be elimi-nated [4].
Activity Based Costing has to cover the amount of indirect costs per particular activity and allocate it directly to costs bearers. So it can be said that indirect costs will be calculated as direct ones. Significant change in calculation of costs centres and costs bearers consists in ac-counting by so called costs rates in particular activities instead of costs centres charges in indirect costs. Such a process can be applied mainly in divisions with high contribution to the total company’s costs and at the same time with high share of indirect costs (e.g. R&D, technical support of the production, administration, supply activities etc.)
According to Vollmuth [18], by the applica-tion of process-oriented calculation from the methodological point of view, these four particu-lar steps are necessary:
1. Analyse of realised activities and proc-esses
2. Definition of correlation values 3. Costing charges setting of realised activi-
ties 4. Overhead costing on performances Instead of the referring parameters used in
differentiated contribution calculations (e.g. workers wages, hours of machinery under opera-tion, production material etc.) the following pa-rameters are used: number of segments, number of customers, number of products alternatives, number of special customer’s demands, number of changes in a product etc.
To obtain the assessed goal of the research we have followed these particular steps:
1. Analysis of contemporary calculation model used in the chosen wood process-ing company and identification of its weaknesses.
2. Projection of Activity Based Costing model with the emphasis on the man-agement of indirect costs.
3. Identification of the chosen economic benefits coming from alternative calcula-tion model.
4. Projection and verification of the meth-odology for the evaluation of economic
108

Rastislav Rajnoha
effects coming from the implementation of alternative calculation model with the support of specialized information soft-ware under given specific conditions.
3. Chosen results
3.1. Strengths and weaknesses analyse of
the alternative costing models Following the realised analysis the crucial
the weaknesses of existing overhead costing monitoring and calculation system for the wooden family houses, eventl. the positives of alternative costing model ABC (Activity – Based – Costing), were integrated into the following points: • With use of ABC Model:
- the standard houses will be cheaper from the cost point of view, and the non-standard houses will be more expensive as till now,
- under the keeping of certain conditions and assumptions, the small-sized houses will be relatively more expensive and the bigger houses relatively cheaper than now,
- the number of houses variants by the wooden houses production will be possi-ble to reduce, which will excessively in-crease the enterprise overhead costs,
- the work productivity and capacities utilization in the single enterprise centres and departments will raise.
• Vice versa, by the use of the traditional form
of overhead costing: - non-standard houses will seem more
profitable in comparison with the stan-dard version, as they really are,
- non-standard and small-sized houses will be more required from the customer, be-cause by such houses there will be the undervaluation of their costs by the cal-culation.
- the number of variants and production severity of houses will raise, whereby the profit will still raise and enterprise activi-ties will stagnate or fall.
3.2. Determination of ratio coefficient One of the particular results of study solu-
tion is the determination of ratio coefficient (c)
as a rate of the whole panels flat, used by the wooden family houses production, defined in a m2 or a useful area of houses, defined just so in a m2. The determination of the ratio coefficient was necessary for the comparison of alternative costing models. To this goal the methods of cor-relation analyse was used, by which the linear model in following form is proposed:
xcy .= ,
where y – panels flat in m2, x – useful area of house in m2, c – ratio coefficient
Besides the method of correlation analyse
the method analyse of variance was used to the relation quantification between the useful area and panels flat and to the results certification, achieved by correlation analyse, because the correlation analyse don’t give the explicit results for the complexly examined value set. From this reason the whole statistical set was segmented by the size of useful house flat into several sub-sets – categories. The primary goal was to verify the reliability of ratio coefficient c defined by correlation analyse in the dependency from the size of useful house flat. By this action the Tukey HSD test was used.
The results achieved in the framework of ra-tio coefficient definition c via methods of correla-tion analyse and analyse of variance are summa-rized into the following table 1, that summaries the specific indexes, derived for the aim of the construction of an alternative calculation model and their subsequent comparison and economical efficiency evaluation towards the traditional model used in the mentioned enterprise.
3.3. Alternative calculation model and quan-
tification of the selected economical contribu-tions
In the following text the further particular results of the study will be presented - they compare the results achieved through the appli-cation of traditional and process-oriented access in the costing area and monitoring of economic enterprise effectiveness of wooden houses pro-ducer. Table 2 represents the budget of the overhead costs on the single departments in the mentioned enterprise.
109

ACTIVITY BASED COSTING AND EFFICIENCY OF THEIR APPLICATION IN THE WOOD HOUSES ...
Table 1. Specific indexes derived as the aim of the construction of an alternative calculation model and their economical efficiency evaluation
Categorization alternative A B C
Useful area in m2
Small houses
Large houses
Small houses
Large houses
Small houses
Large houses
Monitored value
< 175 > 175 < 125 > 125 < 150 > 150 Average useful area in m2/ house 124,18 224,85 106,23 158,56 118,23 188,19 Quota from the whole production in % 91,15 8,85 48,67 51,33 78,76 21,24 Average ratio coefficient c unified for all size categories /defined by correlation analyse/
4,57990
Average ratio coefficient c differentiate by the size categories /defined by analyse of variance/
4,59620 4,41208 4,86854 4,3062 4,65617 4,29710
Table 2. Budget of the overhead firm costs (in SKK/ year)
Department Trade Economics PPP MPP Production Fabrication
Enterprise
Budgeted value 9 070 072 3 230 700 4 386 425 2 472 446 25 770 795 11 881 561 56 812 000
By the construction of process-oriented calcula-tion model we follow the above mentioned methods. The definition of the planned perform-ance volume and process-oriented budget of overhead costs for the enterprise as a whole and for the single process centres - Activity Based Budgeting (ABB) – see table 3 foregoes to the construction of calculation the ABC model.
From the results achieved in the trade de-partments, that the alternative calculation ABC model radically constraints the proportionalisa-tion of overhead costs (p = 1,18), the perform-ance deviation by the changes of the enterprise performance size structure is enabled as well as the identification of coefficient of useful potential of overhead costs (cOC = 93,2 %). When we
analyse the results of process model testing pre-sented in the past tables 3 - 5, we can observe that by the exchange of production size structure it comes in the trade department to the perform-ance deviation in the amount of:
Dp = performance planned – performance real
Dp = 99.000 work. min – 92.298 work. min = 6.702 min
what in the financial formulation gives the
value: Dp = 6.702 min x CPOCd = 6.702 x 91,62 = 4.037,- SKK
Table 3. Overhead activities costs, realized in the framework of trade department - ABB
Volume of activity realised
(number/ year)
Estimated time of 1 activity unit
(min) Activ-
ity code
Activity description Activity
measure-ment unit Small
house (120 m2)
Large house
(240 m2)
Small house
(120 m2)
Large house
(240 m2)
Estimated activity
time for 1 year (min/ year)
Overhead costs of
activity for year
(SKK/ year)
1 Processing of calculation bases Units of bases 66 6 24 24 1 728 158 314
2 Preparation of bases to the fabric realisation Kit of bases 66 6 720 720 51 840 4 749 420
3 Preparation of contracts with a customer
Contracts number 132 12 96 96 13 824 1 266 512
4 Performance billing Bills number 330 30 16 16 5 760 527 713 5 Bases preparation to the
labour permits Kit of bases 66 6 16 16 1 152 105 543
6 Coordination activity in the time of order realisation
Contacts number 990 90 5 5 5 400 494 731
7 Trucks clearance Trucks number 198 30 10 10 2 280 208 887
110

Rastislav Rajnoha
(continued) 8 Other comm. activities Panels flat 36 274 6 595 0,29 0,29 12 528 1 147 776 9 Other undefined activities Panels flat 36 274 6 595 0,10 0,10 4 488 411 177 Total 99 000 9 070 072
Table 4. Calculation of overhead costs and their results, achieved through the application of alternative calculation
model – trade department
Small houses (120 m2) Large houses (240 m2) Activ-ity
code Activity description Activity meas-
urement unit Production unit calcula-
tion
Periodical calculation
Production unit calcula-
tion
Periodical calculation
Proportiona-lity coeffi-
cient p
1 Processing of calculation bases Units of bases 2 199 145 121 2 199 13 193 1,00
2 Preparation of bases to the fabric realisation Kit of bases 65 964 4 353 635 65 964 395 785 1,00
3 Preparation of contracts with a customer
Contracts number 17 590 1 160 969 17 590 105 543 1,00
4 Performance billing Bills number 7 329 483 737 7 329 43 976 1,00 5 Bases preparation to the
labour permits Kit of bases 1 466 96 747 1 466 8 795 1,00
6 Coordination activity in the time of order realisation
Contacts num-ber 6 871 453 504 6 871 41 228 1,00
7 Trucks clearance Trucks number 2 749 181 401 4 581 27 485 1,67 8 Other common activities Panels flat 14 715 971 195 29 430 176 581 2,00 9 Other undefined activities Panels flat 5 271 347 919 10 543 63 258 2,00 Total 124 155 8 194 229 145 974 875 843 1,18
Table 5. Calculation of overhead costs for production unit and periodical calculation – results achieved by the size
structure change – trade department Small houses (120 m2) Large houses (240 m2) Activ-
ity code
Activity description Activity meas-ure-ment unit Production
unit calcula-tion
Periodical calculation
Production unit calcula-
tion
Periodical calculation
Proportiona-lity coeffi-
cient p
1 Processing of calculation bases Units of bases 2 199 118 735 2 199 26 386 1,00
2 Preparation of bases to the fabric realisation Kit of bases 65 964 3 562 065 65 964 791 570 1,00
3 Preparation of contracts with a customer
Contracts number 17 590 949 884 17 590 211 085 1,00
4 Performance billing Bills number 7 329 395 785 7 329 87 952 1,00 5 Bases preparation to the
labour permits Kit of bases 1 466 79 157 1 466 17 590 1,00
6 Coordination activity in the time of order realisation
Contacts number 6 871 371 048 6 871 82 455 1,00
7 Trucks clearance Trucks number 2 749 148 419 4 581 54 970 1,67 8 Other common activities Panels flat 14 715 794 614 29 430 353 162 2,00 9 Other undefined activities Panels flat 5 271 284 661 10 543 126 516 2,00 Total 124 155 6 704 369 145 974 1 751 687 1,18
The computation accuracy in the framework of used procedure certifies the following control
computation that reflects the periodical overhead cost calculation (Table 6):
111

ACTIVITY BASED COSTING AND EFFICIENCY OF THEIR APPLICATION IN THE WOOD HOUSES ...
Table 6. Definition of performance deviation financial – control computation
Size category Costs of planned performance /Costs planned - Cp/
Costs of real performance /Costs re-counted - Crec./
Performance deviation
/Dp/ Small houses 8.194.229 6.704.369 + 1.489.860 Large houses 875.843 1.751.687 - 875.844 Total: 9.070.072 8.456.056 614.016
On the basis of the above-identified per-
formance deviation in the overhead costs of trade departments, the coefficient of overhead costs potential utilization, calculated by the fol-lowing mathematical formulas was defines:
CCC
P
TECOC
=
%2.93100.932,0072.070.9056.456.8
===COC
Table 7. Calculation of overhead costs and their results, obtained by application of an alternative model – enter-
prise total Small houses (120 m2) Large houses (240 m2)
Department Production unit calculation
Periodical calcu-lation
Production unit calculation
Periodical calcu-lation
Proportiona-lity coefficient
p Trade department 124 155 8 194 229 145 974 875 843 1,18 Economic department 43 608 2 878 098 58 767 352 602 1,35 PPP department 56 367 3 720 213 111 035 666 212 1,97 MPP department 33 173 2 189 408 47 173 283 038 1,42 Production department 334 856 22 100 501 611 716 3 670 294 1,83 Fabrication department 158 040 10 430 634 241 821 1 450 927 1,53 Enterprise total 750 198 49 513 084 1 216 486 7 298 916 1,62
Table 8. Calculation of overhead costs pro production unit and periodical calculation – results achieved by the
exchange of size structure – enterprise total Small houses (120 m2) Large houses (240 m2)
Department Production unit calculation
Periodical calcu-lation
Production unit calculation
Periodical calcu-lation
Proportiona-lity coefficient
p
Trade department 124 155 6 704 369 145 974 1 751 687 1,18 Economic department 43 608 2 354 808 58 767 705 204 1,35 PPP department 56 367 3 043 811 111 035 1 332 424 1,97 MPP department 33 173 1 791 334 47 173 566 076 1,42 Production department 334 856 18 082 228 611 716 7 340 588 1,83 Fabrication department 158 040 8 534 155 241 821 2 901 854 1,53 Enterprise total 750 198 40 510 705 1 216 486 14 597 832 1,62
Table 9. Definition of performance deviation and utilization of a potential of overhead costs by the exchange of
size structure – enterprise total
Department Costs planned -
Cp
Costs re-counted - Crec
Performance deviation –
Dp
Potential of overhead costs utilisation
Trade department 9 070 072 8 456 056 614 016 93,2 % Economic department 3 230 700 3 060 012 170 689 94,7 % PPP department 4 386 425 4 376 235 10 191 99,8 % MPP department 2 472 446 2 357 410 115 036 95,3 % Production department 25 770 795 25 422 816 347 979 98,6 % Fabrication department 11 881 561 11 436 009 445 552 96,3 % Enterprise total 56 812 000 55 108 537 1 703 463 97,0 %
112

Rastislav Rajnoha
From the results achieved in the trade de-
partment results, that the process-oriented calcu-lation model radically constraints the proportion-alisation of overhead costs (p = 1,18), the per-formance deviation by the changes of perform-ance size structure is able to open and to identify the coefficient of useful potential of overhead costs (cOC = 93,2 %) in this way. Similar results were obtained by the other departments in the following enterprise. These results, from the enterprise as a whole, obtained from the particu-lar results achieved by the application of proc-ess-oriented calculation model in the framework of single intradepartmental departments and units are summarized in the tables 7 - 9.
By the quantification of economical effi-ciency of the proposed solution we come out from the mutual comparison of their costs and potential economical contributions.
A. Economical contributions – economical contribution from the implementation of alterna-tive economic costing model is presented in the form of gross margin from the average sale price and average direct costs pro m2 of the houses useful area. By both examined values through the method of analyse of variance, their validity for all size categories of houses was verified, whereby:
- Average sale price – from the total achieved results arises that between dif-ferent size-categories of houses, any statistical important differences in the value of average sale price, given on m2 of houses useful area do not exist. This effect was verified post facto through the analyse of variance of sale prices by walled family houses as substitution products. The realised verification con-firmed the results achieved in the fol-lowing wood-processing enterprise.
- Average direct costs – the results of variance analyse were not as clear as in the area of sale prices. In spite of this fact, the alternatives of size categoriza-tion A, C cannot give the statistically important difference in the area of direct costs in the dependency from the size categorization of houses.
By the application of specific methodology we have assessed the chosen economic benefits and costs coming from implementation of alter-native calculation model:
B. Benefits - Earnings for particular company’s per-
formance: - Average structure of performances
6 070 668,- SKK/ year - Small houses
5 717 218,- SKK/ year - Large houses
7 051 535,- SKK/ year - Gross margin for particular company’s
performance: - Average structure of performances
2 066 087,- SKK/ year - Small houses
1 945 794,- SKK/ year - Large houses
2 399 915,- SKK/ year
C. Costs – Total average yearly costs (TAC) on the implementation of alternative solution were calculated flowingly:
TAC = 1.500.000 x 0,229607 + 330.000 = 674.410,- SKK/ year
From the above mentioned we could see
that the economic benefits are coming from the alternative solution multiply overrun costs needed for implementation and regularly utiliza-tion of this solution and therefore we recom-mend its application in the company. 5. Conclusion
Nowadays, many consultant companies dealing with the implementation of costing and calculation systems offer alternative calculation systems based on performed activities and proc-esses - so called Activity Based Costing sys-tems. Managers must decide which conception they would apply in their companies. The system of Activity Based Costing brings economical ef-fects, but it requires higher demands on informa-tion database by special software and therefore it results in higher investment expenditures for its purchase and application. On the base of our methodology and reached results we can rec-ommend implementation of alternative calcula-tion system based on performed processes and activities in the chosen wood-processing com-pany. From the about given study results, real-ised in the selected wood-processing enterprises, the selected economic contributions from the
113

ACTIVITY BASED COSTING AND EFFICIENCY OF THEIR APPLICATION IN THE WOOD HOUSES ...
implementation of alternative solution multi-overstepping confirm the costs, required for their implementation and regularly utilisation, on this basis we recommend their implementation in the enterprise.
Summary
In this paper we have presented abilities of the application of the new modern costing con-ception and calculation conception in the chosen wood-processing enterprises with the goal to solve the given problems. We think that effective cost management under market economy, which is characterized by intensive competition, is based mainly on the system of costing and cal-culation which support the company’s manage-ment by relevant information needed for planning and control of costs as the basic subsystems of controlling-oriented conception of management.
In this study, we focus on some selected results achieved in the course of the process of comparing the economic effectiveness of tradi-tional calculation systems with modern calcula-tion based on processes and activities through the implementation of specific methodologies in the selected wood-processing company.
Nowadays, increasingly more commercially oriented consulting firms, oriented on the imple-mentation of cost accounting systems and calcu-lations in the enterprise praxis offer the alterna-tive calculation systems, based on the performed activities and processes. Enterprise managers stay for a one important decision, which concep-tion of cost accounting and calculations to im-plement in the enterprise. The cost accounting system based on the processes and activities brings to the enterprise the economical benefits, but secondly evokes the higher demands by the assurance of information basis through the spe-cialized software and with them the higher in-vestment expenses for their purchase and utilisa-tion. Basically on the implementation of from us proposed specific methodical and achieved re-sults can be valorised and consequently suggest the implementation of an alternative calculation system, based on the performed processes and activities in the selected enterprise of wood-processing industry.
References:
1. Álvarez López, J., Blanco Ibarra F. [1995]: Con-tabilidad de gestión avanzada: planificación, con-
trol y experiencias prácticas. Madrid : Mc Graw-Hill
2. Berkau, C., Hirschmann, P. [1996]: Kostenorien-tiertes Geschäftsprozessmanagement. München : Franz Vahlen Verlag
3. Däumler, K.D., Grabe, J. [1995]: Kostenrechnung 3 : Plankostenrechnung. Herne/Berlin : Verlag Neue Wirtschafts Briefe
4. Däumler, K.D., Grabe, J. [1996]: Kostenrechnung 1: Grunallagen. Herne/Berlin : Verlag Neue Wirtschafts Briefe
5. Däumler, K.D., Grabe, J. [1997]: Kostenrechnung 2 : Deckungsbeitragsrechnung. Herne/Berlin : Ver-lag Neue Wirtschafts Briefe
6. Eschenbach, R. a kolektív [2000]: Controlling. Praha : Codex
7. Horváth, P. & Partner [2001]: Balanced Scorecard v praxi. Stuttgart : Schäffer-Poeschel Verlag
8. Horváth, P. [2004]: Nová koncepce controllingu – Cesta k účinnému controllingu. Praha : Profess Consulting
9. Klenger, F. [1989]: Operatives Controlling. Műnchen/Wien : R. Oldenbourg Verlag
10. Liberková L., Liberko, I., Dobrovič, J. [2007]: Environmental benchmarketing in small and me-dium - sized enterprises. In: Trends in the devel-opment of machinery and associated technology : 11th international research/expert conference, Hammamet, Zenica : Faculty of Mechanical Engi-neering, Tunisia, ISBN 978-9958-617-34-8, s. 467-470
11. Macík, K.[1999]: Kalkulace nákladů - základ pod-nikového controllingu. Ostrava : Montanex
12. Rajnoha, R. [1999]: Využitie target costingu v praxi, In: Manažment priemyselných podnikov a kvalita, CO-MAT-TECH '99, Zborník z medzinárodnej vedeckej konferencie, STU Trnava, s. 220 – 225
13. Rajnoha, R. [2001]: Kostenrechnung als Basis eines controllingsorientierten Führungskonzeptes. In: Manažment priemyselných podnikov, CO-MAT-TECH '2001, Zborník z medzinárodnej vedeckej konferencie, STU Trnava, s. 143 – 148
14. Rajnoha, R. [2002]: Strategický a operatívny kon-troling, VŠ skriptá, Zvolen : Bratia Sabovci, 137 s.
15. Rajnoha, R. [2003]: Trhovoorientované nákladové účtovníctvo a kalkulácie – možnosti ich uplatnenia v podniku drevospracujúceho priemyslu. Diz-ertačná práca, Zvolen : TU vo Zvolene, 155 s.
16. Rašner, J., Aláč, P., Rajnoha, R., Kotlínová, M. [1998]: Logistický systém realizácie drevodomu. Projekt, Zvolen : Bučina, a.s. Zvolen
17. Stanek, V. [2003]: Zvyšování výkonnosti proces-ním řízením nákladů. Praha : Grada
18. Vollmuth, H.,J. [1997]: Marktorientiertes Kos-tenmanagement: Neue Konzeptionen, Instrumente und Techniken zur Sicherung von Wettbew-erbsvorteilen
19. Planegg : WRS Wirtschaft, Recht und Steuern
114

УПРАВЛЕНИЕ И УСТОЙЧИВО РАЗВИТИЕ 2/2009(23) MANAGEMENT AND SUSTAINABLE DEVELOPMENT 2/2009(23)
ECONOMIC VALUE ADDED AS PERFORMANCE MEASURE IN SLOVAC
MANUFACTURERS
Jaroslava Kadarova1, Rastislav Rajnoha2, Jan Dobrovic3 1 Technical University of Kosice, Slovac Republic 2 Technical University of Zvolen, Slovac Republic 3 University of Presov in Presov, Slovac Republic
Abstract
Article deals with performance measure Economic Value Added. It is the financial performance measure that
comes closer than any other to capturing the true economic profit of an enterprise. Advantages and disadvantages of using Economic Value Added as a primary measure of performance as compared to sales, revenues, earnings, operating profit, profit after tax, and profit margin are investigated. The EVA calculation using data from com-pany’s income and balance sheet statements is illustrated.
Key words: performance measurement, Economic Value Added
Introduction In the early 90´s, value-based performance
measures, such as Economic Value Added have gained immense popularity. Economic Value Added, commonly known by its registered trademark EVA, is already used by more than 250 large companies. The literature reports that more and more large companies are deciding to adopt the EVA performance measure as the guid-ing principle for their corporate policy.
Frequently, EVA is regarded as a single, simple measure that gives a real picture of stockholder wealth creation. The reports claim that implementing an EVA policy triggers a com-pany’s stocks to rise and its leading managers to act more like owners. In addition to motivating managers to create shareholder value and being a basis for management compensation, value based performance measurement systems have further practical advantages.
An EVA system helps managers to make better investment decisions, identify opportuni-ties for improvement and consider short-term as well as long-term benefits for the company. Fur-thermore, studies suggest that EVA is an effec-tive measure of the quality of managerial deci-sions as well as a reliable indicator of a com-pany’s value growth in the future. In summary, constant positive EVA values over time will in-crease company value, while negative EVA im-plies value depreciation.
1. The goal of study
The goal of this study is to describe the calculation Economic Value Added for small manufacturers in Slovac republic, to determine
ways of using EVA and to analyze strengths and weaknesses of the EVA as the performance measure.
2. Material and methods
EVA, an acronym for Economic Value Added, is the registered trade name of Stern Stewart & Company for their version of a long-known and compelling concept called residual income. It is a new class of this concept. First introduced in the late 1980s, Stern Stewart’s EVA has generated considerable publicity and over 300 client adoptions to date, including ma-jor international corporations such as Coca-Cola, Eli Lilly. Siemens, in Germany, was Stern Stew-art's first client in Europe. EVA also has at-tracted competitors who offer related or compet-ing metrics. The resulting intense competition has been referred to as “metric wars” in the fi-nancial press.
EVA is a measurement tool that provides a clear picture of whether a business is creating or destroying shareholder wealth. EVA measures the firm’s ability to earn more than the true cost of capital. EVA combines the concept of residual income with the idea that all capital has a cost, which means that it is a measure of the profit that remains after earning a required rate of return on capital. If a firm’s earnings exceed the true cost of capital it is creating wealth for its shareholders.
Recognized by economists since the 1770s, residual income is based on the premise that, in order for a firm to create wealth for its owners, it must earn more on its total invested capital
115

Jaroslava Kadarova, Rastislav Rajnoha, Jan Dobrovic
than the cost of that capital. Notationally, resid-ual income (RI) for period t is:
1−×−= tttt CAPITALWACCNOPATRI (1)
To compute residual income, begin with net
operating profits after tax (NOPAT) and subtract the total cost of capital measured as the weighted-average cost of capital (WACC) times the total invested capital (CAPITAL).
NOPAT can be defined as a result of the fol-lowing formula:
( tEBITNOPAT −⋅= 1 ) (2)
where EBIT is Earnings Before Interest and t is tax rate. NOPAT includes both effect reached by using assets of a company and interest paid to creditors.
CAPITAL represents long term invested
capital. It is sum of equity and invested capital. The other way of defining capital is to summa-rize fixed assets and net working capital (net working capital = current assets – short term liabilities). Both approaches offer the same re-sults.
In EVA model Weighted Average Cost of Capital (WACC) is used for calculation of eco-nomic value added and as a discount rate trans-ferring future values of EVA to present value to the date of valuation.
( )CEr
CDtrWACC ed +−= 1 (3)
where: rd is the cost of debt
rd is interest for external capital provided t is income tax rate C is value of balance sum D is debt E is equity
A basic construction of EVA measure is
clear from following formula:
tttt WACCCNOPATEVA ×−= (4)
If EVA > 0 than we can say a company is
successful. This is the only case wealth of shareholders increases because they gain more than what their original investment was. The service to creditors is included there, too. In case
EVA = 0 a company produced just as much as it was invested and EVA < 0 leads to destroying of wealth of shareholders.
3. Chosen results
3.1. Calculation of Economic Value Added for small manufacturers
The proposed method to calculate Economic Value Added for small manufacturers contains five main steps. These steps are outlined below.
Step 1: Review the company’s financial
data Nearly all of the needed information to per-
form an EVA calculation can be obtained from the company’s income statements and balance sheets. Some of the needed information may also be included in the notes to financial state-ments. In many cases, the two most current years of data will be sufficient.
Step 2: Identify the company’s Capital (C) Generally Accepted Accounting Principles
(GAAP) are often misleading in describing a company’s real financial position. Because of this deficiency, Stewart proposes up to 164 adjust-ments to regain the real picture of a firm’s finan-cial performance.
The objective of these adjustments is to eliminate financing distortions in a company’s Net Operating Profit after Tax (NOPAT) and Capital. According to this approach, some ac-counting items such as costs for research and product development, restructuring charges, and marketing outlays are considered more as capital investments as opposed to expenses.
A company’s capital, C, is all of the money invested in the company. A company’s capital can be estimated by adding all debts (short-term or long-term) to owners’ equity. An alternative way, is to subtract all non-interest-bearing liabili-ties from total liabilities (or total assets).
Step 3: Determine the company’s Capital
Cost Rate (CCR) One major challenge of the Economic Value
Added calculation for a company is to estimate its capital cost. In fact, for a small company, estimating its capital costs is perhaps the hard-est part in the EVA calculation. Capital cost de-pends on the company’s financial structures, business risks, current interest level, and inves-tors’ expectation. A common method to identify
116

ECONOMIC VALUE ADDED AS PERFORMANCE MEASURE IN SLOVAC MANUFACTURERS
the cost of capital for a company is to calculate its weighted average cost of capital (WACC). The WACC is comprised of costs for all capital sources, such as bank debts, corporate bonds, and shareholder’s equity.
Unfortunately, the WACC calculation, al-though practical for large companies, is less practical for small companies. For instance, many small companies would have difficulty estimating their cost of debt because their debt is not traded publicly. In addition, they are not rated in Moody’s Bond Record. Estimating the cost of equity represents an even bigger chal-lenge. For large companies, the Capital Asset Pricing Model (CAPM) is a common method in estimating their cost of equity. CAPM postulates that the cost of equity is equal to the return on risk-free security plus a company’s systematic risk, called beta, multiplied by the market risk premium. For large publicly traded companies, betas are published regularly by services such as Value Line.
For small companies, since their betas are not published, regression analysis may be used in order to estimate their betas. The next obsta-cle in the capital cost estimation represents the determination of market risk premium. For large U.S. companies, the recommended market risk premium is 5 to 6 percent. For publicly traded small companies, the market risk premium is significantly higher with values around 14 per-cent. To our knowledge, a market risk premium for privately held companies with less than 100employees has not been published.
Taking into accounting these obstacles of estimating the cost of capital for a small com-pany, we propose a method derived from the WACC estimation and the CAPM model which has been adapted to the needs of small compa-nies. We call this estimated cost of capital cost rate CCR so as to discriminate between it and the WACC method commonly used for large companies. The CCR for a particular company can be estimated as follows: CCR = CCRDebt* (Debt/(Debt+Equity))(1-t)+ +CCREquity*(Equity/(Debt+Equity)) (5)
where t represents the company’s tax rate.
CCRDebt can be estimated as follows:
CCRDebt = Prime Rate + Bank Charges (6)
Where the average Bank Charges for small manufacturing companies with which we con-sulted was one to two percent per year.
CCREquity can be estimated as follows:
CCREquity = RF + RP (7)
where RF is the risk free investment rate
RP is the risk premium investment rate. RF can be estimated using a yield-to-
maturity rate for 10-year government bonds. In contrast, RP reflects the risk resulting from in-vesting in a company’s equity. The riskier the investment, the higher the RP.
Step 4: Calculate the company’s Net Oper-
ating Profit after Tax (NOPAT) NOPAT is a measure of a company’s cash
generation capability from recurring business activities and disregarding its capital structure. Some of the adjustments to NOPAT, although valid for a large company, are seldom applicable for a small firm. On the other hand, some of the adjustments applicable for a small company are seldom applicable for a large company. For ex-ample, some researchers observed that an owner-manager’s salary in a small business represents a much larger fraction of revenues that in a large company. Based on this observa-tion, we can assume that some of the owner-manager’s regard their relatively high salary as a part of their compensation for the money in-vested in company. To remove the distortion, an adjustment is needed. From the data given on the income statement, NOPAT was calculated as follows: NOPAT = Net Profit after Tax + Total Adjust-ments – Tax Savings on Adjustments (8)
Step 5: Calculate Economic Value Added Finally, the EVA can be calculated by sub-
tracting Capital Charge from NOPAT as follows: EVA = NOPAT – Capital Charge = = NOPAT – C ´ CCR (9)
If the EVA is positive, the company created
value for its owners. If the EVA negative, owner’s wealth was reduced.
117

Jaroslava Kadarova, Rastislav Rajnoha, Jan Dobrovic
3.2. Using of the Economic Value Added As a mnemonic device, Stern Stewart de-
scribes four main applications of EVA with four words beginning with the letter M:
- Measurement - Management system - Motivation - Mindset
I. Measurement EVA is the most accurate measure of corpo-
rate performance over any given period. Peter Drucker observed in the Harvard Business Re-view that EVA is a measure of "total factor pro-ductivity" whose growing popularity reflects the new demands of the information age.
In calculating EVA, we first make a number of adjustments to conventional earnings in order to eliminate accounting anomalies and bring them closer to true economic results. In contrast, EVA capitalizes research and development spending and amortizes it over an appropriate period. We make similar adjustments to the bal-ance sheet to get a more accurate accounting of the total capital invested in an enterprise in order to assess the proper capital charge. Stern Stew-art has identified more than 160 potential ad-justments in accounting earnings and balance sheets in areas such as inventory costing, depre-ciation, bad debt reserves, restructuring charges, and amortization of goodwill.
The basic idea of EVA is possible to find the main goal of a company that is maximalization of profit. However it does not mean book profit but economical profit. The difference between eco-nomical and book profit is that economical profit is the difference between revenues and eco-nomical costs, which are book costs and oppor-tunity costs and book profit is the difference between revenues and costs. Opportunity costs are resented by the amount of money lost by not investing sources to the best alternative use. Opportunity costs are in reality represented mainly by interests from equity capital including risk reward and sometimes lost wage, too. This relation is possible to describe in following way: Book profit = Revenues – Costs (10)
Economical profit = Total revenues from capital – Costs of capital (11)
This leads to the conclusion that economical
profit appears when its amount is higher than
book profit derived from average cost of capital invested both by creditors (cost interests) and owners – shareholders (opportunity costs). This is a basic idea of new measure – EVA.
II. Management System While simply measuring EVA can give com-
panies a better focus on how they are perform-ing, its true value comes in using it as the foun-dation for a comprehensive financial manage-ment system that encompasses all the policies, procedures, methods and measures that guide operations and strategy. The EVA system covers the full range of managerial decisions, including strategic planning, allocating capital, pricing ac-quisitions or divestitures, setting annual goals-even day-to-day operating decisions. In all cases, the goal of increasing EVA is paramount.
Managers in EVA companies learn that there are only three basic ways to increase value:
- increase the returns from the assets al-ready in the business by running the in-come statement more efficiently with-out investing new capital,
- invest additional capital and aggres-sively build the business so long as ex-pected returns on new investments ex-ceed the cost of capital,
- release capital from existing operations, both by selling assets that are worth more to others and by increasing the ef-ficiency of capital by such things as turning working capital faster and speeding up cycle times.
III. Motivation To instill both the sense of urgency and the
long-term perspective of an owner, Stern Stew-art designs cash bonus plans that cause manag-ers to think like and act like owners because they are paid like owners. Indeed, basing incen-tive compensation on improvements in EVA is the source of the greatest power in the EVA system. Under an EVA bonus plan, the only way managers can make more money for themselves is by creating even greater value for sharehold-ers. This makes it possible to have bonus plans with no upside limits. In fact, under EVA the greater the bonus for managers, the happier shareholders will be.
Most managers today have incentive com-pensation plans that put too much emphasis on compensation and too little on incentive. Bo-
118

ECONOMIC VALUE ADDED AS PERFORMANCE MEASURE IN SLOVAC MANUFACTURERS
nuses, whether meager or lavish, are earned by beating annually negotiated budgets. Under this system, a manager's greatest incentive is to negotiate an easily achievable budget-and, be-cause the bonus is capped, not to exceed it by too much for fear of raising expectations or damaging his or her credibility. EVA bonus tar-gets, in contrast, are automatically reset each year by formula. If EVA shoots up, for example, next year's bonus will be based on improvement above the new, higher level of EVA. What's more, we recommend "banking" a portion of extraordinary bonuses and paying them out over several years. Bonus banks make it possible to have "negative" bonuses when EVA drops sharply, and insure that bonuses are paid only for sustainable increases in EVA. With an unlim-ited upside and a bonus that is decoupled from the annual budget, EVA managers are motivated to go for home runs instead of settling for sin-gles, and to make investments with long-run payoffs. The EVA result is annual budgets that are driven by aggressive strategy instead of strategy that is constrained by modest budgets.
IV. Mindset When implemented in its totality, the EVA
financial management and incentive compensa-tion system transforms a corporate culture. By putting all financial and operating functions on the same basis, the EVA system effectively pro-vides a common language for employees across all corporate functions. EVA facilitates communi-cation and cooperation among divisions and de-partments, it links strategic planning with the operating divisions, and it eliminates much of the mistrust that typically exists between operations and finance. The EVA framework is, in effect, a
system of internal corporate governance that automatically guides all managers and employees and propels them to work for the best interests of the owners. The EVA system also facilitates decentralized decision making because it holds managers responsible for-and rewards them for-delivering value.
A key to wiring EVA into the corporate cul-ture is to make it the focal point for reporting, planning and decision making. To do that re-quires two things.
- The first is the recognition that, because EVA is a measure of total factor produc-tivity, it can and should supercede other financial and operating measures, result-ing in a hierarchical as opposed to a "balanced" scorecard. If EVA is merely added to a list of many other perform-ance measures, confusion and unneces-sary complexity will remain.
- The second requirement is that EVA be incorporated into decision making proc-esses. We have an enormous base of ex-perience in helping our clients to custom-ize and apply EVA to a vast range of de-cisions, inserting the methods into formal procedures, including budgeting and stra-tegic planning, and developing a family of exemplary case illustrations useful in training.
Strengths and Weaknesses of EVA Finally, to help you consider whether
economic profit is an appropriate performance metric for the company you are evaluating, we have discussed the following strengths and weaknesses (tab. 1).
Table 1. Strengths and Weaknesses of EVA
Strengths Weaknesses - If you had to rely on only one single performance
number, economic profit is probably the best because it contains so much information (mathematicians would call it "elegant"): economic profit incorporates balance sheet data into an adjusted income statement metric
- Economic profit works best for companies whose tangible assets (assets on the balance sheet) correlate with the market value of assets - as is often the case with mature industrial companies.
- Although some proponents argue economic profit is "all you need", it is very risky to depend on an single metric.
- The companies least suited for economic profit are high-growth, new-economy and high-technology companies, for whom assets are 'off balance sheet' or intangible.
Conclusion Stern Stewart developed EVA to help man-
agers incorporate two basic principles of finance
into their decision making. The first is that the primary financial objective of any company should be to maximize the wealth of its share-
119

Jaroslava Kadarova, Rastislav Rajnoha, Jan Dobrovic
holders. The second is that the value of a com-pany depends on the extent to which investors expect future profits to exceed or fall short of the cost of capital. By definition, a sustained increase in EVA will bring an increase in the market value of a company. This approach has proved effective in virtually all types of organiza-tions, from emerging growth companies to turn-arounds. This is because the level of EVA isn't what really matters. Current performance already is reflected in share prices. It is the continuous improvement in EVA that brings continuous in-creases in shareholder wealth.
EVA is both a measure of value and also a measure of performance. The value of a business depends on investor’s expectations about the future profits of the interprise. Stock prices track EVA far more closely than they track earnings per share or return on equity. A sustained increase in EVA will bring an increase in the market value of the company. As a performance measure, Economic Value Added forces the companz to make the creation of shareholder value the number one priority. Under the EVA approach stiff charges are incurred for the use of capital. EVA focused companies concentrate on improving the net cash return on invested capital.
Calculation of Economic Value Added for small manufacturers consists of five basic steps: review the company’s financial data, identify the company’s Capital (C), determine the company’s Capital Cost Rate (CCR), calculate the com-pany’s Net Operating Profit after Tax (NOPAT), and calculate Economic Value Added.
EVA can have four main applications, as: measurement, management system, motivation, and mindset.
The paper is a partial result of solving the grant re-search target - VEGA 1/0204/09.
References:
1. Horváth, P. [2004]: Nová koncepce controllingu – Cesta k účinnému controllingu. Praha : Profess Consulting.
2. Jahnátek, Ľ. - Mihok, J. - Kádárová, J. - Szabo, S. [2008]: Economic Value Added as an Effectiveness Measure. In: Acta Avionica, Košice, roč. X/2008 č. 15, s. 70-74. ISSN 1335-9479.
3. Kislingerová, E. [2000]: Using of the economic value added model for valuation of a company. Biatec, Vol. 8, No. 11,. pp. 38-39.
4. Klenger, F. [1989]: Operatives Controlling. Műnchen/Wien : R. Oldenbourg Verlag.
5. Rajnoha, R. [2001]: Kostenrechnung als Basis eines controllingsorientierten Führungskonzeptes. In: Manažment priemyselných podnikov, CO-MAT-TECH '2001, Zborník z medzinárodnej vedeckej konferencie, STU Trnava, s. 143 – 148.
6. Rajnoha, R. [2002]: Strategický a operatívny kontroling, VŠ skriptá, Zvolen : Bratia Sabovci, 137 s.
7. Roztocki, N. – Needy, K. L. [1998 ]: An Integrated Activity-Based Costing and Economic Value Added System as an Engineering Management Tool for Manufacturers. In: ASEM National Conference, , p. 77-84.
8. Sopková, E.: General consumption taxation from point of view of corporate induced costs. In: Súčasný vedecký vestník, časť: Ekonomika, 2007, č. 14 (22). Belgorod: Ruchaučkniga, s. 107-111. ISSN 1561-6886.
9. Stern, Joel M. [1996]: EVA and Strategic Performance Measurement, Global Finance 2000, The Conference Board, Inc.
10. Vidová J. [2003]: Activity Based Costing – metóda kalkulovania nákladov. In.: 6. medzinárodná vedecká konferencia - Trendy v systémoch riadenia podnikov, Herľany, pp. 260-265.
11. Vidová J.: Efektívnosť z pohľadu teórie obmedzenia. Transfer inovácií, No. 6, 2003, pp. 125-126.
12. Vidová, J. [2004]: Evaluation of the economical efficiency by means of EVA. In: 12. Medzinárodná vedecká konferencia CO-MAT-TECH 2004, MTF Trnava, ISBN 80-227-2117-4, s. 1483-1487.
13. Vidová, J. [2004]: Konštrukcia ukazovateľa EVA v slovenskom podniku. In: Medzinárodná vedecká konferencia „Ekonomika a manažment podnikov“, KPH Drevárska fakulta TU Zvolen, ISBN 80-228-1386-9, s.117-122.
120

УПРАВЛЕНИЕ И УСТОЙЧИВО РАЗВИТИЕ 2/2009(23) MANAGEMENT AND SUSTAINABLE DEVELOPMENT 2/2009(23)
POSSIBILITIES OF USING STRUCTURAL FUNDS EU FOR SLOVAK ENTERPRISES
Andrea Sujova1, Jan Dobrovic2 1 Technical University in Zvolen, Slovak Republic
2 University of Presov, Slovak Republic
Abstract
Slovak enterprises especially small and medium sized for being competitive on globalized european market need the modernization of their production and to achieve competitive advantages. The chance is to use financial support of structural funds EU. The paper is focused on possibilities of using structural funds EU for slovak enter-prises.
Key words: structural funds EU, financial support, small and medium enterprises, competitiveness
Introduction Member states of EU have opportunity tu
use financial support from structural funds EU. Structural funds are the main instrument of re-gional policy EU. Their main goal is to assist in reducing differences of economic level between member states and help to reach a higher com-petitiveness. Structural funds don´t support indi-vidual projects but programms of regional devel-opment prepared by regions, states and Euro-pean Commision. Programms are prepared ac-cording to common starting points proposed by European Commision for EU as whole.
The basic strategic document of the Slovak Republic for using the strucural funds EU is Na-tional Strategic Reference Framework (NSRF) for the period of 2007 – 2013. Current programme period of 2007 – 2013 is the first programme period during which the Slovak Republic will be able to draw from the EU funds in its entire dura-tion. The document known as the National Stra-tegic Reference Framework for the period of 2007 – 2013 (NSRF) provided the baseline for this drawing. This strategic document has been drawn up pursuant to the new regulations of the European Union (EU) for the Structural Funds and Cohesion Fund. The Government of the Slo-vak Republic approved the document on Decem-ber 6, 2006 and the European Commission on August 17, 2007.
1. Targets of Structural funds
The cohesion policy of the EU shall be real-ised through the concentration of the fund con-tributions for three main goals during the pro-gramme period of 2007 - 2013: Convergence, Regional competitiveness and employment, and European territorial cooperation. To keep the
concordance with the regulations, the NSRF SR comprises only of the first two goals.
1.1. Convergence Target Within the Convergence target, the financial
contributions from ERDF and ESF funds are pri-marily focused on the regions whose gross do-mestic product per capita during the last three years before the adoption of the new regulations was less than 75% of the average of the enlarged EU countries. In case of Slovakia it is the entire territory with the exception of the Bratislava region.
By financing from the Cohesion fund, the Cohesion target covers the member states whose gross national product during the last three years before the adoption of the regula-tions was below 90% of the average of the enlarged EU countries and the countries that have the convergence programme. These criteria have been met on the entire territory of the Slo-vak Republic.
1.2. Regional competitiveness and employ-ment Target
Areas not falling within the target of Con-vergence (Bratislava region, in case of Slovakia) are eligible to draw financial support within the target of Regional competitiveness and employ-ment. The target aims at strengthening competi-tiveness and making Bratislava region more at-tractive through anticipating economic and social changes and supporting innovations, knowledge-based society, business-spirit, environmental protection and risk prevention, support for em-ployees and companies adaptability and devel-opment of the labour markets oriented on the social inclusion.
121
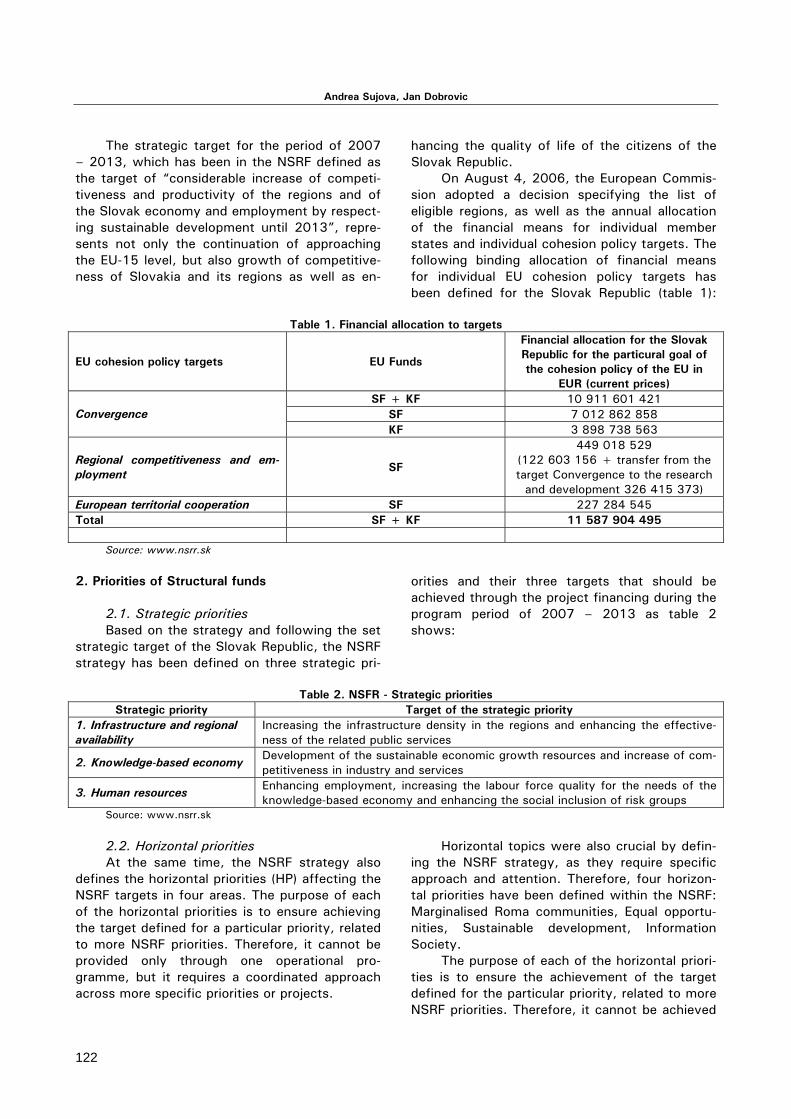
Andrea Sujova, Jan Dobrovic
The strategic target for the period of 2007 – 2013, which has been in the NSRF defined as the target of “considerable increase of competi-tiveness and productivity of the regions and of the Slovak economy and employment by respect-ing sustainable development until 2013”, repre-sents not only the continuation of approaching the EU-15 level, but also growth of competitive-ness of Slovakia and its regions as well as en-
hancing the quality of life of the citizens of the Slovak Republic.
On August 4, 2006, the European Commis-sion adopted a decision specifying the list of eligible regions, as well as the annual allocation of the financial means for individual member states and individual cohesion policy targets. The following binding allocation of financial means for individual EU cohesion policy targets has been defined for the Slovak Republic (table 1):
Table 1. Financial allocation to targets
EU cohesion policy targets EU Funds
Financial allocation for the Slovak Republic for the particural goal of the cohesion policy of the EU in
EUR (current prices) SF + KF 10 911 601 421
SF 7 012 862 858 Convergence KF 3 898 738 563
Regional competitiveness and em-ployment SF
449 018 529 (122 603 156 + transfer from the target Convergence to the research
and development 326 415 373) European territorial cooperation SF 227 284 545 Total SF + KF 11 587 904 495
Source: www.nsrr.sk
2. Priorities of Structural funds 2.1. Strategic priorities Based on the strategy and following the set
strategic target of the Slovak Republic, the NSRF strategy has been defined on three strategic pri-
orities and their three targets that should be achieved through the project financing during the program period of 2007 – 2013 as table 2 shows:
Table 2. NSFR - Strategic priorities
Strategic priority Target of the strategic priority 1. Infrastructure and regional availability
Increasing the infrastructure density in the regions and enhancing the effective-ness of the related public services
2. Knowledge-based economy Development of the sustainable economic growth resources and increase of com-petitiveness in industry and services
3. Human resources Enhancing employment, increasing the labour force quality for the needs of the knowledge-based economy and enhancing the social inclusion of risk groups
Source: www.nsrr.sk 2.2. Horizontal priorities At the same time, the NSRF strategy also
defines the horizontal priorities (HP) affecting the NSRF targets in four areas. The purpose of each of the horizontal priorities is to ensure achieving the target defined for a particular priority, related to more NSRF priorities. Therefore, it cannot be provided only through one operational pro-gramme, but it requires a coordinated approach across more specific priorities or projects.
Horizontal topics were also crucial by defin-ing the NSRF strategy, as they require specific approach and attention. Therefore, four horizon-tal priorities have been defined within the NSRF: Marginalised Roma communities, Equal opportu-nities, Sustainable development, Information Society.
The purpose of each of the horizontal priori-ties is to ensure the achievement of the target defined for the particular priority, related to more NSRF priorities. Therefore, it cannot be achieved
122
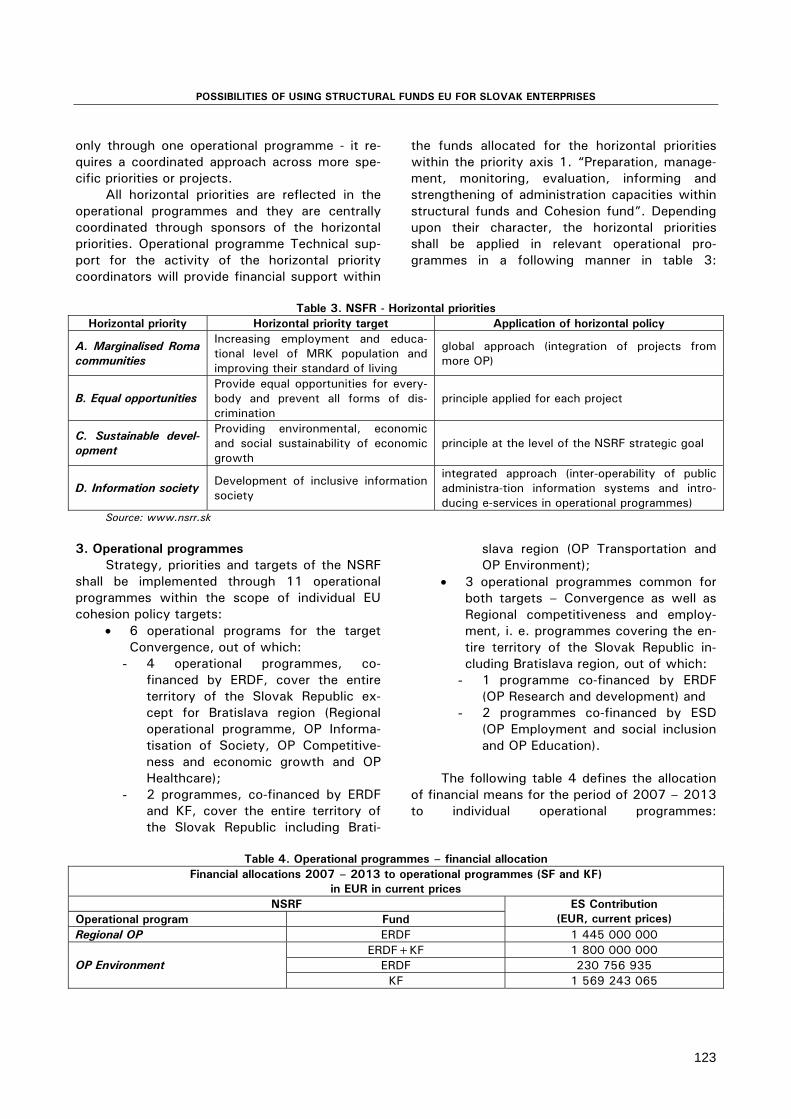
POSSIBILITIES OF USING STRUCTURAL FUNDS EU FOR SLOVAK ENTERPRISES
only through one operational programme - it re-quires a coordinated approach across more spe-cific priorities or projects.
All horizontal priorities are reflected in the operational programmes and they are centrally coordinated through sponsors of the horizontal priorities. Operational programme Technical sup-port for the activity of the horizontal priority coordinators will provide financial support within
the funds allocated for the horizontal priorities within the priority axis 1. “Preparation, manage-ment, monitoring, evaluation, informing and strengthening of administration capacities within structural funds and Cohesion fund”. Depending upon their character, the horizontal priorities shall be applied in relevant operational pro-grammes in a following manner in table 3:
Table 3. NSFR - Horizontal priorities
Horizontal priority Horizontal priority target Application of horizontal policy
A. Marginalised Roma communities
Increasing employment and educa-tional level of MRK population and improving their standard of living
global approach (integration of projects from more OP)
B. Equal opportunities Provide equal opportunities for every-body and prevent all forms of dis-crimination
principle applied for each project
C. Sustainable devel-opment
Providing environmental, economic and social sustainability of economic growth
principle at the level of the NSRF strategic goal
D. Information society Development of inclusive information society
integrated approach (inter-operability of public administra-tion information systems and intro-ducing e-services in operational programmes)
Source: www.nsrr.sk
3. Operational programmes Strategy, priorities and targets of the NSRF
shall be implemented through 11 operational programmes within the scope of individual EU cohesion policy targets:
• 6 operational programs for the target Convergence, out of which:
- 4 operational programmes, co-financed by ERDF, cover the entire territory of the Slovak Republic ex-cept for Bratislava region (Regional operational programme, OP Informa-tisation of Society, OP Competitive-ness and economic growth and OP Healthcare);
- 2 programmes, co-financed by ERDF and KF, cover the entire territory of the Slovak Republic including Brati-
slava region (OP Transportation and OP Environment);
• 3 operational programmes common for both targets – Convergence as well as Regional competitiveness and employ-ment, i. e. programmes covering the en-tire territory of the Slovak Republic in-cluding Bratislava region, out of which:
- 1 programme co-financed by ERDF (OP Research and development) and
- 2 programmes co-financed by ESD (OP Employment and social inclusion and OP Education).
The following table 4 defines the allocation
of financial means for the period of 2007 – 2013 to individual operational programmes:
Table 4. Operational programmes – financial allocation
Financial allocations 2007 – 2013 to operational programmes (SF and KF) in EUR in current prices
NSRF Operational program Fund
ES Contribution (EUR, current prices)
Regional OP ERDF 1 445 000 000 ERDF+KF 1 800 000 000
ERDF 230 756 935 OP Environment KF 1 569 243 065
123

Andrea Sujova, Jan Dobrovic
(continued) ERDF+KF 3 206 904 595
ERDF 877 409 097 OP Transportation KF 2 329 495 498
OP Informatisation of Society ERDF 993 095 405 OP Research and development ERDF 1 209 415 373 OP Competitiveness and economic growth ERDF 772 000 000
OP Healthcare ERDF 250 000 000 OP Technical assistance ERDF 97 601 421 OP Bratislava region ERDF 87 000 000 ESF OP Employment and social inclusion ESF 881 801 578 OP Education ESF 617 801 578 All the NSRF funds 2007 - 2013 together 11 360 619 950 Total ERDF 5 962 278 231 Total KF 3 898 738 563 Total ESF 1 499 603 156 EAFRD (European Agricultural Fund for Rural Development) 1 969 418 078 EFF (European Fisheries Fund) 13 688 528
Source: www.nsrr.sk
4. Possibility of using the structural funds EU by slovak private enterprises
Financial means in particular operational programmes can be required by authorized appli-cant according to determined rules of NSRF. Authorized applicant can be state or public insti-tution, municipality or private enterprise.
Private enterprises are allowed to require non-recurring financial means from following 8 operational programmes and their priority axes:
Competitiveness and economic growth
The global target of this operational pro-gramme is to provide sustainable economic growth and employment.
Priority axes: 1. Innovations and competitiveness growth
– projects focused on these activities: innova-tions and technologic transfers, support of com-mon services for enterpreneurs, support of inno-vation activities in enterprises.
2. Energetics – projects dealing with in-creasing of energetic effectivity in production and consuption and implementation of progres-sive technologies in energetics.
3. Tourism – projects for support of enter-prising activities in tourism.
Employment and social inclusion
The operational programme aims at the growth of employment, social inclusion (incorpo-ration) and creation of capacities. Due to the low flexibility and effectiveness of employees in dif-
ferent spheres of the public administration sec-tor, as well as due to the necessity to improve the quality of policy creation, the operational programme will support activities focused on the improvement of human capital quality and activi-ties oriented on good policy creation.
Priority axes: 1. Support of employment growth – pro-
jects focused on employment support – job crea-tion and maintaning and solving long term unem-ployment.
2. Support of social inclusion – projects dealing with support of social inclusion of per-sons endagered by social exclusion through de-velopment of care services in special regard to Roma communities; support of creating equal opportunities in labour market access in special regard to Roma community.
Education
The global target of the OP Education is to pro-vide long-term competitiveness of the Slovak Republic by means of adapting the educational system to the needs of a knowledge-based economy. Through the ESF contributions, the operational programme shall finance the creation and support of human capital towards acquiring basic skills and key competences required by the knowledge-based economy as well as by the labour market.
Priority axes: 1. Reform of education system – project
focused on activities: change of traditional
124
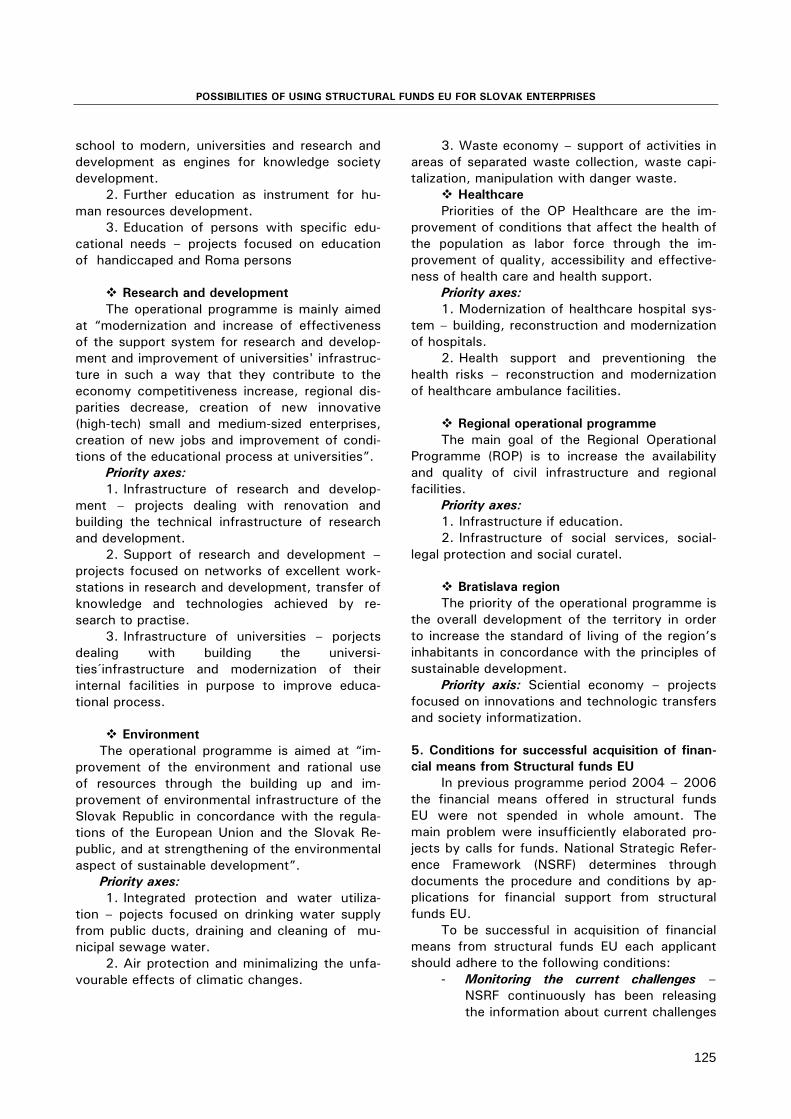
POSSIBILITIES OF USING STRUCTURAL FUNDS EU FOR SLOVAK ENTERPRISES
school to modern, universities and research and development as engines for knowledge society development.
2. Further education as instrument for hu-man resources development.
3. Education of persons with specific edu-cational needs – projects focused on education of handiccaped and Roma persons
Research and development
The operational programme is mainly aimed at “modernization and increase of effectiveness of the support system for research and develop-ment and improvement of universities' infrastruc-ture in such a way that they contribute to the economy competitiveness increase, regional dis-parities decrease, creation of new innovative (high-tech) small and medium-sized enterprises, creation of new jobs and improvement of condi-tions of the educational process at universities”.
Priority axes: 1. Infrastructure of research and develop-
ment – projects dealing with renovation and building the technical infrastructure of research and development.
2. Support of research and development – projects focused on networks of excellent work-stations in research and development, transfer of knowledge and technologies achieved by re-search to practise.
3. Infrastructure of universities – porjects dealing with building the universi-ties´infrastructure and modernization of their internal facilities in purpose to improve educa-tional process.
Environment The operational programme is aimed at “im-
provement of the environment and rational use of resources through the building up and im-provement of environmental infrastructure of the Slovak Republic in concordance with the regula-tions of the European Union and the Slovak Re-public, and at strengthening of the environmental aspect of sustainable development”.
Priority axes: 1. Integrated protection and water utiliza-
tion – pojects focused on drinking water supply from public ducts, draining and cleaning of mu-nicipal sewage water.
2. Air protection and minimalizing the unfa-vourable effects of climatic changes.
3. Waste economy – support of activities in areas of separated waste collection, waste capi-talization, manipulation with danger waste.
Healthcare Priorities of the OP Healthcare are the im-
provement of conditions that affect the health of the population as labor force through the im-provement of quality, accessibility and effective-ness of health care and health support.
Priority axes: 1. Modernization of healthcare hospital sys-
tem – building, reconstruction and modernization of hospitals.
2. Health support and preventioning the health risks – reconstruction and modernization of healthcare ambulance facilities.
Regional operational programme
The main goal of the Regional Operational Programme (ROP) is to increase the availability and quality of civil infrastructure and regional facilities.
Priority axes: 1. Infrastructure if education. 2. Infrastructure of social services, social-
legal protection and social curatel.
Bratislava region The priority of the operational programme is
the overall development of the territory in order to increase the standard of living of the region’s inhabitants in concordance with the principles of sustainable development.
Priority axis: Sciential economy – projects focused on innovations and technologic transfers and society informatization.
5. Conditions for successful acquisition of finan-cial means from Structural funds EU
In previous programme period 2004 – 2006 the financial means offered in structural funds EU were not spended in whole amount. The main problem were insufficiently elaborated pro-jects by calls for funds. National Strategic Refer-ence Framework (NSRF) determines through documents the procedure and conditions by ap-plications for financial support from structural funds EU.
To be successful in acquisition of financial means from structural funds EU each applicant should adhere to the following conditions:
- Monitoring the current challenges – NSRF continuously has been releasing the information about current challenges
125
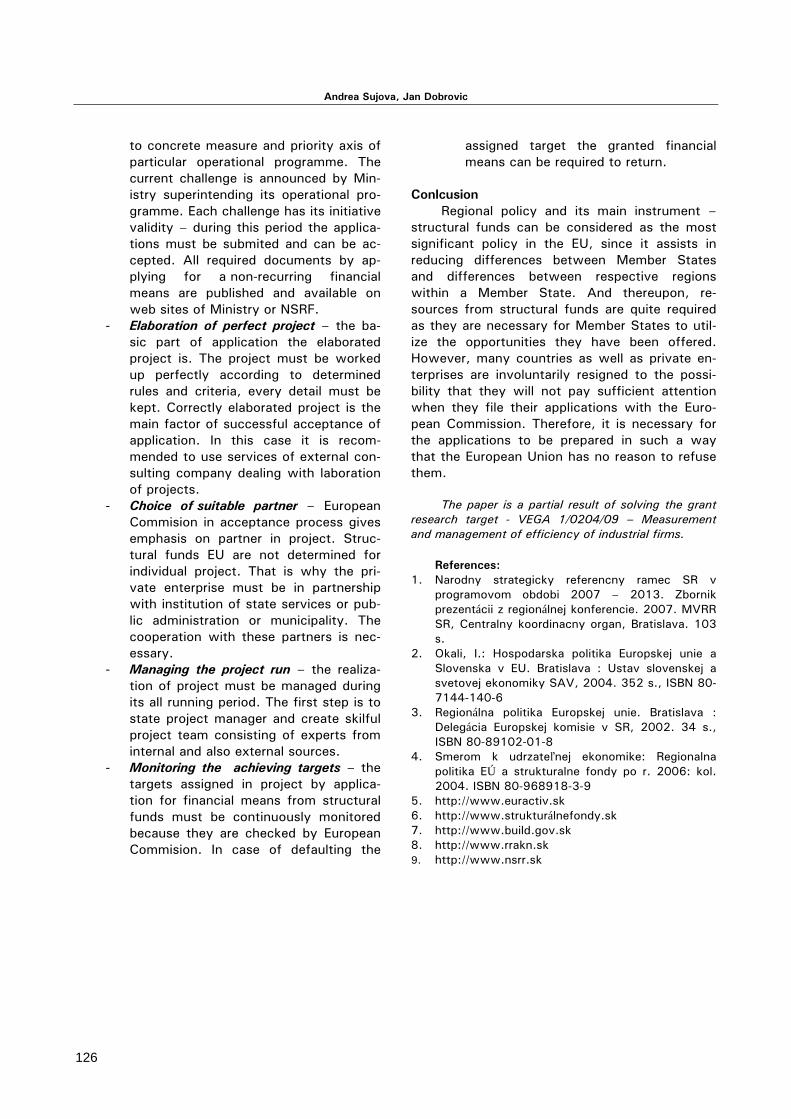
Andrea Sujova, Jan Dobrovic
to concrete measure and priority axis of particular operational programme. The current challenge is announced by Min-istry superintending its operational pro-gramme. Each challenge has its initiative validity – during this period the applica-tions must be submited and can be ac-cepted. All required documents by ap-plying for a non-recurring financial means are published and available on web sites of Ministry or NSRF.
- Elaboration of perfect project – the ba-sic part of application the elaborated project is. The project must be worked up perfectly according to determined rules and criteria, every detail must be kept. Correctly elaborated project is the main factor of successful acceptance of application. In this case it is recom-mended to use services of external con-sulting company dealing with laboration of projects.
- Choice of suitable partner – European Commision in acceptance process gives emphasis on partner in project. Struc-tural funds EU are not determined for individual project. That is why the pri-vate enterprise must be in partnership with institution of state services or pub-lic administration or municipality. The cooperation with these partners is nec-essary.
- Managing the project run – the realiza-tion of project must be managed during its all running period. The first step is to state project manager and create skilful project team consisting of experts from internal and also external sources.
- Monitoring the achieving targets – the targets assigned in project by applica-tion for financial means from structural funds must be continuously monitored because they are checked by European Commision. In case of defaulting the
assigned target the granted financial means can be required to return.
Conlcusion
Regional policy and its main instrument – structural funds can be considered as the most significant policy in the EU, since it assists in reducing differences between Member States and differences between respective regions within a Member State. And thereupon, re-sources from structural funds are quite required as they are necessary for Member States to util-ize the opportunities they have been offered. However, many countries as well as private en-terprises are involuntarily resigned to the possi-bility that they will not pay sufficient attention when they file their applications with the Euro-pean Commission. Therefore, it is necessary for the applications to be prepared in such a way that the European Union has no reason to refuse them.
The paper is a partial result of solving the grant
research target - VEGA 1/0204/09 – Measurement and management of efficiency of industrial firms.
References:
1. Narodny strategicky referencny ramec SR v programovom obdobi 2007 – 2013. Zbornik prezentácii z regionálnej konferencie. 2007. MVRR SR, Centralny koordinacny organ, Bratislava. 103 s.
2. Okali, I.: Hospodarska politika Europskej unie a Slovenska v EU. Bratislava : Ustav slovenskej a svetovej ekonomiky SAV, 2004. 352 s., ISBN 80-7144-140-6
3. Regionálna politika Europskej unie. Bratislava : Delegácia Europskej komisie v SR, 2002. 34 s., ISBN 80-89102-01-8
4. Smerom k udrzateľnej ekonomike: Regionalna politika EÚ a strukturalne fondy po r. 2006: kol. 2004. ISBN 80-968918-3-9
5. http://www.euractiv.sk 6. http://www.strukturálnefondy.sk 7. http://www.build.gov.sk 8. http://www.rrakn.sk 9. http://www.nsrr.sk
126

УПРАВЛЕНИЕ И УСТОЙЧИВО РАЗВИТИЕ 2/2009(23) MANAGEMENT AND SUSTAINABLE DEVELOPMENT 2/2009(23)
PROBLEMS IN FORMING OF COMMUNICATIVE FOREIGN LANGUAGE COMPETENCE
OF STUDENTS-ECONOMISTS IN THE PROCESS OF PROFESSIONAL TRAINING
Nataliya Razenkova Ukrainian State University of Finance and International Trade, Kyiv, Ukraine
Abstract
The problem of another language communicative professional competence of students- economists is trying
to be investigated in the article. The peculiarities concerning requirements of modern Ukrainian and world economy are linked with the features of the high education system.
Key words: competence, mastership, inter-subject links, high level, professional self-realization On the modern stage of Ukrainian economic
development the problems of forming of eco-nomic culture, reorientation and essential perfec-tion of high education of a future specialist have appeared.
The sense of special economic training has to mean the guarantee of formation and devel-opment of a corresponding level of economic enlightenment, bringing up, thinking, and as an integrated result- achievement of economic cul-ture of future specialists in economic sphere.
Such kind of culture covers a wide range of economic activity: from students’ mastering the system of professional knowledge to their forma-tion of essential public norms of economic be-havior that expresses itself the level of students’ economic development. The necessity of forma-tion of professional communicative competence in the system of high economic education is de-termined with the laws, principles and peculiari-ties of functioning Ukrainian economy, rising management role in enterprising activities and high importance of human’s factor in the man-agement of social- political, economic and social- psychological processes in enterprises.
During students’ getting economic educa-tion in high educational establishments imperfect understanding of importance and absence of purposeful forming of economic culture with the aim of making professional activity in the market conditions take place. There is an insufficient level of formation of professional communicative competence in the process of studying profes-sional disciplines with help of subjective- active pedagogical technologies and methodic. There is not enough attention for creative abilities profes-sional intellect and thinking. Students have a rather low level of system practical thinking to-wards solving professional problems.
The modern practice of economic activity determines the new approaches to the system of high education that includes creative use of gen-eral and professional students’ intellect in their study, purposeful forming and developing eco-nomic thinking among future specialists of eco-nomic sphere. The aims, tasks, principles, orga-nizing and methodical base in forming of eco-nomic thinking for communicative competence must be clearly defined.
In the conditions of development of Ukraine, deep and progressive changes are made in all lively important spheres of our society, support ideas of Bologna process and the dynamic ref-ormation of the system of high education. The present priorities in the state policy in educa-tional sphere, especially economic one, are ori-ented for training economists with high intellec-tual potential, developed special competence, able to be self-realized and self-developed, that is declared in Ukrainian law “About High Educa-tion” (2001). Ensuring of solving based strategic task can be only realized by the specialist who has developed abilities and skills and essential mastering (foreign) communicative competence, as knowledge of norms and rules of professional communication on the international level, owning its technologies, the item of which is the term “ communicating personal potential”, that is a necessary condition of its realization.
This problem stays to be not enough inves-tigated towards a future specialist of economic institutes considering modern requirements, spe-cifics of education in conditions of the other lin-gual informatization and approach in training specialists according the ideas of Bologna proc-ess. It has been tried to work with by a lot of scientists and specialists (V. Adolf, E. Isayev, T. Brazhe, D. Hymse), but must continued to be researched as the development of ma
127

Nataliya Razenkova
Defining the sense of foreign language pro-fessional communicative competence as a mas-tership to solve professional tasks with the help of foreign language communicative means, it is necessary to light out the main problems of these abilities that students have to get. In prac-tical pre-training of specialists- economists there is inessential developing of the mentioned ques-tion in:
- a low another lingual school level of pu-pils’ knowledge;
- very limited including modern productive communicative methods into the proc-ess of education;
- low motivation of students- economists for getting another lingual communica-tive knowledge;
- absence of the permanent system in us-ing methods and means of training stu-dents with domination of reading- trans-lating methods of work;
- necessity of a high- quality specialist of economic profile and inessential level of the communicative base;
- professional approach of foreign lan-guage educational program (inter-subject links) [1];
- absence of scientifically determined sense of forming of a professional communicative another lingual compe-tence of specialists- economists and the necessity of its including into the sys-tem of professional training in the eco-nomic sphere.
So, the main contradiction is between high requirements of students’ mastering the essential level of the communicative (foreign language) professional competence and the real level of their training. This contradiction emphasizes the actuality of the problem and determines the ne-cessity of searching answers on certain ques-tions:
- how to link achievements of essential level of (another lingual) communicative competence of the modern student with his psychological and pedagogical pre- training
- which possibilities a high educational establishment has towards systematic forming and developing (foreign lan-guage) professional competence of a student including economic orientation
- which conceptual pedagogical principles are better to use for training students’ professional communicative competence
- how to provide a high motivation in training a lingual theory from the first days of students’ study at economic university.
Students differ with high interest in the questions of developing personal self- realization, their work in perfection of communicative skills, their opinions of wok sense and benefit, imagina-tion about conditions, objects, character of fu-ture work, necessary knowledge and qualifica-tions for professional duties. Theoretical lessons of communicative theory must be held, concern-ing students- economists, where they will be able to get new knowledge, check old one, and fill the gaps. It should be deep and systematic that considers all modern requirements and help students to achieve a new scientific worldview according communicative peculiarities. Students will understand a communicative activity as a system with certain parts; know links between them and laws of the system. The knowledge does not have to be isolated from students, but becomes an organic part of their worldview. The teacher with an orientation into economic activ-ity must more emphasize students’ emotional moments educating their intellect. The material should be clear, certain, bright and sensitive [2].
It must be provided the problems of offered material that requires students’ self- solving questions and changing opinions. Students’ crea-tive abilities should be used. They are to be stimulated in self- mastering scientific literature, preparing reports, participating in conferences with the aim of expressing their points of view, public performing. For developing communicative skills students must be able to organize oral speech, build phrases properly, lead a mono-logue, and vary stylistic devices and methods of communication. It is useful to organize work in groups, diversify it and make productive from the point of forming communicative skills more interesting and dynamical. The whole complex of organization of pedagogical communication can be expressed in three forms: individual and col-lective work, work in pares and work in small groups.
Division is made according the level of self- work or cooperation with a group and a number of its members.
Forming of students’ communicative pro-fessional skills of high economic universities ex-
128

PROBLEMS IN FORMING OF COMMUNICATIVE FOREIGN LANGUAGE COMPETENCE OF STUDENTS-…
presses a wide time process that expects holding a detail search of the state of students’ commu-nicative professional competence (concerning foreign languages), adaptation of expected spe-cific training material to students needs, recog-nizing the system of communicative qualifying methods, organization of communicative profes-sional ( economic) students’ training and perfec-tion of communicative teaching mastering, diag-nostics of the level of students’ communicative professional skills. Theoretical pre- training, prac-tical using knowledge, economic specialization with communicative professional character in training, dialogical character in relations of par-
ticipants, expectation to solve together profes-sional tasks with the help of professional (foreign language) communication, presentation of differ-ent forms of communication provide spreading and deep in mental potential, forming skills, crea-tive search.
References:
1. Kovalchuk V. Scientific referate/ Pedagogical con-ditions forming professional thinking of future specialists of economic sphere in high educational establishments, Kyiv 2007, p.2.
2. Kruchek W. Scientific referate/Forming communi-cative students’ skills, Kyiv 2007, p.34-35.
129

УПРАВЛЕНИЕ И УСТОЙЧИВО РАЗВИТИЕ 2/2009(23) MANAGEMENT AND SUSTAINABLE DEVELOPMENT 2/2009(23)
WORLD FINANCIAL CRISIS: CONSEQUENCES FOR THE CIS’s AGRIMARKET
Olena Lytvyn Taras Shevchenko University, Kyiv, Ukraine
Abstract
The article deals with the consequences of the world financial crisis for the CIS’s agricultural market. The au-
thor focuses on the main problems of the CIS such as collapse of exchange markets, decreasing of prices for raw material commodities including grains, deficit of financial funds and crisis-proof package of laws and instruments for support of the agro industrial complex.
Key words: global financial crisis, agrimarket, prices, export, import. All segments of agro industrial complexes of
CIS countries have already received the conse-quences of the world financial crisis. Collapse of exchange markets, reduction in prices for main agricultural commodities, deficit of financial funds are one of the main problems of the CIS.
Since the CIS came out of the economic crisis of 1998/99 MY, the demand for high value and processed food products has been surging, largely because of rising consumer income. The food demand growth has in turn substantially increased agro-food imports. Another important and more recent development has been the jump in world food prices, which has hit the CIS strongly (along with most other countries in the world). The rise in food prices in the short run has mitigated the longer term growth in food demand and hurt consumers. Russia, Ukraine and Kazakhstan are major importers of meat and nontrivial exporter of grain and sunflower seed.
2000 was the first year since the CIS began economic transition that consumer income rose, and since that year income in real terms has more than doubled. The surge in income has re-sulted in growing demand for food, especially high value products. Because the CIS food proc-essing industry has had difficulty competing with imports on both quality and price, much of this demand has been met by imports. For example, the value of Russia’s agro-food imports has risen from $7 billion in 2000 to a projected $35 billion in 2008 [2].
In the past few years, the U.S. dollar has depreciated substantially against most currencies in the world. The depreciation raises the price competitiveness of U.S. agro-food exports to the CIS vis-à-vis both the CIS producers and U.S. export competitors. Since 2005, world agricul-tural and food prices have risen substantially, especially for staple products such as grain and
rice [6]. In the middle of 2007 the price growth for grains stopped for a while but it started in-creasing again till spring 2008 (Figure 1). The price surge has strongly affected the CIS, where since 2007 consumer food prices have risen by about 35 percent. The price growth has reduced food demand and correspondingly demand for food imports in volume terms, though because of higher prices, the CIS agro-food imports can in-crease in nominal value terms.
Fig.1. Futures price on the world grain market, 2004-2009
The world financial crisis, following decreas-
ing of prices for raw material commodities in-cluding grains, could limit grain exports from Russia and cause default of previously concluded contracts. According to the estimate of the Min-istry of Agriculture, in 2009 grain year, Russia was able to export 20-25 mln tonnes of grain, but the export strongly depended on the domes-tic prices and willingness of agricultural growers to decrease grain prices. Agricultural growers could find rescue in grain selling to the state in-tervention fund, because now state prices be-came higher than export ones. The efficiency of export operations decreased due to increasing costs of financing in future, caused by the world financial crisis [4].
130

Olena Lytvyn
Russian processing enterprises almost stopped sunseed purchases at the end of 2008 in conditions of financial crisis. Agricultural pro-ducers stored all harvested sunflower. Russian processors protracted sunflower purchases due to absence of circulating assets. At the same time, many companies-processors had to merge to oppose to bankruptcy. In 2008 Russia har-vested nearly 7 mln tonnes of sunflower, up 1.5 mln tonnes compared to the previous year. Such increase was achieved by rise of the oilseed yield. At the same time, processing capacities in Russia totaled 11 mln tonnes. But the main issue of the industry was a selling problem, not proc-essing.
President of Russia decided to create the fund in the structure of the Eurasian Economic community for overcoming of crisis conse-quences. He charged the government to make offers of foundation the joint fund in the struc-ture of the Eurasian Economic Community for assistance in overcoming of the world economic crisis consequences. The agreement concerning the foundation of the fund at the rate of 10 bln USD was reached during the informal meeting of the presidents of Russia, Armenia, Kazakhstan, Kyrgyzstan and Tajikistan in Kazakhstan on De-cember 19-21, 2008.
The crisis-proof package of laws for support of the agro industrial complex of Russia allowed both stabilization and growth of the sector in Russia in 2009. In the terms of the crisis, the government supported agricultural growers and even strived for the increase of production vol-umes in 2009. In 2008 the complex reached rather high results, including opportune realiza-tion of the complex of anticrisis measures, the increase of state intervention purchases, the re-cord level of grain harvest and the growth of la-bour productivity. At the same time, the agro industrial complex heavily depended on the state support and credits. That is why, even in the beginning of 2009 the government planned to take measures to allow to the agricultural sector to increase own development rates, including compensating for growing prices for mineral fer-tilizers, diesel oil and mixed fodder. The govern-ment increased the authorized capital stock of Russian Agricultural Bank to provide appropriate intervention grain purchases. Till April 1, 2009 the governmental intervention purchases reached the level of 20 mln tonnes. The crediting vol-umes of the agricultural sector in 2009 totaled nearly 866 bln RUR [4].
In January 2009 the government provided 7 bln RUR from the federal budget to finance credit interest rates, received for development of meat and dairy cattle-breeding, in the size of 100% of the refinancing rate of the Central Bank. Also the government provided another 10 bln USD for financing of credit interest rates in other direc-tions in the size of 80% of the refinancing rate of the Central Bank. To date, the government also worked over the issue concerning the fund-ing of banks for existing investment projects in the agro industrial complex. From the beginning of the year, Rosselhosbank and Vneshtorgbank had increased the crediting volumes of agro in-dustrial enterprises and organizations. In 2009, the government increased the authorized capital stock of Rosselhosbank by 45 bln RUR.
Despite the world financial crisis Kazakh-stan receives high demand for own products and food prices increased in October 2008. Wheat and other products increased in prices and started to bring profits to agricultural growers. In 2008 Kazakhstan increased domestic production of oilseeds and sugar-beet to prevent expensive imports of the products, which often causes in-flation processes on the domestic market of the country.
According to the data of the Ministry of Fi-nances of Kazakhstan, in November, 2008, the grain export volumes from the country totaled 424.000 tonnes, an increase of 1.3% compared to exports in October, 2008, and down 44.1% compared to November, 2007. Wheat share to-taled 94.7% from the general export volume. During January-December of 2008, the volume of the gross agricultural production in Kazakh-stan totaled 10.86 bln USD at current prices, a decrease of 5.6% compared to January-December period of 2007. But during January-December of 2008, the general volume of indus-trial production in Kazakhstan totaled 84.05 bln USD at current prices, up 2.1% compared to January-December period of 2007. According to the Ministry of Finances of Kazakhstan, during the period, the foreign trade turnover of the country totaled 101.2 bln USD, up 39.9% com-pared to January-December of 2007, including exports – 66.95 bln USD, up 57.2%, imports – 34.26 bln USD, up 15.1% [1].
Ukrainian agrarians tried to stir up selling of agricultural products at the end of 2008. The situation was caused by the financial crisis: banks did not give credits and agrarians had to increase own funds through selling of agricultural
131

WORLD FINANCIAL CRISIS: CONSEQUENCES FOR THE CIS’s AGRIMARKET
products. At the same time, agrarians offered for sales mainly grains and preferred to restrain sun-seed sales in order to wait for improving of price situation on the oilseeds market in winter. But despite agricultural producers’ deeds, both grains and oilseeds continued to keep low rates of trad-ing activity due to insufficient volumes of buyers purchasing capacity.
Ukraine faced the main problems in the bank sector in February-March of 2009 that in-fluenced much on the agricultural sector. In 2009 banks had to decrease own costs, intro-duce new mechanisms of restructuring, find new strategic partners. Large-scale and middle banks with foreign investments and developed retail crediting services received larger number of problems compared to captive banks with limited circle of owners. Due to the devaluation of UAH rate banks faced the essential problems during repayments of currency credits. Methods of re-structuring were not able to grade the risks.
In such a way, several Ukrainian banks signed the memorandum of cooperation in the terms of the financial crisis. The heads of seven large-scale banks – Brokbusinessbank, Credit-prombank, Rodovid Bank, Ukrgazbank, Ukrprom-bank, Finances & Credit and VAB Bank – ap-pended their signatures in the document. The parties agreed to coordinate own efforts in the work with problem credits, to renew crediting of economics and population, resume the effective work of the interbank market [1].
The country lost the confidence of investors in catastrophic rates. Ukraine became the global leader of the fall of commercial production, the growth of inflation, the devaluation of the na-tional currency and the fall of stock index. Ac-cording to the data of the United Nations ex-perts, the country met the decrease of econom-ics to the level of 2.1%, unemployment doubled to 6%, the inflation stayed at the level of 2008. Among four largest countries of the CIS (Russia, Belarus, Kazakhstan, Ukraine) the world global crisis affected Ukraine to the utmost, Belarus received the lowest part of the crisis influence.
Speaking about the government measures of eliminating of the financial crisis, since Janu-ary 1, 2009, the law "About priority measures for prevention of negative consequences of the financial crisis and about alternation to several legislative acts of Ukraine" has taken effect. The law is directed for guaranteeing of constitutional rights of Ukrainian citizens, economic security of the state, minimization of possible losses for
economics and financial system of Ukraine from the crisis, which enveloped the majority of de-veloped states. Besides, the law makes changes to several laws of Ukraine, Budget and Economic codes of Ukraine concerning the losses con-nected with capitalization of banks and the losses from the Stabilization fund.
On January 15, 2009 the governments of Belarus and Ukraine signed the treaty concerning the framing of the system of measures for inten-sification of bilateral trade and economic coop-eration in the terms of the global financial and economic crisis. The treaty provided assistance to the countries in various directions, including the commission to bank structures to work out the refusal from anchoring to USD in financial operations.
Ukraine still has great prospects owing to the global crisis, growth of prices for biofuel, and shortage of sowing areas of main agricultural countries. Stocks of agricultural enterprises on the exchange markets started to fall much later compared to metallurgical companies. According to experts, even agricultural sector of the USA received record profits despite the crisis and bank problems. Both private companies and the government tried to introduce new investments and innovations in the agricultural industry to increase its economics role.
According to the data of USDA, in 2009 ag-ricultural world export lowered $14.5 billion to $98.5 billion and agricultural import lowered $2.0 billion to $81.0 billion (compared to 2008 - $115.5 bn and $79.3 bn). There was the export decline in all agricultural products: grain and feed (-) $10 billion to $28.3 billion – vol declines ac-count for two-thirds; oilseeds (-) $4.5 billion to $18.4 billion – vol and unit value declines about equal; cotton (-) $800 million to $4 billion –25% due to vol decline, 75% due to price drop; ani-mal products (-) $1.7 billion – dairy (-) $900 mil-lion, broilers (-) $550 (vol and price) [3]. Agricul-tural import decreasing was caused by the nega-tive wealth effect with lower home values, fal-ling stock market, unemployment and consumer spending contracts. Sharply lower oil prices and stronger dollar lowered also import costs.
As for trade changes in 2008/2009 MY, Russia is raised 1.0 million tons to 15.0 million, a record, due to the rapid year-to-date pace of exports and continued sales. The EU is raised 1.0 million tons to 6.0 million based on the strong pace of import licenses and increased shipments of feed-quality wheat from Ukraine.
132

Olena Lytvyn
EU barley is up 500,000 tons to 4.0 million be-cause of an aggressive, early-season, export li-cense pace, with prices now about $20 below the Black Sea quotes, and comparable freight costs. Russia barley is raised 500,000 tons to 3.0 million based on larger exportable supplies. Ukraine barley is lowered 1.0 million tons to 4.5 million based on intensified competition from Russia and the EU [5].
In 2009 global grain market caused in-creased competition and reduced imports; global recession – weaker demand, weaker prices and stronger dollar. As for developments in the global grain market, there were huge wheat exports from EU, Russia and Ukraine and reduced import demand in the EU. US wheat and coarse grain export volumes slowed down sharply and prices became weaker. Financial crisis and economic slowdown was spread around the globe. World growth slowed to 1.0% in 2009 (2005-07 = 3.8%). Recession in emerging markets slowed from 7.3% (3-yr avg) to 4.8%. Emerging mar-kets threatened as trade slows, commodity prices fall, and currency adjusts.
The prices for agricultural product in 2008/09 MY, which were formed on the world market by rise of offers and decrease of demand, and the global financial crisis, caused the reduc-
tion of crops in most producer-countries in 2009. At the same time, importer-countries continued to provide low purchasing activity despite high level of offers and low prices for the agricultural product. The situation on the market was very favorable for agricultural imports and importer-countries had a marvelous opportunity to create rich inner reserves of grains and other agricul-tural product.
References:
1. APK-Inform. Analytical Statistical Data. http://www.apk-inform.com/
2. “FY 2009 Emerging markets program proposal” Economic Research Service Market and Trade Economics Division, USDA, 2008.
3. Fiscal year 2009 Trade forecasts for agricultural products. // USAD’s Outlook for US agricultural Trade. / Office of Global Analysis/FAS., December 2008
4. Russian Grain Union. Agricultural Statistical Data.http://www. grun.ru
5. United States Department of Agriculture. Foreign Agricultural Service. http://www.fas.usda.gov/
6. Бродский Б.Е. Мировой финансовый кризис: предпосылки, причины, механизмы, последствия // Decision Support and Forecasting Center CEMI RAS, 2009. – P. 5-9.
133

УПРАВЛЕНИЕ И УСТОЙЧИВО РАЗВИТИЕ 2/2009(23) MANAGEMENT AND SUSTAINABLE DEVELOPMENT 2/2009(23)
REMARKS ON THE ROLE OF TERRITORIAL MARKETING IN ECO-DEVELOPMENT OF RURAL COMMUNES
Lukasz Poplawski
University of Agriculture in Krakow, Poland
Abstract
Such activities should be preceded by an action making people aware of benefits resulting from receiving products coming from exceptional places and possibilities of using unique resources which can be found only in a given area. Besides, on account of the development of communes, provinces or voivodeships, what is significant is constant appearance of factors stimulating development, mainly capital and modern technologies. Acquiring them requires a number of marketing actions, whose aim is not only promoting a given region, but also finding new investors. What the inhabitants would like to change in the smallest degree is inhabitants’ mentality. They also want to create promotion sign of the protected region defining its identity. What the accept most enthusiasti-cally is extending tourist base and building such a base, including roads. Key words: territorial marketing, development, activities, protected region, rural communes
Introduction
For several years territorial marketing, whose subject can be a commune, a district, a region, a state and also a special spatial unit with exceptional social and political, tourist and historic meaning, in particular landscape and national parks as well as nature reserves and protected landscape regions, has started to play a significant role in development.
So far in Poland marketing activities relating to protected areas are hardly known, except for creating identity marks of protected areas. Si-multaneously, as a result of extending marketing knowledge, independent scientific disciplines have come into being, including ecological mar-keting [9], whose elements may play a role in eco-development. Marketing activities are chiefly undertaken by local authorities, which aim at creating such conditions of functioning of a terri-torial unit, which make its further development possible.
Spatial forms of nature and landscape pro-tection embrace 33.1% of state area. Landscape parks together with national parks, nature re-serves, the network Nature 2000 and areas of protected landscape constitute main forms of nature protection, which, in turn, determines the degree of legal discipline. Protected areas, be-cause of their specificity, are subject to special regulations, which, depending on the degree of protection, determine the scope of possible man’s activity.
Due to the character of those regions, there is a possibility of employing marketing, especially ecological advertisement and eco-marking as
instruments which could promote a given pro-tected area and therefore the aim of the present work is to present the meaning of territorial mar-keting in eco-development of rural communes based on opinions of inhabitants of protected areas of Swietokrzyskie Voivodeship.
The scope and method of research
The research consisting in pointing to direc-tions of development of protected areas in Swie-tokrzyskie Voivodeship has been conducted by the author since 1998 and has lasted till the present day. The research embraces, among others, differentiating factors affecting multi-functional development as well as eco-development of protected areas. Within the re-search a questionnaire has been carried out in 44 communes in which protected areas predominate as well as in Iwaniska commune (48% of pro-tected regions in its area). The theme of the re-search was finding marketing instruments which could attract the interest of potential tourists in the examined area. Statistical data as well as materials obtained from the commune consti-tuted a complementary element of the research. Communes which have been taken into account made up 61% of rural communes in Swietokrzy-skie Voivodeship and 90% of rural units with the majority of protected areas. A detailed descrip-tion of examined communes has been presented in a spatial approach in a thesis by Brozek and Poplawski.
The questionnaires have been filled in by all potential leaders who were interested as well as people enjoying respect in a commune and influ-
134
Lukasz Poplawski
encing the decisions made up in a commune (the choice of a test was purposeful), especially: vil-lage’s chief officer, councilors, village adminis-trators, local leaders, employers, entrepreneurs, commune inhabitants interested in the future of a commune, agriculturists, leaders of woman’s organisations, leaders of social and political or-ganisations as well as trade unions, a priest, a chemist, doctors and teachers, which corre-sponds to a view presented by Parysek and Siekierski as well as Zawisza and Pilarska that first of all such people, show the directions of development activities of a village community. Among people who underwent the survey agri-culturists constituted 30-40%. The age structure of respondents could be placed in 5 age catego-ries: below 29, from 30 to 39, from 40 to 49, from 50 to 59 and above that. The number of questionnaires addressed directly to inhabitants in each of the communes constituted on average 250, out of which at least a hundred has been filled in and subject to analysis. Among multiple-choice questions the respondents pointed to answers: Yes, No, I do not know. A complete methodological description of the research has been presented in Poplawski’s work [6].
The present publication is financed as “Sci-entific thesis financed from the resources of the Committee for Scientific Research in the years 2004-2007 as a research project.
The influence of protected areas upon local de-velopment: selected aspects
In some concrete cases there might appear various forms and indirect solutions, but in prin-ciple one may differentiate two kinds of spatial systems having ecological functions [Lojewski 1998]:
- natural spatial systems with ecological functions (protected areas);
- artificial systems (ecological arable land) The Act on environment protection defines
aims and principles of environment protection and especially defines activities aiming at pre-serving, proper employing and renovating ele-ments of nature as well as natural complexes and eco-systems. This legal act defines nature protection as a part of ecological policy of a state. The idea of creating protected areas itself is closely related to nature protection and the protection of water resources as well as the abodes of flora and fauna which may be found there. The superior aim of any activity in pro-tected areas is submitting it to nature and land-
scape protection. The Act on nature protection depending on the degree of a legal discipline allows for conducting a given man’s activity in a concrete protected area.
The basic purpose of creating a system of protected areas is maintaining natural processes, eco-systems’ stability and, in particular, preserv-ing bio-variety. In Poland, according to the regu-lations which are binding, the areas of landscape parks and protected landscape are the most pre-disposed to introducing the idea of sustained development. The idea is particularly meaningful for natural protected areas, which perform vari-ous roles; especially they constitute a natural shelter for environment values. In concordance with the idea of permanent sustained develop-ment, what constitutes an alternative for inten-sive agriculture are forms of activities based on ecological and integrated agriculture [Siekierski and Dudek 2000].
In the question of agricultural economy in protected regions, much space is devoted, next to the issue of ecological agriculture, to agro-tourism and eco-tourism. Tourism is generally recognised as a chance for rural areas within multi-functional and sustained development, which may constitute a basic non-agricultural function of farms and the residents of villages, particularly in protected regions (in national and landscape parks).
According to Siekierski and Dudek [2000] what plays a significant role in preserving bal-ance of the natural environment in rural areas are those management directions which determine a proper functioning of the environment, that is drainage system and sewage farms, gas system, storing and recycling waste materials as well as promoting ecological directions of economic de-velopment of rural areas, especially integrated agriculture, ecological agriculture and agro tour-ism. In the assumptions of the regional develop-ment of areas having significant natural values, one may distinguish the following directions: production inside the state and for export of health food, curing plants as well as honey and bee products, the development of treating meth-ods as well as tourism and recreation [Prandecka 1994].
Marketing and regional development
The efficiency of affecting partners can be noticed not only in companies on the market of consumption goods, but also in service compa-nies, investment sector, farms, social institu-
135

REMARKS ON THE ROLE OF TERRITORIAL MARKETING IN ECO-DEVELOPMENT OF RURAL COMMUNES
tions, social organisations and non-profit institu-tions. This fact has stirred interest in territorial marketing. Traditional approach referring only to the activity of enterprises has been completed by an approach taking into account and including into marketing subjects also other non-profit organisations, including self-government com-munes [3].
What had a decisive influence upon a dy-namic increase in the interest in territorial mar-keting were various general factors, being a re-flection of contemporary processes of social and economic changes [1]. According to Szromnik [10] among such elements one may enumerate:
- increase in social awareness of belong-ing to separate local communes as well as regional, national and ethnic ones.
- separating and distinguishing in terms of ownership settlers’ units of different grade
- the rise in decision autonomy and eco-nomic independence of space and ad-ministration units
- the development of marketing way of thinking and acting not only in the sphere of commercial activity
- increase in competitiveness between states and state groups, regions, areas and communes in obtaining factors of perspective development
- initiation of contemporary knowledge and managers’ experiences in the man-agement of settlers’ units
- increase in social and economic aware-ness of the society and the develop-ment of claim attitudes towards organs of territorial self-government related to that
- increase in expectations and require-ments of territorial communes’ members with reference to quantity and quality of received public services
Moreover, dynamic interest in territorial marketing results, according to Hetzel [2], from the following conditions:
- globalisation of some processes of de-velopment, which requires activities un-dertaken on a local level, which is the level of cities, villages and regions as a counterbalance to relevant phenomena taking place on a world-wide scale
- breaking down of some theoretical and ideological doctrines related to the es-sence and functioning of settlers’ units,
which allowed for the development of pragmatic and managerial approaches in the sphere of local space management
- appearing of a new concept of relations between the authority and inhabitants, which rejects the “techno-structural” approach and emphasises the “close-ness” in relation to a given local society
- crisis of the present civilisation and the degree of its development, which re-quires finding new instruments in legiti-mizing cities
What has a significant meaning in the de-velopment of the analysed marketing is the specificity of a given state (region) – it is differ-ent for France and different for Germany. Strong regionalization and increase in competitiveness between centres is a meaningful stimulus for local marketing development, particularly in the face of economic backwardness of some re-gions, increase in the unemployment in those areas, the lack of services, etc. Furthermore, there is a demand for social support of local au-thorities as well as strong identification of inhabi-tants with a region (area). Strong identification is especially noticeable in the case of states and regions which up till the present day had strongly marked their local specificity, especially in terms of culture. In numerous countries or territories in the case of inhabitants’ satisfaction, there is also a high degree of presenting outside support for local authorities in a number of un-dertaken enterprises. The role of local marketing through promoting a city increases, due to, among others, a greater role of globalisation processes in economy, which is related to disap-pearing identifying with a given territory. This factor will cause necessity in presenting one’s own culture or identity with the aim of attracting capital or tourists’ interest in a given region.
Territorial marketing is strictly related to ideas which are present in a given region and which result from particular features or kinds of business in a given region. Those ideas support the development of the region as a whole or its organisations and inhabitants. In the case of territorial marketing in protected areas, there is a strong interdependence between marketing and ecological, social and economic ideas resulting from the concept of constant and sustained de-velopment.
The territorial marketing allows for: - satisfying the needs and wishes of sub-
jects located in a given unit with the
136

Lukasz Poplawski
aim of satisfaction and development at the action which stimulates their desired behaviour
- recognising needs and creating such an offer for investors, which will present the qualities and attractiveness of a given unit in such a way that subjects will invest in the area of this unit
Activities with the use of marketing instru-ments have particular significance in the devel-opment of a commune or a region. Local authori-ties appear in the role of the chief subject which prepares, organises, realises, coordinates and controls all marketing enterprises concerning a region in which a specific territorial unit is the main reference point for profits offered to part-ners.
In implementing constant and sustained de-velopment it is ecological marketing that plays a significant role and it appears as an economic category in market economy with a high aware-ness of economic subjects. Its role is related to consumers’ interest in the condition of the envi-ronment and embraces promoting: products and services friendly to the environment, the idea of employing recyclable materials and promoting the idea of the development of pro-ecological manufacturers [4]. Besides, one may promote ecological behaviour and the needs of economic subjects, especially consumers. What constitutes a significant question is informing consumers and manufacturers about ecological influence of products upon the environment.
What plays a special role in ecological mar-keting are ecological trademarks, ecological ad-vertisement and ecological goods declarations. Those instruments are particularly significant for two reasons, i.e. the consumer’s consciousness and the development of a given region.
Brand as the basis for promoting protected re-gion
In present economic conditions the con-sumer, having a wide choice of goods, in the case of high ecological awareness takes into account the origin and the way of manufacturing a given product. What plays a significant role in this area is a trademark or a logo of a product. Product’s symbol is frequently an element con-firming, for instance, the quality of a product. What proves the fact that market is perceived in such a way by consumers is available marketing research, which evinced the following hierarchy of consumers’ requirements: product safety (its
detailed description), presence or the lack of quality system, production method, product presentation and geographic origin. Apart from main marks guaranteeing quality, conformity to binding certificates or ecological production, what plays a meaningful role are local marks (peasants’ product, regional product, a product of a regional park) [7]. Those marks are related to products strictly associated with a given re-gion. What one should include into products which will contribute to the development of pro-tected regions are material and non material goods connected, among others, with qualities of natural environment, tourist attractiveness, location offers, ideas of local society. Further-more, one may also add to that social service, different kinds of plans, projects, expert opin-ions, advising services related to the develop-ment of a given region [11].
In the European Union the protection of the originality of agricultural products and food as regards the place where they are grown and traditional way of growing them, processing and presentation on the market is regulated by acts of 1992 concerning agricultural and alimentary products related to a given region or character-ized by a traditional production method (direc-tives of July 14, 1992). On the basis of them what is subject to protection are: the name of origin, geographic mark and a specific character (certificates of specific character). Those norms have been introduced in order to standarise prin-ciples and practices on the common European market of member states, and in particular in order to guarantee honest competition, promot-ing member states and especially ensuring high quality of food, guaranteeing higher income for manufacturers, wider and better choice of attrac-tive and specific alimentary products for con-sumers [7].
Ecological marking of goods and services (ecosigns) appears when a given product is envi-ronment-friendly. A significant meaning of eco-signs in economy results from functions per-formed by them, i.e.: educational, informational, stimulating and marketing [Lesniak 2001]. Eco-signs inform first of all about ecological charac-teristics of products and facilitate the choice in the case of consumers having ecological aware-ness thanks to the fact that they possess quali-ties regarded as ecological. Furthermore, they are an instrument in a competition “market” fight and contribute to undertaking by manufacturers ecological actions (enterprises) and simultane-
137

REMARKS ON THE ROLE OF TERRITORIAL MARKETING IN ECO-DEVELOPMENT OF RURAL COMMUNES
ously positively influence shaping ecological awareness of the society. In order to standarise marking ISO has introduced three norms [4]: Type I – ISO 14024, Type II – ISO 14021, Type III – ISO 14025.
A meaningful instrument in the presented subject is ecological advertisement which identi-fies and emphasises proecological qualities of products and social attitudes related to that. The aim of those activities is promoting a given product or a region (area) with the aim of in-creasing its sales or drawing attention to that, for instance attracting tourists. What plays a significant role in ecological advertisement is suggesting to the consumer that he/she wants to be pro-ecological. In countries where ecological attitudes play a significant role, in the case of numerous consumers the demand for products or services is based on conviction that purchasing such a product is accepted by the society. Fur-thermore, one may notice increase in the de-mand for goods which are environment-friendly, as well as demand for health food. Thanks to proper education proecological attitudes find their reflection in appropriate actions and con-tribute to using the environment in a proper way. They also positively influence the behaviour of consumers and manufacturers, which can be exemplified by giving up production of goods containing freon or construction materials con-taining asbestos. The success of such actions, as regards agricultural product, is offering to potential purchasers the most diverse and the highest quality product, which is expressed by the degree in which the product meets require-ments and expectations of future purchasers [12].
Moreover, in ecological marketing there are so called goods declarations. These are as if
reports of the product’s influence upon the envi-ronment from the stage in which it is created until its “death”, in the most majority of cases as waste material. Such declarations inform authori-ties, manufacturers and consumers about the product’s influence upon the environment, and in special cases upon health and consumers.
What plays a significant role in the question of protected regions’ development is trademark. A trademark may constitute an important ele-ment of preserving cultural identity of a given region. Such a mark may be a stimulator of local development because of specificity and original-ity which cannot be found anywhere else. Be-sides, such a mark may be used in the process of introducing constant and sustained develop-ment, especially in the area of a landscape park or a national park. Marking this exceptional, be-cause of a region’s specificity, product may be a visiting card of such a park or area.
What has been presented in the table are opinions of the inhabitants of rural communes in protected areas concerning above mentioned marketing elements, Results analysis explicitly shows that all the answers proposed in closed questions are regarded as favourable towards the increase in attractiveness of a protected re-gion. The respondents want to introduce the slightest changes in inhabitants’ mentality and create promotion sign defining identity of the protected region. What they consider to be the most profitable is extending tourist base and building such a base as well as roads. What is interesting are respondents’ answers regarding promotion where they pay more attention to ensuring a region’s promotion than to a com-mune promotion.
Table 1. Inhabitants’ opinion on what actions should be undertaken in order to make a protected region more at-
tractive in terms of tourism [in %]
Guarantee the region’s promotion
Guarantee the commune’s promo-
tion
Creating promotion mark of a protected
area defining its iden-tity
Obtain financial and advisory assistance
from authorities Commune
Yes No Yes No Yes No Yes No 1 2 3 4 5 6 7 8 9
Backowice 78,81 10,17 74,58 12,71 66,98 16,98 72,64 16,04 Baltow 88,16 1,31 86,84 0,00 84,51 0,00 84,29 4,29 Blizyn 91,49 1,06 88,89 3,33 74,65 11,29 92,50 3,75 Bodzechow 78,00 5,00 79,17 8,33 69,77 8,14 71,91 7,87 Bogoria 64,41 5,08 61,40 6,14 57,52 8,85 56,38 3,19 Brody 52,83 31,13 41,58 31,68 44,34 33,96 93,10 6,90
138

Lukasz Poplawski
(continued) 1 2 3 4 5 6 7 8 9
Daleszyce 33,70 32,61 40,86 32,26 40,22 30,43 33,70 29,35 Gnojno 93,52 3,70 90,65 4,67 77,91 5,81 86,59 2,44 G�rno 75,76 12,12 70,59 15,29 56,79 24,69 62,86 18,57 Imielno 81,97 4,92 82,14 5,36 70,83 8,33 84,00 4,00 Iwaniska 84,29 5,71 86,11 8,33 88,33 3,33 90,00 3,33 Kije 85,71 2,38 90,00 2,50 78,57 4,29 81,94 2,78 Kluczewsko 78,13 7,81 88,89 4,17 81,67 6,67 80,85 8,51 Krasocin 56,76 17,57 61,33 14,67 50,72 20,29 63,77 21,74 Lagow 89,74 3,85 89,47 2,63 73,13 10,45 83,10 4,23 Lopuszno 84,15 4,88 79,45 8,22 72,13 9,84 82,09 5,97 Maslow 88,89 6,06 87,78 7,78 79,01 9,88 83,72 8,14 Michalow 84,09 11,36 83,15 10,11 71,95 17,07 74,39 13,41 Mirzec 86,59 6,10 82,05 8,97 72,37 18,42 76,00 6,67 Mniow 90,41 2,74 90,14 2,82 83,02 5,66 90,00 0,00 Nowy Korczyn 58,24 23,08 56,82 19,32 61,80 25,84 53,93 17,98 Oksa 84,62 8,55 83,02 5,66 70,00 9,00 75,25 6,93 Opatowiec 85,90 5,13 85,71 5,19 66,67 12,50 86,67 2,67 Pacanow 89,71 4,41 88,71 1,61 81,13 5,66 87,27 7,27 Pawlow 93,20 3,88 92,08 3,96 81,52 4,35 91,49 2,13 Piekoszow 53,00 24,00 52,53 27,27 40,21 31,96 44,57 27,17 Pierzchnica 89,80 3,06 90,91 2,02 75,51 6,12 72,90 2,80 Radoszyce 76,25 8,75 74,68 11,39 69,74 14,47 77,50 7,50 Rakow 89,53 2,33 89,41 0,00 86,30 1,37 85,00 1,25 Ruda Maleniecka 83,08 9,23 86,15 6,15 70,59 11,76 77,55 14,29 Sitkowka Nowiny 61,63 13,95 62,03 15,19 51,47 13,24 53,62 13,04 Skarzysko Koscielne 84,62 7,69 78,38 12,16 76,19 15,87 82,09 10,45 Słupia Jedrzejowska 87,76 0,00 90,48 0,00 67,86 3,57 94,59 0,00 Słupia Konecka 89,06 6,25 88,52 6,56 85,00 8,33 90,00 5,00 Smykow 91,78 4,11 93,51 3,90 77,08 6,25 93,75 1,56 Sobkow 81,93 12,05 83,53 7,06 75,34 12,33 84,42 14,29 Solec Zdroj 93,62 3,19 93,55 2,15 85,71 5,95 87,80 2,44 Stopnica 97,87 0,00 95,92 2,04 87,88 3,03 93,94 0,00 Strawczyn 94,12 3,53 92,86 3,57 82,54 6,35 95,95 2,70 Szydlow 89,53 3,49 85,19 4,94 80,00 4,00 89,61 1,30 Tuczepy 80,00 5,45 85,45 3,64 77,27 2,27 63,04 10,87 Wislica 96,59 1,14 97,56 0,00 90,41 0,00 96,10 0,00 Wodzislaw 78,95 4,21 76,60 3,19 53,93 13,48 69,66 7,87 Zagnansk 92,47 4,30 92,00 5,00 84,15 8,54 87,50 3,41 Zlota 98,00 2,00 98,02 0,00 86,36 3,41 95,70 2,15
Source: own research
Table.1 Inhabitants’ opinion on what actions should be undertaken in order to make a protected region more at-tractive in terms of tourism [in %] (continued)
Commune Extending tourist base
Guaranteeing tourist attrac-
tions
Extending tourist base,
including roads
To take care of natura
environment
To change people’s men-
tality Yes No Yes No Yes No Yes No Yes No
1 2 3 4 5 6 7 8 9 10 11 Backowice 77,97 14,41 78,44 12,07 71,68 15,93 71,43 15,18 57,41 18,52
139

REMARKS ON THE ROLE OF TERRITORIAL MARKETING IN ECO-DEVELOPMENT OF RURAL COMMUNES
(continued) 1 2 3 4 5 6 7 8 9 10 11
Baltow 88,46 1,28 90,91 0,00 89,04 1,37 89,61 1,29 80,82 6,84 Blizyn 91,21 2,20 92,05 4,55 89,66 5,77 93,10 4,60 79,27 4,88 Bodzechow 75,51 13,27 76,09 6,52 73,12 10,75 73,91 9,78 63,74 18,68Bogoria 60,68 4,27 61,86 4,24 59,83 0,85 57,76 4,31 48,57 10,48Brody 74,53 9,43 71,17 9,91 74,29 9,52 98,00 2,00 54,17 45,83Daleszyce 46,32 28,42 42,27 32,99 40,00 26,32 36,56 26,88 38,04 30,43Gnojno 90,72 4,12 90,82 4,08 84,54 4,12 89,47 5,26 82,47 5,15 Gorno 73,68 9,47 74,42 5,81 66,67 12,82 69,74 13,16 69,62 13,92Imielno 74,07 9,26 74,55 3,64 79,63 3,70 84,75 1,69 71,15 9,62 Iwaniska 90,00 5,71 89,39 3,03 89,86 7,25 86,96 5,80 74,14 10,34Kije 87,67 4,11 86,49 2,70 78,67 1,33 74,67 1,33 71,23 0,00 Kluczewsko 86,67 5,00 85,19 7,41 90,16 4,92 89,66 5,17 64,91 19,30Krasocin 55,84 23,38 65,79 13,16 64,29 17,14 64,29 17,14 48,57 34,29Lagow 88,61 2,53 89,61 2,60 89,74 2,56 85,33 2,67 77,78 5,56 Lopuszno 87,84 1,35 79,41 7,35 84,21 2,63 81,94 9,72 67,65 14,71Maslow 90,43 6,38 87,63 6,19 85,23 10,23 88,89 6,67 80,49 8,54 Michalow 78,05 12,20 80,49 15,85 77,78 16,05 78,82 11,76 72,29 16,87Mirzec 75,29 5,88 78,48 10,13 82,05 8,97 83,54 8,86 68,83 12,99Mniow 89,55 1,49 86,15 3,08 92,75 0,00 86,36 3,03 79,25 5,66 Nowy Korczyn 60,87 23,91 60,64 26,60 64,04 17,98 59,55 28,09 54,65 25,58Oksa 75,44 8,77 81,25 2,68 81,36 5,93 84,07 3,54 69,61 5,88 Opatowiec 83,12 5,19 84,00 2,67 84,62 0,00 88,75 0,00 75,00 6,58 Pacanow 90,16 3,28 92,06 1,59 87,04 0,00 91,38 0,00 74,55 14,55Pawlow 94,00 5,00 94,12 2,94 88,51 4,60 93,81 3,09 81,52 8,70 Piekoszow 48,00 16,00 45,92 24,49 49,48 18,56 47,47 26,26 39,39 28,28Pierzchnica 85,71 2,04 79,80 5,05 81,82 4,04 77,55 4,08 68,37 6,12 Radoszyce 75,61 10,98 77,11 9,64 76,54 9,88 72,94 7,06 65,38 16,67Rakow 90,70 0,00 91,86 0,00 89,41 2,35 89,77 2,27 83,54 2,53 Ruda Maleniecka 84,62 7,69 83,33 5,00 79,69 9,38 84,75 8,47 73,58 11,32Sitkowka Nowiny 54,93 14,08 58,67 13,33 61,43 14,29 58,57 10,00 52,70 13,51Skarzysko Koscielne 84,00 10,67 88,00 4,00 93,42 2,63 85,33 8,00 68,12 15,94Slupia Jedrzejowska 83,78 0,00 88,24 2,94 84,21 2,63 94,44 0,00 70,00 17,50Slupia Konecka 89,84 5,08 90,00 5,00 89,23 6,15 91,93 3,23 85,25 4,95 Smykow 88,71 3,23 91,18 0,00 85,45 5,45 93,33 0,00 86,54 5,77 Sobkow 82,93 6,10 86,25 10,00 82,67 12,00 83,33 10,26 73,85 12,31Solec Zdroj 92,31 4,40 94,79 1,04 92,31 4,40 93,48 4,35 80,68 7,95 Stopnica 95,92 2,04 97,78 0,00 90,24 0,00 95,74 2,13 84,62 7,69 Strawczyn 97,73 0,00 95,24 2,38 90,54 6,76 94,87 2,56 73,24 14,08Szydlow 89,02 1,22 90,80 2,30 87,80 3,66 92,59 1,23 86,08 6,33 Tuczepy 80,00 5,45 78,43 3,92 74,47 2,13 82,35 5,88 74,07 11,11Wislica 96,55 0,00 96,43 0,00 94,19 1,16 95,18 1,20 88,89 4,94 Wodzislaw 77,08 2,08 75,53 4,26 72,34 6,38 77,17 2,17 66,30 9,78 Zagnansk 93,48 3,26 91,30 5,43 88,42 6,32 85,57 5,15 79,78 8,99 Zlota 95,79 0,00 96,94 3,06 96,81 0,00 96,91 2,06 87,88 7,07
Source: own research
Summary Polish protected regions possess great natu-
ral values and occupy a meaningful part of our
country. Unfortunately, they are poorly pro-moted. The existence of trademarks and logos is a rarity and there is hardly any awareness of
140

Lukasz Poplawski
their existence in the opinion of the society. There appears a necessity of undertaking deci-sive activities with the aim of promoting particu-lar protected regions.
The opinion of the inhabitants of rural communes in protected areas concerning market-ing elements is unambiguous, that is all proposed instruments contributing to the increase in at-tractiveness of a protected region are accepted by the inhabitants.
The role of marketing in eco-development of protected areas will be increasing within the nearest years and it is indispensable to appropri-ately introduce such actions which will not only bring profits for inhabitants, but will also give ecological effects, for instance there will be in-crease in ecological awareness or natural re-sources will be used properly.
Reference:
1. Ashworth G.J., 1999, Is Places Marketing Really Marketing, Regional Studies Association Session: Place Marketing Bilbao
2. Hetzel P., Dlaczego marketing terytorialny i planowanie strategiczne [W:] Marketing terytori-alny, pod red. nauk. T. Domanski, Instytut Studi0w Miedzynarodowych, UL Lodz
3. Iwankiewicz –Rak A. 1997 Marketing organizacji niedochodowych – wybrane problemy adaptacji w warunkach polskich, AE Wroclaw
4. Leśniak J., 2001, Rola instrumentow marketingu ekologicznego we wdrazaniu rozwoju zrownowa-żonego na przykladzie Szwecji, [W:] Ekonomia a rozwoj zrownowazony, pod red nauk. F. Piontka, Wyd. Ekonomia i Srodowisko, Bialystok
5. Poplawski L., 2004. Rola marketingu w rozwoju trwalym i zrownoważonym obszarow chronio-nych, Materialy konferencyjne Wyzszej Szkoly
Ekonomiczno-Informatycznej w Warszawie oraz Wyzszej Szkoly Spoleczno-Ekonomicznej w War-szawie „Spoleczna rola wspolczesnego market-ingu” pod red nauk. T. Kamienski i W. Pomykalo, Wyd. Fundacja Innowacja, Warszawa, s. 223-229
6. Popławski L., 2005. Zastosowanie metody QUOTA SAMPLING w badaniu kierunkow rozwoju obszarów chronionych, [W:] „Przedsiebiorczosc po wstąpieniu Polski do Unii Europejskiej” T.1, pod red. nauk. L. Palasz, Monografie AR Szczecin, s. 251-258
7. Sokólska J., 2001, Produkt markowy jako czynnik rozwoju lokalnego- doświadczenia z realizacji pro-jektu „Tereny, ludzie, produkty”, [W:] Gospo-darowanie na obszarach chronionych, pod red. nauk. A. Boltromiuk, Uniwersytet w Bialymstoku
8. Szromnik A. 1998, Marketing sektorowy – nowe szanse rozwoju oferty dydaktycznej z zakresu marketingu w szkolach wyzszych. [W:] Wspolc-zesne tendencje rozwojowe marketingu i ich wplyw na procesy nauczania, Materialy Konfer-encyjne, AE Krakow
9. Szromnik A. 2002, Marketing terytorialny – kon-cepcja ogólna i doswiadczenia praktyczne. [W:] Marketing terytorialny pod red nauk. T. Markowskiego, Wyd. Komitet Przestrzennego Zagospodarowania Kraju PAN, Studia Tom CXII, Warszawa
10. Szromnik A. 2003, Marketing terytorialny w strategiach rozwoju lokalnego, [W:] Strategie rozwoju lokalnego pod red nauk. M. Adamowicza, Wyd. SGGW, Warszawa
11. Zagorska E., 2002, Marketing gminny jako czyn-nik strategii rozwojowej samorzadow terytorial-nych, Inzynieria Rolnicza 8/2002, Warszawa
12. Zelazna K., 1998, Marketing mix i jego elementy w dzialalnosci agroturystycznej, [W:] Agro-turystyka, pod red. nauk. U. Swietlikowskiej, SGGW, W-wa,
141

УПРАВЛЕНИЕ И УСТОЙЧИВО РАЗВИТИЕ 2/2009(23) MANAGEMENT AND SUSTAINABLE DEVELOPMENT 2/2009(23)
SUSTAINABLE EDUCATIONAL ACTIONS FOR PRE-UNIVERSITY AND UNIVERSITY LEVELS IN IRAQ
Alava Serafim1, Nidal Shaban2, Lisa Rodrigo1, Eman Kadhum3, Ali Michael4
1 University Toulouse II le Mirail, France 2 University of Forestry, Sofia, Bulgaria
3 Ministry of foreign affairs, Bulgaria 4 Cultural Matters Embassy of Iraq in Sofia
Abstract
Sustainable educational actions for pre-university and university levels in Iraq present serious requirement to
improve the levels of necessity knowledge in education system. Using the international huge experience by col-laboration on regional, national, European and international projects in implementation of new approaches and methods will ensure success and prosperity for the future generations to enjoy a quality of life at least as good as our own. Sustainable development implies economic growth together with the protection of environmental quality, each reinforcing the other. The guiding rules of SEA are that people must share with each other and care for the Earth. Humanity must take no more from nature than nature can replenish. This in turn means adopting lifestyles and development paths that respect and work within nature's limits. It can be done without rejecting the many benefits that modern technology has brought, provided that technology also works within those limits. SEA refers to achieving economic and social development in ways that do not exhaust a country's natural resources. Search and development for application from new educational technologies within Production Space and International Relations-EPRI, ecological education/ environmentally sound technologies etc.
Key words: sustainable development, education, collaboration, project and humanity.
Introduction ‘Education for Sustainable Development is
an investment in our future… each respective country should ensure that appropriate resources are made available for its development’ - World Summit on Sustainable Development: Plan of Implementation (2002).
The UN Decade of Education for Sustainable Development seeks to:
a) incorporate quantitative and qualitative ESD indicators into on-going monitoring and evaluation of Education for All (EFA) and the UN Literacy Decade;
b) monitor the progress of activities undertaken by UN agencies, Governments and NGOs in observance of the Decade and facilitate implementation and follow-up;
c) evaluate the achievement of measurable results in realising the aims and objectives of the Decade, particularly in regard to the integration of ESD in national educational policies, programmes and systems;
d) make recommendations to further promote ESD based on results and lessons learnt from the Decade.
The main thrusts of Education for Sustainable Development, originally identified in Chapter 36 of Agenda 21, have been expanded upon in the Work Programme of the UN Commission of Sustainable Development (CSD), reports of the major UN Conferences of the 1990's such as the conference on Women in Beijing, and Population in Cairo, The World Education Forum in Dakar.
1. Principles of Education for Sustainable Development- ESD
- Public understanding of the principles behind sustainability. ESD has a major role in furthering the discussion of sustainability itself and the evolution of the concept from a vision to its practical application in culturally appropriate and locally relevant forms.
- Mainstreaming ESD. This social process needs to be mainstreamed into all sectors including business, agriculture, tourism, natural resource management, local government and mass media, adding value to program development and implementation.
- Lifelong-learning for all. Society has to adapt to a phenomenal rate of change in
142

Alava Serafim, Nidal Shaban, Lisa Rodrigo, Eman Kadhum, Ali Michael
knowledge – a university degree is current for some 5 years – so the know how and capacity of individuals and organisations to be able to continuously learn is a most precious asset for the future. Therefore quality life-long education and learning opportunities are required for all peoples regardless of their occupation or circumstances. Without access to not only basic education but also higher education, nations will find development of any kind, let alone the much preferred sustainable development, very difficult. This education must also reflect the local culture and societal needs.
- ESD is relevant to all nations. The realization that it is our most highly educated countries that create some of the greatest threats to a sustainable future for the planet, the reorienting of existing education programs in all nations to address the social, environmental, and economic knowledge, skills, perspectives, and values inherent in sustainability is also a major thrust of ESD.
- Specialised Training Programs. The development of specialized training programs to ensure that all sectors of society have the skills necessary to perform their world in a sustainable manner.
ESD is fundamentally about values, with respect at the centre: respect for others, including those of present and future generations, for difference and diversity, for the environment, for the resources of the planet we inhabit. Education enables us to understand ourselves and others and our links with the wider natural and social environment, and this understanding serves as a durable basis for building respect. Along with a sense of justice, responsibility, exploration and dialogue, ESD aims to move us to adopting behaviours and practices that enable all to live a full life without being deprived of basics.
ESD is for everyone, at whatever stage of life they are. It takes place, therefore, within a perspective of lifelong learning, engaging all possible learning spaces, formal, non-formal and informal, from early childhood to adult life. ESD calls for a re-orientation of educational approaches – curriculum and content, pedagogy
and examinations. Spaces for learning include non-formal learning, community-based organisations and local civil society, the workplace, formal education, technical and vocational training, teacher training, higher education educational inspectorates, policy-making bodies, …and beyond. 2. Decade of Education for Sustainable Development
The Decade of Education for Sustainable Development (DESD) is a far-reaching and complex undertaking. Its conceptual basis, socio-economic implications, and environmental and cultural connections make it an enterprise, which potentially touches on every aspect of life. The overall goal of the DESD is to integrate the values inherent in sustainable development into all aspects of learning to encourage changes in behavior that allow for a more sustainable and just society for all.The basic vision of the DESD is a world where everyone has the opportunity to benefit from education and learn the values, behaviour and lifestyles required for a sustainable future and for positive societal transformation. This translates into five objectives, to:
1. Give an enhanced profile to the central role of education and learning in the common pursuit of sustainable development;
2. Facilitate links and networking, exchange and interaction among stakeholders in ESD;
3. Provide a space and opportunity for refining and promoting the vision of, and transition to sustainable development – through all forms of learning and public awareness;
4. Foster increased quality of teaching and learning in education for sustainable development;
5. Develop strategies at every level to strengthen capacity in ESD.
The concept of sustainable development continues to evolve. In pursuing education for sustainable development, therefore, there must be some clarity in what sustainable development means and what it is aiming at. This plan presents three key areas of sustainable development – society, environment and economy with culture as an underlying dimension.
143

SUSTAINABLE EDUCATIONAL ACTIONS FOR PRE-UNIVERSITY AND UNIVERSITY LEVELS IN IRAQ
Society: an understanding of social institutions and their role in change and development, as well as the democratic and participatory systems which give opportunity for the expression of opinion, the selection of governments, the forging of consensus and the resolution of differences.
Environment: an awareness of the resources and fragility of the physical environment and the affects on it of human activity and decisions, with a commitment to factoring environmental concerns into social and economic policy development.
Economy: a sensitivity to the limits and potential of economic growth and their impact on society and on the environment, with a commitment to assess personal and societal levels of consumption out of concern for the environment and for social justice.
The values, diversity, knowledge, languages and worldviews associated with culture strongly influence the way issues of education for sustainable development are dealt with in specific national contexts. In this sense, culture is just not a collection of particular manifestations (song, dance, dress, …), but a way of being, relating, behaving, believing and acting through which people live out in their lives and that is in a constant process of change.
Seven interlinked strategies are proposed for the Decade: advocacy and vision building; consultation and ownership; partnership and networks; capacity building and training; research and innovation; information and communication technologies; monitoring and evaluation. Together they form a coherent approach to the incremental increase over the Decade of the promotion and implementation of ESD. They will ensure that change in public attitudes and educational approaches keep pace with the evolving challenges of sustainable development.
3. Why SEDS in Iraq
To rebuild sustainable ecological education system in Iraq, it’s necessary to know the past to make the future in spite of the long destruc-tive, bloody and dramatic period. "The Education system in Iraq, prior to 1991, was one of the best in the region, with over 100% Gross Enrolment Rate for primary schooling and high levels of literacy, both of men and women. The Higher Education, especially the scientific and technological institutions, were of an
international standard, staffed by high quality personnel". (UNESCO Fact Sheet, 28 March 2003)
The education system in Iraq was widely regarded as one the best in the Middle East until the 1980’s. Between the 1960s and 1990s, Iraq made great progress in enrollment at all levels of education and achieved near universal primary enrollment by 1980. During the 1990’s, however;the system seriously deteriorated due to overall neglect, in large part, a consequence of Iraq’s engagement in two wars.According to UN statistics, primary school enrollment fell to 93 percent in 2000 while secondary school enrollment went from 47 percent to 38 percent.
A UNICEF Multiple Indicator Cluster survey (MICS) reported in 2000 that as many as 23 percent of primary school aged children were not attending school, with significant rates among girls in the rural areas. Quality also declined at all levels of the education system: teaching and learning conditions deteriorated; teacher quality eroded; curriculum content was distorted or became outdated; and policy and system development came to a standstill.
Immediately after the conflict in May 2003, only one in six children had textbooks, teachers were unpaid, school facilities were in poor condition, shortages of supplies and equipment were endemic, and the quality of education was in serious decline. Combined with systematic looting and destruction of public property, most schools lacked plumbing, wiring, lighting, desks, windows and doors.
4. How to start Sustainable educational actions for pre-university and university levels in Iraq.
Sustainability relates to ways of thinking
about the world, and forms of social and personal practice that lead to:
- ethical, empowered and personally fulfilled individuals;
- communities built on collaborative engagement, tolerance and equity;
- social systems and institutions that are participatory, transparent and just; and
- environmental practices that value and sustain biodiversity and life-supporting ecological processes. (Source: Hill et al. 2003.)
In terms of the process and goals of education for sustainable development an
144
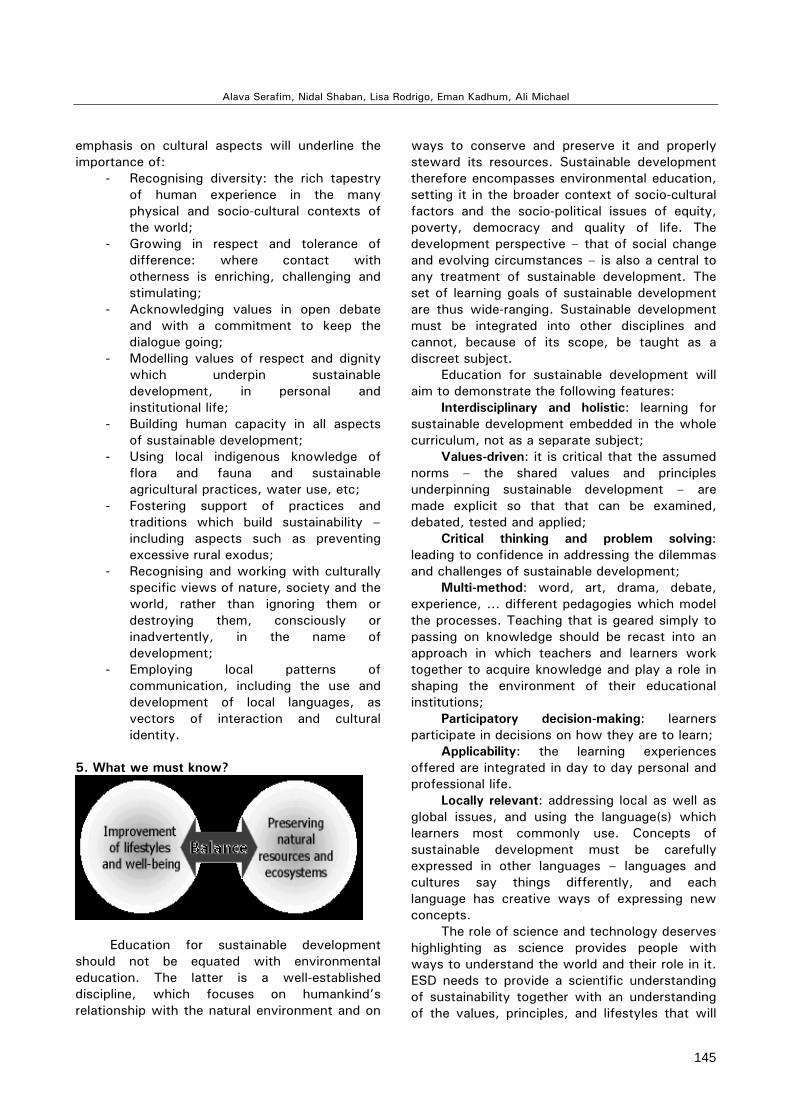
Alava Serafim, Nidal Shaban, Lisa Rodrigo, Eman Kadhum, Ali Michael
emphasis on cultural aspects will underline the importance of:
- Recognising diversity: the rich tapestry of human experience in the many physical and socio-cultural contexts of the world;
- Growing in respect and tolerance of difference: where contact with otherness is enriching, challenging and stimulating;
- Acknowledging values in open debate and with a commitment to keep the dialogue going;
- Modelling values of respect and dignity which underpin sustainable development, in personal and institutional life;
- Building human capacity in all aspects of sustainable development;
- Using local indigenous knowledge of flora and fauna and sustainable agricultural practices, water use, etc;
- Fostering support of practices and traditions which build sustainability – including aspects such as preventing excessive rural exodus;
- Recognising and working with culturally specific views of nature, society and the world, rather than ignoring them or destroying them, consciously or inadvertently, in the name of development;
- Employing local patterns of communication, including the use and development of local languages, as vectors of interaction and cultural identity.
5. What we must know?
Education for sustainable development
should not be equated with environmental education. The latter is a well-established discipline, which focuses on humankind’s relationship with the natural environment and on
ways to conserve and preserve it and properly steward its resources. Sustainable development therefore encompasses environmental education, setting it in the broader context of socio-cultural factors and the socio-political issues of equity, poverty, democracy and quality of life. The development perspective – that of social change and evolving circumstances – is also a central to any treatment of sustainable development. The set of learning goals of sustainable development are thus wide-ranging. Sustainable development must be integrated into other disciplines and cannot, because of its scope, be taught as a discreet subject.
Education for sustainable development will aim to demonstrate the following features:
Interdisciplinary and holistic: learning for sustainable development embedded in the whole curriculum, not as a separate subject;
Values-driven: it is critical that the assumed norms – the shared values and principles underpinning sustainable development – are made explicit so that that can be examined, debated, tested and applied;
Critical thinking and problem solving: leading to confidence in addressing the dilemmas and challenges of sustainable development;
Multi-method: word, art, drama, debate, experience, … different pedagogies which model the processes. Teaching that is geared simply to passing on knowledge should be recast into an approach in which teachers and learners work together to acquire knowledge and play a role in shaping the environment of their educational institutions;
Participatory decision-making: learners participate in decisions on how they are to learn;
Applicability: the learning experiences offered are integrated in day to day personal and professional life.
Locally relevant: addressing local as well as global issues, and using the language(s) which learners most commonly use. Concepts of sustainable development must be carefully expressed in other languages – languages and cultures say things differently, and each language has creative ways of expressing new concepts.
The role of science and technology deserves highlighting as science provides people with ways to understand the world and their role in it. ESD needs to provide a scientific understanding of sustainability together with an understanding of the values, principles, and lifestyles that will
145

SUSTAINABLE EDUCATIONAL ACTIONS FOR PRE-UNIVERSITY AND UNIVERSITY LEVELS IN IRAQ
lead to the transition to sustainable development. Science should be regarded broadly to include social sciences as well as natural sciences and traditional approaches to learning and understanding as well as formal science. Technology provides people with the tools to change their situation as results of learning and expression. Technology should also be regarded broadly to include traditional use of materials and application of knowledge as well as manufactured items. Technology must be applied consistently with the goals of sustainability; misapplication of science and technology can undermine efforts to simultaneously protect the environment and provide for people's economic and personal needs. Education that provides access to science and technology is an area where common cause should be made by advocating strongly for local input into how science and technology should be used.
6. The current status and future prospects for the transformation and reconstruction of The Higher Education System in Iraq
Modern universities in Iraq were established in the second half of the last century, beginning with the University of Baghdad in 1957 uniting several constituent colleges in the process. During the 1960s five more universities were established – the University of Technology and the Al-Mustansirya University in Baghdad as well as universities in Basra, Mosul and Sulaymaniah. The further development of higher education in Iraq was characterized by establishment of technical institutes reflecting the considerable demand for qualified technicians created by the flourishing oil industry. During the last 20 years the policy of establishing a university in each governorate responded to both the demands of equity and the growing demand for higher education. Thus 14 new universities were founded.
Iraq’s current higher education system comprises 20 universities and 47 technical insti-tutes under the management of the Ministry of Higher Education and Scientific Research (MHESR). This includes 200 colleges, 800 de-partments, 28 research centers. The Commission for Computers and Informatics offers specialized course for postgraduates. There are in addition 10 private colleges offering programs in com-puter sciences, business administration, econom-ics and management. The UNESCO survey, 2004 found a total student enrollment of
251175, 42% of whom are women. Almost 50% of the students are enrolled at the 5 uni-versities in Baghdad. Two universities have less than 2000 students while Baghdad University enrolls two thirds of all students. Thus there is wide range in the size of universities as well as a lack of geographic equity in their distribution across the country.
The major fields of study offered by the universities are: education, arts, law, social sciences, administration, economics, natural sciences, engineering and technology, medical sciences, veterinary medicine and agriculture. In the area of education there 24 colleges preparing teachers for secondary schools, 7 colleges for primary and kindergarten school teachers and 7 for physical education. The University of Technology has a specialized college for technical education, training teachers for vocational schools and technical institutes. During the period of economic sanctions, the importation of computers was restricted and therefore computer related disciplines were offered in a limited number of institutions.
Technical Education in Iraq comprises 37 Technical Institutes (58540) and 9 Technical Colleges (7368) with 66 000 students, 22% of whom are female with 2837 teaching staff. There is at least one Institute in each of the 18 governorates. Iraqi higher education has a strong orientation towards technical education through the technical institutes which had significant growth after their inception in 1969. This expan-sion was triggered by the oil boom, which cre-ated the need for large numbers of technical workers. Technical Institutes award a Degree while Technical Colleges award a Diploma. These qualifications cover over 60 fields of specializa-tion in engineering, administration, medical sub-jects, agriculture and applied arts. The Technical Institutes resort with the Commission for Tech-nical Education under the direction of the MHESR.
Of the 19112 academic university teaching staff, 56% are male and 44% female; 43% of the teaching force is concentrated in Baghdad. The average staff student teaching ratio is 1: 13 being much more favourable than neighbouring countries such as Jordan (1:30) and Saudi Arabia (1:20). There are however extreme variations among Iraqi universities from 1:43 to 1:4. In Iraq the minimum educational qualification for a teaching post in higher education is a master’s degree. However one
146

Alava Serafim, Nidal Shaban, Lisa Rodrigo, Eman Kadhum, Ali Michael
third of the teaching staff lack a masters degree; 28% of the staff has doctorates, 39% masters and 33% bachelors degrees.
While in pre-war days, Iraqi scientists were publishing widely in international and regional journals, very few articles were published in the last decade. The larger universities like Basra, Baghdad and Mosul have between 5 & 8 special-ised research centers. In addition there are other specialized research centers - the Polymer Re-search Centre, Date Palm Research and the Ma-rine Research Centre. The Commission for Com-puters and Informatics (CCI) and the Commission for Medical Specialization played an important role in training of research staff and promoting research activities. Socio-political research was conducted at the Gulf Study Centre at Basra University, International Study Centre at Mun-stansiriya University, Iranian Studies Centre in Basrah and Turkish Studies Centre in Mosul. Archeological research was undertaken in the Iraqi National Museum in Baghdad. The House of Wisdom – Beit Al-Hikma and the Iraqi Academy of Sciences – Majma’Al-‘Ilmi al Iraqi, two famous institutions focus on the history and academic tradition of the country and region. The teaching overload of academic staff was a serious obsta-cle to the development of high quality research. There was also limited international cooperation in research.
The Iraqi Academy of Sciences, founded in 1948 was a center for fellows from various disciplines including modern and ancient Middle Eastern languages, history, social and physical sciences. Its main goal was to promote the Arabic language and heritage. Its digital and traditional library was partially looted during the war. Iraqi academics are of the view that the Academy can reestablish itself as one of the leading research centres of the country but urgent interventions are required to rebuild its infrastructure for which a modest $825 000 is estimated.
6a. UNESCO Rroundtable for Iraqi Education System A Roundtable organized by UNESCO (22/23
February 2005, Paris) to enable Iraqi academics and representatives from the MHESR to discuss with representatives of the international community the current status of the higher education system in Iraq and to explore ways of both its immediate and long term reconstruction and transformation. In all 120 delegates
participated in the discussions over a two day period.
The main issues, needs and priorities that emerged from the Rountable were the following:
- The widespread destruction of the infrastructure of the higher education system and now lacking a reliable source of electricity and potable water
- The unstable and dangerous environment for normal academic activity – 48 academics have been assassinated since 2003 and many are under daily threat. This has served to demotivate academics and many have left the country
- The quality of higher education has been steadily deteriorating since the imposition of authoraritian rule in Iraq. This has been exarcerbated by a sequence of wars first with Iran, the Gulf war and now the invasion of 2003 with sanctions compounding the problems; it is estimated that 30-40% of the best trained professors have emigrated since 1990; its research centres have suffered from isolation by the international academic community
- Only about a third of the academic staff hold doctoral degrees; this together with long periods of isolation make the retraining of staff to international standards an urgent priority
- There is a need to equip more than 2000 scientific laboratories and for 30 000 computers; libraries are in a poor condition and are in urgent need of restocking with new books and journals in both Arabic and English; journals in electronic format are required
- The student population has been rapidly increasing due both to a high birthrate and an admissions policy that allows all students who have completed secondary school to enter higher education
At the conclusion of the conference, The Director General of UNESCO, Matsura stated: “The meeting provided us with valuable information and gave us an opportunity to appreciate the determination of Iraq’s academics and Ministry of Education to bring higher education back to its former level of excellence”.
147

SUSTAINABLE EDUCATIONAL ACTIONS FOR PRE-UNIVERSITY AND UNIVERSITY LEVELS IN IRAQ
6b. Interim Progress Despite the formidable problems
encountered by the Iraqi higher education system, progress and improvements have been made. The subjects of democracy, human rights and antiterrorism have been included in the curricula. There is no dedicated budget for higher education but an ad hoc amount has been allocated. This has increased from $40 million in 2003 to nearly $70 million in 2005 This has enabled salaries for teachers to be increased from $1000 a month to $1500 a month. Teacher upgrading has been supported by UNESCO and the World Bank; 4300 new jobs have been created in the universities; 40% of the reconstruction of destroyed buildings have been achieved through the existing budget. A student’s union has been formed in each college and a new law governs student election based on freedom and democratic principles.
6c. Contingency measures In his concluding remarks at the
Roundtable, the director of Higher Education, Georges Haddad, UNESCO outlined the following measures in support of the Iraqi Higher Education System:
- Establish a database of the Iraqi academic diaspora
- Connect the Iraqi higher education system to international networks
- Iraqi academics to participate in the next international quality assurance network (INQAAHA) to be held in Wellington, New Zealand from 29 March to 2nd of April
- Iraqi academics to attend the next meeting of the International Association of University Presidents to be held in Bangkok from July 11-15
- A workshop to be held in Amman to discuss student life in Iraqi universities
- There should be capacity building for university governance and management of Iraqi universities
- UNESCO/UNITWIN Chairs should be established for Iraqi universities in a number of disciplines – engineering, medicine, teacher training, distance education
- Establish a Conference of Rectors /University Presidents
7. Ttransformation of Iraqi Higher Education Sys-tem
As necessary as they are, the above contingency measures to assist the Iraqi Higher Education Sector must be complemented by systemic transformation of the higher education system that has been severely damaged and is out of step with international norms and standards. In order to achieve this it may be wise to appoint an overarching Commission along the lines of the South African National Commission on Higher Education (1996) following the demise of the Apartheid. And there are other such Commissions which have undertaken systemic transformatory imperatives in Chile, Australia and the United Kingdom. Such a Commission should clearly comprise the important stakeholders of the Iraqi Higher Education System - the MHESR, the Universities including the academic staff, the students and other relevant stakeholders. Given the country’s isolation during the last few decades, the inclusion of carefully selected international academics should be a necessary addition to the Commission. Among others, the remit of the Commission should include:
- The value system that should underpin a new and reinvigorated higher education system such as equity, democracy, human rights, autonomy and academic freedom
- How should the State – University relations be mediated and regulated
- The participation rate for the HES; in developed countries it is reaching 50% for the age cohort 18-21 years; what should be the affordable and realistic target for Iraq say in the next ten years; in how many universities should these students be accommodated in order to ensure quality, efficiency and effectiveness
- How should the universities be funded – e.g. through formula based block grants or other systems; what % of the GNP would be devoted to higher education; should students pay fees and if so what proportion of the total expenditure; will there be support for students unable to pay
- How is quality of universities to be enhanced within the context of ongoing strategies to improve the system; will a national Quality Assurance body be
148

Alava Serafim, Nidal Shaban, Lisa Rodrigo, Eman Kadhum, Ali Michael
established; there are a number of models addressing the critical areas of institutional audit, programme accreditation and quality improvement
- How is private higher education which is still in its infancy in Iraq to be regulated; the challenge in recognizing that it will play its part in the provision of higher education is to create a regulatory but enabling environment and subject it to the same quality assurance mechanisms as public higher education
- What will be the role of open and distance education together with e-learning in a transformed Iraqi higher education system
- How is research to be rejuvenated and funded in order to contribute to the pressing challenges of post- conflict reconstruction of the country
Hopefully such an exercise can be conducted in an open transparent manner with the full support of all stakeholders resulting eventually in a framework or blueprint that is owned by the government, institutions and other stakeholders and within which the systematic, incremental and progressive reconstruction of the higher education system can unfold.
7a. Role for the United Nations University
International Leadership Institute With its strategic location in Amman, Jor-
dan, a country at peace with itself and its neighbors’, UNU-ILI is well positioned to make a contribution to the reconstruction of the Iraqi higher education system. The new building and conference center will be an ideal venue for the hosting of conferences, workshops and semi-nars. Two courses are planned for 2005. The first in partnership with UNESCO will be on qual-ity assurance and will include Iraqis as well as delegates from the wider Middle East and be-yond. In November a course on leadership and management of higher education will be held. A sequence of courses on higher education is being planned for 2006 – strategic planning, teacher education, open & distance learning, ICT in higher education, research, private higher educa-tion and regulation of higher education, the role of technical & vocational education, internation-alization and student life. All of these courses will be open to international participants but it is intended to have a strong Iraqi presence.
8b. Funding for the transformation of Iraqi Higher Education
The International Fund for Higher Education in Iraq was initiated by the First Lady of Qatar through a donation of $15 million in 2003 and has enabled UNESCO to address the most urgent needs of higher education in Iraq. To this has been added smaller donations from the Qatar National Bank, South Korea and Doha National Bank. It is vital that these funds are augmented substantially by the international community in order for the reconstruction and rejuvenation of the Iraqi higher education system to proceed unimpeded.
Concluding remarks
- Education is the backbone of any society. Without an efficient education system, no society can function.
- Compelling international evidence indi-cates that countries cannot generate sustainable socio-economic develop-ment without investment in human de-velopment. At the heart of such devel-opment is the production of critical intel-lectual capabilities and well trained graduates with a range of competencies and skills. Douglas (2000) captures this necessity succinctly and aptly: “As the global economy becomes more competi-tive, those states and nations that in-vest the most time and energy in ex-panding and nurturing their higher edu-cation systems, will likely be the big winners of tomorrow”
- Without adequate higher education and research institutions providing a critical mass of skilled and educated people, no country can ensure endogenous and sustainable development and in particular, developing countries and least developed countries cannot reduce the gap separating them from the industrially developed ones, Sharing knowledge, international cooperation and new technologies can offer new opportunities to reduce this gap (World Declaration of Higher Education for the 21st Century, 1998).
- This is the vision that should be the driving force of the MHESR in constructing a modern higher education system for Iraq. The view on the reconstruction of higher education
149

SUSTAINABLE EDUCATIONAL ACTIONS FOR PRE-UNIVERSITY AND UNIVERSITY LEVELS IN IRAQ
expressed by the Deputy Minister of Higher Education of Iraq at the Paris Roundtable is indeed encouraging: “to ensure quality higher education marked by gender parity, the separation of state and religion, mindful of the values of democracy and human rights”. It is clear from the recent UNESCO Roundtable, the International Community stands ready to assist in whatever way required by the Iraqi people.
Reference: 1. Douglas J (2000) The California Idea and
American Higher Education, Stanford Press 2. The Rountable on the Revitilization of Higher
Education In Iraq, Paris: 22/23 February 2005 3. Iraq Education in Transition: Needs and
Challenges, UNESCO, 2004 4. The National Commission on Higher Education, A
Framework for Transformation, South Africa, 1996
5. World Declaration of Higher Education for the Twenty First Century: Vision and Action, Document of World Conference in Higher Education, 5-9 October, 1998
6. United Nations Decade of Education for Sustain-able Development 2005-2014 Draft International Implementation Scheme UNESCO January 2005
150

УПРАВЛЕНИЕ И УСТОЙЧИВО РАЗВИТИЕ 2/2009(23) MANAGEMENT AND SUSTAINABLE DEVELOPMENT 2/2009(23)
THE PLACE OF THE AGRARIAN SECTOR IN THE NATIONAL ECONOMY-VEGETABLE
PRODUCTION
Eman Kadhum1, Messar Tabit2, Nidal Shaban2
1 Ministry of foreign affairs, Bulgaria 2 University of Forestry, Sofia, Bulgaria
Abstract
During the period 2000-2007,reported vegetable production was characterized with following trends: The
big specialized producers produced big assortment from vegetable crops, some of them with low productivity and quality. The Bulgarian producers are not ready to the new EU conditions after 2007. The state policy include sub-sidizing this field by the application of a mechanism based on the scheme for unified payment per area unit. Grant support was paid at the amount of 894 thousand BGN, that is 59,6% of the funds envisaged and 3,7% less than the support provided during the preceding year for the finished quality production manufactured. A total number of 269 vegetable producers were supported from 16 regions for 741 hectares of tomatoes actually planted, /i.e., 45,8% of the ones who initially submitted requests and 1,2% less than the negotiated in 2005/ and 1918 hec-tares of peppers /i.e., 68,6% of the intended and 55,3% more compared to the preceding period. Insufficient financial resource from the state and EU funds. High social and economic price of competences with other EU producers. Bulgarian vegetable producers are not ready in socio-economic aspects to the new situation after 01.01.2007. Necessary of right agrarian policy to keep and develop the skills of farmers, to stimulate optimal conditions for growth of this sector. Insufficient take care to the women participating in vegetable production. The women present main group in vegetable farms.The aim of the paper is to outline the development of CAP on the development of farms producing vegetables during the period of application of the Single payment scheme. To clarify the possibilities of this sector in agrarian national economy.
Key words: economics, vegetables, EU, subsidies
Bulgaria is famous for its old and rich horti-
cultural traditions. The geographic position of the country at the crossroads of three continents and near the places of origin of a number of vegetable crops attests for the historical impor-tance of vegetable production in this region of Europe. Bulgaria has rich gene fond and biodiver-sity in vegetable crops.
The production of vegetables and potatoes is traditional and important part in Bulgarian agri-culture which form about 30 % from the field plant production. For this reason, the sustainable development of this sector in conditions of equal and complete EU member is an important part from the priorities of Bulgarian Government as Common Agricultural Policy on the Development of Horticultural Farms.
Instead of the rich experience in vegetable production, from 90s from the last century, the cultivated area and the quantity and quality of the vegetable production decrease every year. The main reason is unfavorable economic condi-tions.
Vegetable production in Bulgaria is organ-ized in small-sized farms that cover 1.5-2% of the exploited farming land but it forms about one third of the gross plant growing production
which reveals the importance of the sub-sector not only for the satisfaction of consumption but also as a source of incomes. In 2003, about 408 579 vegetable farms have been found, which accounts for 67% of all farms and shows the rife distribution of horticulture in the country. At the same time, 406 724 farms are owned by physi-cal persons with average size of 0,97 da, 1 265 are farms run by sole proprietors with average area scale 15 da. Regarding the legal subjects, 190 are cooperatives with mid size 106,5 da, while other legal entities are 289 with average area of 79 da, along with 111 partnership enti-ties with mid size of 15,4 da.
The feature of small vegetable producing farms is that they rely predominantly on own land, financing and family labor and regardless that nowadays they are profitable after acces-sion of Bulgaria in EU they face serious hardness due to lack of enough liquidity for investment in modernization and further enlargement. To solve this situation it’s necessary from one hand, to enlarge the vegetable farm with new structure and functions due to the national conditions and specificity, and from another hand these farms must solve their obstacles in terms of adoption of advanced technologies; following the stan-
151

Eman Kadhum, Messar Tabit, Nidal Shaban
dards for quality, hygiene and safety environ-mental practices and market adaptation.
The main tools of CAP up on [3], which per-tain to vegetable-producers are: direct payment of single area in first three years after accession, the marketing standards for quality and compli-ance control, interventions, foreign trade regime and producers' organizations (PO). The expected impact on the vegetable producers will evince in following aspects:
- The first three years after accession the size of horticultural farms will be ulti-mate factor for the impact of CAP on their development. Since the margin of the subsidies is 1-2% supposing the net income of those farms, the subsidies in fact will not influence on their develop-ment thus their sustainability will be de-termined and limited by farms' general competitiveness and their ability to re-spond adequately to market signals;
- The adherence to the marketing stan-dards is an element of CAP. It can tem-porarily hinder the producers but indis-putably high quality products find better reception on the market;
- The foreign trade regimen ensures a specific protective clause that aims to avoid the influence of the factors that are unfavorable for the foreign market and to follow better the trade flows of some sensitive products;
- The producers' organizations provide possibility for solving their market prob-lems. Their creation in Bulgaria is ham-pered by various factors, such as: lack of markets; lack of concentration of plantations in one region; small-sized plots; lack of the necessary start -up capital; inability to provide the required production of 1,000 t per year; breach of law by the agricultural producers; de-ficiency of experts; insufficient motiva-tion.
Regardless of the fact that the mechanisms of CAP are generally positively disposed to the producers the accession of our country to the EU is not expected to provoke sudden vitalization of vegetable production. Those farms that are most quickly and best adapted to the market mecha-nisms by effective production and adherence to the requirements and standards will continue to exist in the sector.
The Gross Added Value created in the Agri-culture and Forestry Sector in 2006 amounted to BGN 3 415 million. As a result of unfavorable natural and climatic conditions in the course of the previous years, certain reduction of the physical volume of GVA produced in the sector is observed. The Gross Value Added of the agrarian sector in current prices during recent years is within the limits of BGN 3.3 – 3.5 bil-lion. In 2005 the physical volume of DAV marked a drop of 9.5% compared to 2004. In 2006 the reduction amounted up to 1.9% com-pared to the preceding year. The relative share of Gross Added Value produced by the agrarian sector preserved the downward trend of previ-ous years: from 11.7% in 2003, 11.0% in 2004, and 9.4 in 2005 to 8.5% in 2006.
The external trade balance commodities and services of Republic of Bulgaria is negative and amounted to BGN 9 320 million in 2006 com-pared to BGN 6 926 in 2005. In 2006 the export of the country increased nominally by 21.9% (materially– by 9.0%) compared to 2005 and reached BGN 31 421 million.
With real growth in Gross Domestic Product (GDP) for the studied period is above 4% (table 1), the dynamic of the level of Gross Product (GP) and Gross Value Added (GVA) from agricul-ture is fluctuate tendency. The major drop in (GVA) in compare with the previous period is registrated during 2000 and 2005, with 10,3% and 8,6% which due to unfavorable climatic conditions.
Table 1. Major macro economic parameters over the period 1998 – 2006 Parameters 1998 2000 2001 2002 2003 2004 2005 2006
Real growth in GDP In BG in compare with previous year, %
3,5 5,4 4,0 4,9 4,4 5,7 5,5 6,0
Production in agriculture with value in BGN million 5249,5 6868,7 7491,4 7366,2 6674,4 7105,6 6871,8 6780,9
- including field plant production relative, %
2931,8 41,1
2762,6 46,2
3185,8 48,4
3435,3 55,4
3387,1 50,4
3679,3 51,8
3385,6 49,3
3373,9 49,8
152

THE PLACE OF THE AGRARIAN SECTOR IN THE NATIONAL ECONOMY-VEGETABLE PRODUCTION
(continued) Gross Value Added (GVA) in agricultural production with value in BGN million
3769 3301 3579 3446 3484 3576 3327 3078,0
Changes in GVA in agri-culture in compare with previous year, %
1,4 -10,3 0,3 6,1 -1,4 3,8 -8,6 -2,9
Relative part in GVA in agriculture in compare with the total production in BGN
18,8 13,9 13,4 12,1 11,6 10,8 9,3 7,0
Investment in agriculture with BGN million
201,5 212,2 190,3 380,9 506,2 722,3 584,0 327,1
Relative portion from the investments in compare with the total in BGN, %
3,3 2,1 2,0 2,6 3,2 3,9 3,0 2,6
Used agricultural area (UAA)
5645,0 5582,0 5498,3 5324,7 5326,3 5330,5 5264,5 5190,0 1 thousand, ha Cultivated area in agricul-ture thousand, ha 3392,1 3277,3 3350,5 3277,3 3238,8 3262,8 3128,2 3089,5
Balance of externally trade–agriculture produc-tion in BGN million.
252,4 227,4 222,1 498,5 321,0 389,0 545,7 310,0
Inflation rate, % 18,7 10,3 7,4 5,8 2,3 6,1 5,0 7,7 Exchange rate BGN/USD 1,76 2,12 2,18 2,08 1,73 1,58 1,57 1,50 Source: Ministry of agriculture BG, Agrarian report 1998-2006 with data from National Statistic Institute 1 Used agricultural area (UAA) comprises: Arable land; Areas of perennial plants; Areas of perennial green grass; Family gardens; Greenhouse areas.
0%10%20%30%40%50%60%70%
Agrarian Industry Services
2005
2006
Fig.1. Structure of the economic sectors with regards to the Gross Added Value(GVA) for the period 2005-2006
Stable decreasing tendency is observed
in(GVA) with 13,9% during 1998 and 9,3% during 2005. This drop is highest in compare with other countries from EU.
Table 2. Major macro economic parameters over the period 2003 – 2006
Parameters 2003 2004 2005 2006* 1. Gross Domestic Product (GDP) – current prices in BGN
million, including: 34 627 38 823 42 797 49 091
Gross Value Added (GVA) – BGN million 29 604 32 437 35 220 39 972 Gross Value Added from Sector “Agriculture and For-
estry” in BGN million, including:
- Agriculture, hunting and forestry 3 465 3 546 3 308 3 400 - Fishing 13 14 14 15
153
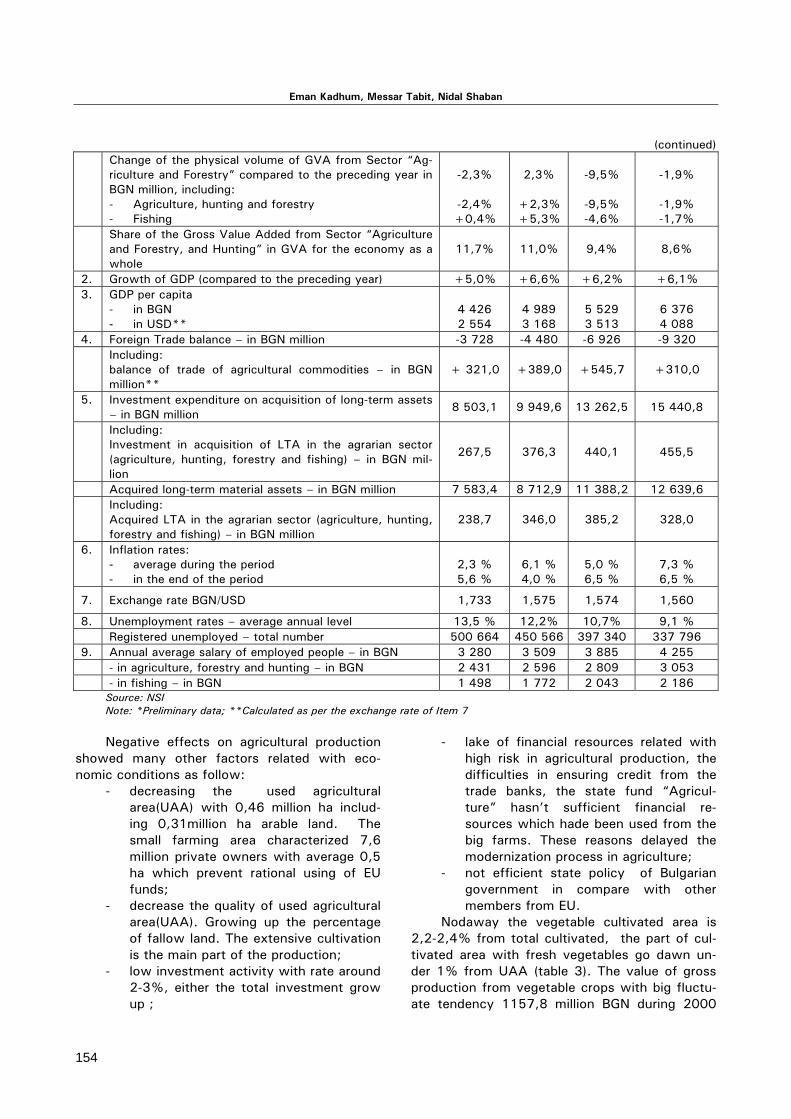
Eman Kadhum, Messar Tabit, Nidal Shaban
(continued) Change of the physical volume of GVA from Sector “Ag-
riculture and Forestry” compared to the preceding year in BGN million, including: - Agriculture, hunting and forestry - Fishing
-2,3%
-2,4% +0,4%
2,3%
+2,3% +5,3%
-9,5%
-9,5% -4,6%
-1,9%
-1,9% -1,7%
Share of the Gross Value Added from Sector “Agriculture and Forestry, and Hunting” in GVA for the economy as a whole
11,7% 11,0% 9,4% 8,6%
2. Growth of GDP (compared to the preceding year) +5,0% +6,6% +6,2% +6,1% 3. GDP per capita
- in BGN - in USD**
4 426 2 554
4 989 3 168
5 529 3 513
6 376 4 088
4. Foreign Trade balance – in BGN million -3 728 -4 480 -6 926 -9 320 Including:
balance of trade of agricultural commodities – in BGN million**
+ 321,0 +389,0 +545,7 +310,0
5. Investment expenditure on acquisition of long-term assets – in BGN million
8 503,1 9 949,6 13 262,5 15 440,8
Including: Investment in acquisition of LTA in the agrarian sector (agriculture, hunting, forestry and fishing) – in BGN mil-lion
267,5 376,3 440,1 455,5
Acquired long-term material assets – in BGN million 7 583,4 8 712,9 11 388,2 12 639,6 Including:
Acquired LTA in the agrarian sector (agriculture, hunting, forestry and fishing) – in BGN million
238,7 346,0 385,2 328,0
6. Inflation rates: - average during the period - in the end of the period
2,3 % 5,6 %
6,1 % 4,0 %
5,0 % 6,5 %
7,3 % 6,5 %
7. Exchange rate BGN/USD 1,733 1,575 1,574 1,560
8. Unemployment rates – average annual level 13,5 % 12,2% 10,7% 9,1 % Registered unemployed – total number 500 664 450 566 397 340 337 796 9. Annual average salary of employed people – in BGN 3 280 3 509 3 885 4 255 - in agriculture, forestry and hunting – in BGN 2 431 2 596 2 809 3 053 - in fishing – in BGN 1 498 1 772 2 043 2 186
Source: NSI Note: *Preliminary data; **Calculated as per the exchange rate of Item 7 Negative effects on agricultural production
showed many other factors related with eco-nomic conditions as follow:
- decreasing the used agricultural area(UAA) with 0,46 million ha includ-ing 0,31million ha arable land. The small farming area characterized 7,6 million private owners with average 0,5 ha which prevent rational using of EU funds;
- decrease the quality of used agricultural area(UAA). Growing up the percentage of fallow land. The extensive cultivation is the main part of the production;
- low investment activity with rate around 2-3%, either the total investment grow up ;
- lake of financial resources related with high risk in agricultural production, the difficulties in ensuring credit from the trade banks, the state fund “Agricul-ture” hasn’t sufficient financial re-sources which hade been used from the big farms. These reasons delayed the modernization process in agriculture;
- not efficient state policy of Bulgarian government in compare with other members from EU.
Nodaway the vegetable cultivated area is 2,2-2,4% from total cultivated, the part of cul-tivated area with fresh vegetables go dawn un-der 1% from UAA (table 3). The value of gross production from vegetable crops with big fluctu-ate tendency 1157,8 million BGN during 2000
154

THE PLACE OF THE AGRARIAN SECTOR IN THE NATIONAL ECONOMY-VEGETABLE PRODUCTION
and 1343,7 million BGN during 2002. In spite of minimum part of the cultivated area with vege-table crops, this sector form 1/3 from the gross production of field crops and 15% from gross production from agriculture, which showed the
efficiency of this sector. The export of vegetable products grow up three times during 2000-2005 period. With value - 14,9 to 54,8 million USD, with part total export of agricultural products grow from 3% to 4%.
Table 3. Major parameters of the role of vegetable production in Bulgarian agriculture
Parameter 1998 2000 2001 2002 2003 2004 2005 2006 Cultivated area with vegetable crops, thousand ha
209,3 214,9 134,5 135,7 122,3 104,3 73,0 71,0
Relative part from UAA1, % 9,7 3,8 3,6 3,1 3,2 2,4 2,4 2,2 Relative part with fresh vege-table crops from UAA1, % 1,3 0,8 1,5 0,9 0,8 0,6 0,8 0,7
Gross production from vege-tables, million BGN
964,9 1157,8 1183,2 1361,0 1343,3 1267,3 1199,4 1060
Including vegetables without potatoes
785,8 940,1 944,1 1169,6 1119,7 1020,7 1027,5 998,1
Relative part of vegetables in Gross production of agricul-ture, %
18,4 13,7 12,6 15,9 16,8 14,4 14,9 15,0
Relative part of vegetables Gross production of field crops, %
41,7 34,0 29,6 34,0 33,1 27,7 30,3 29,6
Export of vegetables, million USD
- 14,9 14,8 32,2 34,4 48,5 54,8 48,2
Relative part of vegetables in total export of agricultural products,%
- 3,0 3,0 4,5 4,5 4,6 4,3 3,7
Source: Ministry of agriculture BG, Agrarian report 1998-2006 with data from National Statistic Institute 1 Used agricultural area (UAA) comprises: Arable land; Areas of perennial plants; Areas of perennial green grass; Family gardens; Greenhouse areas External trade
The main exported vegetable crops are fresh tomato (produced in greenhouses and open field), Dutch cucumber, sweet pepper, onion and potatoes (table 4). Exporting process of Dutch cucumber to EU market go very slow for many reasons belonged to Phytosanitary control re-quirements. Since 01.01.2007 phytosanitary export certificates are issued for goods destined for export for third countries. The goods for EU are moving freely or with Phytosanitary plant passport, guaranteeing that during the produc-
tion process they were subjected to the obliga-tory phytosanitary control according to the re-quirements of the laws of the country and Direc-tive 2000/29 of EU. For this reason the number of issued phytosanitary certificates during the first six months of 2007 is significantly smaller for the last six months of 2006. The tendency of decreasing will continue also during the next few years. The main imported quantity is from onion and potatoes during the studied period.
Table 4. Export and import of fresh vegetables
Import, t Export, t Product 2006 2005 2004 2006 2005 2004
Greenhouse tomato 9168 7321 6948 212 68 1668 Open field tomato 750 1216 933 227 172 21 Greenhouse cucumber 4366 3045 3440 5901 5633 3975 Sweet pepper 3020 13994 6379 1559 1142 2604 Onion 24881 16515 18361 430 426 659 Potatoes 10706 27807 39179 109 105 971 Source: Ministry of agriculture BG, Agrarian report 1998-2006 with data from National Statistic Institute
155

Eman Kadhum, Messar Tabit, Nidal Shaban
Situation of vegetable production in EU: EU countries produce 72,2 million т vegeta-
bles which present 8,3 % from the world pro-duction. The main producers are Italy, Spain, France and Poland (Fig 3).
The production of fruits and vegetables in EU countries present 16,9 % from total agricul-tural products. The main producers are Italy, Greece, and Spain with 25%. Bulgarian produc-tion is 20% (Fig2).
02000400060008000
1000012000140001600018000
IT ES FR PL EL NL DE RO UK PT HU BE BG
Thou
san
d to
n
0
5
10
15
20
25
30
35
SL AT UK FR HU NL PL BE BG RO PT MT IT GR ES
%EU average 16.9%
Source: Еurostat Source.: Eurostat Fig. 2. Relative sharing part of fruits and vegetables fro EU countries (with upper than 10 %) in compare with
total agricultural production (average 2003-2005)
Fig. 3. Major producers of vegetables in EU countries (2003-2005)
- Low percentage of absorption of the
credit resource – hardly 24,3%; The main products are 6,3 million т toma-
toes in which participate, Spain- - 2,1 million. т, Italy- 1,3 million т, Greece-0,8 million т, France and Netherland - with 0,6 million т for every one, Bulgaria produce only 0,2 million т.
- Increase in the number of contracts signed.
Production of vegetables
Potatoes State support for agriculture producers through State Fund“Agriculture” • Target subsidy to support the farmers for
purchasing sowing material from potatoes for producing seeds and for consumption, crop 2006 – the financial resource allocated under this line is at the amount of 1 552 thousand BGN, that is 26,7% more than the subsidy paid during the preceding year, including 436 thousand BGN for seed production and 1 116 thousand BGN for consumption. Following the terms and the conditions of the financial line, 413 potato producers from the country were supported, or 65,5% of the farmers who submit-ted requests for participation in the subsidy and 11,6% more compared to the year 2005. The financial support covers a total area of 1 963 hectares, that is 8,7% of the harvest areas with potatoes and it exceeds with about 85,7% the areas subsidized in the preceding reporting pe-riod.
• Target subsidies for short-term financial support lines
In 2006 through a grant payment was im-plemented under 23 short-term lines through “Agriculture” State fund. Funds were provided for target subsidies, including export subsidies as well as one financial line including a target credit for the purchase of mineral manures for the pro-duction of wheat from crop `2007. A total of 57 178 thousand BGN were absorbed as subsi-dies. The report data for the period indicate as follows:
- A decrease in the total amount of the resource envisaged (purpose subsidies and short-term credits) by comparison with the funds provided in 2005 which is a result of the substantial decrease of the sum envisaged for short-term credit-ing; Peppers and tomatoes
- The level of grant support sustained; • Target subsidy to support the production of vegetables – pepper and tomatoes, crop 2006
156

THE PLACE OF THE AGRARIAN SECTOR IN THE NATIONAL ECONOMY-VEGETABLE PRODUCTION
– during the period reported vegetable produc-tion was subsidized by the application of a mechanism based on the scheme for unified payment per area unit. Grant support was paid at the amount of 894 thousand BGN, that is 59,6% of the funds envisaged and 3,7% less than the support provided during the preceding year for the finished quality production manufactured. A total number of 269 vegetable producers were supported from 16 regions for 741 hectares of tomatoes actually planted, /i.e., 45,8% of the ones who initially submitted requests and 1,2% less than the negotiated in 2005/ and 1918 hec-tares of peppers /i.e., 68,6% of the intended and 55,3% more compared to the preceding period Conclusion
The analysis of the results showed: - The capacity producing of specialized
vegetables with farms is low. - Insufficient financial resource from the
state and EU funds.
- High social and economic price of com-petences with other EU producers. Bul-garian vegetable producers are not ready in socio-economic aspects to the new situation after 01.01.2007.
- Necessary of right agrarian policy to keep and develop the skills of farmers, to stimulate optimal conditions for growth of this sector.
- Insufficient take care to the women par-ticipating in vegetable production. The women present main group in vegetable farms.
References:
1. Agrarian annual report of the Ministry of agricul-ture and food in Bulgaria. http://www.mzh.government.bg/Article.aspx?lmid=820&id=820&lang=2
2. Strategy of development of vegetable production in Bulgaria.
3. HADJIEVA V. 2007: Expected influence of the common agricultural policy on the development of horticultural farms. Journal of management and economy of agriculture. Vol 52 number 5 p.3-8.
157

УПРАВЛЕНИЕ И УСТОЙЧИВО РАЗВИТИЕ 2/2009(23) MANAGEMENT AND SUSTAINABLE DEVELOPMENT 2/2009(23)
INNOVATION - AS A GROWTH FACTOR FOR THE COMPETITIVENESS OF ENTERPRISES IN A UNIFIED EUROPEAN MARKET
Tadeusz Trocikowski
Scientific Foundation European Institute of Innovation, Wloclawek, Poland Knowledge-based economy, innovation and technology transfer are concepts developed for trends that are
visible in the most developed industrial superpowers of the world. The most appreciation is given to knowledge, information and high skills. In these circumstances, innovation plays the primary role as a source of economic change and development. Enterprises in Poland, being aware of such changes, are also beginning to pay more and more attention to innovative activity in order to compete effectively in the market, either by implementing new processes that will provide a cheaper, or through introduction of new technology products and, thus, becoming market leaders. The countries of the European Union in order to effectively compete in the global market must strive to create the conditions for the development businesses in the area of innovative activity. The Lisbon Strat-egy is a tool to make the economy of the European Union the most dynamic and the most competitive in the world. The realization of the objectives of the Lisbon Strategy means developing and stimulating entrepreneurship by setting up companies and supporting their activities with particular emphasis on small and medium-sized enter-prises. The support is possible due to the European Union structural funds. The above shows the importance of a lot of small and medium-sized enterprises in the economic development of the EU. The basis for the development of the economy is innovation. The acquisition of EU funds by enterprises is carried out to introduce new products, services and technologies. The report "Barriers of cooperation and scientific entrepreneurs", published in Novem-ber 2006 by the Ministry of Science and Higher Education shows that every year Poland patenting is only 2.7 per million inhabitants, while the average in the European Union is 133.6. Consequently, the scale of innovation in the Polish economy is low. Overcoming barriers to raising funds and drawing the structural EU funds will contribute to reducing the imbalance.
Key words: innovation, entrepreneurship, competitiveness, SMEs, EU funds
The concept of innovation Building a knowledge-based economy in
business enterprises may be achieved through realizing the importance of knowledge, informa-tion, new techniques and technology.
The concept of innovation in the knowledge economy changes and is defined in many ways, which results in many definitions of innovation. However, after extended analysis of issues one can come to one conclusion. Innovation is some-thing new.
The concept of innovation was certainly de-fined by J. Schumpeter, who, as one of the first, argued that innovation is a new combination of existing production factors.
Schumpeter understood the innovation as introducing fundamental or radical changes, in-cluding the transformation of new ideas and technological invention into the market, but also as:
- The introduction of a new product or of a new quality of a product,
- The introduction of a new or improved method of production,
- The opening of a new market, - The application of a new method of sale
or purchase,
- The use of new raw materials or half-manufactured goods
- The carrying out of the new organiza-tion of any industry.
Finally, according to J. Schumpeter, innova-tion can vary activities that will be successful. He mentions several ways in which innovation may appear:
- these can be new products, - new quality of products, - new production processes, - new markets, - new technologies and materials, - new organizational structures. More often, however, innovation is defined
as an economically successful exploitation of new ideas.
The role of organizational innovation is noted by a significant number by economists; according to them: "organizational change is a response to technical change, while, in fact, organizational innovation can be a necessary precondition for technical innovation."
Organizational Innovation - "refers to the implementation of new methods of organization. These may be changes in the rules adopted by
158

Tadeusz Trocikowski
the action and of the workplace or in the com-pany's relationship with the environment. "
Innovation is the implementation of new or significantly improved product (good or service) or process, a new method of marketing or a new organizational method in business practice, or-ganization or place of employment relations with the environment.
According to Peter F. Drucker, who de-scribed the innovation "... as a specific tool of entrepreneurs, through which, which is an op-portunity to make changes to adopt a new busi-ness or to provide new services." According to him, it is economical rather than technical or social. Ch. Freeman argued, however, that inno-vation can only be seen as innovation, when it is traded. However, the question remains on which the value of innovation can be marked as being traded.
Another definition of innovation is quoted in the document. "Guidelines for Applicants apply-ing for funding under the Sectoral Operational Programme Improvement of the Competitiveness of Enterprises, according to which the innovation must be understood as the work involving prepa-ration and launching of production, as well as preparation for the sale of new or improved products and services (offers) for the placing on the market, or other practical use or the intro-duction of modernization process of distribution.
A different definition of innovation was pre-sented by G.S. Altshuller, who emphasized the need for creative processes as far as innovation was concerned, and associated innovation with creativity. Innovation, according to him, „is a complex phenomenon and a set of skills, a dif-ferent way of organizing, synthesis and expres-sion of knowledge, perception of the world and creates new ideas, perspectives, reactions and products".
Another issue that is important to the con-cept is seeing innovation as a process. Previ-ously unknown product of a company is the re-sult of its innovation. If it is implemented in prac-tice, it is innovation. Innovation is the ability of applying the act of creativity, new ideas, and inventions. Innovation typically involves creativ-ity, but is not identical to it: innovation involves acting on the creative ideas to make some spe-cific and tangible difference in the domain in which the innovation occurs.
Innovation is here treated as a continuum of technical and organizational changes, including, on one hand, simple modifications to existing
products, processes and practices (which may be new to the firm, but not necessarily for the industry), to fundamentally new products and processes, on the other hand (which are so new for the industry and for the company). The im-plementation of innovation requires a series of research as well as technological, organizational, financial and commercial matters. In contrast, according to a manual developed by the Organi-zation for Economic Cooperation and Develop-ment, innovation occurs when new or improved product is introduced to the market, either new or improved processes are used in production, with a new product and process - at least from the point of view of the introducer. In accor-dance with the manual, technical innovation is an objective improvement of the properties of the product or system of supply in relation to the products and processes already existing.
How innovation occurs and, above all, what is innovation? Innovation is the result of three actions interacting with one another.
Firstly, one should gain knowledge, hence show interest, creativity and care.
Secondly, one needs to put theoretical knowledge into practice, and therefore have the ambition and the will to fight for the new.
Thirdly, we must be able to transform the knowledge into a definite action, and that means one must have courage, determination and the necessary financial resources.
As far as innovation is concerned, one usu-ally comes to conclusion: "We do not know what we do not know." If you want to innovate, you cannot rely simply on what you already know. The Light bulb was not invented by the constant optimization of candle wax. New think-ing and new ideas were essential, quite distant from accepted until then. Therefore, we are wrong if we believe that we can innovate on the basis of existing knowledge only. What we can achieve while acting that way is knowing what we know, and not knowing what lies beyond our way of thinking. In other words "we do not know what we do not know."
On the other hand, one would define inno-vation activities differently if considering it from the practical point of view. Innovation activity is the whole of scientific, technological, organiza-tional, financial and commercial matters, which lead to the implementation of new or improved products, processes or services. In a few words, it can be said that it is a change that brings profit. To make it simpler, you can say that sci-
159
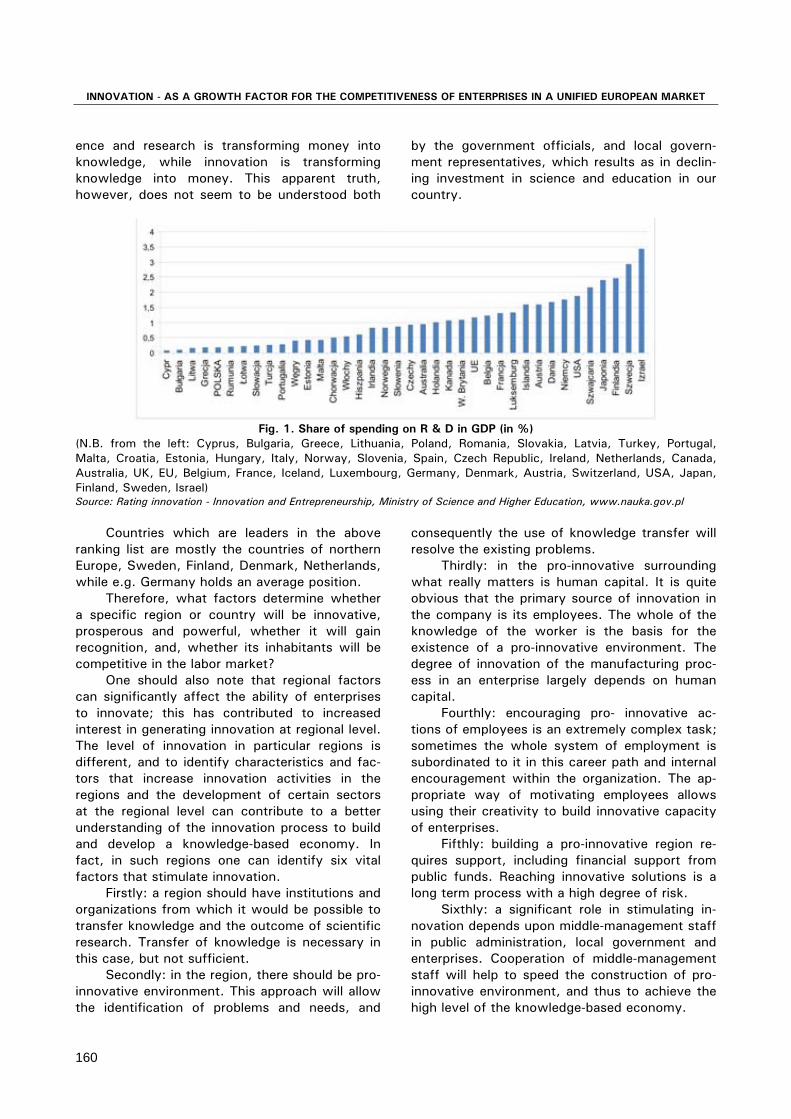
INNOVATION - AS A GROWTH FACTOR FOR THE COMPETITIVENESS OF ENTERPRISES IN A UNIFIED EUROPEAN MARKET
ence and research is transforming money into knowledge, while innovation is transforming knowledge into money. This apparent truth, however, does not seem to be understood both
by the government officials, and local govern-ment representatives, which results as in declin-ing investment in science and education in our country.
Fig. 1. Share of spending on R & D in GDP (in %)
(N.B. from the left: Cyprus, Bulgaria, Greece, Lithuania, Poland, Romania, Slovakia, Latvia, Turkey, Portugal, Malta, Croatia, Estonia, Hungary, Italy, Norway, Slovenia, Spain, Czech Republic, Ireland, Netherlands, Canada, Australia, UK, EU, Belgium, France, Iceland, Luxembourg, Germany, Denmark, Austria, Switzerland, USA, Japan, Finland, Sweden, Israel) Source: Rating innovation - Innovation and Entrepreneurship, Ministry of Science and Higher Education, www.nauka.gov.pl
Countries which are leaders in the above
ranking list are mostly the countries of northern Europe, Sweden, Finland, Denmark, Netherlands, while e.g. Germany holds an average position.
Therefore, what factors determine whether a specific region or country will be innovative, prosperous and powerful, whether it will gain recognition, and, whether its inhabitants will be competitive in the labor market?
One should also note that regional factors can significantly affect the ability of enterprises to innovate; this has contributed to increased interest in generating innovation at regional level. The level of innovation in particular regions is different, and to identify characteristics and fac-tors that increase innovation activities in the regions and the development of certain sectors at the regional level can contribute to a better understanding of the innovation process to build and develop a knowledge-based economy. In fact, in such regions one can identify six vital factors that stimulate innovation.
Firstly: a region should have institutions and organizations from which it would be possible to transfer knowledge and the outcome of scientific research. Transfer of knowledge is necessary in this case, but not sufficient.
Secondly: in the region, there should be pro-innovative environment. This approach will allow the identification of problems and needs, and
consequently the use of knowledge transfer will resolve the existing problems.
Thirdly: in the pro-innovative surrounding what really matters is human capital. It is quite obvious that the primary source of innovation in the company is its employees. The whole of the knowledge of the worker is the basis for the existence of a pro-innovative environment. The degree of innovation of the manufacturing proc-ess in an enterprise largely depends on human capital.
Fourthly: encouraging pro- innovative ac-tions of employees is an extremely complex task; sometimes the whole system of employment is subordinated to it in this career path and internal encouragement within the organization. The ap-propriate way of motivating employees allows using their creativity to build innovative capacity of enterprises.
Fifthly: building a pro-innovative region re-quires support, including financial support from public funds. Reaching innovative solutions is a long term process with a high degree of risk.
Sixthly: a significant role in stimulating in-novation depends upon middle-management staff in public administration, local government and enterprises. Cooperation of middle-management staff will help to speed the construction of pro-innovative environment, and thus to achieve the high level of the knowledge-based economy.
160

Tadeusz Trocikowski
In order to be successful in constructing in-novative culture we must not forget about a system of incentives. The sources of incentives in companies, but also in the institutions of busi-
ness environment are: customers, contractors, suppliers, educational institutions, and a range of internal incentives.
Fig. 2. Participation of SMEs in introducing their own innovations in the total number of SMEs
(N.B. Bulgaria, Latvia, Malta, Slovenia, UK. Britain, Croatia, Turkey, Iceland, USA, Japan, Israel, Canada, Australia - no data) Source: Rating innovation - Innovation and Entrepreneurship, Ministry of Science and Higher Education, www.nauka.gov.pl
Co-operation with the customer can be a
good illustration: the principal task of a company from the SME sector is to provide a continuous outlet for their products. It is necessary in order to obtain profit and the profit is necessary to obtain and maintain the company's earnings to allow further development. The positive impact on the customer guarantees his satisfaction, but, at the same time, it is necessary to offer him such a product, which cannot be offered to him by the competition. Certainly, this must be an innovative product.
While characterizing internal incentives, what should be pointed out is that their exis-
tence requires a suitable environment in the en-terprise or institution. Innovation in your organi-zation will not be made at the commands of the supervisor; in order to create innovation we must create a set of conditions and, furthermore, be well prepared for the failure at the same time. The risk of management of change is a new con-cept, but requires a deeper analysis of the or-ganization that is engaged in the implementation of innovation.
Many companies’ experience shows that to change the employee’s attitude to innovation we often need to change the management system in the enterprise.
Fig. 3. Share (%) of SMEs cooperating in innovation in terms of the total number of SMEs
(N.B. Croatia, Turkey, USA, Japan, Israel, Canada, Australia - no data) Source: Rating innovation - Innovation and Entrepreneurship, Ministry of Science and Higher Education, www.nauka.gov.pl
Whilst the enterprise is joining the innova-
tive activity, it may specify a number of reasons due to which it has taken such a decision.
When building pro-innovative environment in the enterprise one should apply as many in-
structions of others who have built such systems as possible, and therefore:
- give your employees the freedom of thought,
161

INNOVATION - AS A GROWTH FACTOR FOR THE COMPETITIVENESS OF ENTERPRISES IN A UNIFIED EUROPEAN MARKET
- make sure to remove all the uncertain-ties in the organization,
- allow for making mistakes, - appreciate the innovative ideas, - suggest the exchange of thoughts and
ideas, - be a leader in innovative ventures, - engage key customers in the process
of innovation management, - bear in mind that innovation can start
from different sources, - treat technology of the company as
property of the whole, - be prepared for obstacles in the im-
plementation of innovation. This last warning is extremely important as
it presumes a change in the allocation of power in the company, as undermining the position of people with traditional skills, and strengthening the position of those who possess the new ones.
Innovation is the driving force of economic development. Schumpeter defined innovation as "creative destruction". In this spirit, the history of civilization can be seen as a chain of more and
more rapidly occurring innovations, one after another.
In the global economy - the knowledge-based, the innovative power of the companies plays an essential and decisive role. During in-creasingly shorter periods companies must pro-vide new products and services to the market to change and renew the full spectrum of its prod-ucts within a few years. The pressure put on the market is becoming more and more rapid. On the global market, the one that came as the second is often already lost. The skillful use of knowl-edge management, in such way that it becomes a significant factor for competitiveness, innova-tion and planning, implementation, and control over them, is a precondition for future economic success. Rudiments of innovation
By far the most important argument for the crucial role of innovation in increasing the com-petitiveness of enterprises is the ability to gain priority in the creation of new products and ser-vices fulfilling the needs that emerge or to im-prove the efficiency of meeting the customers’ needs.
Table 1. Sources of knowledge and technology transfer
Open source
Sources of information, knowledge of purchase and technology
co-operating partners
Internal sources within the enterprise: Research and development + Production + Marketing + Distribution + Other companies in the cluster + Market and external commercial sources: Competitors + + + Other companies of the same type of activity + + + Clients + + Consultants / consulting firms + + Suppliers of equipment, materials, components, software or services
+ + +
Commercial Laboratories + + + Sources from the public sector: Universities and other institutions of higher education + + + National / Public research institutions + + + Private non – commercial research institutions + + +
162
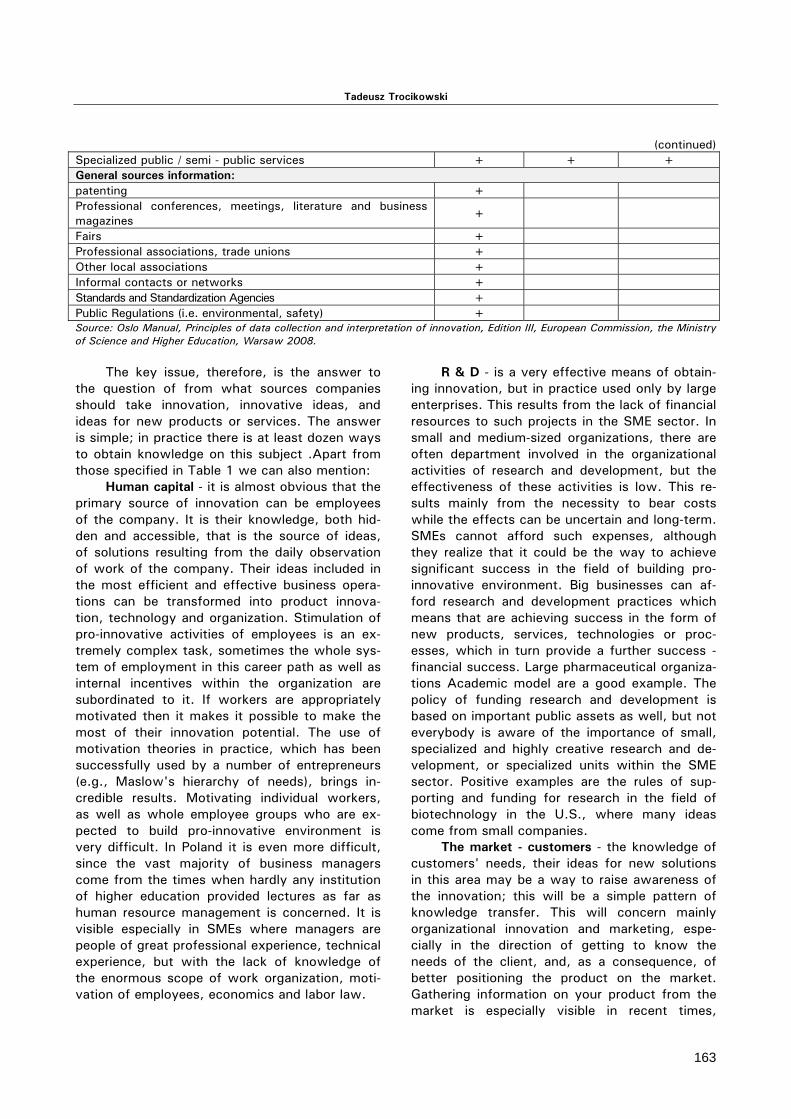
Tadeusz Trocikowski
(continued) Specialized public / semi - public services + + + General sources information: patenting + Professional conferences, meetings, literature and business magazines
+
Fairs + Professional associations, trade unions + Other local associations + Informal contacts or networks + Standards and Standardization Agencies + Public Regulations (i.e. environmental, safety) + Source: Oslo Manual, Principles of data collection and interpretation of innovation, Edition III, European Commission, the Ministry of Science and Higher Education, Warsaw 2008.
The key issue, therefore, is the answer to
the question of from what sources companies should take innovation, innovative ideas, and ideas for new products or services. The answer is simple; in practice there is at least dozen ways to obtain knowledge on this subject .Apart from those specified in Table 1 we can also mention:
Human capital - it is almost obvious that the primary source of innovation can be employees of the company. It is their knowledge, both hid-den and accessible, that is the source of ideas, of solutions resulting from the daily observation of work of the company. Their ideas included in the most efficient and effective business opera-tions can be transformed into product innova-tion, technology and organization. Stimulation of pro-innovative activities of employees is an ex-tremely complex task, sometimes the whole sys-tem of employment in this career path as well as internal incentives within the organization are subordinated to it. If workers are appropriately motivated then it makes it possible to make the most of their innovation potential. The use of motivation theories in practice, which has been successfully used by a number of entrepreneurs (e.g., Maslow's hierarchy of needs), brings in-credible results. Motivating individual workers, as well as whole employee groups who are ex-pected to build pro-innovative environment is very difficult. In Poland it is even more difficult, since the vast majority of business managers come from the times when hardly any institution of higher education provided lectures as far as human resource management is concerned. It is visible especially in SMEs where managers are people of great professional experience, technical experience, but with the lack of knowledge of the enormous scope of work organization, moti-vation of employees, economics and labor law.
R & D - is a very effective means of obtain-ing innovation, but in practice used only by large enterprises. This results from the lack of financial resources to such projects in the SME sector. In small and medium-sized organizations, there are often department involved in the organizational activities of research and development, but the effectiveness of these activities is low. This re-sults mainly from the necessity to bear costs while the effects can be uncertain and long-term. SMEs cannot afford such expenses, although they realize that it could be the way to achieve significant success in the field of building pro-innovative environment. Big businesses can af-ford research and development practices which means that are achieving success in the form of new products, services, technologies or proc-esses, which in turn provide a further success - financial success. Large pharmaceutical organiza-tions Academic model are a good example. The policy of funding research and development is based on important public assets as well, but not everybody is aware of the importance of small, specialized and highly creative research and de-velopment, or specialized units within the SME sector. Positive examples are the rules of sup-porting and funding for research in the field of biotechnology in the U.S., where many ideas come from small companies.
The market - customers - the knowledge of customers' needs, their ideas for new solutions in this area may be a way to raise awareness of the innovation; this will be a simple pattern of knowledge transfer. This will concern mainly organizational innovation and marketing, espe-cially in the direction of getting to know the needs of the client, and, as a consequence, of better positioning the product on the market. Gathering information on your product from the market is especially visible in recent times,
163

INNOVATION - AS A GROWTH FACTOR FOR THE COMPETITIVENESS OF ENTERPRISES IN A UNIFIED EUROPEAN MARKET
mainly due to facilities that bring together infor-mation technology (internet).
Actions of competition - in a free market economy, competition, widely speaking, means rivalry; competition is regarded as a process through which various groups struggle for gain-ing its place in the market; thus, it leads to the elimination of the weaker, while it allows stronger leadership to build up to the best posi-tion and acquiring the most absolute market . Today, competition is considered the most im-portant mechanism which leads to promotion of the most favorable ideas in terms of economic criteria. Knowledge of the workings of competi-tion triggers defense which is basically the use of solutions other than the competition, with the result that they are, in general, pro-innovative solutions. Competition is an important source of information about innovation. Observations of activities and competition in virtually every in-dustry and enterprise is practiced, and often results in coming up with pro-innovative actions. The motivation is clear, eavesdropping competi-tion means that we will not fall behind our com-petition, sometimes even winning the race for customers.
Pro- innovative business environment - in-novation business environment is made up of four systems, which include:
- Access to information for entrepre-neurs,
- A network of institutions active in promoting innovation,
- Pro-innovative educational system, - Pro-innovative actions of the regional
authority. For the realization of the activities from this
issue of great importance are local business or-ganizations, NGOs and the mass-media. In many cases, it involves a change in social attitudes, to creating a pro-innovative. The system of univer-sal access to information for business consists of the following elements:
- Developing a network with access to scientific information, technical, tech-nological as well as the inclusion of public libraries to the system of inno-vative information,
- Creation of regional networks to en-sure high quality information content and the use of information resources on-line,
- Implementing integrated information system, allowing efficient communica-tion between the units of local authori-ties, enterprises, universities, public bodies,
- Organization of pro-innovative events - trade fairs, seminars, conferences as the exchange of thoughts, views on the innovation behavior. This is the place to see new products, ideas, trends, often in international release.
Fig. 4. Number of patents granted by the European Patent Office (EPO) per million inhabitants
Source: Ranking of innovation - The effects of economic, Ministry of Science and Higher Education, www.nauka.gov.pl Research – development units - a number of
separate institutions conducting research funded mainly from public resources. Potentially, they may be a good place for obtaining innovative solutions, especially for larger companies, owing
to the issues which they deal with. These in-clude the entire network of PAN units, although working with small and medium-sized enterprises in their case is rather poor.
164

Tadeusz Trocikowski
Fig. 5. Number of patents granted by the office of the U.S. Patent and Trademark Office (USPTO) per million in-
habitants Source: Ranking of innovation - The effects of economic, Ministry of Science and Higher Education, www.nauka.gov.pl
Technology Platforms - databases - created
as part of a network of institutions active in promoting innovation and supporting the search for new solutions. They are created by many
organizations from the international level (e.g. Europe - the IRC), through government, or re-gional centers, such as the Transfer of Technol-ogy Centre.
Fig. 6. Number of new Community trademarks per million inhabitants
Source: Ranking of innovation - Economical Effects, Ministry of Science and Higher Education, www.nauka.gov.pl Universities - Higher education - as a place
of training future employees they are of great importance. There are also the sources of re-search, but the transfer of the results to the en-terprise level generates a lot of problems. Hence a number of special projects designed to operate between the university-enterprise levels, a num-ber of them financed by the EU, offers the chance to form improved links and helps being optimistic about university researchers’ work being transferred to the market traders.
Conclusions 1. On a macro-scale, as far as development
of innovative entrepreneurship is con-cerned, are difficulties in obtaining funds from the European Union for this type of projects. Bureaucracy procedures for ob-taining assistance from the European Un-ion, to a large extent, hamper the devel-opment of entrepreneurship based on knowledge transfer, innovation and tech-nology.
2. Strong barriers to the raising of the Structural Funds by SMEs on the devel-opment of innovative entrepreneurship
165
INNOVATION - AS A GROWTH FACTOR FOR THE COMPETITIVENESS OF ENTERPRISES IN A UNIFIED EUROPEAN MARKET
are - financial barriers, specifically lack of financial resources for investment co-financed by the European Union.
2.1. As far as the conduct of the ap-plication process is a major prob-lem - too many attachments in the competition as well as un-clear guidelines.
2.2. Under the contracts for funding is a strong barrier - too long to wait for the funds.
2.3. According to respondents, in or-der to facilitate the process of applying for funds from the Euro-pean Union for entrepreneurs from the SME sector should be - to simplify the application forms for structural funds.
3. Definitely, we should - raise the level of knowledge of the beneficiaries - busi-nesses on the EU funds, mainly in terms
of opportunities, and benefit from the funds for SMEs in the proper use of fi-nancial assistance received from the European Union, including the develop-ment of innovation.
Reference:
1. Oslo Manual, Principles of data collection and interpretation of innovation, Edition III,
2. European Commission, the Ministry of Science and Higher Education, Warsaw 2008,
3. Peter F. Drucker, Inspiration and the fact that is, innovation and entrepreneurship, EMKA Publisher Studio, Warsaw in 2005,
4. Innovation and Technology Transfer, web page: www.cptt.uz.zgora.pl,
5. Peter F. Drucker, The effective manager, Business Editor MT, Warsaw 2005.
6. Ranking of innovation - Economical Effects, Minis-try of Science and Higher Education, www.nauka.gov.pl
166
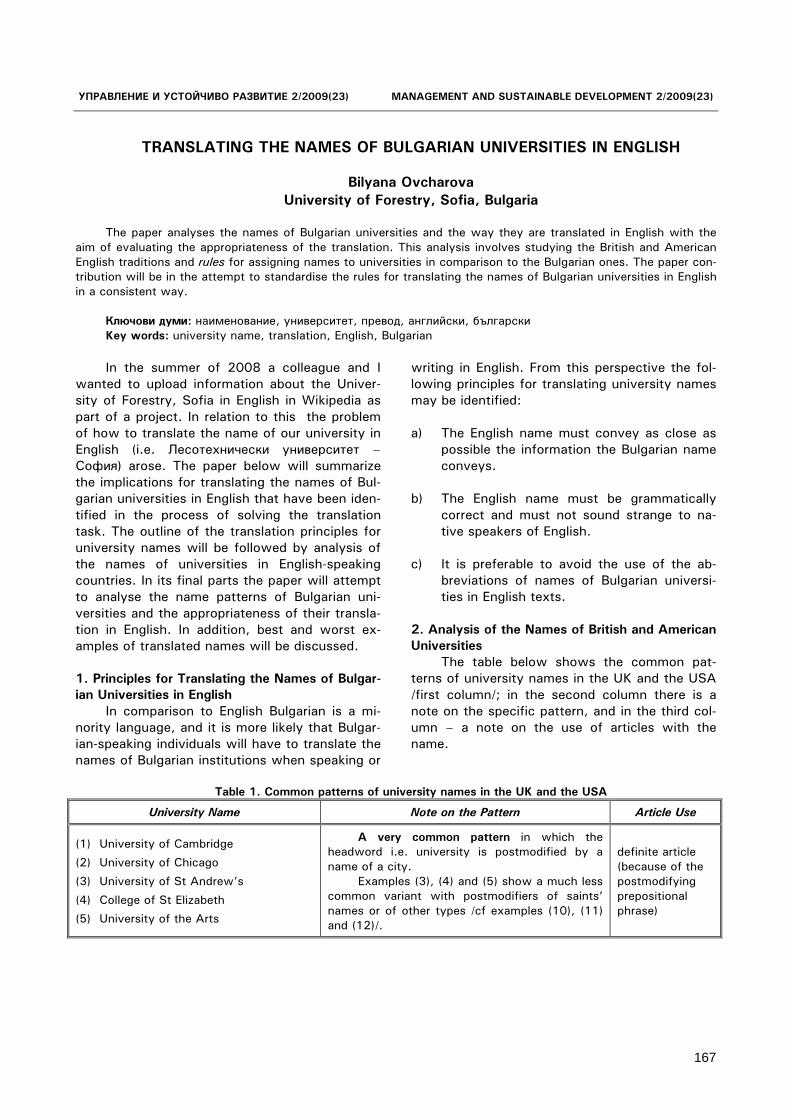
УПРАВЛЕНИЕ И УСТОЙЧИВО РАЗВИТИЕ 2/2009(23) MANAGEMENT AND SUSTAINABLE DEVELOPMENT 2/2009(23)
TRANSLATING THE NAMES OF BULGARIAN UNIVERSITIES IN ENGLISH
Bilyana Ovcharova
University of Forestry, Sofia, Bulgaria The paper analyses the names of Bulgarian universities and the way they are translated in English with the
aim of evaluating the appropriateness of the translation. This analysis involves studying the British and American English traditions and rules for assigning names to universities in comparison to the Bulgarian ones. The paper con-tribution will be in the attempt to standardise the rules for translating the names of Bulgarian universities in English in a consistent way.
Ключови думи: наименование, университет, превод, английски, български Key words: university name, translation, English, Bulgarian In the summer of 2008 a colleague and I
wanted to upload information about the Univer-sity of Forestry, Sofia in English in Wikipedia as part of a project. In relation to this the problem of how to translate the name of our university in English (i.e. Лесотехнически университет – София) arose. The paper below will summarize the implications for translating the names of Bul-garian universities in English that have been iden-tified in the process of solving the translation task. The outline of the translation principles for university names will be followed by analysis of the names of universities in English-speaking countries. In its final parts the paper will attempt to analyse the name patterns of Bulgarian uni-versities and the appropriateness of their transla-tion in English. In addition, best and worst ex-amples of translated names will be discussed.
1. Principles for Translating the Names of Bulgar-ian Universities in English
In comparison to English Bulgarian is a mi-nority language, and it is more likely that Bulgar-ian-speaking individuals will have to translate the names of Bulgarian institutions when speaking or
writing in English. From this perspective the fol-lowing principles for translating university names may be identified:
a) The English name must convey as close as
possible the information the Bulgarian name conveys.
b) The English name must be grammatically correct and must not sound strange to na-tive speakers of English.
c) It is preferable to avoid the use of the ab-breviations of names of Bulgarian universi-ties in English texts.
2. Analysis of the Names of British and American Universities
The table below shows the common pat-terns of university names in the UK and the USA /first column/; in the second column there is a note on the specific pattern, and in the third col-umn – a note on the use of articles with the name.
Table 1. Common patterns of university names in the UK and the USA
University Name Note on the Pattern Article Use
(1) University of Cambridge
(2) University of Chicago
(3) University of St Andrew’s
(4) College of St Elizabeth
(5) University of the Arts
A very common pattern in which the headword i.e. university is postmodified by a name of a city.
Examples (3), (4) and (5) show a much less common variant with postmodifiers of saints’ names or of other types /cf examples (10), (11) and (12)/.
definite article (because of the postmodifying prepositional phrase)
167

Bilyana Ovcharova
(continued)
(6) University of California, Berkeley
(7) University of California, Santa Barbara
(8) University of Texas at Austin
(9) University of Texas at Arligton
This pattern is similar to the one in the above examples and is used for universities with several campuses. The location of the campus is shown after a comma or with a prepositional phrase. The campus name may be droppable.
definite article
(10) Massachusetts Institute of Technol-ogy
(11) California Institute of Technology
(12) London College of Communication
Postmodifiers other than city names are common when the city names are in a pre-modifying position. These are always part of the university abbreviation.
definite article
(13) Brunel University
(14) Harvard University
(15) Yale University
(16) St John’s University
(17) St George’s, University of London
A very common pattern in which the headword i.e. university is premodified by a proper name.
Examples (16) and (17) show a variant with saints’ names. In example (17) the comma indi-cates that St George’s School is part of the Uni-versity of London.
∅ article
(18) University College London
(19) University College Dublin
A pattern with a city name in a non-prepositional post-modifer. The city name is in-cluded in the abbreviation of the respective name.
∅ article
(20) Washington University in Saint Louis
A rare pattern with a city name in a post-modifying position with an in-phrase. The city name is included in the abbreviation of the uni-versity name.
∅ article
3. Analysis of the Translation of the Names of Bulgarian Universities in English
3.1. Names containing the university loca-
tion in end position A very common pattern of the names of
Bulgarian universities is to indicate the city where the university is located at the end of the name writing city name after a dash. Below are examples in Bulgarian:
(21a) Лесотехнически университет –
София (22a) Аграрен университет – Пловдив As shown in Table 1 the names of universi-
ties in the UK and the USA never contain a dash in them. Therefore, preserving the dash in the English translation of the names of Bulgarian universities will result in a name pattern that will be unusual to native speakers of English. A common pattern in English is to use a comma to indicate the location of a university, and the names of the universities above are translated as:
(21b) University of Forestry, Sofia (22b) Agricultural University, Plovdiv 3.2. Names containing a proper name dif-
ferent from or in addition to the name of the city where the university is located
Another common pattern of the names of Bulgarian universities is to include a name of a famous person, historical figure, saint and etc. Examples are:
(23a) Висше военноморско училище
"Никола Йонков Вапцаров" (24a) Стопанска академия „Димитър А.
Ценов" – Свищов In English quotation marks are not used in
names of universities to indicated a proper name of a person or saint. The translations of the above names are:
(23b) Nikola Vaptsarov Naval Academy (24b) D. A. Tsenov Academy of Economics
168

TRANSLATING THE NAMES OF BULGARIAN UNIVERSITIES IN ENGLISH
Considering the above, the name of the old-est university in Sofia, Sofia University, which also contains a name of a saint will translate in English as:
(25) Sofia University of Saint Kliment Ohrid-
ski 3.3. Best and worsts examples of English
translations of names of Bulgarian universities With regard to the second name pattern
discussed in 3.2 above, it seems a very good practice to use only the surname of the historical figure after which the university is named, and not to “burden” the name with abbreviated first and second names as it has been done in the following example:
(26a) Военна академия “Г. С. Раковски” (26b) Rakovski Defence and Staff College The above example is also interesting be-
cause it suggests a translation which is substan-tially different from the Bulgarian original, and the differences do not seem justified, considering the fact that schools of this type are called academies in both the UK and the USA.
(27) Defence Academy of the United King-
dom (28) United States Military Academy at
West Point In some instances it is not possible to pre-
serve all the information of the Bulgarian name as in examples (21a) and (21b). The English name does not include the descriptive word ‘technical’ which is present in the Bulgarian name. The rationale is the degree of occurrence of the collocations ‘University of Forestry’ and ‘Technical Forestry University’. 4. Use of abbreviations of names of Bulgarian universities in English texts
4.1. General considerations The third principle for translation of names
of Bulgarian universities in English in point 1 states that abbreviations should be avoided. In their place, substitutions such as ‘the University’, the College’ and etc. can be used (please notice the capital letter of the organization in this case). However, if an abbreviation must be used, it is better to use a transliterated version of the ac-
cepted Bulgarian abbreviation. The first time the abbreviation is used an adequate explanation must be provided, say, in a footnote:
(29) LTU is the transliteration of the Bulgar-
ian abbreviation (ЛТУ) of the University of For-estry, Sofia (Лесотехнически университет - София)
This principle is in line with ISO 2384:1977
Documentation - Presentation of translations which states that abbreviations’ equivalents in the language of the translation should be given. If there is no equivalent, an abbreviation should be fully explained at its first occurrence. Equiva-lents are such widely accepted and used abbre-viations:
(30) EU (stands for the European Union) (31) ЕС (stands for Европейски съюз) 4.2. Usage of abbreviations and contrac-
tions of university names In the UK and USA famous universities have
official abbreviations: (32) UCLA (University of California, Los An-
geles) /pronounced as one word: uck lah/ (33) MIT (Massachusetts Institute of Tech-
nology) /pronounced as separate letters) Quite often a contraction of the full name of
the university is used in texts: (34) Harvard (instead of Harvard University) (35) UT Austin (instead of the University of
Texas at Austin) (36) St. John’s (instead of St. John’s Uni-
versity) It should be noted that whereas the use of
abbreviations as shown in examples (32) and (33) is common in Bulgarian, the use of contrac-tions as in (34), (35) and (36) is not. It should also be mentioned that Bulgarian abbreviations of university names never include the university locations (point 3.1) and the proper names (point 3.2). However, they may be dropped when a contraction of the name is used.
(37) ЛТУ (stands for Лесотехнически
университет - София) (38) Лесотехнически университет (instead
of Лесотехнически университет – София)
169
Bilyana Ovcharova
Conclusions
The difficulties with the translation of the names of Bulgarian universities in English are related to:
a) punctuation difficulties which require the
avoidance of dashes and quotation marks in line with the English grammar rules for punctuation and their substitution with commas or prepositions (the prepositions being a separate word seem to be less pref-erable);
b) word order difficulties which require that proper names precede the headword in a university name;
c) semantic difficulties which must be solved individually. The research conducted was financed by the Re-
search and Development Center of the University of Forestry, Sofia, under Project N 112/17.04.2008.
References:
1. MILTCHEV, R. Aspects of positioning of information resources of organizations and economic entities with web 2.0 technologies, Journal of Management and Sustainable Development, 2009 (in print)
2. SARKKA, H. Translation of proper names in non-fiction texts, http://translationjournal.net/journal/
39proper.htm 3. ISO 2384:1977 Documentation - Presentation
of translations, http://www.logos.it/pls/dictionary/ linguistic_resources.cap_1_2_en?lang=en
ПРЕВОД НА НАИМЕНОВАНИЯТА НА УНИВЕРСИТЕТИТЕ В БЪЛГАРИЯ НА
АНГЛИЙСКИ ЕЗИК
Биляна Овчарова Лесотехнически университет, София
Докладът анализира наименованията на университетите в България и начинът, по който те се превеждат
на английски език с цел оценка на точността на превода. Анализът включва разглеждане на традициите и правилата за наименоване на университетите във Великобритания и САЩ в съпоставка с тези в България. Приносът на доклада се изразява в опита да се стандартизират правилата за превеждане на английски език на наименованията на университетите в България.
170

УПРАВЛЕНИЕ И УСТОЙЧИВО РАЗВИТИЕ 2/2009(23) MANAGEMENT AND SUSTAINABLE DEVELOPMENT 2/2009(23)
KEYSHOP – PLATFORM FOR E-LEARNING, COLLABORATIVE WORK, KNOWLEDGE SHARING AND ELECTRONIC MATERIALS
Mariya Monova-Zheleva, Yanislav Zhelev, Dimitar Minchev
Burgas Free University, Burgas, Bulgaria
Abstract
The entire human development passes in search of and perfecting the ways and means of communication and education. Today, the profound analysis and correct understanding of the informational content and the adequate putting into practice of the acquired knowledge and skills are basic premises for finding optimal solutions concerning the personal realization and lifestyle as well as for the stable development and management of entire societies and global economics. The current paper presents a lifelong learning platform promoting a new culture of learning based on personalized and self-controlled acquisition of key skills, knowledge and professional competences, which are relevant to the business and labor market needs and requirements. The e-platform development is co-financed by the EU in the framework of the Grundtvig multilateral project "KeyShop - A new culture of learning". The project aims, objectives and the partnership are briefly described in this paper. The main architectural modules of the platform as well as the services and functionality are presented too.
Ключови думи: учене през целия живот, електронно обучение, е-платформа, методът SW Key words: Lifelong Learning, e-Learning, e-Platform, Scenario Workshop /SW/ method
Introduction The KeyShop project is a two-year
Grundtvig multilateral project co-funded in the framework of the Lifelong Learning Programme, with a specific aim of addressing updated and effective educational opportunities for people of all age groups regardless of gender, origin and background knowledge.
The KeyShop (KS) conceptual model was designed following the results of the Memorandum Lifelong Learning 2000 and the PISA Studies. KS is a learning space where self-organized learning and key skills are learned, i.e. it is a place where all those who are interested can acquire, in relaxed atmosphere, competences that are suited on each single. The acquisition of these competences can take place independently and/or with personal learning-support according to the personal pre-conditions. Therefore KS has to be a mirror of these ideas, the design has to show an open learning environment, which provides physical openness (equipment), didactic openness (self-organized learning, open target setting, diversity of methods, individual portfolios, reflecting tools, specialized staff), psychological openness (e.g. intrinsic motivation) and virtual openness (independence of time and space for learners and collaboration among geographically dispersed participants).
The Virtual Key Shop /VKS/ is an important integral part of the Real Key Shop /RKS/ environment. It is considered as a virtual environment facilitating and supporting the RKS
providers as well as the end RKS users in their activities. VKS has to be regarded as a component of the RKS learning space. The main aim of the VKS is to facilitate and support all RKS participants by providing appropriate services.
KeyShop aims to reinforce the contribution of life-long learning to social cohesion, active citizenship, intercultural dialogue, gender equality and personal fulfilment, and to gain new or long forgotten experience: Learning is fun!
KeyShop will foster individual’s ability to turn ideas into action, including the promotion of creativity, innovation and risk/responsibility taking, as well as the ability to plan and manage projects, as individual and as community (also virtual), in order to achieve objectives. This supports everyone in day to day life at home and in the society, employees in being aware of the context of their work and being able to seize opportunities to improve personal and social wellbeing. Theoretical and Methodological Fundaments
It is proved, by practice, that the blended solutions are most applicable when the training requires trainees to be aware of, understand, apply, evaluate and synthesize information in different situations. Bearing in mind the specific of our target group (adult learners, highly skilled people, professionals), as fundaments in the methodology development were taken into account both the “Andragogy” theory [2,3] and
171

Mariya Monova-Zheleva, Yanislav Zhelev, Dimitar Minchev
the “Homo Zappiens” theory [5] which we tried to blend appropriately with SEL theory [http://www.casel.org/basics/index.php] and
“Europeans Awareness Scenario Workshop” methodology [1].
SEL /SElf-organized successful Learning/ has its origin in the English “Key Skills Model”.
Fig. 1. KeyShop website (http://www.thekeyshop.eu)
The SEL Systematic is the German
translation and evaluated systematics. The essence of the SEL philosophy aims at changing the attitude towards learning. SEL prepares for a lifelong and life-comprising learning, a readiness which has become indispensable for both integration into world and for job qualification.
Because of its absolutely individual approach, SEL can be applied regardless of the target groups, i.e. it is suitable for all learners and also offers people, who are far from any process of education, a real chance for a successful integration into processes of education. SEL is suitable for conveying basic qualifications and skill qualifications from those with a minor qualification up to specific continuing education for highly-qualified people.
The essence of the SEL philosophy aims at changing the learners’ attitude on life-long learning so they will rediscover and strengthen the joy of learning. There is no learning under group pressure, no theoretical learning without relationship to the reality of work or private life, no courses at the wrong time, no teacher-centred lessons...
The trainers are involved in critically re-thinking their own way of training in order to collaborate and to re-define the contents production modes, so that the learning methodology proposed turns out to be effective.
As one of the methods for decision making and organising self-determined learning processes we offer a virtual version of the Scenario Workshop. The Austrian partner adapted it by the EASW method and tested it on different target groups and topics.
The European Awareness Scenario Workshop Method enable the direct participation of social groups from civil society. The setting of a EASW Workshop [1] offers the participants a direct opportunity for exchanging and discussing their points of view, doubts, suggestions and wishes, regarding a particular topic or problem, with experts and decision-makers. Furthermore, it is a tool for promoting dialogue, furthering involvement and for managing a constructive discussion between various actor groups.
The virtual version will, of course, not be the same but we believe it to be a very fruitful and participating tool for learners, trainers, political decision makers and educational organisations bringing them together not hindered by international boundaries. e-Platform Virtual KeyShop (VKS) – integration of e-learning, e-practicing and e-tutoring
Virtual KeyShop is an important integral part of the KS environment. It has is considered as an e-platform facilitating and supporting the KS providers as well as the end KS users in their
172

KEYSHOP – PLATFORM FOR E-LEARNING, COLLABORATIVE WORK, KNOWLEDGE SHARING AND ELECTRONIC MATERIALS
activities. VKS has to be regarded as a component of the KS open learning space. The main requirements concerning the platform were: it to be friendly, easy to use, with clear guidelines, and last but not least, the learning how to use the platform has to be easy and intuitive.
The reasonable behind the VKS is represented by the limited resources in terms of teachers (coaches), spaces, but above all by the distant users’ available time, the latter being far from the places of teaching, of student-workers and, particularly, of those customers that want or need to improve their knowledge and/or update their professional skills.
The VKS establishment is based on adoption of open source software in accordance with EU policy for using open source platforms as a key priority in the context of interoperability, security, expenses reducing, transparency, and standardization. The VKS environment is structured in training area and communication area. The communication area consists of a set of instruments promoting collaborations and cooperation activities – forum, news section, web-conferencing facilities, virtual lab, and announcements section. Users have also been supported by problem reporting system collecting requests on technical doubts/problems, etc. The training area provides link to the local e-learning system established in
the corresponding partner organization. The access to the learning content represented in the e-learning system is regulated in accordance with the organization’s common rules and policy. VKS Architecture and Functionality
The main aim of the VKS is to facilitate and support all KS participants by providing appropriate services [4].
The VKS functionality is considered so that the holistic approach to be mirrored in the frame of the SEL systematics, where the qualification fields are communication, application of ICT, working together, problem solving and improvement of own learning and performance through improvement and extension of the digital competences. Digital competences involve the confident and critical use of Information Society Technology for work, leisure and communication. VKS is focused on the use of computer networks to retrieve, assess, store, produce, present and exchange information, emotional support and a sense of belonging to and participating in open educational networks.
• Reception area. Welcome area has to be a virtual mirror of KS welcome area. This module presents, in short, the available KS (real and virtual) services for potential new users.
Fig. 2. Virtual KeyShop welcome area (http://keyshop.bfu.bg)
• Registration. This architectural module
allows the identity of all users to be established and each of them to be appropriately authorized ensuring support of access permission and rights
173

Mariya Monova-Zheleva, Yanislav Zhelev, Dimitar Minchev
policies against resources and data consuming. Another important part of this module is the problem reporting system. Each user accesses the platform through a personal Username and Password.
• Personal Training Centre. Here VKS customers can follow the link to the virtual learning environment already existing in the organization established KS. Thus, the VKS customers will be able to make use of all available services and facilities under the rules of corresponding organization. The KS coaches could use their organization’s virtual learning environment via VKS in order to implement blended learning models.
• Mediathec. Virtual library/repository for multimedia materials (articles, links, demos, lessons, learning modules or courses). The library is separated in two parts: common part (accessible for any user of VKS) and private part, where materials are accessible only for users having appropriate authorization. The key part of this module implementation is the search engine, which supports the finding of information resources including learning objects, assets, e-reserves, learning opportunities and so on.
• Café & Contact Point area. Key part of this module is the communication system allowing synchronous and asynchronous communication between all agents. The functionality comprises:
- free e-mail and e-mail management facilities. The VKS participants could make use of the address book with short presentation of users (interests, preferences, hobby, etc.) in order to make contact;
- support of chat in the two forms - one to one messaging as well as multi-user chat;
- forum with support the use of asynchronous collaborative messaging;
- support of DB where for each VKS participant are specified his/her preferred communication method(s) (phone, Skype, icq, messengers, etc.), and personal details.
- tools for dissemination of news and announcements.
• Community of Practice. It comprises tools which support virtual communities of practice (groups of interests) focused on idea sharing and shared activities. Part of this module
is a system based on the European Awareness Scenario Workshop method which has been considered as a tool supporting and promoting the process of decision making and problem solvi
roblem through virtual and/or real consult
ric, interesting facts rubric, etc. re presented.
tware tools taken into cons
lic Adm
ed on PHP language and MySQL atabase.
• tel Pentium IV 2.66
• oferver - Operation
ase Engine
• Add Software
- - Simple Machine Forum 1.1.6
ng in different situations and contexts. • Consulting Point. This module comprises
DB with information about experts in different subject domains and corresponding contact information on them. Important part of the module is the searching engine, which allows the VKS participants to find contact information about those experts who could help them to solve given p
ation. • Fun Point. This module comprises
entertainment area where games and music link lists, jokes ruba
Software decisions All the sofideration are: • Open Source under the terms of the GPL
license. In accordance with the EU policy the use of Open Source Platforms is a key priority in the context of interoperability, security, expenses reducing, transparency, and standardization. Adoption of open source software has clear social and political support in Europe. European Commission funds research programs such as IST and IDABC /Interoperable Delivery of European e-Government Services to pub
inistrations, Businesses and Citizens/[6]. • Bas
d
Technical Requirements Hardware
Proce- ssor - InGHz
- Memory 1GB - Hard Drive Space - 80GB S tware - Windows 2003 S
System - IIS6 - Web Server - MySQL 5 - Datab- PHP 5 - Hypertext Pre-processor
itional - Electronic Learning Platform - Moodle
2 dev Forum
174

KEYSHOP – PLATFORM FOR E-LEARNING, COLLABORATIVE WORK, KNOWLEDGE SHARING AND ELECTRONIC MATERIALS
- Mail Server - hMailServer 5.0 build 310
- Web Mail Client - RoundCube 0.2 beta
Below the list of selected software tools is presented briefly:
• E-Learning Platform – Moodle 2.0 dev - Moodle is a Course Management System (CMS), also known as a Learning Management System (LMS) or a Virtual Learning Environment (VLE). It is a
spam protection and can attach to your virus c
meet
1.3.4 is a hat allows thumb nailing images
stimulate a broader disse
re onsistent with the whole KS philosophy. The
y adaptable to the cust
kages (specialized stud
of the coun
The consortium deve
ending process which must be som
• Another central aim of the EU is self organisation of the citizens and participation in decision making and community life. The project raises also skills useful in these processes.
free web application that educators can use to create effective online learning sites.
• E-Mail Server – hMailServer 5.0 build 310 - hMailServer is a free e-mail server for Microsoft Windows. It's used by Internet service providers, companies, governments, schools and enthusiasts in all parts of the world. It supports the common e-mail protocols (IMAP, SMTP and POP3) and can easily be integrated with many existing web mail systems. It has flexible score-based
s anner to scan all incoming and outgoing email.
• E-Mail Web Client – RoundCube 0.2 beta - Vanilla is an open-source, standards-compliant, multi-lingual, fully extensible discussion forum for the web. Anyone who has web-space that
s the requirements can download and use Vanilla for free.
• Forum Software - Simple Machines Forum 1.1.6 - SMF in short — is a free, professional grade software package that allows users to set up their own online communities within minutes. Its powerful custom made template engine provides for full control of the lay-out of the message board and with unique SSI /Server Side Includes/ function users can let their forum and website interact with each other. SMF is designed to provide users with all the features they need from a bulletin board while having an absolute minimal impact on the resources of the server.
• File Browsing – FileBrowser PHP application tand viewing them in a web browser. Plans for Future
The main interest is to have a sustainable concept to run the KeyShops (e.g. business plan, selling events) after the project duration to make sure, that the dissemination of our new culture of learning goes on.
During the project period will be established KeyShops in Germany, Austria, Italy and Swiss, run successfully the Virtual KeyShop and have a lot more Trainings for multipliers and potential partners for new KeyShops. As well as European networks could
mination, also after the end of this multilateral project and these links could represent further developments starting from the achieved results.
The created virtual tools support the diffusion of our on-going progress and they actools are open and eas
omers needs and requirements so they will contribute to the broad audience engagement. Contribution to EU policies
The KeyShop project making lifelong learning a reality and therefore we develop on different levels work pac
ies, real and virtual KeyShops, Train-the-Trainer-Programme, business plan e.g.) which will help to implement a new culture of learning. Some important aspects are:
• Elderly people suffer, more than others, the digital divide and, at now, in most
tries they do not take advantages from the new technology. Key Shop tries to give answers to this need, enabling people to get familiar with ICT, learning with pleasure and fun.
• Lifelong learning as one of the basic principles of the EU is an instrument supporting active citizenship and better integration of people in the labour market, the requests of which are rapidly changing. The project intends to make a serious contribution to the development of this idea from a key word to intense vitality. People who aim at learning need guidance, skills and tools to realise these goals.
loped a self organised approach lifelong learning based on the understanding that learning is a never
etimes professional guided. • Our KeyShop concept is as well a bridge
between formal, non-formal and informal education.
175

Mariya Monova-Zheleva, Yanislav Zhelev, Dimitar Minchev
References: 1. Carlsson C. EASW. Eine Europäische
Szenariowerkstattsmethode für partizipatives Planen und Bewußtseinsbildung. Monitorenausbildung in Wien. IRC-BIT in Zusammenarbeit mit Hippopotamos Bildungsberatung. Broschüre, 28-29 November 1997.
2. Knowles, M. S. The modern practice of adult education: From pedagogy to andragogy. Englewood Cliffs, NJ: Prentice Hall Regents, 1980.
3. Knowles, M. S. Andragogy in action. San Francisco: Jossey-Bass, 1984
4. Monova-Zheleva M., Zhelev Y. KeyShop – New Solution in Emergency Management. In: Proceedings of Int. Conference “Management and Sustainable Development”, 21-23 March, Yundola, Bulgaria
5. Veen, W. Learning strategies of Homo Zappiens: Towards new learning Arrangements. In: Book of Abstracts (pp. 20-25). Berlijn: ICWE GmbH. (TUD)
6. IDABC http://europa.eu.int/idabc/en/
KEYSHOP – ПЛАТФОРМА ЗА ЕЛЕКТРОННО ОБУЧЕНИЕ, КОЛАБОРАТИВНА РАБОТА, СПОДЕЛЯНЕ НА ЗНАНИЯ И МАТЕРИАЛИ В ЕЛЕКТРОНЕН ФОРМАТ
Мария Монова-Желева, Янислав Желев, Димитър Минчев
Бургаски свободен университет
Резюме
Цялостното развитие на човечеството преминава под знака на търсене и усъвършенстване на начини и средства за комуникация и обучение. Днес, задълбоченият анализ и правилното разбиране на информационното съдържание и адекватното прилагане на придобитите знания и умения са основни предпоставки за намирането на оптимални решения както по отношение на лична реализация и начин на живот, така и по отношение на устойчивото развитие и управлението на цели общества и глобални икономики. В настоящата статия се представя платформа, която осигурява възможности за учене през целия живот, допринасяйки за изграждането на нова култура в обучението основаваща се на персонализирано и контролирано от самите обучаеми овладяване на ключови знания, умения и придобиването на професионална компетенции, релевантни на нуждите на бизнеса и пазара на труда. Разработката е финансирана от ЕС в рамките на проект „KeyShop – Нова култура на обучението”, Програма за учене през целия живот, Секторна програма Грюндвиг “Обучение на възрастни”. В статията са представени накратко целите, задачите и участниците в проекта. Описани са основните архитектурни модули на платформата, предлаганият набор от услуги и нейните функционални възможности.
176

УПРАВЛЕНИЕ И УСТОЙЧИВО РАЗВИТИЕ 2/2009(23) MANAGEMENT AND SUSTAINABLE DEVELOPMENT 2/2009(23)
УПРАВЛЕНИЕ РЕИНЖИНИРИНГОМ ПЕРСОНАЛА В ОРГАНИЗАЦИЯХ КАК ОСНОВА
УСТОЙЧИВОГО РАЗВИТИЯ БИЗНЕСА
Андрей Блинов, Ольга Рудакова Всероссийский заочный финансово- экономический институт, Москва
Российская Федерация
Резюме В развитии банковского сектора страны существует целый ряд значительных проблем, диспропорций и
противоречий. Повышения эффективности банковской системы важным является работа по модернизации банковского менеджмента. В качестве управленческого подхода российским коммерческим банкам целесообразно освоить реинжиниринг. Наличие единого информационного пространства обеспечивает единый и целостный взгляд на процессы, происходящие в банке, повышает управляемость и надежность банка, что особенно важно в условиях реальной конкуренции. Вопросы реорганизации управления информационными технологиями в коммерческом банке являются как никогда актуальным.
Ключевые слова: банковая деятельность, информацинные технологии, реинжиниринг, персонал В развитии банковского сектора страны
существует целый ряд значительных проблем, диспропорций и противоречий. При общих позитивных тенденциях деятельность денежно-кредитных институтов значительно отстает от потребностей развивающейся российской экономики. Необходимо формирование современной банковской инфраструктуры, создающей предпосылки для эффективного информационного, методического, научного, кадрового, технологического обеспечения банковской деятельности.
По своему содержанию банковская деятельность начинает существенно отличаться от деятельности в предыдущем периоде: значительно возросла и будет возрастать цена ошибки неверно принятого решения; постоянно растет профессионализм других участников рынка.
В контексте повышения эффективности банковской системы важным является работа по модернизации банковского менеджмента. В качестве управленческого подхода российским коммерческим банкам целесообразно освоить реинжиниринг. Реинжиниринг предполагает более глубокую перестройку, чем все другие способы модернизации бизнес-процессов (интенсификация, расширение, инновация, диверсификация и т. д.) — качественный скачок в организации бизнес-процесса, а не постепенное и непрерывное улучшение последнего. Основой данного подхода является анализ и оптимизация бизнес-процессов банка, которые должны быть выявлены, отлажены, приведены в соответствие с эффективной
стратегией развития банка и взаимоотношений с клиентами.
Стремление банков к достижению конкурентных преимуществ на финансовых рынках закономерно обуславливает активное внедрение в современную банковскую практику самых последних достижений в области вычислительной техники, сетевых и информационных технологий, методов защиты информации и обработки данных.
Наличие единого информационного пространства обеспечивает единый и целостный взгляд на процессы, происходящие в банке, повышает управляемость и надежность банка, что особенно важно в условиях реальной конкуренции.
Грамотная автоматизация требует: - выбора информационных технологий, адекватных стратегиям банка;
- экономически эффективной последовательности внедрений, ориентированной на быстрый поэтапный возврат инвестиций;
- привлечения высококвалифицированных специалистов по внедрению и сопровождению;
- обучения персонала банка. Сохранившийся до сих пор подход к
автоматизации деятельности коммерческого банка, выражающийся в требовании инструментально поддержать существующую систему управления, не просто безнадежно устарел, а является методологически неверным. Исходя из такой формулировки,
177

Андрей Блинов, Ольга Рудакова
любая автоматизация успешна. Руководство банка зачастую даже не задается вопросами о том, как изменятся бизнес-процессы, обеспечивающие оказание услуг или управление, как изменится организационная структура управления. При этом задуманная руководством организационно-технологическая перестройка рассматривается как основной процесс, а информационные технологии - как инструмент поддержки этого процесса, что является неправильным. В настоящий момент назрела необходимость в совершенствовании корпоративного управления (повышения уровня менеджмента) в коммерческих банках; модернизации деятельности коммерческих банков на основе принципов реинжиниринга; сокращении издержек и повышении рентабельности банковского бизнеса, качества предлагаемых услуг; разработке стандартов качества банковской деятельности. Поэтому вопросы реорганизации управления информационными технологиями в коммерческом банке являются как никогда актуальным.
Важным этапом является анализ социальных составляющих процесса реинжиниринга, который включает оценку таких аспектов, как готовность пользователей к поддержке нового решения, повышенным нагрузкам и обучению работе с новыми программными продуктами, соответствие их квалификации современным требованиям и технологиям, адекватности их ожиданий. Это тем более важно, что, как показывает практика, неудачи многих проектов в этой области носят именно социальный характер.
В связи с этим одним из факторов, оказывающих существенное влияние на процесс реинжиниринга, является персонал. В команде, выполняющей проект реинжиниринга и контролирующей его проведение, необходимо участие сотрудников, наделенных соответствующими полномочиями и способных создать атмосферу сотрудничества. Сотрудники должны понимать, почему проект приведен в действие (другими словами, они должны оценивать проблемы, которые мешают бизнесу), принимать свои новые обязанности, быть способными выполнять их, посвящать реинжинирингу необходимое время и обоснованно двигаться к успеху.
Многие группы по реинжинирингу создаются в качестве «ударного звена»: руководство компании реагирует на кризис в
подразделениях привлечением внешних консультантов или направлением на этот участок внутренних консультантов. К сожалению, вероятность того, что сторонние специалисты смогут что-то существенно изменить в организации самостоятельно, невелика. Но нельзя рассчитывать и на внутренних консультантов. Дело в том, что, как правило, те, кто ближе к проблеме, даже не видят ее. Они вряд ли в состоянии что-либо радикально изменить. Более того, они-то и послужили причиной возникновения проблем. Внутренние консультанты не могут быть объективными, они не видят задач, лежащих вне их подразделения, не обладают техническими знаниями и средствами, необходимыми для реструктуризации.
С другой стороны, они знают существующие процессы, их недостатки, обладают опытом работы, именно с ними взаимодействуют клиенты.
Соответственно, для успешного исхода дела работники подразделения должны осознать, что им нужна помощь, признать правильность предложенного решения проблемы и необходимость его внедрения. В то же время, нельзя обойтись без экспертных знаний и объективности сторонней организации.
Состав группы по реинжинирингу должен быть смешанным, например:
- те, кто совсем не знает процесса; - те, кто очень хорошо знает процесс; - представители клиентов компании, если есть такая возможность;
- один или два технических эксперта; - наиболее грамотные и преданные сотрудники;
- специалисты, не работающие в компании.
Важно, чтобы в группе было не более десяти человек. Если это невозможно, лучше отказаться от некоторых фигур, включенных из чисто «представительских» соображений.
Реинжиниринг в сфере банковских информационных технологий имеет ряд особенностей. И прежде всего эти особенности связанны с огромной ролью каждого ИТ-специалиста. Зачастую эти специалисты уникальны в своей области, и руководитель не имеет возможности быстро найти им адекватную замену на рынке труда. Этим обуславливается сложность управления этой категорией персонала, ее относительной
178

УПРАВЛЕНИЕ РЕИНЖИНИРИНГОМ ПЕРСОНАЛА В ОРГАНИЗАЦИЯХ КАК ОСНОВА …
самостоятельностью и способностью оказывать существенное влияние на внедрение любых новых решений.
Сложность управления творческим потенциалом персонала посредством командной работы может быть обусловлена отсутствием культуры совместной деятельности, индивидуализмом, стремлением к лидерству, личным результатам, нетерпением. Это требует от каждого участника понимания общей ситуации. Поэтому здесь важную роль играет свободный обмен информацией, объем, полнота и точность которой намного превышают те, которые нужны для оперативного руководства.
По своей специфике ИТ-специалисты – высокообразованные, творческие люди. Они, с одной стороны, позитивно воспринимают все новое, все то, что может оптимизировать и автоматизировать их работу – и именно на этом аспекте внедрения процессного подхода к управлению следует сделать акцент при проведении презентаций проекта реинжиниринга.
С другой стороны, они критически относятся к любым попыткам формализации результатов их деятельности, полагают, и отчасти справедливо, что далеко не всякий эффект может быть количественно измерен. Например, опытный программист может решить задачу по автоматизации некоего процесса в течение 20 минут, тогда как у новичка на это уйдет 10 недель. Задача будет решена в любом случае, но сопоставимы ли трудозатраты первого и второго?
Следовательно, второй ключевой точкой для успешного проведения реинжиниринга ИТ в кредитной организации является адекватная оценка трудозатрат каждого специалиста, основанная не только на длительности, но и на качественном содержании подготовленного решения.
Еще одним залогом успешного проведения проекта по реинжинирингу ИТ в банке является достаточное его финансирование, позволяющее внедрить новую технологию в полном объеме. Только в этом случае от решения действительно будет положительная отдача, частичное внедрение может привести к прямо противоположным результатам. Вместо упрощения и повышения эффективности вся система управления информационными технологиями может стать лишь более громоздкой – «половинчатое» решение
наложится на уже существующее, и обе системы будут существовать параллельно, еще более запутывая ситуацию, приводя систему к полной неуправляемости, а все оценочные показатели – к полностью нерепрезентативным.
Следовательно, необходимость проведения реинжиниринга следует довести не только до ИТ-руководства, но и до руководителей бизнес-подразделений, а также – до руководства высшего звена.
Кардинальные изменения в технологии работы кредитной организации, появление новых продуктов и услуг приводят к тому, что система автоматизации и управления деятельностью банка, которая использовалась ранее, перестает отвечать новым изменившимся требованиям с точки зрения банковской технологии.
В то же время сфера информационных технологий с каждым годом все более усложняется. ИТ поглощают огромные финансовые и временные ресурсы, при этом не всегда предоставляя адекватный эффект. Одной из самых распространенных причин такой негативной ситуации являются ошибки в управлении организацией информационных технологий в банке.
К причинам таких ошибок можно отнести, во-первых, непонимание со стороны руководителей бизнес-подразделений всей важности влияния на ход их работы поддержки информационных технологий на соответствующем уровне. Во многих банках ИТ по-прежнему считается второстепенной, не прибыль-приносящей структурой. С этим нельзя согласиться, так как в ситуации сбоя автоматизированной банковской системы, или как минимум сбоя в работе магистрального канала связи, банк будет парализован, будет остановлена деятельность всех подразделений до окончания восстановительных работ.
Во-вторых, как следствие первого – недостаточный уровень заработной платы ИТ-специалистов (в десятки раз ниже аналогичного в странах Европы). Это порождает высокую текучесть кадров или наем менее квалифицированных специалистов – часто студентов или выпускников вузов. Подобное сокращение затрат в разы увеличивает риски, связанные с человеческим фактором: недостаточностью знаний и невозможностью своевременного выявления критичных участков, предотвращению сбоев заранее.
179

Андрей Блинов, Ольга Рудакова
Расчет экономической целесообразности реинжиниринга включает сопоставление возможных затрат и потенциальной экономической выгоды от использования нового решения. Для этого могут анализироваться такие параметры, как период окупаемости системы, чистая приведенная стоимость, норма рентабельности, общая стоимость владения и др. Цель всего этого процесса — хотя бы примерно оценить экономическую эффективность решения.
Несмотря на то, что ИТ-инфраструктура банка является подразделением,
ориентированным в первую очередь на обеспечение нужд бизнес-подразделений и не имеет прямого контакта с клиентами, от качества предоставляемых ею сервисов напрямую зависит эффективность работы всего банка. Качественно организованное, ориентированное на бизнес-процессы, хорошо структурированное и понятное ИТ – вот конечная цель трудного и длительного процесса реинжиниринга, оправдывающая и многократно окупающая все затраты.
180

УПРАВЛЕНИЕ И УСТОЙЧИВО РАЗВИТИЕ 2/2009(23) MANAGEMENT AND SUSTAINABLE DEVELOPMENT 2/2009(23)
ПОДХОДЫ К ОПРЕДЕЛЕНИЮ ТЕХНИКО-ТЕХНОЛОГИЧЕСКОЙ СОСТАВЛЯЮЩЕЙ
УСТОЙЧИВОГО РАЗВИТИЯ ОБЛАСТЕЙ УКРАИНЫ
Сергей Войтко Национальный технический университет Украины "Киевский политехнический институт",
Киев, Украина
Резюме Описано систему индексов и индикаторов измерения процессов устойчивого развития. На базе украинс-
кой экономики предложено использование концептуальных основ устойчивого развития для определения уров-ня отдельных регионов и областей. Приведены тенденции научно-технического развития. Определены наборы данных технико-технологического развития региона. Проведен обобщающий анализ примененного подхода. Предложено варианты использования разработки.
Ключевые слова: устойчивое развитие, регионы, технико-технологическая составляющая
Вступление Экономическая составляющая устойчивого
развития подразумевает оптимальное исполь-зование ограниченных ресурсов человечества. Разумное ограничение уровня потребления предоставляет возможность сохранять тот или другой ресурс или продлевать его использова-ние на более длительное время [1]. Структура потребления товаров, услуг и информации пос-тоянно меняется, особенно это заметно на эта-пе спада экономического развития. Возможным вариантом выхода с экономического кризиса может быть развитие технико-технологической составляющей сферы производства и предос-тавления услуг.
Повышение уровня экономической состав-ляющей устойчивого развития отдельно взятой страны или региона возможно в разрезе разви-тия техники и технологии, используя сущест-вующие наработки высоких технологий, при-меняя природо-, энерго- и материалосберега-ющих технологий, разрабатывая принципиально новые направления развития. Важной состав-ляющей также является информатизация об-щества, что приводит к изменению структуры как производства, так и потребления. Послед-нее время увеличивается трансферт техноло-гий, реализация патентов и лицензий, объектов интеллектуальной собственности.
Вышеуказанное дает основание сосредо-точить внимание не только на основных мак-роэкономических показателях устойчивого раз-вития таких, как ВВП на душу населения; раз-мер потребительской корзины; средняя зарпла-та и другое, но и использовать, на первый взгляд, второстепенные, уникальные для от-дельно взятой страны. Для Украины это транс-
портная инфраструктура страны, поступления от которой составляют более 50 % от сферы услуг, прежде всего, за счет транзитной сос-тавляющей [2].
1. Проблемная ситуация и задачи
Научной проблемой является необходи-мость комплексного исследования влияния технико-технологического фактора на развитие экономики региона, области, административ-ной единицы с учетом использования основных положений концепции устойчивого развития.
Основными задачами статьи являются сле-дующие: обобщение информации относительно наработок концепции устойчивого развития; разработка подходов к оценке места в рейтинге и уровня развития области, используя наработ-ки концепции устойчивого развития; анализ статистических данных по макроэкономичес-ким показателям областей Украины; предложе-ние варианта оптимизации по количеству пока-зателей для расчета устойчивого развития ре-гиона, области.
2. Основные положения устойчивого развития
Экономическая составляющая устойчивого развития формируется с индекса конкурентос-пособности (3 индикатора, 47 наборов данных) [3] и индекса экономической свободы (10 ин-дикаторов, 50 наборов данных) [4].
Индекс глобальной конкурентоспособнос-ти формируется с таких трех показателей:
1. группа индикаторов базовых требова-ний (Basic requirements);
2. группа индикаторов повышения эффективности (Efficiency enhancers);
3. группа индикаторов инновационности
181

Сергей Войтко
(Innovation and sophistication factors). В первую группу входят 4 комплексных
индикатора: институциональная среда (Institutions); инфраструктура экономики (Infrastructure); макроэкономическая стабиль-ность (Macroeconomic stability); здоровье лю-дей и начальное образование (Health and primary education). Вторая группа состоит из 6 индикаторов: высшее образование и система обучения (Higher education and training); эффективность товарного рынка (Goods market efficiency); эффективность рынка труда (Labor market efficiency); совершенство финансового рынка (Financial market sophistication); техно-логическая подготовленность (Technological readiness) и масштабы рынка (Market size). Третья группа характеризуется такими индика-торами: совершенство бизнеса (Business sophistication) и инновации (Innovations).
Индекс экономической свободы формиру-ется из таких 10 индикаторов: уровня свободы бизнеса; уровня свободы торговли; уровня фискальной свободы; степени зависимости экономики от правительства; уровня монетар-ной свободы; уровня инвестиционной свободы; уровня финансовой свободы; прав на частную собственность; уровня свободы от коррупции; уровня свободы рынка труда.
3. Практическая реализация положений кон-цепции для определения экономического разви-тия регионов страны
На примере украинской экономики пред-лагается использовать следующие индикаторы. Для индекса конкурентоспособности: институ-циональная среда; инфраструктура экономики; макроэкономическая стабильность; образова-тельная деятельность; эффективность товарно-го ринка; предпринимательская деятельность; международное торговое сотрудничество; эффективность ринка труда; технологическая подготовленность; инвестиционная привлека-тельность; масштабы ринка; инновационность; научная деятельность. Индекс экономической свободы характеризуется такими индикатора-ми: свобода бизнеса; свобода торговли; зави-симость экономики от правительства; инвес-тиционная свобода; права на собственность; свобода от коррупции; рынок труда; иностран-ные инвестиции; банковская сфера.
4. Основные тенденции научно-технического развития
Основными тенденциями научно-
технического развития в мире являются: ин-формационно-коммуникационные системы; биотехнология; генная инженерия; медицинские технологии; оптоэлектронные устройства; ком-пьютеры; телекоммуникация; электроника; гиб-кие автоматизированные производственные мо-дули; новые материалы; аэрокосмические тех-нологии; вооружение; атомная и ядерная тех-нологии; нанотехнологии [5].
Российская Федерация выделяет следую-щие приоритетные направления развития науки, техники и технологии: фундаментальные ис-следования; информационные технологии и электроника; производственные технологии; новые материалы и химические продукты; тех-нологии биологических и живых систем; транс-порт; топливо и энергетика; экология и рацио-нальное природопользование. В России также существует перечень критических технологий федерального уровня [6].
Поддержка таких направлений в Украине определенной степенью осуществляется Зако-ном «О приоритетных направлениях инноваци-онной деятельности в Украине» [7]. Украинс-ким законодательством определены следующие приоритетные направления развития: совер-шенствования химических технологий, новые материалы, развитие биотехнологий; охрана и оздоровление человека и окружающей среды; нанотехнологии, микроэлектроника, информа-ционные технологии, телекоммуникации; раз-витие высококачественной металлургии; мо-дернизация электростанций; развитие иннова-ционной культуры общества; высокотехно-логическое развитие сельского хозяйства и пе-рерабатывающей промышленности; новые и восстанавливаемые источники энергии; новые ресурсосохраняющие технологии; машиност-роение и приборостроение; транспортные сис-темы: строительство и реконструкция. Особен-ностью национальной инновационной системы является сосредоточение усилий как на тради-ционные направления, так и использование ми-ровых тенденций технологического развития.
5. Определение наборов данных технико-технологического развития
Анализируя вышеуказанное выбираем на-боры данных, которые могут быть использо-ваны при расчетах индикаторов устойчивого развития в технико-технологическом аспекте: состояние трансферта технологий; инноваци-онное развитие страны; уровень развития ин-формационно-коммуникационных технологий;
182

ПОДХОДЫ К ОПРЕДЕЛЕНИЮ ТЕХНИКО-ТЕХНОЛОГИЧЕСКОЙ СОСТАВЛЯЮЩЕЙ ...
уровень затрат страны на исследования и раз-работки; объемы иностранных инвестиций и другие. Одной из составляющих устойчивого развития является интеллектуальная собствен-ность. Тенденцию к росту этого показателя обуславливают политические, экономические, производственно-коммерческие факторы раз-вития экономики. Возможным является интен-сификация творческой деятельности, рост чис-ла как внешних, так и внутренних заявок на регистрацию объектов интеллектуальной собс-твенности. Это связано с созданием благопри-ятных экономических условий, в том числе и вступление Украины во Всемирную организа-цию торговли.
6. Формирование наборов данных
Учитывая доступность данных предлагает-ся использовать для предварительных расчетов 30 наборов данных. Среди них выделим те, ко-торые непосредственно касаются технико-технологической составляющей: объем пром-ышленной продукции; стоимость основных средств; объемы экспорта услуг; объемы им-порта услуг; количество научно-исследовательских организаций; численность работников научных организаций; внутренние затраты на научные и научно-технические ра-боты; количество промышленных предприятий, которые внедряют инновации; объемы иннова-ционной продукции; прямые инвестиции в об-ласть.
Основной принцип определения весового коэффициента по каждому набору данных – объемы поступлений в денежном выражении от той или иной сферы. Для индикатора, состоя-щего с двух наборов данных используется принцип Парето (соотношение 20:80), для двух наборов данных – соотношение 1:1:3 в зави-симости от важности составляющих.
7. Результаты и анализ предварительных рас-четов
По результатах расчетов наиболее перс-пективными в технико-техническом направле-нии являются Киевская, Донецкая, Днепропет-ровская, Харьковская, Запорожская, Одесская, Луганская, Львовская, Полтавская области и Автономна Республика Крым. Сравнивая ре-зультаты исследования всей экономической составляющей для страны имеем практически аналогичные показатели. Последовательность областей следующая: Киевская, Донецкая, За-порожская, Днепропетровская, Харьковская,
Луганская, Одесская, Львовская, Автономна Республика Крым, Полтавская.
Вариант расчета является ориентиро-вочным. На базе полученных данных предлага-ется провести оптимизационную процедуру, которая выключит те наборы данных, которые несущественно влияют на конечный результат. Результат анализа влияния весовых коэффици-ентов по вышеуказанному расчету следующий: 11 первых показателей в сумме составляет 0,815, то есть более 80 %, а первые 20 – 0,957. Для дальнейших расчетов по отдельным составляющим и по всему комплексу можно сократить.
8. К вопросу использования концепции устой-чивого развития
Внедрение разработок, основанных на концепции устойчивого, позволяет определить как статические, так и динамические характе-ристики экономико-социальных структур. В наше случае предложено инновационную, тех-нико-технологическую составляющую развития областей и регионов Украины. На основе пред-ложенной методики предлагается использовать разработки как:
- методические рекомендации для орга-нов государственной власти относи-тельно решения проблем реализации социально-экономических реформ и трансформации экономики;
- рекомендации касательно ликвидации неравномерного социально-экономического и технико-технологи-ческого развития регионов и областей страны, которое вызвано исторически приобретенным неравномерным расп-ределением факторов производства;
- проекты, позволяющие развивать вза-имовыгодные экономические связи между областями, дающие возмож-ность достижения удовлетворительного уровня торговли, научно-технического сотрудничества;
- взаимосогласование потребностей во внутренних и централизованных ре-сурсах области и региона.
Выводы
Оптимальное соотношение факторов для отдельных областей и регионов страны может привести к технологическому прорыву страны, что, в свою очередь, способствует развитию экономики, повышению технического уровня и
183

Сергей Войтко
качества реализации инноваций, приоритетной поддержки исследований. Страны-лидеры за индексами устойчивого развития в большинстве случаев являются носителями значительного интеллектуального потенциала. В таком случае использование наработок по устойчивому раз-витию и проекции их на частные случаи, разви-тие отдельных регионов или областей, позволит повысить экономический уровень всей страны. Таким образом основным элементом научной новизны исследования является предложенный комплексный подход к анализу уровня развития области (региона) страны на основе использо-вания концепции устойчивого развития.
Дальнейших научных исследований требу-ет количественная и качественная оценка влия-ния глобальных факторов на экономику регио-на страны в контексте устойчивого развития, учитывая тенденции влияния мирового эконо-мического кризиса.
Список литературы:
1. Згуровский М. З., Гвишиани А. Д. Глобальное
моделирование процессов устойчивого развития в контексте качества и безопасности жизни лю-дей (2005-2007/2008 годы). — К.: Издательство «Политехника», 2008. — 331 с.
2. Обсяг реалiзованої промислової продукцiї (робiт, послуг) за 2001-2005 роки. [Electronic Resource] Державний комiтет статистики України – http://www.ukrstat.gov.ua/
3. World Ecomomic Forum [Electronic Resource] 2007. WEF, – Read 16 March 2007. – www.weforum.org
4. Heritage Fundation [Electronic Resource] 2007. HF, – Read 15 June 2007. – www.heritage.org
5. Science and Engineering Indicators. 2000, National Science Board. – Wash., 2000. – Chapter 2, 7.
6. Постановление Правительства Российской Фе-дерации «Критические технологии федерального уровня» Правительственная комиссия по науч-но-технической политике. 21 июля 1996 г., № 2728п-П8 [Electronic Resource] 2007. – http://www.extech.msk.su
7. Закон України «Про прiоритетні напрями iнновацiйної діяльностi в Українi» вiд 16 сiчня 2003 року за № 433-IV.
184