uw faculty of management working paper series no 3
TRANSCRIPT

1
UW Faculty of Management
Working Paper Series
No 3/ October 2015
DO REGULATIONS AND SUPERVISION SHAPE THE CAPITAL CRUNCH EFFECT OF LARGE BANKS IN THE EU?
Małgorzata Olszak a
a Department of Banking and Money Markets, Faculty of Management, University of Warsaw, Poland
Mateusz Pipieńb, b Department of Econometrics and Operations Research, Cracow University of Economics, Poland
Iwona Kowalskac ,
c Faculty of Management, University of Warsaw, Poland
Sylwia Roszkowskad d Faculty of Economic and Social Sciences, University of Łódź, National Bank of Poland, Poland
JEL Classification: E32, G21, G28, G32
Keywords: capital ratio, lending, capital crunch, regulations, supervision, procyclicality

2
UW FM Working Paper Series are written by researchers employed at the Faculty of Management of UW and by other economists, and are published by the Faculty. DISCLAIMER: An objective of the series is to get the research results out quickly, even if their presentations are not fully polished. The findings, interpretations, and conclusions expressed in this Working Paper are those of their author(s) and do not necessarily the views of the Faculty of Management of UW. © By the Author(s). The papers are written by the authors and should be cited accordingly. Publisher: University of Warsaw, Faculty of Management Press
Address:
Str.: Szturmowa 1/3; 02-678 Warsaw, Poland
Telephone: +48 22 55 34 164
Fax: +48 22 55 34 001
This paper can be downloaded without charge from: http://www.wz.uw.edu.pl/serwisy,witryna,1,dzial,326.html
Information on all of the papers published in the UW Faculty of Management Working Paper Series can be found on Faculty of Management Website at: http://www.wz.uw.edu.pl/serwisy,witryna,1,dzial,326.html
ISSN 2300-4371 (ONLINE)

3
Do regulations and supervision shape the capital crunch effect of large banks in the EU? Małgorzata Olszaka,1, Mateusz Pipieńb, Iwona Kowalskac , Sylwia Roszkowskad,
a Department of Banking and Money Markets, Faculty of Management, University of Warsaw, Poland b Department of Econometrics and Operations Research, Cracow University of Economics, Poland c Department of Mathematics and Statistical Methods, Faculty of Management, University of Warsaw, Poland d Faculty of Economic and Social Sciences, University of Łódź, National Bank of Poland, Poland
Abstract This paper extends the literature on the capital crunch effect by examining the role of public policy for the link between lending and capital in a sample of large banks operating in the European Union. Applying Blundell and Bond (1998) two-step robust GMM estimator we show that restrictions on bank activities and more stringent capital standards weaken the capital crunch effect, consistent with reduced risk taking and boosted bank charter values. Official supervision also reduces the impact of capital ratio on lending in downturns. Private oversight seems to be related to thin capital buffers in expansions, and therefore the capital crunch effect is enhanced in countries with increased market discipline. We thus provide evidence that neither regulations nor supervision at the microprudential level is neutral from a financial stability perspective. Weak regulations and supervision seem to increase the pro-cyclical effect of capital on bank lending.
JEL Classification: E32, G21, G28, G32
Keywords: capital ratio, lending, capital crunch, regulations, supervision, procyclicality
1 Corresponding author. Tel.: +48 22 55 34 150; fax: +48 55 34 001. Address: Faculty of Management, University of Warsaw, ul. Szturmowa 1/3, 02-678 Warsaw, Poland. E-mail addresses: [email protected] (M. Olszak), [email protected] (M. Pipień), [email protected] (S. Roszkowska), [email protected] (I. Kowalska).

4
Contents 1. Introduction ............................................................................................................................................. 5
2. Theoretical and empirical background ...................................................................................................... 6
3. Data and research methodology ................................................................................................................ 9
3.1. Data .................................................................................................................................................. 9
3.2. The econometric model ....................................................................................................................11
4. Empirical results .....................................................................................................................................15
4.1. Effects of bank regulation on the link between loan growth and capital ratio .....................................18
4.2. Effects of supervision on the link between loan growth and capital ratio ...........................................20
5. Conclusions ............................................................................................................................................24
6. Acknowledgements .................................................................................................................................25
7. References ..............................................................................................................................................25

5
1. Introduction
The relationship between lending and capital ratios in economic downturns of large banks varies
substantially among European Union (EU) member states, meaning that the capital crunch effect
(i.e. reduction in lending resulting from capital requirements, as defined by Peek and Rosengren,
1995, p. 625) is diversified. This diversity exists despite the fact that many of these banks compete
with each other in the same or similar markets and thus are subject to more or less the same
economic factors. They are also subject to the same Basel minimum capital requirements
implemented in directives – which intend to create level playing field in the EU single market. Why
does the effect of capital on loan growth vary across different EU countries? This paper attempts to
answer this puzzle. The primary hypothesis examined in this paper is that country-specific
regulatory factors and supervision help to explain cross-country differences in the link between
lending and capital ratios amongst large banks in the EU.
This paper extends the existing research by including the regulatory and supervisory
characteristics that may affect the amount of capital private banks maintain (Brewer, Kaufmann and
Wall, 2008) and capital buffers of banks (Fonseca and González, 2010). Previous studies have been
limited to individual countries (United States by Beatty and Liao, 2011 and Carlson et al., 2013;
France by Labonne and Lame, 2014; United Kingdom by Mora and Logan, 2011), so that all banks
were affected equally by the country’s regulations and supervisory policy towards banks. Those
studies which focused on the link between lending and capital across countries, have not accounted
for regulations and supervision (Gambacorta and Marqués-Ibáñez, 2011). In other words, this paper
explores the effects, if any, of government policy factors on the association between loan growth
and capital ratio in economic downturns.
Whether and how the government policy affects the link between lending and capital is of
importance today. The results may have implications for the design of government policies towards
bank regulations and bank supervision, both official and private. The different effects of capital
ratio on lending may provide information about the extent to which more restrictive regulations

6
result in the possibility of reduced risk taking and therefore limit the impact of capital on loan
growth as well as the extent to which prudential supervision is substituting for market discipline.
Therefore our study should shed some light on the potential effects of current modifications in
capital standards included in Basel III, and in the EU CRD IV and CRR provisions.
The EU countries in the second half of the nineties and in the first decade of 2000’s are a
very good sample for investigating the question of the factors explaining this diversity of
relationship between capital and lending. On the one hand, in this period the process of
harmonization of standards aiming at smoothing functioning of a single market in Europe was
gaining momentum. On the other hand, several significant differences between those countries were
still present. The differences were particularly visible in the area of bank regulations and
supervision (Barth et al., 2006, p. 166-167). As Bart et al. find, both old member states as well as
new EU countries (i.e. those which accessed the EU in 2004) differed with respect to the
restrictiveness of the regulations and supervision.
The rest of the paper is organized as follows. Section 2 puts our study in the context of
research on the role of bank capital for loan supply and thus develops our hypotheses. We describe
our sample and research design in Section 3. We discuss results and supplemental analyses in
Section 4. Section 5 concludes our work.
2. Theoretical and empirical background
Banking activity is a very strongly regulated business due its inherent financial vulnerability and
instability (Minsky, 1986), which results from the market failures inherent to banking activity (i.e.
asymmetric information and limited commitment). Banks play an important role in reducing
information asymmetry between depositors (households) and borrowers (firms) by providing
monitoring of borrowers (Diamond, 1984). This delegated monitoring potentially explains why
banks hold lending portfolios instead of focusing on their comparative advantage, i.e. loan
origination and monitoring of borrowers (Beatty and Liao, 2014, p. 343). As Diamond (1984) and

7
Boyd and Prescott (1986) argue, by holding loans banks will have incentives to monitor borrowers
and produce information about credit risk, which should reduce the scope for financial instability.
Delegated monitoring increases agency problems between depositors and bank managers
because banks fail to take optimal risk from depositors’ perspectives. Tirole (2006) shows that
either demandable deposits or equity can be used as alternative mechanisms to control these agency
problems. However, the need for government bailouts during the recent financial crisis highlighted
concerns that insured demand deposits do not provide proper mechanism for monitoring banks or
adequate risk taking incentives. This led to calls for banks to be obliged to hold more equity capital.
Capital regulation in the form of internationally coordinated standards (Basel I, II and III accords)
has been introduced to counteract banks’ risk-shifting incentives being exacerbated by provision of
government safety net. In particular, Dewatripont and Tirole (1994) put forth the representation
hypothesis which argues that government is a representative monitor which helps to protect small
dispersed depositors from moral hazard and adverse selection due to the inability of such depositors
to conduct the monitoring functions at low cost and due to the potential of free rider problem (see
also Tirole, 2001).
Capital market imperfections can restrict bank lending during downturns (the so called
capital crunch hypothesis, Peek and Rosengren, 1995). Van den Heuvel (2011) argues that banks
may reduce lending due to capital requirements and costs of raising of new equity. The reduction in
lending can occur even when the capital requirement is not currently binding because low-capital
banks may optimally forgo profitable credit extension now to reduce the risk of future capital
inadequacy (see also Borio and Zhu, 2012). This can occur whenever increasing the capital base is
more costly than alternative funding sources. There are several explanations for this: information
frictions in pecking order theory (asymmetric information, Myers, 1984); issuance of new equity
may signal poor performance (adverse selection, Myers and Majluf, 1984); external equity finance
may be regarded as more prone to misuse by managers unless it provides sufficient control (agency
problems, Jensen and Meckling, 1984).

8
The problem of the effect of capital ratio on bank lending has been studied extensively since
the 1990’s, when the first Basel Accord was introduced as an international capital standard. Early
studies of the association show that bank capital may exert some impact on lending, but this effect
is relatively weak (see Jackson et al., 1999). Several recent papers focus mainly on the relationship
between capital and lending, but do not consider the capital crunch effect (see e.g. Berrospide and
Edge, 2010; Bridges et al., 2014 Labonne and Lame, 2014). The capital crunch effect is found in
large publicly traded banks by Beatty and Liao (2011) and in US commercial banks by Carlson et
al. (2013). Additionally, in a cross-country study Gambacorta and Marqués-Ibáñez (2011) show that
publicly traded banks tend to restrict their lending more during recessions or crisis periods. This
study, however, does not take into consideration the factors explaining the cross-country
heterogeneity of the link between lending and capital (i.e. the heterogeneity of capital crunch
effect).
Regulations and supervision may influence this link through their impact on market
discipline and therefore on capital kept by banks to cover unexpected losses. On the one hand,
tighter restrictions on bank activities may reduce depositors’ incentives to monitor banks, as they
may limit the opportunities for bank managers to undertake risky investments. This may result in
lower capital buffers and therefore amplify the capital crunch effect. On the other hand, the opposite
may be also true, if such restrictions result in better risk management of credit portfolio due to
deeper specialization and greater transparency. Fonseca and González (2010) show that more
restrictive constraints on a bank’s range of activities are related with greater capital buffers of
banks. Carlson et al. (2013) also show that capital crunch hypothesis is not found in banks with
greater capital ratios. We therefore expect that more restrictive regulations should be associated
with weakened capital crunch effect. Additionally, Brewer et al. (2008) find that more restrictive
capital standards are associated with more capital in relation to risky assets. We would accordingly
expect tighter restrictions on capital standards to make the capital crunch effect weaker.
Supervisory policies (official supervision, private market oversight, the power of deposit
insurer and restrictiveness of deposit insurance scheme) aimed at constraining excessive risk taking

9
resulting from moral hazard may affect the capital crunch effect in a number of ways. If official
supervisory authorities and deposit insurer have greater powers to intervene reasonably (i.e. without
political pressure) in banks to discipline managers, they may reduce the risk undertaken by banks
and will have a direct positive effect on capital buffers. Effective supervision may also enhance
investor confidence regarding expropriation and boost charter values (Fonseca and González,
2010). Empirical evidence finds such valuation effect for large banking organizations (Brewer et al,
2008) and for capital buffers (Fonseca and González, 2010). We thus forecast that stricter official
supervision is related with weakened capital crunch effect. Increased market discipline in countries
with better private oversight will make the cost of deposits more sensitive to bank risk and therefore
result in higher capital buffers (and weakened capital crunch effect). However, if banks decide to
operate at lower capital buffers in expansions to adapt to perceptions of reduced short-term risk then
capital buffers will be thin (and the capital crunch effect would be strengthened). Reduced moral
hazard, related to more market discipline typical for less generous deposit insurance, discourages
banks from taking greater risks (Merton, 1977) and to keep higher capital buffers. Empirical
evidence confirms this effect, showing that more generous deposit insurance decreases bank capital
buffers (Fonseca and González, 2010). For this reason, we expect that regulations reducing moral
hazard would have a negative impact on the capital crunch effect.
3. Data and research methodology
3.1. Data We use pooled cross-section and time series data of individual banks’ balance sheet items and profit
and loss accounts from 27 EU countries and country-specific macroeconomic indicators for these
countries, over a period from 1996 to 2011. The balance sheet and profit and loss account data are
taken from the Bankscope database, whereas the macroeconomic data were accessed from the
EUROSTAT and the IMF web pages. Due to the fact that capital crunch hypothesis is a better
explanation of constrained lending of large banks (see Beatty and Liao, 2011 and Carlson et al.,
2013), in each country we identify the 30% of banks with the largest assets. We look at both
unconsolidated and consolidated data in a separate analysis to address the problem of potentially

10
different capital crunch effect in banks consolidating financial statements and thus conducting their
business in several financial market segments, e.g. as financial conglomerates. In other words, large
banks reporting consolidated statements are larger (“too big to fail” or “too interconnected to fail”,
see Schooner and Taylor 2010; Stiglitz 2010, De Haan and Poghosyan 2012) and may be more
prone to moral hazard problems, because as the economic theory predicts, such banks undertake too
many risky investments (see also Freixas et al. 2007). We exclude from our sample outlier banks
by eliminating the extreme bank-specific observations when a given variable adopts extreme values.
The resulting sample includes 657 banks (6058 observations) in the case of unconsolidated data and
144 banks (2091 observations) in the case of consolidated financial data.
Barth et al. (2006) assemble a detailed database on bank regulation and supervision in over 150
countries to which we refer in our study. The characteristics of bank regulation in each country will
be incorporated through a measure of the scope of activities permitted to banks (REGRESTR)
constructed by Barth et al. (2006, and 2013). We measure the regulatory restrictiveness using an
index comprising two variables: restrictions on the range of activities (securities, insurance, real-
estate activities) and restrictions on bank ownership and control of non-financial firms. In our
analysis we chose to use the first principal component of the above-mentioned variables (see Barth
et al., 2006). It ranges from -0.3 to 0.5 with higher values indicating wider range of activities
permitted to banks.
We also incorporate the capital regulatory index constructed by Barth et al. (2006) as a
measure of the stringency of capital requirements. We explore the role of two such indices, with
higher values indicating greater stringency. First, the overall capital regulatory index (CAPREG),
which is simply the sum of two components: overall capital stringency and initial capital stringency.
Its values range from 0 to 10. The other, is the initial capital stringency index (INCAPSTR), which
ranges from 0 to 3 and shows whether certain funds may be used to initially capitalize a bank and
whether they are officially verified.
As the supervisory effectiveness variable we incorporate two measures developed by Barth
et al. (2006, 2013): the official supervisory power (OFFSUP) and the private sector monitoring
11
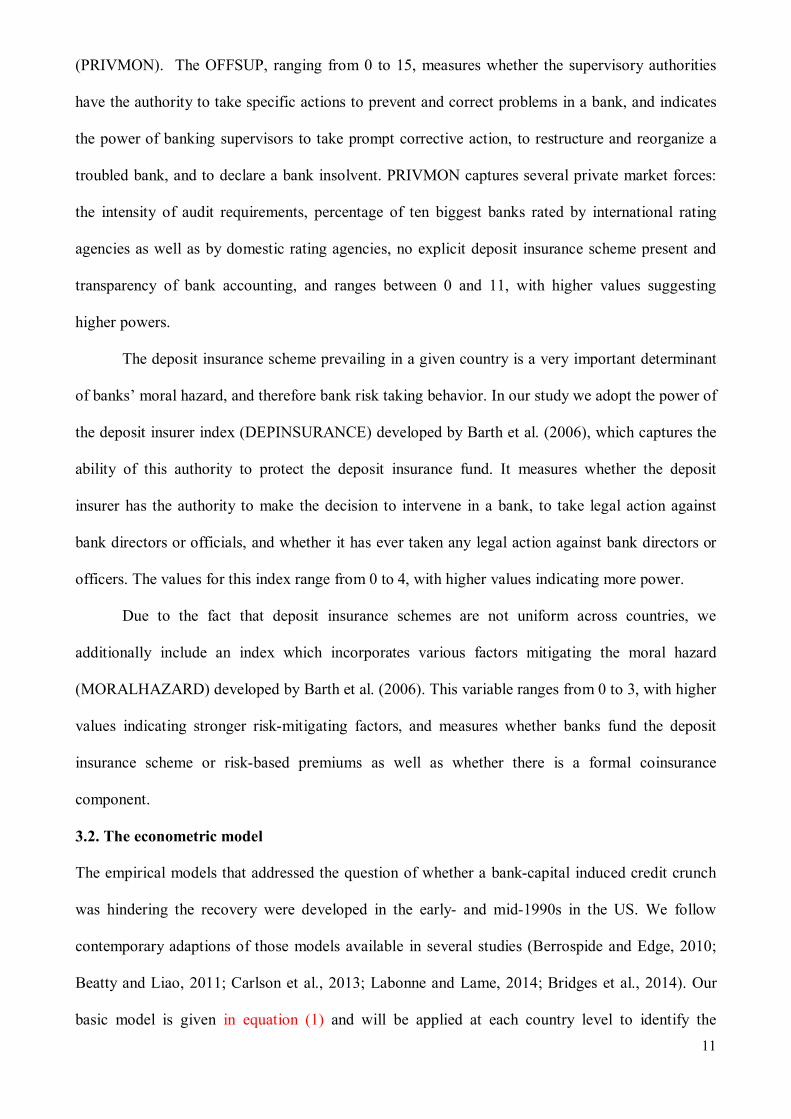
(PRIVMON). The OFFSUP, ranging from 0 to 15, measures whether the supervisory authorities
have the authority to take specific actions to prevent and correct problems in a bank, and indicates
the power of banking supervisors to take prompt corrective action, to restructure and reorganize a
troubled bank, and to declare a bank insolvent. PRIVMON captures several private market forces:
the intensity of audit requirements, percentage of ten biggest banks rated by international rating
agencies as well as by domestic rating agencies, no explicit deposit insurance scheme present and
transparency of bank accounting, and ranges between 0 and 11, with higher values suggesting
higher powers.
The deposit insurance scheme prevailing in a given country is a very important determinant
of banks’ moral hazard, and therefore bank risk taking behavior. In our study we adopt the power of
the deposit insurer index (DEPINSURANCE) developed by Barth et al. (2006), which captures the
ability of this authority to protect the deposit insurance fund. It measures whether the deposit
insurer has the authority to make the decision to intervene in a bank, to take legal action against
bank directors or officials, and whether it has ever taken any legal action against bank directors or
officers. The values for this index range from 0 to 4, with higher values indicating more power.
Due to the fact that deposit insurance schemes are not uniform across countries, we
additionally include an index which incorporates various factors mitigating the moral hazard
(MORALHAZARD) developed by Barth et al. (2006). This variable ranges from 0 to 3, with higher
values indicating stronger risk-mitigating factors, and measures whether banks fund the deposit
insurance scheme or risk-based premiums as well as whether there is a formal coinsurance
component.
3.2. The econometric model
The empirical models that addressed the question of whether a bank-capital induced credit crunch
was hindering the recovery were developed in the early- and mid-1990s in the US. We follow
contemporary adaptions of those models available in several studies (Berrospide and Edge, 2010;
Beatty and Liao, 2011; Carlson et al., 2013; Labonne and Lame, 2014; Bridges et al., 2014). Our
basic model is given in equation (1) and will be applied at each country level to identify the

12
association between loan growth and capital ratio during downturns (Downturn*CAP). This model
reads as follows:
∆퐿표푎푛 , = 훼 ∆퐿표푎푛 , + 훼 ∆퐿표푎푛 , + 훼 퐷표푤푛푡푢푟푛 + 훼 퐶퐴푃 , + 훼 퐷표푤푛푡푢푟푛 ∗ 퐶퐴푃 , +
훼 퐿퐼푄퐺퐴푃 , + 훼 퐷퐸푃퐵퐴푁퐾푆 , + 훼 ∆퐶퐴푃 , + 훼 푄퐿푃 , + 훼 푠푖푧푒 , + 훼 ∆푈푁퐸푀푃퐿 , +
훼 ∑ 퐶표푢푛푡푟푦 + 훼 ∑ 푇 +휗 , + 휀 (1)
where: i - the number of the bank; j-the number of country; t- the number of observation for the i-th
bank; ∆Loan – annual real loan growth rate; CAP – capital ratio, i.e. equity capital divided by total
assets; LIQGAP –liquidity gap, calculated as (loans to nonfinancial sector subtract deposits of
nonfinancial sector subtract interbank deposits)/loans to nonfinancial sector; this variable measures
the extent to which bank loans are financed by unstable funding (i.e. securitizations, etc.);
DEPBANKS – deposits from banks divided by total assets; ∆CAP – annual change in capital ratio;
QLP – is quality of lending portfolio (it equals loan loss provisions divided by average loans); size
– logarithm of assets; ∆UNEMPL - annual change in unemployment rate. Elements
∑ 퐶표푢푛푡푟푦 푎푛푑∑ 푇 are a set of country and time dummy variables. ϑ are unobservable
bank-specific effects that are not constant over time but vary across banks. Finally, ε is a white-
noise error term.
Considering the fact that we have access to annual data, we relate the loan growth rate to the
current period bank specific variables instead of their lagged values. Such choice is motivated by
three reasons. First, when banks design their capital allocation plans they do it based on the amount
of current risks (expressed in the previous level of capital ratio) and any expected increases in the
risks (which result from the loan extension plans) (see Resti and Sironi, 2007, p. 712). Second, the
actual lending decisions made throughout the year may also be adjusted taking account of the
current changes in bank capital as well as the changes in the quality of credit portfolio (because loan
loss charge-offs affect capital through changes in bank profits). This effect would be omitted if the

13
capital ratio was incorporated as lagged. Third, the usage of lagged variables would not resolve the
problem of simultaneity and the endogeneity bias (see also Roberts and Whited, 2011, p. 32).
We predict a negative coefficient on Downturn if loan supply declines during Downturns for
reasons other than capital and liquidity constraints (as do Beatty and Liao, 2011, p. 7). Further, if
external financing is not frictionless, and banks are concerned that they might violate capital
requirements, then the coefficient on CAP is expected to be positive. That is banks with higher
capital ratio will extend more loans. The coefficient on interaction term between Downturn and
CAP is our measure of capital crunch effect. A positive coefficient implies that lending is
constrained by capital. A negative coefficient would indicate that capital is not important in lending
extension during downturns.
To investigate the impact of government policy on the capital crunch effect we interact
regulatory and supervisory indices with our measure of capital crunch, i.e. Downturn*CAP. The
large number of country variables and the need to use interaction terms indicate that it is best to
incorporate each of the coefficients separately rather than incorporating the interaction terms of all
country variables at once (see e.g Barth et al., 2006 and Fonseca and González, 2010). The model
used to test the role of regulations (denoted as REGULATION) is given below:
∆퐿표푎푛 , = 훼 ∆퐿표푎푛 , + 훼 ∆퐿표푎푛 , + 훼 퐷표푤푛푡푢푟푛 + 훼 퐶퐴푃 , + 훼 퐷표푤푛푡푢푟푛 ∗ 퐶퐴푃 , +
훼 퐿퐼푄퐺퐴푃 , + 훼 퐷퐸푃퐵퐴푁퐾푆 , + 훼 ∆퐶퐴푃 , + 훼 푄퐿푃 , + 훼 푠푖푧푒 , + 훼 ∆푈푁퐸푀푃퐿 , +
훼 푅퐸퐺푈퐿퐴푇퐼푂푁 + 훼 푅퐸퐺푈퐿퐴푇퐼푂푁 ∗ 퐷표푤푛푡푢푟푛 ∗ 퐶퐴푃 , + 훼 ∑ 퐶표푢푛푡푟푦 +
훼 ∑ 푇 +휗 , + 휀 (2)
The model used to test the role of supervision (denoted as SUPERVISION) reads as:
∆퐿표푎푛 , = 훼 ∆퐿표푎푛 , + 훼 ∆퐿표푎푛 , + 훼 퐷표푤푛푡푢푟푛 + 훼 퐶퐴푃 , + 훼 퐷표푤푛푡푢푟푛 ∗ 퐶퐴푃 , +
훼 퐿퐼푄퐺퐴푃 , + 훼 퐷퐸푃퐵퐴푁퐾푆 , + 훼 ∆퐶퐴푃 , + 훼 푄퐿푃 , + 훼 푠푖푧푒 + 훼 ∆푈푁퐸푀푃퐿 , +
훼 푆푈푃퐸푅푉퐼푆퐼푂푁 + 훼 푆푈푃퐸푅푉퐼푆퐼푂푁 ∗ 퐷표푤푛푡푢푟푛 ∗ 퐶퐴푃 , + 훼 ∑ 퐶표푢푛푡푟푦 +
훼 ∑ 푇 +휗 , + 휀 (3)

14
In equation (2) (equation (3)) a positive coefficient on interaction term between
REGULATIONS (SUPERVISION) and Downturn*CAP would indicate that the positive relation
between loan growth and capital ratio in downturns increases with the country variable, consistent
with the diminished market discipline, which may lead to enhanced capital crunch effect. A
negative coefficient implies diminished risk taking and indicates that the country variable mitigates
the capital crunch effect.
In our study we apply the system of generalised method of moments (GMM) proposed by
Blundell and Bond (1998) with Windmeijer correction (2005). We control for the potential
endogeneity of CAP, LIQGAP, DEPBANKS, ∆CAP and QLP in the two-step system GMM
estimation procedure by the inclusion of up to four lags of explanatory variables as instruments. The
UNEMPL, as well as the country and the time dummy variables are the only variables considered
exogenous. As the consistency of the GMM estimator depends on the validity of the instruments,
we consider two specification tests. The first is the test verifying the hypothesis of absence of
second-order serial correlation in the first difference residuals (AR(2)) and the absence of first-order
serial correlation in the differentiated residuals (AR(1)). The second test which we apply is the
Hansen’s J statistic for over-identifying restrictions, which tests the overall validity of the
instruments tests (see Roodman, 2009, p. 141).
Our models include dynamic interaction between the capital ratio and the variables
describing changes in economic activity. As there is no comparable dataset including information
on business cycle stages in the EU member states, we had to assess the business cycle fluctuations
for the whole set of countries. To do this, we estimated frequencies and amplitudes of the Almost
Periodically Correlated (APC) stochastic process describing deviations from the long term trend of
the GDP growth observed quarterly using dataset covering in almost all EU countries (but for
Croatia, Cyprus, Czech Republic, Iceland, Ireland, Malta, Romania and Spain) 72 observations in
the period of 1st quarter of 1995 up to the 4th quarter of 2012 (other applications of this approach
show Parzen and Pagano, 1971; Frances and Dijk, 2005). The cyclical component, estimated
according to a subsampling scheme, described in details by Lenart and Pipień (2013), was utilized

15
to assess whether in a particular year the economy has contracted or not. We defined Downturn
period in the case when at least two quarters in a year can be characterized by a slowdown or
recession. This means that in those quarters deviation from the long term growth trend may be
positive or negative but the changes as compared to the previous quarter should be negative. In an
opposite case we marked appropriate year as no Downturn period.
4. Empirical results
Table 1 reports descriptive statistics of the sample (panel A) and the correlation coefficients from
the pooled estimation (panel B). Consistent with prior research (e.g. Berrospide and Egde, 2010;
Beatty and Liao, 2011; Carlson et al., 2013; Labonne and Lame, 2014) we find positive and
significant coefficient of 0.074 (p-value below 0.01) on CAP, indicating that on average loan
growth of banks in the EU is positively related to capital ratio. The negative correlation coefficient
between CAP and size suggests that banks with higher assets have lower capital ratios. Therefore,
following Carlson et al. (2013) we expect that large banks will be more sensitive to capital ratio in
their lending activity.
In table 2 we show the values of indices measuring the restrictiveness of regulations and
supervision across EU countries. As can be seen, there is a huge diversity of these measures in the
EU member states.

16
Table 1. Summary descriptive statistics of key regression variables (in percentage points) (PANEL A) and correlations (PANEL B).
PANEL A
∆LO
AN
S
Dow
ntur
n
CA
P
Dow
ntur
n*C
AP
∆UN
EMPL
LIQ
GA
P
DEP
BA
NK
S
∆CA
P
QLP
size
UNCONSOLIDATED Mean 4.03 0.51 6.75 3.71 -0.15 -84.40 13.93 0.05 0.80 15.11
# observations 9773 11876 10452 10451 10955 10328 8042 9602 10145 10575 CONSOLIDATED
Mean 3.82 0.51 5.83 3.04 -0.02 -49.82 17.96 0.03 0.43 7.79 # observations 1998 2304 2089 2089 2282 2091 2088 1943 2016 2091
PANEL B UNCONSOLIDATED
∆LOANS 1 Downturn 0.019 * 1
CAP 0.086 *** 0.022 ** 1 Downturn*CAP 0.063 *** 0.751 *** 0.517 *** 1
∆UNEMPL 0.034 *** 0.261 *** -0.034 *** 0.169 *** 1 LIQGAP -0.131 *** 0.001 0.092 *** 0.051 *** 0.003 1
DEPBANKS -0.058 *** -0.024 ** -0.423 *** -0.222 *** 0.020 * 0.014 1 ∆CAP -0.101 *** 0.002 0.081 *** 0.032 *** 0.041 *** 0.036 *** 0.038 *** 1 QLP 0.011 0.032 *** -0.059 *** 0.006 0.142 *** -0.033 *** 0.008 -0.068 *** 1 size 0.025 ** -0.005 -0.276 *** -0.140 *** 0.063 *** -0.080 *** 0.238 *** 0.018 * -0.085 *** 1
CONSOLIDATED ∆LOANS 1 Downturn -0.012 1
CAP -0.011 -0.030 1

17
Downturn*CAP -0.004 0.824 *** 0.382 *** 1 ∆UNEMPL -0.038 * 0.159 *** -0.014 0.122 *** 1
LIQGAP -0.052 ** -0.020 0.123 *** 0.039 * 0.026 1 DEPBANKS -0.003 -0.019 -0.130 *** -0.073 *** 0.033 -0.074 *** 1
∆CAP -0.008 0.020 0.184 *** 0.128 *** 0.096 *** -0.018 -0.021 1 QLP 0.074 *** 0.044 * 0.164 *** 0.107 *** 0.315 *** 0.061 *** 0.032 -0.005 1 size -0.018 0.011 -0.506 *** -0.207 *** 0.080 *** 0.048 ** -0.027 -0.001 -0.171 *** 1
∆loan – annual loan growth rate; CAP - capital ratio, i.e. equity capital to total assets; ∆CAP – annual change in capital ratio; DEPBANKS - Deposits from banks to total assets; LIQGAP - Loans less Total customer deposits less Deposits from banks divided by Loans; size - logarithm of total assets; QLP - Loan loss provisions divided by average loans ; ∆UNEMPL – change in annual unemployment rate; #obs – number of observations; *, **, *** denote significance at the 10%, 5% and 1% level, respectively.

18
Table 2. Heterogeneity of indices measuring regulatory restrictiveness and stringency of supervision and of the link between lending and capital of large banks during downturns
Country
REG
RES
TR
CA
PREG
INC
APS
TR
OFF
SUP
PRIV
MO
N
DEP
INSU
RA
NC
E
MO
RA
LHA
ZAR
D
Link between lending
and capital
# ba
nks
# ob
serv
atio
ns
Link between lending
and capital
# ba
nks
# ob
serv
atio
ns
UNCONSOLIDATED CONSOLIDATED
Austria -0.94 5 2 10 8 2 2 -0.518
24 211 -0.712
6 61 Belgium -0.94 6 0 13 9
-2.253
6 39 0.219
7 68
Bulgaria 1.05 5 1 10 6 1 1 0.373
4 43
Cyprus 1.49 3 2 11 7 2 2
1 5 0.701
3 37
Czech Republic 1.92 6 3 12 10 4
2 19 -0.240
3 39 Denmark -0.06 4 2 14 9 0 1 -0.159 *** 20 165 3.557
7 82
Estonia -0.50 8 2 8 7 1 2
1 7
2 23 Finland -0.06 8 3 11 7 0 1
1 6
2 16
France -0.06 4 2 6 7 4 2 -1.727 * 27 200 -0.030
21 213 Germany -0.94 6 3 11 7 1 2 -0.850 ** 350 3524 -1.945
6 72
Greece -0.50 3 2 11 11
2 22 -0.297
5 64 Hungary 0.82 5 2 15 9 0 2
3 39
Ireland -0.94 5 2 10 7 2 1
4 46 Italy 1.92 8 3 12
0 1 0.048
145 1278 -1.984
14 143
Latvia -0.50 4 3 10 7 1 2 -2.071
4 30
2 19 Lithuania 0.82 4 1 10 10 1 1
2 11
2 18
Luxembourg -0.06 9
15
1
-1.708 ** 7 41
3 36 Malta -0.72 5 3 14 9
Netherlands -2.04 3 2 11 10 0 0
0.959
7 76 Poland -1.16 5 2 13
0 2 0.195
8 61 -0.491
3 25
Portugal 1.92 4 0 9 8
2
2 15 -0.581
6 70 Romania 1.49 8 3 9 8 3 2
2 19 -0.014
2 20
Slovak Republic 1.05 7 2 8 9 0 2
2 14 2 24
Slovenia 0.38 7 2 13 4
3 26 3 36 Spain -0.94 4 1 10 9 1 1 -1.815
20 172 0.304 * 10 128
Sweden 0.38 4 1 11 8 1 2 -0.164
18 140 4 37 United Kingdom -2.92 10 3 15 9 2 3 -8.336 * 6 20 -0.537
17 196
Notes: The coefficients measuring the link between lending and capital in downturns have been estimated using the GMM estimator with robust standard errors, applied to model given by equation (1). *, **, *** denote significance at the 10%, 5% and 1% level, respectively; # denotes the number of banks or observations.
4.1. Effects of bank regulation on the link between loan growth and capital ratio

19
The regression results given by equation 2 are shown in columns (1)-(3) of Table 3 for
unconsolidated data and in columns (4)-(6) for consolidated data. Coefficients of both CAP and
Downturn*CAP are positive and statistically significant (but for the REGRESTR regression model
in which they are marginally significant). The results in columns (1) and (4) are consistent with an
expectation that restrictions on bank activities have two opposite effects on capital ratios and thus
on the link between lending and capital. The negative (and statistically significant) coefficient in the
unconsolidated data suggests that tighter restrictions on bank activities limit the capital crunch
effect. The positive coefficient present in consolidated data implies that reduced market discipline
increases the economic importance of capital in downturns.
Moreover, more restrictive overall capital standards (CAPREG) and initial capital
requirements (INCAPSTR) diminish the effect of capital ratio on loan growth in Downturns, as the
coefficients on both Downturn*CAP*CAPREG and Downturn*CAP*INCAPSTR are negative in
both unconsolidated and consolidated data. Thus our results are consistent with increased capital
ratios in countries with more restrictive capital standards. This results in a weakened capital crunch
effect.
Table 3 Regulations and capital crunch
Variables: (1) (2) (3) (4) (5) (6) UNCONSOLIDATED CONSOLIDATED
∆loan(-1) -0.079 ** -0.075 * -0.065 0.002 0.006 0.018 (-1.98) (-1.87) (-1.62) (0.05) (0.14) (0.37)
∆loan(-2) -0.115 -0.106 -0.047 0.086 ** 0.085 ** 0.079 * (-1.51) (-1.41) (-0.72) (2.33) (2.35) (1.85)
Downturn -2.864 ** -1.593 * -0.739 -2.149 -6.354 -5.573 (-2.34) (-1.67 (-1.02 (-0.47) (-1.10) (-0.96)
CAP 0.249 0.493 *** 0.520 ** -0.683 -1.297 -1.106 (1.46) (2.65 (2.43) (-0.73) (-1.14) (-1.09)
Downturn*CAP 0.306 0.681 ** 0.882 ** 0.368 3.393 2.114 (1.56) (2.02 (2.14) (0.45) (1.28) (1.16)
LIQGAP -0.008 -0.007 -0.007 0.002 0.005 0.003 (-1.29) (-1.12 (-1.15) (0.28) (0.53) (0.42)
DEPBANKS 0.049 -0.008 -0.030 -0.096 -0.091 -0.108 (0.5) (-0.09 (-0.40) (-1.01) (-0.93) (-1.13)
∆CAP -1.291 * -1.443 ** -1.436 * 0.354 0.401 0.466

20
(-1.90) (-1.98 (-1.88) (0.60) (0.67) (0.75) QLP -0.353 -0.389 -0.504 3.437 3.493 3.406
(-0.69) (-0.77 (-1.12) (0.79) (0.80) (0.79) size 0.795 *** 0.918 *** 1.060 *** -2.634 -1.885 -1.288
(3.49) (3.68 (3.11) (-0.72) (-0.64) (-0.55) ∆UNEMPL 2.091 *** 2.084 *** 2.001 *** -1.253 * -1.445 ** -1.264 *
(5.14) (5.44 (5.35) (-1.81) (-2.11) (-1.67) Intercept -9.534 * -15.675 ** -18.420 ** 27.560 16.743 14.188
(-1.94) (-2.49 (-2.24 (0.83) (0.69) (0.70)
REGRESTR 1.363 *** -2.395 (2.93) (-1.38)
Downturn*CAP* REGRESTR -0.136 *** 0.424 (-2.72) (1.14)
CAPREG 0.526 ** 1.598 (1.96) (1.50)
Downturn*CAP* CAPREG -0.091 ** -0.401 (-2.35) (-1.23)
INCAPSTR 1.423 ** 2.997 (2.25) (1.37)
Downturn*CAP* INCAPSTR -0.341 ** -0.560 (-2.48) (-0.97)
AR(1) -1.64 -1.64 -1.6 -1.85 * -1.87 * -1.79 * AR(2) -0.82 -0.85 -1.48 -1.56 -1.67 -1.35
Hansen test 602.23 *** 605.44 *** 598.16 *** 135.78 134.6 132.1 #banks 657 657 650 144 144 141
# observations 6068 6068 6027 1588 1588 1552 Notes: The models are given by equation (2). The symbols have the following meaning: ∆loan – annual loan growth rate; Downturn - Dummy equal to one in Downturns and 0 otherwise; CAP - capital ratio, i.e. equity capital to total assets; Downturn*CAP - Interaction between Downturn and capital ratio (CAP)∆CAP – annual change in capital ratio; DEPBANKS - Deposits from banks to total assets; LIQGAP - Loans less Total customer deposits less Deposits from banks divided by Loans; size - logarithm of total assets; QLP - Loan loss provisions divided by average loans ; ∆UNEMPL – change in annual unemployment rate. REGRESTR is the measure of regulatory restrictions on bank activities. CAPREG is the measure of overall stringency of capital requirements. INCAPSTR is the initial capital stringency index. Coefficients for the country and time dummies are not reported. The models have been estimated using the GMM estimator with robust standard errors. T-statistics are given in brackets. Data range 1996-2011. *, **, *** denote significance at the 10%, 5% and 1% level, respectively. # denotes the number of banks or observations.
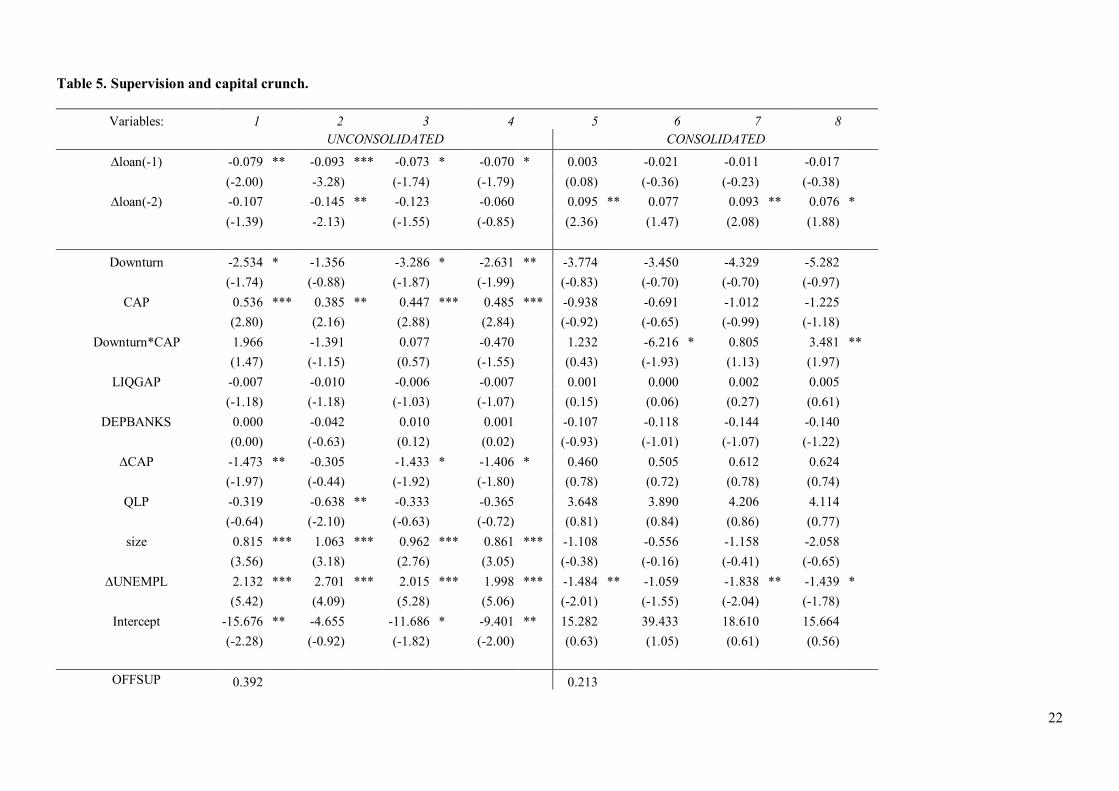
4.2. Effects of supervision on the link between loan growth and capital ratio
In Table 4 in Columns (1) and (5) we find that the coefficient on interaction between OFFSUP and
Downturn*CAP is negative (but only marginally significant in unconsolidated data) which supports
the hypothesis that effective official supervision reduces excessive risk taking and boosts bank
charter values and thus weakens capital crunch effect. The positive Downturn*CAP* PRIVMON
21
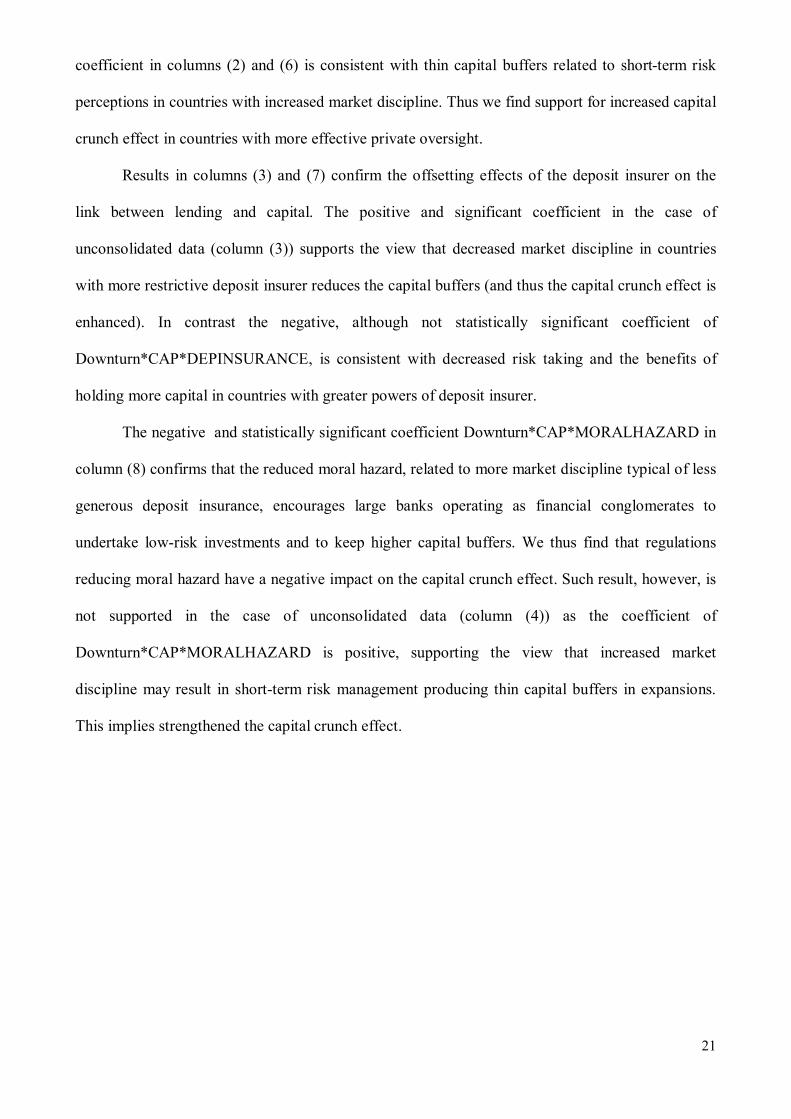
coefficient in columns (2) and (6) is consistent with thin capital buffers related to short-term risk
perceptions in countries with increased market discipline. Thus we find support for increased capital
crunch effect in countries with more effective private oversight.
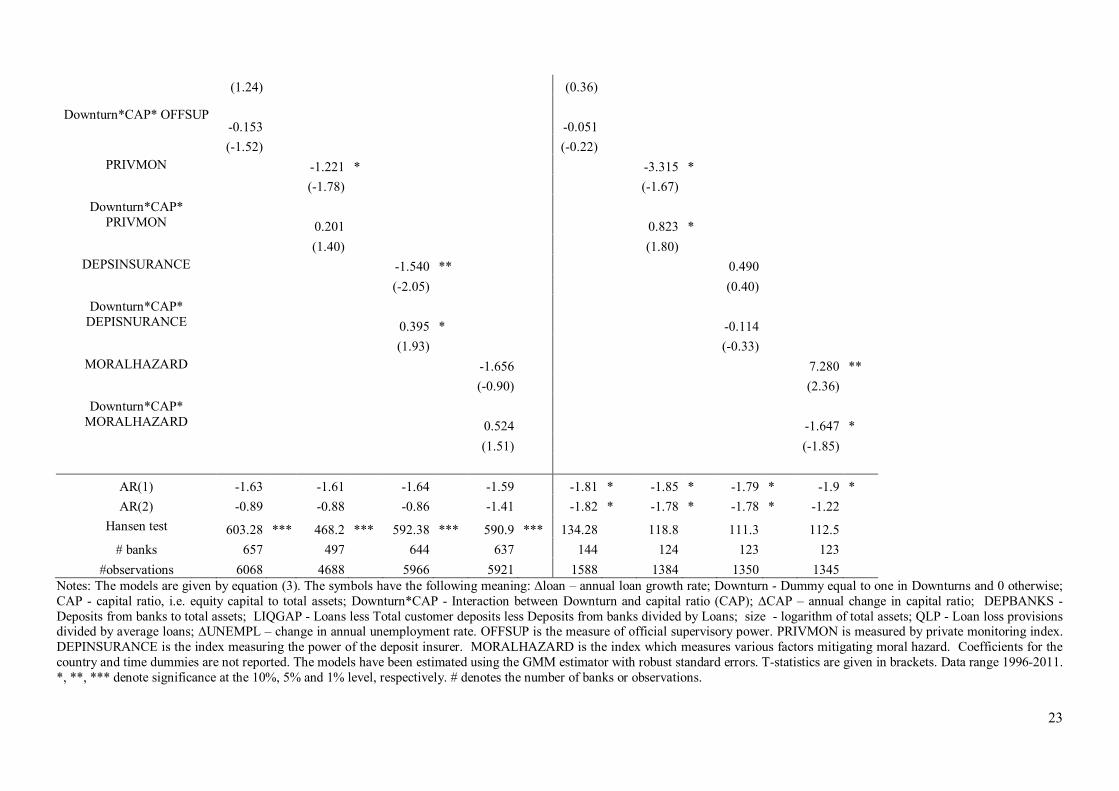
Results in columns (3) and (7) confirm the offsetting effects of the deposit insurer on the
link between lending and capital. The positive and significant coefficient in the case of
unconsolidated data (column (3)) supports the view that decreased market discipline in countries
with more restrictive deposit insurer reduces the capital buffers (and thus the capital crunch effect is
enhanced). In contrast the negative, although not statistically significant coefficient of
Downturn*CAP*DEPINSURANCE, is consistent with decreased risk taking and the benefits of
holding more capital in countries with greater powers of deposit insurer.
The negative and statistically significant coefficient Downturn*CAP*MORALHAZARD in
column (8) confirms that the reduced moral hazard, related to more market discipline typical of less
generous deposit insurance, encourages large banks operating as financial conglomerates to
undertake low-risk investments and to keep higher capital buffers. We thus find that regulations
reducing moral hazard have a negative impact on the capital crunch effect. Such result, however, is
not supported in the case of unconsolidated data (column (4)) as the coefficient of
Downturn*CAP*MORALHAZARD is positive, supporting the view that increased market
discipline may result in short-term risk management producing thin capital buffers in expansions.
This implies strengthened the capital crunch effect.
22
Table 5. Supervision and capital crunch.
Variables: 1 2 3 4 5 6 7 8 UNCONSOLIDATED CONSOLIDATED
∆loan(-1) -0.079 ** -0.093 *** -0.073 * -0.070 * 0.003 -0.021 -0.011 -0.017 (-2.00) -3.28) (-1.74) (-1.79) (0.08) (-0.36) (-0.23) (-0.38)
∆loan(-2) -0.107 -0.145 ** -0.123 -0.060 0.095 ** 0.077 0.093 ** 0.076 * (-1.39) -2.13) (-1.55) (-0.85) (2.36) (1.47) (2.08) (1.88)
Downturn -2.534 * -1.356 -3.286 * -2.631 ** -3.774 -3.450 -4.329 -5.282 (-1.74) (-0.88) (-1.87) (-1.99) (-0.83) (-0.70) (-0.70) (-0.97)
CAP 0.536 *** 0.385 ** 0.447 *** 0.485 *** -0.938 -0.691 -1.012 -1.225 (2.80) (2.16) (2.88) (2.84) (-0.92) (-0.65) (-0.99) (-1.18)
Downturn*CAP 1.966 -1.391 0.077 -0.470 1.232 -6.216 * 0.805 3.481 ** (1.47) (-1.15) (0.57) (-1.55) (0.43) (-1.93) (1.13) (1.97)
LIQGAP -0.007 -0.010 -0.006 -0.007 0.001 0.000 0.002 0.005 (-1.18) (-1.18) (-1.03) (-1.07) (0.15) (0.06) (0.27) (0.61)
DEPBANKS 0.000 -0.042 0.010 0.001 -0.107 -0.118 -0.144 -0.140 (0.00) (-0.63) (0.12) (0.02) (-0.93) (-1.01) (-1.07) (-1.22)
∆CAP -1.473 ** -0.305 -1.433 * -1.406 * 0.460 0.505 0.612 0.624 (-1.97) (-0.44) (-1.92) (-1.80) (0.78) (0.72) (0.78) (0.74)
QLP -0.319 -0.638 ** -0.333 -0.365 3.648 3.890 4.206 4.114 (-0.64) (-2.10) (-0.63) (-0.72) (0.81) (0.84) (0.86) (0.77)
size 0.815 *** 1.063 *** 0.962 *** 0.861 *** -1.108 -0.556 -1.158 -2.058 (3.56) (3.18) (2.76) (3.05) (-0.38) (-0.16) (-0.41) (-0.65)
∆UNEMPL 2.132 *** 2.701 *** 2.015 *** 1.998 *** -1.484 ** -1.059 -1.838 ** -1.439 * (5.42) (4.09) (5.28) (5.06) (-2.01) (-1.55) (-2.04) (-1.78)
Intercept -15.676 ** -4.655 -11.686 * -9.401 ** 15.282 39.433 18.610 15.664 (-2.28) (-0.92) (-1.82) (-2.00) (0.63) (1.05) (0.61) (0.56)
OFFSUP 0.392 0.213
23
(1.24) (0.36)
Downturn*CAP* OFFSUP -0.153 -0.051
(-1.52) (-0.22) PRIVMON -1.221 * -3.315 *
(-1.78) (-1.67) Downturn*CAP*
PRIVMON 0.201 0.823 * (1.40) (1.80)
DEPSINSURANCE -1.540 ** 0.490 (-2.05) (0.40)
Downturn*CAP* DEPISNURANCE 0.395 * -0.114
(1.93) (-0.33) MORALHAZARD -1.656 7.280 **
(-0.90) (2.36) Downturn*CAP*
MORALHAZARD 0.524 -1.647 * (1.51) (-1.85)
AR(1) -1.63 -1.61 -1.64 -1.59 -1.81 * -1.85 * -1.79 * -1.9 * AR(2) -0.89 -0.88 -0.86 -1.41 -1.82 * -1.78 * -1.78 * -1.22
Hansen test 603.28 *** 468.2 *** 592.38 *** 590.9 *** 134.28 118.8 111.3 112.5 # banks 657 497 644 637 144 124 123 123
#observations 6068 4688 5966 5921 1588 1384 1350 1345 Notes: The models are given by equation (3). The symbols have the following meaning: ∆loan – annual loan growth rate; Downturn - Dummy equal to one in Downturns and 0 otherwise; CAP - capital ratio, i.e. equity capital to total assets; Downturn*CAP - Interaction between Downturn and capital ratio (CAP); ∆CAP – annual change in capital ratio; DEPBANKS - Deposits from banks to total assets; LIQGAP - Loans less Total customer deposits less Deposits from banks divided by Loans; size - logarithm of total assets; QLP - Loan loss provisions divided by average loans; ∆UNEMPL – change in annual unemployment rate. OFFSUP is the measure of official supervisory power. PRIVMON is measured by private monitoring index. DEPINSURANCE is the index measuring the power of the deposit insurer. MORALHAZARD is the index which measures various factors mitigating moral hazard. Coefficients for the country and time dummies are not reported. The models have been estimated using the GMM estimator with robust standard errors. T-statistics are given in brackets. Data range 1996-2011. *, **, *** denote significance at the 10%, 5% and 1% level, respectively. # denotes the number of banks or observations.

24
5. Conclusions
This paper attempts to explain the substantial differences across EU countries in the link between
lending and capital of large banks in downturns by public policy characteristics unique to the
country in which these banks are headquartered. The results highlight the fact that restrictions on
bank activities and more stringent capital standards weaken the capital crunch effect, consistent
with reduced risk taking and boosted bank charter values.
Moreover, official supervision also alters the impact of capital ratio on lending in
downturns, which is consistent with reduced risk taking incentives in countries with better micro-
prudential supervision. Private market oversight seems to be related to short-term risk management
producing thin capital buffers in expansions, and therefore the capital crunch effect is enhanced in
countries with increased market discipline. Stricter powers of deposit insurer and regulations
reducing moral hazard have ambiguous effect on the link between lending and capital, as they are
related with increased capital crunch effect in unconsolidated data, and weakened capital crunch
effect in consolidated data.
Our analysis has three basic implications for public policy. First, both regulations are
supervision at the micro-prudential level are not neutral from a financial stability perspective. Weak
regulations and supervision increase the pro-cyclical effect of bank lending, due to insufficient
capital kept by banks to cover unexpected losses which rise in downturns.
Second, the results feed into the current policy debate on the new guidelines for capital
suggested by the Basel Committee on Banking Supervision (BCBS, 2011), referred to as Basel III,
since we find that lending of both groups of large banks (i.e. reporting unconsolidated and
consolidated data) is less sensitive to capital ratio if the regulations oblige banks to have more
capital relative to risks.

25
Third, from a supervisory perspective, our results suggest that official supervision has
potential in reducing pro-cyclicality of capital. However, due to the fact that in the case of
consolidated data (the too big to fail banks or systemically important financial institutions) we find
that the countercyclical effect of micro-prudential supervision is not statistically significant, we
infer that to supervise such banks effectively, there is a need for coordination between several
national authorities. We thus provide empirical support to establishment of multinational
supervisory authorities, such as the Single Supervisory Mechanism in the EU.
6. Acknowledgements
We gratefully acknowledge the financial support provided by Polish National Scientific Centre (NCN), No. of decision DEC-2012/05/D/HS4/01356. This paper’s findings, interpretations, an conclusions are entirely those of the authors and do not necessarily represent the views of the University of Warsaw or other institutions at which the authors are affiliated. We thank participants in the “Panel Data Modelling Conference. Theory and practice” held at Warsaw School of Economics and in the Scientific seminar held at National Bank of Poland.
7. References
Barth, J.R., G. Jr. Caprio and R Levine (2006), ‘Rethinking Bank Regulation. Till Angels Govern’ New York: Cambridge University Press.
Barth, J.R., G. Jr. Caprio and R Levine (2013), ‘Measure it, improve it. Bank Regulation and Supervision in 180 Countries 1999-2011’. Milken Institute.
Basel Committee on Banking Supervision (BCBS) (2011), ‘Basel III: a global regulatory framework for more resilient banks and banking systems’. Basel: Bank for International Settlements.
Beatty, A., and S. Liao (2011), ‘Do delays in expected loss recognition affect banks’ willingness to lend?’ Journal of Accounting and Economics 52, 1-20
Beatty, A., and S. Liao (2014), 'Financial accounting in the banking industry: A review of the empirical literature' Jounral of Accounting and Economics 58, 339-383
Berrospide, J.M., and R.M. Edge (2010), 'The effects of bank capital on lending: What do we know? And What does it mean?' International Journal of Central Banking, December 2010, 5-54.
Blundell, R., and S. Bond (1998), ‘Initial conditions and moment restrictions in dynamic panel data model.’ Journal of Econometrics 87, 115-143.
Borio, C., and V. H. Zhu (2012),’Capital Regulation, Risk-Taking, and Monetary Policy: A Missing Link in the Transmission Mechanism?’ Journal of Financial Stability 8, 236-251.
Boyd, J., and E. Prescott (1986), ‘Financial Intermediary – coalitions’, Journal of Economic Theory 38, 211-232.
Brewer, E., G.G. Kaufman and L. D. Wall (2008), ‘Bank Capital Ratios Across Countries: Why Do They Vary?’ Journal of Financial Services Research 34, 177-201.

26
Bridges, J., D. Gregory, M. Nielsen, S. Pezzini, A. Radia, and M. Spaltro (2014), ‘The impact of capital requirements on bank lending’, Working Paper No. 486. Bank of England.
Carlson, M., H. Shan and M.Warusawitharana (2013), 'Capital ratios and bank lending: A matched bank approach' Journal of Financial Intermediation 22, 663-687
De Haan, J., Poghosyan T (2012) ‘Bank size, market concentration and bank earnings volatility in the US’, Journal of International Financial Markets, Institutions, and Money 22:35-54.
Dewatripont, M., and J.Tirole (1994), 'The Prudential Regulation of banks', MIT Press, Cambridge, MA.
Diamond D.W. (1984), ‘Financial Intermediation and Delegated Monitoring’, The Review of Economic Studies 51, 393-414.
Diamond D.W. and P.H. Dybvig (1983), ‘Bank Runs, Deposit Insurance, and Liquidity’ Journal of Political Economy, Vol. 91 (June), 401–419.
DIRECTIVE 2013/36/EU OF THE EUROPEAN PARLIAMENT AND OF THE COUNCIL of 26 June 2013 on access to the activity of credit institutions and the prudential supervision of credit institutions and investment firms, amending Directive 2002/87/EC and repealing Directives 2006/48/EC and 2006/49/EC ((L 176). (CRDIV)
Fonseca, A.R., and F. González (2008), 'Cross-country determinants of bank income smoothing by managing loan-loss provisions' Journal of Banking and Finance 32, 217-228.
Fonseca, A.R., and F. González (2010). 'How bank capital buffers vary across countires: The influence of cost of deposits, market power and bank regulation'. Journal of Banking and Finance 34, 892-902.
Franses, P.H., and D. Dijk (2005), ‘The forecasting performance of various models for seasonality and nonlinearity for quarterly industrial production’, International Journal of Forecasting, 21, 87–102.
Freixas X, G. Loranth and A.D. Morrison (2007), ‘Regulating financial conglomerates’, Journal of Financial Intermediation 16, 479-514.
Gambacorta, L., Marqués-Ibáñez D. 2011, 'The bank lending channel. Lessons from the crisis.' Working Paper Series No 1335/May 2011, European Central Bank.
Jackson, P., C., Furfine, H., Groeneveld, D., Hancock, D., Jones, W., Perraudin, L., Radecki and M., Yoneyama, (1999). ‘Capital Requirements and Bank Behaviour: The Impact of The Basle Accord’, Basle: Bank for International Settlements.
Jensen M., and W., Meckling, (1976), ‘Theory of the firm: managerial behaviour, agency costs and ownership structure’, Journal of Financial Economics, 3, 305–360.
Labonne, C., and Lame, G. (2014) ‘Credit Growth and Bank Capital Requirements: Binding or Not?’ Working Paper
Lenart, Ł., and M. Pipień (2013), ‘Almost Periodically Correlated Time Series in Business Fluctuations Analysis’, Acta Physica Polonica A 123(3), 70-86.
Merton, R. C., (1974), ‘On the pricing of corporate debt: the risk structure of interest rates’, Journal of Finance, 29, 449–70.
Minsky, H.P., (1986), Stabilizing an unstable economy. Mc Graw Hill 2008 Mora, N., and A. Logan (2012), 'Shocks to bank capital: Evidence from UK Banks at Home and
Away', Applied Economics 44 (9), 1103-1119. Myers, S. (1984), ‘The capital structure puzzle’, Journal of Finance 39, 575–592. Myers, S., and N. Majluf, (1984), ‘Corporate financing and investment decisions when firms have
information that investors do not have’, Journal of Financial Economics 13, 187-221 Parzen, E., and M. Pagano (1979) ‘An approach to modeling seasonally stationary time-series’,
Journal of Econometrics, 9, 137–153.
27
Peek, J., and E. Rosengren (1995), ‘The capital crunch: Neither a borrower nor a lender be’, Journal of Money, Credit, and Banking, 27, 625–638.
REGULATION (EU) No 575/2013 OF THE EUROPEAN PARLIAMENT AND OF THE COUNCIL of 26 June 2013 on prudential requirements for credit institutions and investment firms and amending Regulation (EU) No 648/2012 (L 176). (CRR)
Resti, A., and A. Sironi (2007), ‘Risk management and shareholders’ value in banking’, John Wiley and Sons Ltd.
Roberts, M.R., and T.M. Whited (2011), ‘Endogeneity in Empirical Corporate Finance’, Financial Research and Policy Working Paper No. FR 11-29. The Bradley Policy Research Center. University of Rochester.
Roodman, D. (2009), ‘Practitioners Corner: A Note on the Theme of Too Many Instruments’, Oxford Bulletin of Economics and Statistics 71, 135-156.
Schooner HM, Taylor MW (2010) Global Bank Regulation. Principles and Policies. Elsevier, Academic Press. Tirole, J., (2001), ‘When markets fail’, IMF Survey 30(2). Tirole, J., (2006), ‘The theory of corporate finance’, Princeton University Press. Princeton. New
Jersey. Van den Heuvel, S.J., (2011), ‘Banking Conditions and the Effects of Monetary Policy: Evidence
from U.S.’, Federal Reserve Board, Working Paper. Windmeijer, F. (2005), ‘A finite sample correction for the variance of linear efficient two step
GMM estimators’, Journal of Econometrics, 126(1), 25–51.