(uy lockheed missiles m et nebse4-8i-c-2227 unclassified · 2014-09-27 · ad-fl145 682 tonographic...
TRANSCRIPT

AD-fl145 682 TONOGRAPHIC RECONSTRUCTION OF NEUTRON RADIOGRAPH IMAGES i/i(UY LOCKHEED MISSILES AND SPACE CO INC SUNNYVALE CAS M JAFFEY ET AL.11984 LMSC-D-966339 NeBSe4-8i-C-2227
UNCLASSIFIED F/G 28/6 N
END

22.2i_,. -/
0 -0
~" ____t
MICROCOPY RESOLUTION TEST CHART hNATIONAL BUREAU OF STANDARDS- 1963-A
.
%Ui7U
-. TOMOGRAPH IC RECONSTRUCT ION
..:.| OF NEUTRON RADIOGRAPH.. . IMAGES
.7 1.
I
-'.E
,.a -.
F I N A L T E C H N I C ALLR E P O R'I acTI
%"°-- '.,. ." gLckheed--Missiles & Space So payjE Ic
'..: SNNYVALE, CALIFORNIA Company, Inc.fm abk r~wm d g.J
' a .; - _
S4;07 01

TOMOGAPHI RECNSTRCTIO
TOFGRAPROC RC ORCTIO
IMAGES
FINAL TECHNICAL REPORT
NTIS TAI
UnannunceStephen M. Jaf feyKalyan Dutta
Distribution/
Availability CodegAvail and/or
Dist Special /p.
NRL Contract N00014-81-C-2227
Submitted by 1
LOCKHEED MISSILES & SPACE COMPANY, INC.Palo Alto Research Laboratories
e e

Final Report LMSC D-966339
TABLE OF CONTENTS"A."
U
Section Page
I'-.,
I OVERVIEW AND SUMMARY I
1.1 Introduction 2
1.2 Relationship of Neutron CT to other CT techniques J
1.3 Objectives 4
1.4 Proposed Tasks 5
1.5 Summary 6k0
Ii COMPUTED TOMOGRAPHY CONCEPTS 7
2.1 Reconstruction Algorithm 7
2.2 Reconstruction Resolution d
2.3 Line Integral Estimates and Errors 9
r
III NEUTRON-BEAM TUMOGRAPIY ii
3.1 Underlying Physicdl Interactions 11
3.2 Neutron Radiography 12
3.3 Digitization and Preprocessing 123.3.1 Digitization 13
3.3.2 Registration 143.3.3 Spatial Averaginy 143.3.4 Line Integral Estimates 14. .5 Correction for Detector Non-linearity 15

I-.
3.4 Evaluation of the Neutron Tomogrdms 163.4.1 Neutron Tomograms of Cylindrical Samples 163.4.2 Neutron Tomograms of Aircraft Fuselage Fragment 173.5 Adaptation of Neutron Tomography to Mobile Sources 19 P19
3.5.1 Low Neutron Beam Intensity 193.5.2 Effects of Low L/D Ratio 203.5.3 Effect of Gamma-ray Contamination of Projections 21
. I V X-RAY TOMOGRAPHY, COMPARISON TO NEUTRON TOMOGRAPHY 24
4.1 X-ray Tomograms 24
4.2 Neutron vs. X-ray Tomography 26S
V THREE-DIMENSIONAL DISPLAY BY REPROJECTION 28
5.1 The Reprojection Technique 29
5.2 Additive vs. Source-Attenuation Model for Reprojection 30
5.3 Display of Fuselage Fragment 31
VI RECOMMENDATIONS FOR FUTURE WORK 34
FIGURES 36
REFERENCES 4
0'
* ** *

Final Report LMSC D-966339
SECTION I
OVERVIEW AND SUMMARY
, I.
- iThis report covers an investigation of the application of
computer-aided tomography to the problem of nondestructive
- inspection ot industrial components. The work presented here
describes the application of tomographic techniques to neutron
radiography. A comparison of neutron and x-ray tomography is
included. Additionally, the capability for three-dimensional
" ... visualization of inspection data, made possible by the use of
- .. tomographic methods, is described. %-
. This work was initiated by Dr. J. Blodgett of the Naval
.. :Research Laboratory for the Materials Division of the Naval Air
Systems Command. Of particular interest were the possibilities
S'"tomography offered of increased contrast sensitivity and 3D visu-
alization during field inspection of aircraft components.
6::
%:I.. -1-
N.

7 , 76 .6-- , _-. ._o - * , . . . - - - o . . -. . . - . - -. . *- , .* .. . . .- -* un .-
Final Report LMSC D-966JJ9
1.1. Introduction
At the present time, x-ray projection radiography is a
widely used nondestructive testing (NDT) technique in industrial
* inspection. In recent years, an x-ray imaging technique called
computer-aided tomography (CT) has been very successful in pro-
*[ viding cross-sectional images of the internal structure of
three-dimensional objects. CT has had a major impact in medical
imaging, where it has provided improved visibility of low-
contrast lesions and tumors that could not be seen in projection
radiographs.
Because of the costs currently associated with the acquisi-
tion of image data and computer-aided reconstruction of cross-
sectional images, the major advances in CT techniques have pri-
marily been in medical imaging. However, with the increasing
• [availability of cheaper, improved radiation sources and detec-
tors, and with improvements in general-purpose tomographic recon-
struction software, CT techniques are increasingly applicable to
tNDT inspection tasks.
in some respects tomographic techniques are more applicable
to industrial inspection than to medical imaging. Unlike the
situation in medical imaging where there are biological limits to
the dosage that may be used and where rapid data acquisition and
near on-line processing of the data is desirable, in industrial
NDT situations the required data can be obtained on film or other
detectors using optimum levels of radiation dosage and exposure
times, and scanned and converted to digital imagery to be
-2 -
~- V

1 i Final Report LMSC D-966339
processed later. For these reasons CT techniques are now very
appropriate for NDT inspection.
1.2. Relationship of Neutron CT to Other CT Techniques
We applied the mathematics of tomographic reconstruction
from projections to neutron radiographs. This mathematics and
associated algorithms have been well developed for medical CT.
Although neutron and x-ray attenuation mechanisms differ, the
same attenuation equdtion and thus reconstruction mathematics and
Si" algorithms apply.
in comparison with medical CT, industrial x-ray CT is a new
but rapidly developing field. Several companies are developing
prototype industrial machines and at least two are renting time
on their machines and/or selling commercial models. We purchased
x-ray computed tomograms for comparison with the neutron tomo-
grams of the same test sample.
INeutron tomography has been little explored. The only Known
work prior to or concomitant with this project has been the
- application of high eneryy reactor neutrons to reconstruction of
nuclear fuel rod bundles (Barton,1977; Schlapper,1980;
Richards,1982; de Volpi,19d2j and biological tissues
" £Koeppe,1981j. Industrial inspection applications of neutron
radiography generally use thermal neutrons due to higher obtain-
able neutron flux. Our project focused on the use of thermal
* neutrons for non-destructive inspection of an aircraft component,
Keeping in mind the adaptation to mobile thermal neutron sources.
. . . . . . . . ..* . . . o . . . . . . * • q
* Final Report LMSC D-966349
The utility of neutron-beam computed tomography will be in the
increased contrast sensitivity over neutron and x-ray radiogra-
" -. phy, and x-ray CT for materials contrasted better by neutrons
than x-rays.
1.3. Objectives
The major objective of this study was to develop a system
for the tomographic reconstruction of images obtained from a
neutron-beam imaging experiment. While the reconstruction of x-
"-;". ray projection data is commonly done, neutron-beam tomographic
- reconstructions have not yet been investigated as an inspection
tool.
A second objective of this study was to obtain x-ray tomo-
grams of the same inspection part that was used in the neutron-
beam experiment, in order to compare tne relative qualities of
x-ray and n-beam tomographic reconstructions.
The tomographic reconstructions were performed on a test
specimen especially fabricated for the purpose. It consisted of a
9 -fragment of an aircraft fuselage that includes several structural
members (including fasteners, rivets, etc.), and also a second
section composed of several calibrated phantoms (titanium, steel
and aluminum cylinders).
Photographs of this specimen are shown in Figures 1 and 2
(at the end of the text section of this report).
Unlike the case of x-ray tomography, no special-purpose
Op_ -4-

Final Report LMSC D-966339
scanners exist for n-beam tomography, and thus the preliminary
experiments described here, done using an unoptimized radiation
• " source and a manually rotated specimen stage, give results that
can be much improved with equipment designed for the purpose.
. 1.4. Proposed Tasks
The study had the following basic tasks:
1) Determination of system requirements, and acquisition of a
set of x-ray tomograms through a suitable industrial inspec-
tion component.
. 2) Generation of fast tomographic reconstruction software based
on an array processor implementation of general-purpose
reconstruction programs.
* 3) Tomograpnic reconstruction of several slices through the
specimen, obtained from scanned and registered neutron-beam
projection radiographs supplied by the Naval Research
Laboratory.
4) A comparison of the techniques of x-ray and neutron tomogra-
phy and of the results obtained from these techniques.
5) Development of a three-dimensional data base from thesetI
tomographic reconstructions, and application of the tech-
*"- nique of "reprojection" to these data bases to obtain high
- contrast three-dimensional displays of structures of
interest.

-1 -- - - -.- ~ .'- - , . %T
Final Report LMSC D-966sJ9
• !.5. su____r_-_
1.5 Summary
Section II briefly describes the concepts of computed tomog-
rapny. Section III reports on our work in neutron computed
tomography. Section IV describes the x-ray tomograms acquired on
*the same inspection part. it also compares the relative quali-
ties obtainable from the x-ray and the n-beam methods. Section V
describes three-dimensional image synthesis, using data obtained
from these reconstructions, and employing recently developed
-reprojection" techniques to obtain pseudo-projection images with
enhanced feature visibility. Section VI recommends future worK.
'a °
° ..
.V..
L' -6- O
,*..>,-I ,*.,.-*. .***.*.* . ,.**, , , - .' , . . ..,.• .. , , _ ,.'.,, , , . , , , , , , . , , , , . . , , .

Final Report LMSC D-966339
III
SECTION 1I
COMPUTED TOMOGRAPHY CONCEPTS
S
2.
F -
2.1. Reconstruction Algorithm
Numerous authors have discussed tomographic reconstruction
algorithms LHerman,1980;Macovski,1983;etc.j. The required inputs
- are planar sets of parallel or fan beam line integrals of linear
attenuation coefficients taken with a fixed source-detector
geometry at multiple angles as the object rotates about an axis
perpendicular to tne plane.
We used the convolution backprojection algorithm. It
exploits the central section theorem. Suppose a planar function
" f(x y) is projected by integration along parallel rays into a
scalar function p(r). Let F(u,v) be the two dimensional Fourier
transform of f(x,y). Then the Fourier transform P(w) of the
projection p(r) is the restriction of F(u,v) to the line passing
through the origin and perpendicular to the projection rays.
I. -7-

Final Report LMSC D-966339
Thus, we can fill in F(u,v) by taking projections at many angles
and taking their Fourier transforms.
In concept the inverse two-dimensional Fourier transform
yields the reconstruction of f(x,y). For computational simpli-
city and accuracy the computation is restructured as a sequence
of ID operations (including convolution) on each projection func-
tion.
0
2.2. Reconstruction Resolution
hReconstruction resolution is fundamentally limited by the
spatial bandwidth of the projection measurement system [Bra-
cewell,1977J. Basically, the measurement bandwidth determines
the projection bandwidth which by the central section theorem
limits the reconstructed image Fourier spectrum. Finite source
size is the main factor limiting the resolution in the the neu-
tron tomograms. The 75 mm diameter object adjacent to the film
cassette and an L/D ratio of 50 yield a resolution of about 1.5
mm. Since the geometric unsharpness of an object point varies
with projection angle, the reconstruction impulse response will
generally be assymmetric and spatially variant LVerly,1979j.
Note that the resolution of the projection data parallel to the
rotation axis defines an effective tomogram thickness and limits
the resolution in that direction in a jD stack of tomograms.
Geometric misalignments (radiograpa misregistrations) are
the other main cause of resolution loss.
P -8--0

" Final Report LMSC D-966339
Reconstruction resolution also depends on a low pass filter
embedded in the 1D convolution kernel. This filter trades off
noise averaging against further resolution loss. We used the
mildly smoothing Shepp-Logan filter liuesman,1977J.
Sampling also affects resolution. Minimizing aliasing when S
sampling each projection optimizes resolution and minimizes cer-
tain streak artifacts [Joseph and Spital,198OJ. Coarse angular
sampling generates streak artifacts emanating radially and at
some distance from high contrast structures LJoseph and
. Schulz,1980J. To avoid these streaks the minimum number of pro-
jection angles is: S
L4min = 2 (Pi) R (Vm) (2.1)
where R is the object radius and Vm is the maximum spatial fre- •
_ quency in the reconstructed image. Less views are acceptable in• °.
- practice. in our experiment the 90 views yielded low level
streaking. ,
2.3. Line Integral Estimates and Errors
*' " The line integrals, A, ot the linear attenuation coefficient
are estimated using the fundamental attenuation relationship:
A = - ln( (a)/I(u) ) (2.2)
where I(a) and I(u) are the neutron intensities reaching a point
b.. on the detector plane after attenuation (a) by the object and
unattenuated (u) in the absence of the object. With film-screen
9

. . . . . . . - - - . . . ... .- -
Final Report LMSC D-966339
* .- recording I(a) and I(u) are estimated from the film optical den-
sities.
The reconstruction image quality depends on errors in
.- estimating A. For neutron radiography the major error sources
are gamma radiation in the primary beam, secondary radiation,
detector non-linearities, finite source size, and statistical
fluctuations in the detected image and in the detection process.
i - The logarithmic attenuation relationship causes non-linear
and object dependent propagation of measurement errors.
A + dA = - ln ( (1(a) + di(a)) / (I(u) + dl(u)) (2.3)
= A + In ( 1 + dI(a)/I(a) ) - ln ( 1 + dI(u)/I(u)
The second order and higher terms of the systemmatic errors usu-
ally coherently degrade wide regions of the reconstructed images.
Detector non-linearity and secondary radiation were the pri-
-. mary problems for our CT reconstructions (Section 3.3). Gamma
- radiation in the primary beam, finite source size, and Poisson
statistics may become significant errors when a mobile neutron
source is used (Section 3.5).
*10
9 .
9.....o
I..
-' -10-
* .. - . - . . * * %..* ' .9.*.t*. - - ,. - . .

Final Report LMSC D-966339
FA SECTION III
NEUTRON-BEAM TOMOGRAPHY
3.
Neutron CT combines the contrast sensitivity and three-
* dimensional information of CT with the radiographic properties of
neutrons. The latter includes contrasting of materials with
similar densities, high contrast imaging of hydrogenous materi-
*i als, and penetration of large thicknesses of some dense metals.
m0* 3.1. Underlying Physical Interactions
V The information bearing image is formed by 70 Kev electrons
emitted by the gadolinium conversion screen after absorption of
neutrons that have passed through the object without interacting.
Several obfuscatory images increase the exposure. These arise
from scattered neutrons and prompt emission of gamma rays follow-
r. ing neutron capture by the object and the conversion screen.
Gamma radiation in the primary beam adds additional degrading
exposure. The dependence of the attenuation coefficients on neu-
tron energy is quite small for thermal neutrons [TyufaKov,1979j

Final Report LMSC D-966JJ9
so that beam hardening, so troublesome in x-ray CT, is a minor
problem in thermal neutron CT except for thick primarily absorb-
ing materials.
3.2. Neutron Radiography
XA.
The neutron radiographs were recorded by Dr. Peter Moore of
the Naval Research Laboratory at the National Bureau of Standards
reactor, using a high purity filtered thermal neutron beam (1/40
eV). Exposures were recorded on type AA film using a 12.5 m
vapor deposited gadolinium converter screen. One half minute
exposures were taken to insure that film grain noise dominated 0
*£ the Poisson counting noise.
The test object was mounted on a stage (Figure 3) and manu-
ally rotated by 2 degrees between each of 90 exposures. To
minimize effect of source size the stage was placed against the
film cassette with the rotation axis 1.75" from the film plane.
" The rotation axis was aligned parallel to the film plane. The
* source to rotation axis distance was 73".
3.3. Digitization and Preprocessing
CT requires digital estimates of the line integrals of the
linear attenuation coefficients along specific rays. Thus, the S
• [radiographs must be digitized, spatially registered and remapped
in intensity.
-12-"

. .. -- - . .-.. • . -
Final Report LMSC D-966339
3.3.1. Digitization
Each radiograph was imaged by a Sierra Scientific LSV 1.5" 4vidicon camera and digitized by a Lockheed improved Grinnel digi-
tizer. Several steps were taken to ensure that TV resolution and
electronic noise did not significantly degrade the radiographic .
information. Digitization was to 8 bit accuracy. 256 successive . -
digitized frames of each radiograph were averaged. The spatial ..-
sampling interval of 0.35 mm was fine enough to avoid significant S
aliasing perpendicular to the rotation axis except for object
points within an inch of the film. An analogue low pass filter
reduced aliasing of the projection of nearby object points. Fig-
ures 4 and 5 show two digitized radiographs.
3.3.2. Registration
The radiographs were registered by linear resampling. Eight
rectangular cadmium chips were attached to the neutron beam side
of the film cassette for use as registration markers. Normalized 0
cross-correlation was used to estimate the displacement of each
marker with respect to one reference radiograph. For each image,
the six coefficients of an affine transformation were estimated 5by a least squares fit to the eight fiducial mark displacements.
Fit residuals were less than 0.2 mm in magnitude, indicating evensmailer resulting misregistrations after resampling. Geometric 0
distortion in the vidicon camera was less than 0.35 mm displace-
ment across the field of view. These registration errors .
6 together with the finite source size limited the reconstruction S
resolution.
- 13- -

.4 °
Final Report LMSC D-966jJ9
The CT algorithm requires samples recorded perpendicular to
the axis of object rotation. To locate the axis, a #35 drill bitI. was attached to the rotation stage in coincidence with the rota-
tion axis. Prior to registration, the digitized reference radio-
graph was rotated so that the rotation axis was parallel to image
columns.
3.3.3. Spatial Averaging
The various effective computed tomography algorithms assume
that the projection rays are all perpendicular to the object
rotation axis. However, since the radiographs were recorded with
a cone beam geometry, this assumption is invalid. To minimize
* artifacts from this effect, 5 adjacent rows in the digitized
images were averaged prior to reconstruction. The resulting
tomogram thickness is about 1.8 mm.
To facilitate array processor implementation parallel rather
than fan beam geometry was assumed. The consequences should be
small since the actual fan beam angle was only 2 degrees.
3.3.4. Line integral Estimates
Line integrals, A, of the linear attenuation coefficient
were estimated from Equation (2.2) assuming the film densities
were proportional to the logarithm of the information bearing
exposure. Analogue shading correction followed by logarithmic
amplification resulted in digitized counts proportional to the
|,film density. V
F" - 140S.%
~ ~ *.5**.~~s5*'S.% . . ~ %.%.% .-.- ' V V]

Final Report LMSC D-966339
The unattenuated intensity ,(u) varied both spatially and
between radiographs. Unfortunately, the specified object free acalibration radiograph was not recorded. Therefore, estimates of
the logarithm of I(u) were made by linear fits to the estimates 1:of the logarithm of I(a) at points in each radiograph located
outside of the projected image of the object. . ."1
V V
3.3.5. Correction for Detector Non-linearity
Artifacts in the initial tomgrams of the calibrated
cylinders (Figure 6a) resemble those due to non-linear detectors
as described by Duerinckx L1979] for a pair of cylinders. In
r. particular, the neutron tomograms exhibit broad dark and light
streaks between cylinders and flaring out from cylinders. More-
over, a plot of image intensity versus position across the diame- 0.
ter of the steel cylinder snows the classic cupping artifact
(Figure 7aj. The non-linear detector model is the special case
of Equation (2.3) when dA is a function of A. 6
One possible cause is non-linearity at the toe of the
Hurter-Driffield curve. Unfortunately, the stepwedge included in *
the radiographs did not extend to the lowest density regions
recorded for steel. A second possible cause of detector non-
linearity is an approximately constant background bias due to
secondary radiation from the object. Since neutron scatter
[Barton,198J;de Volpi, 1983J and prompt emission gamma radiation
LNewachek,1983j are both isotropically distributed, their inten-
sity effect at the film plane has a low frequency spectrum chat
* ..' ' ° - - . . ' - , . . . . ., .... ... . ..i* .. .. ~*~ . -p. S* % , .o . . .:j

Final Report LMSC D-966339
. falls off rapidly with object distance from the film plane
[Stonestrom,1976; Robb,19831. Both mechanisms would cause line
integral underestimates that increased with increasing magnitude
." of the true line integral, an effect consistent with the sign of
the image artifacts described.M
We used a constant bias model to compensate for whichever or
both of the effects were significant. This approach follows that
suggested by Stonestrom [1976J and implemented by Joseph L19d2i.
S.The constant scattering level was simply varied until the
artifacts were best suppressed as judged visually. Figure 6b
shows the scatter corrected tomogram and Figure 7b the removal of
the cupping artifact. The correction also reduced flares emanat-
ing from the highly attenuating structures in the fuselage frag-
ment but introduced two low contrast streaks (Figure 8a,b).
After examining the radiographs Newacheck [1983] concluded
that film non-linearity was the major effect. Furthermore, the
". background bias level of three tenths of the beam intensity
through the titanium cylinder was considerably higher than that
expected from crude neutron scatter calculations.
3.4. Evaluation of the Neutron Tomograms
The reconstructions were made using the convolution backpro-
jection algorithm with the Shepp-Logan filter. Starting with a
published software package Liluesman,1977], we implemented the
rate limiting steps on a Floating Point Systems AP-120B array
processor. The resulting 1 minute reconstruction tLmes
-16-
N..-V.* . . * , *** d V -f *V . *

Final Report LMSC D-966s39'4-
facilitated interactive calibration experiments.
The reconstructions indicate the basic shapes, locations,
. and rough attenuation coefficients. They delineate structures
unseen in the x-ray tomograms, but the resolution is poorer.
. Several reconstruction errors, or artifacts, are present. The
main causes and potential corrections will be indicated.
3.4.1. Neutron Tomograms of Cylindrical Samples
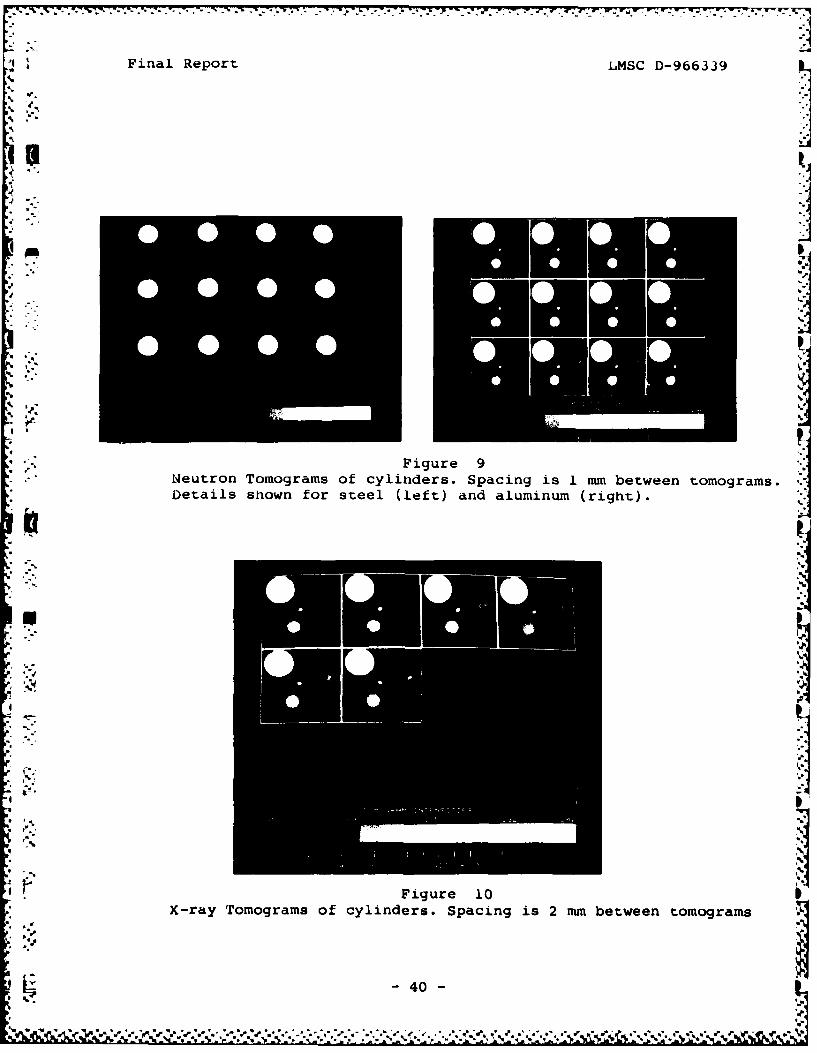
Figure 9 shows 12 tomograms sampled at 1 mm spacing. The
pixel width is 0.4 mm. Figure 10 shows x-ray tumograms for com-
parison (Section IV). The neutron reconstructions of the
cylinder cluster faithfully capture the circular cross-sections
and their locations. For example, vertical and horizontal meas-
urements from the tomograms of the diameters of the three large
• cylinders agree to within 1 mm of the actual diameters. The
steel, aluminum and titanium cylinders had diameters of .75", .5"
1. and .375" respectively.
Diagonal cuts and fluted steel drill bits were placed in the.0-
cylinders to assess resolution. The diagonal cuts in the steel
and titanium cylinders are faintly visible, but unseen in the
aluminum. The spiral voids in the fluted steel bit embedded at
the central axis of the steel cylinder are apparent but at much
lower contrast than in the x-ray tomograms. The spiral steel bit
is apparent as it rotates in the aluminum cylinder through the
* sequence of tomograms. However, the spiral voids are not
apparent. All of these small features are better resolved in the
0S-17,* *. . - 17 - a..

• ..
Final Report LMSC D-966349
x-ray tomograms.
The discrepancy between indications of spiral voids in the S
steel but not the aluminum cylinder is unexplained. Note, how-
ever, that the contrast between void and cylinder is much lower
for aluminum and that the voids lose considerable contrast due to S
lLmited reconstruction resolution.
The estimated linear attenuation coefficients sharply
discriminate steel, titanium and aluminum, but err quantitatively
in an object dependent manner.
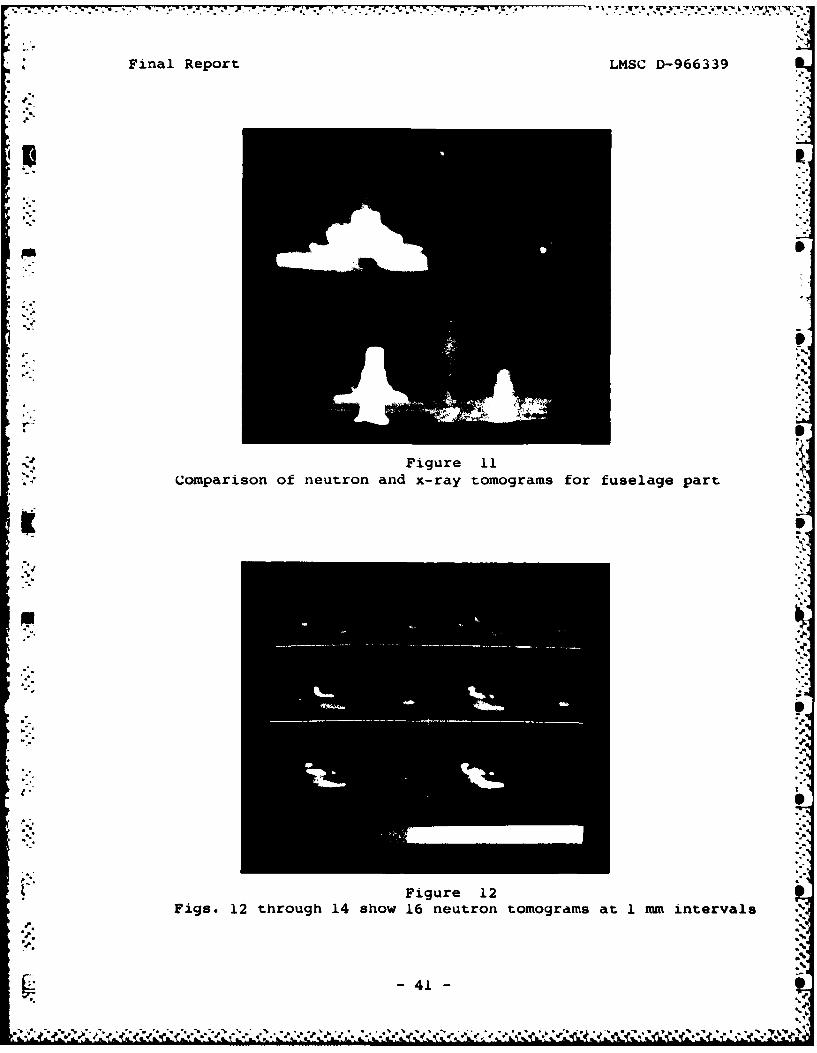
3.4.2. Neutron Tomograms of Aircraft Fuselage Fragment
Figure 11 compares neutron and x-ray tomograms of the air-
craft fuselage fragment. Figures 12, 13 and 14 show 16 neutron 0
reconstructions sampled at 1 mm spacing through the fastener sec-
tion. For comparison Figures 15, 16 and 17 snow the correspond-
ing x-ray tomograms (Section IV).
The image quality of the x-ray tomograms is better, but the
neutron tomograms present many structures with superior contrast.
The neutron tomograms have poorer resolution and various streak
artifacts. These streaks are due to 4 missing or degraded pro-
jection radiographs, a slightly inadequate number of projection
angles, and probably also to registration errors. In addition,
parts of the fastener have somewhat poor definition probably due
to residual uncorrected scatter or film non-linearitie-.
Better contrasting in the neutron tomograms is due as
- 18- 0

Final Report LMSC D-9b6339 "
expected to the properties of thermal neutron linear attenuation
coefficients that make neutron radiography attractive for inspec- •Stion purposes. The discrimination of materials with similar den-"
sities is illustrated by the reconstructed fastener. The x-ray
tomogram shows the screw and nut with barely distinguishable den-
sities, whereas the nut contrast sharply with the screw in the
neutron tomograms. The highlighting of hydrogenous materials is
exemplified for layers of rubber and epoxy. Even the paint
around the stiffener shows up, although faintly, because the
layer of paint is so thin.
3.5. Adaptation of Neutron Tomography to Mobile Sources
Because the NBS reactor neutron radiographs were of higher S
quality than is practical for mobile neutron sources, the Naval
Research Laboratory requested that we discuss the problems mobile
p sources pose for neutron CT.
3.5.1. Low Neutron Beam Intensity
Usually CT cannot compensate for poor counting statistics.
What it can do is increase contrast sensitivity by directly
. estimating the linear attenuation coefficients. Its efficient
use of measurement geometry rather than of neutron counts enables
" this circumvention of the background trends characteristic of
projection radiography. Note that the noise variance in a recon-
structed CT image is approximately inversely proportional to the
number of projection angles. Consequently, the exposure per 1L -19-

Final Report LMSC D-966339
radiograph required to get tomograms with roughly the same noise
levels as in a single radiograph is considerably less than for
that single radiograph.
One exception where CT uses neutron statistics more effi-
-iciently is where multiple orientation views of the object are
required. The same stack of CT slices can be reprojected from
* . arbitrary orientations without new exposures. Projection radiog-
raphy of course requires one exposure per viewpoint.
Computed tomography has specific constraints tnat reduce the
fraction of detectable neutrons. Exposure time is lost during
mechanical motion of the sample between measurements. A tilmless
.video or solid state detection system would bypass cassette
reloading time. Steps taken to minimize non-linear geometric
artifacts by approximating pencil beam, pure neutron, scatter
free imaging also degrade tfue efficiency of neutron intensity
utilization. These steps can include source collimation, back-
scatter collimation grids, and dual measurement preprocessing
(Section 3.5.3). in addition, increasing the source to object
distance so that fan beams better approximate the cone beam will
reduce available neutron beam intensity.
3.5.2. Effects of Low L/D Ratio
Because source size dominates the resolution, the average
resolution cell width in the tomographic reconstructions varies
"" approximately in inverse proportion to the L/D ratio and in pro-
portion to the transverse radius of the object. Thus, for recon-
20-20.-

Final Report LMSC D-966339
" struction at a given resolution, the L/D ratio limits the object
radius. An object with radius 75 mm imaged with an L/D of 15|0will be ret 3tructed with resolution of about 3 to 4 mm.
Because the linear smearing effects of geometric unsharpness
74 occur in the intensity domain prior to logarithmic processing
(Equation 2.3), non-linear effects such as streaking [Stones-
trom,19dlj can arise near high contrast objects. Such non-
linearities and associated artifacts may be significant espe-
,K cially since the geometric unsharpness would be worse than in
medical CT and since industrial objects often have more high con-
b trast edges than human bodies.
The remedy of a narrower collimator aperture costs in neu-
tron intensity. Perhaps CT restoration [Bracewell,1977;
Verly,1979J could reduce the artifacts and improve tomogram reso-
lution. However, CT restoration is not well understood and would
boost image noise levels thus requiring higher neutron exposures.0
3.5.J. Effect of Gamma Ray Contamination of Projections
Mobile neutron source n-beams have varying levels of gamma
radiation. In addition, prompt emission from object and conver-
sion screen adds gamma exposure. However, direct exposure detec-
tion is mandated by speed requirements.0
if reconstruction used the sum ot intensities directly, then
the tomograms would simply be weighted averages of pure neutron
"nd gamma ray images. A loss of tomogram contrast would result S
in hydrogenous and other materials with high neutron attenuation
b - 21-
.' %LIO

Final Report LMSC D-966J39
-" eand low gamma ray attenuation. An additional contrast loss would
result from prompt emission, and pair production. However, the
logarithmic processing (Equation 2.3) introduces a non-linearity.
One can speculate on the character of non-linear image artifacts
by analogy to the well studied effect of beam-hardening in x-ray
tomography.
The shared feature is two or more kinds of radiation for
each of which the material attenuation coefficients are dif-
ferent. The multiple images superpose additively prior to loga-
The attenuation coefficients decredse with increasing photon
energy causing the beam to 'harden' as it traverses the object.
Beam hardening can cause streaks emanating from edges, flares
surrounding objects, and streak artifacts between bones [Duer-
inckx,1979j. Note the similarity to non-linear detector
artifacts.
The non-linearities and resultant artifacts for neutron-
gamma ray imaging could be more severe because of the lack of
correlation between neutron and gamma ray attenuation coeffi-
cients. The effect would be further complicated if the gamma ray
contamination is broad spectrum and thus has its own beam harden-
ing effects.
With dual measurements the gamma contamination could poten-
tially be digitally removed before logarithmic processing.
MacovsKi L1983] suggested simultaneous dual measurements for
.* iefficient use of exposure. For example, two pieces of film could
C N.

_ Final Report LMSC D-966339
be placed together in front of a gadolinium foil in the back
screen configuration. If the film adjacent to the foil has a
single emulsion side facing the foil, then the low energy elec-
trons emitted from the converter will expose primarily that emul-
sion. The gamma rays will expose both films.
The resulting two equations in two unknowns can be solved
*" for the line integral, A(n), of the neutron attenuation coeffi-
cient and the total gamma ray contribution, I(g,k):
I(tot,k) I(n,k) * exp(-A(n)) + I(g,k) (4.1)
where i(n,k) is the detected neutron intensity in the absence of
an object and I(tot,k) is the total neutron equivalent intensity
detected by the kth piece of film.
This dual measurement scheme compensates for the background
* biases due to primary and secondary gamma radiation, except for
some portion of the prompt emission gamma originating in the
conversion screen. In addition, if collimation between the
object and detector is used to remove primary beam gamma rays
scattered from the object, then the dual measurement scheme might
provide separate neutron and gamma ray tomograms in registration.
As noted in Section 3.4.5 secondary gamma radiation from prompt
emission object might also be dealt with by a constant background
bias model.
232=

; ,. ' -':'
-. . . ........ .......... ....... . . .. . ... ..
I Final Report LMSC D-966J39
SECTION IV
X-RAY TOMOGRAPHY, COMPARISON TO NEUTRON TOMOGRAPHY
4.
- 4.1. X-ray Tomograms
One original task was to acquire a multiangle x-ray radio-
"* graphs and create tomograms from them. Shortly after we com-
. menced the project, the first industrial x-ray CT became commer-
cially available. Rather than duplicate work that others with
more resources had achieved, we altered the task with the con-
currence of Dr. Moore of NRL. The new task was to acquire x-ray .
- tomograms on a commercial scanner. These tomograms would then be
compared with our neutron tomograms in terms of image quality and
complementary contrast sensitivity. They would also be used as a
data base for making high contrast three-dimensional displays. L
The resources saved by this change were then applied to the
* remaining tasks.
- For industrial inspection the medical tomograpny technology
had to be modified to handle dense thick objects. Much higher24°
~- 24 -
.4 -. ; '-,- ',..- ee :.- % €-.. " ." --- "''*- ,' %%

Final Report LMSC D-966339
. energy sources were required for object penetration. Detectors
had to be developed for high energy low flux photon counting.
We had the test sample scanned and reconstructed on the
Scientific Measurement Systems (SMS) industrial tomograph scanner
in Austin, Texas [Hopkins,1981i. They used an isotopic 200 Curie
(192)Ir source with energy concentrated at 310 keV (68%), 468 keV
(23%), and 610 keV (3%). SMS uses an unique plastic scintillator
detector system operated in the photon counting mode. These
detectors are particularly efficient and inexpensive.
To attain tomograms suitable for three dimensional display
and comparison with our neutron tomograms, we specified that SMS
provide recontructions with constrast sensitivity of a few per-
cent, their highest spatial resolution, and thin slice thickness.K°The detectors were fronted with lead collimators with apertures
of 1.0 mm in width and 1.0 mm in height. The source was col-
limated with an exit aperture of 3.2 mm in width and 1.0 mm in -
height. in this configuration the reconstructions can resolve
square wave patterned objects down to about 1.2 mm per line pair.
SMS chose suitable sampling rates. They sampled each projection t0
every 0.6 nun at 200 equally spaced angles.
Figure 10 snows tomograms of the cylinders. The six tomo-
grams are sampled axially at 2 mm intervals. All of the cuts and 0
the fluted drill bits are clearly revealed. The cylinders have
quite uniform estimated linear attenuation coefficients (Figure
18). The low contrast circular artifacts are due to residual 0
uncorrected x-ray scattering. 7.1-25- -
. . .. . . .. . . . . . . . .

K. - :~ 7 - j~ 7
4 Final Report LMSC D-966339
"K iI ' ' Figures 15, 16 and 17 show sixteen tomograms sampled at I mm
intervals through the fuselage fragment. Contrast sensitivity in
the display can be maximized by stretching the linear attenuation
coefficients in the neighborhood of a particular material to fill
the full 8 bit dynamic range of the refresh memory. Figure 19
shows a tomogram of the aircraft fuselage fragment with contrast
- - settings centered around aluminum and steel.
4.2. Neutron Versus X-ray Tomography
For this study, the meaningful comparisons are between
material contrast capabilities, underlying physical limitations,
and available source strengths. As shown by the neutron tomo-
grams, neutron tomography lige neutron radiography can discrim-
inate certain materials with similar densities and low density
hydrogenous materials.
Scatter in high energy x-ray imaging is forward directed,U
and thus more difficult to eliminate or correct from a geometric
point of view than the isotropic scattering for neutron imaging.
Nonetheless, for some objects it may be desirable to separate the
object and film cassette at the expense of resolution in order to
reduce the frequency content of the scattered neutron background.
From an engineering viewpoint, higher equivalent intensity
x-ray sources are available. For example, the industrial x-ray
CT scanner at Aerojet Corporation (Sacramento, California) uses a
linear accelerator and achieves 0.4 imm resolution in tomographic
scans of 6" diameter objects recorded in under 20 minutes. 6ven
, 26-

* .- ** . - - r r r -
- Final Report LMSC D-966339
with the high intensity NBS reactor source used in our experi-
5 ment, 45 minutes of exposures were required to achieve consider-
ably less resolution for a smaller object. Mobile sources
currently under development have considerably weaker sources
necessitating image quality compromises such as low L/D ratio,
and small source to object distances.
E27
" *1
II
-27
S."
. -. .

Final Report LMSC D-966439
SECTION V
THREE-DIMENSIONAL DISPLAY BY REPROJECTION
5.i .-
Currently there is considerable interest in three-
dimensional visualization of a volume of interest for industrial
inspection purposes. For example, we are concerned with the
visualization of the three dimensional distribution of voids in
the rocket motor chamber walls, as well as the internal confi-
guration of nuclear fuel rod bundles. For aircraft component
inspection, JD display could potentially aid in visualizing the
* distribution, size, shape, and three 30 relationships of voids,
cracks, inclusions, contaminants, and misaligned or missing
parts. For example, knowledge of flaw orientation or the pattern
of growth of a crack with time can be related to material
strength.
., Computed tomography yields very good two-dimensional image
" slices; for three-dimensional viewing, many such slices must be
combined into a single view using a "reprojection" technique.
Single views are necessary when the structure of interest crosses I-28- -

., . , . _ ° • . . . . . . . . . . . . . . . . . . ° . . . . . . . . . . . . .''v~~~~~ . ...w .r .n .S . ...,S -- W V ; . . . . .. . . . . . .
O Final Report LMSC D-966339
between tomograms. It can be time consuming, unreliable, and
sometimes impossible to visualize 3D structures simply by looking
at a sequence of tomograms and mentally reconstructing the
object. The idea is to use the full capabilities of the human
visual system by presenting interactively modified dynamic,
stereo projection views to the observer.
We have developed high speed reprojection algorithms and
software under NSF Grant # ECS 79-25432 [Jaffey,1982;Dutta,198J
and Lockheed Independent Research Projects. We have applied the
technique to the x-ray tomograms of the test specimen. Had time
permitted, JD display of contrasted structures such as rubber,
paint, and bonding materials in the neutron tomograms would also
have been informative. Discussions of the technique LDutta,1983j
and its application follow.
5.1. The Reprojection Technique
A reprojection operation consists of generating a two-
dimensional view of a stack of CT slices, by suitably combining
the linear attenuation coefficients in each slice along a given
set of rays. The resulting images resemble ordinary radiographs.
The great advantage of digital reprojection methods is that they
allow processing of the IT data prior to reprojection so as to
enhance the structures of interest by dissolving away unwanted
regions or selective highlighting.
* A reprojection algorithm computes the line integrals of the
linear attenuation coefficient along a set of rays through a
@1 -29-.
' " ". v", , "-. . .-. " o '. .5..-. * • ..- .'-' " ". ". ' .' *''' -'.. * .. * -* "** .* . --........ .

* Final Report LMSC D-966339
volume of computed tomographic samples. Although these samples
are discrete, the volume is considered to be filled by being
- modelled as a set of adjacent cubic volume elements (voxels) cen-
tered at each sample. Each voxel has uniform intensity equal to
its estimated linear attenuation coefficient.
Each reprojection ray that intersects a particular voxel
does so with an intersection length which we call a ray factor,
or line length. The integrated linear attenuation coefficient
along a ray is then obtained by suitably adding the product of
the intensity and the ray factor for each voxel intersecting that
* ray.
5.2. Additive vs. Source-Attenuation Model for Reprojection
If the reprojected linear attenuation coefficient along a
ray is obtained by simply adding together the ray factor contri-
bution of each voxel, the resulting reprojection is called an
additive model. in this case the voxel contributions may be com-
puted in any order to obtain the final result.
In our more powerful source-attenuation model, each voxel
acts both as a source contributing to the final density, and as
an attenuator to reduce the contributions of other voxels along
the ray that are farther from the observer. This is also a more
general model, the additive model being obtainable from it by
setting the attenuation coefficient to zero.
The observed ray intensity for the source-attenuation model
-.,

Final Report LMSC D-966J39
can be calculated in a recursive manner provided that the voxel
contributions are calculated in an ordered way, from the farthest
to the nearest voxel along the ray. At any stage only the net
", h: intensity need be retained. This results in a regular implementa-
tion very suitable for array processor mechanization.
pW
The array processor implementation is particularly efficient
for orthographic projections perpendicular to one of the three
sampling axes. Our implementation was done on a Floating Point
Systems API20-B unit at the FORTRAN level.
S5.3. Display of Fuselage Fragment
Several display experiments were done with the x-ray tomo-
grams of the fuselage fragment. Figure 20 shows a rotating
sequence of views reprojected additively from the original tomo-
grams. The views resemble radiographs. Each adjacent pair ofI -
views is a stereo pair. Stereo viewing can provide good depth
cues for this kind of imagery. When these views are successively
displayed to a television monitor, the object appears to rotate,
leading to depth perception from motion.
.7
'-" The power of reprojection lies in selective manipulations ot
the stack of tomograms prior to reprojection. For example, to
-* increase the contrast of the fastener, all the tomogram pixels
outside of the fastener were set to zero prior to reprojection
(Figure 21). This zeroing waL based on both location and ampli-
t tude. The resulting reprojections (Figure 22) have higher con-
trast than ordinary radiographs. They are analogous to x-rays of
ILo -. 3d'."
. , .,- ... .. . . , . -. - .. -a-.-- . . . :. . .-. . . * *. -. * ., . • .. . . , . . . y - -:
7 'k- -.
Final Report LMSC D-966339
the tastener alone, with the remainder of the object cut away.
• . in a second experiment the volume was dissected identically,
but the source-attenuation reprojection model was used (Figure
23). The attenuation coefficients were set high so that only the
O nearest surfaces of the object are displayed. in this mode the
reprojection performs hidden voxel removal. The intensity pat-
tern in these views is unusual but does lead to excellent stereo
fusion. We are currently working towards a more natural shading
scheme for the nearest surfaces.
In a third experiment the sobel operator was used to enhance
object edges and interfaces before reprojection (Figure 24).
Figure 25 shows the resulting rotating additive reprojection
sequence.
These examples illustrate the main features of reprojection
" display. Three-dimensional perception is achieved by stereo or
* motion or both. High contrast of selected structures is achieved
by emphasis or dissection. Reprojection from any especially
*[ informative viewpoint is possible without collection of new data.
We have implemented a variety of other volume operations includ-
ing dynamic cutting, peeling away, and dissolving away. The
- accompanying video tape shows the dynamic form of these three-
dimensional displays.
A work station with these display capabilities would give an
inspector a powerful tool for visually manipulating a stack of
tomograms. The aim is an interactive system for visualizing
-2...- '-*. % . %2 - * U
, '.. ---.... -_', - - , -. - .- ' ..-.. - - . . , .,. ,.... .*... ,.. ... t... .>: ., 5 , .*....

P Final Report LMSC D-966339
-'three-dimensional structures of diagnostic significance that
cross between tomograms and are not easily understood by viewing
a sequence of individual tomograms.
0
.1
0
• 0
, °S
S7 - 3 3 -J

I.- - . . .. . . - - . , . -. .. ' . - . . . .. - - . . - .", -
Final Report LMSC D-966339
-..
SECTION VI
RECOMMENDATIONS FOR FUTURE WORK-S
6.
1 1) Determination of whether there are neutron radiography
inspection applications for which the increased time
requirement of neutron tomography could be justified by the
increased contrast sensitivity that tomographic imaging pro-
vides.
mI2) Investigate the adaptation of neutron tomographic techniques
to mobile accelerators.
(A) Determine whether levels of background gamma will be
high enough to necessitate correction. if so, investigate
the dual measurement correction scheme.lS
-. (B) Determine the severity of the non-linearity effects of
low L/D ratio (around 15).
. - (C) Investigate the use during reconstruction of apriori
information about the scanned object in order to reduce the
L - 34-

Final Report LMSC D-966339
required neutron exposures.
U - U(D) Investigate the use of a film free recording system with
real-time digitization of the projection images to speed up:. ..
" .the data acquisition.
3) If neutron tomography is judged useful, determine whether
there is a subset of its applications that would benefit by
" three-dimensional visualization or analysis techniques. A
digital work station designed for the interpretation of
tomograms could be augmented with such display and analysis
capabilities.
.5
[ ii°• *1
a oI
,o".1
- 35-- II ., '
:[ % .*-°iq, , , ~..

Final Report LMSC D-966339
NV
Figure 1Photograph of the Test Specimen showing the aircraft fuselage
fragment and the calibrated phantoms
.0
I F 7.1-4.oi A
Figure 2 FPhotograph of the Test Specimen from another view angle
-36-

Final Report LMSC D-966339
Uk
Fiur
PhtgahsoigteTstSeierttn tg
Figure 4POeogrp shoigte Testro Specienrainagestg
an.il37 set

Final Report LMSC D-966339
€S.
:"p.
Figure 5A second representative digitized neutron radiograph image
* Figure 6Reconstructed neutron tomograms showing effects of correctionfor scatter. Left: uncorrected, right: corrected for scatter
-38-
.: < . i% :2i .- 5**.* . ~ VVV~ V . , V" I I I

.4 ~ Final Report LMSC D-966339
399
S.'IFinl ReortLMSC D-966339
Figure 9
- .Neutron Tomograms of cylinders. Spacing is 1 mm between tomograms.Details Shown for steel (left) and aluminum (right).
.4'41
C...S"A
*Final Report LMSC D-966339
Figure 11Comparison of neutron and x-ray tomograms for fuselage part
41
Fiur 1
Fig 2 hogh1 ho 6nue o 12 og m atImSnevl
-41-

Final Report LMSC D-966339
Figure 13See caption for Fig.12
See cptio for ig.1* I2

-. . N.
Final Report LMSC D-966339
* 4
S
'I
0r'.
Figure 15Figs. 15 through 17 show 16 x-ray tomograms at 1 mm intervals
* S
S
"S~
I..
%
0--
"S...I -
'S...-'S.'
a-. -
0U-
Figure 16 0See caption for Fig.15 P..-
-'S.
5,
'S.t.*~ .*
- 4J -
% ~ P *- %~, .. .. ,' . U. L~ V V ~
a, . .rVP d"t d'.t. 'S%'S*****tS.~**%~*% *

4Final Report LMSC D-966439
414
4. Figure 17Estiateof -ra Seea catiouin rfcin vs.g.15nc
4. 44

K ' F i n a l R e p o r t L M S C D -9 6 6 3 3 9
Figure 19X-ray tomogram with intensity windows centered on
aluminum (top) and steel (bottom).
44
-
;L e
Figure•20Aditv rprjctos.f
-aytoords
.,
::: .:
-45
q L
* S S 4V * W C. . .d . . . * * C. ." 5 .*%f F* ur * 19 S .- b S* *S- a t m g am w t in e s t wi do s e te ed o
S ..
a u i u t p n t e b t o )

Final Report LMSC D-966.s39
#A1
464

-4 .4'7 . 7.7
Final Report LMSC D-966339
Figure 2
X-a oormrpoeto sngtesuc-teuto oe
- X-ry tomgramFigure 24
TheSoel peatrpjeio usn thea soureattenuation moelg
.47
XNkp"N

I - , _ L / . , ' - -i . - . ' . b '"'
. . - - .
*. t_ Final Report LMSC D-966339,
| U
'. ," ".
U=". w
*-. -t
.
, ..
'p
-°, ".
j~ir'
9.,!
-'- .~ .j . ' . V . * ~ * 4 .( 4 U E 4 '-

.. .
Final Report LMSC D-966.339
REFERENCES
Barton,C.F., private communication, 1983.
Barton,C.F., Trdns.Am.Nucl.Soc. V.27 (1977) pp 212-213.
Braceweli,R.N., J.Comp. Assisted Tomog. v.1 (1977) pp 6-15.
DeVolpi,A. private communication, 1983.
DeVolpi,A., and Rhodes,E.A., Materials Evaluation, v.40
(1982) pp 1273-1279.
Duerincxx,A.J., Image Statistics and N~onlinear Artifacts inCornputed Transmission X,-ra y Tomography Ph.D. Thesis, Dept.
ofEec.Engg., Stanford univ., 199
Duttd,K., Jaffey,S.M., Proceedings of the 1981 Array Confer-ence of Array, the FPS Array Processor user society (April1983) pp 2-9.
Herman,G.T., Image Reconstruction from Projections, AcademicPress, 1980.
Hopkins,F.F., Morgan,I.L., Ellix r,iI.D., Klinkseik,R.V.,*Meyer,G.A., and Thompson,J.N., IEEE Tr.Nuc.Sc. v.NS-28
(1981) pp 1717-1720.
Huesman,R.H., Gullberg,G.T., Greenberg,W.L., andBudinger,T.F., Donner Algorithlms for Reconstruction TomograEp2X Univ. of Calf., Berkeley, 1977.
Jaffey,S.M. and Dutta,K., SPIE v.367 Processing and Displayof Three-Dimensional Data (1982), pp 130-14U.
Joseph,P.M., and Spital,R.D., Med.Phys., v.9 (1982) pp 464-
Joseph,P.M., and Schulz,R.A., Med.Phys. v.7 (1980) pp 692-702.
Joseph,P.M., Spitdl,R.D., and Stockham,C.D., Comput. Tomog.,Iv.4 (1980) pp 189-206. N
-49-

Final Report LMSC D-966.339
Koeppe,R.A., Brugger,R.M., Schlapper,G.A., Larsen,G.N., andJost,R.J., J.Comp. Assisted Tomog. v.5 (1981) pp 79-88.
91 Macovski,A., private communication, 1983.
Macovski,A., Medical Imaging Sytes Prentice-Hall, 1983.
Newacheck,R.L., of Aerotest operations, private communica-tion, 1983.
Richdrds,W.J., McClellan,G.C., and Tow,D.i4., Materialsj4valuation, v-40) (1982) pp 1263-1267.
Robb, R.A., private communication, 1983.
- Schlapper,G.A., Larsen,G.N., Koeppe,R.M., Jost,R.A., andBrugger,R.M., Trans.Am.Nucl.Soc. v.34 (1980) pp 176-178.
* Stonestrom,J.P., Non-linearities in X-ray Computerized Tomo-
graphic Imaging Sytm Ph.D. Thesis, Dept. of Elec. Engg.,Stanford Univ. 1976.
Stonestrom,J.P., Alvarez,R.E., and Macovski,A., IEEETr.Biomed.Engg., v.BME-28 (1981) pp 128-141.
Tyufakov,N.D., and Shtan,A.S., Principles of Neutron Radiog-raphy Amerind Publishing Co. Ltd., New Delhi (1979).
- Verly,J.G., and Bracewell,R.N., J.Comp. Assisted Tomog., v.3 K(1979) pp 662-673.
Li -50-
- ' ~~ % V ~ ... ~. * ~%% ~ '.~q* ,. * '' a ~ a a . ~ - , '