v ice president—portfolio specialist: u.s. equities v ice...
TRANSCRIPT

US LARGE-CAP GROWTH EQUITY STRATEGY12 APRIL 2017
FOR EXISTING CLIENT IN STRATEGY ONLY. NOT FOR FURTHER DISTRIBUTION.
Presentation to:
T. ROWE PRICE 78
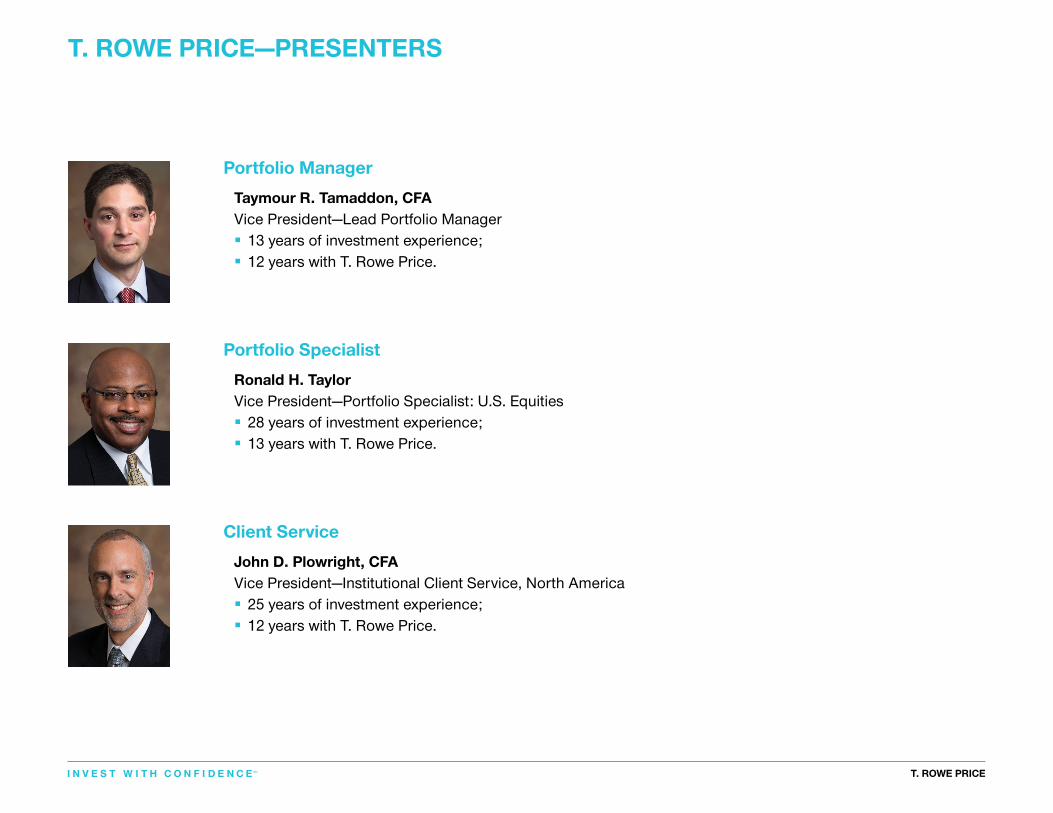
Client Service
John D. Plowright, CFA Vice President—Institutional Client Service, North America § 25 years of investment experience; § 12 years with T. Rowe Price.
John D. Plowright, CFAInstitutional Client Service, North America
JOHN D. PLOWRIGHT, CFA
T. ROWE PRICE 64
Portfolio Specialist
Ronald H. Taylor Vice President—Portfolio Specialist: U.S. Equities§ 28 years of investment experience;§ 13 years with T. Rowe Price.
Ronald H. TaylorPortfolio Specialist
RONALD H. TAYLOR
T. ROWE PRICE 60
Portfolio Manager
Taymour R. Tamaddon, CFA Vice President—Lead Portfolio Manager (Eff ective 1 January 2017)§ 13 years of investment experience;§ 12 years with T. Rowe Price.
Taymour R. Tamaddon, CFAPortfolio Manager
TAYMOUR R. TAMADDON, CFA

T. ROWE PRICE
Australia Level 31120 Collins StreetMelbourne VIC 3000Australia+61.03.9225.5434
Australia Level 50, Governor Phillip Tower1 Farrer Place, Suite 50BSydney NSW 2000Australia+61.2.8667.5700
Canada Suite 4240, 77 King Street WestTD North TowerP.O. Box 87Toronto, ON M5K 1G8Canada+1.416.360.5777
Denmark Tuborg Havnevej 19DK-2900 HellerupDenmark+45.33.36.05.00
Germany Bockenheimer Landstraße 17/1960325 Frankfurt am MainGermany+49.69.71045.5218
Hong Kong 21/F Jardine House1 Connaught PlaceCentral, Hong Kong+852.2536.7800
ItalyVia Torino 220123, MilanItaly+39.02.72546615
Japan GranTokyo South Tower 7F9-2, Marunouchi 1-chome,Chiyoda-ku, Tokyo100-6607, Japan+81.3.6758.3800
Luxembourg 35 Boulevard Prince HenriL-1724 LuxembourgGrand Duchy of Luxembourg+352.27.47.251
Netherlands Strawinskylaan 10471077 XX AmsterdamNetherlands+31.20.333.62.00
Singapore 501 Orchard Road10-02 Wheelock PlaceSingapore 238880+65.6836.0098
SpainTorre EuropaPaseo de la Castellana 95–1528046 MadridSpain+34.91.418.69.50
Sweden Ôstermalmstorg 1114 42 StockholmSweden+46-85-025-65-93
Switzerland Talstrasse 65, 6th Floor8001 ZurichSwitzerland+41.44.227.1550
United Arab Emirates Dubai InternationalFinancial CentreThe Gate, Level 15, Offi ce 24PO Box 482023DubaiUnited Arab Emirates+971.4.4019266
United Kingdom 60 Queen Victoria StreetLondon, EC4N 4TZUnited Kingdom+44.20.7651.8200
United States 100 East Pratt StreetBaltimore, MD 21202United States+1.410.345.2000
T. ROWE PRICE
T. ROWE PRICE 64
Portfolio Specialist
Ronald H. Taylor Vice President—Portfolio Specialist: U.S. Equities§ 28 years of investment experience;§ 13 years with T. Rowe Price.
Ronald H. TaylorPortfolio Specialist
RONALD H. TAYLOR
T. ROWE PRICE—PRESENTERS
T. ROWE PRICE 60
Portfolio Manager
Taymour R. Tamaddon, CFA Vice President—Lead Portfolio Manager (Eff ective 1 January 2017)§ 13 years of investment experience;§ 12 years with T. Rowe Price.
Taymour R. Tamaddon, CFAPortfolio Manager
TAYMOUR R. TAMADDON, CFA
T. ROWE PRICE 78
Client Service
John D. Plowright, CFA Vice President—Institutional Client Service, North America § 25 years of investment experience; § 12 years with T. Rowe Price.
John D. Plowright, CFAInstitutional Client Service, North America
JOHN D. PLOWRIGHT, CFA

T. ROWE PRICE
TABLE OF CONTENTS
201703-129460
1 Section A: Company Overview
2 Section B: Investment Discipline and Process
3 Section C: Market Overview
4 Section D: Performance Review
5 Section E: Portfolio Review and Characteristics
6 Section F: Fee Schedules
7 Section G: Additional Information and Disclosures
8 Section H: Glossary of Investment Terms
9 Section I: Biographical Backgrounds

1T. ROWE PRICE
COMPANY OVERVIEW

2 T. ROWE PRICE6 T. ROWE PRICE
INDEPENDENT INVESTMENT ORGANIZATION
§ We are focused solely on investment management and related services
ALIGNMENT OF INTERESTS
§ We are a publicly owned company with substantial employee ownership
FINANCIAL STRENGTH
§ We carry no outstanding long-term debt and maintain substantial cash reserves
GLOBAL INVESTMENT PLATFORM
§ We off er a full range of Equity, Fixed Income, and Asset Allocation solutions
STABLE LEADERSHIP TEAM
§ Our Management Committee averages 16 years with T. Rowe Price3
A GLOBAL ASSET MANAGEMENT FIRM—FOCUSED ON CLIENT SUCCESS
1 The combined assets under management of the T. Rowe Price group of companies in USD as of December 31, 2016. The T. Rowe Price group of companies includes T. Rowe Price Associates, Inc., T. Rowe Price International Ltd, T. Rowe Price Hong Kong Limited, T. Rowe Price Singapore Private Ltd., and T. Rowe Price (Canada), Inc.
2 78 portfolio managers, 19 associate portfolio managers, 10 regional portfolio managers, 11 sector portfolio managers, 140 investment analysts/credit analysts, 47 quantitative analysts, 4 solutions associates, 45 associate analysts, 28 portfolio specialists/generalists, 2 strategists, 5 specialty analysts, 53 traders, 11 trading analysts, 2 economists, 31 portfolio modeling associates, and 22 management associates.
3 As of Decemer 31, 2016.
Founded in
1937810.81
billion USD in assets under management1
508investment professionals worldwide2,3
Local presence in
16 countries3
Over
6,000 associates worldwide3
as of 31 December 2016.
As of 31 December 2016.

3T. ROWE PRICE 7T. ROWE PRICE
WE INVEST IN OUR GLOBAL INVESTMENT RESOURCESAs of December 31, 2016
EQUITY PROFESSIONALSASSET ALLOCATION PROFESSIONALS
FIXED INCOME PROFESSIONALS
172 FIXED INCOMEProfessionals
30135
EQUITY Professionals
ASSET ALLOCATIONProfessionals
15 YEARSPortfolio Manager Average Tenure
20YEARSPortfolio Manager Average Investment Experience
35|190|133
UNITED STATES
356PROFESSIONALS
66|33
UNITED KINGDOM
99PROFESSIONALS
2PROFESSIONALS
25|6
HONG KONG
31PROFESSIONALS
5
JAPAN
5PROFESSIONALS
9
AUSTRALIA
9PROFESSIONALS
6
SINGAPORE
6PROFESSIONALS
78 portfolio managers, 19 associate portfolio managers, 10 regional portfolio managers, 11 sector portfolio managers, 140 investment analysts/credit analysts, 47 quantitative analysts, 4 solutions associates, 45 associate analysts, 28 portfolio specialists/generalists, 2 strategists, 5 specialty analysts, 53 traders, 11 trading analysts, 2 economists, 31 portfolio modeling associates, and 22 management associates.
As of 31 December 2016

4T. ROWE PRICE 8T. ROWE PRICE
PERSPECTIVES AND RESEARCHAs of December 31, 2016
Global Equities VOLATILITY, UNCERTAINTY, AND THE AGING BULL MARKET
Scott Berg, CFA Portfolio Manager, Global Growth Equity Strategy
PRICEPOINTOctober 2016
Timely intelligence and analysis for our clients.
KEY POINTS
Top-down macroeconomic and political news is dominating markets like never before.
The uneven nature of global economic health and a now more uncertain investing environment has raised questions over whether the equity cycle is coming to an end, or are we merely entering a new phase?
For patient long-term investors, such uncertainty typically creates buying opportunities in durable growth stocks, especially those with perceived cyclicality. Importantly, although profits growth and earnings have been poor at an aggregate level, there remain compelling pockets of growth in the world, and this remains a perennial opportunity throughout a cycle.
While the rally in oil and commodity prices has brought about a debate on the potential for a value cycle to form, we believe that long-term growth stocks are likely to continue to command a sustainable premium in a challenging macroeconomic environment.
MACROECONOMIC HEADLINES DOMINATE IN 2016
Macro and top-down events are dominating markets like never before in 2016. Rising uncertainty is to be expected when you combine the fact that we are eight years into the second longest bull market in history, in a U.S. election year, and in an environment where so many of the pillars of past return are evolving. The result ofthe UK referendum on European Union (EU) membership has added to the list of macroeconomic and political risks facing markets.
Realistically, the Brexit result will impact the UK economy in the near term as companies hold back investment in the face of uncertainty surrounding the UK’s relationship with Europe. Continental Europe may suffer a similar fate, an unwelcome outcome for a region that is growing slowly and still at the beginning of its economic recovery. Ongoing stimulus from the European Central Bank to support the European economy is highly likely and affirms the view that interest rates are likely to remain low
FOR INVESTMENT PROFESSIONALS ONLY. NOT FOR FURTHER DISTRIBUTION.
Post-Brexit Vote BRITAIN LEANS TOWARD A CLEAN BREAK FROM THE EU
PRICEPOINTOctober 2016
Timely intelligence and analysis for our clients.
KEY POINTS
New UK Prime Minister Theresa May has announced that Britain will begin the process of leaving the European Union by the end of March 2017.
This removes some of the uncertainty about how the country will extricate itself from the EU but has also heightened concerns about the potential ramifications of a so-called hard Brexit.
In our view, May’s announcement and the tone she used to make it signals less market-friendly government policies, potentially harming the UK’s growth prospects and weakening the sterling.
The continuing market uncertainty, however, will provide opportunities for patient investors with a long-term investment horizon.
May’s statement on October 2 at her first Conservative Party conference as Prime Minister was by far the strongest indication that she prefers the “hard’’ option of disentangling Britain from the EU, meaning a full withdrawal from the customs union and single European market.
“There will be no unnecessary delays in invoking Article 50. We will invoke it when we are ready. And we will be ready soon. We will invoke Article 50 no later than the end of March next year,” May said.
Quentin Fitzsimmons, a portfolio manager in T. Rowe Price’s fixed income team, says, “The Brexit vote was won by people who haven’t been doing well with the status quo. May is out to win their support and confidence in order to win the next general election. A more hardline approach to Brexit now seems more likely as May’s government regards the referendum result as a clear signal that border and migration controls are nonnegotiable in the coming Brexit negotiations.”
Global Fixed Income SHOULD I STAY OR SHOULD I GO? BOND INVESTORS FACE DIFFICULT CHOICES AHEAD
Arif Husain Head of International Fixed Income
PRICEPOINTOctober 2016
Timely intelligence and analysis for our clients.
KEY POINTS
Bond investors face a very difficult investment environment: Yields are near record lows, central bank actions have caused widespread volatility, and concerns persist over the prospects for the global economy.
Yields are likely to remain low, protecting existing portfolios against sudden declines in value, but weak U.S. corporate balance sheets could signal volatility.
It is still possible to make money in this environment, but rising correlations between equities and certain bond assets are complicating matters.
Ultimately, investors need to decide whether they want to access the higher yields available from emerging market, high yield, and corporate debt (which means accepting higher correlations with equities) or the greater diversification available from developed market sovereigns (which will mean accepting lower yields).
Every asset in a portfolio needs to justify its place. As investors, therefore, it is important that we frequently ask ourselves a basic question: Why am I holding this product? If we can’t provide a clear answer, then it is time to rethink our approach. Investing in a security for the wrong reasons can prove to be an expensive mistake.
The question is particularly important for fixed income investors at the moment. Yields in developed market sovereigns remain close to record lows, with some USD $13 trillion1 currently estimated to be in negative territory. Unconventional central bank actions have caused markets to be volatile and unpredictable, leaving participants in a near-permanent state of anxiety about when and where the next hike or cut may be coming from. Concerns over Chinese growth, the UK’s exit from the European Union, and an increasingly fractious Middle East are only adding to a prevailing climate of uncertainty. Faced with such difficult terrain, bond investors can be forgiven for not knowing which way to turn.
FOR INVESTMENT PROFESSIONALS ONLY. NOT FOR FURTHER DISTRIBUTION.
1 Source: Financial Times as of August 12, 2016.
MARKET TRENDS
PLAN SPONSORS STRATEGYMEDIA
NEWSLETTERS
Defi ned Contribution § The PPA, 10 Years In. A Retirement
Revolution Ready for Evolution § Financial Wellness: Household
Financial Capability
Defi ned Benefi t § LDI: Customization Does Not Lead
to Higher Turnover § Using an LDI Completion Manager
Global Equity § A Case for Inclusion: International
Small-Cap Equity § Steering A Path Through Uncertainty § Investment Opportunities in a Low-
Growth World
Global Fixed Income § Emerging Markets Corporate Bonds:
Seeking Yield and Ineffi ciencies in Emerging Credit Markets
§ Is the UK About To Switch To Fiscal Stimulus?
§ Should I Stay or Should I Go? Bond Investors Face Diffi cult Choices Ahead
Video § Investors Have A Choice to Make
Blogs § Central Banks: Tiptoeing Toward
Tighter Policy § Global Growth Lifts Amid a Benign
Outlook for Global Infl ation
Webinars § T. Rowe Price Webcast: A Post-
Election Point of View § Fixed Income: Should I Stay
or Should I Go?
Press § Barron’s: Interview with Shawn
Driscoll—Get Ready for the Great Oil Bust of 2017
§ Bloomberg TV Interview Ziad Bakri— Health Policy Under the Trump Administration
§ Global Market Outlook 2017 Press Briefi ng
§ Pension Curve Insider § Fixed Income Sector Pulse § In Focus § DCIO § Quarterly Investment Updates
§ Global Market Outlook: The right side of change
§ The Benefi ts of Active Management at T. Rowe Price
§ Brexit: Britain leans toward a clean break from EU
§ Global Capital Market Updates
As of 31 December 2016

5T. ROWE PRICE
LOS ANGELES DEPARTMENT OF WATER AND POWER—RELATIONSHIP MANAGEMENT TEAM
§ Coordinates overall relationship management activities
§ Primary point of contact providing access to broad firm resources
§ Ultimate accountability for client satisfaction
Institutional Client Service:
A dedicated team helping you meet your overall objectives.
Institutional Client Operations:
Institutional Sales:
§ Key contact during initial onboarding and for future cash flows
§ Operational liaison with legal, investments, and custodian
§ Coordinates review of legal agreements and contracts
§ Partners with client service team to share intellectual capital, industry insights, etc.
§ Leads investment solutions dialogue in areas beyond current mandate(s)
§ Partners on relationship management activities
§ Assists with coordination of portfolio reviews and reporting
§ Supports client-specific requests and day-to-day servicing
38T. ROWE PRICE
JOHN D. PLOWRIGHT
Footnote Nimbus Sans Novus Condensed 10/10
After updating please save EPS in: GROUPS\KitBP\TRP_MKTG_KITS\TRP_ExbTRPGen\_EPS Presenters as: Your inst Client Plowright.eps
John D. Plowright, CFAPhone: 415-772-1117
E-mail: [email protected]
14T. ROWE PRICE
MEREDITH EMPIE
Footnote Nimbus Sans Novus Condensed 10/10
After updating please save EPS in: GROUPS\KitBP\TRP_MKTG_KITS\TRP_ExbTRPGen\_EPS Presenters as: Your inst Client Empie.eps
Meredith EmpiePhone: 415-772-1118
E-mail: [email protected]
56T. ROWE PRICE
ANNE FADER
Footnote Nimbus Sans Novus Condensed 10/10
After updating please save EPS in: GROUPS\KitBP\TRP_MKTG_KITS\TRP_ExbTRPGen\_EPS Presenters as: OP Fader.eps
Anne M. FaderPhone: 410-345- 2268
E-mail: [email protected]
6T. ROWE PRICE
KEN BROOKS
Footnote Nimbus Sans Novus Condensed 10/10
After updating please save EPS in: GROUPS\KitBP\TRP_MKTG_KITS\TRP_ExbTRPGen\_EPS Presenters as: Your inst Client Brooks.eps
Ken BrooksPhone: 415-772-1104
E-mail: [email protected]

6T. ROWE PRICE
Russell Investment Group is the source and owner of the trademarks, service marks, and copyrights related to the Russell indexes. Russell® is a trademark of Russell Investment Group.
Objective
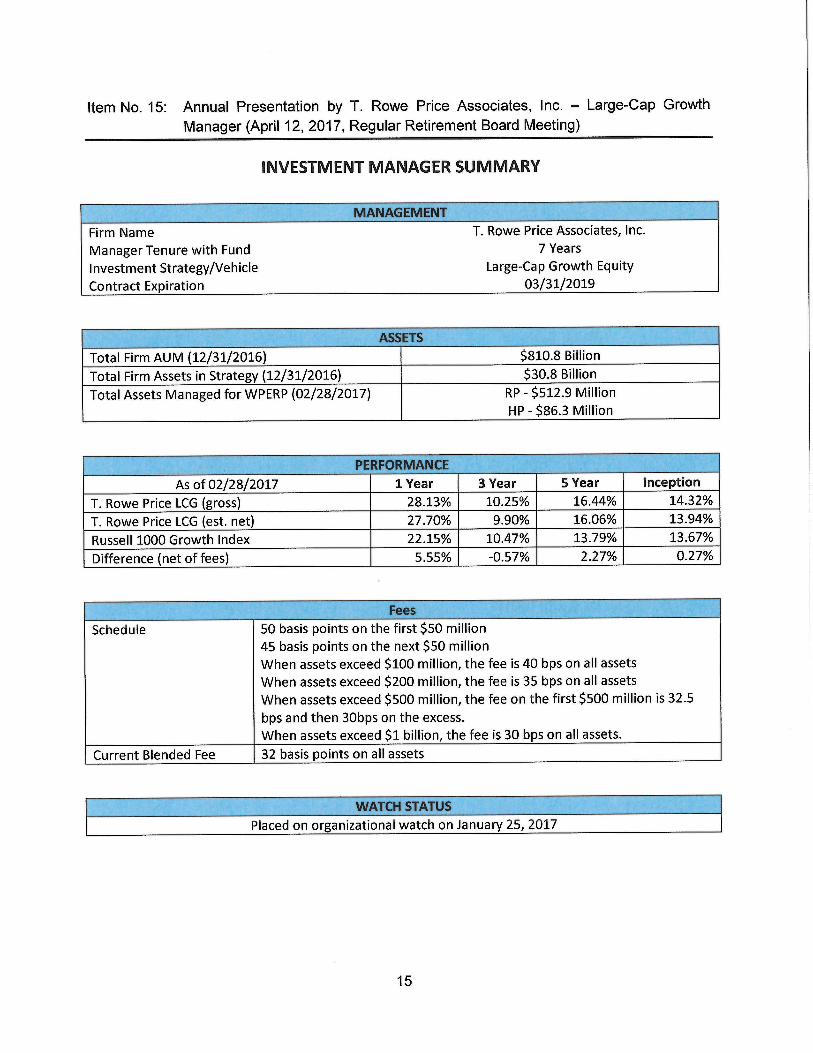
§ Seeks to provide long-term capital appreciation by investing primarily in common stocks of large growth companies.
Mandate
§ US Large-Cap Growth Equity Strategy: Separately Managed Portfolio Strategy Assets as of 31 December 2016: 30.8 Billion USD
Benchmark
§ Russell 1000 Growth Index
Investment Guidelines
§ No more than 5% of portfolio may be invested in any one issue, unless it represents more than 5% of index, in which case the portfolio may invest up to 125% of index weight.
§ All foreign securities, except for Benefit Driven Incorporations (BDIs) included in the Russell indices, are prohibited.
CLIENT OBJECTIVELos Angeles Department of Water and Power Retirement Plan:
Inception value as of 16 April 2010 360,783,756 USDContributions 30,998,937 Withdrawals 343,044,405 Market Appreciation 464,152,668 Market Value as of 28 February 2017 512,890,956
Inception value as of 16 April 2010 50,894,003 USDContributions 9,455,219 Withdrawals 51,106,787 Market Appreciation 77,097,804 Market Value as of 28 February 2017 86,340,240
Los Angeles Department of Water and Power Health Benefits Plan:

7T. ROWE PRICE 33T. ROWE PRICE
1 The combined U.S. Large-Cap Growth Equity assets of the T. Rowe Price group of companies. The T. Rowe Price group of companies includes T. Rowe Price Associates, Inc., T. Rowe Price International Ltd, T. Rowe Price Hong Kong Limited, T. Rowe Price Singapore Private Ltd., and T. Rowe Price (Canada), Inc.
2 The total US Large-Cap Growth Equity Strategy assets of the T. Rowe Price group of companies. 3 Corporate, Public, Non-Profi t, Taft-Hartley, Endowments/Foundations, and Sub-Advisory clients.4 Includes a U.S.-registered mutual fund and a common trust fund. Strategy assets under management for the T. Rowe Price U.S.-registered mutual funds and common trust funds are calculated based on the closing price of the security in its respective market and may
diff er from the net asset value of the fund.
U.S. LARGE-CAP GROWTH ASSETS UNDER MANAGEMENT
Total U.S. Large-Cap Growth EquityAssets: 155.0 Billion USD1
As of 31 December 2016
US Large-Cap Growth EquityStrategy Assets: 30.8 Billion USD2
As of 31 December 2016
Large-Cap Growth investing is a signifi cant business for T. Rowe Price.
US Large-Cap CoreGrowth Equity Strategy56.5B USD
US GrowthStock Strategy
67.7B USD
US Large-CapGrowth Equity Strategy30.8B USD
Non-U.S. Commingled Fund1,265.4M USD
U.S. Separate Accounts13,270.0M USD3
Non-U.S. Separate Accounts2,915.6M USD
U.S. InstitutionalCommingled Funds13,353.8M USD4
Numbers may not total due to rounding.

8T. ROWE PRICE
INVESTMENT DISCIPLINE AND PROCESS

9T. ROWE PRICE 7T. ROWE PRICE
US LARGE-CAP GROWTH EQUITY INVESTMENT TEAMAs of 31 December 2016
Extensive collaboration among investment professionals enhances idea generation.
1 11 sector portfolio managers, 90 research analysts, 42 associate research analysts, 6 quantitative analysts, and 5 specialty analysts as of 31 December 2016. Eff ective 1 January 2017, Taymour Tamaddon assumed portfolio management responsibilities for the strategy.
US Large-Cap Growth Equity StrategyPortfolio Management Team
Stability | Depth | Collaboration
Taymour Tamaddon, CFA Portfolio Manager (LCG)
David L. Rowlett, CFA Associate Portfolio
Manager (LCG)
Joseph B. Fath, CPAPortfolio Manager (GSS)
Larry J. Puglia, CFA, CPA Portfolio Manager (LCCG)
Ronald H. Taylor Portfolio Specialist
Craig S. Watson, CPA Portfolio Specialist
§ 13 years of investment experience
§ 12 years with T. Rowe Price § B.S., Cornell
University § M.B.A., Tuck School
of Business at Dartmouth
§ 13 years of investment experience
§ 8 years with T. Rowe Price § B.B.A., University
of Georgia § M.B.A., University of
North Carolina, Kenan-Flagler Business School
§ 16 years of investment experience
§ 14 years with T. Rowe Price § B.S., University
of Illinois, Urbana-Champaign
§ M.B.A., The Wharton School, University of Pennsylvania
§ 27 years of investment experience
§ 26 years with T. Rowe Price § B.B.A., University of
Notre Dame § M.B.A., The Darden
School, University of Virginia
§ 28 years of investment experience
§ 13 years with T. Rowe Price § B.A., University
of California, Los Angeles
§ M.B.A., Harvard Business School
§ 21 years of investment experience
§ 9 years with T. Rowe Price § B.S., Hampton
University § M.B.A., The Wharton
School, University of Pennsylvania
Equity Research Team154 Research Analysts | Industry Specialists1

10 T. ROWE PRICE
As of 1 January 2017
1 Also has portfolio management responsibilities.2 11 sector portfolio managers, 90 research analysts, 42 associate research analysts, 6 quantitative analysts, and 5 specialty analysts as of 31 December 2016. Highlighted names refl ect analysts with coverage responsibilities for portfolio holdings.
EQUITY RESEARCH TEAM
BAL BaltimoreHKG Hong KongLON London
SGP Singapore SYD Sydney TOK Tokyo
154 Equity Research Professionals worldwide2
HEADS OF EQUITY DIRECTORS OF EQUITY RESEARCH ASSOCIATE DIRECTORS OF EQUITY RESEARCH
Christopher D. Alderson LONGlobal Co-HeadRobert W. Sharps BALGlobal Co-Head
Eric L. Veiel, CFA BALU.S.
Kamran Baig LONEMEA and Latin AmericaStephon Jackson, CFA BALNorth America
Jason Polun, CFA BALNorth AmericaMitchell Todd, CA LONDeveloped Europe
Kes Visuvalingam, CFA SGPAsiaThomas Watson, CFA BALNorth America
Jai Kapadia HKG AsiaTobias Mueller LON Developed Europe
Viral Patel SYD Australia
HEALTH CARE
Ziad Bakri, CFA, MD1 BALU.S. BiotechMelissa Gallagher, Ph.D. LONOUS Pharma/BiotechJohn Hall, Ph.D. BALSmall-Cap Biotech Rachel Jonas BALU.S. SMID Healthcare Adam Poussard, CFA BALU.S. Services & EquipmentKyle Rasbach, Ph.D.,Pharm.D. BALPharmaI-hung Shih, Ph.D BALU.S. Biotech Dai Wang HKGChinese HealthcareJon Wood BALU.S. Medical Devices/ToolsRouven Wool-Lewis, Ph.D. BALU.S. Services & Hospitals
INDUSTRIALS
Jason Adams BALU.S. Aerospace and Defense Peter Bates, CFA1 BALU.S. ConglomeratesAndrew Chang SGPJapan and Asia Ex Japan Auto/Steel Andrew Davis BALU.S. TransportsRyan Ferro, CFA BALU.S. SMID IndustrialsJoel Grant, CFA BALU.S. Autos & Distributors Gianluca Guicciardi, CFA LONIndustrials/Capital GoodsHiromasa Ikeda HKGJapan Small-Cap Industrials Curt Organt, CFA1 BALU.S. Small-Cap GeneralistMelanie Rizzo, CFA BALU.S. Trucking/MachineryEunbin Song, CFA HKGAsia Ex Japan Auto/C&ERupinder Vig LONIndustrials/Capital Goods
BUSINESS SERVICES
Shaun Currie, CFA BALU.S. Business ServicesJon Friar BALU.S. Business ServicesIan McDonald, CFA BALU.S. Business ServicesJared Murphy BALU.S. Bus. Serv./Industrials
TECHNOLOGY
Kennard Allen1 BALU.S. Hardware/SoftwareGreg Dunham, CFA BALU.S. SoftwareTobias Mueller, CFA LONEurope Semi./SoftwareEmily Scudder, CFA, CPA BALU.S. Hardware Joshua Spencer, CFA1 BALU.S. Semi./EquipmentAlan Tu, CFA BALU.S. SoftwareAlison Yip HKGAsia Ex-Japan Hardware
MEDIA/TELECOM
Paul Cho BALCable/Telecom Paul Greene1 BALU.S. Advertising/InternetAden Lau SGPAsia Ex-Japan Telecom/Fin.Jacqueline Liu HKGAsia Ex-Japan InternetJeff Nathan BALU.S. Advertising/Media Corey Shull, CFA BALU.S. Media/InternetChristopher Whitehouse LONEurope Media/Telecom
CONSUMER/RETAIL
Gbemi Adeniyi-Williams LONEMEA Generalist/ConsumerPaulina Amieva BALLatin America GeneralistIra Carnahan, CFA BALU.S. Consumer DiscretionaryEric DeVilbiss, CFA BALU.S. Restaurants/AgricultureAmanda Hall, CFA LONEurope ConsumerMichael Jacobs TOKJapan Retail/LeisureJacob Kann, CFA BALDiscretionaryRekha Marda BALU.S. Food Retail/Durables Sridhar Nishtala SGPAsia Ex-Japan StaplesRobert Quinn, Jr. BALU.S. Consumer StaplesSebastian Schrott LONEuropean Luxury/RetailVivian Si BALU.S. Mass Merch. / ApparelBrian Solomon, CFA BALU.S. Cruise/Lodging Konstantin Stoev, CFA LONEuropean Staples and AutoJohn Williams, CFA BALLarge-Cap Consumer StaplesEric Yuan HKGRegional Gaming
FINANCIAL SERVICES
Malik Asif LONEMEA BanksJon Casper BALU.S. FinancialsVincent DeAugustino, CFA BALU.S. SMID FinancialsChristopher Fortune, CFA BALU.S. Small Cap BanksYoichiro Kai, CMA SGPAsian Banks incl. Japan and Japanese InsuranceGregory Locraft, Jr. BALU.S. P&C InsuranceJihong Min SGPSoutheast Asia BanksThibault Nardin LONEurope BanksMatt Snowling, CFA BALCapital MarketsGabriel Solomon1 BALU.S. Money Center/Insur.Zenon Voyiatzis LONEurope Insur./Financials
REAL ESTATE
Dan McCulley, CFA BALU.S. Real EstatePreeta Ragavan, CFA BALU.S. Real Estate
NATURAL RESOURCES
Haider Ali HKGAsia Ex-Japan Oil & GasSheena Barbosa, CFA HKGAsia Ex-Japan Utilities/Infra.Ryan Burgess, CFA1 BALU.S. Chemicals/IndustrialsChris Driessen BALMetals & MiningShawn Driscoll1 BALU.S. E&PRyan Hedrick, CFA BALU.S. Coal/UtilitiesJon Hussey BALU.S. Agriculture Shinwoo Kim BALU.S. Energy ServicesMatt Mahon BALU.S. Chemicals Ryan Martyn SYDAustralia Energy/IndustrialsChris O’Neill BALU.S. E&PTimothy Parker, CFA1 BALU.S. E&PVivek Rajeswaran, CFA BALU.S. Equip. & Services/WasteThomas Shelmerdine SYDAustralian Metals & MiningJohn Sherman LONEuropean Chemicals/Indus.Christopher Wheaton LONEnergy Majors
REGIONAL GENERALISTS Ulle Adamson, CFA1 LONEMEA Martin Baylac LONLatin AmericaSimon Cheng, CFA, CPA HKGGreater China Small-CapArchibald Ciganer, CFA1 TOKJapan Transports/ConsumerAnouk Dey, CFA BALU.S. Small-Cap Growth Vishnu Gopal HKGIndia & ASEAN Small-CapBen Griffi ths, CFA1 LONEurope Small-CapNabil Hanano, CFA BALEuropeTetsuji Inoue, CPA TOKJapan Small-Cap/Real Estate, Japan TechnologyRandal Jenneke1 SYDAustralia Media/ConsumerJai Kapadia HKGAsia Real Estate/Conglom.Mark Lawrence, CFA LONEMEAOxana Lyalina LONEMEAMichael Niedzielski LONEurope Small-Cap Paul O’Sullivan, ACA SYDAustralia Financials/H.C.Seun Oyegunle, CFA LONEMEAViral Patel SYDAustralia REITS/RetailAlexander Roik BALU.S. Small-Cap ValueSin Dee Tan, CFA LONEurope Small-CapVerena Wachnitz, CFA1 LONLatin America Hiroshi Watanabe, CFA1 TOKJapan SMID-CapMarta Yago LONLatin America

11T. ROWE PRICE 9T. ROWE PRICE
Extensive analyst interaction across industry groups, sectors, and asset classes promotes a broad perspective and timely decision-making.
FUNDAMENTAL RESEARCH AND ANALYSIS
Analysts are industry specialists across capitalization and investment styles
§ Evaluate impact of all competitors within an industry group
Fundamental, bottom-up approach to company research
§ Industry and company dynamics, management team quality, and fi nancial fundamentals are central considerations
“Push/pull” relationship between analysts and portfolio managers
§ Multiple signaling tools communicate analysts’ conviction and urgency
§ Portfolio managers “stress test” analysts’ recommendations to independently confi rm conclusions
§ Valuation assessment is a key consideration
Compensation of our professionals is closely linked to investment performance
§ Quantitative measurement of ratings/impact
§ Qualitative assessment of overall contribution
§ Performance-based bonuses
§ Equity participation
12T. ROWE PRICE 10T. ROWE PRICE
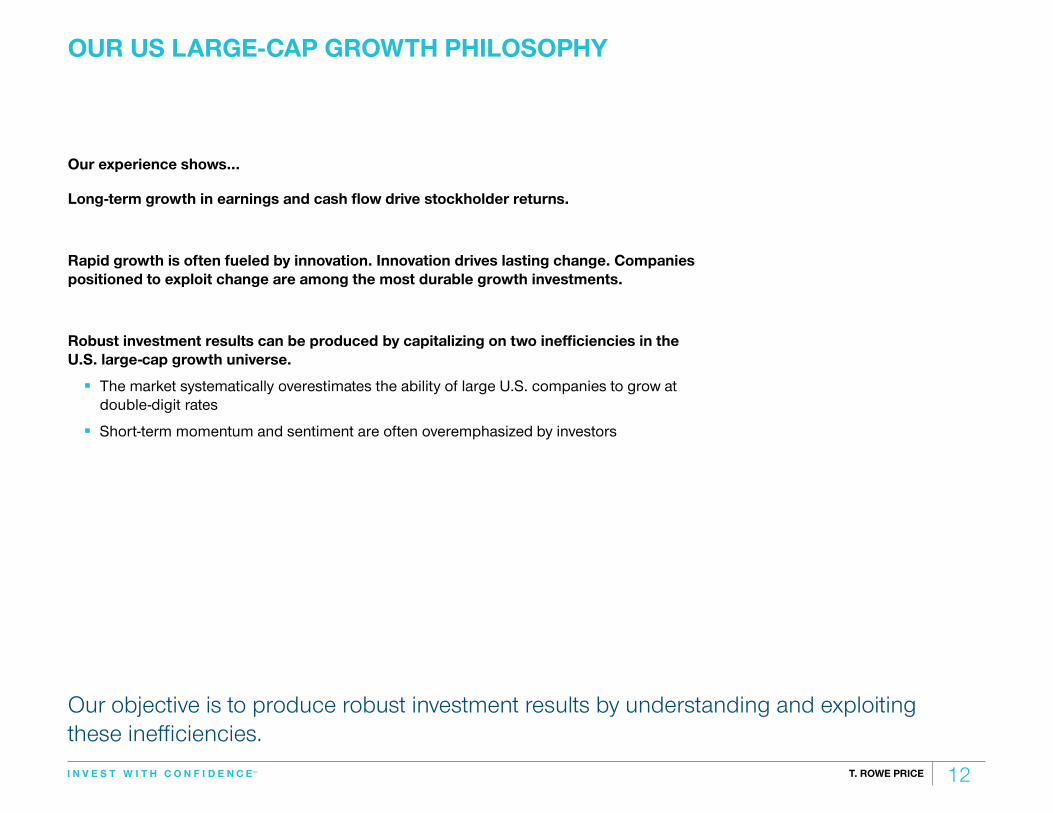
Our objective is to produce robust investment results by understanding and exploiting these ineffi ciencies.
OUR US LARGE-CAP GROWTH PHILOSOPHY
Our experience shows...
Long-term growth in earnings and cash fl ow drive stockholder returns.
Rapid growth is often fueled by innovation. Innovation drives lasting change. Companies positioned to exploit change are among the most durable growth investments.
Robust investment results can be produced by capitalizing on two ineffi ciencies in the U.S. large-cap growth universe.
§ The market systematically overestimates the ability of large U.S. companies to grow at double-digit rates
§ Short-term momentum and sentiment are often overemphasized by investors

13T. ROWE PRICE 11T. ROWE PRICE
1 Sectors representing 10%+ of the Russell 1000 Growth Index.Russell Investment Group is the source and owner of the trademarks, service marks, and copyrights related to the Russell indexes. Russell® is a trademark of Russell Investment Group.
Superior information and implementation can produce robust investment results.
US LARGE-CAP GROWTH INVESTMENT PROCESS Our research-driven, bottom-up approach is the engine for our investment idea generation
§ New information or new insights alter outlook
§ Unanticipated deterioration in investment fundamentals
§ Extreme valuation
§ Most compelling, highest-conviction ideas over three-year time horizon
§ Individual position sizes typically range ±4% relative to Russell 1000 Growth Index weighting
§ Sector weightings generally limited to 0.5X–3.0X of primary1 Russell 1000 Growth Index sector weights
§ Predicted tracking error target of 400–700 basis points relative to the Russell 1000 Growth Index
§ Active risk management process to eliminate “unintended bets”
§ Proprietary industry and company analysis
§ Analyst inputs to confi rm 10%+ Real EPS Growth
§ Independent stress testing by portfolio management team
§ Confi rm analyst conclusions
§ Valuation analysis
§ Quantitative screens
§ Forecasted 10%+ Real EPS Growth
§ Historical ROE
§ Eliminates companies with slow or no long-term growth prospects
§ Generally 5B+ USDmarket cap
§ Primarily U.S. companies
Sell Discipline Portfolio
Construction and Risk Management
500Companies
150–200Companies
80–120Companies
60–75Companies
Fundamental Research and
Analysis Growth Screens Defi ning the
Universe

14T. ROWE PRICE 12T. ROWE PRICE
In-depth company analysis provides portfolio managers with sound, long-term investment ideas.
FUNDAMENTAL RESEARCH ANALYSIS154 equity research professionals1 worldwide who are industry specialists across capitalization and investment styles.
1 11 sector portfolio managers, 90 research analysts, 42 associate research analysts, 6 quantitative analysts, and 5 specialty analysts as of December 31, 2016.
Industry Analysis Company Analysis
Secular Analysis Cyclical Analysis Qualitative Analysis Quantitative Analysis Valuation Analysis
Industry Growth Prospects
§ Unit volume growth
§ Price stability/pricing power
Industry Conditions
§ Capacity additions/reductions
§ Demand drivers
Market Position
§ Market share
§ Brand/reputation, technology, intellectual property
§ Cost position/structural advantage
Management Team Quality
§ Strategy
§ Capital allocation
§ Information systems
Financial Strength
§ Free cash fl ow generation
§ Level and direction of margins
§ Level and direction of ROIC
§ Balance sheet strength
Confi rm Attractive Valuation
§ Relative valuation
§ P/FCF
§ P/E
§ PEG Ratio
§ EV/EBITDA
31 December 2016.

15T. ROWE PRICE
MARKET OVERVIEW

16 T. ROWE PRICE
5
As of 31 December 2016
Past performance is not a reliable indicator of future results. Sources: FactSet
Performance by Style and Market Capitalisation
ONE YEAR THREE YEAR
<-10% -5% to -10% 0% to -5% 0 to +5% +5% to +10% >+10% Scale:
Russell 1000 Value S&P 500 Russell 1000 Growth
Russell M
id-C
ap Grow
th
Russell 2000 Value Russell 2000 Russell 2000 Growth
FIVE YEAR TEN YEAR
17.3% 12.0% 7.1%
20.0% 13.8% 7.3%
31.7% 21.3% 11.3%
8.6% 8.9% 8.6%
9.5% 7.9% 6.2%
8.3% 6.7% 6.6%
14.8% 14.6% 14.5%
15.7% 14.7% 13.5%
15.1% 14.4% 13.7%
5.7% 6.9% 8.3%
7.6% 7.9% 7.8%
6.3% 7.1% 7.7%
Rus
sell
Mid
-C
ap V
alue
Rus
sell
Mid
-C
ap V
alue
Russell M
id-C
ap Grow
th
Russell 1000 Value S&P 500 Russell 1000 Growth
Russell 2000 Value Russell 2000 Russell 2000 Growth
Russell 1000 Value S&P 500 Russell 1000 Growth
Russell 1000 Growth S&P 500 Russell 1000 Value
Russell M
id-C
ap Grow
th
Russell M
id-C
ap Grow
th Rus
sell
Mid
-C
ap V
alue
Rus
sell
Mid
-C
ap V
alue
Russell 2000 Value
Russell 2000 Growth
Russell 2000 Growth
Russell 2000
Russell 2000
Russell 2000 Value
PERFORMANCE BY STYLE AND MARKET CAPITALISATION Periods Ended 31 December 2016
Source: FactSet.Past performance cannot guarantee future results.
Russell Investment Group is the source and owner of the trademarks, service marks, and copyrights related to the Russell indexes. Russell® is a trademark of Russell Investment Group.

17T. ROWE PRICE
3
85
90
95
100
105
110
115
Inde
x Le
vel-R
ebas
ed
S&P 500 INDEX December 2015 – December 2016
Marching Higher Despite the Uncertainties
Past performance is not a reliable indicator of future results. Sources: FactSet, The Wall Street Journal, T. Rowe Price.
Period S&P 500 IndexReturn
1 year 12.0%
5 year 14.7%
10 year 6.9%
As of 31 December 2016
Uncertainty heightened by Brexit vote
U.S. PresidentialElection
0
5
10
15
20
25
30
Dec-15 Jan-16 Feb-16 Mar-16 Apr-16 May-16 Jun-16 Jul-16 Aug-16 Sep-16 Oct-16 Nov-16 Dec-16
VIX
1 year average
Rising/Fading Anxiety OverImpending U.S. Recession
MARCHING HIGHER DESPITE THE UNCERTAINTIESOne Year Ended 31 December 2016Figures are Calculated in U.S. Dollars
Past performance cannot guarantee future results.
Sources: FactSet, The Wall Street Journal, T. Rowe Price.Past performance cannot guarantee future results.
S&P 500 INDEXPeriod
S&P 500IndexReturn
1 year 12.0%
5 year 14.7%
10 year 6.9%

18 T. ROWE PRICE
6
1.4
5.9 6.9
-1.5
10.16.6
-2.5
-21.1
-4.8
4.7
-8.4
3.4
12.013.8
-2.7
22.8
6.0 5.4
18.9
27.4
16.3 16.7
23.5
-25%
-15%
-5%
5%
15%
25%
35%
S&P 500 Sector Returns
2015 2016
InfoTech
HealthCare Financials
ConsumDisc
ConsumStpls
Indust &Bus Svcs Energy Utilities Real Estate Materials
TelecomSvcs
S&P 500 Index Weights:
21% 14% 15% 12% 9% 10% 8% 3% 3% 3% 3%
As of 31 December 2016
Past performance is not a reliable indicator of future results. Returns in US dollars. Sources: Wilshire, FactSet
Reversal in Sector Leadership over 2016; Financials, Energy, and Materials Rebound
REVERSAL IN SECTOR LEADERSHIP OVER 2016; FINANCIALS, ENERGY, AND MATERIALS REBOUND As of 31 December 2016Figures are Calculated in U.S. Dollars
Sources: Wilshire, FactSet.Past performance cannot guarantee future results.
S&P 500 SECTOR RETURNS
T. Rowe Price uses the MSCI/S&P Global Industry Classifi cation Standard (GICS) for sector and industry reporting. Each year, MSCI and S&P review the GICS structure. The last change occurred on31 August 2016. T. Rowe Price will adhere to all future updates to GICS for prospective reporting.

19T. ROWE PRICE
EQUITY VALUATIONS AND EARNINGS GROWTH 20 Years Ended December 2016
8
Past performance is not a reliable indicator of future results. Sources: FactSet
Equity Valuations and Earnings Growth
S&P 500 Russell 1000 Value Russell 1000 Growth Russell Mid Cap Russell 2000
EPS Growth 2015 1.0 -3.9 6.6 3.2 4.5
EPS Growth 2016e 0.7 -1.2 2.7 1.4 -1.2
EPS Growth 2017e 12.0 13.1 11.0 12.4 26.2
EPS Growth 2018e 11.7 11.8 12.2 12.7 22.9
0
10
20
30
40
50
60
S&P 500 Russell 1000 Value Russell 1000 Growth Russell Mid Cap Russell 2000
MARKET INDICES: FORWARD P/E RATIOS Past 20 years, as of 31 December 2016
Current Relative P/E Ratio
Average P/E Ratio
P/E Ratio Range over past 20 years
Past performance cannot guarantee future results.
Source: FactSet.Past performance cannot guarantee future results.
MARKET INDICES: FORWARD P/E RATIOS
Russell Investment Group is the source and owner of the trademarks, service marks, and copyrights related to the Russell indexes. Russell® is a trademark of Russell Investment Group.

20 T. ROWE PRICE
23
BULLS
1. Near term earnings comparison arefavourable for key sectors of market
2. Compared to alternatives, valuation ofequities appears reasonable
3. Employment trends remain broadly positive
4. Sentiment and business cycle appearsupportive
BEARS 1. Profit margins have plateaued as wage
growth accelerates
2. Revenue growth remains challengedacross many segments of the market
3. Valuations are extended by historicalstandards
4. Rates and U.S. dollar expected to trendhigher
As of 31 December 2016
The Outlook for US Equities: Valid Arguments on Both Sides of Debate
Cautiously optimistic. Expect higher levels of volatility as we negotiate periods of uncertainty. Remain disciplined, value diversification, and focus on long-term opportunities.
Sources: T Rowe Price
THE OUTLOOK FOR US EQUITIES: VALID ARGUMENTS ON BOTH SIDES OF DEBATE As of 31 December 2016
Source: T. Rowe Price.
21T. ROWE PRICE
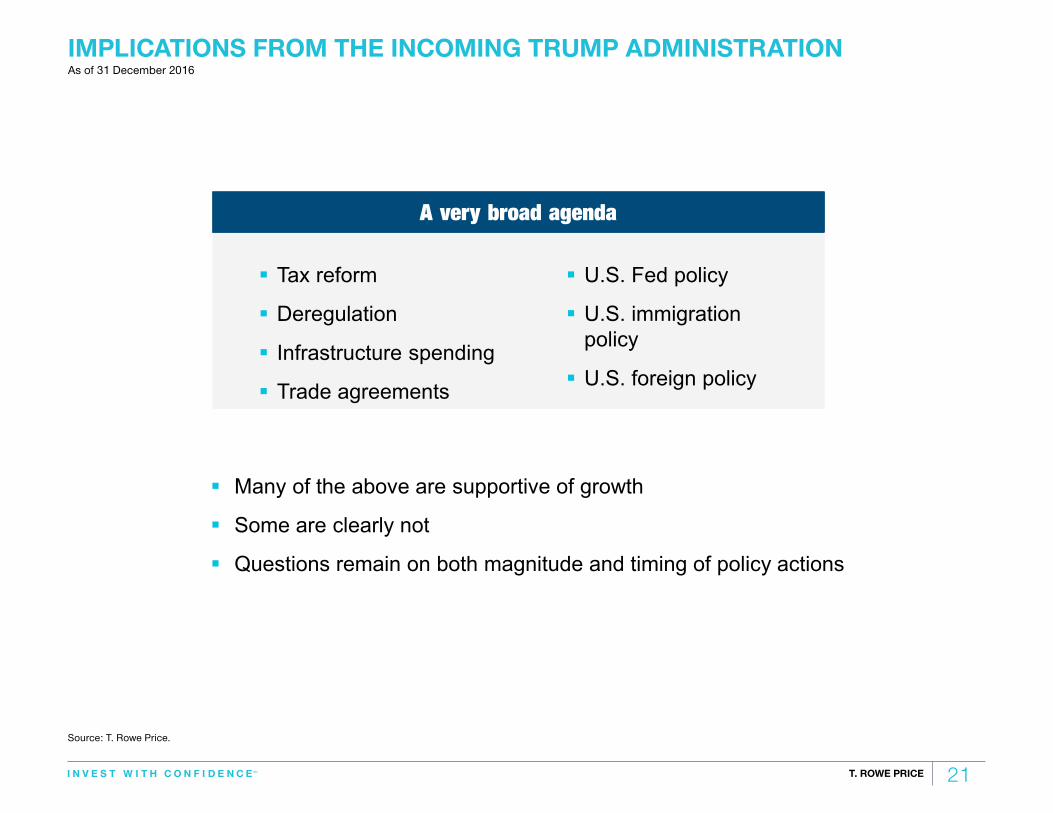
IMPLICATIONS FROM THE INCOMING TRUMP ADMINISTRATIONAs of 31 December 2016
Source: T. Rowe Price. 24
Implications from the Incoming Trump Administration
A very broad agenda
Tax reform
Deregulation
Infrastructure spending
Trade agreements
§ U.S. Fed policy
§ U.S. immigrationpolicy
§ U.S. foreign policy
Many of the above are supportive of growth
Some are clearly not
Questions remain on both magnitude and timing of policy actions
Sources: T Rowe Price
A very broad agenda

22T. ROWE PRICE
PERFORMANCE REVIEW

23T. ROWE PRICE
COMPLIANCE CERTIFICATE

24T. ROWE PRICE
COMPLIANCE CERTIFICATE

25 T. ROWE PRICE
PERFORMANCE SUMMARY AND MARKET UPDATEAs of 31 December 2016
2T. ROWE PRICE
I V. MARKET OUTLOOK
§ Modest U.S. economic growth should continue
§ Investors remain cautious amid global economic growth concerns
§ Quality, large-cap stocks off er solid risk/reward prospects
§ Equity valuations remain reasonable versus long-term averages
I. MARKET OVERVIEW
Fourth Quarter One YearS&P 500 Index 3.82% 11.96%Russell 1000 Growth Index 1.01 7.08Russell 1000 Value Index 6.68 17.34Nasdaq 1.34 7.50Russell 2000 Index 8.83 21.31
§ Large-cap stocks underperformed small-caps for the quarter
§ Growth stocks underperformed value stocks for the quarter
§ Global economic growth remains a key issue
I I. SECTOR PERFORMANCE RUSSELL 1000 GROWTH INDEX
Fourth QuarterTop Three Performers Bottom Three PerformersIndustrials & Business Services Real EstateFinancials Health CareTelecommunication Services Energy
One YearTop Three Performers Bottom Three PerformersTelecommunication Services Health CareEnergy Real Estate
Utilities Consumer Staples
V. MARKET OUTLOOK
§ Modest U.S. economic growth should continue
§ Investors remain cautious amid global economic growth concerns
§ Quality, large-cap stocks off er solid risk/reward prospects
§ Equity valuations remain reasonable versus long-term averages
As of December 31, 2016Figures are Calculated in U.S. Dollars
III. PORTFOLIO PERFORMANCE FOURTH QUARTER
Los Angeles Department of Water and Power Employees' Retirement Plan
Major Absolute Contributors Major Absolute Detractors
Morgan Stanley Amazon.com
American Airlines Facebook
Alaska Air Group Intuitive Surgical
Boeing Visa
UnitedHealth Group Workday
IV. PORTFOLIO PERFORMANCE ONE YEAR
Los Angeles Department of Water and Power Employees' Retirement Plan
Major Absolute Contributors Major Absolute Detractors
Applied Materials Alexion Pharmaceuticals
Morgan Stanley Vertex Pharmaceuticals
Amazon.com Regeneron Pharmaceuticals
UnitedHealth Group LinkedIn
Priceline Bristol-Myers Squibb
1T. ROWE PRICE
As of December 31, 2016Figures are Calculated in U.S. Dollars
I V. MARKET OUTLOOK
§ Modest U.S. economic growth should continue
§ Investors remain cautious amid global economic growth concerns
§ Quality, large-cap stocks off er solid risk/reward prospects
§ Equity valuations remain reasonable versus long-term averages
I. MARKET OVERVIEW
Fourth Quarter One YearS&P 500 Index 3.82% 11.96%Russell 1000 Growth Index 1.01 7.08Russell 1000 Value Index 6.68 17.34Nasdaq 1.34 7.50Russell 2000 Index 8.83 21.31
§ Large-cap stocks underperformed small-caps for the quarter
§ Growth stocks underperformed value stocks for the quarter
§ Global economic growth remains a key issue
I I. SECTOR PERFORMANCE S&P 500 INDEX
Fourth QuarterTop Three Performers Bottom Three PerformersFinancials Real EstateEnergy Health CareIndustrials & Business Services Consumer Staples
One YearTop Three Performers Bottom Three PerformersEnergy Real EstateTelecommunication Services Health Care
Financials Consumer Staples
V. MARKET OUTLOOK
§ Modest U.S. economic growth should continue
§ Investors remain cautious amid global economic growth concerns
§ Quality, large-cap stocks off er solid risk/reward prospects
§ Equity valuations remain reasonable versus long-term averages
(N) New holding.(E) Eliminated.
V. SIGNIFICANT TRADES FOURTH QUARTER
Los Angeles Department of Water and Power Employees' Retirement Plan
Major Purchases Major Sales
Home Depot (N) Lowe's
Red Hat (N) Danaher
Microsoft Hanesbrands (E)
Crown Castle International (N) Juniper Networks (E)
Philip Morris International Tractor Supply
Business Description sourced from Thomson Reuters Worldscope Fundamentals, Copyright©, Thomson Reuters, 1999–2017. All Rights Reserved.The specifi c securities identifi ed and described do not represent all of the securities purchased, sold, or recommended for the portfolio, and no assumptions should be made that the securities identifi ed and discussed were or will be profi table.The information shown does not refl ect any exchange-traded funds that may be held in the portfolio.Numbers may not total due to rounding.
SA_CLIENT_TOPTEN Sep Accts with Client Performance Top Ten Holdings – Not Mutual Fund data
After updating please save EPS in: Groups/KitBP/TRP_Mtg Kits/TRP_ExbTRPGen/_EPS Footnotes as: SA_Client_TopTen
Past performance cannot guarantee future results.
Russell Investment Group is the source and owner of the trademarks, service marks, and copyrights related to the Russell indexes. Russell® is a trademark of Russell Investment Group.
VI. MARKET OUTLOOK

26T. ROWE PRICE
TOTAL RETURN PERFORMANCELos Angeles Department of Water and Power Employees' Retirement PlanPeriods Ended 31 December 2016Figures are Calculated in U.S. Dollars
Business Description sourced from Thomson Reuters Worldscope Fundamentals, Copyright©, Thomson Reuters, 1999–2017. All Rights Reserved.The specifi c securities identifi ed and described do not represent all of the securities purchased, sold, or recommended for the portfolio, and no assumptions should be made that the securities identifi ed and discussed were or will be profi table.The information shown does not refl ect any exchange-traded funds that may be held in the portfolio.Numbers may not total due to rounding.
SA_CLIENT_TOPTEN Sep Accts with Client Performance Top Ten Holdings – Not Mutual Fund data
After updating please save EPS in: Groups/KitBP/TRP_Mtg Kits/TRP_ExbTRPGen/_EPS Footnotes as: SA_Client_TopTen
Past performance cannot guarantee future results.
Russell Investment Group is the source and owner of the trademarks, service marks, and copyrights related to the Russell indexes. Russell® is a trademark of Russell Investment Group.
Past performance cannot guarantee future results.1 Performance fi gures are shown gross of advisory fees. Total returns would be lower as a result of the deduction of such fees.2 Net returns refl ect the deduction of advisory fees. Source: T. Rowe Price Modifi ed Dietz Rate of Return. Total returns include all realized and unrealized gains and losses plus income. All investments are subject to risk, including the possible loss of the money you invest.
Calendar Years16 Apr 2010– 31 Dec 2010 2011 2012 2013 2014 2015 2016
Los Angeles Department of Water and Power Employees' Retirement Plan (Gross of Fees)1 4.83% -2.03% 19.91% 44.51% 9.26% 12.48% 5.27%
Los Angeles Department of Water and Power Employees' Retirement Plan (Net of Fees)2 4.59 -2.36 19.52 44.06 8.91 12.12 4.92
Russell 1000 Value Index 8.21 2.64 15.26 33.48 13.05 5.67 7.08
Value Added (Net of Fees)3 -3.62 -5.00 4.26 10.58 -4.14 6.45 -2.16
Annualized
ThreeMonths
One Year
Two Years
ThreeYears
Five Years
Since Client Inception
16 Apr 2010
Los Angeles Department of Water and Power Employees' Retirement Plan (Gross of Fees)1 2.35% 5.27% 8.82% 8.97% 17.52% 13.23%
Los Angeles Department of Water and Power Employees' Retirement Plan (Net of Fees)2 2.27 4.92 8.46 8.61 17.14 12.86
Russell 1000 Value Index 1.01 7.08 6.37 8.55 14.50 12.35
Value Added (Net of Fees)3 1.26 -2.16 2.09 0.06 2.64 0.51
3 Value Added is shown as Los Angeles Department of Water and Power Employees' Retirement Plan (Net of Fees) minus Russell 1000 Growth Index.

27T. ROWE PRICE
Annualized
Quarter-to-Date
One Year
Two Years
ThreeYears
Five Years
Since ClientInception
16 Apr 2010
Los Angeles Department of Water and Power Employees' Retirement Plan (Gross of Fees)1 8.63% 28.13% 10.11% 10.08% 16.32% 14.27%
Los Angeles Department of Water and Power Employees' Retirement Plan (Net of Fees)2 8.58 27.72 9.75 9.72 15.95 13.90
Russell 1000 Value Index 7.66 22.15 7.69 10.47 13.79 13.26
Value Added (Net of Fees)3 0.92 5.57 2.06 -0.75 2.16 0.64
TOTAL RETURN PERFORMANCELos Angeles Department of Water and Power Employees' Retirement PlanPeriods Ended 28 February 2017 Figures are Calculated in U.S. Dollars
Russell Investment Group is the source and owner of the trademarks, service marks, and copyrights related to the Russell indexes. Russell® is a trademark of Russell Investment Group.
Past performance cannot guarantee future results.1 Performance fi gures are shown gross of advisory fees. Total returns would be lower as a result of the deduction of such fees.2 Net returns refl ect the deduction of advisory fees. Source: T. Rowe Price Modifi ed Dietz Rate of Return. Total returns include all realized and unrealized gains and losses plus income. All investments are subject to risk, including the possible loss of the money you invest.3 Value Added is shown as Los Angeles Department of Water and Power Employees' Retirement Plan (Net of Fees) minus Russell 1000 Growth Index.

28 T. ROWE PRICE
Footnote Nimbus Sans Novus Condensed 10/10
ATTRIBUTION ANALYSISLA Dept of Water and Power Employees Retirement Plan - LCG vs. Russell 1000 Growth Index3 Months Ended 31 December 2016Figures Shown in U.S. Dollar
Total Value Added
Value Added FromSector Weight
Value Added FromStock Selection
N
Numbers may not add to 100% due to rounding; all numbers are percentages.Note: Analysis represents the equity-only performance of the portfolio as calculated by the Wilshire Atlas attribution model and is exclusive of cash, trusts, mutual funds, delisted securities, and other non-equity holdings. Returns will not match official T. Rowe Price performance because Wilshire uses different pricing and exchange rate sources and does not capture intraday trading or fair-value pricing.Performance for each security is obtained in the local currency and, if necessary, is converted using an exchange rate determined by an independent third party. Source: Wilshire Atlas, MSCI/S&P Global Industry Classification Standard (GICS) sectors; Analysis by T. Rowe Price Associates, Inc. T. Rowe Price uses the MSCI/S&P GICS for sector and industry reporting.Each year, MSCI and S&P make changes to the GICS structure. The last change occurred on 31 August 2016. T. Rowe Price will adhere to all future updates to GICS for prospective reporting. Figures areshown gross of fees. Past performance cannot guarantee future results.
BY SECTOR (TOP AND BOTTOM FIVE BY TOTAL VALUE ADDED)
TotalIndustrials &
Bus Svcs FinancialsHealth Care
Real Estate
Telecom Svcs
Consumer Staples Materials Energy Utilities
Consumer Disc
Information Technology
Over (Under) Weight -- -1.13 5.82 3.26 -2.05 -0.20 -7.64 -2.75 -0.63 -0.03 4.86 0.49
Portfolio Weight (Ending) 100.00 9.93 8.71 19.36 0.61 1.06 1.82 0.86 0.00 0.00 25.59 32.07
Index Weight (Ending) 100.00 11.06 2.88 16.10 2.66 1.26 9.46 3.61 0.63 0.03 20.73 31.57
Portfolio Performance 2.32 20.71 19.98 0.43 7.00 23.10 -1.26 10.21 0.00 0.00 -0.60 -3.37
Index Performance 1.01 6.88 6.68 -3.48 -5.28 4.55 -0.51 2.09 -0.89 3.69 2.10 1.06
Footnote Nimbus Sans Novus Condensed 10/10
ATTRIBUTION ANALYSIS (USD)Los Angeles Department of Water and Power Employees' Retirement Plan vs. Russell 1000 Growth IndexThree Months Ended 31 December 2016
Past performance cannot guarantee future results. Numbers may not add to 100% due to rounding; all numbers are percentages. Analysis represents the equity-only performance of the portfolio as calculated by the Wilshire Atlas attribution model and is exclusive of cash, trusts, mutual funds, delisted securities, and other non-equity holdings. Returns will not match offi cial T. Rowe Price performance because Wilshire uses diff erent pricing and exchange rate sources and does not capture intraday trading or fair-value pricing. Performance for each security is obtained in the local currency and, if necessary, is converted using an exchange rate determined by an independent third party.Source: Wilshire Atlas, MSCI/S&P Global Industry Classifi cation Standard (GICS) sectors; analysis by T. Rowe Price Associates, Inc. T. Rowe Price uses the MSCI/S&P GICS for sector and industry reporting. Each year, MSCI and S&P review the GICS structure. The last change occurred on 31 August 2016. T. Rowe Price will adhere to all future updates to GICS for prospective reporting.Figures are shown gross of fees.Russell Investment Group is the source and owner of the trademarks, service marks, and copyrights related to the Russell indexes. Russell® is a trademark of Russell Investment Group.

29T. ROWE PRICE
KEY THREE MONTH PERFORMANCE DRIVERSThree Months Ended 31 December 2016
CONTRIBUTORS § Industrials & Business Services
§ Shares of American Airlines rallied sharply in the fourth quarter on expectations that more disciplined industry capacity growth should drive improved results. The stock benefited from mid-quarter news that Warren Buffett’s Berkshire Hathaway had accumulated shares in the company. Better than expected traffic numbers coupled with management’s raised guidance for fourth quarter revenue growth propelled the stock higher. Restrained capacity growth and improved traffic also benefited our position in Alaska Air Group.
§ Financials
§ Shares of Morgan Stanley, TD Ameritrade Holding, and State Street traded higher along with the broader financials sector during the fourth quarter. In addition to tailwinds from higher interest rates, FICC (Fixed Income, Currencies, and Commodities) activity—a key profit driver for the brokerages—continued to improve. Following the election, asset managers rallied based on expectations that the Department of Justice’s fiduciary rule could be rolled back under the incoming administration.
DETRACTORS § Information Technology
§ While Facebook reported another strong and better than consensus quarter, the stock traded lower on comments from management that 2017 would be a year of aggressive investment for the company. Also, like many internet-related names, the stock has lagged since the election as investors rotated into other segments of the market deemed to see the greatest benefits from potential policy changes.
§ Consumer Discretionary
§ Shares of Amazon.com traded lower following its latest quarterly report, as gross profits and management guidance came in lower than expected. Investors reacted negatively to higher year-over-year costs related to the build-out of its third-party distribution business. However, these non-recurring expenses are supported by the fact that growth is accelerating at Amazon’s fulfillment business, where margins are much higher than in its base retail operations. Margins for Amazon Web Services, which continues to grow at an impressive rate, also recently reached all-time highs.
§ Priceline reported another quarter of solid results, with strong growth across all geographies and channels. Key metrics, including bookings growth, gross profits, and earnings all came in ahead of consensus expectations and previous guidance. Despite the company’s healthy fundamentals the stock was roughly flat for the quarter after it sold-off along with other internet-related names as investors rotated into cyclicals and interest-rate sensitive stocks following the election.
The specific securities identified and described do not represent all of the securities purchased, sold, or recommended for clients in the portfolio and no assumptions should be made that the securities identified and discussed were or will be profitable.

30 T. ROWE PRICE
Footnote Nimbus Sans Novus Condensed 10/10
ATTRIBUTION ANALYSISLA Dept of Water and Power Employees Retirement Plan - LCG vs. Russell 1000 Growth Index1 Year Ended 31 December 2016Figures Shown in U.S. Dollar
Total Value Added
Value Added FromSector Weight
Value Added FromStock Selection
N
Numbers may not add to 100% due to rounding; all numbers are percentages.Note: Analysis represents the equity-only performance of the portfolio as calculated by the Wilshire Atlas attribution model and is exclusive of cash, trusts, mutual funds, delisted securities, and other non-equity holdings. Returns will not match official T. Rowe Price performance because Wilshire uses different pricing and exchange rate sources and does not capture intraday trading or fair-value pricing.Performance for each security is obtained in the local currency and, if necessary, is converted using an exchange rate determined by an independent third party. Source: Wilshire Atlas, MSCI/S&P Global Industry Classification Standard (GICS) sectors; Analysis by T. Rowe Price Associates, Inc. T. Rowe Price uses the MSCI/S&P GICS for sector and industry reporting.Each year, MSCI and S&P make changes to the GICS structure. The last change occurred on 31 August 2016. T. Rowe Price will adhere to all future updates to GICS for prospective reporting. Figures areshown gross of fees. Past performance cannot guarantee future results.
BY SECTOR (TOP AND BOTTOM FIVE BY TOTAL VALUE ADDED)
Total FinancialsReal Estate
Industrials &Bus Svcs
Consumer Disc
Consumer Staples Materials Utilities Energy
Telecom Svcs
Information Technology
Health Care
Over (Under) Weight -- 5.82 -2.05 -1.13 4.86 -7.64 -2.75 -0.03 -0.63 -0.20 0.49 3.26
Portfolio Weight (Ending) 100.00 8.71 0.61 9.93 25.59 1.82 0.86 0.00 0.00 1.06 32.07 19.36
Index Weight (Ending) 100.00 2.88 2.66 11.06 20.73 9.46 3.61 0.03 0.63 1.26 31.57 16.10
Portfolio Performance 5.20 26.95 7.00 24.26 6.59 15.27 32.70 0.00 0.00 47.01 5.75 -9.94
Index Performance 7.07 14.26 -6.66 15.66 6.19 3.79 11.14 17.97 22.97 23.46 11.17 -6.80
Footnote Nimbus Sans Novus Condensed 10/10
ATTRIBUTION ANALYSIS (USD)Los Angeles Department of Water and Power Employees' Retirement Plan vs. Russell 1000 Growth IndexOne Year Ended 31 December 2016
Past performance cannot guarantee future results. Numbers may not add to 100% due to rounding; all numbers are percentages. Analysis represents the equity-only performance of the portfolio as calculated by the Wilshire Atlas attribution model and is exclusive of cash, trusts, mutual funds, delisted securities, and other non-equity holdings. Returns will not match offi cial T. Rowe Price performance because Wilshire uses diff erent pricing and exchange rate sources and does not capture intraday trading or fair-value pricing. Performance for each security is obtained in the local currency and, if necessary, is converted using an exchange rate determined by an independent third party.Source: Wilshire Atlas, MSCI/S&P Global Industry Classifi cation Standard (GICS) sectors; analysis by T. Rowe Price Associates, Inc. T. Rowe Price uses the MSCI/S&P GICS for sector and industry reporting. Each year, MSCI and S&P review the GICS structure. The last change occurred on 31 August 2016. T. Rowe Price will adhere to all future updates to GICS for prospective reporting.Figures are shown gross of fees.Russell Investment Group is the source and owner of the trademarks, service marks, and copyrights related to the Russell indexes. Russell® is a trademark of Russell Investment Group.

31T. ROWE PRICE
KEY ONE YEAR PERFORMANCE DRIVERSOne Year Ended 31 December 2016
CONTRIBUTORS § Financials
§ Shares of global investment bank Morgan Stanley rose sharply in the second half of the year along with the broader financials sector. The outcome of the U.S. presidential election led to a more favorable outlook for financials in light of expectations for reduced regulations, lower corporate taxes, and rising interest rates and inflation. Fundamentals have also improved, with a strong recovery in FICC (Fixed Income, Currencies, and Commodities) activity signaling that the underlying business has found its footing. Our position in TD Ameritrade Holding also benefited from the aforementioned tailwinds in the sector.
§ Consumer Discretionary
§ Despite a broader slowdown in travel trends, Priceline continued to deliver strong bookings growth by taking market share from its competition. The company’s international expansion and its move into non-hotel properties also present attractive opportunities for continued long term growth.
§ Shares of MGM Resorts International rose on reports that gambling traffic in Macau is beginning to recover after a significant slowdown in 2015. In our view, the firm is also well positioned to benefit from a deleveraging of its balance sheet via the formation of MGM Growth Properties, a real estate investment trust (REIT) designed to invest in various properties.
DETRACTORS § Health Care
§ Alexion Pharmaceuticals issued softer than expected guidance in the first quarter and later announced disappointing results from a phase III clinical trial that led to a sharp decline in the second quarter. The stock saw further volatility late in the year after delaying the filing of its quarterly financial statements and removing the CEO and CFO. Its financials have since been filed, without issue, and a new management team has been brought on board.
§ Shares of Allergan declined early on in the year when its proposed merger with Pfizer was called off after the U.S. Treasury Department issued a notice aimed at curbing the benefits of tax inversions. While we still maintain a constructive view, we subsequently trimmed our position and continue to monitor competitive pressures on the company’s dominant eye care business.
§ Information Technology
§ LinkedIn provided disappointing 2016 guidance early in the year that sent shares sharply lower. While we thought that LinkedIn’s core Talent Solutions business was a high quality asset, we had a few areas of concern including the company’s acquisition strategy, the size of its addressable market, and the impact that its planned investments would have on cash flows. We eliminated the stock in the first quarter and had begun to unwind our position before Microsoft’s takeover announcement.
§ Our overweight exposure to salesforce.com detracted from relative returns in the latter half of 2016, largely in response to a lack of clarity surrounding the company’s acquisition strategy. Sentiment further weighed on the stock following its failed pursuit of acquiring LinkedIn, rumors of the CEO’s interest in acquiring Twitter, and a leaked presentation highlighting numerous potential acquisition targets.
The specific securities identified and described do not represent all of the securities purchased, sold, or recommended for clients in the portfolio and no assumptions should be made that the securities identified and discussed were or will be profitable.

32T. ROWE PRICE
Past performance cannot guarantee future results. Each point represents the performance of the portfolio and its benchmark for a three-year annualized period. Points above the diagonal represent outperformance relative to the benchmark. Points below the diagonal represent relative underperformance. Figures shown gross of fees. Returns would have been lower as the result of the deduction of applicable fees.
TOTAL RETURN PERFORMANCEThree-Year Rolling Returns (Annualized Net of Fees)— Los Angeles Department of Water and Power Employees' Retirement Plan vs. Russell 1000 Growth IndexCalculated Quarterly from 30 June 20101 to 31 December 2016Figures are Calculated in U.S. Dollars
Percent
Portfolio Outperformance
Portfolio Underperformance
Los
Ang
eles
Dep
artm
ent o
f Wat
er
and
Pow
er E
mpl
oyee
s’ R
etire
men
t Pla
nRussell 1000 Growth Index
-40 -30 -20 -10
0
10 20 30 40
-40
-30
-20
-10
0
10
20
30
40
5334
1 Client inception date 16 April 2010.
Russell Investment Group is the source and owner of the trademarks, service marks, and copyrights related to the Russell indexes. Russell® is a trademark of Russell Investment Group.
Past performance cannot guarantee future results. Each point represents the performance of the portfolio and its benchmark for a three-year annualized period. Points above the diagonal represent outperformance relative to the benchmark. Points below the diagonal represent relative underperformance. Figures shown gross of fees. Returns would have been lower as the result of the deduction of applicable fees.

33T. ROWE PRICE
Past performance cannot guarantee future results. This information demonstrates, in part, the fi rm’s Risk/Return analysis. This material is provided for informational purposes only and is not intended to be investment advice or a recommendation to take any particular investment action.Statistics based on monthly gross returns. Returns would have been lower as the result of the deduction of applicable fees.Supplemental information.
1 30 April 2010. Actual client inception date is 16 April 2010.
TOTAL RETURN PERFORMANCERisk/Return CharacteristicsSince Inception1 Through 31 December 2016Figures are Calculated in U.S. Dollars
Since Inception1
Los Angeles Department of Water
and Power Employees' Retirement Plan
Russell 1000 Growth Index
Annualized Total Return 13.70% 12.76%
Annualized Standard Deviation 15.38% 13.07%
Historical Tracking Error 4.78% 0.00%
Beta 1.13 1.00
R-Squared 0.92 1.00
Alpha -0.45% 0.00%
Sharpe Ratio 0.88 0.96
Information Ratio 0.20 0.00
Russell 1000Growth Index
Los Angeles Department of Water and Power Employees’ Retirement Plan
Average Annual Standard Deviation (%)
Aver
age
Annu
al R
etur
n (%
)
The bottom axis will move whenthe graph is updated. You must realign to the guide. Sorry :(
The square around the graph is artwork
DO NOT ADJUST.
8 15 2210
13
16
r1000 Growth Index
LCGC
Russell Investment Group is the source and owner of the trademarks, service marks, and copyrights related to the Russell indexes. Russell® is a trademark of Russell Investment Group.
Past performance cannot guarantee future results.

34T. ROWE PRICE
PORTFOLIO REVIEW AND CHARACTERISTICS

35T. ROWE PRICE
Footnote Nimbus Sans Novus Condensed 10/10
1 Source: IBES. The specifi c securities identifi ed and described do not represent all of the securities purchased, sold, or recommended for the portfolio, and no assumptions should be made that the securities identifi ed
and discussed were or will be profi table. The information shown does not refl ect any exchange-traded funds that may be held in the portfolio. Numbers may not total due to rounding. Statistics are investment-weighted median unless otherwise noted.
PORTFOLIO SNAPSHOTAs of 31 December 2016
SECTOR WEIGHTINGS
-15
0
15
30
45dif
Rus
LADWP
UtilitiesTelecomSvcs
Real Estate
MaterialsInfoTech
Indust &Bus Svcs
HealthCare
FinancialsEnergyConsumStpls
ConsumDisc
Percent
Russell 1000 Growth IndexOver/Underweighting
Los Angeles Department of Water and Power Employees’ Retirement Plan
Los Angeles Department of Water andPower Employees' Retirement Plan Russell 1000 Growth Index
Projected Earnings Growth Rate1 15.7% 10.8%
Price to Earnings (12 Months Forward)1 21.3X 20.0X
Investment-Weighted Average Market Capitalization (Millions USD) 155,198 154,034
Number of Holdings 65 595
20 Largest Holdings 62.7% 37.7%
Portfolio Turnover (Last 12 Months) 40.1% N/A
Active Share 68.1% N/A
Company % of Portfolio
Amazon.com 8.5%
Alphabet 6.7
Priceline 5.2
Facebook 4.9
Visa 3.9
Microsoft 3.9
Qualcomm 3.1
Boeing 2.8
Morgan Stanley 2.7
UnitedHealth Group 2.5
Total 44.2%
TOP 10 HOLDINGS
PORTFOLIO CHARACTERISTICS
Russell Investment Group is the source and owner of the trademarks, service marks, and copyrights related to the Russell indexes. Russell® is a trademark of Russell Investment Group.
Active Share is a holdings-based measure of active management representing the percentage of a portfolio’s holdings that diff er from those in its benchmark. Compared with tracking error, which measures the standard deviation of the diff erence in a manager’s returns versus the index returns, Active Share allows investors to get a clearer understanding of what a manager is doing to drive performance, rather than drawing conclusions from observed returns. The greater the diff erence between the asset composition of a product and its benchmark, the greater the active share is.
T. Rowe Price uses the MSCI/S&P Global Industry Classifi cation Standard (GICS) for sector and industry reporting. Each year, MSCI and S&P review the GICS structure. The last change occurred on31 August 2016. T. Rowe Price will adhere to all future updates to GICS for prospective reporting.
1 Source: IBES. The specifi c securities identifi ed and described do not represent all of the securities purchased, sold, or recommended for the portfolio, and no assumptions should be made that the securities identifi ed
and discussed were or will be profi table. The information shown does not refl ect any exchange-traded funds that may be held in the portfolio. Numbers may not total due to rounding. Statistics are investment-weighted median unless otherwise noted.

36T. ROWE PRICE
Business Description sourced from Thomson Reuters Worldscope Fundamentals, Copyright©, Thomson Reuters, 1999–2017. All Rights Reserved.The specifi c securities identifi ed and described do not represent all of the securities purchased, sold, or recommended for the portfolio, and no assumptions should be made that the securities identifi ed and discussed were or will be profi table.The information shown does not refl ect any exchange-traded funds that may be held in the portfolio.Numbers may not total due to rounding.
SA_CLIENT_TOPTEN Sep Accts with Client Performance Top Ten Holdings – Not Mutual Fund data
After updating please save EPS in: Groups/KitBP/TRP_Mtg Kits/TRP_ExbTRPGen/_EPS Footnotes as: SA_Client_TopTen
10 LARGEST OVER/UNDERWEIGHTSLos Angeles Department of Water and Power Employees' Retirement Plan Relative to the Russell 1000 Growth IndexAs of 31 December 2016
10 Largest Overweights % of Portfolio
% of Index Difference
Amazon.com 8.5% 2.8% 5.7%
Priceline 5.2 0.7 4.6
Qualcomm 3.1 0.2 2.9
Morgan Stanley 2.7 0.0 2.7
Facebook 4.9 2.5 2.5
Visa 3.9 1.4 2.5
Alphabet 6.7 4.4 2.3
American Airlines 2.2 0.0 2.2
MGM Resorts International 2.1 0.0 2.1
Danaher 2.1 0.1 2.0
10 Largest Underweights % of Portfolio
% of Index Difference
Apple 1.1% 5.5% -4.4%
Walt Disney 0.0 1.6 -1.6
Comcast 0.0 1.5 -1.5
Altria Group 0.0 1.3 -1.3
PepsiCo 0.0 1.2 -1.2
Coca-Cola 0.0 1.1 -1.1
Amgen 0.0 1.0 -1.0
Verizon Communications 0.0 1.0 -1.0
3M 0.0 1.0 -1.0
AbbVie 0.0 1.0 -1.0
Russell Investment Group is the source and owner of the trademarks, service marks, and copyrights related to the Russell indexes. Russell® is a trademark of Russell Investment Group.

37T. ROWE PRICE
RECENT PORTFOLIO CHANGESLos Angeles Department of Water and Power Employees' Retirement Plan Three Months Ended 31 December 2016
Major Purchases% of
Portfolio Business DescriptionHome Depot1 0.9% Home Depot is a home improvement retailer.
Red Hat1 0.8 Red Hat provides open source software solutions, using a community-powered approach to develop and offer operating system, virtualization, management, middleware, cloud, mobile and storage technologies.
Microsoft 3.9 Microsoft is a technology company. The Company develops, licenses, and supports a range of software products, services and devices.
Crown Castle International1 0.6 Crown Castle International is a real estate investment trust.Phlip Morris International 1.1 Philip Morris International is a holding company engaged in the manufacture and sale of cigarettes, other tobacco products
and other nicotine-containing products in markets outside of the United States.
Major Sales% of
Portfolio Business DescriptionLowe's 0.4% Lowe's is a home improvement retailer. Danaher 2.1 Danaher designs, manufactures and markets professional, medical, industrial and commercial products and services.Hanesbrands2 0.0 Hanesbrands is a marketer of basic innerwear and activewear apparel in the Americas, Europe, Australia and Asia/Pacific
under apparel brands, such as Hanes, Champion, Maidenform, DIM, Bali, Playtex, Bonds, JMS/Just My Size, Nur Die/Nur Der, L'eggs, Lovable, Wonderbra, Flexees, Gear for Sports and Berlei.
Juniper Networks2 0.0 Juniper Networks designs, develops and sells products and services for high-performance networks to enable customers to build networks for their businesses.
Tractor Supply 0.8 Tractor Supply is an operator of rural lifestyle retail stores in the United States.
Business Description sourced from Thomson Reuters Worldscope Fundamentals, Copyright©, Thomson Reuters, 1999–2017. All Rights Reserved.The specifi c securities identifi ed and described do not represent all of the securities purchased, sold, or recommended for the portfolio, and no assumptions should be made that the securities identifi ed and discussed were or will be profi table.The information shown does not refl ect any exchange-traded funds that may be held in the portfolio.Numbers may not total due to rounding.
SA_CLIENT_TOPTEN Sep Accts with Client Performance Top Ten Holdings – Not Mutual Fund data
After updating please save EPS in: Groups/KitBP/TRP_Mtg Kits/TRP_ExbTRPGen/_EPS Footnotes as: SA_Client_TopTen
1 New Holding. 2 Eliminated.

38 T. ROWE PRICE
PORTFOLIO BY MARKET CAPITALIZATIONLos Angeles Department of Water and Power Employees' Retirement Plan As of 31 December 2016
0–10 Billion USD 2%
10–25 Billion USD 20%
25–50 Billion USD 21%
50+ Billion USD 57%
CenteneTractor Supply
Alaska Air GroupAmerican AirlinesCitizens FinancialDollar GeneralFirst Republic BankFortiveHilton Worldwide HoldingsIlluminaIncyteIntuitive SurgicalMGM Resorts InternationalPalo Alto NetworksRed HatServiceNowTD Ameritrade HoldingTextronVertex PharmaceuticalsVulcan MaterialsWorkdayYum! Brands
AetnaAlexion PharmaceuticalsAnthemCignaCME GroupCrown Castle InternationalFedExHumanaIntercontinental ExchangeIntuitO'Reilly AutomotivePayPal HoldingsRoss StoresSalesforce.comState StreetStrykerTeslaT-Mobile US
AlphabetAmazon.comAppleBiogenBoeingBristol-Myers SquibbCelgeneCostco WholesaleDanaherFacebookHome DepotLowe'sMerckMicrosoftMorgan StanleyNetflixNVIDIAPhilip Morris InternationalPricelineQualcommStarbucksUnitedHealth GroupVisa
Business Description sourced from Thomson Reuters Worldscope Fundamentals, Copyright©, Thomson Reuters, 1999–2017. All Rights Reserved.The specifi c securities identifi ed and described do not represent all of the securities purchased, sold, or recommended for the portfolio, and no assumptions should be made that the securities identifi ed and discussed were or will be profi table.The information shown does not refl ect any exchange-traded funds that may be held in the portfolio.Numbers may not total due to rounding.
SA_CLIENT_TOPTEN Sep Accts with Client Performance Top Ten Holdings – Not Mutual Fund data
After updating please save EPS in: Groups/KitBP/TRP_Mtg Kits/TRP_ExbTRPGen/_EPS Footnotes as: SA_Client_TopTen
The securities mentioned above represent 100% of the publicly traded common equity securities held by the portfolio.

39T. ROWE PRICE
MARKET CAPITALIZATION RANGELos Angeles Department of Water and Power Employees' Retirement Plan As of 31 December 2016
0
12
24
36
48
60
Russell 1000 Growth
4950
50+25–5010–250–10
Percent
Russell 1000 Growth IndexLos Angeles Department of Water and Power Employees’ Retirement Plan
Billions USD
Russell Investment Group is the source and owner of the trademarks, service marks, and copyrights related to the Russell indexes. Russell® is a trademark of Russell Investment Group.

40T. ROWE PRICE
FULL PORTFOLIO HOLDINGSLos Angeles Department of Water and Power Employees' Retirement Plan As of 31 December 2016
Rounding may cause figures to vary from 100.00%.
As of December 31, 2016Portfolio Holdings
Security Name %Assets+Accrd
CONSUMER DISCRETIONARY 25.24 %
Automobiles 1.40 %
TSLA Tesla 1.40
Hotels Restaurants & Leisure 4.34 %
HGV Hilton Grand Vacations 0.09
MGM MGM Resorts International 2.13
SBUX Starbucks 0.67
TC551OBB Hilton Worldwide Holdings 1.04
YUM Yum! Brands 0.42
Internet & Direct Marketing Retail 14.72 %
AMZN Amazon.com 8.48
NFLX Netflix 0.99
PCLN Priceline 5.25
Multiline Retail 1.30 %
DG Dollar General 1.30
Specialty Retail 3.48 %
Security Name %Assets+Accrd
HD Home Depot 0.93
LOW Lowe's 0.39
ORLY O'Reilly Automotive 0.57
ROST Ross Stores 0.76
TSCO Tractor Supply 0.82
CONSUMER STAPLES 1.78 %
Food & Staples Retailing 0.69 %
COST Costco Wholesale 0.69
Tobacco 1.09 %
PM Philip Morris International 1.09
FINANCIALS 8.51 %
Banks 0.67 %
CFG Citizens Financial 0.48
FRC First Republic Bank 0.20
Capital Markets 7.84 %
AMTD TD Ameritrade Holding 1.56
Rounding may cause figures to vary from 100.00%.

41T. ROWE PRICE
FULL PORTFOLIO HOLDINGSLos Angeles Department of Water and Power Employees' Retirement Plan As of 31 December 2016
Rounding may cause figures to vary from 100.00%.
As of December 31, 2016Portfolio Holdings
Security Name %Assets+Accrd
CME CME Group 0.71
ICE Intercontinental Exchange 1.47
MS Morgan Stanley 2.71
STT State Street 1.38
HEALTH CARE 18.92 %
Biotechnology 4.81 %
ALXN Alexion Pharmaceuticals 1.53
BIIB Biogen 1.15
CELG Celgene 0.91
INCY Incyte 0.27
VRTX Vertex Pharmaceuticals 0.95
Health Care Equipment & Supplies 5.36 %
DHR Danaher 2.08
ISRG Intuitive Surgical 2.06
SYK Stryker 1.22
Health Care Providers & Services 6.95 %
AET Aetna 1.02
ANTM Anthem 0.52
Security Name %Assets+Accrd
CI Cigna 0.82
CNC Centene 0.70
HUM Humana 1.42
UNH UnitedHealth Group 2.47
Life Sciences Tools & Services 0.23 %
ILMN Illumina 0.23
Pharmaceuticals 1.57 %
BMY Bristol-Myers Squibb 1.03
MRK Merck 0.54
INDUSTRIALS & BUSINESS SERVICES 9.71 %
Aerospace & Defense 3.37 %
BA Boeing 2.80
TXT Textron 0.57
Air Freight & Logistics 1.29 %
FDX FedEx 1.29
Airlines 4.11 %
Rounding may cause figures to vary from 100.00%.

42 T. ROWE PRICE
FULL PORTFOLIO HOLDINGSLos Angeles Department of Water and Power Employees' Retirement Plan As of 31 December 2016
Rounding may cause figures to vary from 100.00%.
As of December 31, 2016Portfolio Holdings
Security Name %Assets+Accrd
AAL American Airlines 2.16
ALK Alaska Air Group 1.95
Machinery 0.94 %
FTV Fortive 0.94
INFORMATION TECHNOLOGY 31.34 %
Communications Equipment 0.26 %
PANW Palo Alto Networks 0.26
Internet Software & Services 11.66 %
FB Facebook 4.95
GOOG Alphabet Class C 2.44
GOOGL Alphabet Class A 4.27
It Services 5.99 %
PYPL PayPal Holdings 2.10
V Visa 3.90
Semiconductors & Semiconductor Equipment 3.62 %
NVDA NVIDIA 0.55
Security Name %Assets+Accrd
QCOM Qualcomm 3.07
Software 8.73 %
CRM Salesforce.com 1.48
INTU Intuit 0.87
MSFT Microsoft 3.89
NOW ServiceNow 1.16
RHT Red Hat 0.80
WDAY Workday 0.53
Technology Hardware, Storage & Peripherals 1.08 %
AAPL Apple 1.08
MATERIALS 0.84 %
Construction Materials 0.84 %
VMC Vulcan Materials 0.84
OTHER RESERVES 1.76 %
Cash 0.04 %
U S Dollars 0.04
Short Term Obligations 1.71 %
Rounding may cause figures to vary from 100.00%.

43T. ROWE PRICE
FULL PORTFOLIO HOLDINGSLos Angeles Department of Water and Power Employees' Retirement Plan As of 31 December 2016
Rounding may cause figures to vary from 100.00%.
As of December 31, 2016Portfolio Holdings
Security Name %Assets+Accrd
TC1E44MI COLLECTIVE STIF 1.71
REAL ESTATE 0.88 %
Equity Real Estate Investment Trusts (reits) 0.88 %
CCI Crown Castle International 0.59
PK Park Hotels & Resorts 0.29
TELECOMMUNICATION SERVICES 1.03 %
Wireless Telecommunication Services 1.03 %
TMUS T-Mobile US 1.03
Total Mkt Val+Accrd (USD): 472,125,269.21
Rounding may cause figures to vary from 100.00%.

44 T. ROWE PRICE
FULL PORTFOLIO HOLDINGSLos Angeles Department of Water and Power Health Benefits Plan As of 31 December 2016
As of December 31, 2016Portfolio Holdings
Security Name %Assets+Accrd
CONSUMER DISCRETIONARY 25.35 %
Automobiles 1.42 %
TSLA Tesla 1.42
Hotels Restaurants & Leisure 4.37 %
HGV Hilton Grand Vacations 0.09
MGM MGM Resorts International 2.13
SBUX Starbucks 0.67
TC551OBB Hilton Worldwide Holdings 1.07
YUM Yum! Brands 0.41
Internet & Direct Marketing Retail 14.75 %
AMZN Amazon.com 8.49
NFLX Netflix 0.98
PCLN Priceline 5.28
Multiline Retail 1.30 %
DG Dollar General 1.30
Specialty Retail 3.52 %
Security Name %Assets+Accrd
HD Home Depot 0.93
LOW Lowe's 0.39
ORLY O'Reilly Automotive 0.58
ROST Ross Stores 0.80
TSCO Tractor Supply 0.82
CONSUMER STAPLES 1.78 %
Food & Staples Retailing 0.68 %
COST Costco Wholesale 0.68
Tobacco 1.09 %
PM Philip Morris International 1.09
FINANCIALS 8.44 %
Banks 0.67 %
CFG Citizens Financial 0.48
FRC First Republic Bank 0.19
Capital Markets 7.77 %
AMTD TD Ameritrade Holding 1.52
Rounding may cause figures to vary from 100.00%.
Rounding may cause figures to vary from 100.00%.

45T. ROWE PRICE
FULL PORTFOLIO HOLDINGSLos Angeles Department of Water and Power Health Benefits Plan As of 31 December 2016 As of December 31, 2016
Portfolio Holdings
Security Name %Assets+Accrd
CME CME Group 0.70
ICE Intercontinental Exchange 1.47
MS Morgan Stanley 2.69
STT State Street 1.39
HEALTH CARE 18.86 %
Biotechnology 4.76 %
ALXN Alexion Pharmaceuticals 1.53
BIIB Biogen 1.15
CELG Celgene 0.89
INCY Incyte 0.26
VRTX Vertex Pharmaceuticals 0.93
Health Care Equipment & Supplies 5.35 %
DHR Danaher 2.09
ISRG Intuitive Surgical 2.05
SYK Stryker 1.21
Health Care Providers & Services 6.94 %
AET Aetna 1.01
ANTM Anthem 0.52
Security Name %Assets+Accrd
CI Cigna 0.82
CNC Centene 0.70
HUM Humana 1.42
UNH UnitedHealth Group 2.46
Life Sciences Tools & Services 0.24 %
ILMN Illumina 0.24
Pharmaceuticals 1.58 %
BMY Bristol-Myers Squibb 1.04
MRK Merck 0.55
INDUSTRIALS & BUSINESS SERVICES 9.63 %
Aerospace & Defense 3.37 %
BA Boeing 2.80
TXT Textron 0.57
Air Freight & Logistics 1.29 %
FDX FedEx 1.29
Airlines 4.04 %
Rounding may cause figures to vary from 100.00%.
Rounding may cause figures to vary from 100.00%.

46 T. ROWE PRICE
FULL PORTFOLIO HOLDINGSLos Angeles Department of Water and Power Health Benefits Plan As of 31 December 2016 As of December 31, 2016
Portfolio Holdings
Security Name %Assets+Accrd
AAL American Airlines 2.16
ALK Alaska Air Group 1.88
Machinery 0.93 %
FTV Fortive 0.93
INFORMATION TECHNOLOGY 31.35 %
Communications Equipment 0.26 %
PANW Palo Alto Networks 0.26
Internet Software & Services 11.62 %
FB Facebook 4.94
GOOG Alphabet Class C 2.43
GOOGL Alphabet Class A 4.26
It Services 5.98 %
PYPL PayPal Holdings 2.10
V Visa 3.89
Semiconductors & Semiconductor Equipment 3.60 %
NVDA NVIDIA 0.54
Security Name %Assets+Accrd
QCOM Qualcomm 3.06
Software 8.76 %
CRM Salesforce.com 1.52
INTU Intuit 0.86
MSFT Microsoft 3.89
NOW ServiceNow 1.16
RHT Red Hat 0.80
WDAY Workday 0.53
Technology Hardware, Storage & Peripherals 1.12 %
AAPL Apple 1.12
MATERIALS 0.83 %
Construction Materials 0.83 %
VMC Vulcan Materials 0.83
OTHER RESERVES 1.82 %
Cash 0.04 %
U S Dollars 0.04
Short Term Obligations 1.78 %
Rounding may cause figures to vary from 100.00%.
Rounding may cause figures to vary from 100.00%.

47T. ROWE PRICE
FULL PORTFOLIO HOLDINGSLos Angeles Department of Water and Power Health Benefits Plan As of 31 December 2016
Rounding may cause figures to vary from 100.00%.
As of December 31, 2016Portfolio Holdings
Security Name %Assets+Accrd
TC1E44MI COLLECTIVE STIF 1.78
REAL ESTATE 0.89 %
Equity Real Estate Investment Trusts (reits) 0.89 %
CCI Crown Castle International 0.59
PK Park Hotels & Resorts 0.30
TELECOMMUNICATION SERVICES 1.04 %
Wireless Telecommunication Services 1.04 %
TMUS T-Mobile US 1.04
Total Mkt Val+Accrd (USD): 79,476,701.76
Rounding may cause figures to vary from 100.00%.

48T. ROWE PRICE
FEE SCHEDULE
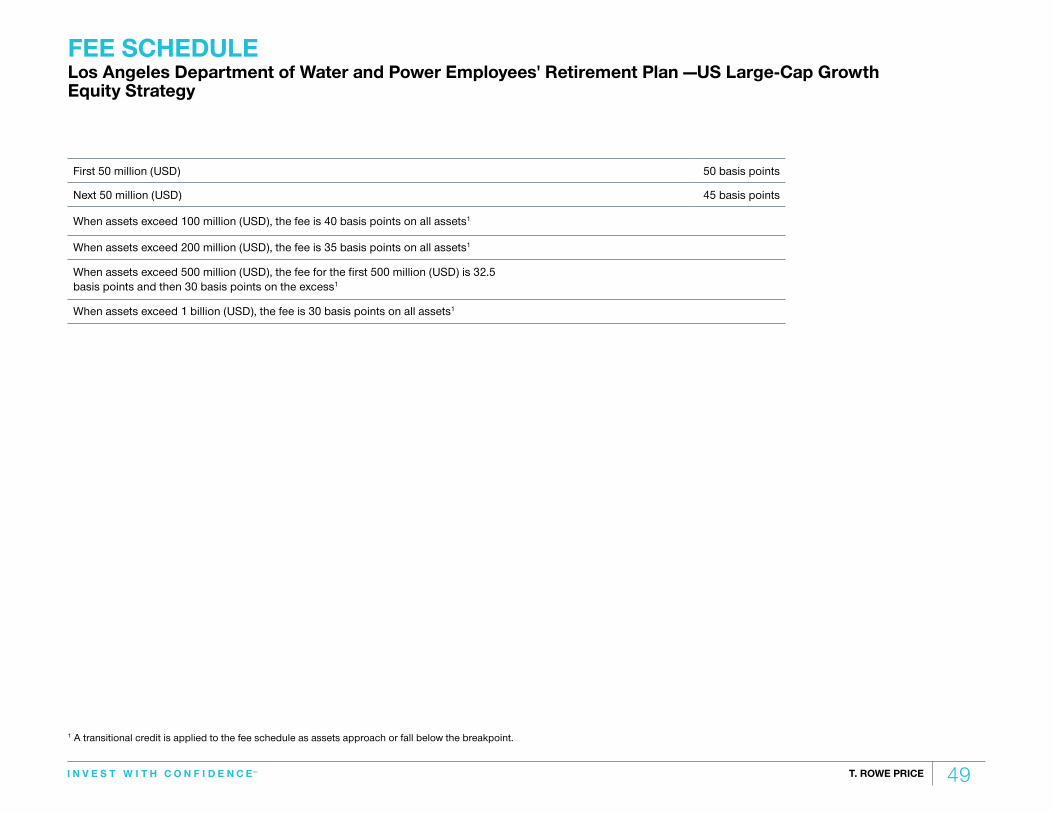
49T. ROWE PRICE
Footnote Nimbus Sans Novus Condensed 10/10
FEE SCHEDULELos Angeles Department of Water and Power Employees' Retirement Plan —US Large-Cap Growth Equity Strategy
First 50 million (USD) 50 basis points
Next 50 million (USD) 45 basis points
When assets exceed 100 million (USD), the fee is 40 basis points on all assets1
When assets exceed 200 million (USD), the fee is 35 basis points on all assets1
When assets exceed 500 million (USD), the fee for the first 500 million (USD) is 32.5 basis points and then 30 basis points on the excess1
When assets exceed 1 billion (USD), the fee is 30 basis points on all assets1
1 A transitional credit is applied to the fee schedule as assets approach or fall below the breakpoint.

50T. ROWE PRICE
FEE SCHEDULEUS Large-Cap Growth Equity CompositeAs of 31 December 2016
The US Large-Cap Growth Equity Composite seeks long-term capital appreciation by investing primarily in common stocks of large-cap growth companies based in the U.S. (Created June 2006)
First 50 million (USD) 50 basis points
Next 50 million (USD) 45 basis points
Above 100 million (USD) 40 basis points on all assets1
Above 200 million (USD) 35 basis points on all assets1
Minimum separate account size 50 million (USD)
1 A transitional credit is applied to the fee schedule as assets approach or fall below the breakpoint.

51T. ROWE PRICE
ADDITIONAL INFORMATION ANDDISCLOSURES

52T. ROWE PRICE
Russell Investment Group is the source and owner of the trademarks, service marks, and copyrights related to the Russell indexes. Russell® is a trademark of Russell Investment Group.
Past performance cannot guarantee future results.1 Net-of-fees performance refl ects the deduction of the highest applicable management fee (Model Net Fee) that would be charged based on the fee schedule appropriate to you for this mandate, without the benefi t of breakpoints. Please be advised that the composite may include other investment products that are subject to management fees that are inapplicable to you but are in excess of the Model Net Fee. Therefore, the actual performance of all the portfolios in the composite on a net-fee basis will be diff erent and may be lower than the Model Net Fee performance. However, such Model Net Fee performance is intended to provide the most appropriate example of the impact management fees would have by applying management fees relevant to you to the gross performance of the composite.
Supplemental information. Please see the GIPS® Disclosure page for additional information on the composite. Monthly composite performance is available upon request.
14T. ROWE PRICE
2 The value added is shown as US Large-Cap Growth Equity Composite (Gross of Fees) minus Russell 1000 Growth Index.
Calendar Years 2007 2008 2009 2010 2011 2012 2013 2014 2015 2016US Large-Cap Growth Equity Composite (Gross of Fees) 9.41% -40.39% 54.28% 16.77% -1.19% 18.51% 45.31% 9.26% 10.74% 3.41%
US Large-Cap Growth Equity Composite (Net of Fees)1 8.87 -40.70 53.54 16.19 -1.68 17.93 44.61 8.72 10.19 2.90
Russell 1000 Growth Index 11.81 -38.44 37.21 16.71 2.64 15.26 33.48 13.05 5.67 7.08
Value Added (Gross of Fees)2 -2.40 -1.95 17.07 0.06 -3.83 3.25 11.83 -3.79 5.07 -3.67
TOTAL RETURN PERFORMANCEUS Large-Cap Growth Equity CompositePeriods Ended 31 December 2016Figures are Calculated in U.S. Dollars
Annualized
ThreeMonths
OneYear
ThreeYears
FiveYears
SevenYears
TenYears
FifteenYears
US Large-Cap Growth Equity Composite (Gross of Fees) 1.90% 3.41% 7.76% 16.59% 13.89% 9.60% 8.47%
US Large-Cap Growth Equity Composite (Net of Fees)1 1.77 2.90 7.22 16.02 13.33 9.06 7.93
Russell 1000 Growth Index 1.01 7.08 8.55 14.50 13.03 8.33 6.42
Value Added (Gross of Fees)2 0.89 -3.67 -0.79 2.09 0.86 1.27 2.05
Russell Investment Group is the source and owner of the trademarks, service marks, and copyrights related to the Russell indexes. Russell® is a trademark of Russell Investment Group.
Past performance cannot guarantee future results.1 Net-of-fees performance refl ects the deduction of the highest applicable management fee (Model Net Fee) that would be charged based on the fee schedule appropriate to you for this mandate, without
the benefi t of breakpoints. Please be advised that the composite may include other investment products that are subject to management fees that are inapplicable to you but are in excess of the Model Net Fee. Therefore, the actual performance of all the portfolios in the composite on a net-fee basis will be diff erent and may be lower than the Model Net Fee performance. However, such Model Net Fee performance is intended to provide the most appropriate example of the impact management fees would have by applying management fees relevant to you to the gross performance of the composite.
Supplemental information. Please see the GIPS® Disclosure page for additional information on the composite. Monthly composite performance is available upon request.
Annualized
Three Months
One Year
Three Years
Five Years
Seven Years
Ten Years
Fifteen Years
US Large-Cap Growth Equity Composite (Gross of Fees) 1.90% 3.41% 7.76% 16.59% 13.89% 9.60% 8.47%
US Large-Cap Growth Equity Composite (Net of Fees)1 1.77 2.90 7.22 16.02 13.33 9.06 7.93
Russell 1000 Growth Index 1.01 7.08 8.55 14.50 13.03 8.33 6.42
Value Added (Net of Fees)2 0.76 -4.18 -1.33 1.52 0.30 0.73 1.51
Calendar Years 2007 2008 2009 2010 2011 2012 2013 2014 2015 2016US Large-Cap Growth Equity Composite (Gross of Fees) 9.41% -40.39% 54.28% 16.77% -1.19% 18.51% 45.31% 9.26% 10.74% 3.41%
US Large-Cap Growth Equity Composite (Net of Fees)1 8.87 -40.70 53.54 16.19 -1.68 17.93 44.61 8.72 10.19 2.90
Russell 1000 Growth Index 11.81 -38.44 37.21 16.71 2.64 15.26 33.48 13.05 5.67 7.08
Value Added (Net of Fees)2 -2.94 -2.26 16.33 -0.52 --4.32 2.67 11.13 -4.33 4.52 -4.18
2 The value added is shown as US Large-Cap Growth Equity Composite (Net of Fees) minus Russell 1000 Growth Index.
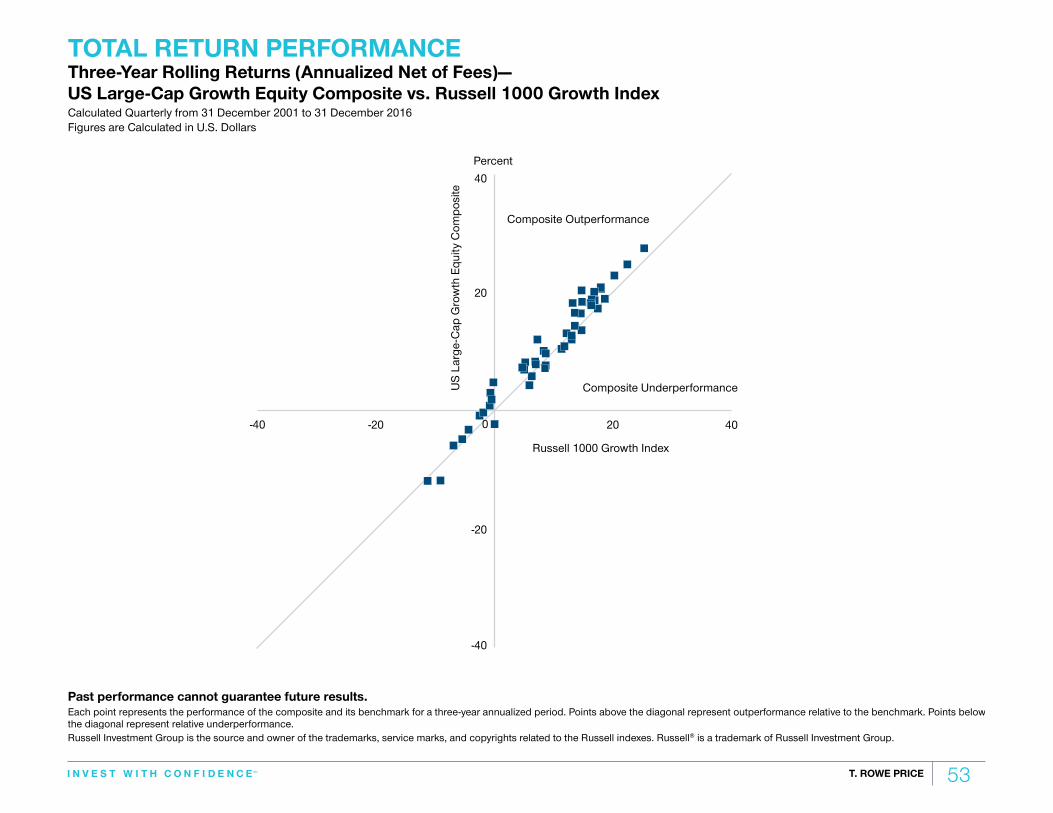
53T. ROWE PRICE
Percent
Composite Outperformance
Composite UnderperformanceUS
Larg
e-C
ap G
row
th E
quity
Com
posi
teRussell 1000 Growth Index
-40 -20
0
20 40
-40
-20
0
20
40
LCGC
TOTAL RETURN PERFORMANCEThree-Year Rolling Returns (Annualized Net of Fees)— US Large-Cap Growth Equity Composite vs. Russell 1000 Growth IndexCalculated Quarterly from 31 December 2001 to 31 December 2016 Figures are Calculated in U.S. Dollars
Past performance cannot guarantee future results. Each point represents the performance of the composite and its benchmark for a three-year annualized period. Points above the diagonal represent outperformance relative to the benchmark. Points below the diagonal represent relative underperformance. Figures shown gross of fees. Returns would have been lower as the result of the deduction of applicable fees.Supplemental information.Russell Investment Group is the source and owner of the trademarks, service marks, and copyrights related to the Russell indexes. Russell® is a trademark of Russell Investment Group.

54T. ROWE PRICE 22T. ROWE PRICE
ATTRIBUTION ANALYSIS (USD) US Large-Cap Growth Equity Representative Portfolio vs. Russell 1000 Growth IndexFive Years Ended 31 December 2016
The representative portfolio is an account in the composite we believe most closely refl ects current portfolio management style for the strategy. Performance is not a consideration in the selection of the representative portfolio. Information regarding the representative portfolio and, where applicable, the other accounts in the composite is available upon request. Please see the GIPS® Disclosure page for additional information on the composite.Supplemental information. Numbers may not add to 100% due to rounding; all numbers are percentages. Analysis represents the equity-only performance of the portfolio as calculated by the Wilshire Atlas attribution model and is exclusive of cash, trusts, mutual funds, delisted securities, and other non-equity holdings. Returns will not match offi cial T. Rowe Price performance because Wilshire uses diff erent pricing and exchange rate sources and does not capture intraday trading or fair-value pricing. Performance for each security is obtained in the local currency and, if necessary, is converted using an exchange rate determined by an independent third party.Source: Wilshire Atlas, MSCI/S&P Global Industry Classifi cation Standard (GICS) sectors; analysis by T. Rowe Price Associates, Inc. T. Rowe Price uses the MSCI/S&P GICS for sector and industry reporting. Each year, MSCI and S&P review the GICS structure. The last change occurred on 31 August 2016. T. Rowe Price will adhere to all future updates to GICS for prospective reporting.Figures are shown gross of fees.
Past performance cannot guarantee future results.
Russell Investment Group is the source and owner of the trademarks, service marks, and copyrights related to the Russell indexes. Russell® is a trademark of Russell Investment Group.

55T. ROWE PRICE 23T. ROWE PRICE
ATTRIBUTION ANALYSIS (USD)US Large-Cap Growth Equity Representative Portfolio vs. Russell 1000 Growth Index10 Years Ended 31 December 2016
The representative portfolio is an account in the composite we believe most closely refl ects current portfolio management style for the strategy. Performance is not a consideration in the selection of the representative portfolio. Information regarding the representative portfolio and, where applicable, the other accounts in the composite is available upon request. Please see the GIPS® Disclosure page for additional information on the composite.Supplemental information. Numbers may not add to 100% due to rounding; all numbers are percentages. Analysis represents the equity-only performance of the portfolio as calculated by the Wilshire Atlas attribution model and is exclusive of cash, trusts, mutual funds, delisted securities, and other non-equity holdings. Returns will not match offi cial T. Rowe Price performance because Wilshire uses diff erent pricing and exchange rate sources and does not capture intraday trading or fair-value pricing. Performance for each security is obtained in the local currency and, if necessary, is converted using an exchange rate determined by an independent third party.Source: Wilshire Atlas, MSCI/S&P Global Industry Classifi cation Standard (GICS) sectors; analysis by T. Rowe Price Associates, Inc. T. Rowe Price uses the MSCI/S&P GICS for sector and industry reporting. Each year, MSCI and S&P review the GICS structure. The last change occurred on 31 August 2016. T. Rowe Price will adhere to all future updates to GICS for prospective reporting.Figures are shown gross of fees.
Past performance cannot guarantee future results.
Russell Investment Group is the source and owner of the trademarks, service marks, and copyrights related to the Russell indexes. Russell® is a trademark of Russell Investment Group.

56T. ROWE PRICE
GIPS® DISCLOSURE
GIPS® DisclosureUS Large‐Cap Growth Equity CompositePeriod Ended December 31, 2016Figures Shown in U.S. dollar
2007 2008 2009 2010 2011 2012 2013 2014 2015 2016Gross Annual Returns (%) 9.41 ‐40.39 54.28 16.77 ‐1.19 18.51 45.31 9.26 10.74 3.41Net Annual Returns (%)1 8.87 ‐40.70 53.54 16.19 ‐1.68 17.93 44.61 8.72 10.19 2.90Russell 1000 Growth Index (%) 11.81 ‐38.44 37.21 16.71 2.64 15.26 33.48 13.05 5.67 7.08Composite 3‐Yr St. Dev. 9.45 18.26 22.12 24.88 20.11 18.52 15.15 12.41 12.13 12.99Russell 1000 Growth Index 3‐Yr St. Dev. 8.54 16.40 19.73 22.11 17.76 15.66 12.18 9.59 10.70 11.15Composite Dispersion 0.46 0.33 0.65 0.26 0.26 0.33 0.21 0.29 0.38 N/AComp. Assets (Millions) 13,390.4 7,690.5 9,411.7 12,924.7 13,123.1 18,460.5 26,449.4 30,270.4 32,684.2 28,132.8
# of Accts. in Comp. 48 45 42 45 46 51 52 60 67 56Total Firm Assets (Billions) 397.5 275.7 395.2 485.0 493.1 579.8 696.3 749.6 772.4 817.21Reflects deduction of highest applicable fee schedule without benefit of breakpoints. Investment return and principal value will vary. Past performance cannot guarantee future results. Monthly composite performance is available upon request. See below for further information related to net of fee calculations.
T. Rowe Price (TRP) has prepared and presented this report in compliance with the Global Investment Performance Standards (GIPS®). TRP has been independently verified for the 20‐year period ended June 30, 2016 by KPMG LLP. The verification report is available upon request. Verification assesses whether (1) the firm has complied with all the composite construction requirements of the GIPS standards on a firm‐wide basis and (2) the firm's policies and procedures are designed to calculate and present performance in compliance with the GIPS standards. Verification does not ensure the accuracy of any specific composite presentation.TRP is a U.S. investment management firm with various investment advisers registered with the U.S. Securities and Exchange Commission, the U.K. Financial Conduct Authority, and other regulatory bodies in various countries and holds itself out as such to potential clients for GIPS purposes. TRP further defines itself under GIPS as a discretionary investment manager providing services primarily to institutional clients with regard to various mandates, which include U.S., international, and global strategies but excluding the services of the Private Asset Management group. The minimum asset level for equity portfolios to be included in composites is $5 million and prior to January 2002 the minimum was $1 million. The minimum asset level for fixed income and asset allocation portfolios to be included in composites is $10 million; prior to October 2004 the minimum was $5 million; and prior to January 2002 the minimum was $1 million. Valuations are computed and performance reported in U.S. dollars.Gross performance returns are presented before management and all other fees, where applicable, but after trading expenses. Net of fees performance reflects the deduction of the highest applicable management fee that would be charged based on the fee schedule appropriate to you for this mandate, without the benefit of breakpoints. Gross and net performance returns are net of nonreclaimable withholding taxes on dividends, interest income, and capital gains. Effective June 30, 2013, portfolio valuation and assets under management are calculated based on the closing price of the security in its respective market. Previously portfolios holding international securities may have been adjusted for after‐market events. Policies for valuing portfolios, calculating performance, and preparing compliant presentations are available upon request. Dispersion is measured by the standard deviation across asset‐weighted portfolio returns represented within a composite for the full year. Dispersion is not calculated for the composites in which there are five or fewer portfolios.Some portfolios may trade futures, options, and other potentially high‐risk derivatives which generally represent less than 10% of a portfolio. Benchmarks are taken from published sources and may have different calculation methodologies, pricing times, and foreign exchange sources from the composite. Composite policy requires the temporary removal of any portfolio incurring a client initiated significant cash inflow or outflow greater than or equal to 25% of portfolio assets. The temporary removal of such an account occurs at the beginning of the measurement period in which the significant cash flow occurs and the account re‐enters the composite on the last day of the current month after the cash flow. Additional information regarding the treatment of significant cash flows is available upon request.
The firm's list of composite descriptions and/or a presentation that adheres to the GIPS® standards are available upon request.

57T. ROWE PRICE 29T. ROWE PRICE
MONITORING AND RISK MANAGEMENT ELEMENTS
Equity Steering Committee Oversight
§ Periodic review by senior investment professionals promotes consistency of the strategy’s investment process and portfolio construction.
Quantitative Risk Management Tools
§ Wilshire Variance Analysis enables portfolio managers to review performance attribution versus benchmarks from a holdings-based perspective.
§ Barra risk analysis provides managers with a common risk factor tool to analyze their strategy versus a benchmark.
§ Zephyr returns-based style analysis allows portfolio managers to analyze the style and size consistency of their strategy versus a benchmark.
58T. ROWE PRICE
GLOSSARY OF INVESTMENT TERMS
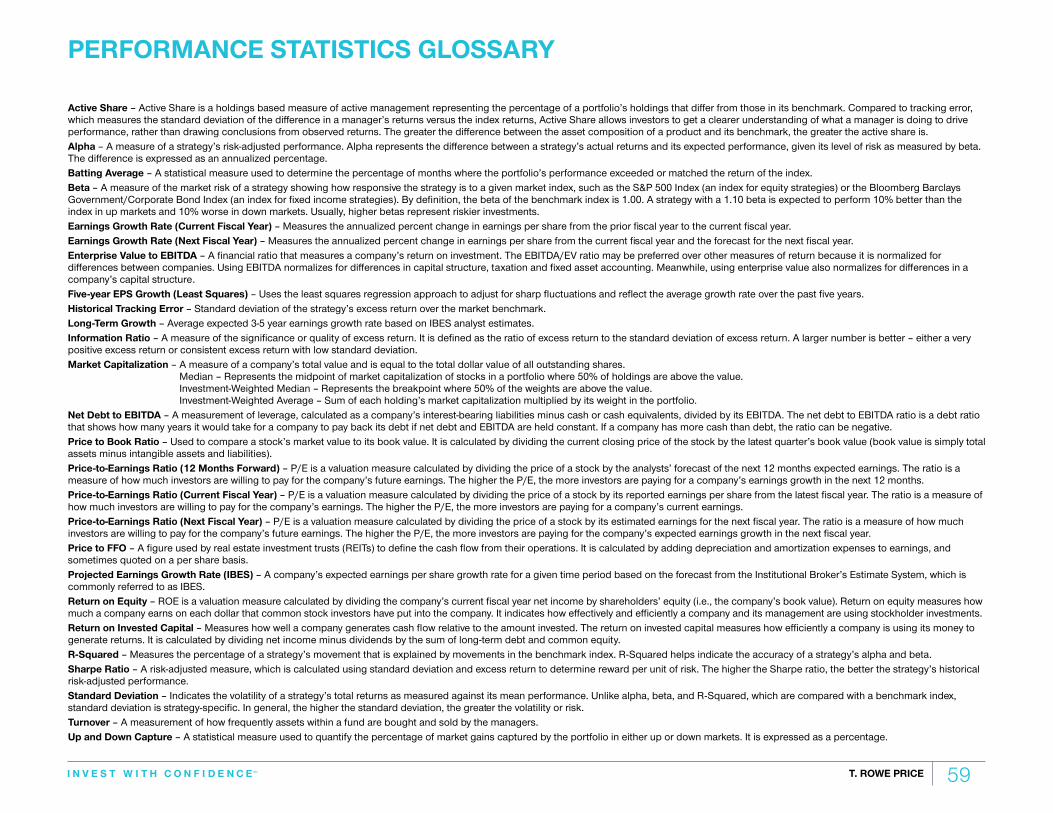
59T. ROWE PRICE 1T. ROWE PRICE
PERFORMANCE STATISTICS GLOSSARY
Active Share – Active Share is a holdings based measure of active management representing the percentage of a portfolio’s holdings that diff er from those in its benchmark. Compared to tracking error, which measures the standard deviation of the diff erence in a manager’s returns versus the index returns, Active Share allows investors to get a clearer understanding of what a manager is doing to drive performance, rather than drawing conclusions from observed returns. The greater the diff erence between the asset composition of a product and its benchmark, the greater the active share is. Alpha – A measure of a strategy’s risk-adjusted performance. Alpha represents the diff erence between a strategy’s actual returns and its expected performance, given its level of risk as measured by beta. The diff erence is expressed as an annualized percentage.Batting Average – A statistical measure used to determine the percentage of months where the portfolio’s performance exceeded or matched the return of the index.Beta – A measure of the market risk of a strategy showing how responsive the strategy is to a given market index, such as the S&P 500 Index (an index for equity strategies) or the Bloomberg Barclays Government/Corporate Bond Index (an index for fi xed income strategies). By defi nition, the beta of the benchmark index is 1.00. A strategy with a 1.10 beta is expected to perform 10% better than the index in up markets and 10% worse in down markets. Usually, higher betas represent riskier investments.Earnings Growth Rate (Current Fiscal Year) – Measures the annualized percent change in earnings per share from the prior fi scal year to the current fi scal year.Earnings Growth Rate (Next Fiscal Year) – Measures the annualized percent change in earnings per share from the current fi scal year and the forecast for the next fi scal year.Enterprise Value to EBITDA – A fi nancial ratio that measures a company’s return on investment. The EBITDA/EV ratio may be preferred over other measures of return because it is normalized for diff erences between companies. Using EBITDA normalizes for diff erences in capital structure, taxation and fi xed asset accounting. Meanwhile, using enterprise value also normalizes for diff erences in a company’s capital structure.Five-year EPS Growth (Least Squares) – Uses the least squares regression approach to adjust for sharp fl uctuations and refl ect the average growth rate over the past fi ve years.Historical Tracking Error – Standard deviation of the strategy’s excess return over the market benchmark.Long-Term Growth – Average expected 3-5 year earnings growth rate based on IBES analyst estimates.Information Ratio – A measure of the signifi cance or quality of excess return. It is defi ned as the ratio of excess return to the standard deviation of excess return. A larger number is better – either a very positive excess return or consistent excess return with low standard deviation. Market Capitalization – A measure of a company’s total value and is equal to the total dollar value of all outstanding shares.
Median – Represents the midpoint of market capitalization of stocks in a portfolio where 50% of holdings are above the value.Investment-Weighted Median – Represents the breakpoint where 50% of the weights are above the value. Investment-Weighted Average – Sum of each holding’s market capitalization multiplied by its weight in the portfolio.
Net Debt to EBITDA – A measurement of leverage, calculated as a company’s interest-bearing liabilities minus cash or cash equivalents, divided by its EBITDA. The net debt to EBITDA ratio is a debt ratio that shows how many years it would take for a company to pay back its debt if net debt and EBITDA are held constant. If a company has more cash than debt, the ratio can be negative.Price to Book Ratio – Used to compare a stock’s market value to its book value. It is calculated by dividing the current closing price of the stock by the latest quarter’s book value (book value is simply total assets minus intangible assets and liabilities).Price-to-Earnings Ratio (12 Months Forward) – P/E is a valuation measure calculated by dividing the price of a stock by the analysts’ forecast of the next 12 months expected earnings. The ratio is a measure of how much investors are willing to pay for the company’s future earnings. The higher the P/E, the more investors are paying for a company’s earnings growth in the next 12 months.Price-to-Earnings Ratio (Current Fiscal Year) – P/E is a valuation measure calculated by dividing the price of a stock by its reported earnings per share from the latest fi scal year. The ratio is a measure of how much investors are willing to pay for the company’s earnings. The higher the P/E, the more investors are paying for a company’s current earnings.Price-to-Earnings Ratio (Next Fiscal Year) – P/E is a valuation measure calculated by dividing the price of a stock by its estimated earnings for the next fi scal year. The ratio is a measure of how much investors are willing to pay for the company’s future earnings. The higher the P/E, the more investors are paying for the company’s expected earnings growth in the next fi scal year.Price to FFO – A fi gure used by real estate investment trusts (REITs) to defi ne the cash fl ow from their operations. It is calculated by adding depreciation and amortization expenses to earnings, and sometimes quoted on a per share basis.Projected Earnings Growth Rate (IBES) – A company’s expected earnings per share growth rate for a given time period based on the forecast from the Institutional Broker’s Estimate System, which is commonly referred to as IBES.Return on Equity – ROE is a valuation measure calculated by dividing the company’s current fi scal year net income by shareholders’ equity (i.e., the company’s book value). Return on equity measures how much a company earns on each dollar that common stock investors have put into the company. It indicates how eff ectively and effi ciently a company and its management are using stockholder investments.Return on Invested Capital – Measures how well a company generates cash fl ow relative to the amount invested. The return on invested capital measures how effi ciently a company is using its money to generate returns. It is calculated by dividing net income minus dividends by the sum of long-term debt and common equity.R-Squared – Measures the percentage of a strategy’s movement that is explained by movements in the benchmark index. R-Squared helps indicate the accuracy of a strategy’s alpha and beta.Sharpe Ratio – A risk-adjusted measure, which is calculated using standard deviation and excess return to determine reward per unit of risk. The higher the Sharpe ratio, the better the strategy’s historical risk-adjusted performance. Standard Deviation – Indicates the volatility of a strategy’s total returns as measured against its mean performance. Unlike alpha, beta, and R-Squared, which are compared with a benchmark index, standard deviation is strategy-specifi c. In general, the higher the standard deviation, the greater the volatility or risk.Turnover – A measurement of how frequently assets within a fund are bought and sold by the managers.Up and Down Capture – A statistical measure used to quantify the percentage of market gains captured by the portfolio in either up or down markets. It is expressed as a percentage.

BIOGRAPHICAL BACKGROUNDS

61 T. ROWE PRICE
BIOGRAPHICAL BACKGROUNDST. Rowe Price—Presenters
Taymour R. Tamaddon, CFATaymour Tamaddon is the portfolio manager of the US Large-Cap Growth Equity Strategy in the U.S. Equity Division. He is a vice president and member of the Investment Advisory Committees for the Health Sciences, Mid-Cap Growth, New America Growth, Growth Stock, Blue Chip Growth, and Capital Appreciation Strategies and the Tax-Efficient Strategies. He is also a vice president of the T. Rowe Price Institutional International Funds, Inc., and the T. Rowe Price International Funds, Inc. Mr. Tamaddon is a vice president of T. Rowe Price Group, Inc.
Mr. Tamaddon has 13 years of investment experience, 12 of which have been with T. Rowe Price. He joined the firm in 2004 after serving as a summer intern with T. Rowe Price in 2003, covering the eye care industry. Prior to this, Mr. Tamaddon was employed by Amazon.com in the areas of finance and merchandising. He also was a consultant with Booz Allen Hamilton, specializing in the energy industry.
Mr. Tamaddon earned a B.S. in applied physics, cum laude, from Cornell University. He also holds an M.B.A. from the Tuck School of Business at Dartmouth, where he was an Edward Tuck Scholar with high distinction. Mr. Tamaddon has also earned the Chartered Financial Analyst designation.
Ronald H. TaylorRon Taylor is a portfolio specialist in the Equity Division of T. Rowe Price. He is a member of the US Large-Cap Growth Equity Strategy team working closely with institutional clients, consultants, and prospects. Mr. Taylor is a vice president of T. Rowe Price Group, Inc.
Mr. Taylor has 28 years of investment experience, 13 of which have been at T. Rowe Price. Prior to joining the firm in 2003, he was employed by Zurich Scudder Investments as an equity product specialist and later as the director of Institutional Client Service. Mr. Taylor also previously worked for Chancellor Capital Management as an equity product specialist and at Putnam Investments as an equity analyst and later in new business development and client service. He began his career as a high yield bond analyst at Columbia Savings & Loan.
Mr. Taylor earned a B.A. in economics from the University of California at Los Angeles and an M.B.A. from Harvard Business School.
62T. ROWE PRICE
BIOGRAPHICAL BACKGROUNDST. Rowe Price—Presenters
John D. Plowright, CFA John Plowright is a North America client service executive for Global Investment Services, the organization responsible for the firm's institutional business worldwide. He is a vice president of T. Rowe Price Group, Inc., and T. Rowe Price Associates, Inc.
Mr. Plowright has 25 years of investment experience, 12 of which have been at T. Rowe Price. Before joining T. Rowe Price in 2004, he was a director of client services with RCM Capital Management, and prior to that, he was a director and fixed income specialist with RCM Capital Management.
Mr. Plowright earned a B.A. in religion from Earlham College, cum laude, and a master's degree in international management from American Graduate School of International Management. Mr. Plowright has earned the Chartered Financial Analyst designation and is a Series 7 and 63 registered representative.

T. ROWE PRICE
Important Information
This material, including any statements, information, data and content contained within it and any materials, information, images, links, graphics or recording provided in conjunction with this material are being furnished by T. Rowe Price for general informational purposes only. The material is not intended for use by persons in jurisdictions which prohibit or restrict the distribution of the material and in certain countries the material is provided upon specifi c request. It is not intended for distribution to retail investors in any jurisdiction. Under no circumstances should the material, in whole or in part, be copied or redistributed without consent from T. Rowe Price. The material does not constitute a distribution, an off er, an invitation, recommendation or solicitation to sell or buy any securities in any jurisdiction. The material has not been reviewed by any regulatory authority in any jurisdiction. The material does not constitute advice of any nature and prospective investors are recommended to seek independent legal, fi nancial and tax advice before making any investment decision. Past performance is not a reliable indicator of future performance. The value of an investment and any income from it can go down as well as up. Investors may get back less than the amount invested.
The views contained herein are as of the date indicated on the front cover and may have changed since that time.
Australia - Issued in Australia by T. Rowe Price International Ltd (ABN 84 104 852 191), Level 50, Governor Phillip Tower, 1 Farrer Place, Suite 50B, Sydney, NSW 2000, Australia. T. Rowe Price International Ltd is exempt from the requirement to hold an Australian fi nancial services licence in respect of the fi nancial services it provides in Australia. T. Rowe Price International Ltd is authorized and regulated by the UK Financial Conduct Authority under UK laws, which diff er from Australian laws. For Wholesale Clients only.
Canada - Issued in Canada by T. Rowe Price (Canada), Inc. T. Rowe Price (Canada), Inc.’s investment management services are only available to Accredited Investors as defi ned under National Instrument 45-106. T. Rowe Price (Canada), Inc. enters into written delegation agreements with affi liates to provide investment management services.
DIFC - Issued in the Dubai International Financial Centre by T. Rowe Price International Ltd. This material is communicated on behalf of T. Rowe Price International Ltd by its representative offi ce which is regulated by the Dubai Financial Services Authority. For Professional Clients only.
EEA - Issued in the European Economic Area by T. Rowe Price International Ltd., 60 Queen Victoria Street, London EC4N 4TZ which is authorized and regulated by the UK Financial Conduct Authority. For Professional Clients only.
Hong Kong - Issued in Hong Kong by T. Rowe Price Hong Kong Ltd., 21/F, Jardine House, 1 Connaught Place, Central, Hong Kong. T. Rowe Price Hong Kong Ltd. is licensed and regulated by the Securities & Futures Commission. For Professional Investors only.
Singapore - Issued in Singapore by T. Rowe Price Singapore Private Ltd., No. 501 Orchard Rd, #10-02 Wheelock Place, Singapore 238880. T. Rowe Price Singapore Private Ltd. is licensed and regulated by the Monetary Authority of Singapore. For Institutional and Accredited Investors only.
Switzerland - Issued in Switzerland by T. Rowe Price (Switzerland) GmbH (“TRPSWISS”), Talstrasse 65, 6th Floor, 8001 Zurich, Switzerland. For Qualifi ed Investors only.
USA - Issued in the USA by T. Rowe Price Associates, Inc., 100 East Pratt Street, Baltimore, MD, 21202, which is regulated by the U.S. Securities and Exchange Commission. For Institutional Investors only.
T. ROWE PRICE, INVEST WITH CONFIDENCE and the Bighorn Sheep design are, collectively and/or apart, trademarks or registered trademarks of T. Rowe Price Group, Inc. in the United States, European Union, and other countries. This material is intended for use only in select countries.