va tech wabag - aceanalyser meet/209532_20140210.pdfva tech wabag (india) ... saudi arabia, egypt,...
TRANSCRIPT

VA TECH WABAGInvestor & Analyst Meet
10th February 2014

This presentation and the accompanying slides (the “Presentation”), which have been prepared by VA TECH WABAG LIMITED (the“Company”), have been prepared solely for information purposes and do not constitute any offer, recommendation or invitation topurchase or subscribe for any securities, and shall not form the basis or be relied on in connection with any contract or bindingcommitment whatsoever. No offering of securities of the Company will be made except by means of a statutory offering documentcontaining detailed information about the Company.
This Presentation has been prepared by the Company based on information and data which the Company considers reliable, but theCompany makes no representation or warranty, express or implied, whatsoever, and no reliance shall be placed on, the truth,accuracy, completeness, fairness and reasonableness of the contents of this Presentation. This Presentation may not be all inclusiveand may not contain all of the information that you may consider material. Any liability in respect of the contents of, or any omissionfrom, this Presentation is expressly excluded.
This presentation contains certain forward looking statements concerning the Company’s future business prospects and businessprofitability, which are subject to a number of risks and uncertainties and the actual results could materially differ from those in suchforward looking statements. The risks and uncertainties relating to these statements include, but are not limited to, risks anduncertainties regarding fluctuations in earnings, our ability to manage growth, competition (both domestic and international),economic growth in India and abroad, ability to attract and retain highly skilled professionals, time and cost over runs on contracts,our ability to manage our international operations, government policies and actions regulations, interest and other fiscal costsgenerally prevailing in the economy. The company does not undertake to make any announcement in case any of these forwardlooking statements become materially incorrect in future or update any forward looking statements made from time to time by or onbehalf of the company.
2
Safe Harbour

33
Business Overview
Water Treatment Plant, Meenad, Kerala

4
Complete Water Treatment Solution Provider…
Provides a complete range of Water and Waste Water Treatment solutions
Offering spanning across Municipal Drinking Water, Municipal Sewage,
Industrial Water, Industrial Effluents, Desalination and Recycle
Technology focused company - Owns more than 100 patents
R&D centers located in India, Austria and Switzerland
Indian Multinational player in the water treatment industry
Strong execution track record - More than 2250 projects in last 3 decades
Professionally managed Company with Promoters having an average of 30
years work experience in the industry

5
Offering a complete range of solutions across project lifecycle
Commiss-ioning
Design
Procure-ment
Construction
Installation
O&M
Pureplay water company
Catering to both Municipal &
Industrial customers
Offerings span across
segments of water treatment
Range of services from
concept / design stage to
implementation to
operations of plant

6
Management Buyout followed by Acquisition of erstwhile Parent…
Name changed to VA Tech
Wabag (India) in 2000
Austrian Group VA Tech acquired
“Wabag” part of Business from
DB in 1999
1999 - 2000
Siemens acquired VA Tech Group
2005(Jul)
VA Tech Wabag (India)
2005(Sept)
Management Buyout of the India Business backed by ICICI
Venture
VA Tech Wabag
(Austria)
2007
VA Tech Wabag (India) acquires its erstwhile parent –VA Tech Wabag (Austria) from
Siemens
VA Tech Wabag (India)
Emergence
of Global
Water
Player with
focus on the
emerging
markets
Held by Deutsche
Babcock (DB) Group
Water Treatment business
represented by “Wabag”
1924 --------- 1996
VA Tech Wabag (Austria)
VA Tech Wabag (India)
2010(Oct)
VA Tech Wabag (India) listed on NSE & BSE

7
… Strengthen the Positioning in Water Treatment Sector
Access to Global geographies
Perennial Rights to “WABAG” brand -Established in 1924
Project References in more than 19 countries helps P/Q
Technical Know-how – Access to over 100 Patents & Experienced Manpower
Wabag Austria acquisition brought along… …. facilitated to Achieve
Growth in India Business
Revenue grew over 3 timesFrom Rs. 332 Crs to Rs. 1041 Crs
Acceptance of WABAG INDIA in Overseas market
Opportunity to leverage Low Cost Economic Advantage in
Global market

8
Current Business Structure ...
WABAG AustriaWABAG INDIA
International BusinessInternational BusinessDomestic Business
Desalination
Municipal
Industrial
O&M
Saudi Arabia, Egypt, Latin America
VA Tech WABAG
European Countries
Austria Czech Republic
Switzerland Romania
Turkey
Sub Saharan / North African Countries / Others
Tunisia Libya Iran
Namibia Algeria Macao
Exports
Sri Lanka Indonesia
Qatar Nepal
Tanzania Bahrain
Subsidiaries / JV
China Oman
Philippines Spain

9
… evolving with growth in International Geographies
India58%
Austria Group40%
Others*2%
India51%
Austria Group25%
Others*24%
Leveraging Indian resources for gaining momentum in International Geographies
Order Intake (Rs. 1,774 Crs.) in FY 2012 Order Intake (Rs. 2,155 Crs.) in FY 2013
* Others include Indian Subsidiaries /JVs like Oman, Muscat & Philippines

Reduced expenses in High Cost Geography
Invested in High Potential Water Markets by establishing Local Presence (MDUs)
10
Moving Closer to Clients…..
Austria21.862%
Other Geographi
es13.5838%
Austria12.3247%
Other Geographi
es14.0153%
Total Cost of Operation in Wabag Austria Group(Euro 35 Mn) in FY 2009
Total Cost of Operation in Wabag Austria Group(Euro 26 Mn) in FY 2013

11
Our Key Strengths
Chirita, Water Treatment Plant,Romania
12
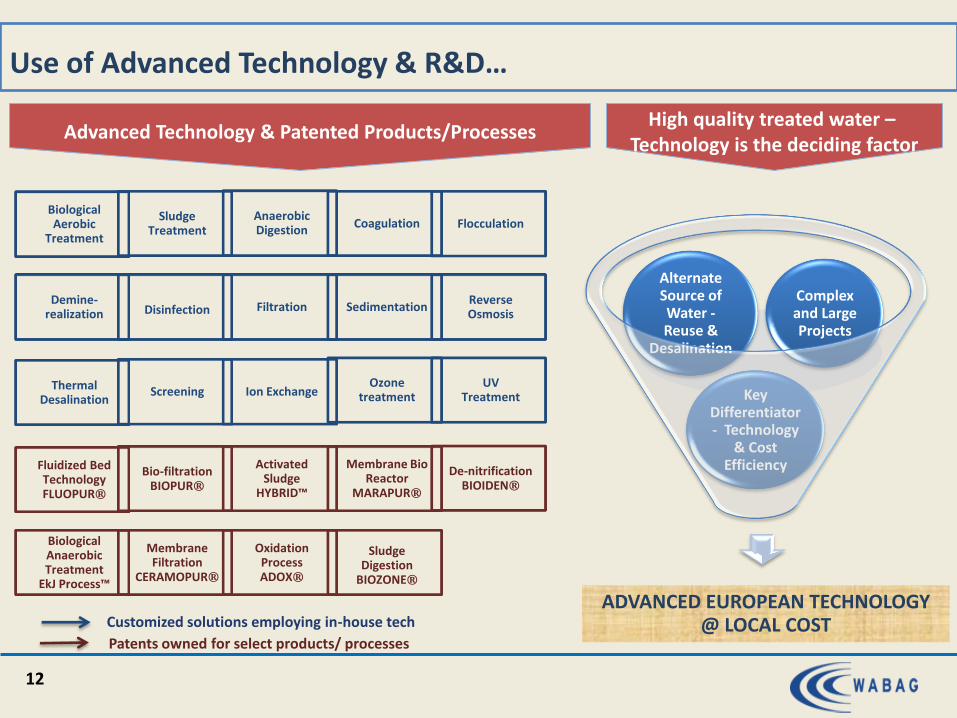
Use of Advanced Technology & R&D…
Advanced Technology & Patented Products/Processes
Demine-realization Disinfection Filtration Sedimentation
Reverse Osmosis
BiologicalAnaerobicTreatment
EkJ Process™
MembraneFiltration
CERAMOPUR®
Oxidation ProcessADOX®
SludgeDigestion
BIOZONE®
Fluidized Bed TechnologyFLUOPUR®
Bio-filtrationBIOPUR®
Activated Sludge
HYBRID™
Membrane BioReactor
MARAPUR®
De-nitrificationBIOIDEN®
ThermalDesalination
Screening Ion ExchangeOzone
treatmentUV
Treatment
ADVANCED EUROPEAN TECHNOLOGY @ LOCAL COST
Key Differentiator - Technology
& Cost Efficiency
Alternate Source of Water -Reuse &
Desalination
Complex and Large Projects
High quality treated water –Technology is the deciding factor
Customized solutions employing in-house tech
Patents owned for select products/ processes
Biological Aerobic
Treatment
Anaerobic Digestion
Coagulation FlocculationSludge
Treatment

13
Presence in High Growth Potential Water Markets
Countries Market $Bn CAGR Range
US 107.0 10-15%
China 47.0 6-10%
Italy 16.0 10-15%
Brazil 15.0 10-15%
Spain 11.0 15%+
Saudi Arabia 8.5 6-10%
Mexico 7.3 6-10%
South Africa 6.1 6-10%
India 5.9 10-15%
UAE 4.4 10-15%
Countries Market $Bn CAGR Range
Algeria 4.0 6-10%
Iran 3.8 10-15%
Egypt 3.5 6-10%
Indonesia 2.5 10-15%
Hungary 1.8 15%+
Malaysia 1.7 10-15%
Morocco 1.6 10-15%
Argentina 1.3 15%+
Romania 0.9 15%+
Tunisia 0.8 10-15%
Countries, WABAG is focused
Source : GWI Report

14
Asset Light Business Model
Design &
EngineeringTechnology
Civil Construction (Outsourced)
Operation &
Maintenance
Critical for cost optimization
Approvals to match customer requirements
In-house to ensure compliance with designs
― Combination of Proprietary & Bought out Technology
― Testing, Quality Control
Mostly outsourced to dedicated Contractors
Ensures low asset base
Allows to focus on core competencies
In-house to ensure quality performance
― High Plant Operation Efficiency
― Least Downtime
High EBIDTA segment
Focus on ‘Value-Added & High Margin’ work processes; Limits investment in Asset Base
Ability to handle large and complex projects
Execution skill for high value projects & in emerginggeographies
Strong Balance Sheet
Asset light & Cash generating business
Our Strengths
22
21
2422%
20%21%
17%
19%
21%
23%
19202122232425
FY 11 FY 12 FY 13
Ro
CE
Ass
et T
urn
ove
r (X
)

15
FINANCIAL HIGHLIGHTS
Waste Water Treatment Plant,Turkey

Growth in Order Intake despite Global Economic Slowdown, Arab Spring & Policy Paralysis in India
Converted Threat into Opportunity – Robust Order Intake Growth in Overseas Business
Rs. 398 Crs. of Framework Contracts added in 9M FY14 of which Rs. 244 Crs. moved to firm Order Book in Jan 14
16
Consistent Order Intake across geographies…
FY 11 FY 12 FY 13 9M FY14
1,802 1,774 2,155
3,048
Rs. Crs.

17
Increase in Average Order Size
FY 2012 FY 2013 9M FY 2014
* Average of Order intake of Top 10 projects during Financial year
108
183
70% Increase in ticket size [Rs. Crs.] *
Petrobrazi, Romania
136

18
Current Order Book of Rs. 6,000 Crs.
EPC -Municipal
3,48658%
EPC -Industrial
90115%
O&M1,61127%
Average execution period for Municipal Orders – 24 months & Industrial Orders – 12 to 15 months
Most of Municipal Orders backed by funding from Multilateral / JNNURM / Central Govt /LCs.
Industrial Orders from reputed companies like Reliance Industries, BHEL, NTPC, IOCL, etc.
Framework Contract of Rs. 1,169 Crs. of which Rs. 244 Crs. moved to firm Order Book in Jan 14
Rs. Crs.

Well Diversified Geographical Presence reduces dependence on Single Country
Ability to convert Order book in to Revenue despite temporary geographical set back and other economic issues
19
Robust Revenue Growth…
FY 11 FY 12 FY 13 9M FY14
734 773933
1334510
674686
9M Q4
Rs. Crs.
1,244
1,4471,619

Increase in O&M Business Revenue share from 10% in FY 11 to 17% in FY 13
Gaining margin on account of better absorption of Overhead
Margin improvement despite Investments in various international geographies (MDUs)
20
… with improved EBITDA margins
FY 11 FY 12 FY 13 9M FY14
38 3965
10283 91
90
9M Q4
Rs. Crs.
121130
155

21
Consistent growth in PAT
FY 11 FY 12 FY 13 9M FY14
7 1430
4246
60
60
9M Q4
Rs. Crs.
Asset Light Model resulting in low Depreciation and Finance Cost
Any improvement in EBITDA directly flows through PBT
53
74
90

• Why are the Receivables & Payables higher on Balance Sheet date?
– Q4 generally accounts for 40-45% of annual turnover
– Invoice raised & recognized as Revenue that appear in Receivables, are not due for payment as per contract
– The above applies to Payables to major Vendors too
– Receives and makes payment as per contracted terms in due course of time
22
Working Capital Cycle
Clients
Major Vendors
Pla
ces
an O
rder
Sup
ply
& R
aise
In
voic
e
Rai
se In
voic
e b
ased
on
ven
do
r in
voic
e
Rec
eive
s Pa
ymen
t as
co
ntr
acte
d
term
Mak
es P
aym
ent
to
Ven
do
rs
Ord
er P
lace
men
t o
f m
ajo
r co
mp
on
ents
o
n s
imila
r te
rms
1
2
3
4
5
6

23
100 MLD Nemmeli (Chennai) Desalination Plant
Nemmeli, Chennai
- 100 000 m3/day
- Reverse Osmosis & Ultrafiltration Technology
- Total Contract Value : Rs. 1084 Crs.
- Total EPC Cost : Rs. 584 Crs.
- Received till date : Rs. 497 Crs.
- Outstanding Receivables : 87 Crs. [including retention
money of Rs. 29 Crs.]
-O&M for 7 years : Rs. 500 Crs.
- Funded by a Grant from Govt of India
O&M Period started from January 2014

24
Consistently achieving Guidance
Revenue Order Intake
1,600-1,700
2,000 -2,100
Upward Revision of Guidance for FY 14
Revenue : Rs. 2,000 Crs., Order Intake : Rs. 3,500 Crs.
FY 2013 [Rs Crs] FY 2014 [Rs Crs]
Revenue Order Intake
1,850 –1,950
2,600 –2,700
9M FY141,335
Surpassed Order Intake
Guidance in 9
months
ACHIEVED

25
Improved Dividend Pay-out
21
28
34
4 6 7
FY 2011 FY 2012 FY 2013
EPS DPS
200%
300%
350%
Earning Per Share (Rs.) 21 28 34
Dividend Per Share (Rs.) 4 * 6 7
Dividend Payout 19 % 21 % 21 %
* Adjusted for Share Split.

26
Our Key Strengths
Thank You