vacillation cycles in wrf simulations of hurricane katrina · reif et al.: vacillation cycles in...
TRANSCRIPT

Australian Meteorological and Oceanographic Journal 64 (2014) 123-131
123
Vacillation cycles in WRF Simulations of hurricane Katrina
Matthias Reif1, Michael J. Reeder2,3, and Mai C. N. Hankinson2
1Institute of Meteorology and Geophysics Innsbruck, University of Innsbruck, Austria.2School of Mathematical Sciences, Monash University, Victoria, Australia.
3ARC Centre of Excellence for Climate System Science, Monash University, Victoria, Australia.
(Manuscript received October 2013, revised May 2014)
The intensification of hurricane Katrina (2005) in non-hydrostatic simulations with the WRF model is compared to a hydrostatic simulation conducted in a previous study with the Australian Bureau of Meteorology’s Tropical Cyclone Limited Area Prediction System (TCLAPS). During the intensification both simulations exhib-it inner-core vacillation cycles between highly asymmetric and more symmetric phases in the low-level potential vorticity (PV) and vertical velocity, although theirevolution and structure are more complex in WRF. Although in WRF the low-level PV vacillates between symmetric and more asymmetric stages, similar to the hydrostatic TCLAPS simulation, no fully monopolar structure develops in asym-metric phases; the PV maintains its ring-like structure during the intensification. The asymmetric phases in WRF are characterised by isolated PV anomalies break-ing from the eyewall and propagating towards the centre. While stirring high PV into the centre episodically, these isolated PV anomalies cause a stepwise drop in central pressure.
Introduction
Over the past two decades the forecasting of tropical cyclone tracks has improved through continued research and ever-increasing computing power. In contrast, there has been little improvement in forecasting the intensity of tropical cyclones (Rogers et al. 2013, Cangialosi and Franklin 2012, DeMaria and Gross 2003).
Recently Montgomery and Smith (2014) reviewed the different theories for tropical cyclone intensification. Although early theories were based on axisymmetric ideas, the recent literature recognises the importance of asymmetric mechanisms in the intensification of tropical cyclones. These mechanisms include vortex Rossby waves (VRW, Montgomery and Kallenbach 1997, Möller and Montgomery 1999, Chen et al. 2003), barotropic instability (Schubert et al. 1999, Kossin and Schubert 2001, Kossin and Eastin 2001) and vortical hot towers (VHT, Hendricks et al. 2004, Montgomery et al. 2006). Nguyen et al. (2011) show how all these mechanisms participate during the intensification, causing the modeled vortex to vacillate between relatively symmetric and highly asymmetric phases. This alternating change in the degree of symmetry is termed a vacillation cycle (VC). In their hydrostatic simulations of hurricane Katrina with
the Australian Bureau of Meteorology model TCLAPS the asymmetric phase is characterised by a monopole structure in low-level potential vorticity (PV) and equivalent potential temperature with the maximum at the vortex centre. In this phase the modeled tropical cyclone deepens rapidly. In contrast, the symmetric phase is characterised by a low-level ring of elevated PV, and vertical velocity. In this phase the maximum azimuthal-mean tangential wind rapidly accelerates. The two phases of the low-level structure of the PV and are observed in aircraft data by Kossin and Eastin (2001) in hurricanes Diana (1984) and Olivia (1994). More recently, Hankinson et al. (2014) showed that vacillation cycles are common in ensemble simulations with TCLAPS of hurricane Katrina.
It was suggested by Nguyen et al. (2011) that both convective and barotropic instabilities are important for the development of vacillation cycles. Therefore, vacillation cycles are likely to be sensitive to the initial conditions, model formulation and physical parameterisation. For this reason non-hydrostatic WRF simulations of hurricane Katrina are conducted and the results are presented here. From this perspective, the current research extends the results of Nguyen et al. (2011).
Furthermore, the evolution of the PV in the inner core region is examined to understand the mechanism, by which the central pressure varies during vacillation cycles. ‘Methods’ describes the WRF model setup, a vortex centre
Corresponding author address: Institute of Meteorology and Geophysics Innsbruck. Email: [email protected]
124 Australian Meteorological and Oceanographic Journal 64:2 June 2014
communicate with each other by two-way interaction on a mercator projection. The outer domain has a resolution of around 16.7 km (0.15°) horizontal resolution on a grid with 280 × 240 points. The inner domain has 301 × 301 grid points with the southwest corner located at 17.5°N and 267.5°E giving a horizontal mesh size of about 5.6 km (0.05°). To construct the initial and boundary conditions a GFS analysis is interpolated on 45 vertical σ levels on both domains with the top level at 50 hPa. In the coarser domain the cumulus parameterisation, based on a cloud model of Kain and Fritsch (1993), is used, whereas in the finer domain the cumulus scheme is switched off. The cloud microphysical calculations use the Purdue Lin scheme of Chen and Sun (2004). The longwave radiation calculations employ the Rapid Radiative Transfer Model (RRTM) based on that by Mlawer et al. (1997), while the shortwave radiation calculations use a scheme based on Dudhia (1989). Moisture fluxes from surface are calculated using similarity theory and the boundary layer (YSU) is based on Hong et al. (2006).
finding technique and a symmetry parameter used to identify the vacillation cycles.
‘Results’ documents the vacillation cycles in a non-hydrostatic simulation of hurricane Katrina., followed by the results on the evolution of the PV in the inner-core region. A discussion and the conclusions are given in the final section.
Methods
The non-hydrostatic WRF modelThe Weather Research and Forecast model (WRF) is an atmospheric simulation system, which has been previously applied to a wide range of meteorological problems, including tropical cyclone intensification (Rotunno et al. 2009, Li and Pu 2008, Nolan et al.2009, Fierro et al. 2009). The Advanced Research WRF (ARW) dynamic core, chosen here, uses the non-hydrostatic perturbation form of the Euler equations written in flux-form (Skamarock 2008). The WRF run discussed here has two fixed domains, which
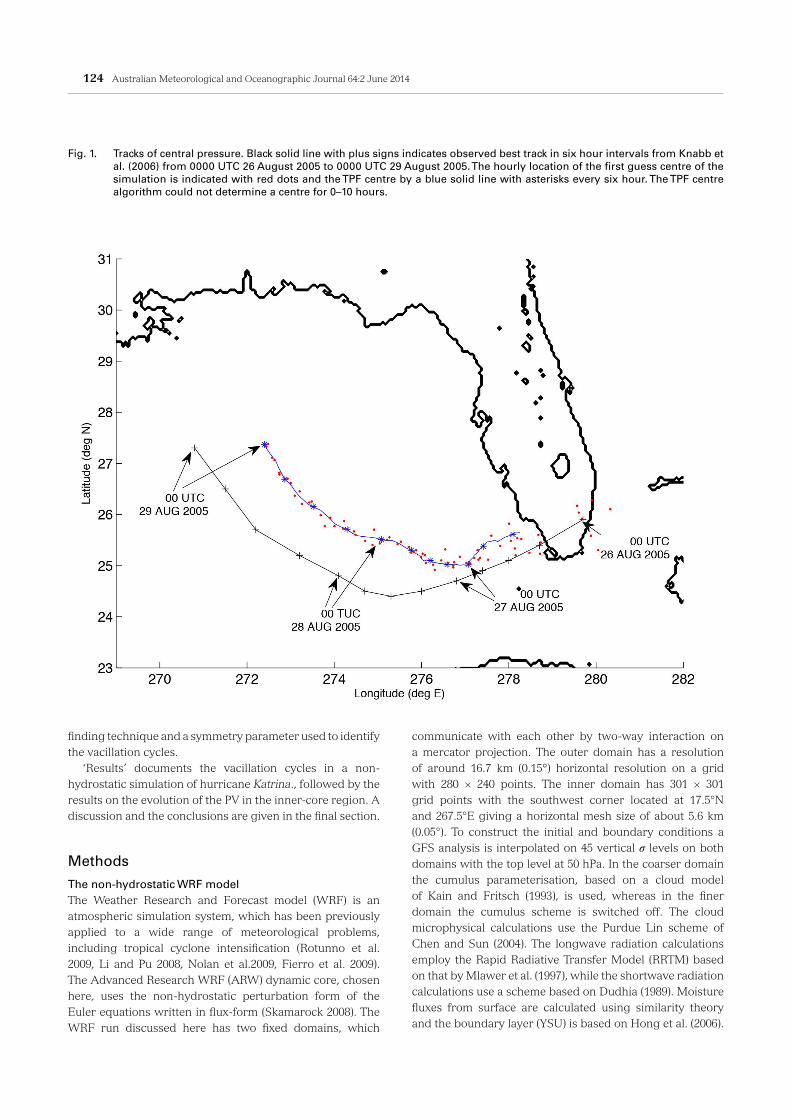
Fig. 1. Tracks of central pressure. Black solid line with plus signs indicates observed best track in six hour intervals from Knabb et al. (2006) from 0000 UTC 26 August 2005 to 0000 UTC 29 August 2005. The hourly location of the first guess centre of the simulation is indicated with red dots and the TPF centre by a blue solid line with asterisks every six hour. The TPF centre algorithm could not determine a centre for 0–10 hours.

Reif et al.: Vacillation cycles in WRF simulations of hurricane Katrina 125
mesoscale undulations in the centre. Primarily the technique was developed for application to observations near the core. As the data density from the model is considerably higher than the density of dropsonde or aircraft observations, the minimisation in the TPF code converges in a well established vortex. Nonetheless, the algorithm diverges when the pressure anomalies are weak or when the first guess centre is too removed from the actual centre, as for the period 0–10 h.
Measure of asymmetryThe degree of asymmetry in the vortex is quantified by the maximum of the azimuthal standard deviation of the potential vorticity (PVσ)
Here , with Δr = 5 km and R increases in steps of Δr from 0 to 300 km. The amplitude of the PVσ and its variability in a ring around the centre of the vortex determine the magnitude of Smax. Symmetric profiles of PVσ with small variations along the radii give small values of Smax whereas intense single PVσ maxima result in high values of Smax. PVσ is defined by
where the subscript σ emphasises that the calculation uses the full sigma-level data. The σ coordinate system is a terrain-following hydrostatic pressure vertical coordinate, hence it is a pressure coordinate for which the following simplification is applicable. PVσ is an approximation to the full Ertel PV defined as where Ω is the angular velocity vector of the earth and v is the velocity; the horizontal derivatives of the vertical velocity ∂w∂x and ∂w∂y as well as the horizontal components of the Coriolis force are
...(2)
...(3)
Derivatives for diffusion are calculated along coordinate surfaces and the horizontal diffusion coefficient is diagnosed from horizontal deformation, whereas vertical diffusion is accomplished by the boundary layer scheme.
Vortex centre findingThe first guess for the centre of the vortex at each level is defined by the average of the location of minimum wind speed and the location of minimum sea level pressure or the minimum of geopotential height depending on the level. This first guess is improved by the translating pressure fit technique (TPF) developed by Kepert (2005) for objectively locating the pressure centre of tropical cyclones from observations. As indicated by the red dots in Fig. 1 the first guess track of the simulation undulates around the smoother TPF track, indicated by the blue line with asterisk signs every six hours.
The algorithm of Kepert (2005) determines the centre by randomly perturbing the parametric tropical cyclone pressure profiles of Holland (1980) and minimising a cost function. When the algorithm of Kepert (2005) is applied at a particular time the cost function simplifies to
Here the parametric profile phol is defined by the shape and intensity of β vm ,rm ,b, pc( ) , where vm is the maximum cyclostrophic wind at the radius of maximum wind (RMW) rm, b is the profile shape parameter and pc is the central pressure. σ P
2 is the error variance of the ith pressure data point at location xi. The centre is calculated by minimising Jp over β. In other words, the actual pressure profile is fitted to a range of typical tropical cyclone profiles. Hence, the TPF centre is determined by the largescale vortex and not by
...(1)
Fig. 2. Minimum sea level pressure in red and maximum wind speed in dark blue (observed 1-minute sustained maximum surface winds and maximum wind anywhere in the model). Solid lines are the best track data and dashed-dotted lines are from the simulation. The light blue solid line with crosses shows the maximum of the azimuthal mean tangential wind at 850 hPa.

126 Australian Meteorological and Oceanographic Journal 64:2 June 2014
0000 UTC 29 August 2005 in the simulation compared with the observation of 902 hPa at 1800 UTC 28 August 2005). Although the simulation reaches the observed final minimum pressure, the evolution of the minimum pressure is different from that observed. There are two phases in which the pressure remains constant in the best track data whereas in the simulation the central pressure falls continuously, albeit with variations in the pressure tendency.
The detrended evolution of Smax at 850 hPa, denoted ΔSmax, is plotted in Fig. 3 in conjunction with the central pressure tendency
∂pc∂t
. Symmetric and asymmetric phases are indicated by vertical black solid (S1–S4) and dashed lines (A1–A4) in Fig. 2 and 3. Asymmetric phases are defined as periods in which ΔSmax > 1.5 and
∂pc∂t
< -2. Symmetric phases are defined simply as the period preceeding an asymmetric phase in which ΔSmax < 0.
In asymmetric phases A1–A3 there is pronounced deepening of the vortex, exceeding –3 hPa h−1, along with high values of ΔSmax, exceeding two. This result agrees with the findings of Nguyen et al. (2011) who found that asymmetric phases are characterised by relatively strong deepening. In contrast, symmetric phases are characterised by a relatively weak deepening. Moreover, in the intensification phase from 24–60 h the correlation between ΔSmax and
∂pc∂t
shown in Fig. 3(a) is negative (R2 = –0.51). The negative correlation during the vacillation cycles supports the relationship found by Nguyen et al. (2011) between the degree of symmetry and the rate of change of the central pressure.
Nguyen et al. (2011) also found the maximum azimuthally-mean tangential wind to increase most rapidly during symmetric phases. Here, during the intensification period 24 – 60 h, the correlation between ΔSmax and shown in Fig. 3b is just slightly negative (R2=–0.09). The result implies that, in contrast to Nguyen et al. (2011), there is a slight but insignificant preference for the mean tangential wind to increase during asymmetric phases also.
Azimuthal meanThe evolution of the azimuthal mean fields are shown in Fig. 4. Each asymmetric phase is characterised by the inward propagation of the tangential acceleration, as indicated by the thick red dashed lines in Fig. 4, resulting in a relatively large acceleration near the centre of the vortex. In Nguyen et al. (2011) the acceleration of the mean tangential wind near the RMW is closely associated with the symmetric phase. In contrast, in the WRF simulation the patterns of acceleration in the mean tangential wind are similar but lagged in time. Except for S3, the strongest accelerations occur just after symmetric phases and persist during asymmetric phases. This results in the positive correlation between ΔSmax and .
The blue contours in Fig. 4(b) illustrate the evolution of the mean PV and its radial gradient (shaded). Throughout the intensification (from 20 h onwards) the vortex shows a PV minimum in the core relative to the eyewall, which is consistent with the ring structure of low-level PV reported
neglected in PVσ. Although the simulation is non-hydrostatic PVσ is calculated hydrostatically as it is used as a diagnostic only. All graphs show PV (henceforth PV) in potential vorticity units (PVU = 10−6 K m2 kg−1 s−1).
Results
Vortex evolutionFigures 1 and 2 compare the simulated track and intensity of the vortex with observations. The distance between the simulated and observed track is 46, 126 and 158 km after 24, 48 and 72 h of simulation, respectively (Fig. 1). At the initial time, the minimum pressure (red dash-dotted line) and maximum wind (dark blue dash-dotted line) shown in Fig. 2 are 1004 hPa and approximately 20 m s−1, respectively. In contrast, the best track values at the initial time are 983 hPa (red solid line) and 36 m s−1 (blue solid line). The best track are the maxima in the 1-minute sustained surface winds obtained from a combination of measurements (Knabb et al. 2006).
Although the simulation differs from the observations in detail, the rate of intensification is comparable. The model wind rapidly intensifies in about 50 to 60 hours to a category 5 tropical cyclone with a maximum in the mean tangential wind at 850 hPa of 85 m s−1 at 69 h in the simulation compared to an observed best track maximum of 77 m s−1 at 66 h. Near the end of integration, at 72 h, the model reaches almost the same pressure as that of hurricane Katrina (901 hPa at
Fig. 3. Detrended evolution of in red with circles,
the maximum mean tangential wind in blue with triangles, (a) and the central pressure tendency
in green with crosses (b).

Reif et al.: Vacillation cycles in WRF simulations of hurricane Katrina 127
the mean flow at the critical radius. This critical radius is typically located outside of the RMW. We investigate now the region inside of the RMW wherein the mean PV radial gradient is generally positive.
In Fig. 5 the azimuthal angle is defined such that zero degrees is south of the centre and increases counterclockwise, which is in the direction of the mean flow. The solid lines indicate the mean tangential wind at radii of 40 and 20 km, respectively, whereas dashed lines mark the movement of the PV anomalies.
It is evident from Fig. 5 that the PV anomalies retrograde at 30–50 km radii (solid lines in Fig. 5(a) are more horizontal than dashed lines). This behaviour is consistent with the propagation of VRWs in a negative mean PV radial gradient. At the inner radii 10–30 km (Fig. 5(b)), at which the mean PV radial gradient is positive (see Fig. 4(b)), the retrogression is not clearly evident. Moreover, the inward movement of PV anomalies can be seen by combining panels (a) and (b) in Fig. 5. For instance, a positive cyclonic PV anomaly (marked by the orange shading) disappears at 31 h at 180° in Fig. (a) and reappears instantly in Fig. 5(b) (similarly at 38 h at 90° during A2). In A3 the anomaly could not be tracked further with the detection of the absolute PV maximum (see next section) as diabatic generation of PV in the eyewall intensifies. Nevertheless, the PV in A3 at 46 h is low at the outer radii (Fig. 5(a)) between 200°–360° and about double at inner radii (Fig. 5(b)) indicating the continuation of the centreward propagation of the PV anomalies.
by Nguyen et al. (2011), and is typical for the symmetric phases. Except for S3, the PV in the centre increases in the asymmetric phases and decreases in the symmetric phases (see the blue contours at S1, S2, S4 and S5). In contrast to Nguyen et al. (2011) there is no clear monopolar PV structure in the asymmetric phases. A negative PV gradient develops near the centre three times at 28 h, 41 h and 49 h (before S1 and after A2 and A3), but on average the PV gradient in the core remains positive on the inside of the core region and negative on the outside. Solid purple lines in Fig. 4(b) and (c) mark isolated PV anomalies that propagate towards the centre; they are described in the following section 4.1.
The tendency of the radial wind at 900 hPa, shown in Fig. 4(c), illustrates the acceleration of the mean inflow in the boundary layer. Particularly, during or just before the symmetric phases the radial inflow accelerates at radii between the RWM and 150 km. The mean tangential wind accelerates following to these accelerations in the radial wind (see Fig. 4(a)).
Evolution of the PV in the inner core region
Vortex Rossby wavesThe stepwise deepening of the simulated vortex during the asymmetric phase is now examined in light of the evolution of the PV in the inner-core region. As suggested by Montgomery and Kallenbach (1997), vortex Rossby waves propagating outwards in a negative mean radial PV gradient may affect the vortex intensity by feeding wave energy into
Fig. 4. Radius-time plots at 850 hPa of the azimuthally averaged: (a) tendency of the tangential wind shaded with as blue contours (in m s−1 with increments of 10), (b) radial gradient of the PV shaded with PV as blue contours (in PVU with increments of 10), and at 900 hPa (c) the tendency of the radial wind shaded with u as blue contours (in m s−1 with incre-ments of 5, positive values represent outward flow; at 66–72 h there is no data in the innermost 20 km as the 900 hPa level intersects the surface). Solid black line indicates the radius of maximum tangential wind.

128 Australian Meteorological and Oceanographic Journal 64:2 June 2014
Isolated PV anomaliesThe PV anomalies in the inner-core region appear to move inwards resembling eyewall mesovortices (see e.g. Schubert et al. 1999, Kossin et al. 2000). The inward movement of these isolated PV anomalies is investigated now.
Isolated PV anomalies are identified by tracking the absolute PV maximum in a coarse grain field of PV constructed using a three point filter. These PV anomalies are taken to be part of a single event while three conditions are met. First, they can be tracked for at least one hour. Second, they move no further than 25 km per analysis interval, which is 5 minutes (implying that the anomalies cannot move faster than 300 km/h, which is a condition easily satisfied). Third, their distance from the centre decreases with time.
The purple lines in Fig. 4 (dashed lines in Fig. 5 and thick
solid lines in Fig. 6) show the start and end points of four events that could be tracked and which satisfy the criteria above. These events are named P1–P4. They originate in the eyewall around the RMW (black solid line in Fig. 4(b)) and propagate centrewards on a negative mean PV gradient until they reach the location of the maximum mean PV (where
). Additionally, Fig. 6 shows a horizontal plane view of the PV and vertical velocity with the tracked PV maxima (dashed lines) and the location of the corresponding absolute PV maximum (marked by an asterisk). During the asymmetric phases A1 and A2 the isolated PV anomalies P2 and P4 could be tracked centrewards (Fig. 6(c) and (f)). Furthermore, the two events P1 and P3 occur before S1 around 23 h and between A2 and S2 at 34 h (see Fig. 5), also shown in Fig. 6(a) and (d). The PV anomaly P1 shown in Fig. 6a at 23:25 h, has been further
Fig. 5. PV [PVU] averaged over 30–50 km, in (a), and 10–30 km radius in (b). Dashed lines indicate the angular speed of the tracked PV anomalies and the solid lines the mean tangential wind. The azimuthal angle increases in the counterclockwise direction and is defined such that zero is south.

Reif et al.: Vacillation cycles in WRF simulations of hurricane Katrina 129
mean tangential wind.Differential advection geometrically deforms fluid
elements. Such transport and deformation will, in general, have the effect of homogenising the scalar properties of the fluid. The process of homogenisation is called stirring. Here we focus on the stirring of PV.
In A3 and later on, the PV is still stirred into the centre although the PV in the ring along the eyewall is higher than
tracked until 24:10 h while it travelled centrewards. ΔSmax also peaks at 23 h (see Fig. 3) and there is a centreward acceleration of (see Fig. 4(a)), although the intensification is not sufficiently strong to be defined as an asymmetric phase; also the deepening of the vortex is not as distinct as in the asymmetric phases. Although these events do not satisfy the criterion ΔSmax > 1.5 as in A1–A4, they intensify the vortex by stirring PV centrewards and accelerating the
Fig. 6. Contours of PV on the 850 hPa pressure level with increments of 3, 6, 9, 12, 15, 18 and 21 PVU as indicated by the color bar in (g). Asymmetric phases A1–A4 are shown in (c), (f), (h) and (i) and symmetric phases S1–S3 are shown in (b), (e) and (g), respectively. Thick solid lines indicate the track of isolated PV anomalies. Thin solid lines are vertical velocity with intervals of 1, 2 and 3 m s−1.

130 Australian Meteorological and Oceanographic Journal 64:2 June 2014
6(c, f, i) and even stays ring-like in the azimuthal mean (see blue contours in 4(b) from 30 h onwards).
This ring structure in the low level PV implies that the vortex is barotropically unstable, as there is a change in sign in the radial PV gradient. Barotropic instability and convection go hand in hand to produce the centreward stirring of PV. Isolated PV anomalies are generated diabatically at the sites of enhanced convection (VHTs). Barotropic instability needs a PV ring on which counter propagating vortex Rossby waves amplify (Schubert et al. 1999). In the early stages of the simulation (before 30 h) the VHTs appear to be the sole source of isolated PV anomalies, whereas later when the vortex becomes barotropically unstable, the PV ring tends to break into isolated PV anomalies. The inward propagation and merger of these isolated PV anomalies acts to reduce the barotropic instability. It appears that these two competing processes drive the vacillation cycle. Eventually the vortex deepens as the PV anomalies propagate towards the centre and merge.
Fierro et al. (2009) documented changes in the structure of hurricane Rita (2005) in simulations with WRF as the resolution increases from 1 to 5 km. Although the intensity did not change appreciably, they found the energy at low wave numbers (2–4) decreased with increasing resolution, while the energy of the symmetric flow and that at higher wave numbers increased with higher resolution. These results imply that the vacillations reported here may become less pronounced as the resolution increased. Answering the question of whether vacillation cycles are real features of tropical cyclones or numerical artifacts requires a detailed comparison of measurements with high resolution simulations using a wide range of grid spacings.
Conclusions
This study has investigated the vacillation cycles that occurred during a simulation of hurricane Katrina with the Weather Research and Forecasting model (WRF). Vacillation cycles are the repeated oscillation between an asymmetric and a symmetric mean azimuthal low-level PV structure, first reported by Kossin and Eastin (2001) and simulated by Nguyen et al. (2011).
Nguyen et al. (2011) investigated vacillation cycles in simulations with the hydrostatic model TCLAPS. It has been shown here that vacillation cycles occur in a non-hydrostatic model as well. In the symmetric phase the low-level PV has an approximately circular shape that frequently breaks down into one or more isolated, monopolar PV anomalies which subsequently propagate centrewards on the mean negative PV gradient.
The patterns of low-level PV in WRF (the PV rings and anomalies) that characterise the individual phases agree with the results of Nguyen et al. (2011) in the symmetric phases, although the structure and evolution of the PV field in asymmetric phases is less distinct. In particular, it appears that the WRF simulation produces weaker vacillation cycles
in the centreward propagating tip of the PV (see P5 in Fig. 6(h)). Similarly for P6 in Fig. 6(i) the asterisk indicates the absolute PV maximum at 51 h in A4 while the PV stirring into the centre cannot be tracked. The algorithm tracks the absolute maximum which remains in the eyewall after 45:00 h preventing further tracking of the isolated PV anomalies even though they are visible in A3 and A4 in the horizontal cross sections (see P5 and P6 in Fig. 6(h) and (i)).
Figures 6(b, e, g) show PV contours in the symmetric phases S1–S3, respectively. These three symmetric phases are characterised by relatively lower PV in the centre region as well as in the eyewall region compared to asymmetric phases (see also blue contours in Fig. 4(b)). The solid and dashed contours in Fig. 6 indicate vertical velocity. The vertical motion illustrates the symmetry of the vortex with a more circular shape in symmetric phases and more asymmetric shapes with single updrafts in asymmetric phases. All of the isolated PV anomalies originate in regions of strong vertical updraft, see e.g. Fig. 6(a, c, f). Such vertical updrafts spanning the depth of the troposphere (not shown) are regions of intense convection, sometimes termed vortical hot towers (VHTs, Hendricks et al. 2004). VHTs appear to be a necessary prerequisite for forming isolated PV anomalies as they diabatically generate strong PV maxima.
Discussion
The configuration used for the WRF simulation was designed to be as close as possible to the configuration of the TCLAPS simulation reported by Nguyen et al. (2011). Although vacillation cycles can be identified in the non-hydrostatic WRF simulation reported here, the vacillations are more pronounced in the hydrostatic TCLAPS simulation. The WRF fields are more noisy and show more small-scale variation compared to the smoother model fields of Nguyen et al. (2011) even though both models have 0.05° horizontal resolution. The reason might be the non-hydrostatic formulation of WRF or it might be that TCLAPS has more implicit diffusion, or possibly, a combination of both.
The general evolution of the vortex in WRF and TCLAPS is similar although the structure of the fields and the timing of the individual symmetric and asymmetric phases differ completely, as expected. The stepwise intensification in the two models is more distinct in TCLAPS, whereas in WRF the deepening of the vortex is more gradual. In contrast to the simulation of Nguyen et al. (2011), which had three intense phases in which the vortex deepened, the steps are shorter and smaller in the WRF simulation. Both models fail to reproduce the two distinct steps (in particular the second step from 36–48 h) in the best track (Fig. 2). Furthermore, in contrast to the PV in TCLAPS and and observations from Kossin and Eastin (2001) (using relative vorticity as a surrogate for the PV) the WRF simulation does not develop a monopolar PV maximum at the centre in any of the asymmetric phases (see Fig. 6). On the other hand a ring structure develops in all of the symmetric phases (see Fig.

Reif et al.: Vacillation cycles in WRF simulations of hurricane Katrina 131
Kain, J. S. and J. M. Fritsch. 1993. Convective Parameterisation for Me-soscale Models: The Kain- Fritsch Scheme. Meteor. Monogr. Amer. Meteor. Soc., 46, 165–70.
Kepert, J. D., 2005. Objective Analysis of Tropical Cyclone Location and Motion from High-Density Observations. Mon. Weather Rev., 133, 2406–21.
Knabb, R., J. Rhome, and D. Brown. 2006. Tropical Cyclone Report. hur-ricane Katrina. Tech. Rep., National Hurricane Center.
Kossin, J. and M. Eastin. 2001. Two Distinct Regimes in the Kinematic and Thermodynamic Structure of the Hurricane Eye and Eyewall. J. Atmos. Sci., 58, 1079–90.
Kossin, J. and W. Schubert. 2001. Mesovortices, Polygonal Flow Patterns, and Rapid Pressure Falls in Hurricane-Like Vortices. J. Atmos. Sci., 58, 2196–209.
Li, X. and Z. Pu. 2008. Sensitivity of Numerical Simulation of Early Rapid Intensification of Hurricane Emily (2005) to Cloud Microphysical and Planetary Boundary Layer Parameterisations. Mon. Wea. Rev., 136, 4819–38.
Mlawer, E. J., S. J. Taubman, P. D. Brown, M. J. Iacono, and S. A. Clough, 1997: Radiative Transfer for Inhomogeneous Atmospheres: RRTM, a Validated Correlated-K Model for the Longwave. J. Geophys. Res., 102, 16 663–82.
M¨oller, J. and M. Montgomery, 1999: Vortex Rossby Waves and Hurri-cane Intensification in a Barotropic Model. J. Atmos. Sci., 56, 1674– 87.
Montgomery, M. and R. Kallenbach. 1997. A Theory for Vortex Rossby-Waves and its Application to Spiral Bands and Intensity Changes in Hurricanes. Q. J. R. Meteorol. Soc., 123, 435–65.
Montgomery, M., M. Nicholls, T. Cram, and A. Saunders. 2006. A Vortical Hot Tower Route to Tropical Cyclogenesis. J. Atmos. Sci., 63, 355–86.
Montgomery, M. T. and R. K. Smith. 2014. Paradigms for Tropical-Cyclone Intensification. Aust. Meteor. Ocean. J., 64, 37–66.
Nguyen, C. M., M. J. Reeder, N. E. Davidson, R. K. Smith, and M. T. Mont-gomery. 2011. Inner-Core Vacillation Cycles during the Intensification of hurricane Katrina. Q. J. R. Meteorol. Soc., 137, 829–44.
Nolan, D. S., J. A. Zhang, and D. P. Stern. 2009. Evaluation of Planetary Boundary Layer Parameterisations in Tropical Cyclones by Compari-son of In Situ Observations and High-Resolution Simulations of Hur-ricane Isabel (2003). Part I: Initialization, Maximum Winds, and the Outer-Core Boundary Layer. Mon. Wea. Rev., 137, 3651–74.
Rogers, R., et al., 2013. NOAA’S Hurricane Intensity Forecasting Experi-ment: A Progress Report. Bull. Amer. Meteor. Soc., 94, 859–82.
Rotunno, R., Y. Chen,W.Wang, C. Davis, J. Dudhia, and G. J. Holland, 2009: Large-Eddy Simulation of an Idealized Tropical Cyclone. Bull. Amer. Meteor. Soc., 90, 1783–88.
Schubert, W., M. Montgomery, R. Taft, T. Guinn, S. Fulton, J. Kossin, and J. Edwards. 1999. Polygonal Eyewalls, Asymmetric Eye Contrac-tion, and Potential Vorticity Mixing in Hurricanes. J. Atmos. Sci., 56, 1197–223.
Skamarock, W. C. 2008. A Description of the Advanced Research WRF Ver-sion 3. Tech. Rep., NCAR.
than TCLAPS. In TCLAPS there are three distinct and intense vacillation cycles whereas in WRF there are four cycles of which each is individually weaker.
The breakdown of the PV to individual anomalies is associated with barotropic instability and convection. The combination of convection and barotropic instability results in the centreward propagation of low-level PV anomalies, which, in the process, stirs PV into the centre region in the asymmetric phases. This rearrangement of the PV field is responsible for a rapid fall in the central pressure. Although the transition to an asymmetric phase is a result of this instability it is not restricted to these transitions.
Further research could focus on the robustness of PV dynamics in vacillation cycles by simulating other real case or idealised tropical cyclones with a non-hydrostatic model at higher resolutions while comparing these results to measurements.
Acknowledgments
We are grateful to Jeff Kepert for providing his centre finding algorithm. As a part of a master’s thesis this work was supported by the Austrian Ministry of Science BMWF as part of the Uni Infrastrukturprogramm of the Focal Point Scientific Computing at the University of Innsbruck. The first author is grateful to the International Relations Office of the University of Innsbruck for financial support as well as to Alexander Gohm the local supervisor at the University of Innsbruck who refined the author’s master’s thesis with his sense for precision.
ReferencesCangialosi, J. P. and J. L. Franklin. 2012. 2012 National Hurricane Center
Forecast Verification Report, Tech. rep., National Hurricane Center, NOAA.
Chen, S.-H. and W.-Y. Sun. 2004. An Explicit One-Dimensional Time-De-pendent Tilting Cloud Model. J. Atmos. Sci., 61, 2797–816.
Chen, Y., G. Brunet, and M. Yau, 2003: Spiral Bands in a Simulated Hurri-cane. Part II: Wave Activity Diagnostics. J. Atmos. Sci., 60, 1239– 1256.
DeMaria, M. and J. Gross. 2003. Hurricane! Coping with Disaster, edited by Robert Simpson, Chapter 4: Evolution of Tropical Cyclone Forecast Models. American Geophysical Union.
Dudhia, J., 1989: Numerical Study of Convection Observed during the Winter Monsoon Experiment using a Mesoscale Two-Dimensional Model. J. Atmos. Sci., 46, 3077–107.
Fierro, A. O., R. F. Rogers, F. D. Marks, and D. S. Nolan. 2009. The Im-pact of Horizontal Grid Spacing on the Microphysical and Kinematic Structures of Strong Tropical Cyclones Simulated with the WRF-ARW Model. Mon. Weather Rev., 137, 3717–43.
Hankinson, M. C., M. J. Reeder, N. E. Davidson, and K. Puri. 2014. Vacilla-tion cycles in simulations of hurricane Katrina. Q. J. R. Meteorol. Soc.
Hendricks, E., M. Montgomery, and C. Davis. 2004. On the Role of ‘Vor-tical’ Hot Towers in Formation of Tropical Cyclone Diana (1984). J. Atmos. Sci., 61, 1209–32.
Holland, G. J., 1980: An Analytic Model of the Wind and Pressure Profiles in Hurricanes. Mon. Weather Rev., 108, 1212–18.
Hong, S.-Y., Y. Noh, and J. Dudhia. 2006. A New Vertical Diffusion Package with an Explicit Treatment of Entrainment Processes. Mon. Weather Rev., 134, 2318–41.
