vaers summary 09172021
TRANSCRIPT

VAERS Summary for COVID-19 Vaccines through 9/17/2021All charts and tables below reflect the data release on 9/24/2021 from the VAERS website, which includesU.S. and foreign data, and is updated through: 9/17/2021.
High-Level Summary COVID19vaccines(Dec’2020 -present)
All othervaccines1990-present
US Data OnlyCOVID19 vaccines(Dec’2020 -present)
US Data OnlyAll other vaccines1990-present
Number of Adverse Reactions 726,965 821,800 569,294 720,923
Number of Life-Threatening Events 16,056 13,609 8,606 9,712
Number of Hospitalizations 66,642 78,471 32,612 38,158
Number of Deaths 15,386* 9,104* 6,981 5,115
# of Permanent Disabilities aftervaccination
20,789 19,607 8,088 12,445
Number of Office Visits 114,126 43,187 106,281 41,874
# of Emergency Room/DepartmentVisits
82,798 209,732 71,490 200,771
# of Birth Defects after vaccination 475 139 311 89
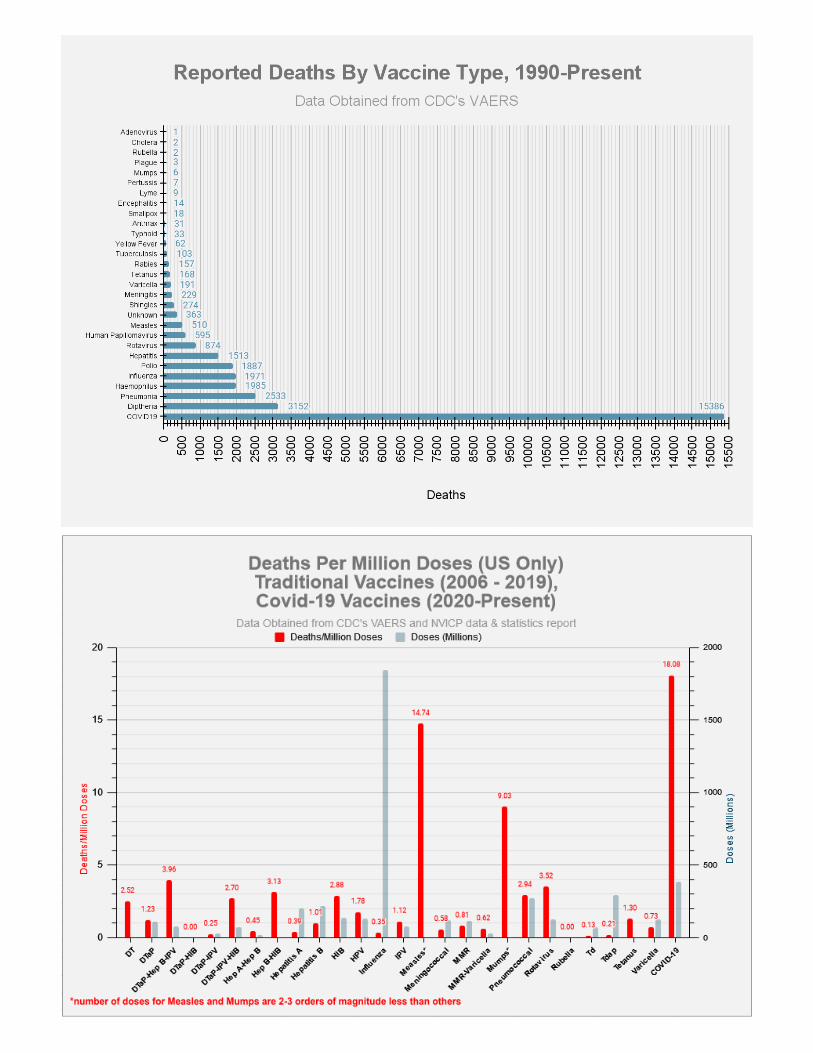
*Note that the total number of deaths associated with the COVID-19 vaccines is greater than the number of deaths associated with all othervaccines combined since the year 1990.
Deaths
[Note that the single counts before 2020-11-29 are due to incorrect date data in the VAERS system]
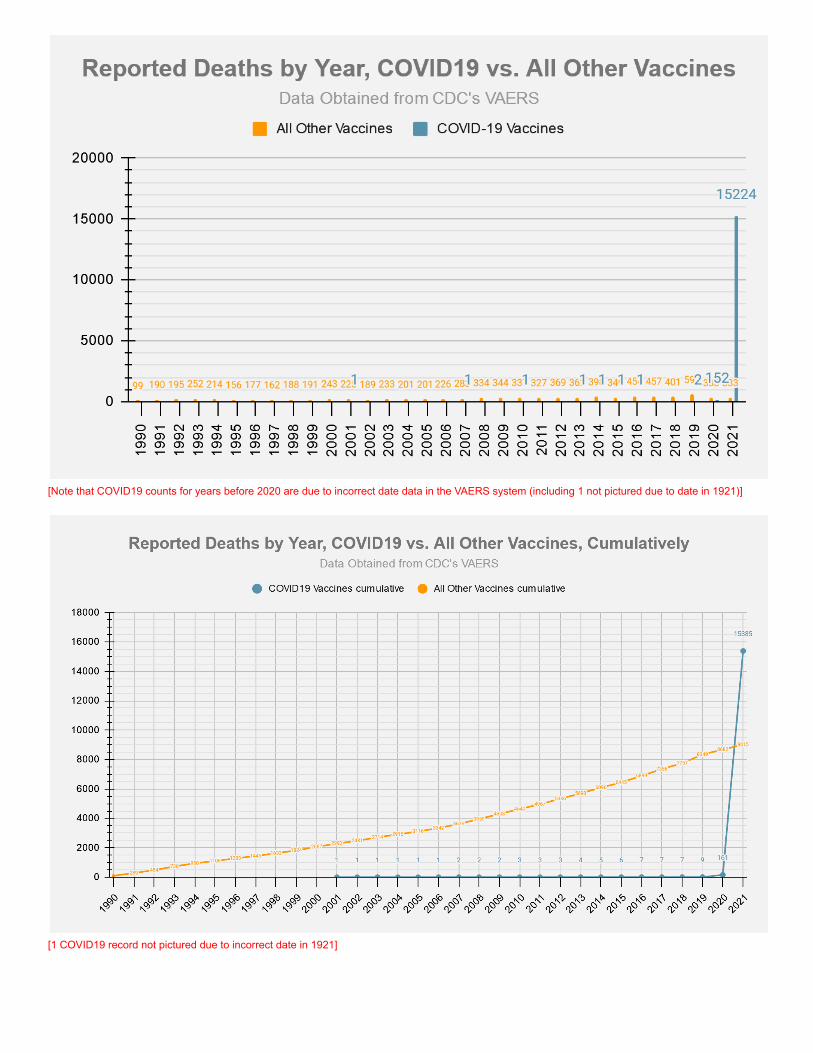
[Note that COVID19 counts for years before 2020 are due to incorrect date data in the VAERS system (including 1 not pictured due to date in 1921)]
[1 COVID19 record not pictured due to incorrect date in 1921]
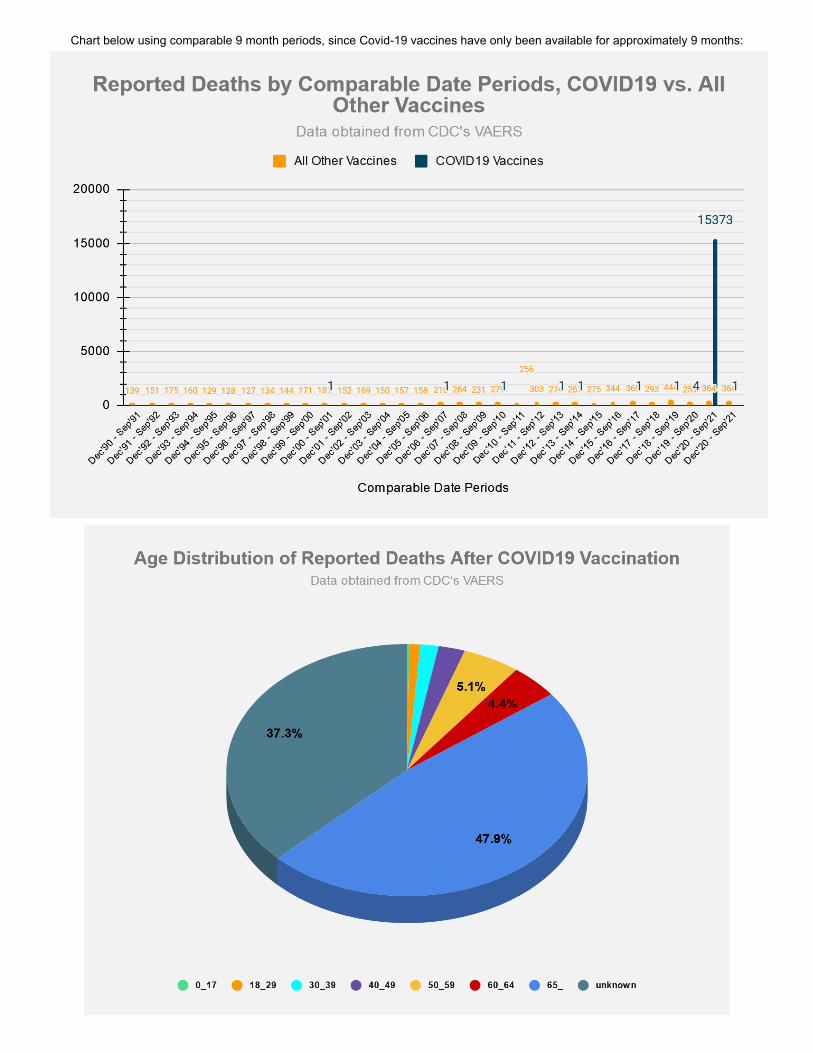
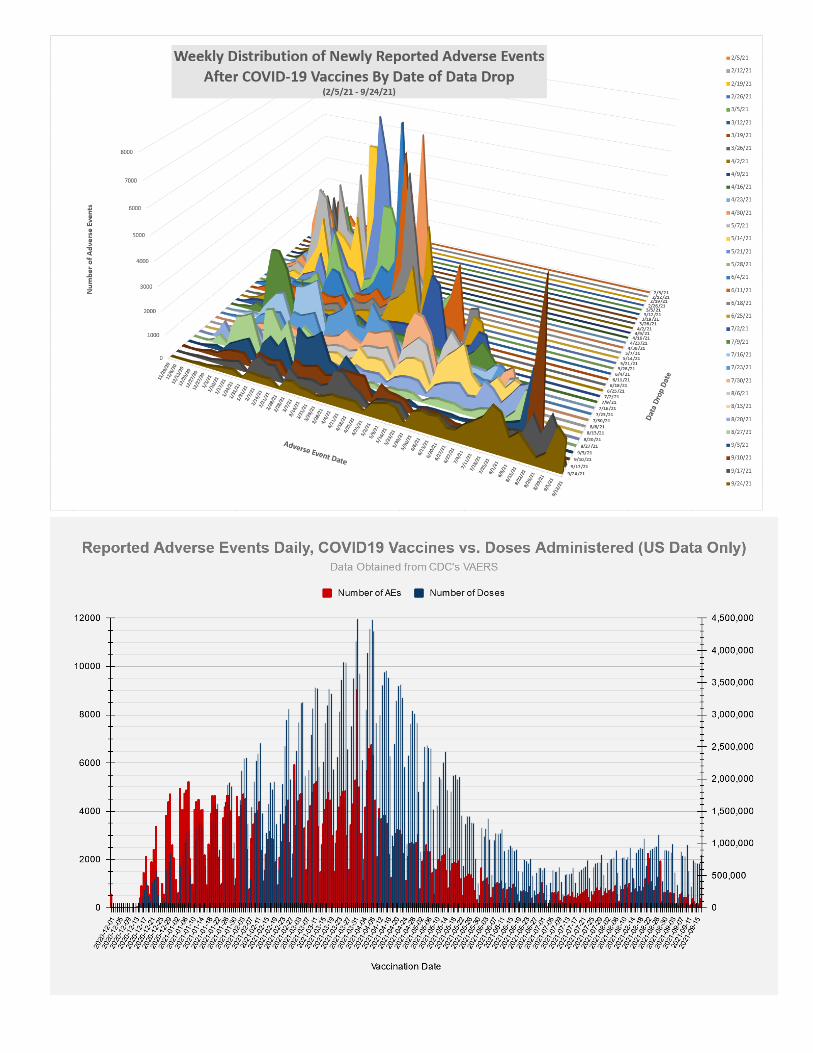
Chart below using comparable 9 month periods, since Covid-19 vaccines have only been available for approximately 9 months:

Adverse Events
[Note that 816 records for COVID19 were scattered throughout years earlier than 2020 due to incorrect date data in the VAERS system]
Chart below using comparable 9 month periods, since Covid-19 vaccines have only been available for approximately9 months:
[Note that 1670 records for COVID19 were scattered throughout periods earlier than Dec’20-Sep’21 due to incorrect date data in the VAERS system]

Symptoms
The slide below was taken from an FDA document from October 22, 2020 and provides a list of possible adverse eventoutcomes related to the Covid-19 vaccines.● Source: Vaccines and Related Biological Products Advisory Committee October 22, 2020 Meeting Presentation
The following table lists the number of adverse events found in the VAERS data which match the outcomes listed above:
FDA listed symptom Total (Non-Lethal) Adverse Events Total Deaths
Guillain-Barre 1129 24
Acute Disseminated Encephalomyelitis 79 3
Transverse Myelitis 234 0
Encephalitis 944 101
Convulsions/Seizures 8924 283
Stroke 8431 825
Narcolepsy, Cataplexy 169 3
Anaphylaxis 33166 135
Acute Myocardial Infarction (Heart Attack) 2327 794
Myocarditis/Pericarditis 5739 91
Autoimmune Disease 668 18
Other Acute Demyelinating Diseases 155 2
Pregnancy and birth outcomes (Miscarriages) 1959 54
Other Allergic Reactions 1366 1
Thrombocytopenia 2755 222
Disseminated Intravascular Coagulation 123 39
Venous Thromboembolism 12499 734
Arthritis and Arthralgia/Joint Pain 47957 138
Kawasaki Disease 29 1
Systemic Inflammatory Response Syndrome 394 25

Vaccination Related Risks of Covid-19 vs. Flu
These set of figures compare the COVID19 vaccine to the traditional Flu vaccines. ‘Risk of Death’ percentagesdepend on the ‘# of Vaccinations’ data, which is only approximate, and was pulled from the CDC’s report on Fluvaccination coverage for the 2019-2020 season, and from Our World in Data for the COVID19 vaccinations.
Covid19 vaccinations through 5/31/2021 vs. Flu vaccinations 7/1/2019 - 5/31/2020 (last complete flu season)
Vaccine Type # ofVaccinations[3]
# of Deaths Risk of Death Percentage Deaths/Mill.Vaccinations[3]
Flu 167,447,642[1] 31 1 in 5,401,537 0.000019% .19
COVID19 167,733,972[2] 5,382 1 in 31,165 0.003209% 32.09
Risk of dying from COVID vaccine is 173.3 times greater than Flu Vaccine
Vaccine Type # ofVaccinations[3]
# of AdverseReactions
Risk ofAdverseReaction
Percentage AEs/Mill.Vaccinations[3]
Flu 167,447,642 9,672 1 in 17,313 0.005776% 57.76
COVID19 167,733,972 494,583 1 in 339 0.2949% 2,949
Risk of adverse reaction from COVID vaccine is 51.0 times greater than Flu Vaccine
[1] number of flu vaccinations based on estimated flu vaccine coverage data from CDC and estimated population data from US Census. Yearly flu vaccination datacovers a period of time from 7/1 to 5/31 of the following year.[2] number of covid19 vaccinations based on estimates from Our World in Data[3] Persons vaccinated with at least one dose.
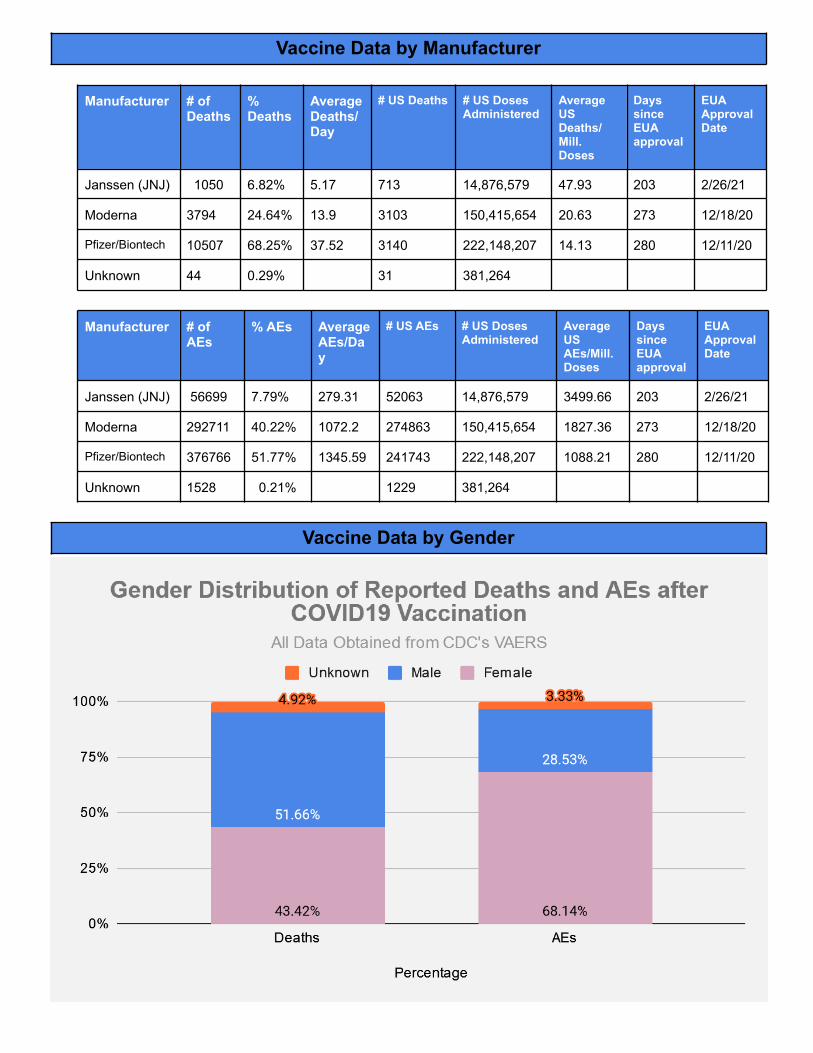
Vaccine Data by Manufacturer
Manufacturer # ofDeaths
%Deaths
AverageDeaths/Day
# US Deaths # US DosesAdministered
AverageUSDeaths/Mill.Doses
DayssinceEUAapproval
EUAApprovalDate
Janssen (JNJ) 1050 6.82% 5.17 713 14,876,579 47.93 203 2/26/21
Moderna 3794 24.64% 13.9 3103 150,415,654 20.63 273 12/18/20
Pfizer/Biontech 10507 68.25% 37.52 3140 222,148,207 14.13 280 12/11/20
Unknown 44 0.29% 31 381,264
Manufacturer # ofAEs
% AEs AverageAEs/Day
# US AEs # US DosesAdministered
AverageUSAEs/Mill.Doses
DayssinceEUAapproval
EUAApprovalDate
Janssen (JNJ) 56699 7.79% 279.31 52063 14,876,579 3499.66 203 2/26/21
Moderna 292711 40.22% 1072.2 274863 150,415,654 1827.36 273 12/18/20
Pfizer/Biontech 376766 51.77% 1345.59 241743 222,148,207 1088.21 280 12/11/20
Unknown 1528 0.21% 1229 381,264
Vaccine Data by Gender

Vaccine Data by Location

Sources
Visit: vaersanalysis.info for more information
1. Vaccine data (Covid-19 and other vaccines) taken from CDC’s VAERS website, located here:https://vaers.hhs.gov/data/datasets.html. VAERS data sets in the form of csv files are pulled downweekly and put into a database for reporting/analysis. Data files are available all the way back to 1990.
2. Number of doses distributed for other vaccines found in NVICP Data and Statistics report here:https://www.hrsa.gov/sites/default/files/hrsa/vaccine-compensation/data/data-statistics-report.pdf
3. Numbers for Covid-19 vaccines administered by manufacturer found here:https://covid.cdc.gov/covid-data-tracker/#vaccinations_vacc-total-admin-rate-total
4. Numbers for total Covid-19 vaccine doses administered found here:https://data.cdc.gov/Vaccinations/COVID-19-Vaccination-Trends-in-the-United-States-N/rh2h-3yt2
5. Numbers for Flu vaccine doses administered for 2019-2020 season found here:https://www.cdc.gov/flu/fluvaxview/coverage-1920estimates.htm