vaginal birth after cesarean: new insights · vaginal delivery and settings of higher-level care...
TRANSCRIPT

Evidence Report/Technology Assessment Number 191
Vaginal Birth After Cesarean: New Insights
Prepared for: Agency for Healthcare Research and Quality U.S. Department of Health and Human Services 540 Gaither Road Rockville, MD 20850 www.ahrq.gov
Contract No. 290-2007-10057-I
Prepared by Oregon Evidence-based Practice Center, Oregon Health & Science University, Portland, Oregon
Investigator Team Jeanne-Marie Guise, M.D., M.P.H. Karen Eden, Ph.D. Cathy Emeis, Ph.D., C.N.M. Mary Anna Denman, M.D. Nicole Marshall, M.D. Rongwei (Rochelle) Fu, Ph.D. Rosalind Janik, B.A. Peggy Nygren, M.A. Miranda Walker, M.A. Marian McDonagh, Pharm.D.
AHRQ Publication No. 10-E003March 2010
This information is based on research conducted by the Oregon Evidence-based Practice Center (EPC) under contract to the Agency for Healthcare Research and Quality (AHRQ), Rockville, MD (Contract No. 290-2007-10057-I). The findings and conclusions in this document are those of the authors, who are responsible for its content, and do not necessarily represent the views of AHRQ. No statement in this report should be construed as an official position of AHRQ or of the U.S. Department of Health and Human Services. The information in this report is intended to help clinicians, employers, policymakers, and other make informed decisions about the provision of health care services. This report is intended as a reference and not as a substitute for clinical judgment. This report may be used, in whole or in part, as the basis for development of clinical practice guidelines and other quality enhancement tools, or a basis for reimbursement and coverage policies. AHRQ or U.S. Department of Health and Human Services endorsement of such derivative products may not be stated or implied.
This document is in the public domain and may be used and reprinted without permission except those copyrighted materials noted for which further reproduction is prohibited without the specific permission of copyright holders.
Suggested Citation: Guise J-M, Eden K, Emeis C, Denman MA, Marshall N, Fu R, Janik R, Nygren P, Walker M, McDonagh M. Vaginal Birth After Cesarean: New Insights. Evidence Report/Technology Assessment No.191. (Prepared by the Oregon Health & Science University Evidence-based Practice Center under Contract No. 290-2007-10057-I). AHRQ Publication No. 10-E003. Rockville, MD: Agency for Healthcare Research and Quality. March 2010.
No investigators have any affiliations or financial involvement (e.g., employment, consultancies, honoraria, stock options, expert testimony, grants or patents received or pending, or royalties) that conflict with material presented in this report.
ii

Preface The Agency for Healthcare Research and Quality (AHRQ), through its Evidence-Based Practice Centers (EPCs), sponsors the development of evidence reports and technology assessments to assist public- and private-sector organizations in their efforts to improve the quality of health care in the United States. This report was requested by the NIH Office of Medical Applications of Research as a background paper for the Consensus Development Conference on Vaginal Birth After Cesarean – New Insights. The reports and assessments provide organizations with comprehensive, science-based information on common, costly medical conditions, and new health care technologies. The EPCs systematically review the relevant scientific literature on topics assigned to them by AHRQ and conduct additional analyses when appropriate prior to developing their reports and assessments. To bring the broadest range of experts into the development of evidence reports and health technology assessments, AHRQ encourages the EPCs to form partnerships and enter into collaborations with other medical and research organizations. The EPCs work with these partner organizations to ensure that the evidence reports and technology assessments they produce will become building blocks for health care quality improvement projects throughout the Nation. The reports undergo peer review prior to their release. AHRQ expects that the EPC evidence reports and technology assessments will inform individual health plans, providers, and purchasers as well as the health care system as a whole by providing important information to help improve health care quality. We welcome written comments on this evidence report. They may be sent to the Task Order Officer named below at: Agency for Healthcare Research and Quality, 540 Gaither Road, Rockville, MD 20850, or by email to [email protected].
Carolyn M. Clancy, M.D. Jean Slutsky, P.A., M.S.P.H. Director Director, Center for Outcomes and Evidence Agency for Healthcare Research and Quality Agency for Healthcare Research and Quality
Beth A. Collins Sharp, R.N., Ph.D. Shilpa Amin, M.D., M.B.sc, FAAFP Director, EPC Program EPC Program Task Order Officer Agency for Healthcare Research and Quality Agency for Healthcare Research and Quality
Jennifer Croswell, M.D., M.P.H. Acting Director Office of Medical Applications of Research National Institutes of Health
iii

Acknowledgments This systematic evidence review was developed for the National Institutes of Health Consensus Development Conference on Vaginal Birth After Cesarean: New Insights. It was supported by the Office of Medical Applications of Research (OMAR) at the National Institutes of Health and the Agency for Healthcare Research and Quality (AHRQ) and the investigators acknowledge the contributions of Shilpa Amin, M.D., M.B.sc, FAAFP, Task Order Officer, AHRQ; Lata Nerurkar, Ph.D., OMAR, Jennifer Croswell, M.D., M.P.H, OMAR; and Gary Cunningham, M.D., Chair of the Consensus Development Conference Panel. Investigators thank the Technical Expert Panel members for providing guidance for the project, the peer reviewers for providing feedback on the draft report, Andrew Hamilton, M.L.S., M.S., for conducting the literature searches; and Benjamin Chan, M.S., for providing statistical assistance; Abby Parsons, M.D., for providing abstract and paper review assistance; JoDee Anderson, M.D. for assistance on neonatal outcomes; and Alia Broman for data abstraction assistance.
iv
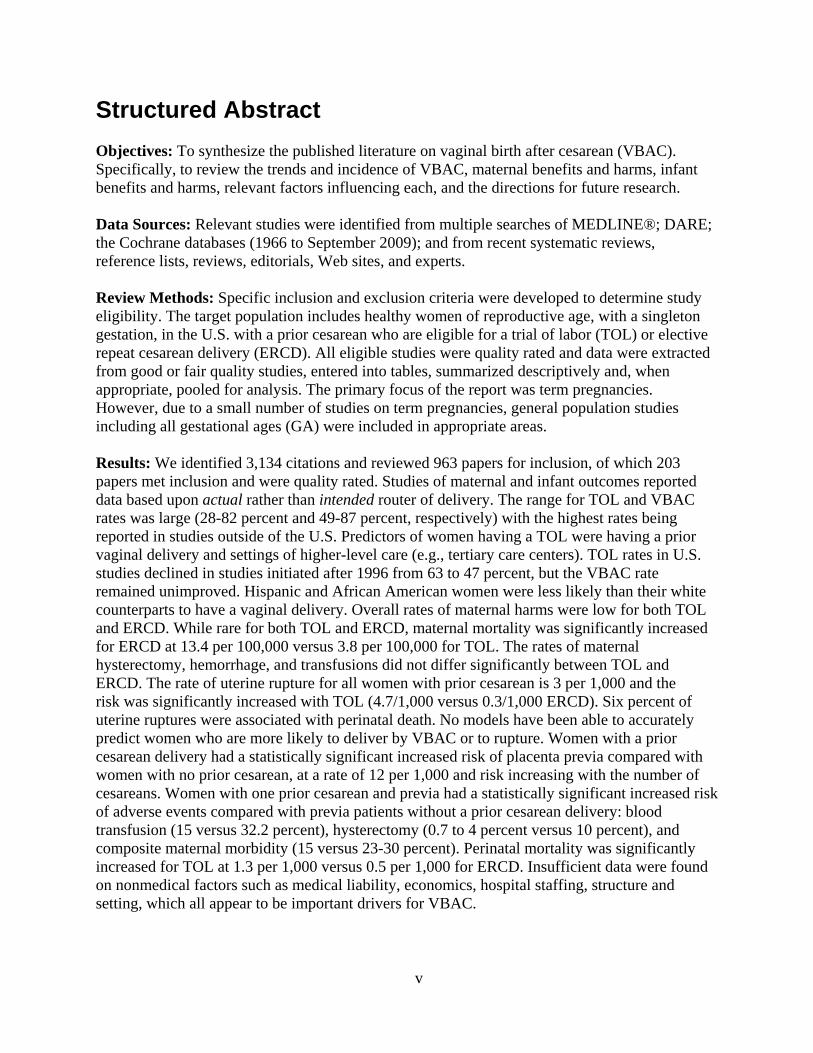
Structured Abstract Objectives: To synthesize the published literature on vaginal birth after cesarean (VBAC). Specifically, to review the trends and incidence of VBAC, maternal benefits and harms, infant benefits and harms, relevant factors influencing each, and the directions for future research. Data Sources: Relevant studies were identified from multiple searches of MEDLINE®; DARE; the Cochrane databases (1966 to September 2009); and from recent systematic reviews, reference lists, reviews, editorials, Web sites, and experts. Review Methods: Specific inclusion and exclusion criteria were developed to determine study eligibility. The target population includes healthy women of reproductive age, with a singleton gestation, in the U.S. with a prior cesarean who are eligible for a trial of labor (TOL) or elective repeat cesarean delivery (ERCD). All eligible studies were quality rated and data were extracted from good or fair quality studies, entered into tables, summarized descriptively and, when appropriate, pooled for analysis. The primary focus of the report was term pregnancies. However, due to a small number of studies on term pregnancies, general population studies including all gestational ages (GA) were included in appropriate areas. Results: We identified 3,134 citations and reviewed 963 papers for inclusion, of which 203 papers met inclusion and were quality rated. Studies of maternal and infant outcomes reported data based upon actual rather than intended router of delivery. The range for TOL and VBAC rates was large (28-82 percent and 49-87 percent, respectively) with the highest rates being reported in studies outside of the U.S. Predictors of women having a TOL were having a prior vaginal delivery and settings of higher-level care (e.g., tertiary care centers). TOL rates in U.S. studies declined in studies initiated after 1996 from 63 to 47 percent, but the VBAC rate remained unimproved. Hispanic and African American women were less likely than their white counterparts to have a vaginal delivery. Overall rates of maternal harms were low for both TOL and ERCD. While rare for both TOL and ERCD, maternal mortality was significantly increased for ERCD at 13.4 per 100,000 versus 3.8 per 100,000 for TOL. The rates of maternal hysterectomy, hemorrhage, and transfusions did not differ significantly between TOL and ERCD. The rate of uterine rupture for all women with prior cesarean is 3 per 1,000 and the risk was significantly increased with TOL (4.7/1,000 versus 0.3/1,000 ERCD). Six percent of uterine ruptures were associated with perinatal death. No models have been able to accurately predict women who are more likely to deliver by VBAC or to rupture. Women with a prior cesarean delivery had a statistically significant increased risk of placenta previa compared with women with no prior cesarean, at a rate of 12 per 1,000 and risk increasing with the number of cesareans. Women with one prior cesarean and previa had a statistically significant increased risk of adverse events compared with previa patients without a prior cesarean delivery: blood transfusion (15 versus 32.2 percent), hysterectomy (0.7 to 4 percent versus 10 percent), and composite maternal morbidity (15 versus 23-30 percent). Perinatal mortality was significantly increased for TOL at 1.3 per 1,000 versus 0.5 per 1,000 for ERCD. Insufficient data were found on nonmedical factors such as medical liability, economics, hospital staffing, structure and setting, which all appear to be important drivers for VBAC.
v

Conclusions: Each year 1.5 million childbearing women have cesarean deliveries, and this population continues to increase. This report adds stronger evidence that VBAC is a reasonable and safe choice for the majority of women with prior cesarean. Moreover, there is emerging evidence of serious harms relating to multiple cesareans. Relatively unexamined contextual factors such as medical liability, economics, hospital structure, and staffing may need to be addressed to prioritize VBAC services. There is still no evidence to inform patients, clinicians, or policy-makers about the outcomes of intended route of delivery because the evidence is based largely on the actual route of delivery. This inception cohort is the equivalent of intention to treat for randomized controlled trials and this gap in information is critical. A list of future research considerations as prioritized by national experts is also highlighted in this report.
vi
Contents Executive Summary ......................................................................................................................1
Evidence Report ..........................................................................................................................9
Chapter 1. Introduction ...............................................................................................................11
What are the rates and patterns of utilization of trial of labor after prior cesarean,
What are the nonmedical factors (provider type, hospital type, etc) that influence the
Structure of Report and Key Questions ................................................................................13 Background Questions ....................................................................................................13 Key Questions.................................................................................................................13
Introduction...........................................................................................................................13 Background...........................................................................................................................14
vaginal birth after cesarean, and repeat cesarean delivery in the United States? ...........14
patterns of utilization of trial of labor after prior cesarean? ........................................17
Chapter 2. Methods.....................................................................................................................21 Topic Development...............................................................................................................21
Analytic Framework and Key Questions........................................................................21 Technical Expert Panel and Expert Reviewers...............................................................23
Literature Search and Strategy..............................................................................................23 Inclusion and Exclusion Criteria...........................................................................................23
General............................................................................................................................24 Key Question 1 ...............................................................................................................24 Key Question 2 ...............................................................................................................25 Key Question 3 ...............................................................................................................25 Key Question 4 ...............................................................................................................26 Special Considerations....................................................................................................26
Data Extraction and Synthesis ..............................................................................................27 Quality Rating of Individual Studies ..............................................................................27 Development of Evidence Tables and Data Abstraction Process...................................27
Strength of Available Evidence ......................................................................................28 Data Synthesis.................................................................................................................29
Size of Literature...................................................................................................................30
Chapter 3. Results .......................................................................................................................33 Among women who attempt a trial of labor after prior cesarean, what is the vaginal delivery
rate and the factors that influence it? .................................................................................33 Trial of Labor Rate..........................................................................................................33 Predictors of Trial of Labor ............................................................................................36 Vaginal Birth After Cesarean Rate .................................................................................36
Induction of Labor ..........................................................................................................36 Predictors of Vaginal Birth After Cesarean ....................................................................44 Screening Tools for Predicting Vaginal Birth After Cesarean .......................................46
vii
What are the short- and long-term benefits and harms to the mother of attempting trial of labor after prior cesarean versus elective repeat cesarean delivery, and what factors influence benefits and harms?............................................................................................47
Maternal Death................................................................................................................47 Uterine Rupture...............................................................................................................51
Hysterectomy ..................................................................................................................73 Transfusions/Hemorrhage...............................................................................................77
Infection ..........................................................................................................................84 Surgical Injury ................................................................................................................84 Hospital Stay...................................................................................................................88 Pelvic Floor.....................................................................................................................89 Deep Vein Thrombosis ...................................................................................................89 Special Considerations....................................................................................................90
Adhesions......................................................................................................................116 Reproductive Health .....................................................................................................116
What are the short- and long-term benefits and harms to the baby of maternal attempt at trial of labor after prior cesarean versus elective repeat cesarean delivery, and what factors influence benefits and harms?..........................................................................................117
Perinatal Mortality ........................................................................................................117 Infant Morbidity............................................................................................................127
Sepsis ............................................................................................................................132 Birth Trauma.................................................................................................................132 Apgar Scores.................................................................................................................133 Neonatal Intensive Care Unit Admissions....................................................................133
Breastfeeding ................................................................................................................138 Impact of Mode of Delivery on Subsequent Babies .....................................................138
Neurological Development ...........................................................................................139 Special Considerations..................................................................................................139
Chapter 4. Discussion ...............................................................................................................143 What are the critical gaps in the evidence for decision-making, and what are the priority
investigations needed to address these gaps?...................................................................151 National Childbirth Study ................................................................................................151 Prediction Tools ...............................................................................................................152 Maternal Health Outcomes ..............................................................................................152 Infant Health Outcomes ...................................................................................................153 Cost ..................................................................................................................................153
References and Included Studies ..............................................................................................157
Acronyms/Abbreviations ..........................................................................................................169
viii
Tables Table 1 Reasons behind women’s decisions for repeat cesarean delivery ...............................17 Table 2 Vaginal birth after cesarean rates by types of induction..............................................37 Table 3 Vaginal birth after cesarean and proportion with augmented labor in women
induced with prostaglandin E2 .....................................................................................39 Table 4 Vaginal birth after cesarean rate with oxytocin used for induction versus
augmentation................................................................................................................42 Table 5 Most commonly reported indications and pooled proportions ....................................43 Table 6 Uterine rupture: trial of labor versus elective repeat cesarean delivery among any
gestational age studies..................................................................................................51 Table 7 Characteristics of uterine rupture studies of trial of labor and elective repeat cesarean delivery..........................................................................................................54 Table 8 Rupture associated morbidity ......................................................................................56 Table 9 Effect of oxytocin augmentation on rate of uterine rupture in women receiving
prostaglandin E2 for induction .....................................................................................65 Table 10 The odds of uterine rupture after cesarean delivery by factor .....................................68 Table 11 Lower uterine segment thickness and uterine defect ...................................................71 Table 12 Hysterectomy rates of trial of labor versus elective repeat cesarean delivery.............75 Table 13 Surgical injury rates for trial of labor versus elective repeat cesarean delivery among
any gestational studies .................................................................................................86 Table 14 Abruption based on number of prior cesarean deliveries ............................................91 Table 15 Blood transfusion by number of prior cesarean deliveries ..........................................92 Table 16 Overall incidence of placenta previa............................................................................92 Table 17 Incidence of placenta previa by number of prior cesarean deliveries..........................93 Table 18 Incidence of hysterectomy in women with previa by number of prior cesarean
deliveries ......................................................................................................................97 Table 19 Overall incidence of placenta accreta ..........................................................................97 Table 20 Incidence of placenta accreta by number of prior cesarean deliveries ........................98 Table 21 Incidence of placenta accreta with placenta previa by number of prior cesarean
deliveries ......................................................................................................................99 Table 22 Multiple cesarean deliveries effect on rates of hemorrhage ......................................101 Table 23 Multiple cesarean deliveries effect on rates of adhesions..........................................102 Table 24 Multiple cesarean deliveries effect on rates of surgical injury ..................................103 Table 25 Multiple cesarean deliveries effect on rates of perioperative infection .....................103 Table 26 Multiple cesarean deliveries effect on rates of wound complications .......................104 Table 27 Multiple cesarean deliveries effect on rates of hysterectomy....................................105 Table 28 Impact of direction of scar .........................................................................................107 Table 29 Vaginal birth after cesarean rate in studies with data by body mass index ...............111 Table 30 Summary of findings on maternal and infant health outcomes for trial of labor and
body mass index.........................................................................................................114 Table 31 Perinatal mortality rate (20 weeks or greater gestation to 7 days of life) among any
gestational age studies ...............................................................................................119 Table 32 Fetal mortality rate (20 weeks or greater gestation and before birth) among term
studies ........................................................................................................................122 Table 33 Neonatal mortality rate (death occurring in the first 28 days of life) among term
studies ........................................................................................................................124
ix
Table 34 Comparison of cohort studies reporting respiratory morbidity in infants among term studies ................................................................................................................128 Table 35 Neonatal intensive care unit admissions among term studies....................................136 Table 36 Summary of evidence for key questions....................................................................146 Table 37 Future research...........................................................................................................154
Figures Figure 1 Rates of vaginal birth after cesarean (VBAC rate), total cesarean deliveries (CD rate), primary cesarean deliveries (Primary CD), and repeat cesarean delivery (RCD) .........................12
Figure 11 Uterine rupture among studies including both trial of labor and elective repeat
Figure 21 Transfusion rates for trial of labor versus elective repeat cesarean among all studies78 Figure 22 Transfusion rates for trial of labor versus elective repeat cesarean delivery among
Figure 23 Rates of infection for trial of labor versus elective repeat cesarean delivery among all
Figure 24 Rates of fever for trial of labor versus elective repeat cesarean delivery among all
Figure 25 Length of stay for trial of labor versus elective repeat cesarean delivery among any
Figure 26 Incidence of placenta previa by number of prior cesarean deliveries among any
Figure 27 Perinatal mortality rate for trial of labor versus elective repeat cesarean delivery
Figure 28 Neonatal mortality rate for trial of labor versus elective repeat cesarean delivery
Figure 2 Cesarean delivery by country - percent for live births (2007) .....................................15 Figure 3 Vaginal birth after cesarean rates by state for 2006.....................................................16 Figure 4 Analytic Framework ....................................................................................................22 Figure 5 Search and Selection of Literature...............................................................................31 Figure 6 Trial of labor in studies conducted in the U.S. and outside the U.S ............................34 Figure 7 Global trial of labor rates have dropped over time ......................................................35 Figure 8 Vaginal birth after cesarean rates with oxytocin induction .........................................41 Figure 9 Rates of maternal death for trial of labor among all studies ........................................49 Figure 10 Rates of maternal death for elective repeat cesarean delivery among all studies........50
cesarean delivery............................................................................................................................53 Figure 12 Uterine rupture among all trial of labor studies ...........................................................55 Figure 13 Risk for perinatal death given uterine rupture .............................................................57 Figure 14 Uterine rupture with induction of a trial of labor.........................................................59 Figure 15 Risk of rupture: induction versus spontaneous labor...................................................60 Figure 16 Uterine rupture with prostaglandin E2 induction .........................................................62 Figure 17 Uterine rupture with oxytocin......................................................................................64 Figure 18 Risk of uterine rupture with any induction method .....................................................67 Figure 19 Hysterectomy occurrence for trial of labor..................................................................76 Figure 20 Hysterectomy occurrence for elective repeat cesarean delivery..................................77
term studies ....................................................................................................................................79
studies ......................................................................................................................................82
studies ......................................................................................................................................84
gestational age studies....................................................................................................................89
gestational age studies....................................................................................................................96
among any gestational age studies...............................................................................................120
among term studies ......................................................................................................................128 Figure 29 Need for bag-and-mask resuscitation among term studies ........................................129
x

Figure 30 Rates of transient tachypnea of the newborn for trial of labor versus elective repeat cesarean delivery among term studies .........................................................................................130
Appendixes Appendix A Technical Expert Members Appendix B Expert Reviewers Appendix C Search Strategies Appendix D List of Developed Countries Appendix E Inclusion and Exclusion Criteria Appendix F Excluded Studies List Appendix G List of Citations From the Maternal-Fetal Medicine Units Network Appendix H Quality Rating Criteria Appendix I Individual Quality Rating Tables Appendix J Strength of Evidence Table Appendix K Detailed Evaluation of Predictors of Trial of Labor and Vaginal Birth After
Cesarean Appendix L Detailed Evaluation of Vaginal Birth After Cesarean Rates Appendix M Induction of Labor Additional Figures Appendix N Detailed Evaluation of Screening Tools for Predicting Vaginal Birth After
Cesarean Appendix O Detailed Maternal Mortality Table Appendix P Predictive Tools of Uterine Rupture Table Appendix Q Detailed Transfuion/Hemorrhage Table Appendix R Detailed Infection Table Appendix S Detailed Hopsital Stay Table
Appendixes and evidence tables cited in this report are available at http://www.ahrq.gov/downloads/pub/evidence/pdf/vbacup/vbacup.pdf.
xi
Executive Summary Introduction
Despite the Healthy People 2010 national goal1 to reduce the cesarean delivery rate to 15 percent of births each year, this century has set record rates of cesarean deliveries. When the national rate of cesarean delivery was first measured in 1965, it was 4.5 percent,2 in 2007, almost one in three women in the United States (U.S.) delivered by cesarean (32.8 percent cesarean delivery rate in 2007). With almost 1.5 million cesarean surgeries performed every year, cesarean is the most common surgical procedure in the U.S. Vaginal birth after cesarean (VBAC) emerged from the 1980 National Institutes of Health (NIH) Consensus Conference on Cesarean as a mechanism to safely reduce the cesarean delivery rate.3 VBAC proved to be an effective contributor to reduce the use of cesarean through the early 1990s. From 1990 through 1996, the VBAC rate rose from 19.9 to 28.3 percent and the cesarean rate declined from 22.7 to 20.7 percent.4 Since 1996, VBAC rates have declined sharply, to the point where over 90 percent of women with a prior cesarean will deliver by repeat cesarean. While primary cesarean accounts for the largest number of cesarean deliveries, the largest single indication for cesarean is prior cesarean accounting for 534,180 cesareans each year, thus the safety of VBAC remains important.1 The degree to which cesarean deliveries and VBACs are improving or adversely affecting health remains a subject of continued controversy and uncertainty. This systematic review was conducted to inform the 2010 NIH Consensus Development Conference to evaluate emerging issues relating to VBAC.
Key Questions The key questions reviewed in this report were assigned by the Agency for Healthcare
Research and Quality. Questions were based on deliberations of the planning committee for the National Institutes of Health Consensus Development Conference on Vaginal Birth After Cesarean: New Insights convened by the National Institutes of Health’s Office of Medical Applications of Research and further refined by a technical expert panel during the evidence report process. Ultimately, four key questions were reviewed for this report:
1. Among women who attempt a trial of labor after prior cesarean, what is the vaginal delivery rate and the factors that influence it?
2. What are the short- and long-term benefits and harms to the mother of attempting trial of labor after prior cesarean versus elective repeat cesarean delivery, and what factors influence benefits and harms?
3. What are the short- and long-term benefits and harms to the baby of maternal attempt at trial of labor after prior cesarean versus elective repeat cesarean delivery, and what factors influence benefits and harms?
4. What are the critical gaps in the evidence for decision-making, and what are the priority investigations needed to address these gaps?
Methods Relevant studies were identified from multiple searches of MEDLINE®; DARE; the
Cochrane databases (1966 to September 2009); and from recent systematic reviews, reference lists, reviews, editorials, Web sites, and experts. Retrieved abstracts were entered into an electronic database (EndNote®).
1

Of the 3,134 citations reviewed from the searches, 2,171 met exclusion criteria at the abstract level and were not reviewed further. After the abstract review process, 963 full-text papers were retrieved and reviewed for inclusion. An additional 37 full-text papers were retrieved from peer review. A total of 203 full-text papers met inclusion after applying paper inclusion/exclusion criteria. Investigators quality rated included studies, and those rated good or fair quality are discussed in this report. For the topics presented, 71 studies provided data on trial of labor (TOL) and VBAC rate, 27 on induction of labor (IOL) or augmentation, 28 on predictors of TOL and VBAC, 14 on scored models for predicting VBAC, 41 on maternal outcomes, 11 on infant outcomes, 28 on uterine rupture, 19 on abnormal placentation, seven on obesity, 12 on multiple cesarean deliveries, and seven on direction of cesarean delivery scar.
Results Among women who attempt a trial of labor after prior cesarean, what is the vaginal delivery rate and the factors that influence it?
Who attempts a trial of labor? The rates of TOL are highly variable, ranging from 28 to 70 percent with an overall rate of 58 percent in the U.S. The evidence is largely limited to large tertiary teaching hospitals. TOL rates have declined, particularly after 1996, both inside and outside of the U.S. In the U.S. studies that initiated enrollment after 1996, less than half (47 percent) of women had a TOL. TOL is more likely in hospitals with higher delivery volumes, tertiary care centers, and teaching hospitals. Women with a prior vaginal delivery or non-white women were more likely to have a TOL (odds ratio 1.51 to 6.67 and odds ratio 3.5, respectively).
What is the vaginal delivery rate? In 43 U.S. based studies, 74 percent of women who had a TOL delivered vaginally. While TOL rates reported in observational studies have dropped over time, VBAC rates have remained constant for the women who have a TOL.
What are the factors that influence the vaginal delivery rate? All scored predictive models provide reasonable ability to identify women who are good candidates for VBAC, but none have discriminating ability to consistently identify women who are at risk for cesarean delivery.
Antepartum factors Prior vaginal delivery: A prior history of vaginal delivery was consistently reported to
increase likelihood of VBAC approximately three fold (range odds ratio 1.83 to 28). Among women requiring induction of labor, limited evidence also suggests a higher rate of VBAC among those with prior vaginal delivery (OR 6.8; 95 percent CI: 3.04 to 13.9).
Indication for prior cesarean: Women with prior cesarean delivery for malpresentation/breech were more likely to have a VBAC (75 percent, range 60 to 86 percent) compared with women with prior cesarean delivery for fetal distress (60 percent, range 49 to 69 percent) or failure to progress/cephalopelvic disproportion (54 percent, range 48 to 60 percent).
Race: Hispanic and African American women were more likely to have a TOL but less likely to have a VBAC compared with non-Hispanic and white women, respectively (20 to 49 percent).
Location: Women at rural and private hospitals had a decreased likelihood of TOL and a decreased likelihood of VBAC (57 percent versus 66 percent for tertiary care centers).
Macrosomia: There was decreased likelihood of VBAC in infants weighing 4,000 grams or greater (odds ratio 0.62; 95 percent CI: 0.54 to 0.71). Infants weighing 4,500 grams or greater were less likely to be delivered via VBAC (1.3 to 5.8 percent) compared with 4,000 to 4,499g infants (11.6 to 17.4 percent).
2
Body mass index: VBAC rates ranged from 68 to 77 percent in the studies of obese women. Women with a body mass index (BMI) of less than 40 had VBAC rates of 52.1 to 70 percent.
Intrapartum factors Progress of labor: A greater progress of labor--as determined by more advanced dilation,
lower station, and higher Bishop score--predicted a higher likelihood of VBAC. Epidural: The effect of epidural use on the likelihood of VBAC is uncertain. Augmentation: Augmentation of labor with oxytocin was associated with a rate of 68 percent
VBAC, although the strength of this evidence was low. Induction: Sixty-three percent of women with IOL had a VBAC (PGE2=63 percent,
oxytocin=62 percent, misoprostol=61 percent). Fifty-four percent of women induced with a Foley Catheter had a VBAC. What are the short- and long-term benefits and harms to the mother of attempting trial of labor after prior cesarean versus elective repeat cesarean delivery, and what factors influence benefits and harms?
What are the short-term benefits and harms to the mother of TOL versus elective repeat cesarean delivery (ERCD)?
Maternal death. While maternal mortality is rare, with an overall rate of 10.1 per 100,000 for all women with prior cesarean, the risk of maternal mortality is significantly increased with ERCD (3.8 per 100,000 for TOL versus 13.4 per 100,000 ERCD). When limited to term studies, the maternal mortality was 1.9 per 100,000 for TOL and 9.6 per 100,000 for ERCD.
Hysterectomy. Hysterectomy was rare, occurring in less than three percent of all women with prior cesarean. There was no significant difference between the TOL and ERCD with respect to hysterectomy among all studies or when studies were limited to term populations; however hysterectomy was more common among women undergoing ERCD among studies that were open to all gestational ages (GAs).
Transfusion/hemorrhage. When limited to term studies, the rate of transfusion for TOL was 6.6 per 1,000 (95 percent CI: 2.0 to 22.1 per 1,000) and for ERCD was 4.6 per 1,000 (95 percent CI: 1.6 to 13.2 per 1,000). In term patients, TOL is associated with increased risk of transfusion. When all GAs are evaluated, there is an increased risk of transfusion with ERCD, suggesting a risk-modifying effect of preterm delivery on risk of transfusion. In low risk ERCD, there was a statistically significant increase in transfusion with TOL compared with ERCD prior to labor. Spontaneous labor may be protective against hemorrhage, but data are inconsistent.
Infection. For any GA cohorts, the risk for any infection with TOL was 46 per 1,000 (95 percent CI: 15 to 135 per 1,000) and for ERCD was 32 per 1,000 (95 percent CI: 13 to 73 per 1,000). The rate for fever with TOL was 65 per 1,000 (95 percent CI: 44 to 93 per 1,000) and for ERCD was 72 per 1,000 (95 percent CI: 25 to 189 per 1,000). Studies that did not report TOL outcome (VBAC or repeat cesarean delivery [RCD] after a TOL) tend to report increased febrile morbidity associated with TOL. Cesarean delivery, either ERCD or RCD after a TOL, appears to have a higher incidence of any febrile morbidity compared with VBAC but definitive studies are lacking. A trend toward increased endometritis was seen with ERCD compared with TOL; in contrast, chorioamnionitis was increased in TOL compared with ERCD. Increasing BMI was associated with increased fever in patients undergoing TOL.
Surgical injury. Rate of surgical injury may be increased with TOL, but definitive studies are lacking. Vertical skin incision increases risk of surgical injury to the bladder.
3
Length of stay. Elective repeat cesarean delivery is associated with a longer hospital stay compared with TOL. The mean length of stay for TOL was 2.55 days (95 percent CI: 2.34 to 2.76 days) compared with 3.92 days (95 percent CI: 3.56 to 4.29) for ERCD.
Uterine rupture. The risk of uterine rupture for all women with a prior cesarean delivery regardless of route of delivery is 0.3 percent (95 percent CI: 0.2 to 0.4 percent). The risk of uterine rupture for women undergoing a TOL is significantly elevated at 0.47 percent (95 percent CI: 0.28 to 0.77 percent); compared with women undergoing an ERCD (0.026 percent; 95 percent CI: 0.009 to 0.082 percent).
Maternal morbidity. To date, there have been no maternal deaths reported because of uterine rupture. The risk of hysterectomy due to uterine rupture ranged from 14 to 33 percent.
Neonatal morbidity. The overall risk of perinatal death due to uterine rupture was 6.2 percent. The two studies of women delivering at term that reported perinatal death rates report that 0 to 2.8 percent of all uterine ruptures resulted in a perinatal death. Overall, the literature relating to response time between premonitory signs of uterine rupture and perinatal mortality are insufficient. However, there is suggestion that fetal bradycardia is an ominous sign for fetal extrusion, which is associated with poor perinatal outcomes, and prompt delivery in this setting is warranted.
What factors influence the incidence of uterine rupture? Direction of scar. Women with a prior classical incision are at increased risk of uterine
dehiscence/rupture. Compared with women with prior low transverse cesarean delivery (LTCD), women with prior low vertical cesarean delivery (LVCD) or with an unknown scar are not at a significantly increased risk of uterine dehiscence or rupture.
Induction of labor. The risk of rupture with any IOL method at term was 1.5 percent and 1.0 percent when any GA was considered. At greater than 40 weeks, the rate was highest at 3.2 percent.
Gestational age. Relative to women with spontaneous labor, there was no increase in risk of rupture among those induced at term. Women induced after 40 weeks GA had an increased risk compared with those undergoing spontaneous labor (risk difference 1.8 percent; 95 percent CI: 0.1 to 3.5 percent, NNH 56).
Method of induction. The rate of uterine rupture by induction method--oxytocin, PGE2, and misoprostol--was 1.1 percent, two percent, six percent, respectively. The risk of uterine rupture with mechanical methods of IOL is understudied.
Can uterine rupture be predicted? Studies of individual factors that may increase or decrease a woman’s risk of uterine rupture are largely exploratory.
Protective factors. Women with prior vaginal delivery have lower risk for uterine rupture. Risk factors. Women undergoing IOL have higher risk of uterine rupture compared with
spontaneously laboring women. Women who are postdate may have a higher risk of uterine rupture. Obese and morbidly obese women are more likely to suffer rupture and/or dehiscence. Women with a prior classical incision are at increased risk of uterine rupture.
Predictive measures. No study was able to produce a reliable and robust model to predict uterine rupture. This is likely because uterine rupture is a rare event, and although there are factors associated with uterine rupture, none are of great magnitude. An accurate and reliable tool to predict an individual woman’s risk of uterine rupture has not been found.
Imaging. The data regarding ultrasound measurements of uterine thickness and uterine rupture consistently suggest that there may be value to ultrasound measurements of uterine thickness for women with prior cesarean delivery.
4
What are the long-term benefits and harms to the mother of TOL versus ERCD? Adhesions. Prior cesarean delivery was associated with a statistically significant increase in
adhesions at subsequent cesarean and hysterectomy. Adhesions were associated with increased perioperative complications, time to delivery, and total operative time. It is unclear whether adhesions and complications increase with increasing number of prior cesareans.
General health. No studies evaluated TOL and/or RCD with respect to pelvic pain, risk of ectopic pregnancy, and general health risks, such as diabetes or high blood pressure.
Fertility. Two studies have shown impaired fertility following cesarean delivery. One study found a difference in the ability to conceive in subjects undergoing cesarean delivery compared with instrumented vaginal delivery (odds ratio 0.33; 95 percent CI: 0.12 to 0.98). Another study found a history of cesarean delivery was associated with increased odds of taking greater than 1 year to conceive (odds ratio 1.53; 95 percent CI: 1.09 to 2.14).
Menopause. One case-control study found an increased risk of early menopause in women with multiple cesarean deliveries compared with no pelvic surgery (odds ratio 2.69; 95 percent CI: 1.16 to 6.22).
What are the long-term benefits and harms to the mother of multiple cesarean? Women who do not have a TOL will undergo RCD and, potentially, multiple cesareans.
Hemorrhage/transfusion. The overall rates of hemorrhage/transfusion with multiple cesarean deliveries were less than five percent, but the risk appeared to increase with increasing numbers of cesareans.
Adhesions. The incidence of adhesions increased with increasing numbers of cesareans. Surgical injury. Bladder, bowel, and ureteral injury are uncommon occurrences that appear
to increase with multiple cesareans. Infection. The risk of postoperative infection with multiple cesareans remains unclear. Wound complications. The risk of wound complications does not appear to increase with
multiple cesarean deliveries. Hysterectomy. There was a strong correlation between multiple cesareans and hysterectomy.
The odds ratio for hysterectomy with one prior cesarean was 0.7 to 2.14, with one or more was 1.4 to 7.9, and two or more was 3.8 to 18.6.
Abnormal placentation Abruption. The risk of abruption for women with any prior cesarean was 0.10 to 0.15
percent. The risk did not appear to increase with prior cesarean or number of prior cesarean deliveries.
Previa. Women with a prior cesarean delivery had a statistically significant increased risk of placenta previa compared with women with no prior cesarean at a rate of 12 per 1,000 (95 percent CI: 8 to 15 per 1,000). The incidence increased with increasing number of prior cesarean deliveries. Prior cesarean was a significant risk factor for maternal morbidity in women with previa. Compared with previa patients without a prior cesarean delivery, women with one prior cesarean and previa had a statistically significant increased risk of blood transfusion (15 versus 32.2 percent), hysterectomy (0.7 to 4 percent versus 10 percent), and composite maternal morbidity (15 versus 23 to 30 percent). For women with three or more prior cesarean deliveries and previa, the risk of hysterectomy and composite maternal morbidity rose significantly (0.7-4 percent versus 50-67 percent and 15 versus 83 percent, respectively).
Accreta. The incidence of placenta accreta rose with increasing number of prior cesarean deliveries. The results were statistically significant for women with two or more prior cesareans (odds ratio 8.6 to 29.8).
5

Previa and accreta. Women with placenta previa are at increased risk for placenta accreta, and the risk increased with increasing number of prior cesareans. Women with more than three prior cesareans and previa had a 50-67 percent incidence of accreta. What are the short- and long-term benefits and harms to the baby of maternal attempt at trial of labor after prior cesarean versus elective repeat cesarean delivery, and what factors influence benefits and harms? What are the short-term benefits and harms to the baby of maternal attempt at TOL versus ERCD?
Perinatal death. Perinatal, fetal, and neonatal mortality rates were low in women with a history of prior cesarean delivery. The overall perinatal death rate with TOL was 1.3 per 1,000 (95 percent CI: 0.59 to 3.04 per 1,000) compared with 0.5 per 1,000 (95 percent CI: 0.07 to 3.82 per 1,000) for ERCD. The intrapartum death rates were consistently slightly higher in women who attempt a TOL (0.1 to 0.4 per 1,000) versus ERCD (0 to 0.04 per 1,000). Women with high-risk conditions and indicated repeat cesarean delivery (IRCD) appear to have higher rates of neonatal mortality.
Sepsis. Three studies measured sepsis in the neonate undergoing a TOL versus ERCD; however only one study actually defined and measured “proven” sepsis. This study found no differences in proven sepsis in infants born after TOL versus those delivered by ERCD.
Apgar scores. Four studies found no differences in Apgar scores of less than six and seven at 5 minutes in infants undergoing a TOL versus ERCD. Three studies examined the differences in low Apgars (less than seven) at 5 minutes in VBAC versus RCD after a TOL; two of these studies found no difference in Apgar scores of infants born by VBAC versus RCD after a TOL.
Neonatal intensive care unit (NICU) admission. Six of eight studies found no significant differences in frequency of NICU admissions between TOL and ERCD.
Breastfeeding. No studies were found that explored the effect of a TOL versus an ERCD on breastfeeding initiation or continuation.
Additional short-term outcomes. There was insufficient evidence to determine if rates of respiratory distress, neonatal trauma, or asphyxia/hypoxic-ischemic encephalopathy varied between TOL and ERCD.
Factors related to outcomes. There was insufficient data to determine that fetal presentation or gestational age in term neonates influences benefits or harms to the neonate undergoing TOL versus ERCD. What are the long-term benefits and harms to the baby of maternal attempt TOL versus ERCD?
Perinatal outcome in future pregnancies. One study showed that prior cesarean delivery increases the risk for unexplained stillbirth in the next pregnancy and another study showed no difference in risk for stillbirth. Both studies are limited by their retrospective design and relied on large perinatal databases while employing various methodologies to overcome confounding.
Neurological development. No studies were found that measured the impact of a TOL versus ERCD on neonatal neurological development.
Discussion While cesarean deliveries represent a third of all births, they account for almost half of the
childbirth-related expenses of hospitalization, at $7.8 billion annually.1 A major contributor to the increase in cesareans is the rapid decline in VBACs witnessed over the last decade.
6

Therefore, the appropriate and safe use of cesarean and VBAC is not only an individual patient- and provider-level concern, but it is also a national health policy concern.
One of the major findings of this report is that the best evidence suggests that VBAC is a reasonable and safe choice for the majority of women with prior cesarean. The occurrence of maternal and infant mortality for women with prior cesarean is not significantly elevated when compared with national rates overall of mortality in childbirth. The majority of women who have TOL will have a VBAC, and they and their infants will be healthy. However, there is a minority of women who will suffer serious adverse consequences of both TOL and ERCD. While TOL rates have decreased over the last decade, VBAC rates and adverse outcomes have not changed suggesting that the reduction is not reflecting improved patient selection. Sophisticated statistical models have not been able to predict those women who will do well and those who will be harmed.
The most dramatic change since the 1980 VBAC report is the number of women with multiple cesareans. This report found that women with three or more prior cesareans are at significantly increased risk of complications, and the risks increase for women with prior cesarean delivery and previa. Since we are unable to determine which women will have previa or to prevent its occurrence, all pregnant women are at risk, and the risk increases with multiple cesareans.
Studies of VBAC versus ERCD have traditionally reported outcomes based upon actual route of delivery rather than intended route, leading to misclassification of patients who intend elective repeat cesarean but go into labor prior to their cesarean or women who intended trial of labor but who are delivered by cesarean. The evidence from these studies is at best indirect and difficult to apply to a woman who plans for either option. Each leaves clinicians and patients uncertain of the ramification for their decisionmaking and masks potential adverse effects of desiring one route of delivery but having another.
Mode of delivery for subsequent pregnancies poses a difficult question for women with prior cesarean and their providers. Some women have already made their decision prior to leaving the hospital after their cesarean, due to factors surrounding that birth. Others will decide early in pregnancy, and still others will remain undecided until presenting in labor. Some women will not have a choice due to provider, hospital, insurance, or medico-legal factors that mandate repeat cesarean. This report suggests that although there are statistically significant differences between ERCD and TOL, there are very few clinically significant differences, and the overall mortality risk is not significantly elevated between women with prior cesarean delivery and women undergoing their first pregnancy. Serious deficiencies were found in the existing literature, however, and this report provides a list of research priorities as prioritized by national experts as well as potential study designs to advance the field and provide important information to patients, clinicians, and policymakers.
7

Evidence Report

1
1
Chapter 1. Introduction The effective and safe use of cesarean delivery has been a focus of national attention and
concern for decades. Thirty years ago the National Institutes of Health (NIH) held a Consensus Conference on Cesarean Childbirth in response to concerns about a three-fold increase in the rate of cesarean deliveries (from 5 to 15.2 percent).3, 5, 6 As a result of that conference, vaginal birth after cesarean (VBAC) was proposed as a mechanism to reduce the use of cesareans. As shown in Figure 1, though it took almost a decade following the conference to gain popularity, VBAC effectively contributed to the reduction in the cesarean rate. As the VBAC rate rose from 19.9 percent in 1990 to 28.3 percent in 1996, the cesarean delivery rate decreased from 22.7 percent to 20.7 percent over the same time period.4 However, a complex combination of emerging studies that suggested that the morbidity associated with VBAC, particularly uterine rupture, was higher than initially thought; organizational changes; and liability pressures resulted in a rapid reduction in the practice of VBAC and concomitant increases in cesarean delivery. While primary cesarean accounts for the largest number of cesarean deliveries, the largest single indication for cesarean is prior cesarean, accounting for over a third of all cesareans; thus the safety of VBAC remains important.1 Despite the national goal, as stated by Healthy People 20107
to reduce the cesarean delivery rate to 15 percent of births, the cesarean delivery rate for 2007 is the highest ever recorded, at 32.8 percent of all births.1 This systematic review was conducted to inform the 2010 NIH Consensus Development Conference on emerging issues relating to VBAC.
Appendixes and evidence tables cited in this report are available at http://www.ahrq.gov/downloads/pub/evidence/pdf/vbacup/vbacup.pdf.
1111
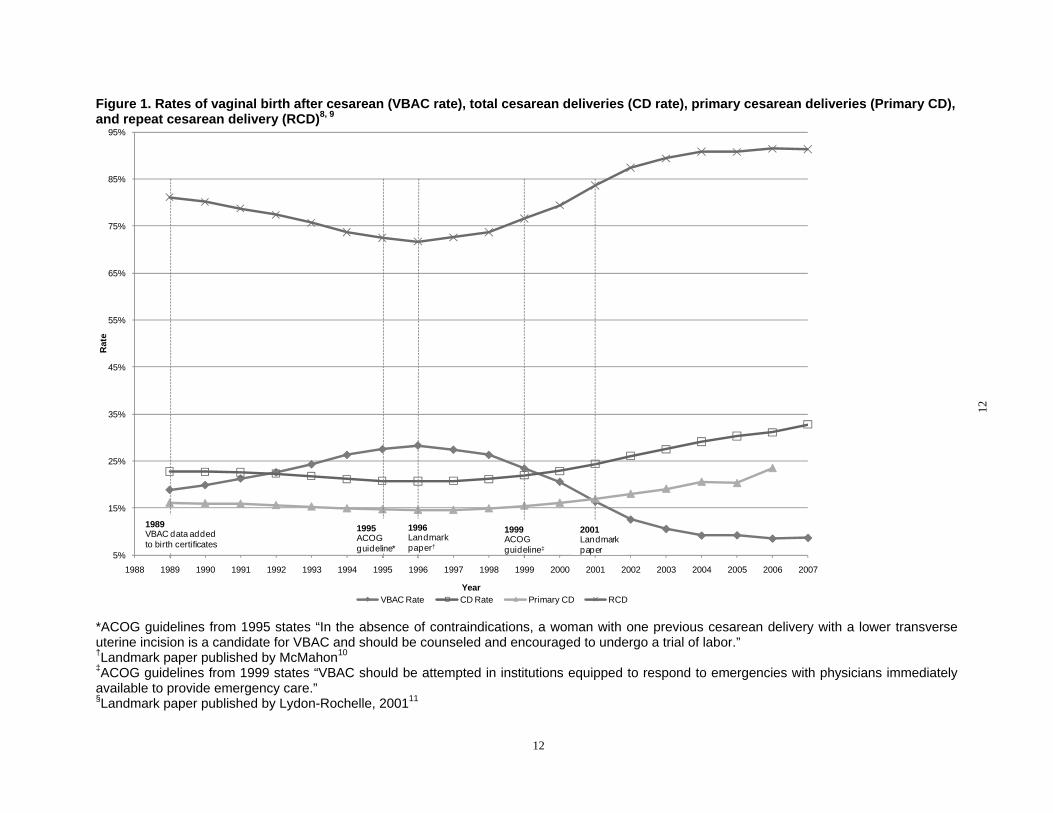
Figure 1. Rates of vaginal birth after cesarean (VBAC rate), total cesarean deliveries (CD rate), primary cesarean deliveries (Primary CD), and repeat cesarean delivery (RCD)8, 9
Rat
e
95%
85%
75%
65%
55%
45%
35%
25%
15%
5%
1989 VBAC data added to birth certificates
1995 ACOG guideline*
1996 Landmark paper†
1999 ACOG guideline‡
2001 Landmark paper
1988 1989 1990 1991 1992 1993 1994 1995 1996 1997 1998 1999 2000 2001 2002 2003 2004 2005 2006 2007
Year VBAC Rate CD Rate Primary CD RCD
*ACOG guidelines from 1995 states “In the absence of contraindications, a woman with one previous cesarean delivery with a lower transverse uterine incision is a candidate for VBAC and should be counseled and encouraged to undergo a trial of labor.” †Landmark paper published by McMahon10
‡ACOG guidelines from 1999 states “VBAC should be attempted in institutions equipped to respond to emergencies with physicians immediately available to provide emergency care.”§Landmark paper published by Lydon-Rochelle, 200111
12
12
Structure of Report and Key Questions An evidence report focuses attention on the strengths and limits of evidence from published
studies about the effectiveness and/or harms of a clinical intervention. The development of an evidence report begins with a careful formulation of the problem. The Evidence-based Practice Center (EPC) systematically reviewed the relevant scientific literature on key questions relating to VBAC assigned by the Agency for Healthcare Research and Quality (AHRQ), the Planning Committee for the NIH Consensus Development Conference on VBAC: New Insights, the National Institutes of Health’s Office of Medical Applications of Research (OMAR), and further refined by a technical expert panel (TEP). Ultimately, two background questions and four key questions were reviewed for this report: Background Questions • What are the rates and patterns of utilization of trial of labor after prior cesarean, vaginal
birth after cesarean, and repeat cesarean deliveries in the United States?
• What are the nonmedical factors (provider type, hospital type, etc.) that influence the patterns and utilization of trial of labor after prior cesarean?
Background questions will be addressed in the introduction of the report with information from reputable sources; however, these data are not part of the systematic review process.
Key Questions 1. Among women who attempt a trial of labor after prior cesarean, what is the vaginal
delivery rate and the factors that influence it?
2. What are the short- and long-term benefits and harms to the mother of attempting trial of labor after prior cesarean versus elective repeat cesarean delivery, and what factors influence benefits and harms?
3. What are the short- and long-term benefits and harms to the baby of maternal attempt at trial of labor after prior cesarean versus elective repeat cesarean delivery, and what factors influence benefits and harms?
4. What are the critical gaps in the evidence for decision-making, and what are the priority investigations needed to address these gaps?
Introduction The strength and suitability of the evidence regarding the risks of major maternal and infant
morbidity and mortality associated with VBAC is the focus of this evidence report. In judging the suitability of evidence, the perspective taken was what a decisionmaker would want to know—that is, whether the risk for complications is higher for women who plan a VBAC versus those who plan an elective repeat cesarean delivery (ERCD), under optimal conditions of care. Some components of obstetric care, as well as some aspects of the setting of this care, might increase the risks of VBAC or ERCD.
The evidence report emphasizes direct evidence between an intervention (e.g., planned VBAC or ERCD) and health outcomes, the quality of individual studies, and the strength of the body of evidence, giving weight to studies that are appropriately designed to answer a question and meet high methodological standards that reduce the likelihood of biased results. To compare two different treatments or management strategies, the results of well-done, randomized
13
controlled trials (RCTs) are often regarded as better evidence than are results of cohort, case-control, or cross-sectional studies. These designs, in turn, are considered to provide better evidence than do uncontrolled trials or case series. However, it is increasingly becoming recognized that observational studies may provide important information to aid in understanding adverse events when interventions are applied to more heterogeneous populations than are typical of RCTs. In addition, studies—particularly trials—of interventions are often conducted in narrow populations that are more homogeneous and less generalizable than the intended clinical population or they do not include important populations that may be more susceptible to harm. Therefore, observational studies that reflect actual clinical effectiveness in more heterogeneous populations and community settings can provide information that is more generally applicable. Similarly, observational studies can provide quality evidence for assessing diagnostic tests or prediction tools.
Throughout the report, three key comparative effectiveness themes are emphasized: 1) understanding whether particular populations have higher likelihood of benefits or harms, 2) whether particular settings experience higher benefits or harms, and 3) understanding the role of study designs in shaping the understanding of important outcomes or harms from therapies. The approach to the evidence not only reports the findings of studies relating to a key question, but also looks for information that may illuminate important consequences for the intervention being more broadly applied. Sub-questions included in this summary may include: • Are there important racial, ethnic, socio cultural, genetic, access to healthcare, medical
utilization, patient values, patient adherence and compliance differences that affect response to therapy?
• What populations are particularly susceptible to harm?
• Are the results of effectiveness likely to be retained in populations with more heterogeneity, co-morbidities, different age groups, values, preferences, or settings, or other characteristics?
Similarly, this report aims to enhance future research. It is important for researchers to know how their choice of study design may affect their results and what elements of study design portend higher quality. This report provides these details as a step to informing and improving future research.
Background The following were asked as background questions to this evidence report. Information is
summarized from reputable sources, but did not undergo a systematic review process.
What are the rates and patterns of utilization of trial of labor after prior cesarean, vaginal birth after cesarean, and repeat cesarean delivery in the United States?
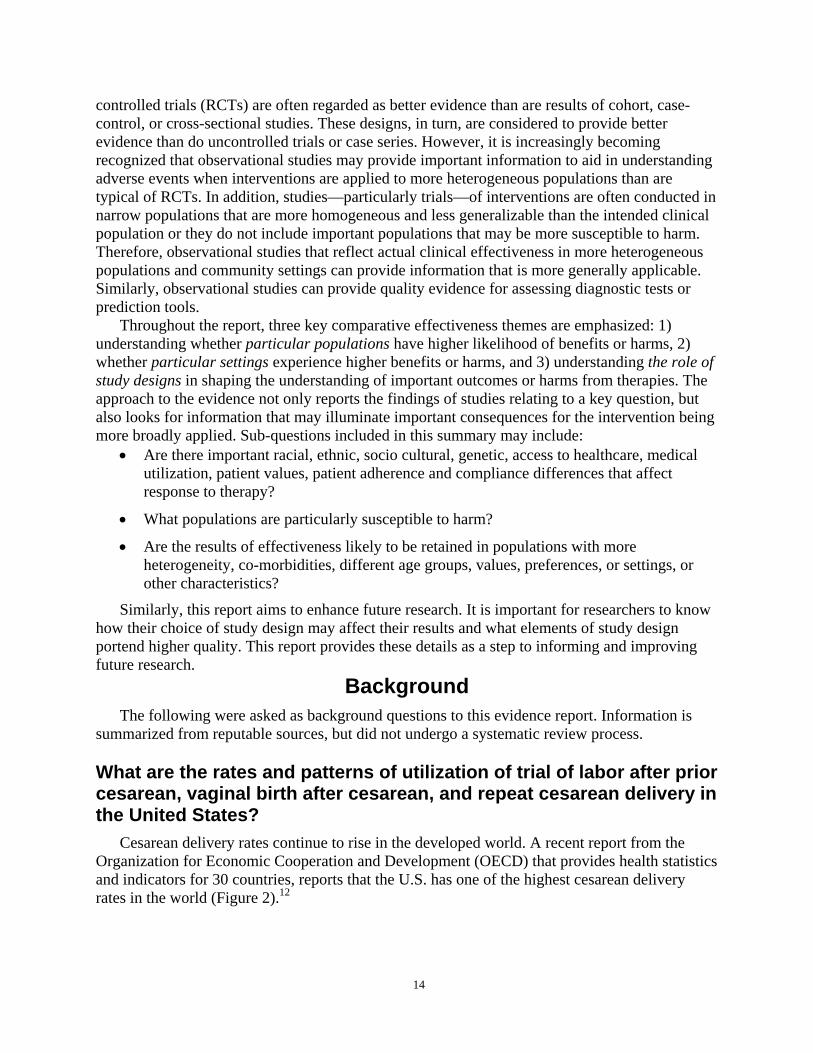
Cesarean delivery rates continue to rise in the developed world. A recent report from the Organization for Economic Cooperation and Development (OECD) that provides health statistics and indicators for 30 countries, reports that the U.S. has one of the highest cesarean delivery rates in the world (Figure 2).12
14
Figure 2. Cesarean delivery by country - percent for live births (2007)12 Pe
rcen
t liv
e bi
rths
Note: Data for Norway, Ireland, Australia, United States, and Italy are from 2006
The cesarean delivery rate in the U.S. reached an all time high of 32.8 percent in 2007, far exceeding the national goal of 15 percent.1, 7 Though there are many potential causes, the decline in VBACs has certainly contributed to this trend. Cesarean delivery and VBAC rates differ considerably by state ranging from 2.5 to 20.9 percent (Figure 3).
15
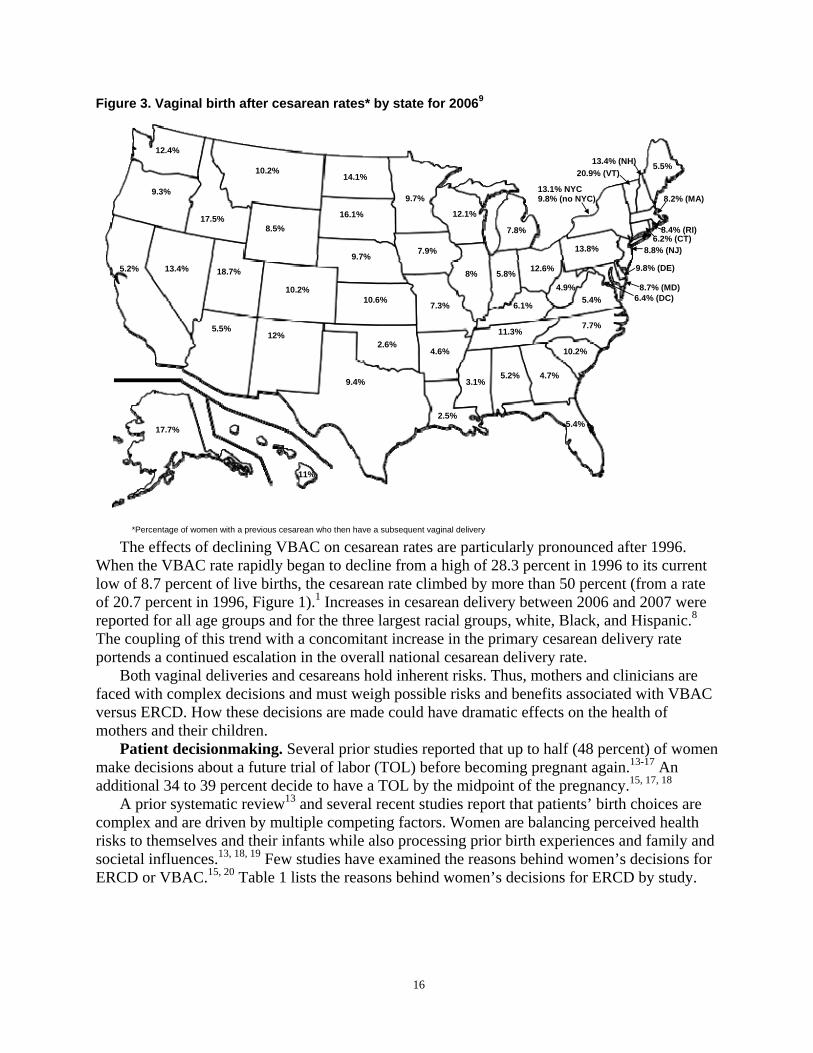
Figure 3. Vaginal birth after cesarean rates* by state for 20069
12.4%
5.5%
5.2%
10.2%
13.4%
12%
18.7%
8.5% 17.5%
10.2%
4.6%
7.9%
10.6%
2.5%
9.7%
7.3%
9.7%
14.1%
2.6%
16.1%
9.4% 5.2%
5.4%
4.7%
8% 5.8%
6.1%
7.8%
3.1%
7.7%
12.6%
10.2%
11.3%
5.4%
12.1%
4.9%
5.5%
13.8%
13.4% (NH)
13.1% NYC 9.8% (no NYC)
20.9% (VT)
6.2% (CT)
6.4% (DC)
9.8% (DE)
8.7% (MD)
8.2% (MA)
8.8% (NJ)
8.4% (RI)
17.7%
11%
9.3%
*Percentage of women with a previous cesarean who then have a subsequent vaginal delivery
The effects of declining VBAC on cesarean rates are particularly pronounced after 1996. When the VBAC rate rapidly began to decline from a high of 28.3 percent in 1996 to its current low of 8.7 percent of live births, the cesarean rate climbed by more than 50 percent (from a rate of 20.7 percent in 1996, Figure 1).1 Increases in cesarean delivery between 2006 and 2007 were reported for all age groups and for the three largest racial groups, white, Black, and Hispanic.8
The coupling of this trend with a concomitant increase in the primary cesarean delivery rate portends a continued escalation in the overall national cesarean delivery rate.
Both vaginal deliveries and cesareans hold inherent risks. Thus, mothers and clinicians are faced with complex decisions and must weigh possible risks and benefits associated with VBAC versus ERCD. How these decisions are made could have dramatic effects on the health of mothers and their children.
Patient decisionmaking. Several prior studies reported that up to half (48 percent) of women make decisions about a future trial of labor (TOL) before becoming pregnant again.13-17 An additional 34 to 39 percent decide to have a TOL by the midpoint of the pregnancy.15, 17, 18
A prior systematic review13 and several recent studies report that patients’ birth choices are complex and are driven by multiple competing factors. Women are balancing perceived health risks to themselves and their infants while also processing prior birth experiences and family and societal influences.13, 18, 19 Few studies have examined the reasons behind women’s decisions for ERCD or VBAC.15, 20 Table 1 lists the reasons behind women’s decisions for ERCD by study.
16
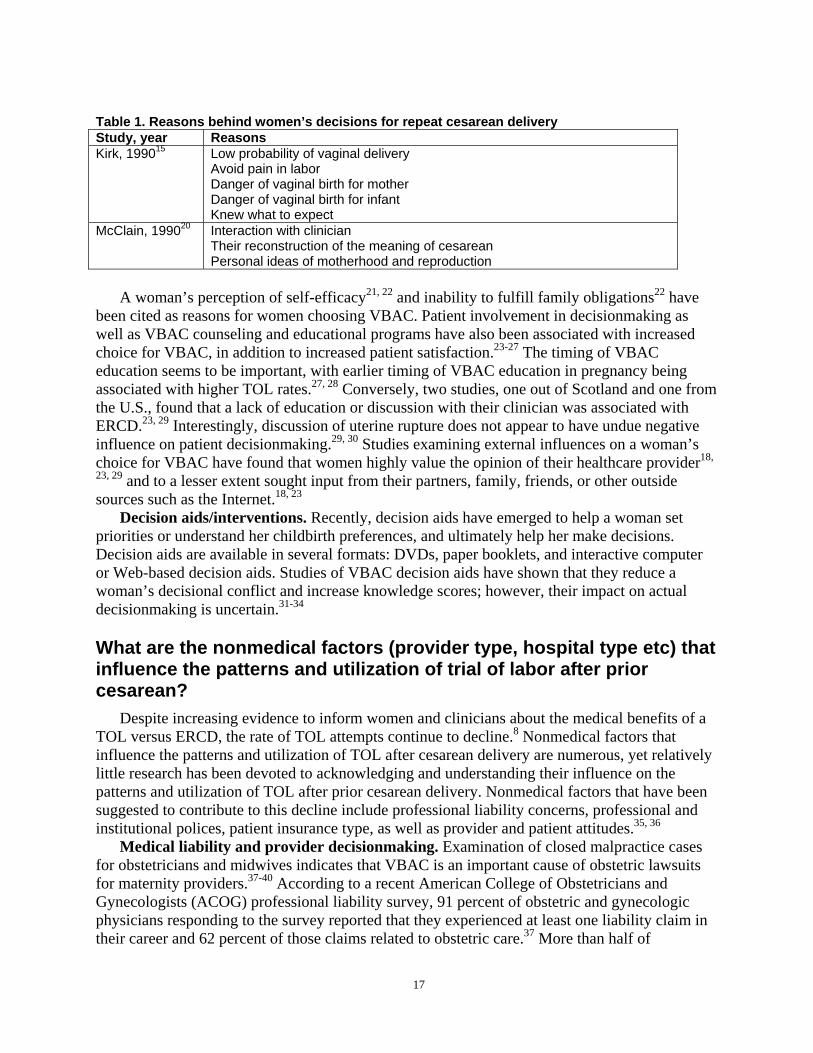
Table 1. Reasons behind women’s decisions for repeat cesarean delivery Study, year Reasons Kirk, 199015 Low probability of vaginal delivery
Avoid pain in labor Danger of vaginal birth for mother Danger of vaginal birth for infant Knew what to expect
McClain, 199020 Interaction with clinician Their reconstruction of the meaning of cesarean Personal ideas of motherhood and reproduction
A woman’s perception of self-efficacy21, 22 and inability to fulfill family obligations22 have been cited as reasons for women choosing VBAC. Patient involvement in decisionmaking as well as VBAC counseling and educational programs have also been associated with increased choice for VBAC, in addition to increased patient satisfaction.23-27 The timing of VBAC education seems to be important, with earlier timing of VBAC education in pregnancy being associated with higher TOL rates.27, 28 Conversely, two studies, one out of Scotland and one from the U.S., found that a lack of education or discussion with their clinician was associated with ERCD.23, 29 Interestingly, discussion of uterine rupture does not appear to have undue negative influence on patient decisionmaking.29, 30 Studies examining external influences on a woman’s choice for VBAC have found that women highly value the opinion of their healthcare provider18,
23, 29 and to a lesser extent sought input from their partners, family, friends, or other outside sources such as the Internet.18, 23
Decision aids/interventions. Recently, decision aids have emerged to help a woman set priorities or understand her childbirth preferences, and ultimately help her make decisions. Decision aids are available in several formats: DVDs, paper booklets, and interactive computer or Web-based decision aids. Studies of VBAC decision aids have shown that they reduce a woman’s decisional conflict and increase knowledge scores; however, their impact on actual decisionmaking is uncertain.31-34
What are the nonmedical factors (provider type, hospital type etc) that influence the patterns and utilization of trial of labor after prior cesarean?
Despite increasing evidence to inform women and clinicians about the medical benefits of a TOL versus ERCD, the rate of TOL attempts continue to decline.8 Nonmedical factors that influence the patterns and utilization of TOL after cesarean delivery are numerous, yet relatively little research has been devoted to acknowledging and understanding their influence on the patterns and utilization of TOL after prior cesarean delivery. Nonmedical factors that have been suggested to contribute to this decline include professional liability concerns, professional and institutional polices, patient insurance type, as well as provider and patient attitudes.35, 36
Medical liability and provider decisionmaking. Examination of closed malpractice cases for obstetricians and midwives indicates that VBAC is an important cause of obstetric lawsuits for maternity providers.37-40 According to a recent American College of Obstetricians and Gynecologists (ACOG) professional liability survey, 91 percent of obstetric and gynecologic physicians responding to the survey reported that they experienced at least one liability claim in their career and 62 percent of those claims related to obstetric care.37 More than half of
17
respondents reported making changes in their practice due to the availability or affordability of malpractice insurance with 19.5 percent reporting increasing their cesarean rate, 19.0 percent decreasing their VBAC rate, 21 percent decreasing their number of high-risk pregnant patients, and 6 percent stopping obstetric practice entirely.
Though the studies are few, the literature generally supports the association between medical-legal pressures and both increased likelihood to perform cesarean deliveries and reduced likelihood to perform VBACs.37, 41-43 Both regional and hospital malpractice claims have been associated with higher cesarean delivery rates. One study of hospitals in New York reported that the odds of cesarean delivery were three times higher in high premium regions compared with low premium regions (95 percent CI: 2.13 to 4.24).41 Similarly, higher hospital-level claims were significantly associated with higher cesarean rates after controlling for clinical risk (1.26; 95 percent CI: 1.10 to 1.43), and physicians’ perceptions of risk of suit was also associated with almost a two-fold increased odds of cesarean (1.96; 95 percent CI: 1.53 to 2.93). One study demonstrated that for each annual $10,000 increase in medical liability insurance premium, the primary cesarean rate increased by 15.7 per 1,000 for term nulliparous women.42 Looking specifically at tort reform, caps on noneconomic damages were the leading predictor of delivery method, in one study, with VBAC rates being significantly higher and cesarean delivery rates significantly lower in states where caps on noneconomic damages existed. A dose response of sorts was found among noneconomic tort caps suggesting that noneconomic caps at $250,000 would be associated with 9,000 additional VBACs and 12,000 fewer cesarean deliveries.43
Overall the literature supports a connection between malpractice liability and even provider perception of risk of liability and use of cesarean.
Several studies have tried to understand providers’ attitudes toward TOL after a prior cesarean delivery.44-49 These studies note disparity in the management approaches of providers in women who desire a TOL as well as a perceived increased risk of liability when caring for women who attempt a VBAC. Upon examination of 109 closed malpractice claims from a single liability insurer, Clark et al concluded that 80 percent of VBAC lawsuits were potentially avoidable by a management style that limited VBAC to spontaneously laboring women without repetitive moderate to severe variables.39 Some authors have suggested checklists, structured guidelines, and simulation of obstetric emergencies to enhance consistency and reduce adverse events, but to date, there is insufficient evidence about their effectiveness.50-52
More recently, reports of limited access to hospitals and providers willing to provide a TOL after a previous cesarean have emerged.25 Much of this decline in VBAC services is thought to be in response to a shift in professional and hospital guidelines indicating that “VBAC should be attempted in institutions equipped to respond to emergencies with physicians immediately available to provide emergency care.”53 Smaller hospitals with limited staff and resources have difficulty meeting these requirements, interpreted as in-house presence of obstetric surgical providers, and many institutions have discontinued offering VBAC services. Declines in rural hospitals offering TOL after cesarean have resulted in VBAC services becoming centralized, many times far away from where women live and work.54 In a descriptive, comparative study, Misra et al found that VBAC attempts had declined in Maryland from 2000 to 2005 (4.65 versus 3.58 percent, respectively) while the total (primary and repeat) cesarean rate rose from 21.71 percent in 1995 to 24.03 percent in 2005.55 In a study of all institutions (N=312) providing birth services in a four state region, Roberts et al found 30.6 percent of hospitals previously offering VBAC services prior to the 1999 ACOG policy recommendation had ceased doing so.56 This study also found that access to VBAC services in smaller or more rural hospitals was
18
disproportionately affected. The ethical, social, and financial implication of women delivering subsequent pregnancies by cesarean because of limited options for a TOL after cesarean delivery within their community is unstudied.
Several studies have explored the relationship between private and public health insurance and VBAC.57-59 Wagner et al found that Medicaid insured women were more likely than privately insured women to attempt a TOL (64 versus 50 percent, p=0.001) and to have a VBAC (62 versus 60 percent, p=not significant [NS]).58 In a recent review of state Medicaid coverage and utilization of cesarean delivery, Grant found that an increase in the amount physicians are reimbursed for cesarean deliveries versus vaginal delivery does account for a slight increase in the number of cesareans being performed.59 Specifically, a $1,000 increase in the reimbursement for performing a cesarean increases cesarean delivery rates by 1 percent. A major factor that distinguishes VBAC from ERCD is the labor process that could take hours to days and requires constant provider supervision. The current structure for provider reimbursement reimburses the delivery event (e.g., vaginal versus cesarean delivery) rather than the process. No studies were found that addressed the effect of this structure of reimbursement on provider’s willingness to offer VBAC.
In summary, the nonmedical factors that influence the patterns and utilization of TOL after prior cesarean delivery are numerous and complex. Studies consistently suggest that these nonmedical factors play an important role in decisionmaking and patient access. A better understanding of nonmedical issues and the significance of their impact on utilization of VBAC is warranted.
19
1
1
Chapter 2. Methods
Topic Development Analytic Framework and Key Questions
The Planning Committee for the National Institutes of Health (NIH) Consensus Development Conference on Vaginal Birth After Cesarean (VBAC): New Insights determined the key questions for this evidence report. Key questions examine 1) a chain of evidence about factors that may influence VBAC, 2) maternal and infant benefits and harms of attempting a VBAC versus an elective repeat cesarean delivery (ERCD), and 3) factors that may influence maternal and infant outcomes. Figure 4 presents an analytic framework that illustrates the clinical logic and contextual factors that underlie the key questions of this report. An analytic framework is intended to illustrate relevant clinical logic and other influencing factors, in this case relating to VBAC. It is meant to clarify the context in which decisions about route of delivery are made, clarify direct and indirect associations, and clarify assumptions and disagreements that underlie clinical controversies. Thus, the analytic framework serves as a central conceptual model for what information is being sought (key questions), what the literature tells us, and the information gaps between the two.
The framework starts with the population of interest, in this case women with a prior cesarean delivery. It explicitly aims to understand a woman’s initial intended route of delivery and the factors that influence that initial intention. During this evolving decisionmaking process, there may be adverse outcomes that arise from discordance between an initial preference and the actual choices available, or there may be unforeseen benefits. The routes of delivery are listed in some detail with respect to features that may contribute uniquely to risks and benefits. The framework then clarifies the relationship among the route of actual delivery, intermediate outcome measures, and maternal and infant health outcomes. This framework represents both what might be found in the literature and also important considerations for consumers, clinicians, payers, policymakers, and future research. Studies that measure health outcomes, such as maternal and infant mortality, are emphasized over studies of intermediate outcomes (e.g., nonreassuring fetal tracing). Studies providing evidence of a direct association between an intervention (e.g., ERCD) and health outcomes are said to provide direct evidence and are given greater weight than are studies that provide indirect evidence.
Appendixes and evidence tables cited in this report are available at http://www.ahrq.gov/downloads/pub/evidence/pdf/vbacup/vbacup.pdf.
21
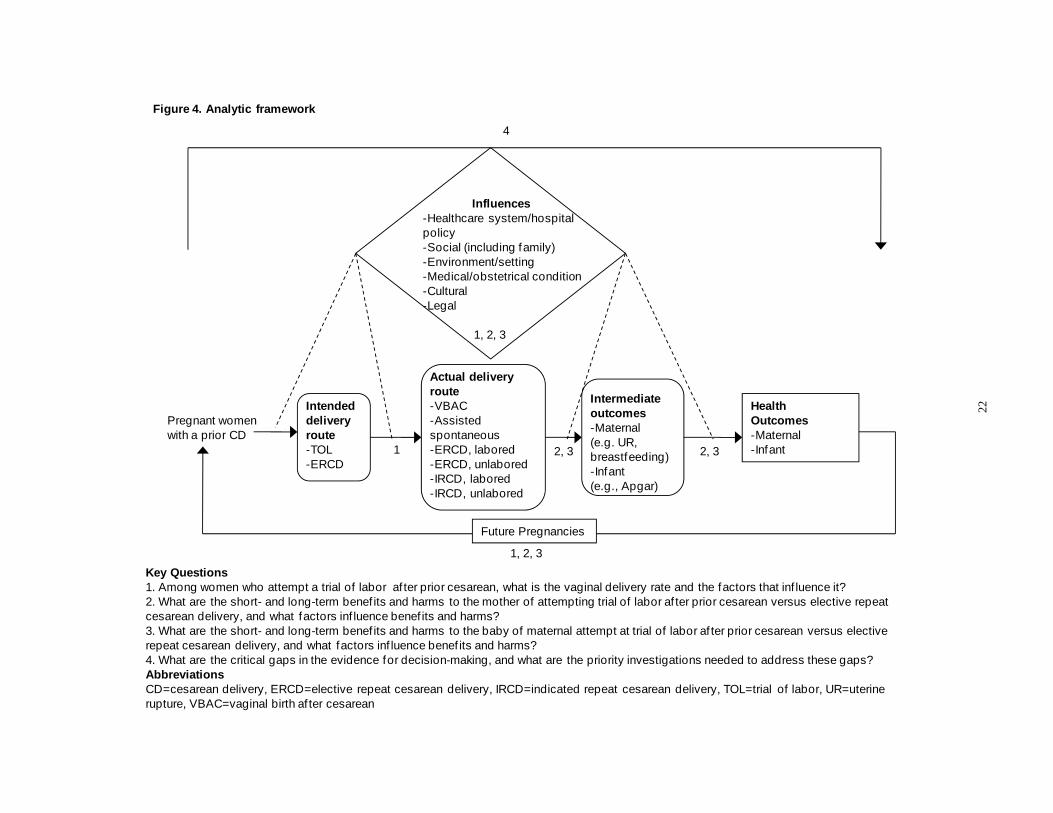
Pregnant women with a prior CD
Health Outcomes -Maternal -Inf ant
Intended delivery route -TOL -ERCD
Actual delivery route -VBAC -Assisted spontaneous -ERCD, labored -ERCD, unlabored -IRCD, labored -IRCD, unlabored
Intermediate outcomes -Maternal (e.g. UR, breastfeeding) -Infant (e.g., Apgar)
Influences -Healthcare system/hospital policy -Social (including family) -Environment/setting -Medical/obstetrical condition -Cultural -Legal
Future Pregnancies
1 2, 3 2, 3
1, 2, 3
1, 2, 3
Figure 4. Analytic framework
4
Key Questions 1. Among women who attempt a trial of labor af ter prior cesarean, what is the vaginal delivery rate and the factors that inf luence it? 2. What are the short- and long-term benef its and harms to the mother of attempting trial of labor af ter prior cesarean versus elective repeat cesarean delivery, and what factors inf luence benef its and harms? 3. What are the short- and long-term benef its and harms to the baby of maternal attempt at trial of labor af ter prior cesarean versus elective repeat cesarean delivery, and what factors inf luence benef its and harms? 4. What are the critical gaps in the evidence for decision-making, and what are the priority investigations needed to address these gaps? Abbreviations CD=cesarean delivery, ERCD=elective repeat cesarean delivery, IRCD=indicated repeat cesarean delivery, TOL=trial of labor, UR=uterine rupture, VBAC=vaginal birth af ter cesarean
22

Technical Expert Panel and Expert Reviewers A technical expert panel (TEP) (Appendix A) was assembled at the start of the evidence
report process to provide input from experts and clinicians in the field to ensure that the scope of the project addressed important clinical questions and issues. The panel included obstetrician/gynecologists, internists, pediatricians, family physicians, and researchers. The panel convened for periodic conference calls during the course of the project. Expert reviewers (Appendix B), including several panel members, provided comments on the draft evidence report.
Literature Search and Strategy Relevant studies were identified from searching MEDLINE, Database of Abstracts of
Reviews of Effectiveness (DARE), and the Cochrane Database of Systematic Reviews and Controlled Trials (1966 to September 2009) multiple times over the course of the project (Appendix C). Additional articles were obtained from recent systematic reviews, reference lists, reviews, editorials, hand searching, Web sites, and by consulting experts. Retrieved abstracts were entered into an electronic database (EndNote®).
A total of 3,134 unique citations were reviewed from the searches. Two investigators reviewed a random set of titles and abstracts to select articles for full text review. When an appropriate level of reliability was reached for inclusion/exclusion of studies, the remaining titles and abstracts were divided up and reviewed by one investigator. A research assistant tracked the inclusion status and names of reviewers for each abstract reviewed. The full text articles of citations that had original data about maternal and infant outcomes relevant to a key question in one or more topic area were retrieved.
Inclusion and Exclusion Criteria The target population includes women of reproductive age in the United States (U.S.) with a
prior cesarean delivery who are eligible for a trial of labor (TOL) or ERCD. Settings that were applicable to a U.S. population were included. Therefore, studies were not limited to the U.S.; foreign studies were included if originating from a developed country (Appendix D). This was believed to offer the broadest range of information on maternal and infant outcomes applicable to the U.S. population. The evidence report emphasizes the patient’s perspective in choice of mode of delivery, interventions needed for induction and/or augmentation of labor, and potential adverse effects of a specific mode of delivery on maternal and infant outcomes. It also considers the generalizability of efficacy studies performed in controlled settings.
The Planning Committee for the NIH Consensus Development Conference identified their ideal population of interest as term infants (greater than or equal to 37 weeks gestational age [GA]). However, after initial review of the searches, there was concern about the lack of data on term-only infants. Two cohort studies that compared outcomes of term infants with preterm infants were reviewed and showed no difference.60, 61 For both of these reasons, general population studies of women with a prior cesarean delivery who delivered at any GA (preterm and term) were included as were studies that focused exclusively on women delivering at term. While this approach was thought to be reasonable for maternal outcomes, infant outcomes are affected by prematurity, and the scope of studies for this topic remained limited to term studies, except where noted.
23
General For all key questions, full text studies with data on women with a prior cesarean delivery
eligible for a TOL or ERCD and maternal and/or infant outcomes were initially reviewed. They were subsequently included if they met eligibility criteria: 10 or more subjects, participants represented the target population, and data on benefits and harms to the mother or infant given either mode of delivery. Exclusions included studies of women without a prior cesarean delivery, nulliparous patients, breech delivery, exclusive focus on preterm delivery, low birth weight, studies of pregnancies including twins or abortions, studies begun or published before the 1980 NIH Consensus Conference on VBAC, and studies focusing on patients with particular conditions such as gestational diabetes, human immunodeficiency virus, preeclampsia, etc. (Appendix E). Non-English language papers, editorials, letters, studies available exclusively in abstract form, and studies of animals or cadavers were also excluded. Case-control and case series studies meeting similar inclusion/exclusion criteria were examined and included if they reported relevant data. Given that the focus of this report is intended for a U.S. obstetric population, studies conducted in undeveloped or developing countries were excluded (Appendix D). If the authors described their country as “developing” in either the abstract or the article, it was excluded. For a full listing of excluded studies, please see the excluded studies list in Appendix F.
Investigators read the full text version of the retrieved papers and re-applied the initial eligibility criteria. For all topics, articles were excluded if they did not provide sufficient information to determine the methods for selecting subjects and for analyzing data. For some topics, additional criteria were applied to select studies that were systematically reviewed.
For the purposes of this report, the term “rate” is used to describe the proportion of women who experienced a given event (i.e., VBAC, ERCD, etc.). Though this is not always technically correct when expressing summary statistics, it is a term that is used throughout the literature and easily understood by patients and clinicians.
Among women who attempt a trial of labor after prior cesarean, what is the vaginal delivery rate and the factors that influence it?
For this question, full text randomized controlled trials (RCTs) were reviewed in addition to observational studies. This key question was limited to studies with data on women with a prior cesarean delivery having a TOL and vaginal delivery rates and/or factors influencing the delivery rate. For evaluating the rates of TOL and VBAC, studies were included if they explicitly stated the inclusion and exclusion criteria and provided data for computing TOL or VBAC rates.
To evaluate the effect of induction of labor (IOL) on women with a prior cesarean delivery, only studies that reported the number of women who were induced and the corresponding number with VBAC, uterine rupture, or other relevant outcome were included. Of particular interest were those studies that stratified data by the method of IOL, or whether oxytocin was used for IOL or augmentation or both. We included RCTs and observational studies, preferring cohort designs with an inception cohort but also including less rigorous designs (case series) because data from RCTs and cohort studies were sparse.
24
What are the short- and long-term benefits and harms to the mother of attempting trial of labor after prior cesarean versus elective repeat cesarean delivery, and what factors influence benefits and harms?
For this question, the ideal comparison group was intended VBAC versus intended ERCD. However, as no studies of health outcomes measured intent, the primary comparison groups were TOL and ERCD, unless otherwise noted.
An important concern for patients, providers, hospitals, and policymakers regarding VBAC is the potential for uterine rupture, which can have severe maternal and infant morbidity and mortality. To determine how frequently uterine rupture occurs, it is important to have a clear definition for uterine rupture. A prior systematic review of VBAC and uterine rupture found that studies varied widely in their definition and use of terminology surrounding uterine rupture.62
This report uses the anatomic definition of uterine rupture that was proposed by the prior evidence report and restated by the TEP for this project. For the purposes of this report, uterine rupture is defined as: • Complete Uterine Rupture – separation through the entire thickness of the wall including
visceral serosa (with or without extrusion of part of all of fetal-placental unit)
• Incomplete Uterine Rupture – separation that was not completely through all layers of the uterine wall (e.g., serosa intact)62
To evaluate the effect of IOL on the outcome of uterine rupture, the definitions given above were used in the primary analysis. Because the number of studies using these definitions was small, the scope of literature was expanded to enable examination of individual factors predicting uterine rupture, predictive tools, and imaging to predict uterine rupture.
What are the short- and long-term benefits and harms to the baby of maternal attempt at trial of labor after prior cesarean versus elective repeat cesarean delivery, and what factors influence benefits and harms?
For this question, all studies were limited to term infants (greater than or equal to 37 weeks GA), with the exception of fetal macrosomia and perinatal mortality. Studies addressing the influence of fetal macrosomia used fetal weight (greater than or equal to 4,000 grams) for the inclusion criteria instead of GA.
To measure the frequency of perinatal mortality and the corresponding subsets of perinatal death, we used the definitions accepted by the National Center for Vital Statistics.63 The definition of perinatal death (perinatal II) included infants less than 28 days of age and fetal deaths of 20 weeks or more GA. To study the frequency of stillbirth (antepartum and intrapartum) we used both the intermediate and late fetal definitions of fetal death. Intermediate (20-27 weeks GA) and late fetal death (greater than or equal to 28 weeks GA) referred to the intrauterine death of a fetus before delivery. Although most fetal deaths occur early in pregnancy (less than 20 weeks GA), most countries, and in particular the U.S., only report intermediate and late fetal death. Neonatal (infant) mortality was defined as death in the first 28 days of life.63
Rates for perinatal, fetal, and neonatal mortality were reported per 1,000 live births.
25
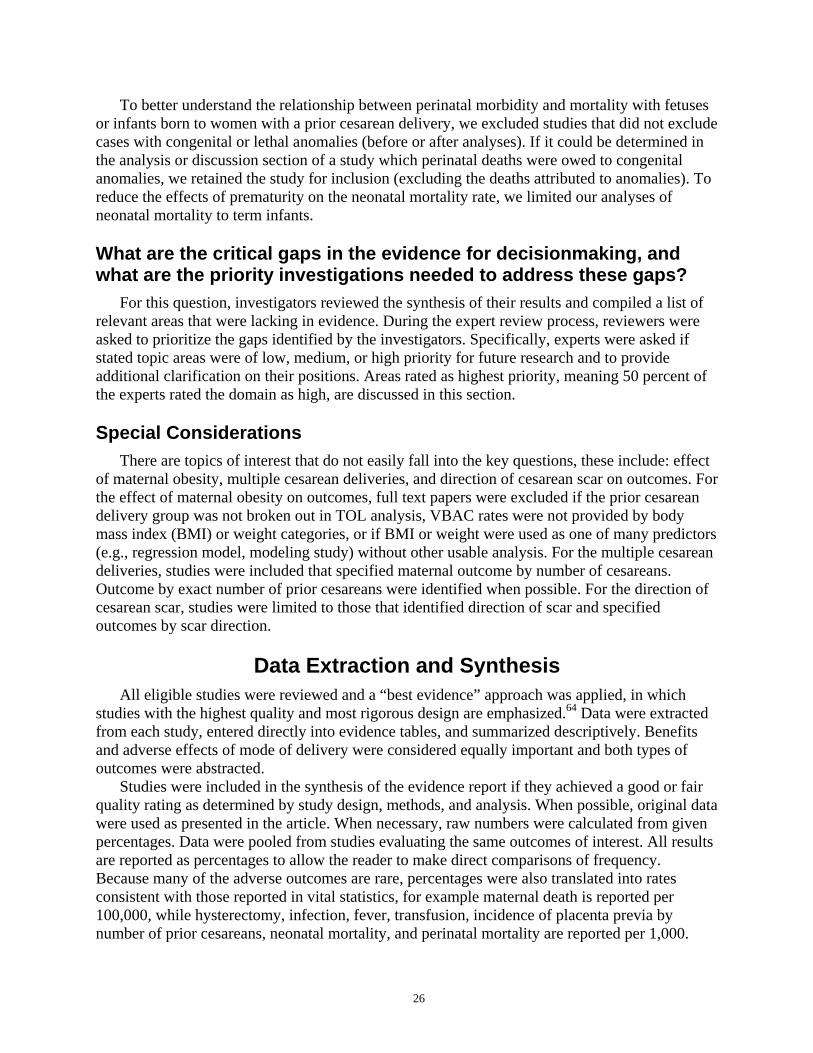
To better understand the relationship between perinatal morbidity and mortality with fetuses or infants born to women with a prior cesarean delivery, we excluded studies that did not exclude cases with congenital or lethal anomalies (before or after analyses). If it could be determined in the analysis or discussion section of a study which perinatal deaths were owed to congenital anomalies, we retained the study for inclusion (excluding the deaths attributed to anomalies). To reduce the effects of prematurity on the neonatal mortality rate, we limited our analyses of neonatal mortality to term infants.
What are the critical gaps in the evidence for decisionmaking, and what are the priority investigations needed to address these gaps?
For this question, investigators reviewed the synthesis of their results and compiled a list of relevant areas that were lacking in evidence. During the expert review process, reviewers were asked to prioritize the gaps identified by the investigators. Specifically, experts were asked if stated topic areas were of low, medium, or high priority for future research and to provide additional clarification on their positions. Areas rated as highest priority, meaning 50 percent of the experts rated the domain as high, are discussed in this section.
Special Considerations There are topics of interest that do not easily fall into the key questions, these include: effect
of maternal obesity, multiple cesarean deliveries, and direction of cesarean scar on outcomes. For the effect of maternal obesity on outcomes, full text papers were excluded if the prior cesarean delivery group was not broken out in TOL analysis, VBAC rates were not provided by body mass index (BMI) or weight categories, or if BMI or weight were used as one of many predictors (e.g., regression model, modeling study) without other usable analysis. For the multiple cesarean deliveries, studies were included that specified maternal outcome by number of cesareans. Outcome by exact number of prior cesareans were identified when possible. For the direction of cesarean scar, studies were limited to those that identified direction of scar and specified outcomes by scar direction.
Data Extraction and Synthesis All eligible studies were reviewed and a “best evidence” approach was applied, in which
studies with the highest quality and most rigorous design are emphasized.64 Data were extracted from each study, entered directly into evidence tables, and summarized descriptively. Benefits and adverse effects of mode of delivery were considered equally important and both types of outcomes were abstracted.
Studies were included in the synthesis of the evidence report if they achieved a good or fair quality rating as determined by study design, methods, and analysis. When possible, original data were used as presented in the article. When necessary, raw numbers were calculated from given percentages. Data were pooled from studies evaluating the same outcomes of interest. All results are reported as percentages to allow the reader to make direct comparisons of frequency. Because many of the adverse outcomes are rare, percentages were also translated into rates consistent with those reported in vital statistics, for example maternal death is reported per 100,000, while hysterectomy, infection, fever, transfusion, incidence of placenta previa by number of prior cesareans, neonatal mortality, and perinatal mortality are reported per 1,000.
26

Several included studies came from the National Institute of Child Health and Human Development Maternal-Fetal Medicine Units Network (MFMU) cohort (Appendix G). For synthesis, the most appropriate study is included for the outcome being discussed.
Studies that did not use an anatomic definition for uterine rupture were excluded from analysis of rates of uterine rupture. For other topic areas where studies that used an anatomic definition were not available (predictors, imaging to predict uterine rupture, and timing from symptom to delivery as a predictor of infant outcome), information was provided from existing studies. Quality Rating of Individual Studies
Reviewers rated the quality of RCTs, cohort, case-control, and case series studies using criteria specific to different study designs developed by the U.S. Preventive Services Task Force (U.S.PSTF) and additional criteria developed by the National Health Service Centre for Reviews and Dissemination, based at the University of York in England (Appendix H).65, 66 Two reviewers independently reviewed a small portion of the studies. When reviewers disagreed, a final rating was reached through consensus. When a Kappa of at least 0.60 was met between reviewers, a single reviewer rated the remaining studies.67 The Kappa between reviewers for this evidence report was 0.743 (95 percent CI: 0.537 to 0.949). Studies reporting several different outcomes may have different quality ratings for each outcome depending on how accurate the measure used was and how completely it controlled for potential confounders in multi-variable models (Appendix I). Studies determined to be poor quality were not included in the analyses, unless no studies of better quality were available for a given topic.
In addition to the quality criteria for each study design, the evaluation of prediction modeling studies required that they provided a clear definition of prognostic factors. The most important criteria for these studies were comparable groups that included clear inclusion and exclusion criteria; clear definitions of the prognostic factors; and adjustment (as needed, for studies without comparable groups) for confounders. To achieve a rating of good, minimally, the study had to meet these three ratings. A study with comparable groups and no need for adjustment could still meet this standard. For studies that only met two of these three criteria, the highest quality rating they could achieve was fair.
Development of Evidence Tables and Data Abstraction Process The following information about the patient population, study design, study outcomes, and
study quality was extracted from full text, published studies of VBAC and TOL, IOL, ERCD, or uterine rupture and was used to construct evidence tables showing: identifying information (study name, years of observation); setting (population-based, referral clinic-based, other); study design (randomized trial, prospective, etc.); interventions (induction, augmentation medications); outcomes studied (infant, maternal, cost, etc.); length of followup; statistical methods for handling confounders (statistical adjustment, stratification, none) and attrition; numbers of subjects recruited, included, and completing study; and characteristics of the sample (demographic variables, number of previous births, other risk factors). Data were abstracted by one reviewer and verified by a second.
For prediction studies, odds ratios are routinely presented unless noted by another measure of risk (relative risk [RR]). When possible all results are presented using the same reference and outcome. In the prediction sections, the results are presented for predicting TOL and for
27
predicting VBAC. If a study, for example, predicted repeat cesarean delivery after a TOL, the odds ratios were inverted so that all studies predicted VBAC.
Strength of Available Evidence We assessed the overall strength of the body of evidence for each key question using the
methods described in the Methods Reference Guide for Effectiveness and Comparative Effectiveness Reviews used by the Evidence-based Practice Centers.65 The purpose of grading the strength of the whole body of evidence is to provide information beyond study design hierarchy and internal validity assessment to other factors that are important to the application of information for clinical practice and policy. Parameters thought important to policymakers include quantity of evidence, assessment of risk of bias, precision, directness, and consistency. Risk of bias was assessed in two ways: first by describing the study designs used and assuming a hierarchy of designs in terms of risk of bias (randomized controlled trials inherently having lower risk of bias than do observational study designs) and secondly by reporting the cumulative internal quality rating of the included studies. In order to have low risk of bias, the studies would be both RCTs and also have good internal quality ratings overall, and bodies of evidence that are based on observational studies with poor internal quality ratings would be determined to have a high risk of bias. Moderate risk of bias would be the many combinations of factors that would fall in between these two extremes. Consistency was evaluated by determining if the majority of study results were trending in a similar direction, such that their point estimates and confidence intervals (CI) may vary, but the overall conclusions are similarly evaluable. The directness of the evidence was assessed by whether there was a direct link between the interventions studied and the outcomes of interest; for example if mortality due to uterine rupture is the outcome of interest, did the studies evaluate these in the same study or were separate bodies of evidence required to answer the question. Precision refers to how sure one can be of the point estimate of effect and was assessed by examining the narrowness of CIs of studies or CI of the point estimate resulting from pooled analysis. The body of evidence was graded for the evidence surrounding the most important outcomes in the report. A table was created presenting the ratings for each of these domains for the following maternal outcomes: VBAC rate, IOL rate (with subcategories of VBAC rate, uterine rupture rate, and other harms–stratified by intervention), maternal mortality, rate of uterine rupture, hysterectomy, transfusion, hemorrhage and blood loss, effect of IOL on hemorrhage, infection, and long-term sequelae (adhesions, pelvic pain, and reproductive health). The following infant outcomes are also captured on the table: perinatal, fetal, and neonatal mortality; transient tachypnea of the newborn (TTN); respiratory morbidity with bag-and-mask ventilation; respiratory morbidity with intubation for meconium; hypoxic-ischemic encephalopathy/asphyxia; neonatal intensive care unit (NICU) admissions; neurologic sequelae (short- and long-term); sepsis; trauma; and breastfeeding (Appendix J). From the assessments of the domains described above, an overall grade of the strength of the body of evidence was determined (high, medium, low, or insufficient). A high strength of evidence reflects a high degree of confidence that the body of evidence presents the true effect and suggests that additional studies and future research would have a low likelihood of changing the estimate. A moderate strength of evidence suggests that the confidence in the body of evidence is moderate and that additional studies may change the estimate. A low strength of evidence suggests that the confidence that the body of evidence is reflecting the true estimate is low and that it is likely that new studies may change the estimate. An insufficient
28
strength of evidence suggests that there is either no evidence or that the body of evidence does not permit estimating the true effect.
Data Synthesis In addition to discussion of the findings of the studies overall, meta-analyses were conducted
to summarize data and obtain more precise estimates on main outcomes for which studies were homogeneous enough to provide a meaningful combined estimate. Otherwise, the data are summarized qualitatively.
For common events, e.g., TOL and VBAC, where normal approximation applies, estimates of rates and their standard errors were calculated from each study and directly combined. A random effects model68 was used to combine the studies while incorporating variations among studies. Statistical heterogeneity was assessed by using the standard Q-test and the I2 statistic (the proportion of variation in study estimates due to heterogeneity rather than sampling error).69
Based on the Cochrane handbook, a rough guide to interpret I2 is as follows: 0 to 40 percent: might not be important; 30 to 60 percent: may represent moderate heterogeneity; 50 to 90 percent: may represent substantial heterogeneity; 75 to 100 percent: considerable heterogeneity. Furthermore, the importance of the observed value of I2 depends on (i) magnitude and
direction of effects and (ii) strength of evidence for heterogeneity (e.g., P value from the chi-squared test).69 The proportion of women in the induced groups who achieved VBAC or who had a uterine rupture was combined using MetaAnalyst (Beta 3.13; Tufts Medical Center).70 For the other outcomes, the rates were combined using STATA 10.1® (StataCorp, College Station, Texas, 2009).
For rare or relatively rare events—e.g., the number of ruptures, maternal deaths and infant deaths, etc.—normal approximation does not apply well to estimates of rates directly, and we used two slightly different methods to combine them. When studies did not report zero events in the group, we first logit-transformed the rates before combining the studies as the distribution for the logits of rates were usually approximately normal. The studies were then combined using a random effects model,68 and the combined rates were obtained by transforming the combined logit-rates to its original scale. Statistical heterogeneity (Q-test and I2 statistic) was assessed based on the logits of rates for these outcomes. These analyses were performed by using STATA 10.1® (StataCorp, College Station, Texas, 2009). When there are studies that reported zero events, a logistic random effects model71, 72 was used to include studies without events. This model also applies the logit-transformation of the rates to achieve better statistical property. In this case, statistical heterogeneity was assessed using Fisher’s exact test, and analyses were performed using the NLMIXED procedure in SAS v9.2 (SAS Institute Inc., Cary, NC, USA).
Risk ratio and/or risk difference were used to compare various rates between TOL and ERCD groups. Again the studies were combined by using a random effects model68 and statistical heterogeneity was assessed using Q-test and I2 statistic.
Forest plots were presented to graphically summarize the study results and the pooled results.73 To explore heterogeneity, we performed subgroup analyses and meta-regression74, 75 to evaluate whether the summary estimates differ by study level characteristics.
29

Size of Literature Of the 3,134 citations reviewed from the searches, 2,171 met exclusion criteria at the abstract
level and were not reviewed further. After the abstract review process, 963 full text papers were retrieved and reviewed for inclusion. An additional 37 full text papers were retrieved during the peer review process. After applying inclusion/exclusion criteria, a total of 203 full text papers met inclusion. Investigators quality rated included studies, and those rated good or fair quality are discussed in this report. As mentioned previously, poor quality studies are not discussed unless no studies of better quality were available for a given topic. For the topics presented, 71 studies provided data on TOL and VBAC rate, 27 on IOL or augmentation, 28 on predictors of TOL and VBAC, 14 on scored models for predicting VBAC, 41 on maternal outcomes, 28 on uterine rupture, 11 on infant outcomes, 19 on abnormal placentation, seven on obesity, 12 on multiple cesarean deliveries, and seven on direction of cesarean delivery scar (Figure 5).
30
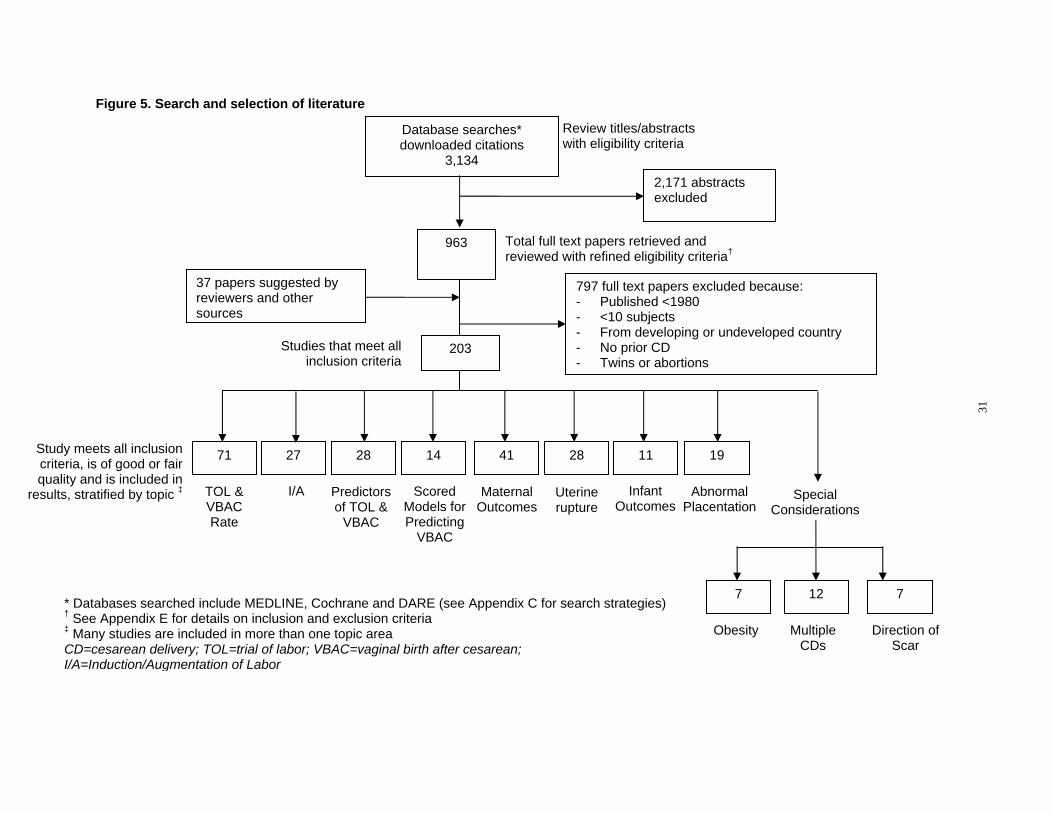
Review titles/abstracts with eligibility criteria
Database searches* downloaded citations
3,134 2,171 abstracts excluded
963 Total full text papers retrieved and reviewed with refined eligibility criteria†
797 full text papers excluded because: - Published <1980 - <10 subjects - From developing or undeveloped country - No prior CD - Twins or abortions
37 papers suggested by reviewers and other sources
203Studies that meet all inclusion criteria
Study meets all inclusion
criteria, is of good or fair
quality and is included in
71 27 28 14 41 28 11 19
results, stratified by topic ‡ TOL & I/A Predictors Scored Maternal Uterine Infant Abnormal SpecialVBAC of TOL & Models for Outcomes rupture Outcomes Placentation Considerations Rate VBAC Predicting
VBAC
* Databases searched include MEDLINE, Cochrane and DARE (see Appendix C for search strategies) 7 12 7
Figure 5. Search and selection of literature
† See Appendix E for details on inclusion and exclusion criteria Obesity Multiple Direction of ‡ Many studies are included in more than one topic area
CDs Scar CD=cesarean delivery; TOL=trial of labor; VBAC=vaginal birth after cesarean;
I/A=Induction/Augmentation of Labor
31
1
1
Chapter 3. Results Among women who attempt a trial of labor after prior
cesarean delivery, what is the vaginal delivery rate and the factors that influence it?
In the sections that follow for this question, the rate of trial of labor (TOL) and its predictors are presented followed by the rate of vaginal birth after cesarean (VBAC) with special focus on induction and spontaneous labor. The section closes with a summary of the many factors associated with VBAC and a review of tools that attempt to predict VBAC for women who have a TOL.
Trial of Labor Rate In order to understand the proportion of women who have a VBAC, the first searches were
for studies to estimate the proportion of women attempting a TOL in the United States (U.S.). To be included studies had to be at least fair quality, clearly define eligibility for TOL, as well as provide the number of women eligible for TOL and the number of women who had a TOL. Thirty-five observational studies consisting of 10 prospective cohort studies76-85 and 25 retrospective cohort studies,10, 27, 86-108 were combined providing a TOL rate of 61 percent (95 percent CI: 57 to 65 percent). This analysis (and all meta-analyses) was conducted using a random effects model that considers heterogeneity. In this analysis of 35 observational studies that included 661,765 TOL-eligible women, the Q-statistic for heterogeneity was high, with an I2
for between-heterogeneity of greater than 99 percent. The full range for TOL rates across the studies inside and outside the U.S. was 28 to 82 percent, Figure 6. Further stratification of study subgroups were conducted to assess differences that could explain the heterogeneity. Considered factors included study design (prospective versus retrospective), U.S. versus non-U.S. population, gestational age of the population (term versus any gestational age), and year of study. Among these, gestational age, country of origin, and year of study demonstrated statistically significant differences. Stratification by the study designs (retrospective and prospective) of all 35 studies revealed no significant association with TOL rates.
As shown in Figure 6, the overall TOL rate in studies conducted in the U.S. was 58 percent (95 percent CI: 52 to 65 percent), with a range of 28 to 70 percent, compared with 64 percent (95 percent CI: 59 to 70 percent) among women in studies conducted outside the U.S.
Appendixes and evidence tables cited in this report are available at http://www.ahrq.gov/downloads/pub/evidence/pdf/vbacup/vbacup.pdf.
33
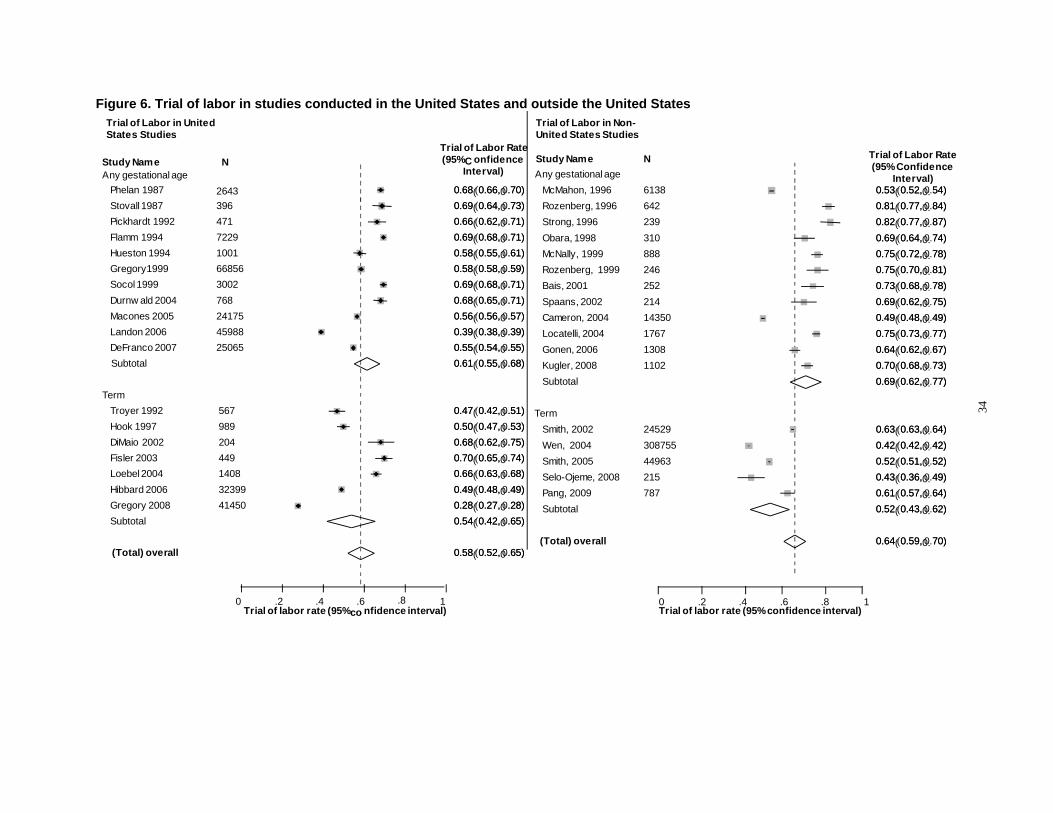
C (95% ConfidenceInterval) Any gestational age Interval) 0.0.6688 (( 00..666,6, 00 ..7070)) McMahon, 1996 6138 0.0.5533 (( 00..552,2, 0.0. 5454)) 0.0.6699 (( 00..664,4, 00 ..7373)) Rozenberg, 1996 642 0.0.8811 (( 00..777,7, 0.0. 8484)) 0.0.6666 (( 00..662,2, 00 ..7171)) Strong, 1996 239 0.0.8822 (( 00..777,7, 0.0. 8787)) 0.0.6699 (( 00..668,8, 00 ..7171)) Obara, 1998 310 0.0.6699 (( 00..664,4, 0.0. 7474)) 0.0.5588 (( 00..555,5, 00 ..6161)) McNally, 1999 888 0.0.7755 (( 00..772,2, 0.0. 7878)) 0.0.5588 (( 00..558,8, 00 ..5959)) Rozenberg, 1999 246 0.0.7755 (( 00..770,0, 0.0. 8181)) 0.0.6699 (( 00..668,8, 00 ..7171)) Bais, 2001 252 0.0.7733 (( 00..668,8, 0.0. 7878)) 0.0.6688 (( 00..665,5, 00 ..7171)) Spaans, 2002 214 0.0.6699 (( 00..662,2, 0.0. 7575)) 0.0.5566 (( 00..556,6, 00 ..5757)) Cameron, 2004 14350 0.0.4499 (( 00..448,8, 0.0. 4949)) 0.0.3399 (( 00..338,8, 00 ..3939)) Locatelli, 2004 1767 0.0.7755 (( 00..773,3, 0.0. 7777)) 0.0.5555 (( 00..554,4, 00 ..5555)) Gonen, 2006 1308 0.0.6644 (( 00..662,2, 0.0. 6767)) 0.0.6611 (( 00..555,5, 00 ..6868)) Kugler, 2008 1102 0.0.7700 (( 00..668,8, 0.0. 7373))
Subtotal 0.0.6699 (( 00..662,2, 0.0. 7777))
0.0.4477 (( 00..442,2, 00 ..5151)) Term
0.0.5500 (( 00..447,7, 00 ..5353)) Smith, 2002 24529 0.0.6633 (( 00..663,3, 0.0. 6464)) 0.0.6688 (( 00..662,2, 00 ..7575)) Wen, 2004 308755 0.0.4422 (( 00..442,2, 0.0. 4242)) 0.0.7700 (( 00..665,5, 00 ..7474)) Smith, 2005 44963 0.0.5522 (( 00..551,1, 0.0. 5252)) 0.0.6666 (( 00..663,3, 00 ..6868)) Selo-Ojeme, 2008 215 0.0.4433 (( 00..336,6, 0.0. 4949)) 0.0.4499 (( 00..448,8, 00 ..4949)) Pang, 2009 787 0.0.6611 (( 00..557,7, 0.0. 6464)) 0.0.2288 (( 00..227,7, 00 ..2828)) Subtotal 0.0.5522 (( 00..443,3, 0.0. 6262)) 0.0.5544 (( 00..442,2, 00 ..6565))
(Total) overall 0.0.6644 (( 00..559,9, 0.0. 7070)) 0.0.5588 (( 00..552,2, 00 ..6565))
.2 .4 .6 .8 1 0 .2 .4 .6 .8 1
Study Name N(95% onfidence
34
Figure 6. Trial of labor in studies conducted in the United States and outside the United States Trial of Labor in United Trial of Labor in Non-
States Studies United States Studies Trial of Labor Rate
Trial of Labor RateStudy Name N Any gestational age
Phelan 1987 2643 Stovall 1987 396 Pickhardt 1992 471 Flamm 1994 7229 Hueston 1994 1001 Gregory1999 66856 Socol 1999 3002 Durnw ald 2004 768 Macones 2005 24175 Landon 2006 45988 DeFranco 2007 25065 Subtotal
Term
Troyer 1992 567
Hook 1997 989
DiMaio 2002 204 Fisler 2003 449 Loebel 2004 1408 Hibbard 2006 32399 Gregory 2008 41450 Subtotal
(Total) overall
0Trial of labor rate (95%co nfidence interval) Trial of labor rate (95% confidence interval)
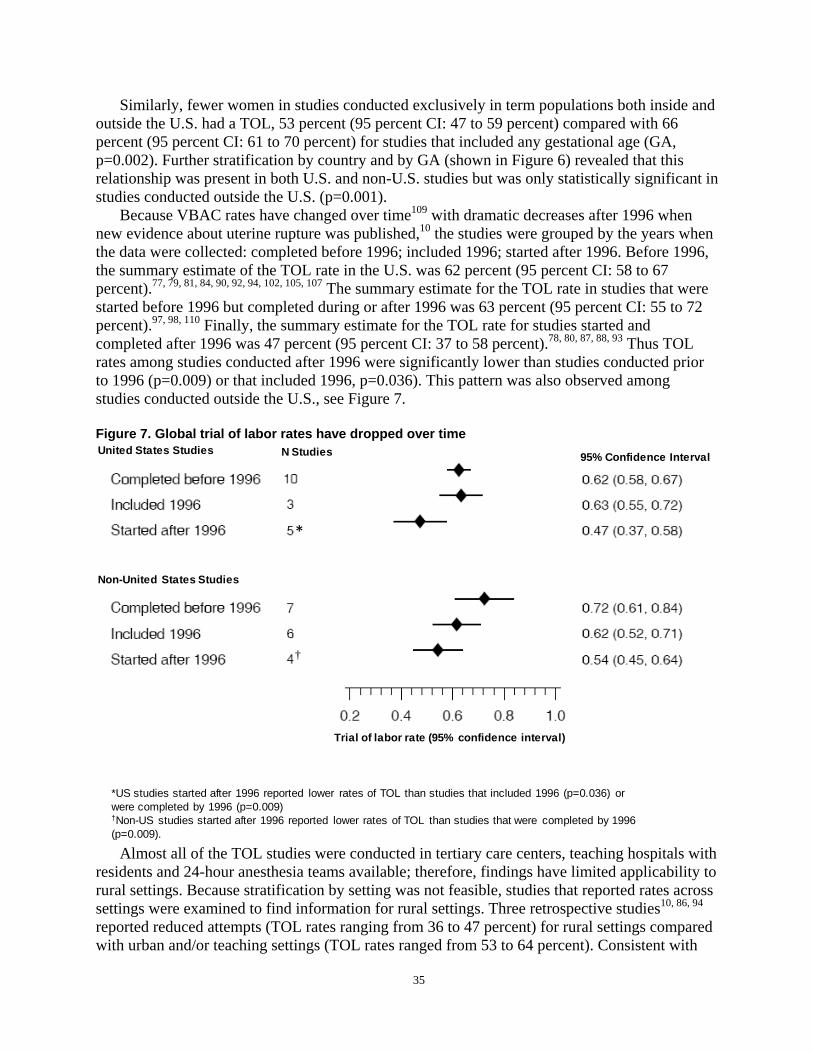
Similarly, fewer women in studies conducted exclusively in term populations both inside and outside the U.S. had a TOL, 53 percent (95 percent CI: 47 to 59 percent) compared with 66 percent (95 percent CI: 61 to 70 percent) for studies that included any gestational age (GA, p=0.002). Further stratification by country and by GA (shown in Figure 6) revealed that this relationship was present in both U.S. and non-U.S. studies but was only statistically significant in studies conducted outside the U.S. (p=0.001).
Because VBAC rates have changed over time109 with dramatic decreases after 1996 when new evidence about uterine rupture was published,10 the studies were grouped by the years when the data were collected: completed before 1996; included 1996; started after 1996. Before 1996, the summary estimate of the TOL rate in the U.S. was 62 percent (95 percent CI: 58 to 67 percent).77, 79, 81, 84, 90, 92, 94, 102, 105, 107 The summary estimate for the TOL rate in studies that were started before 1996 but completed during or after 1996 was 63 percent (95 percent CI: 55 to 72 percent).97, 98, 110 Finally, the summary estimate for the TOL rate for studies started and completed after 1996 was 47 percent (95 percent CI: 37 to 58 percent).78, 80, 87, 88, 93 Thus TOL rates among studies conducted after 1996 were significantly lower than studies conducted prior to 1996 (p=0.009) or that included 1996, p=0.036). This pattern was also observed among studies conducted outside the U.S., see Figure 7.
Figure 7. Global trial of labor rates have dropped over time United States Studies
Non-United States Studies
N Studies
*
†
95% Confidence Interval
*US studies started after 1996 reported lower rates of TOL than studies that included 1996 (p=0.036) or were completed by 1996 (p=0.009) †Non-US studies started after 1996 reported lower rates of TOL than studies that were completed by 1996
Trial of labor rate (95% confidence interval)
(p=0.009).
Almost all of the TOL studies were conducted in tertiary care centers, teaching hospitals with residents and 24-hour anesthesia teams available; therefore, findings have limited applicability to rural settings. Because stratification by setting was not feasible, studies that reported rates across settings were examined to find information for rural settings. Three retrospective studies10, 86, 94
reported reduced attempts (TOL rates ranging from 36 to 47 percent) for rural settings compared with urban and/or teaching settings (TOL rates ranged from 53 to 64 percent). Consistent with
35
this finding, one retrospective study reported that 70 percent of repeat cesarean deliveries (RCD) in rural settings were potentially unnecessary compared with 61 percent in urban teaching settings.111
Summary of trial of labor rates. The rates of TOL are highly variable ranging from 28 to 70 percent in the U.S. The evidence is largely limited to large tertiary teaching hospitals. TOL rates have declined, particularly after 1996, both inside and outside of the U.S. In the U.S. studies launched after 1996, less than half (47 percent) of women in the studies had a TOL.
Predictors of Trial of Labor Eight good or fair quality retrospective cohort studies,10, 27, 86, 94, 101, 112-114 and one fair quality
retrospective cross sectional study111 looked for factors known in the prenatal setting that may predict TOL. Three themes emerged from these studies related to site of delivery, history of prior vaginal delivery, and race. TOL was more likely in hospitals with higher delivery volumes, tertiary care centers, and teaching hospitals.10, 86, 94, 111 Women with a prior vaginal delivery had more than double the likelihood of a TOL (odds ratio 1.51 to 6.67).10, 86, 101 Finally, non-white women were more likely to have a TOL than white women (odds ratio 3.5).27 Further details and discussion of predictors of TOL can be found in Appendix K.
Vaginal Birth After Cesarean Rate As the TOL rate is decreasing, it is certainly important to examine what affect, if any, this
has on the VBAC rate and what factors are contributing to vaginal delivery. Sixty-seven studies, 14 fair quality prospective cohort studies76-85, 115-118 and 53 retrospective cohort studies60, 86-93, 110,
119-128 10, 27, 95-98, 100-108, 129-146 provided an overall summary estimate for VBAC of 74 percent (95 percent CI: 72 to 75 percent). The heterogeneity of this meta-analysis of 67 observational studies that included 368,304 women was high, I2 greater than 98 percent. The range in VBAC rates across studies inside and outside the US was 49 to 87 percent, Appendix L. To examine this heterogeneity, these studies were stratified and analyzed by study design (prospective versus retrospective; true cohort that included TOL and ERCD versus studies of TOL only), country (U.S. versus non-U.S.), GA (term only versus any GAs) and by years when the data were collected (completed before 1996, during 1996, and started after 1996). None of these factors were found to result in statistically significant differences (see Appendix L for detailed evaluation).
Summary and strength of evidence on vaginal birth after cesarean rates. The overall strength of the body of evidence is moderate. The rates of VBAC are highly variable in these studies. Most evidence of VBAC rates are from studies based in large tertiary care centers. While TOL rates have dropped over time, VBAC rates reported in observational studies have remained constant for the women who have a TOL. In studies based in the U.S., 74 percent (95 percent CI: 72 to 76 percent) of women who had a TOL delivered vaginally.
Induction of Labor A major area of interest is whether clinical antepartum and intrapartum management
strategies such as induction of labor (IOL) influence VBAC rates. Women with a history of a prior cesarean delivery who undergo a TOL may require cervical ripening, induction and/or augmentation of labor. Multiple approaches can be taken including mechanical, pharmacological or combinations. The potential impact of each method on the ultimate VBAC rate, as well as any
36
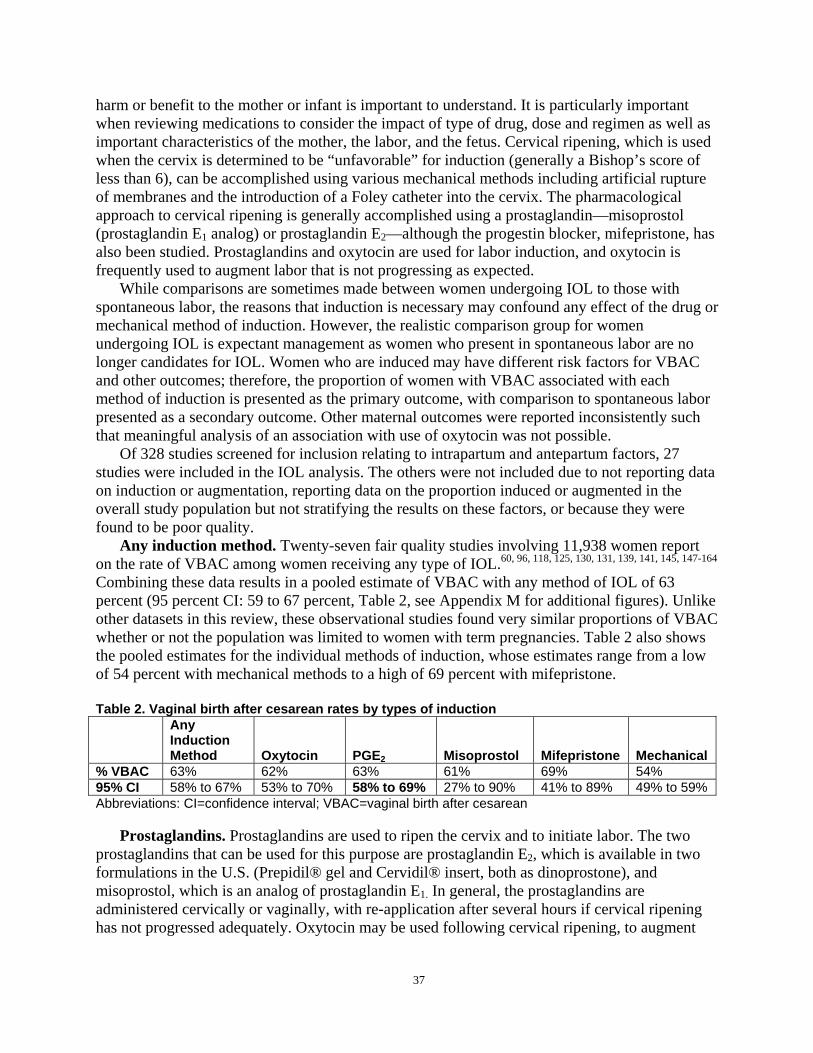
harm or benefit to the mother or infant is important to understand. It is particularly important when reviewing medications to consider the impact of type of drug, dose and regimen as well as important characteristics of the mother, the labor, and the fetus. Cervical ripening, which is used when the cervix is determined to be “unfavorable” for induction (generally a Bishop’s score of less than 6), can be accomplished using various mechanical methods including artificial rupture of membranes and the introduction of a Foley catheter into the cervix. The pharmacological approach to cervical ripening is generally accomplished using a prostaglandin—misoprostol (prostaglandin E1 analog) or prostaglandin E2—although the progestin blocker, mifepristone, has also been studied. Prostaglandins and oxytocin are used for labor induction, and oxytocin is frequently used to augment labor that is not progressing as expected.
While comparisons are sometimes made between women undergoing IOL to those with spontaneous labor, the reasons that induction is necessary may confound any effect of the drug or mechanical method of induction. However, the realistic comparison group for women undergoing IOL is expectant management as women who present in spontaneous labor are no longer candidates for IOL. Women who are induced may have different risk factors for VBAC and other outcomes; therefore, the proportion of women with VBAC associated with each method of induction is presented as the primary outcome, with comparison to spontaneous labor presented as a secondary outcome. Other maternal outcomes were reported inconsistently such that meaningful analysis of an association with use of oxytocin was not possible.
Of 328 studies screened for inclusion relating to intrapartum and antepartum factors, 27 studies were included in the IOL analysis. The others were not included due to not reporting data on induction or augmentation, reporting data on the proportion induced or augmented in the overall study population but not stratifying the results on these factors, or because they were found to be poor quality.
Any induction method. Twenty-seven fair quality studies involving 11,938 women report on the rate of VBAC among women receiving any type of IOL.60, 96, 118, 125, 130, 131, 139, 141, 145, 147-164
Combining these data results in a pooled estimate of VBAC with any method of IOL of 63 percent (95 percent CI: 59 to 67 percent, Table 2, see Appendix M for additional figures). Unlike other datasets in this review, these observational studies found very similar proportions of VBAC whether or not the population was limited to women with term pregnancies. Table 2 also shows the pooled estimates for the individual methods of induction, whose estimates range from a low of 54 percent with mechanical methods to a high of 69 percent with mifepristone.
Table 2. Vaginal birth after cesarean rates by types of induction Any Induction Method Oxytocin PGE2 Misoprostol Mifepristone Mechanical
% VBAC 63% 62% 63% 61% 69% 54% 95% CI 58% to 67% 53% to 70% 58% to 69% 27% to 90% 41% to 89% 49% to 59% Abbreviations: CI=confidence interval; VBAC=vaginal birth after cesarean
Prostaglandins. Prostaglandins are used to ripen the cervix and to initiate labor. The two prostaglandins that can be used for this purpose are prostaglandin E2, which is available in two formulations in the U.S. (Prepidil® gel and Cervidil® insert, both as dinoprostone), and misoprostol, which is an analog of prostaglandin E1. In general, the prostaglandins are administered cervically or vaginally, with re-application after several hours if cervical ripening has not progressed adequately. Oxytocin may be used following cervical ripening, to augment
37
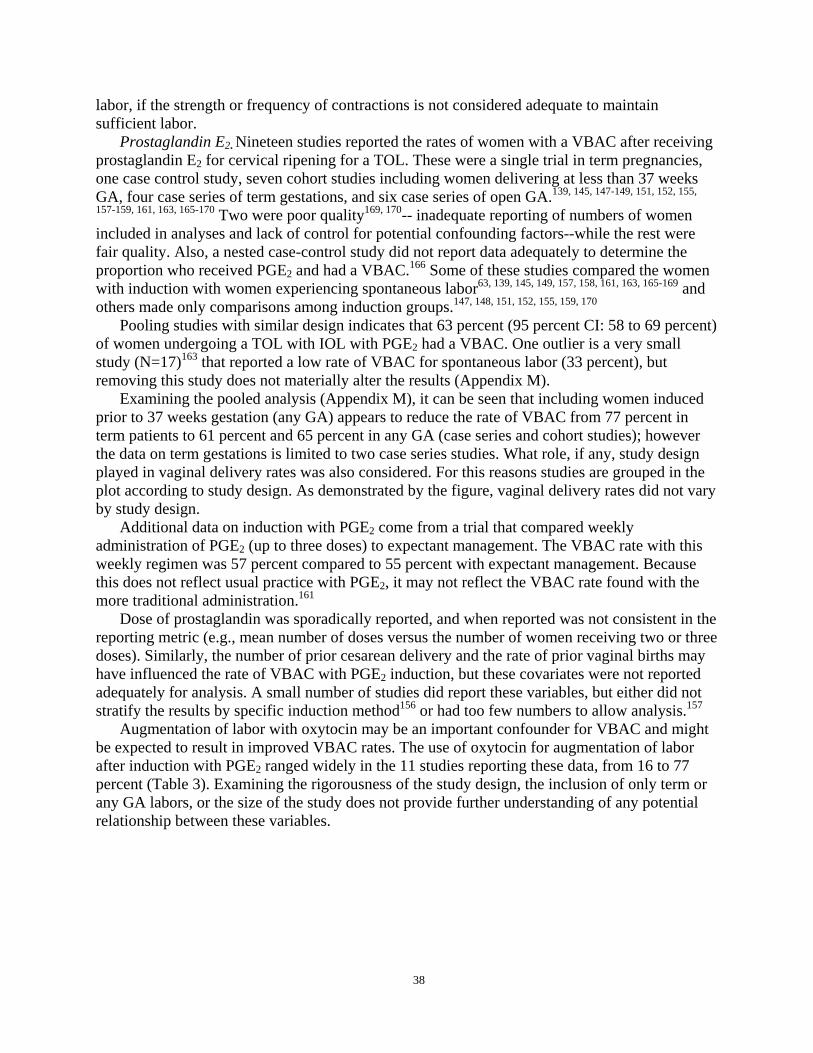
labor, if the strength or frequency of contractions is not considered adequate to maintain sufficient labor.
Prostaglandin E2. Nineteen studies reported the rates of women with a VBAC after receiving prostaglandin E2 for cervical ripening for a TOL. These were a single trial in term pregnancies, one case control study, seven cohort studies including women delivering at less than 37 weeks GA, four case series of term gestations, and six case series of open GA.139, 145, 147-149, 151, 152, 155,
157-159, 161, 163, 165-170 Two were poor quality169, 170-- inadequate reporting of numbers of women included in analyses and lack of control for potential confounding factors--while the rest were fair quality. Also, a nested case-control study did not report data adequately to determine the proportion who received PGE2 and had a VBAC.166 Some of these studies compared the women with induction with women experiencing spontaneous labor63, 139, 145, 149, 157, 158, 161, 163, 165-169 and others made only comparisons among induction groups.147, 148, 151, 152, 155, 159, 170
Pooling studies with similar design indicates that 63 percent (95 percent CI: 58 to 69 percent) of women undergoing a TOL with IOL with PGE2 had a VBAC. One outlier is a very small study (N=17)163 that reported a low rate of VBAC for spontaneous labor (33 percent), but removing this study does not materially alter the results (Appendix M).
Examining the pooled analysis (Appendix M), it can be seen that including women induced prior to 37 weeks gestation (any GA) appears to reduce the rate of VBAC from 77 percent in term patients to 61 percent and 65 percent in any GA (case series and cohort studies); however the data on term gestations is limited to two case series studies. What role, if any, study design played in vaginal delivery rates was also considered. For this reasons studies are grouped in the plot according to study design. As demonstrated by the figure, vaginal delivery rates did not vary by study design.
Additional data on induction with PGE2 come from a trial that compared weekly administration of PGE2 (up to three doses) to expectant management. The VBAC rate with this weekly regimen was 57 percent compared to 55 percent with expectant management. Because this does not reflect usual practice with PGE2, it may not reflect the VBAC rate found with the more traditional administration.161
Dose of prostaglandin was sporadically reported, and when reported was not consistent in the reporting metric (e.g., mean number of doses versus the number of women receiving two or three doses). Similarly, the number of prior cesarean delivery and the rate of prior vaginal births may have influenced the rate of VBAC with PGE2 induction, but these covariates were not reported adequately for analysis. A small number of studies did report these variables, but either did not stratify the results by specific induction method156 or had too few numbers to allow analysis.157
Augmentation of labor with oxytocin may be an important confounder for VBAC and might be expected to result in improved VBAC rates. The use of oxytocin for augmentation of labor after induction with PGE2 ranged widely in the 11 studies reporting these data, from 16 to 77 percent (Table 3). Examining the rigorousness of the study design, the inclusion of only term or any GA labors, or the size of the study does not provide further understanding of any potential relationship between these variables.
38
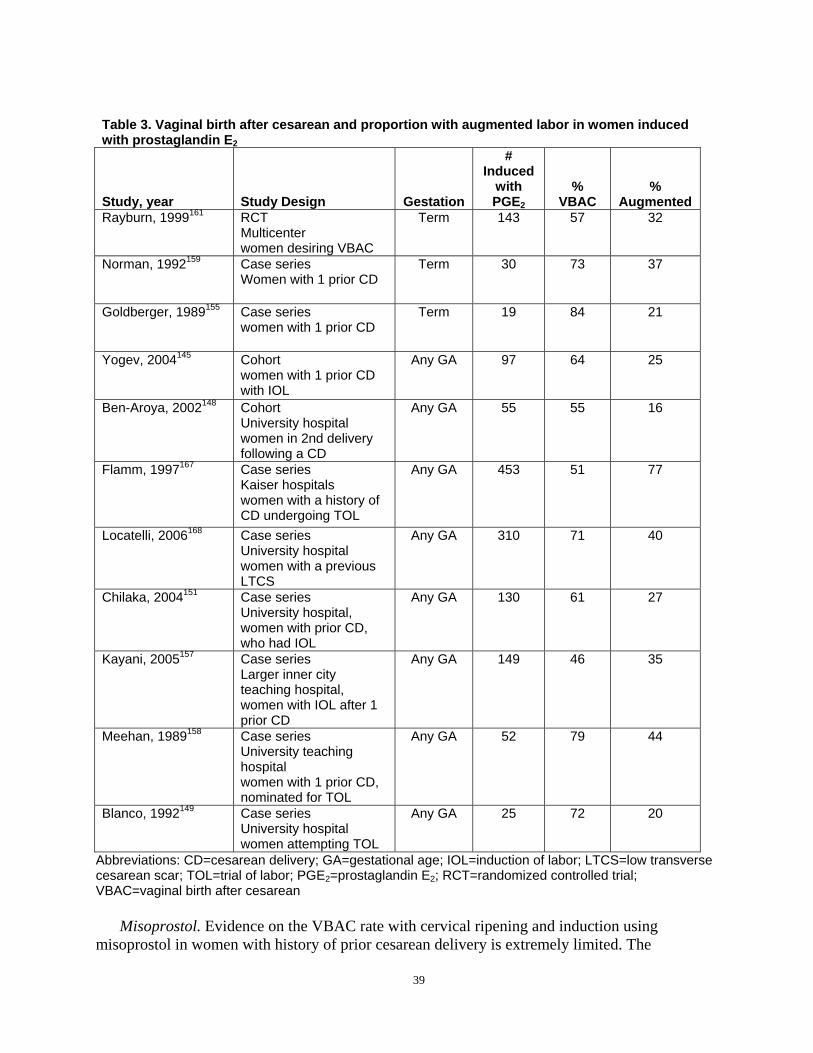
Table 3. Vaginal birth after cesarean and proportion with augmented labor in women induced with prostaglandin E2
Study, year Study Design Gestation
# Induced
with PGE2
% VBAC
% Augmented
Rayburn, 1999161 RCT Multicenter women desiring VBAC
Term 143 57 32
Norman, 1992159 Case series Women with 1 prior CD
Term 30 73 37
Goldberger, 1989155 Case series women with 1 prior CD
Term 19 84 21
Yogev, 2004145 Cohort women with 1 prior CD with IOL
Any GA 97 64 25
Ben-Aroya, 2002148 Cohort University hospital women in 2nd delivery following a CD
Any GA 55 55 16
Flamm, 1997167 Case series Kaiser hospitals women with a history of CD undergoing TOL
Any GA 453 51 77
Locatelli, 2006168 Case series University hospital women with a previous LTCS
Any GA 310 71 40
Chilaka, 2004151 Case series University hospital, women with prior CD, who had IOL
Any GA 130 61 27
Kayani, 2005157 Case series Larger inner city teaching hospital, women with IOL after 1 prior CD
Any GA 149 46 35
Meehan, 1989158 Case series University teaching hospital women with 1 prior CD, nominated for TOL
Any GA 52 79 44
Blanco, 1992149 Case series University hospital women attempting TOL
Any GA 25 72 20
Abbreviations: CD=cesarean delivery; GA=gestational age; IOL=induction of labor; LTCS=low transverse cesarean scar; TOL=trial of labor; PGE2=prostaglandin E2; RCT=randomized controlled trial; VBAC=vaginal birth after cesarean
Misoprostol. Evidence on the VBAC rate with cervical ripening and induction using misoprostol in women with history of prior cesarean delivery is extremely limited. The
39
contributing evidence comes from two small (N=96 combined) fair quality retrospective cohort studies that included women with any GAs. These two studies report widely different proportions of women with VBAC, 78 percent171 and 44 percent,172 with a pooled estimate of 61 percent (95 percent CI: 27 to 90 percent). Although these are fair quality studies in general, they may not represent similar populations, or because they are small may not have included enough women to be able to prevent sampling error.
Mifepristone. Mifepristone is a progestin blocker that has been studied for use in cervical ripening. A small (N=32), fair quality trial compared mifepristone 200 mg and placebo, each given orally for 2 days to women with a Bishop score of three or less, followed 2 days later by induction with prostaglandins, oxytocin, and/or artificial rupture of membranes as needed. Eligible women were scheduled for IOL due to post-date pregnancy, pre-eclampsia, or severe fetal growth retardation. Although the rate of onset of spontaneous labor was higher in the mifepristone group than in the placebo group (69 versus 12 percent), the rates of vaginal delivery were not statistically significantly different (69 versus 50 percent) although the study may have not had adequate statistical power to determine a difference at a p<0.05 level.173 Other findings that were different between the groups were the time between first dose and start of labor (60 hours and 30 minutes versus 82 hours and 50 minutes; p<0.01), and the amount of oxytocin required (2.11 international unit [IU] versus 4.67 IU; p<0.01) for mifepristone and placebo, respectively.
Oxytocin. Oxytocin is used for both IOL as well as augmentation of labor when contractions are inadequate to maintain progression of labor. Seventeen studies reported on the use of oxytocin in women with a prior cesarean delivery (one good quality cohort, nine fair quality cohorts, and five fair quality case series).11, 118, 125, 129-131, 141, 154, 156-158, 162, 164, 168, 169, 174, 175 While oxytocin can be used in combination with a prostaglandin, the focus here is on the use of oxytocin alone. Five studies reported VBAC rates with oxytocin alone used only for IOL (not augmentation),125, 141, 157, 162, 175 The pooled estimate of VBAC is 62 percent (95 percent CI: 53 to 70 percent). From the forest plot (Figure 8) it can be seen that the studies with lower quality design and including any GA report higher VBAC rates than either better studies (cohort design) or the single case series in term gestations. Additionally, the best quality study in this group reported an odds ratio for VBAC of 1.19 (95 percent CI: 0.93 to 1.53) for women who had IOL with a favorable cervix compared with women with spontaneous labor.156 It is not clear that this includes only oxytocin induction, however. A fair quality study reported a VBAC rate of 74 percent, but includes oxytocin and/or amniotomy.169
40
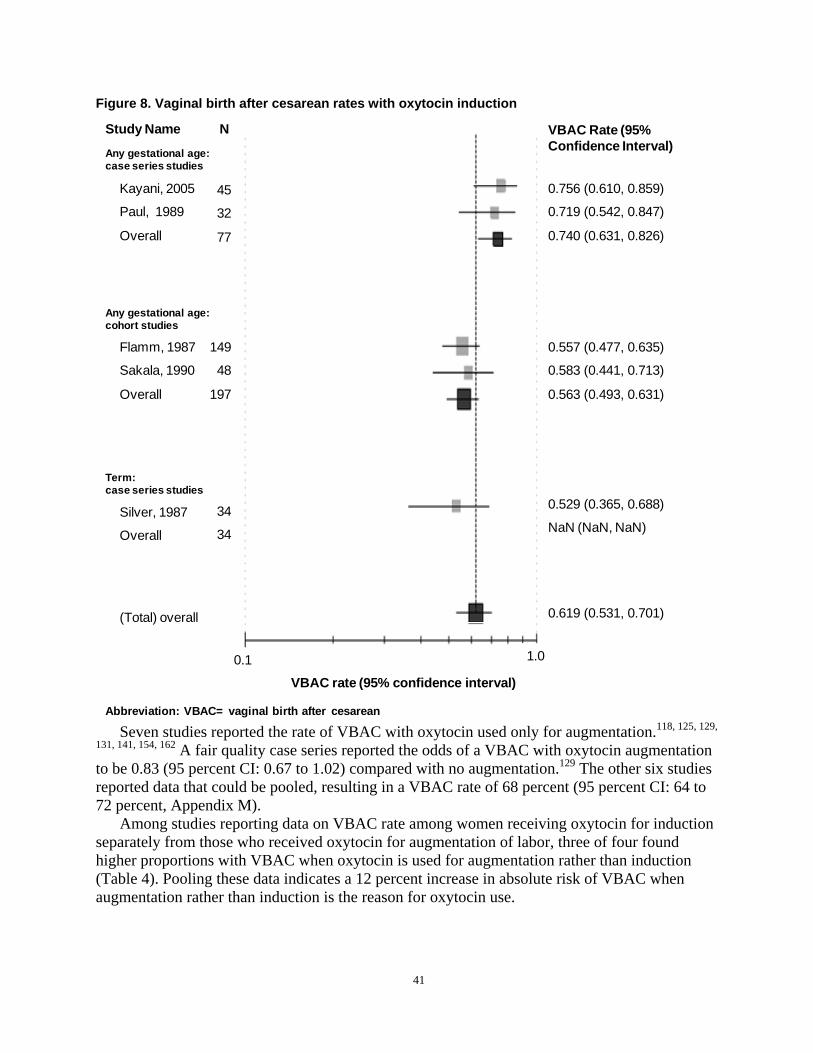
(Total) overall
Figure 8. Vaginal birth after cesarean rates with oxytocin induction
Study Name N VBAC Rate (95% Confidence Interval) Any gestational age:
case series studies
Kayani, 2005 45 0.756 (0.610, 0.859)
Paul, 1989 32 0.719 (0.542, 0.847)
Overall 77 0.740 (0.631, 0.826)
Any gestational age: cohort studies
Flamm, 1987 149 0.557 (0.477, 0.635)
Sakala, 1990 48 0.583 (0.441, 0.713)
Overall 197 0.563 (0.493, 0.631)
Term: case series studies
0.529 (0.365, 0.688) Silver, 1987 34 NaN (NaN, NaN) Overall 34
0.619 (0.531, 0.701) (Total) overall
1.0 0.1
VBAC rate (95% confidence interval)
Abbreviation: VBAC= vaginal birth after cesarean
Seven studies reported the rate of VBAC with oxytocin used only for augmentation.118, 125, 129,
131, 141, 154, 162 A fair quality case series reported the odds of a VBAC with oxytocin augmentation to be 0.83 (95 percent CI: 0.67 to 1.02) compared with no augmentation.129 The other six studies reported data that could be pooled, resulting in a VBAC rate of 68 percent (95 percent CI: 64 to 72 percent, Appendix M).
Among studies reporting data on VBAC rate among women receiving oxytocin for induction separately from those who received oxytocin for augmentation of labor, three of four found higher proportions with VBAC when oxytocin is used for augmentation rather than induction (Table 4). Pooling these data indicates a 12 percent increase in absolute risk of VBAC when augmentation rather than induction is the reason for oxytocin use.
41

Table 4. Vaginal birth after cesarean rate with oxytocin used for induction versus augmentation Study Study Design Induction Augmentation Silver, 1987162 Cohort
Medical center hospital, women at term with a history of one prior CD, who received intrapartum oxytocin
53% 63%
Sakala, 1990141 Cohort University hospital, women who underwent TOL and had > 1 prior CD
58% 88%
Flamm, 1987125 Cohort Kaiser hospitals, women with prior CD who were administered oxytocin
56% 69%
Paul/Horenstein, 1985131
Cohort University hospital, women with prior CD offered TOL
72% 69%
Pooled absolute difference in proportion with VBAC 12% (95% CI 0.3% to 24%) Abbreviations: CD=cesarean delivery; CI=confidence interval; TOL=trial of labor; VBAC=vaginal birth after cesarean
Dose of oxytocin (cumulative, maximum rate of infusion) was sporadically reported, and when reported was not consistent in the reporting metric. Similarly, while the number of prior cesarean deliveries may have influenced the rate of VBAC with PGE2 induction, these covariates were not reported adequately for analysis.
Prostaglandin E2 versus oxytocin. While the conditions that may lead to using PGE2 for IOL may differ from those for choosing oxytocin, there may be some value in comparing the benefits and harms of these two drugs, particularly if the reason for induction and underlying obstetric characteristics also can be compared. The best evidence comparing the effect of these two drugs on VBAC rates comes from a good quality cohort study of women at term who had one prior cesarean delivery.156 In this study of 11,778 women, 3,259 underwent IOL. An analysis of women induced with an unfavorable cervix compared with those experiencing spontaneous labor showed a significantly lower rate of VBAC in the induced group; odds ratio 0.46 (95 percent CI: 0.39 to 0.53). A similar analysis of women induced with a favorable cervix found no significant difference between groups; odds ratio 1.19 (95 percent CI: 0.93 to 1.53). Assuming that PGE2 (+ oxytocin) was used in those with unfavorable cervixes, and oxytocin used without PGE2 in those with favorable cervixes, this indicates a higher rate of VBAC with oxytocin alone. However, a small proportion of women were induced without either drug and direct comparisons were not undertaken. A poor quality trial enrolled 42 women and found a higher rate of VBAC with PGE2 (81 percent) compared with oxytocin (71percent); however the study was too small to find a statistically significant difference and methodological concerns indicate the need to interpret these findings with caution.176 Two other studies (from three publications) did not report data in a way that would allow comparison of VBAC between PGE2 and oxytocin
164, 177, 178 groups.Mechanical methods of induction. The evidence on the risk or benefits of mechanical
methods of cervical ripening in women with a prior cesarean delivery is limited to five studies.148, 150, 169, 179, 180 The best of these are two small retrospective cohort studies evaluating the use of a Foley catheter for cervical ripening compared with spontaneous labor.148, 150 The proportion of women with VBAC after Foley catheter IOL were 56 percent150 and 51 percent148
with a pooled proportion of 54 percent (95 percent CI: 49 to 59 percent). The first is a good quality study (N=2,479), that also included a group of women with
favorable cervixes who received amniotomy. Logistic regression controlling for several factors found that cervical ripening with a transcervical Foley catheter resulted in a slightly lower proportion with VBAC than with spontaneous labor (odds ratio 0.68; 95 percent CI: 0.41 to
42
1.15), while amniotomy resulted in a slightly higher rate (odds ratio 1.19; 95 percent CI: 0.84 to 1.69); neither was statistically significantly different from spontaneous labor.150
The other study (N=1,648) included women who received PGE2 tablets or Foley catheter for cervical ripening compared with spontaneous labor.148 This study has more flaws than the first, in that the baseline characteristics, such as number or prior cesarean deliveries, previous vaginal deliveries, inter-delivery interval, etc., are not as well described; neither was the dosing of PGE2 taken into account nor did the analysis control for confounding variables. This study found the rate of VBAC to be significantly lower in the Foley catheter group compared with the spontaneous labor group (51 versus 65 percent, p< 0.01).
In the first study, crude rates of VBAC were also lower in the Foley catheter group, but analysis controlling for confounding factors resulted in a non-significant difference.150 The authors of both studies note that for the outcome of uterine rupture, the studies were most likely underpowered to find differences between the groups; they estimate that it would require a sample size of greater than 10,000 patients to find a difference. Additional evidence on Foley catheter, a double-balloon device, and breast stimulation were inadequate to make determinations of VBAC rate, risk of uterine rupture, or other outcomes.169, 179, 180 No studies of other mechanical methods, e.g., acupuncture, were found.
Influence of prior vaginal delivery and indication for prior cesarean on vaginal birth after cesarean induction. A small case series of women requiring oxytocin induction or augmentation (N=98) did not find a significant difference in the rate of VBAC among those with prior vaginal deliveries compared with those with none among the group induced with oxytocin, but did find that prior vaginal delivery resulted in a higher rate of VBAC among those with oxytocin augmentation compared to those with no prior vaginal deliveries (86 and 56 percent, p<0.05).162 In this study, a recurrent indication for induction or augmentation resulted in significantly lower rates of VBAC compared with the groups without recurrent indications (38 versus 90 percent, p<0.01 and 81 versus 50 percent, p<0.05, respectively). Comparing the birth weights of current and previous deliveries in the induced and augmented groups resulted in a non-significant difference with those induced, but a difference favoring smaller fetuses among those augmented (84 versus 49 percent, p<0.01). Because this is a small case series, these data should be interpreted as suggestive, rather than conclusive.
In a fair quality study of 205 women with a prior cesarean delivery and who required induction, 41 percent of those with no prior vaginal deliveries had a VBAC, while 82 percent of those who did have prior vaginal delivery had a VBAC (odds ratio 6.8; 95 percent CI: 3.04 to 13.9).157
The relationship between the reason for the prior cesarean delivery and VBAC when oxytocin is used was examined in three studies (total N=595).118, 125, 130 The most commonly reported indications and pooled proportions with VBAC are listed in Table 5 below. Table 5. Most commonly reported indications and pooled proportions Indication for Prior cesarean delivery VBAC Rate Failure to progress/cephalopelvic Disproportion 54% (48% to 60%) Fetal Distress 60% (49% to 69%) Malpresentation/breech 75% (60% to 86%) Abbreviations: VBAC=vaginal birth after cesarean
Summary and strength of the evidence on induction of labor. Overall, evidence regarding the rate of VBAC among women with IOL is low to moderate strength, indicating that 63 percent of these women will have a VBAC (PGE2=63 percent, oxytocin=62 percent,
43
misoprostol=61 percent). Augmentation of labor with oxytocin was associated with a rate of 68 percent VBAC, although the strength of this evidence is low. Evidence was inadequate to make a comparison of VBAC resulting from induction with oxytocin or prostaglandin E2. Fifty-four percent of women induced with a Foley Catheter had a VBAC, based on moderate strength evidence. Other mechanical methods were not reported adequately to make comparisons or conclusions. Approximately 60 percent of the studies were conducted in university hospital settings, with the smaller studies also including community hospital settings such that the evidence is weighted towards the larger, tertiary care setting. Less than half of these studies were conducted in the U.S., with most of the others being conducted in Canada, Britain, Ireland, Sweden and Israel. For induction, the results were not stratified by age, race, ethnicity, or baseline risk. Predictors of Vaginal Birth After Cesarean
The impact of individual factors on VBAC discussed above can overlap and interact with each other such that a factor found to have statistically significant influence on VBAC rate may no longer be significant when other key factors are taken into account. Studies that evaluate these factors in concert, using regression analyses for example, can provide a higher level of evidence on the residual influence of individual factors. Four prospective cohort studies,85, 167, 181, 182 18 retrospective cohort studies,27, 61, 86, 99, 104, 106, 113, 119, 127, 136, 143, 146, 183-188 and one case-control study189 addressed predictive factors for VBAC. The key factors considered by these studies were demographic factors that included maternal age, ethnicity, race, and marital status; nonclinical factors that included insurance status, site of delivery, and volume of VBACs; past obstetric factors that included prior vaginal delivery and prior indications for cesarean delivery; pre-existing and current factors that included maternal height, body mass index (BMI), substance abuse, and pre-existing maternal disease; and current obstetric factors related to the infant gender, age and size. In this section, only the strongest predictors (supported by several good or fair cohort studies) that had an overall trend are presented. Full discussion of all predictors can be found in Appendix K.
Demographic factors. Of all demographic predictors that were evaluated, the strongest evidence was found for ethnicity and race. In all four cohort studies reporting on ethnicity and race, Hispanic women had a reduced likelihood of VBAC (by 31 to 49 percent, Appendix K) than non-Hispanic women.181, 182, 185, 187 In these same studies, African American women had a reduced likelihood of VBAC (by 20 to 49 percent) compared with white women.181, 182, 185, 187 It is interesting to note that non-white women were more likely to have a TOL but less likely to have a VBAC.27 While not included in the meta analysis of VBAC rates because the cohort included twin deliveries, one retrospective cohort study reported that African American women were more likely to fail at VBAC, were more likely to be hypertensive and have diabetes.190
Nonclinical factors. The site of delivery can play an important role in deciding what kind of birthing options are pursued, (Appendix K). Women at rural and private hospitals that provide obstetric care for lower risk deliveries had a decreased likelihood of VBAC.86, 111 This finding is consistent with another finding by the same investigators86 that women at rural and private hospitals were less likely to attempt a TOL. Private hospitals in this study had an average VBAC rate of 57 percent compared with a VBAC rate of 66 percent for perinatal centers.86
Past obstetric factors. There is particular interest in whether demographic factors, nonclinical and past obstetric factors may predict VBAC since these factors are known prenatally and would allow clinicians to provide information on prognosis early in pregnancy. Investigators from studies have explored prior vaginal delivery, years since prior cesarean delivery, prior labor
44
experience and prior baby weight as potential factors for predicting VBAC. A prior history of vaginal delivery was consistently reported to increase likelihood of VBAC in all 13 cohort studies86, 99, 104, 127, 136, 143, 167, 181-184, 187, 191 and one case-control study (Appendix K).189 Women with a vaginal delivery after their prior cesarean (prior VBAC) were three to seven times more likely to have a VBAC for their current delivery127, 167, 181-184, 189, 191 compared with women with no prior vaginal deliveries. Women who had a vaginal delivery before their cesarean deliveries also had an increased likelihood to have a VBAC.143, 167
One secondary analysis of a retrospective cohort study98 of 16 community and university hospitals123 specifically examined the effect of prior vaginal delivery before a cesarean and of a prior VBAC on the current TOL. The VBAC rate for women with no history of vaginal delivery was 65 percent, 83 percent for women with a prior vaginal delivery before a cesarean, and 94 percent for women with a prior VBAC.123 Finally, a secondary analysis of the National Institute of Child Health and Human Development Maternal-Fetal Medicine Units Network (MFMU) cohort data reported that the likelihood of a VBAC increased with each prior VBAC.192 Women with zero, one, two, three, and four or more prior VBACs had likelihoods of VBAC of 63.3, 87.6, 90.9, 90.6, and 91.6 percent (p<0.001), respectively.
Pre-existing and current obstetric factors. Many pre-existing factors (maternal height, BMI, smoking and substance use, and maternal disease) appear to change the likelihood of VBAC (Appendix K) but were only supported by single or two studies and are discussed in the appendix. Several investigators examined the effect of pre-existing disease on VBAC. In three of four cohort studies, women with a maternal disease (hypertension, diabetes, asthma, seizures, renal disease, thyroid disease, or collagen vascular disease) had a decreased likelihood (by 17 to 58 percent) of VBAC.127, 182, 187 By contrast, in a large prospective study by Grobman et al,181 the presence of diabetes, asthma, chronic hypertension, renal disease or heart disease, was not significant in the study’s multivariable logistic model.
Many current obstetric factors related to the infant (GA, birth weight and infant gender) predicted VBAC or TOL followed by a cesarean delivery. Of these, the most consistent finding is that as infant weight increases the likelihood of VBAC decreases. Four of five studies reported that women delivering infants weighing more than 4 kilograms (kg) had a reduced likelihood of VBAC (by 41 to 51 percent) than women who delivered smaller infants.86, 127, 143, 146, 182 The oldest of these studies143 found no relationship between a birth weight over 4 kg and likelihood of VBAC.
Obstetric factors related to the labor itself (dilation, effacement, station, Bishop score, cervix position) consistently predicted VBAC. Three prospective cohort studies,167, 182, 184 one retrospective study136 and one case-control study189 provided consistent evidence that women who were more dilated at admission or at rupture of membranes (ROM) were more likely to deliver vaginally. All three studies that examined effacement reported increased likelihood as effacement reached 75 to 100 percent.99, 167, 184 Similarly, all three studies that examined head position reported that as the baby’s position was vertex, engaged or at a lower station, the likelihood of VBAC increased.85, 136, 185 Both studies that examined Bishop’s score showed that as the score increased, the likelihood of VBAC increased two183 to six times.143
Overall impression of prediction studies. With the exception of three studies,104, 167, 181
these prognostic studies of VBAC could be described as exploratory.193 According to Simon and Altman, studies that report association and identify patients at risk but that have not yet had results confirmed in followup studies with pre-stated hypotheses, do not yet provide sufficient evidence to change clinical practice.193 The three studies104, 167, 181 that provided this cross
45
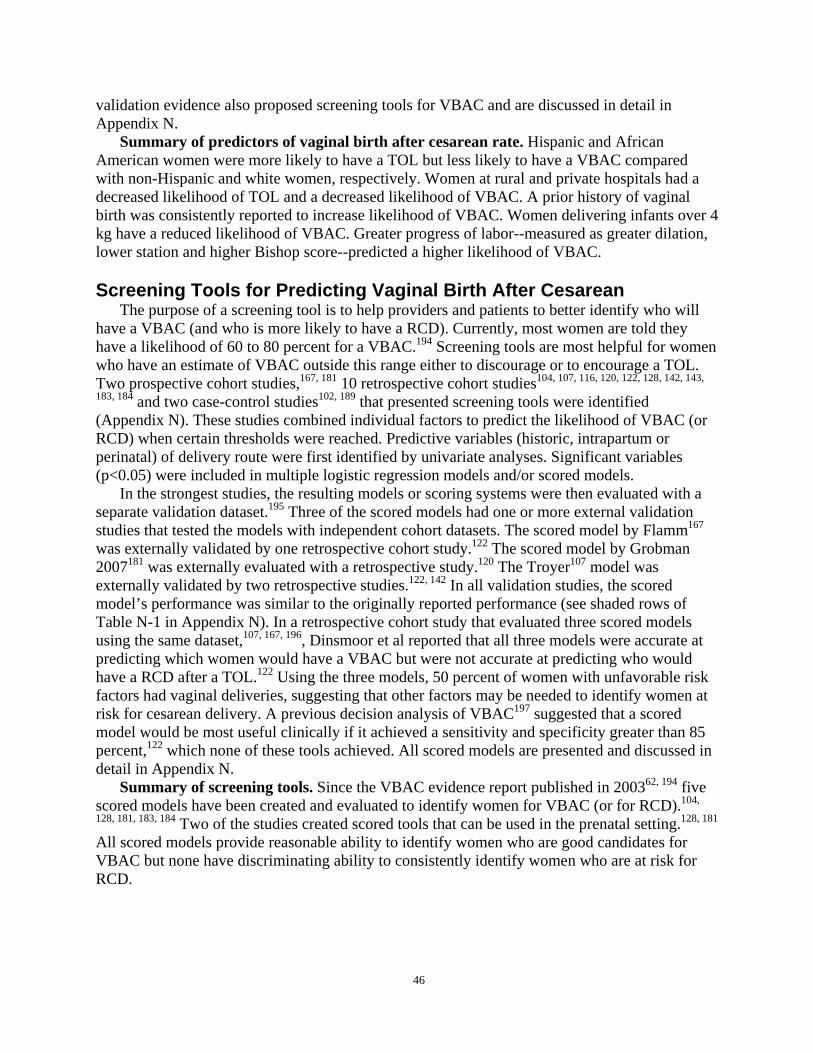
validation evidence also proposed screening tools for VBAC and are discussed in detail in Appendix N.
Summary of predictors of vaginal birth after cesarean rate. Hispanic and African American women were more likely to have a TOL but less likely to have a VBAC compared with non-Hispanic and white women, respectively. Women at rural and private hospitals had a decreased likelihood of TOL and a decreased likelihood of VBAC. A prior history of vaginal birth was consistently reported to increase likelihood of VBAC. Women delivering infants over 4 kg have a reduced likelihood of VBAC. Greater progress of labor--measured as greater dilation, lower station and higher Bishop score--predicted a higher likelihood of VBAC.
Screening Tools for Predicting Vaginal Birth After CesareanThe purpose of a screening tool is to help providers and patients to better identify who will
have a VBAC (and who is more likely to have a RCD). Currently, most women are told they have a likelihood of 60 to 80 percent for a VBAC.194 Screening tools are most helpful for women who have an estimate of VBAC outside this range either to discourage or to encourage a TOL. Two prospective cohort studies,167, 181 10 retrospective cohort studies104, 107, 116, 120, 122, 128, 142, 143,
183, 184 and two case-control studies102, 189 that presented screening tools were identified (Appendix N). These studies combined individual factors to predict the likelihood of VBAC (or RCD) when certain thresholds were reached. Predictive variables (historic, intrapartum or perinatal) of delivery route were first identified by univariate analyses. Significant variables (p<0.05) were included in multiple logistic regression models and/or scored models.
In the strongest studies, the resulting models or scoring systems were then evaluated with a separate validation dataset.195 Three of the scored models had one or more external validation studies that tested the models with independent cohort datasets. The scored model by Flamm167
was externally validated by one retrospective cohort study.122 The scored model by Grobman 2007181 was externally evaluated with a retrospective study.120 The Troyer107 model was externally validated by two retrospective studies.122, 142 In all validation studies, the scored model’s performance was similar to the originally reported performance (see shaded rows of Table N-1 in Appendix N). In a retrospective cohort study that evaluated three scored models using the same dataset,107, 167, 196, Dinsmoor et al reported that all three models were accurate at predicting which women would have a VBAC but were not accurate at predicting who would have a RCD after a TOL.122 Using the three models, 50 percent of women with unfavorable risk factors had vaginal deliveries, suggesting that other factors may be needed to identify women at risk for cesarean delivery. A previous decision analysis of VBAC197 suggested that a scored model would be most useful clinically if it achieved a sensitivity and specificity greater than 85 percent,122 which none of these tools achieved. All scored models are presented and discussed in detail in Appendix N.
Summary of screening tools. Since the VBAC evidence report published in 200362, 194 five scored models have been created and evaluated to identify women for VBAC (or for RCD).104,
128, 181, 183, 184 Two of the studies created scored tools that can be used in the prenatal setting.128, 181
All scored models provide reasonable ability to identify women who are good candidates for VBAC but none have discriminating ability to consistently identify women who are at risk for RCD.
46
What are the short- and long-term benefits and harms to the mother of attempting trial of labor after prior cesarean versus elective repeat cesarean delivery, and what factors influence
benefits and harms? This section reviews the maternal benefits and harms associated with VBAC compared with
ERCD. The goal of this endeavor is not only to describe the current knowledge of risks of each type of delivery, but to highlight important gaps in the literature. As part of this report, the following outcomes were examined: maternal death, uterine rupture, hysterectomy, transfusion and/or hemorrhage, infection, length of hospital stay, surgical injury, and composite morbidity. In addition, factors that may modify the outcomes associated with mode of delivery such as IOL, number of prior cesarean, deliveries and direction of scar are also discussed.
Maternal Death Maternal mortality rose in the U.S. after the dawn of the 21st century from seven to nine per
100,000 in the 80s and 90s to 12 to 15 per 100,000 since 2003.198-200 Although these rates are still very low, understanding whether choices patients and providers make about route of delivery and clinical management contribute to maternal mortality is critically important.
There were 12 good or fair quality cohort studies totaling 26 maternal deaths among 402,883 patients that reported maternal mortality associated with TOL and ERCD (Appendix O).76, 77, 81,
93, 97, 100, 108, 164, 201-204 The absolute risk of maternal death associated with TOL was 0.0038 percent (95 percent CI: 0.009 to 0.0155 percent) and with ERCD was 0.0134 percent (95 percent CI: 0.0043 to 0.0416 percent). Four studies focused exclusively on women delivering at term.93,
97, 108, 204 Among these four studies the maternal mortality was similarly lower for TOL (0.0019 percent; 95 percent CI: 0.0004 to 0.0095 percent) compared with ERCD (0.0096 percent; 95 percent CI: 0.0021 to 0.0432 percent, Figures 9 and 10).
One study from Canada reported differences in maternal mortality with TOL relative to ERCD for low and high volume maternity units. This study deserves mention because it was one of the only studies to evaluate maternal death in a range of institution types. This study evaluated both large tertiary centers as well as community hospitals, demarcating types by the number of deliveries per year.108 In low volume maternity wards defined as less than 500 deliveries a year, the odds ratio was 2.68 (0.16 to 45.5) for maternal mortality with TOL compared with RCD. High volume maternity wards, defined by greater than 500 deliveries per year, were noted to have an odds ratio of 0.16 (0.02 to 1.29) of mortality with TOL compared with RCD.108 No other studies stratified maternal death rates by institution size or delivery volume.
Summary and strength of evidence on maternal death. Overall, the strength of evidence regarding the rate of mortality for women with a prior cesarean delivery is high with good consistency and precision. While maternal mortality is rare with an overall rate of 10.1 per 100,000 for all women with prior cesarean, the risk of maternal mortality is significantly increased with ERCD. When combining the TOL group across all studies, the risk of maternal mortality is found to be 0.0038 percent (95 percent CI: 0.0009 to 0.0155 percent). The combined risk for ERCD group across all studies is 0.0134 percent (95 percent CI: 0.0043 to 0.0416 percent). This translates to 3.8 per 100,000 for TOL (95 percent CI: 0.9 to 15.5 per 100,000) and 13.4 per 100,000 for ERCD (95 percent CI: 4.3 to 41.6 per 100,000). When the analysis is limited to term studies, the combined risk of maternal deaths for TOL is 0.0019 percent for TOL
47
(95 percent CI: 0.0004 to 0.0095 percent) and 0.0096 percent for ERCD (95 percent CI: 0.0021 to 0.0432 percent); translating to 1.9 per 100,000 for TOL (95 percent CI: 0.4 to 9.5 per 100,000) and 9.6 per 100,000 for ERCD (95 percent CI: 2.1 to 43.2 per 100,000). In addition, metaregression showed that among TOL studies, maternal mortality was significantly lower among studies of term populations compared with studies of any gestational age (p=0.027) but there was no significant difference based upon gestational age among ERCD studies (p=0.141) (Figures 9 and 10).
While rare for both TOL and ERCD, compared to ERCD, the overall risk of maternal death associated with TOL is significantly lower (RR, 0.33, 95 percent CI: 0.13 to 0.88; p=0.027). Using 0.0134 percent as the baseline risk for ERCD, the calculated risk difference is -0.0090 percent (95 percent CI: -0.0117 to 0.0016 percent), translating to 9.0 less deaths per 100,000 (95 percent CI: 1.6 to 11.7 less deaths per 10,000) from the TOL group. Among the four studies focused exclusively on women delivering at term, the maternal mortality risk was similarly lower for TOL (RR: 0.27, 95 percent CI: 0.09 to 0.85; p=0.025). Using 0.0096 percent as the baseline risk for ERCD, the calculated risk difference is -0.0070 percent (95 percent CI: -0.0087 to 0.0014 percent), translating to 7.0 less deaths per 100,000 (95 percent CI: 1.4 to 8.7 less deaths per 10,000) from the TOL group, as compared to the ERCD group.
48
Death Rate(95% Confidence Interval)*
0 (0, 0.003972)
0.000016 (0.000002, 0.000056)
0.000065 (0.000002, 0.000364)
0 (0, 0.000321)
Figure 9. Rates of maternal death for trial of labor among all studies
49
N Total TOL
D th t (95% C f id I t l)
Death Rate (95% Confidence Interval)*
N Maternal Deaths
Loebel, 2004
Wen, 2004
Spong, 2007
Gregory, 2008
Study Name Term studies
Martin, 1983
Eglington, 1984
Phelan, 1987
Eriksen, 1989
Flamm, 1994
Obara, 1998
Zelop, 1999
Bais, 2001
Any gestational age studies 0
0
1
0
1
0
0
0
0
2
1
0
927
128,960
15,323
11,480
Combined (Test for heterogeneity is based on Fisher’s exact text P=0.443)
Combined (Test for heterogeneity is based on Fisher’s exact text P=0.521)
162
308
1,796
70
5,022
214
2,774
184
0 (0, 0.022514)
0 (0, 0.011905)
0.000557 (0.000014, 0.003098)
0 (0, 0.050629)
0.000199 (0.000005, 0.001109)
0 (0, 0.017090)
0 (0, 0.001329)
0 (0,019849)
0 (0, 0.003972)
0.000016 (0.000002, 0.000056)
0.000065 (0.000002, 0.000364)
0 (0, 0.000321)
0.000190 (0.000037, 0.000969)
0.000019 (0.000004, 0.000095)
All studies combined (Test for heterogeneity is based on Fisher’s exact text P=0.037) 0.000038 (0.000009, 0.000155)
0.000 0.002 0.004 0.006 Death rate (95% confidence interval)
*95% confidence intervals are exact Abbreviation: TOL= trial of labor
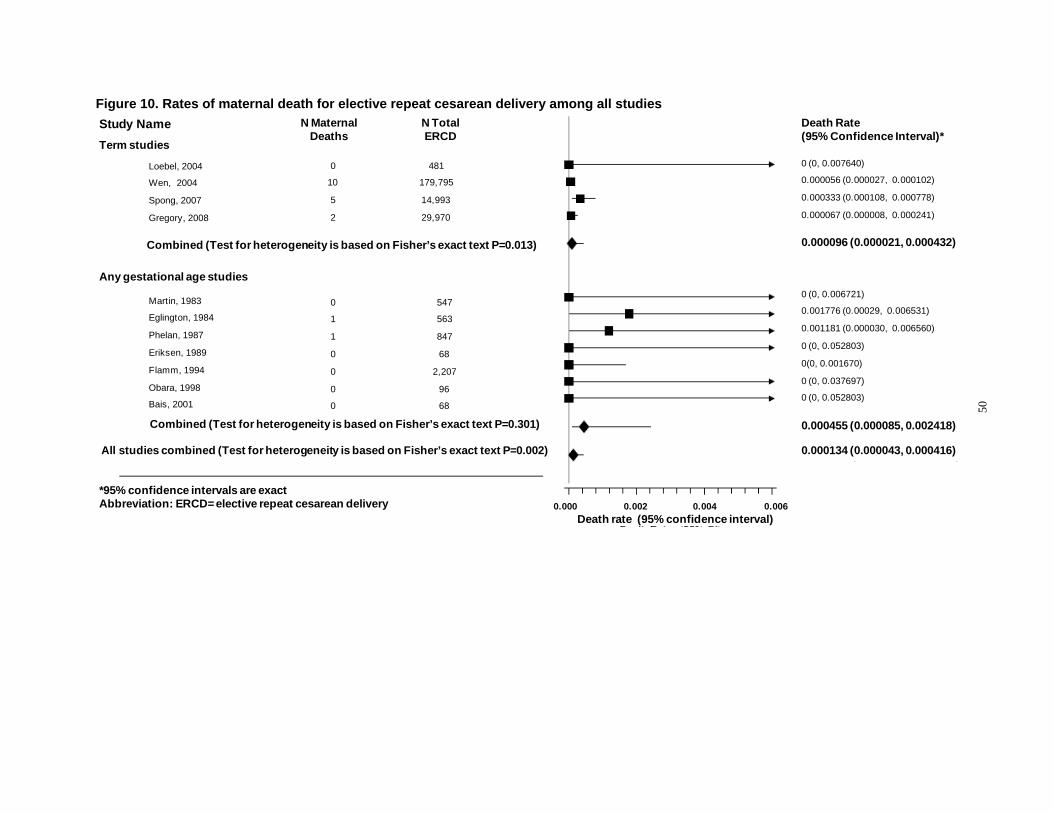
Figure 10. Rates of maternal death for elective repeat cesarean delivery among all studies
50
Any gestational age studies
N Total ERCD
N Maternal Deaths
Loebel, 2004
Wen, 2004
Spong, 2007
Gregory, 2008
Study Name Term studies
0
10
5
2
481
179,795
14,993
29,970
Combined (Test for heterogeneity is based on Fisher’s exact text P=0.013)
All studies combined (Test for heterogeneity is based on Fisher’s exact text P=0.002)
Combined (Test for heterogeneity is based on Fisher’s exact text P=0.301)
Martin, 1983
Eglington, 1984
Phelan, 1987
Eriksen, 1989
Flamm, 1994
Obara, 1998
Bais, 2001
0
1
1
0
0
0
0
547
563
847
68
2,207
96
68
Death Rate (95% Confidence Interval)*
0 (0, 0.006721)
0.001776 (0.00029, 0.006531)
0.001181 (0.000030, 0.006560)
0 (0, 0.052803)
0(0, 0.001670)
0 (0, 0.037697)
0 (0, 0.052803)
0 (0, 0.007640)
0.000056 (0.000027, 0.000102)
0.000333 (0.000108, 0.000778)
0.000067 (0.000008, 0.000241)
0.000455 (0.000085, 0.002418)
0.000096 (0.000021, 0.000432)
0.000134 (0.000043, 0.000416)
0.000 0.002 0.004 0.006 Death rate (95% confidence interval)
*95% confidence intervals are exact Abbreviation: ERCD= elective repeat cesarean delivery
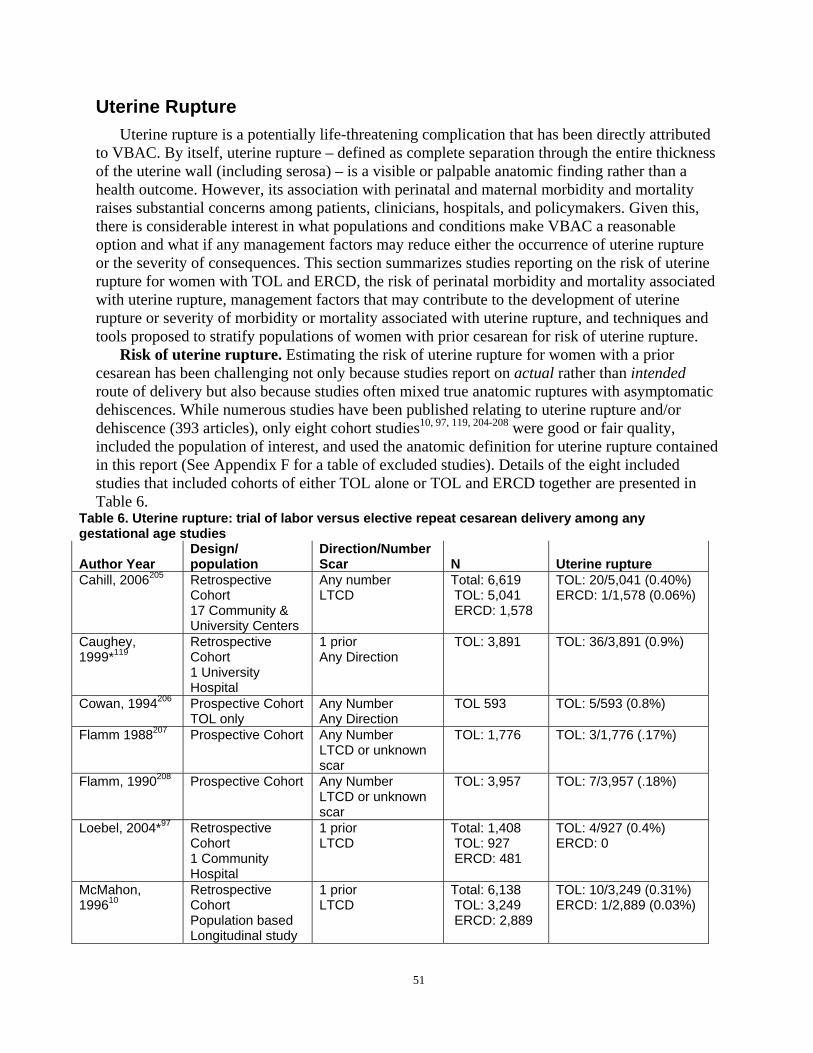
Uterine Rupture Uterine rupture is a potentially life-threatening complication that has been directly attributed
to VBAC. By itself, uterine rupture – defined as complete separation through the entire thickness of the uterine wall (including serosa) – is a visible or palpable anatomic finding rather than a health outcome. However, its association with perinatal and maternal morbidity and mortality raises substantial concerns among patients, clinicians, hospitals, and policymakers. Given this, there is considerable interest in what populations and conditions make VBAC a reasonable option and what if any management factors may reduce either the occurrence of uterine rupture or the severity of consequences. This section summarizes studies reporting on the risk of uterine rupture for women with TOL and ERCD, the risk of perinatal morbidity and mortality associated with uterine rupture, management factors that may contribute to the development of uterine rupture or severity of morbidity or mortality associated with uterine rupture, and techniques and tools proposed to stratify populations of women with prior cesarean for risk of uterine rupture.
Risk of uterine rupture. Estimating the risk of uterine rupture for women with a prior cesarean has been challenging not only because studies report on actual rather than intended route of delivery but also because studies often mixed true anatomic ruptures with asymptomatic dehiscences. While numerous studies have been published relating to uterine rupture and/or dehiscence (393 articles), only eight cohort studies10, 97, 119, 204-208 were good or fair quality, included the population of interest, and used the anatomic definition for uterine rupture contained in this report (See Appendix F for a table of excluded studies). Details of the eight included studies that included cohorts of either TOL alone or TOL and ERCD together are presented in Table 6.
Table 6. Uterine rupture: trial of labor versus elective repeat cesarean delivery among any gestational age studies
Author Year Design/ population
Direction/Number Scar N Uterine rupture
Cahill, 2006205 Retrospective Cohort 17 Community & University Centers
Any number LTCD
Total: 6,619 TOL: 5,041 ERCD: 1,578
TOL: 20/5,041 (0.40%) ERCD: 1/1,578 (0.06%)
Caughey, 1999*119
Retrospective Cohort 1 University Hospital
1 prior Any Direction
TOL: 3,891 TOL: 36/3,891 (0.9%)
Cowan, 1994206 Prospective Cohort TOL only
Any Number Any Direction
TOL 593 TOL: 5/593 (0.8%)
Flamm 1988207 Prospective Cohort Any Number LTCD or unknown scar
TOL: 1,776 TOL: 3/1,776 (.17%)
Flamm, 1990208 Prospective Cohort Any Number LTCD or unknown scar
TOL: 3,957 TOL: 7/3,957 (.18%)
Loebel, 2004*97 Retrospective Cohort 1 Community Hospital
1 prior LTCD
Total: 1,408 TOL: 927 ERCD: 481
TOL: 4/927 (0.4%) ERCD: 0
McMahon, 199610
Retrospective Cohort Population based Longitudinal study
1 prior LTCD
Total: 6,138 TOL: 3,249 ERCD: 2,889
TOL: 10/3,249 (0.31%) ERCD: 1/2,889 (0.03%)
51
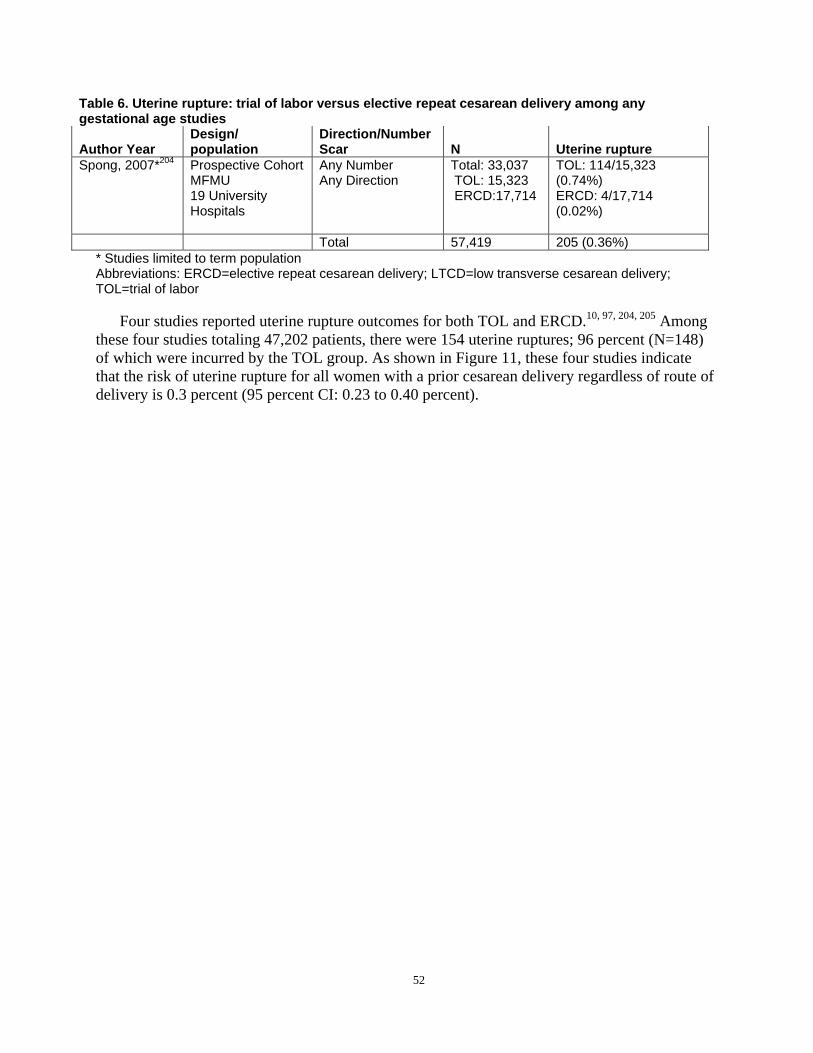
Table 6. Uterine rupture: trial of labor versus elective repeat cesarean delivery among any gestational age studies
Author Year Design/ population
Direction/Number Scar N Uterine rupture
Spong, 2007*204 Prospective Cohort MFMU 19 University Hospitals
Any Number Any Direction
Total: 33,037 TOL: 15,323 ERCD:17,714
TOL: 114/15,323 (0.74%) ERCD: 4/17,714 (0.02%)
Total 57,419 205 (0.36%) * Studies limited to term population Abbreviations: ERCD=elective repeat cesarean delivery; LTCD=low transverse cesarean delivery; TOL=trial of labor
Four studies reported uterine rupture outcomes for both TOL and ERCD.10, 97, 204, 205 Among these four studies totaling 47,202 patients, there were 154 uterine ruptures; 96 percent (N=148) of which were incurred by the TOL group. As shown in Figure 11, these four studies indicate that the risk of uterine rupture for all women with a prior cesarean delivery regardless of route of delivery is 0.3 percent (95 percent CI: 0.23 to 0.40 percent).
52
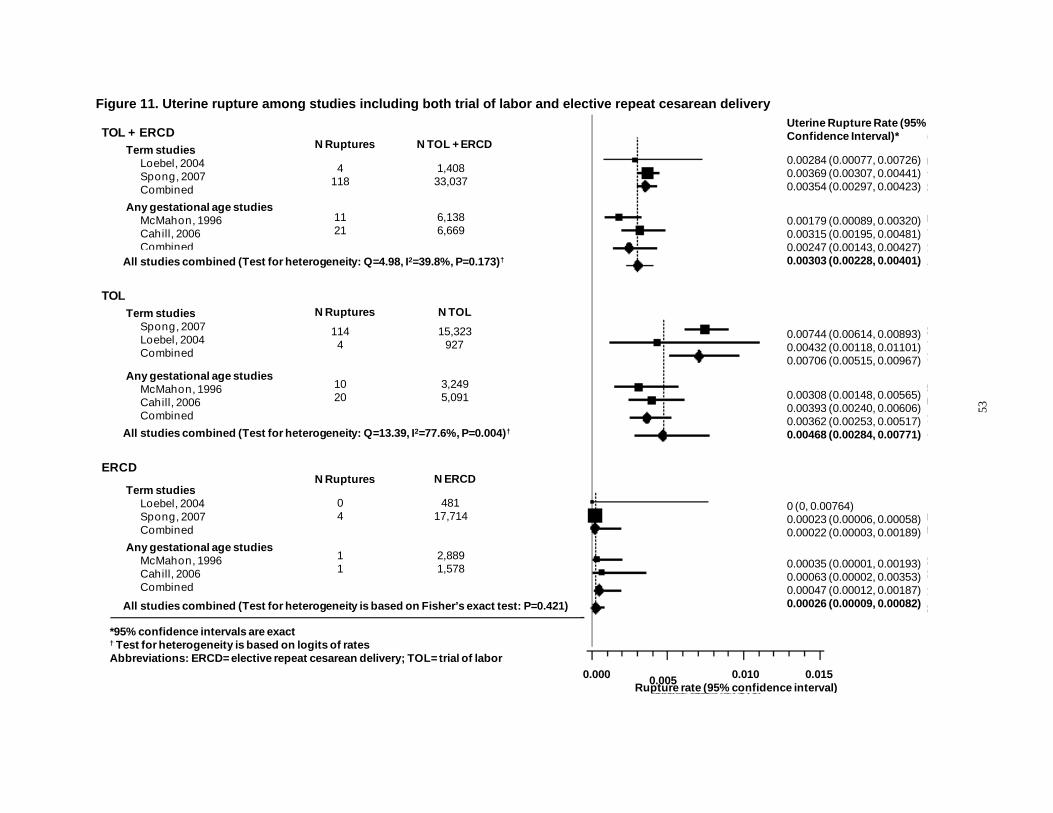
Figure 11. Uterine rupture among studies including both trial of labor and elective repeat cesarean delivery
4 118
1,408 33,037
Term studies Loebel, 2004 Spong, 2007 Combined
Any gestational age studies McMahon, 1996 Cahill, 2006 Combined
11 21
6,138 6,669
All studies combined (Test for heterogeneity: Q=4.98, I2=39.8%, P=0.173)†
TOL + ERCD
N TOL N Ruptures
N TOL + ERCD N Ruptures
114 4
15,323 927
10 20
3,249 5,091
0.00284 (0.00077, 0.00726) 0.00369 (0.00307, 0.00441) 0.00354 (0.00297, 0.00423)
0.00179 (0.00089, 0.00320) 0.00315 (0.00195, 0.00481) 0.00247 (0.00143, 0.00427) 0.00303 (0.00228, 0.00401)
Uterine Rupture Rate (95% Confidence Interval)*
0.00744 (0.00614, 0.00893) 0.00432 (0.00118, 0.01101) 0.00706 (0.00515, 0.00967)
0.00308 (0.00148, 0.00565) 0.00393 (0.00240, 0.00606) 0.00362 (0.00253, 0.00517) 0.00468 (0.00284, 0.00771)
Term studies Spong, 2007 Loebel, 2004 Combined
Any gestational age studies McMahon, 1996 Cahill, 2006 Combined
TOL
All studies combined (Test for heterogeneity: Q=13.39, I2=77.6%, P=0.004)†
0 4
481 17,714
Term studies Loebel, 2004 Spong, 2007 Combined
Any gestational age studies McMahon, 1996 Cahill, 2006 Combined
1 1
2,889 1,578
ERCD N ERCD N Ruptures
0 (0, 0.00764) 0.00023 (0.00006, 0.00058) 0.00022 (0.00003, 0.00189)
0.00035 (0.00001, 0.00193) 0.00063 (0.00002, 0.00353) 0.00047 (0.00012, 0.00187) 0.00026 (0.00009, 0.00082) All studies combined (Test for heterogeneity is based on Fisher’s exact test: P=0.421)
*95% confidence intervals are exact † Test for heterogeneity is based on logits of rates Abbreviations: ERCD= elective repeat cesarean delivery; TOL= trial of labor
0.000 0.005 0.010 0.015 Rupture rate (95% confidence interval)
53
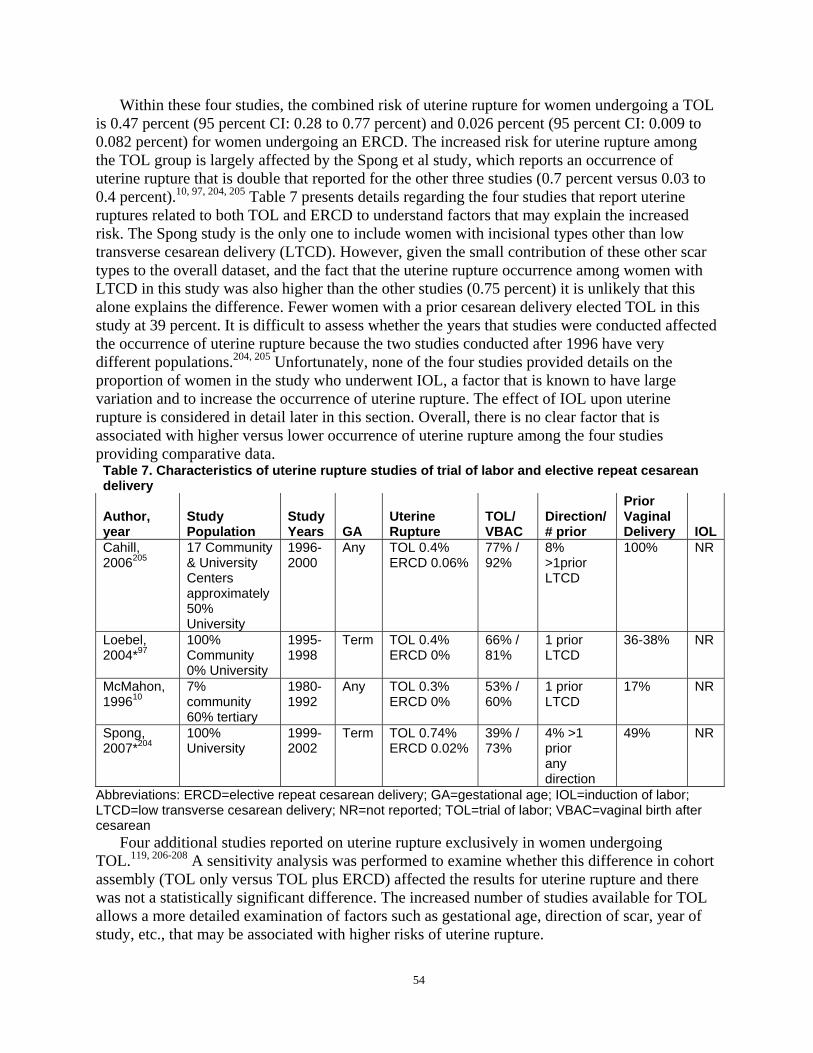
Within these four studies, the combined risk of uterine rupture for women undergoing a TOL is 0.47 percent (95 percent CI: 0.28 to 0.77 percent) and 0.026 percent (95 percent CI: 0.009 to 0.082 percent) for women undergoing an ERCD. The increased risk for uterine rupture among the TOL group is largely affected by the Spong et al study, which reports an occurrence of uterine rupture that is double that reported for the other three studies (0.7 percent versus 0.03 to 0.4 percent).10, 97, 204, 205 Table 7 presents details regarding the four studies that report uterine ruptures related to both TOL and ERCD to understand factors that may explain the increased risk. The Spong study is the only one to include women with incisional types other than low transverse cesarean delivery (LTCD). However, given the small contribution of these other scar types to the overall dataset, and the fact that the uterine rupture occurrence among women with LTCD in this study was also higher than the other studies (0.75 percent) it is unlikely that this alone explains the difference. Fewer women with a prior cesarean delivery elected TOL in this study at 39 percent. It is difficult to assess whether the years that studies were conducted affected the occurrence of uterine rupture because the two studies conducted after 1996 have very different populations.204, 205 Unfortunately, none of the four studies provided details on the proportion of women in the study who underwent IOL, a factor that is known to have large variation and to increase the occurrence of uterine rupture. The effect of IOL upon uterine rupture is considered in detail later in this section. Overall, there is no clear factor that is associated with higher versus lower occurrence of uterine rupture among the four studies providing comparative data. Table 7. Characteristics of uterine rupture studies of trial of labor and elective repeat cesarean delivery
Author, year
Study Population
Study Years GA
Uterine Rupture
TOL/ VBAC
Direction/ # prior
Prior Vaginal Delivery IOL
Cahill, 2006205
17 Community & University Centers approximately 50% University
19962000
Any TOL 0.4% ERCD 0.06%
77% / 92%
8% >1prior LTCD
100% NR
Loebel, 2004*97
100% Community 0% University
19951998
Term TOL 0.4% ERCD 0%
66% / 81%
1 prior LTCD
36-38% NR
McMahon, 199610
7% community 60% tertiary
19801992
Any TOL 0.3% ERCD 0%
53% / 60%
1 prior LTCD
17% NR
Spong, 2007*204
100% University
19992002
Term TOL 0.74% ERCD 0.02%
39% / 73%
4% >1 prior any direction
49% NR
Abbreviations: ERCD=elective repeat cesarean delivery; GA=gestational age; IOL=induction of labor; LTCD=low transverse cesarean delivery; NR=not reported; TOL=trial of labor; VBAC=vaginal birth after cesarean
Four additional studies reported on uterine rupture exclusively in women undergoing TOL.119, 206-208 A sensitivity analysis was performed to examine whether this difference in cohort assembly (TOL only versus TOL plus ERCD) affected the results for uterine rupture and there was not a statistically significant difference. The increased number of studies available for TOL allows a more detailed examination of factors such as gestational age, direction of scar, year of study, etc., that may be associated with higher risks of uterine rupture.
54
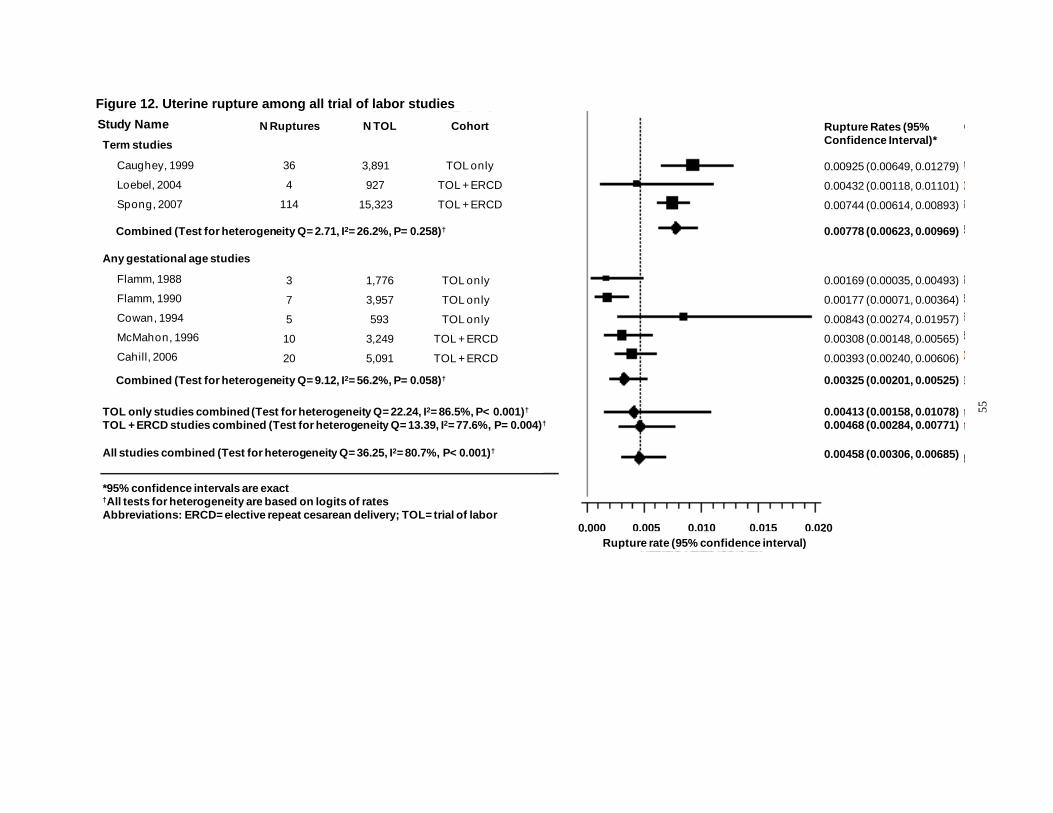
Figure 12. Uterine rupture among all trial of labor studies
55
Term studies
Caughey, 1999
Loebel, 2004
Spong, 2007
Study Name
Any gestational age studies
Flamm, 1988
Flamm, 1990
Cowan, 1994
McMahon, 1996
Cahill, 2006
36
4
114
N Ruptures
TOL only
TOL + ERCD
TOL + ERCD
3,891
927
15,323
N TOL Cohort
0.00925 (0.00649, 0.01279)
0.00432 (0.00118, 0.01101)
0.00744 (0.00614, 0.00893)
Rupture Rates (95% Confidence Interval)*
Combined (Test for heterogeneity Q= 2.71, I2= 26.2%, P= 0.258)† 0.00778 (0.00623, 0.00969)
All studies combined (Test for heterogeneity Q= 36.25, I2= 80.7%, P< 0.001)†
Combined (Test for heterogeneity Q= 9.12, I2= 56.2%, P= 0.058)†
3
7
5
10
20
1,776
3,957
593
3,249
5,091
TOL only
TOL only
TOL only
TOL + ERCD
TOL + ERCD
0.00169 (0.00035, 0.00493)
0.00177 (0.00071, 0.00364)
0.00843 (0.00274, 0.01957)
0.00308 (0.00148, 0.00565)
0.00393 (0.00240, 0.00606)
0.00325 (0.00201, 0.00525)
0.00458 (0.00306, 0.00685)
TOL only studies combined (Test for heterogeneity Q= 22.24, I2= 86.5%, P< 0.001)†
TOL + ERCD studies combined (Test for heterogeneity Q= 13.39, I2= 77.6%, P= 0.004)† 0.00413 (0.00158, 0.01078) 0.00468 (0.00284, 0.00771)
0.000 0.005 0.010 0.015 0.020
*95% confidence intervals are exact †All tests for heterogeneity are based on logits of rates Abbreviations: ERCD= elective repeat cesarean delivery; TOL= trial of labor
Rupture rate (95% confidence interval)
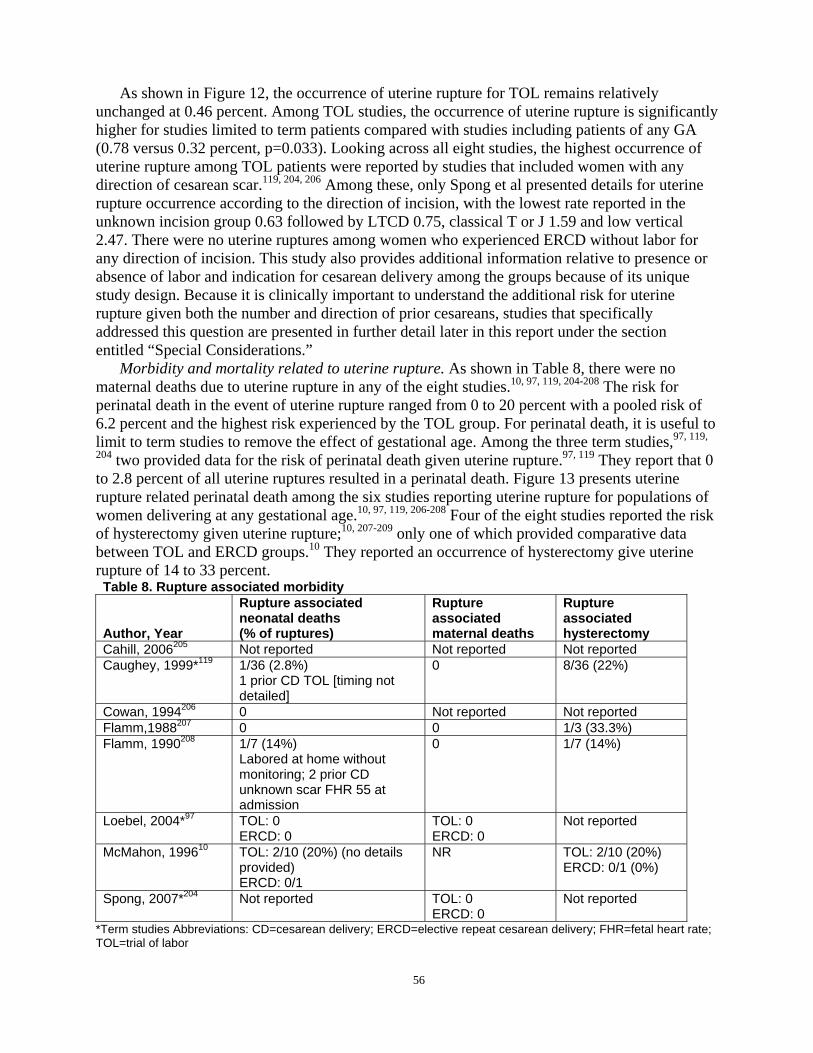
As shown in Figure 12, the occurrence of uterine rupture for TOL remains relatively unchanged at 0.46 percent. Among TOL studies, the occurrence of uterine rupture is significantly higher for studies limited to term patients compared with studies including patients of any GA (0.78 versus 0.32 percent, p=0.033). Looking across all eight studies, the highest occurrence of uterine rupture among TOL patients were reported by studies that included women with any direction of cesarean scar.119, 204, 206 Among these, only Spong et al presented details for uterine rupture occurrence according to the direction of incision, with the lowest rate reported in the unknown incision group 0.63 followed by LTCD 0.75, classical T or J 1.59 and low vertical 2.47. There were no uterine ruptures among women who experienced ERCD without labor for any direction of incision. This study also provides additional information relative to presence or absence of labor and indication for cesarean delivery among the groups because of its unique study design. Because it is clinically important to understand the additional risk for uterine rupture given both the number and direction of prior cesareans, studies that specifically addressed this question are presented in further detail later in this report under the section entitled “Special Considerations.”
Morbidity and mortality related to uterine rupture. As shown in Table 8, there were no maternal deaths due to uterine rupture in any of the eight studies.10, 97, 119, 204-208 The risk for perinatal death in the event of uterine rupture ranged from 0 to 20 percent with a pooled risk of 6.2 percent and the highest risk experienced by the TOL group. For perinatal death, it is useful to limit to term studies to remove the effect of gestational age. Among the three term studies,97, 119,
204 two provided data for the risk of perinatal death given uterine rupture.97, 119 They report that 0 to 2.8 percent of all uterine ruptures resulted in a perinatal death. Figure 13 presents uterine rupture related perinatal death among the six studies reporting uterine rupture for populations of women delivering at any gestational age.10, 97, 119, 206-208 Four of the eight studies reported the risk of hysterectomy given uterine rupture;10, 207-209 only one of which provided comparative data between TOL and ERCD groups.10 They reported an occurrence of hysterectomy give uterine rupture of 14 to 33 percent. Table 8. Rupture associated morbidity
Author, Year
Rupture associated neonatal deaths (% of ruptures)
Rupture associated maternal deaths
Rupture associated hysterectomy
Cahill, 2006205 Not reported Not reported Not reported Caughey, 1999*119 1/36 (2.8%)
1 prior CD TOL [timing not detailed]
0 8/36 (22%)
Cowan, 1994206 0 Not reported Not reported Flamm,1988207 0 0 1/3 (33.3%) Flamm, 1990208 1/7 (14%)
Labored at home without monitoring; 2 prior CD unknown scar FHR 55 at admission
0 1/7 (14%)
Loebel, 2004*97 TOL: 0 ERCD: 0
TOL: 0 ERCD: 0
Not reported
McMahon, 199610 TOL: 2/10 (20%) (no details provided) ERCD: 0/1
NR TOL: 2/10 (20%) ERCD: 0/1 (0%)
Spong, 2007*204 Not reported TOL: 0 ERCD: 0
Not reported
*Term studies Abbreviations: CD=cesarean delivery; ERCD=elective repeat cesarean delivery; FHR=fetal heart rate; TOL=trial of labor
56
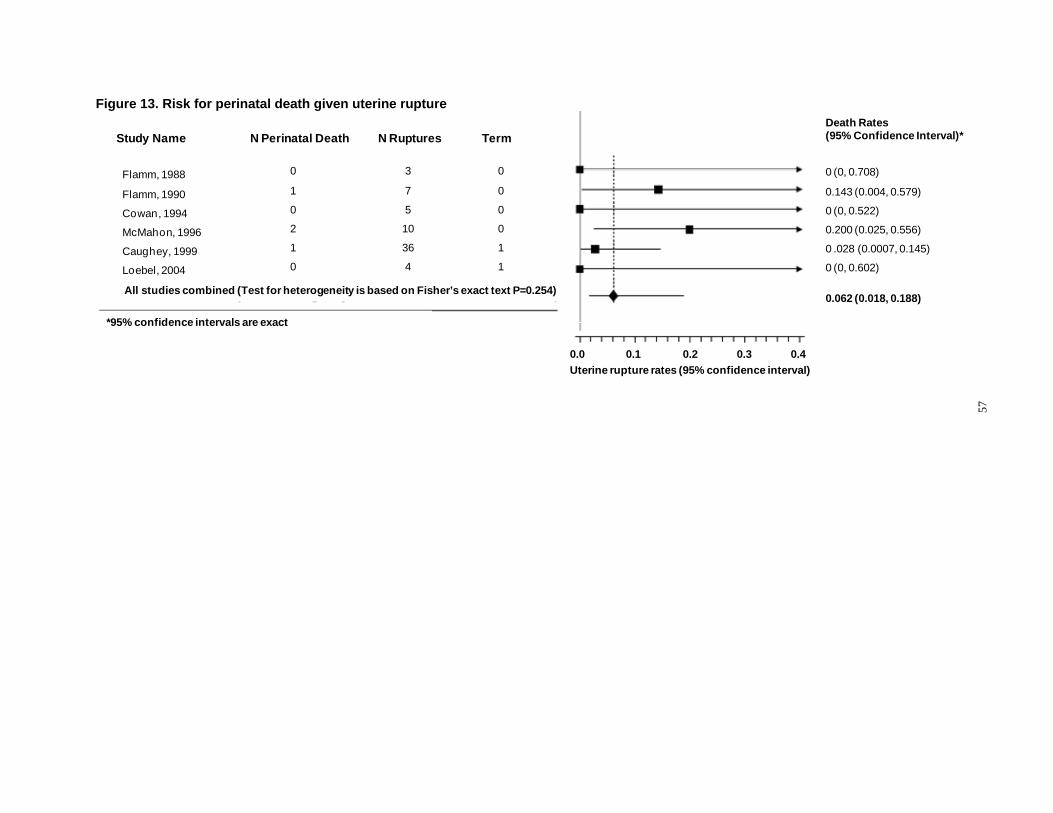
Figure 13. Risk for perinatal death given uterine rupture Death Rates
Study Name N Perinatal Death N Ruptures Term (95% Confidence Interval)*
Flamm, 1988 0 3 0 0 (0, 0.708)
Flamm, 1990 1 7 0 0.143 (0.004, 0.579)
Cowan, 1994 0 5 0 0 (0, 0.522)
2 10 0 0.200 (0.025, 0.556)
Caughey, 1999 1 36 1 0 .028 (0.0007, 0.145)
Loebel, 2004 0 4 1 0 (0, 0.602)
McMahon, 1996
All studies combined (Test for heterogeneity is based on Fisher’s exact text P=0.254) 0.062 (0.018, 0.188)
*95% confidence intervals are exact
0.0 0.1 0.2 0.3 0.4 Uterine rupture rates (95% confidence interval)
57
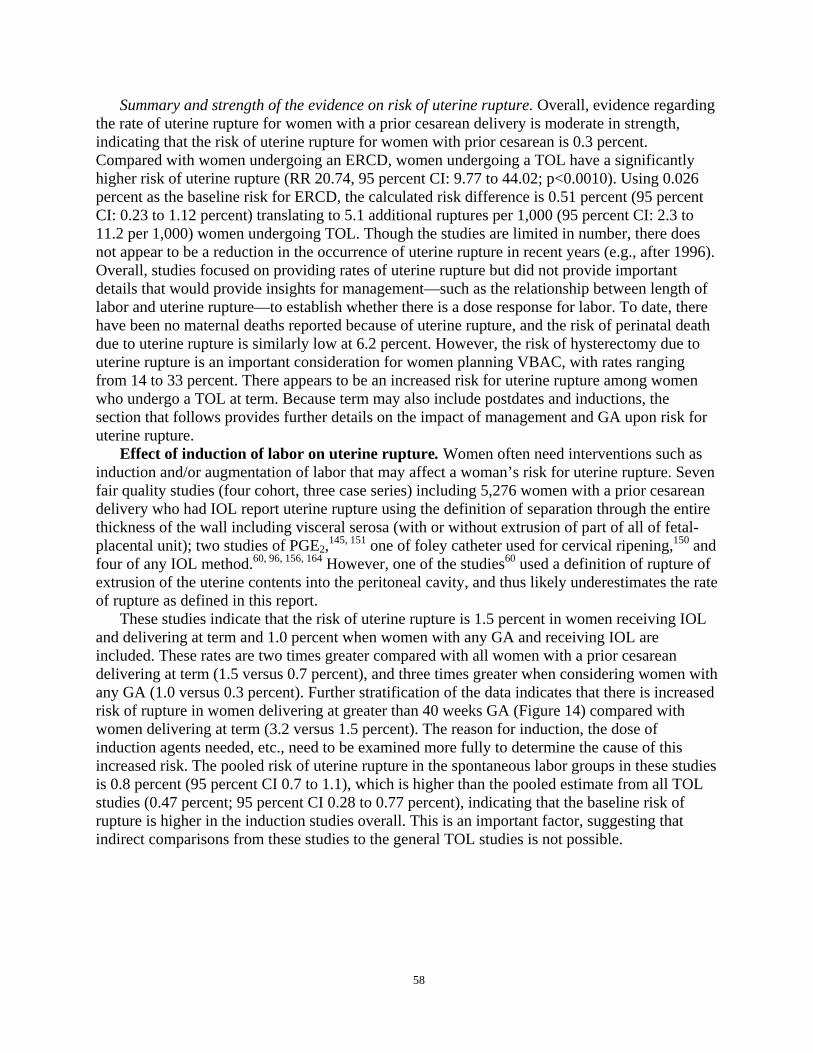
Summary and strength of the evidence on risk of uterine rupture. Overall, evidence regarding the rate of uterine rupture for women with a prior cesarean delivery is moderate in strength, indicating that the risk of uterine rupture for women with prior cesarean is 0.3 percent. Compared with women undergoing an ERCD, women undergoing a TOL have a significantly higher risk of uterine rupture (RR 20.74, 95 percent CI: 9.77 to 44.02; p<0.0010). Using 0.026 percent as the baseline risk for ERCD, the calculated risk difference is 0.51 percent (95 percent CI: 0.23 to 1.12 percent) translating to 5.1 additional ruptures per 1,000 (95 percent CI: 2.3 to 11.2 per 1,000) women undergoing TOL. Though the studies are limited in number, there does not appear to be a reduction in the occurrence of uterine rupture in recent years (e.g., after 1996). Overall, studies focused on providing rates of uterine rupture but did not provide important details that would provide insights for management—such as the relationship between length of labor and uterine rupture—to establish whether there is a dose response for labor. To date, there have been no maternal deaths reported because of uterine rupture, and the risk of perinatal death due to uterine rupture is similarly low at 6.2 percent. However, the risk of hysterectomy due to uterine rupture is an important consideration for women planning VBAC, with rates ranging from 14 to 33 percent. There appears to be an increased risk for uterine rupture among women who undergo a TOL at term. Because term may also include postdates and inductions, the section that follows provides further details on the impact of management and GA upon risk for uterine rupture.
Effect of induction of labor on uterine rupture. Women often need interventions such as induction and/or augmentation of labor that may affect a woman’s risk for uterine rupture. Seven fair quality studies (four cohort, three case series) including 5,276 women with a prior cesarean delivery who had IOL report uterine rupture using the definition of separation through the entire thickness of the wall including visceral serosa (with or without extrusion of part of all of fetal-placental unit); two studies of PGE2,145, 151 one of foley catheter used for cervical ripening,150 and four of any IOL method.60, 96, 156, 164 However, one of the studies60 used a definition of rupture of extrusion of the uterine contents into the peritoneal cavity, and thus likely underestimates the rate of rupture as defined in this report.
These studies indicate that the risk of uterine rupture is 1.5 percent in women receiving IOL and delivering at term and 1.0 percent when women with any GA and receiving IOL are included. These rates are two times greater compared with all women with a prior cesarean delivering at term (1.5 versus 0.7 percent), and three times greater when considering women with any GA (1.0 versus 0.3 percent). Further stratification of the data indicates that there is increased risk of rupture in women delivering at greater than 40 weeks GA (Figure 14) compared with women delivering at term (3.2 versus 1.5 percent). The reason for induction, the dose of induction agents needed, etc., need to be examined more fully to determine the cause of this increased risk. The pooled risk of uterine rupture in the spontaneous labor groups in these studies is 0.8 percent (95 percent CI 0.7 to 1.1), which is higher than the pooled estimate from all TOL studies (0.47 percent; 95 percent CI 0.28 to 0.77 percent), indicating that the baseline risk of rupture is higher in the induction studies overall. This is an important factor, suggesting that indirect comparisons from these studies to the general TOL studies is not possible.
58
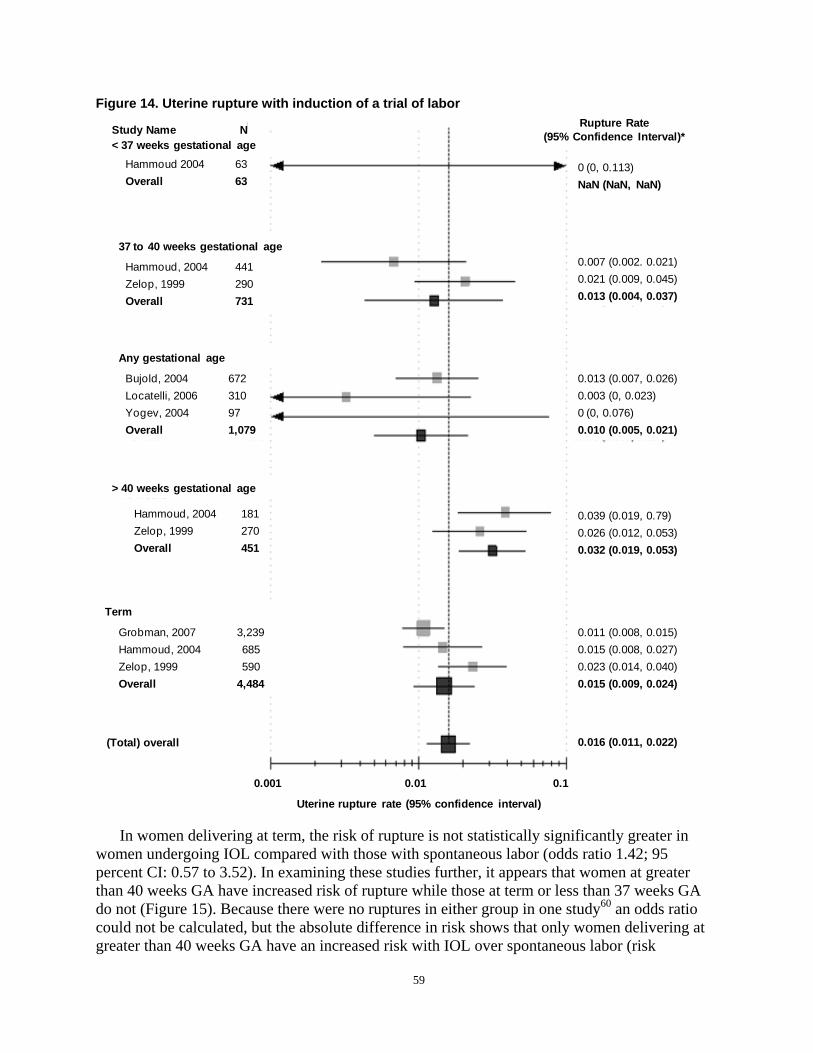
Figure 14. Uterine rupture with induction of a trial of labor Rupture Rate Study Name N (95% Confidence Interval)*
< 37 weeks gestational age Hammoud 2004 63 0 (0, 0.113) Overall 63 NaN (NaN, NaN)
37 to 40 weeks gestational age 0.007 (0.002. 0.021) Hammoud, 2004 441 0.021 (0.009, 0.045) Zelop, 1999 290 0.013 (0.004, 0.037) Overall 731
Any gestational age
Bujold, 2004 672 0.013 (0.007, 0.026) Locatelli, 2006 310 0.003 (0, 0.023) Yogev, 2004 97 0 (0, 0.076) Overall 1,079 0.010 (0.005, 0.021)
> 40 weeks gestational age
Hammoud, 2004 181 0.039 (0.019, 0.79) Zelop, 1999 270 0.026 (0.012, 0.053) Overall 451 0.032 (0.019, 0.053)
Term
Grobman, 2007 3,239 0.011 (0.008, 0.015) Hammoud, 2004 685 0.015 (0.008, 0.027) Zelop, 1999 590 0.023 (0.014, 0.040) Overall 4,484 0.015 (0.009, 0.024)
(Total) overall 0.016 (0.011, 0.022)
0.001 0.01 0.1
Uterine rupture rate (95% confidence interval)
In women delivering at term, the risk of rupture is not statistically significantly greater in women undergoing IOL compared with those with spontaneous labor (odds ratio 1.42; 95 percent CI: 0.57 to 3.52). In examining these studies further, it appears that women at greater than 40 weeks GA have increased risk of rupture while those at term or less than 37 weeks GA do not (Figure 15). Because there were no ruptures in either group in one study60 an odds ratio could not be calculated, but the absolute difference in risk shows that only women delivering at greater than 40 weeks GA have an increased risk with IOL over spontaneous labor (risk
59
difference 1.8 percent; 95 percent CI: 0.1 to 3.5 percent). The number needed to harm (NNH) in this group is 56 (for every 56 women greater than 40 weeks GA whose labor is induced during a TOL, one additional rupture will occur compared with those having spontaneous labor). However, for women with indication for induction of labor at 40 weeks gestation and beyond, clinicians are faced with the option of induction or ERCD and not spontaneous labor. A better, more useful, comparator for induction of labor would be expectant management. These findings should be interpreted with caution, as one study found similarly increased rates of rupture with induction regardless of GA, while the other found increased risk in the group with greater than 40 weeks GA only. Figure 15. Risk of rupture: induction versus spontaneous labor
Study Name N 95% Confidence Interval < 37 weeks gestational age
Hammoud 2004 253 0 (-0.023, 0.023
Overall 253 NaN (Nan, Nan)
> 40 weeks gestational age
Hammoud, 2004 329 0.025 (-0.009, 0.059) Zelop, 1999 1,271 0.016 (-0.004, 0.036) Overall 1,600 0.018 (-0.001, 0.035)
37 to 40 weeks gestational age
Zelop, 1999 1,503 0.016 (-0.001, 0.033) Hammoud, 2004 1,911 -0.005 (-0.014, 0.005) Overall 3,414 0.004 (-0.016, 0.024)
Any gestational age 0.002 (-0.008, 0.012) Bujold, 2004 2,479 0.001 (-0.014, 0.016) Yogev, 2004 1,028 0 (-0.004, 0.006) Locatelli, 2006 1,321 0.001 (-0.004, 0.006) Overall 4,828
Term
Hammoud, 2004 2,493 0.004 (-0.006, 0.014) Zelop, 1999 2,774 0.016 (0.003, 0.029) Grobman, 2007 9,228 0.002 (-0.003, 0.006) Overall 14,495 0.005 (-0.002, 0.013)
0.003 (0, 0.007) (Total) overall
-0.010 -0.005 0.000 0.005 0.010 0.015 0.020 0.025 0.030
Risk Difference (95% Confidence Interval)
60
Given that there is such limited evidence regarding the risk of uterine rupture with various methods of IOL, it was decided to evaluate studies that used a broader definition of uterine rupture. While these cannot be compared with those evaluated for the risk of uterine rupture in spontaneous labor, they can be used to make indirect comparisons across IOL methods. The studies included below report that uterine rupture was a primary outcome measure of the study and report clear methods for ascertaining rupture, e.g., individual chart review. Because the definitions used are not limited to the anatomical description of rupture used in the above, these analyses should be considered exploratory only.
Prostaglandin E2. The risk of uterine rupture with PGE2 use for cervical ripening and IOL was reported as a main of outcome interest in 14 studies (six good or fair quality cohort studies, and eight fair quality case series). Two of which included only women at term gestation,156, 164
while the rest included women with any GA.11, 145, 148, 149, 151, 157, 158, 163, 165, 168-170 Pooled analysis of the proportion of women experiencing a uterine rupture after PGE2 induction provides a point estimate of 2.0 percent (95 percent CI: 1.1 to 3.5 percent, see Figure 16). It is important to note however, that these studies did not define uterine rupture according to the anatomic definition in this report. Therefore, understanding these rates in comparison with other VBAC studies is not possible. The two studies restricting to women with term GA found very different rates; 3.9 percent164 compared with 0.8 percent.156 The study with the lower rate was methodologically superior. The studies with more rigorous design report a higher rate of uterine rupture. One study included in this analysis used ICD-9 codes to identify uterine rupture11 – a method that has subsequently been shown to overestimate true rupture rates.210 The study reporting the highest rate, 10.3 percent,170 identified cases by discharge diagnosis of uterine rupture, another method that may overestimate the proportion with true rupture. The validity and reliability of the method used was not tested or reported, and similar to the use of ICD-9 codes, could overestimate true rupture. Additionally, baseline obstetric characteristics of women induced, mean total dose of prostaglandin, and percent receiving oxytocin for augmentation (except for the uterine rupture cases) were not reported such that comparisons to other study populations cannot be made.
61
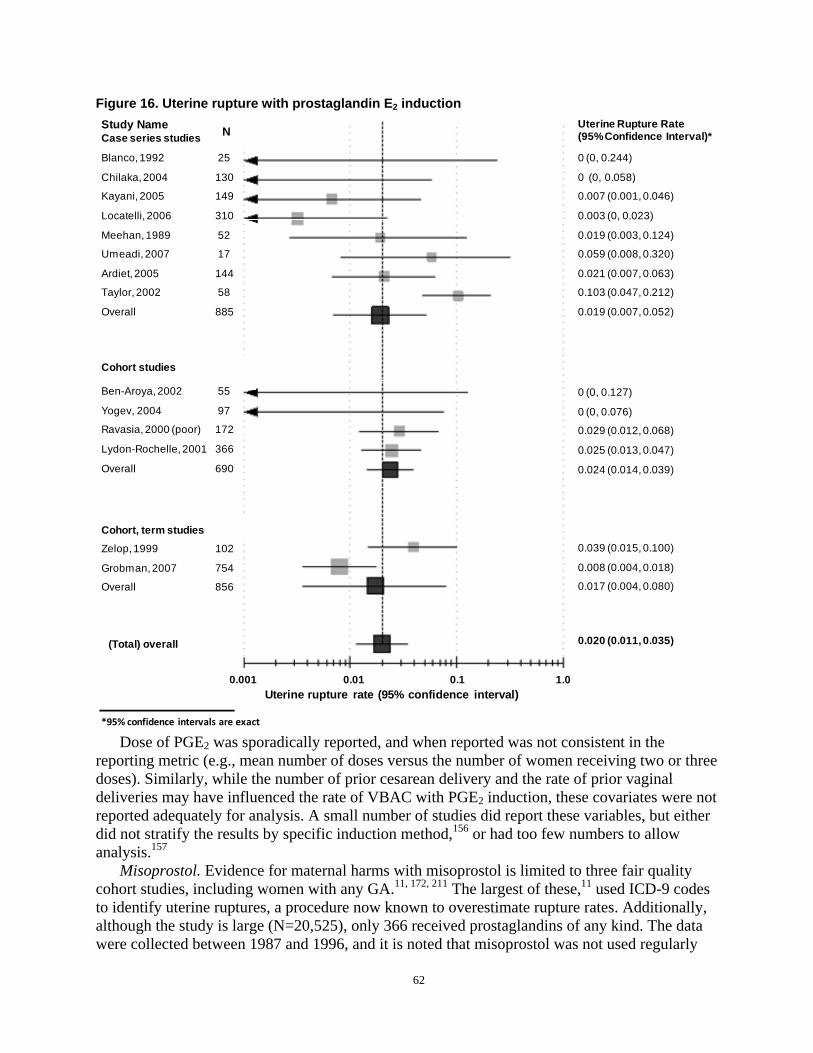
N
Figure 16. Uterine rupture with prostaglandin E2 induction Study Name Uterine Rupture Rate NCase series studies (95% Confidence Interval)*
Blanco, 1992 25 0 (0, 0.244)
Chilaka, 2004 130 0 (0, 0.058)
Kayani, 2005 149 0.007 (0.001, 0.046)
Locatelli, 2006 310 0.003 (0, 0.023)
Meehan, 1989 52 0.019 (0.003, 0.124)
Umeadi, 2007 17 0.059 (0.008, 0.320)
Ardiet, 2005 144 0.021 (0.007, 0.063)
Taylor, 2002 58 0.103 (0.047, 0.212)
Overall 885 0.019 (0.007, 0.052)
Cohort studies
Ben-Aroya, 2002 55 0 (0, 0.127)
Yogev, 2004 97 0 (0, 0.076) Ravasia, 2000 (poor) 172 0.029 (0.012, 0.068)
Lydon-Rochelle, 2001 366 0.025 (0.013, 0.047)
Overall 690 0.024 (0.014, 0.039)
Cohort, term studies Zelop, 1999 102 0.039 (0.015, 0.100)
Grobman, 2007 754 0.008 (0.004, 0.018)
Overall 856 0.017 (0.004, 0.080)
0.020 (0.011, 0.035) (Total) overall
0.001 0.01 0.1 1.0 Uterine rupture rate (95% confidence interval)
*95% confidence intervals are exact
Dose of PGE2 was sporadically reported, and when reported was not consistent in the reporting metric (e.g., mean number of doses versus the number of women receiving two or three doses). Similarly, while the number of prior cesarean delivery and the rate of prior vaginal deliveries may have influenced the rate of VBAC with PGE2 induction, these covariates were not reported adequately for analysis. A small number of studies did report these variables, but either did not stratify the results by specific induction method,156 or had too few numbers to allow analysis.157
Misoprostol. Evidence for maternal harms with misoprostol is limited to three fair quality cohort studies, including women with any GA.11, 172, 211 The largest of these,11 used ICD-9 codes to identify uterine ruptures, a procedure now known to overestimate rupture rates. Additionally, although the study is large (N=20,525), only 366 received prostaglandins of any kind. The data were collected between 1987 and 1996, and it is noted that misoprostol was not used regularly
62
until 1996, indicating that few of the women described as receiving a prostaglandin had misoprostol. While the actual numbers of women receiving misoprostol are not reported, the relative risk for a uterine rupture in women who received a prostaglandin during 1996 was 12.2 (95 percent CI: 3.4 to 39.6). This compares with a separate analysis of uterine rupture among women who received a prostaglandin during the years 1987 to 1995, relative risk 14.1 (95 percent CI: 6.1 to 33.0; both compared with ERCD).
The other two studies are much smaller, but do report misoprostol data separately. In a small, fair quality, cohort study (N=226) comparing PGE2 (administered as a gel or pessary) with misoprostol (25 to 50 mcg),211 only 16 of 145 women in the misoprostol group and nine of 81 in the PGE2 group had a prior cesarean delivery. Additionally, the data for PGE2 was obtained retrospectively while the data for misoprostol were obtained prospectively. The results for uterine rupture were stratified by history of a prior cesarean delivery with two of 16 in the misoprostol group (13 percent) and zero of nine in the PGE2 group having what is described only as a low transverse rupture. One additional patient in the misoprostol group had a scar dehiscence. In both cases of rupture, hysterectomy was performed, with no blood transfusions. The second study of misoprostol made comparisons among women with a history of prior cesarean delivery to those without prior cesarean delivery, a comparison that is not relevant to this review.172 There were no uterine ruptures, and 2.0 percent were reported as having “complications,” including abruption placenta, retained placenta, uterine atony, and blood transfusion.
Mifepristone. In a small (N=32), fair quality trial of mifepristone and placebo, each given for 2 days followed 2 days later by IOL with prostaglandins, oxytocin, and/or artificial rupture of membranes as needed in term GAs,173 one uterine scar separation occurred in each group (6.25 percent). Maternal outcomes were not different between groups, except that two patients in the mifepristone group developed fever, compared with none in the placebo group. One wound infection was found in each group.
Oxytocin. The risk of uterine rupture following induction or augmentation of labor with oxytocin was reported as a main outcome measure in eight studies (one good quality cohort study, four fair quality cohort studies, and three fair quality case series).11, 125, 156-158, 164, 168, 169
The risk of uterine rupture is 1.1 percent (95 percent CI: 0.9 to 1.5 percent) when data from these studies are pooled (Figure 17).
63
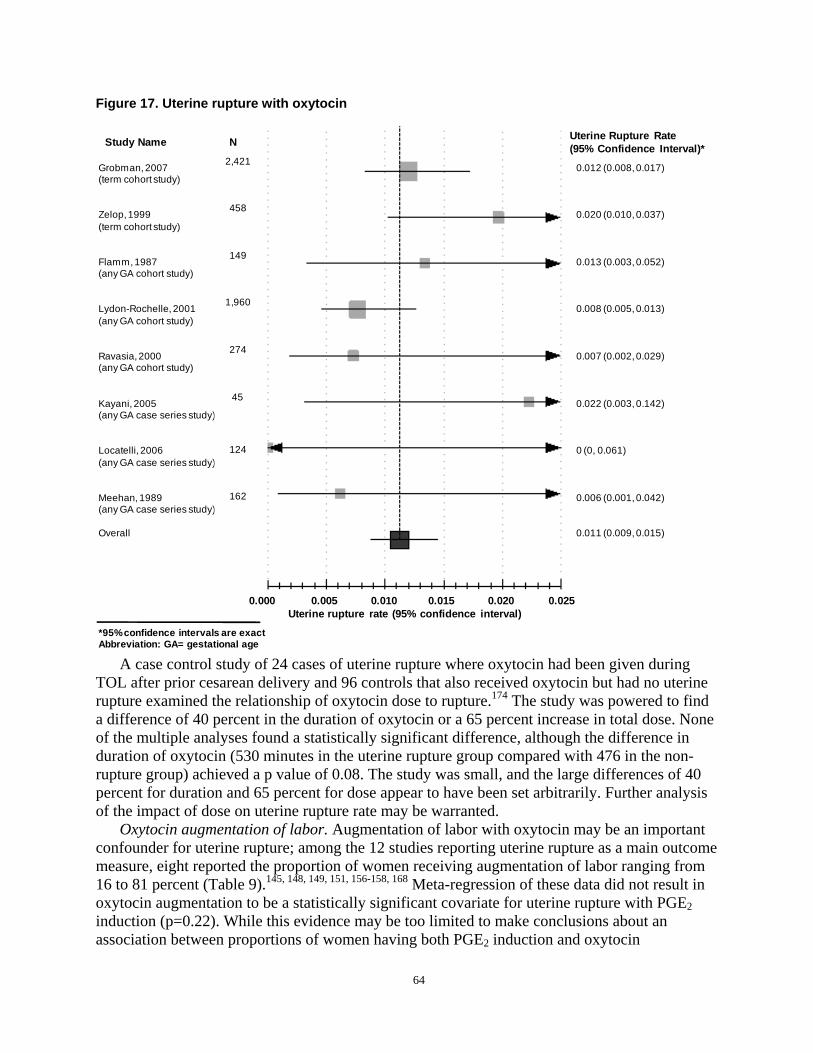
Figure 17. Uterine rupture with oxytocin
Grobman, 2007 (term cohort study)
Zelop, 1999 (term cohort study)
Flamm, 1987 (any GA cohort study)
Lydon-Rochelle, 2001 (any GA cohort study)
Ravasia, 2000 (any GA cohort study)
Kayani, 2005 (any GA case series study)
Locatelli, 2006 (any GA case series study)
Meehan, 1989 (any GA case series study)
Overall
2,421
458
149
1,960
274
45
124
162
Study Name N Uterine Rupture Rate (95% Confidence Interval)*
0.012 (0.008, 0.017)
0.020 (0.010, 0.037)
0.013 (0.003, 0.052)
0.008 (0.005, 0.013)
0.007 (0.002, 0.029)
0.022 (0.003, 0.142)
0 (0, 0.061)
0.006 (0.001, 0.042)
0.011 (0.009, 0.015)
0.000 0.005 0.010 0.015 0.020 0.025 Uterine rupture rate (95% confidence interval)
*95% confidence intervals are exact Abbreviation: GA= gestational age
A case control study of 24 cases of uterine rupture where oxytocin had been given during TOL after prior cesarean delivery and 96 controls that also received oxytocin but had no uterine rupture examined the relationship of oxytocin dose to rupture.174 The study was powered to find a difference of 40 percent in the duration of oxytocin or a 65 percent increase in total dose. None of the multiple analyses found a statistically significant difference, although the difference in duration of oxytocin (530 minutes in the uterine rupture group compared with 476 in the non-rupture group) achieved a p value of 0.08. The study was small, and the large differences of 40 percent for duration and 65 percent for dose appear to have been set arbitrarily. Further analysis of the impact of dose on uterine rupture rate may be warranted.
Oxytocin augmentation of labor. Augmentation of labor with oxytocin may be an important confounder for uterine rupture; among the 12 studies reporting uterine rupture as a main outcome measure, eight reported the proportion of women receiving augmentation of labor ranging from 16 to 81 percent (Table 9).145, 148, 149, 151, 156-158, 168 Meta-regression of these data did not result in oxytocin augmentation to be a statistically significant covariate for uterine rupture with PGE2 induction (p=0.22). While this evidence may be too limited to make conclusions about an association between proportions of women having both PGE2 induction and oxytocin
64
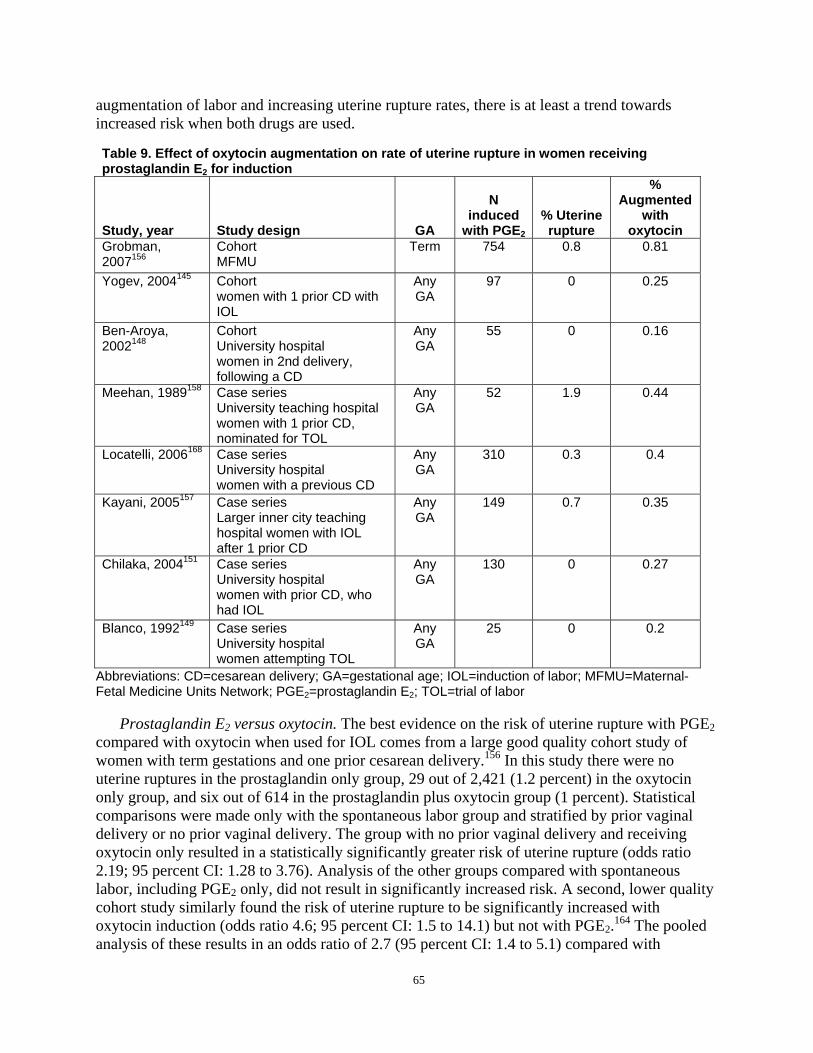
augmentation of labor and increasing uterine rupture rates, there is at least a trend towards increased risk when both drugs are used.
Table 9. Effect of oxytocin augmentation on rate of uterine rupture in women receiving prostaglandin E2 for induction
Study, year Study design GA
N induced
with PGE2
% Uterine rupture
% Augmented
with oxytocin
Grobman, 2007156
Cohort MFMU
Term 754 0.8 0.81
Yogev, 2004145 Cohort women with 1 prior CD with IOL
Any GA
97 0 0.25
Ben-Aroya, 2002148
Cohort University hospital women in 2nd delivery, following a CD
Any GA
55 0 0.16
Meehan, 1989158 Case series University teaching hospital women with 1 prior CD, nominated for TOL
Any GA
52 1.9 0.44
Locatelli, 2006168 Case series University hospital women with a previous CD
Any GA
310 0.3 0.4
Kayani, 2005157 Case series Larger inner city teaching hospital women with IOL after 1 prior CD
Any GA
149 0.7 0.35
Chilaka, 2004151 Case series University hospital women with prior CD, who had IOL
Any GA
130 0 0.27
Blanco, 1992149 Case series University hospital women attempting TOL
Any GA
25 0 0.2
Abbreviations: CD=cesarean delivery; GA=gestational age; IOL=induction of labor; MFMU=Maternal-Fetal Medicine Units Network; PGE2=prostaglandin E2; TOL=trial of labor
Prostaglandin E2 versus oxytocin. The best evidence on the risk of uterine rupture with PGE2 compared with oxytocin when used for IOL comes from a large good quality cohort study of women with term gestations and one prior cesarean delivery.156 In this study there were no uterine ruptures in the prostaglandin only group, 29 out of 2,421 (1.2 percent) in the oxytocin only group, and six out of 614 in the prostaglandin plus oxytocin group (1 percent). Statistical comparisons were made only with the spontaneous labor group and stratified by prior vaginal delivery or no prior vaginal delivery. The group with no prior vaginal delivery and receiving oxytocin only resulted in a statistically significantly greater risk of uterine rupture (odds ratio 2.19; 95 percent CI: 1.28 to 3.76). Analysis of the other groups compared with spontaneous labor, including PGE2 only, did not result in significantly increased risk. A second, lower quality cohort study similarly found the risk of uterine rupture to be significantly increased with oxytocin induction (odds ratio 4.6; 95 percent CI: 1.5 to 14.1) but not with PGE2.164 The pooled analysis of these results in an odds ratio of 2.7 (95 percent CI: 1.4 to 5.1) compared with
65
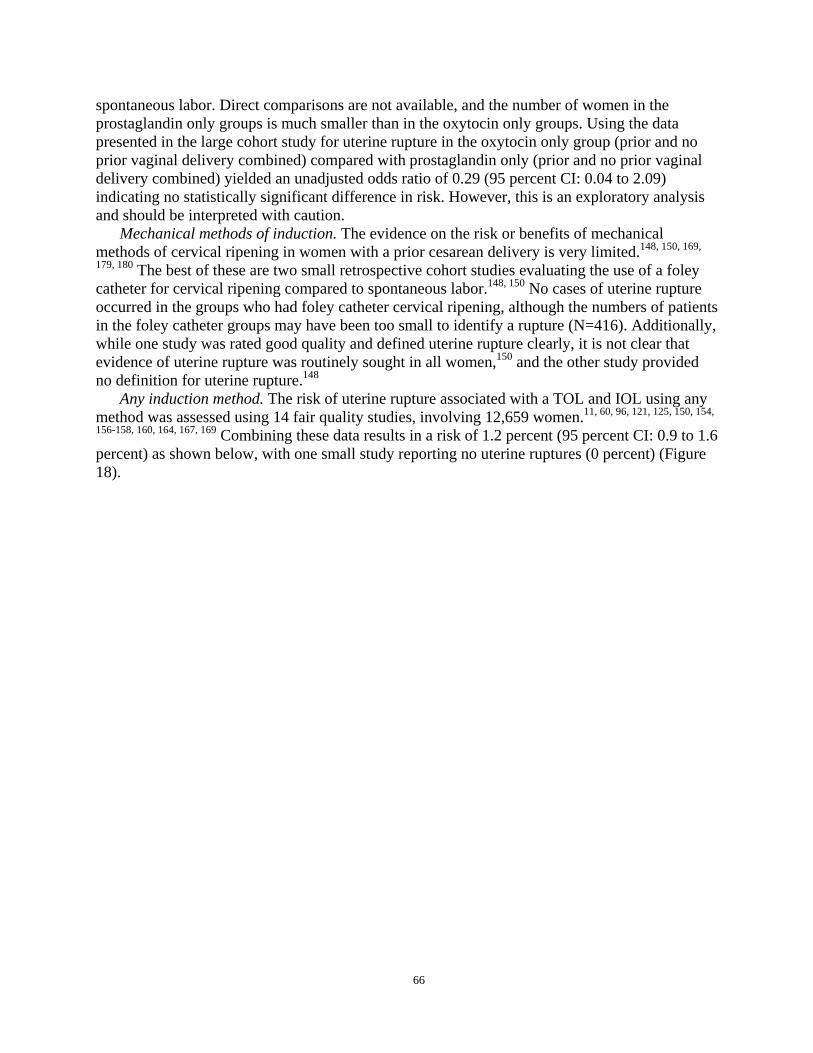
spontaneous labor. Direct comparisons are not available, and the number of women in the prostaglandin only groups is much smaller than in the oxytocin only groups. Using the data presented in the large cohort study for uterine rupture in the oxytocin only group (prior and no prior vaginal delivery combined) compared with prostaglandin only (prior and no prior vaginal delivery combined) yielded an unadjusted odds ratio of 0.29 (95 percent CI: 0.04 to 2.09) indicating no statistically significant difference in risk. However, this is an exploratory analysis and should be interpreted with caution.
Mechanical methods of induction. The evidence on the risk or benefits of mechanical methods of cervical ripening in women with a prior cesarean delivery is very limited.148, 150, 169,
179, 180 The best of these are two small retrospective cohort studies evaluating the use of a foley catheter for cervical ripening compared to spontaneous labor.148, 150 No cases of uterine rupture occurred in the groups who had foley catheter cervical ripening, although the numbers of patients in the foley catheter groups may have been too small to identify a rupture (N=416). Additionally, while one study was rated good quality and defined uterine rupture clearly, it is not clear that evidence of uterine rupture was routinely sought in all women,150 and the other study provided no definition for uterine rupture.148
Any induction method. The risk of uterine rupture associated with a TOL and IOL using any method was assessed using 14 fair quality studies, involving 12,659 women.11, 60, 96, 121, 125, 150, 154,
156-158, 160, 164, 167, 169 Combining these data results in a risk of 1.2 percent (95 percent CI: 0.9 to 1.6 percent) as shown below, with one small study reporting no uterine ruptures (0 percent) (Figure 18).
66
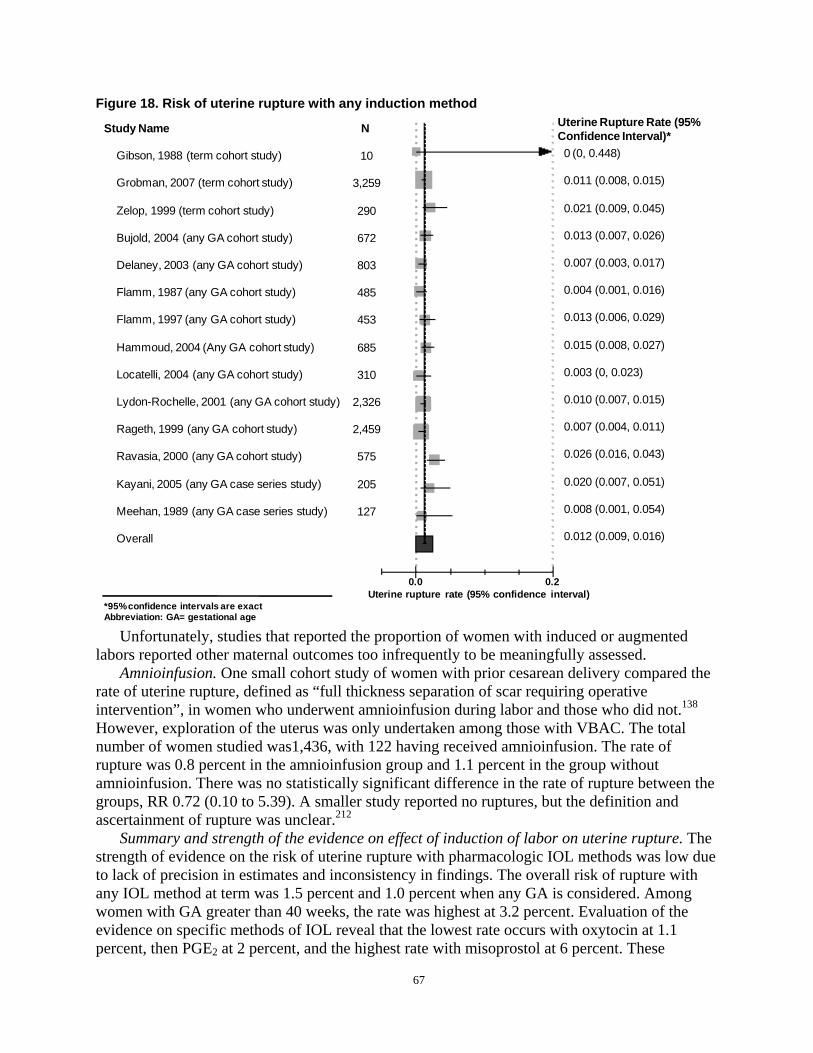
Figure 18. Risk of uterine rupture with any induction method
Study Name N Uterine Rupture Rate (95% Confidence Interval)*
Gibson, 1988 (term cohort study) 10 0 (0, 0.448)
Grobman, 2007 (term cohort study) 3,259 0.011 (0.008, 0.015)
Zelop, 1999 (term cohort study) 290 0.021 (0.009, 0.045)
Bujold, 2004 (any GA cohort study) 672 0.013 (0.007, 0.026)
Delaney, 2003 (any GA cohort study) 803 0.007 (0.003, 0.017)
Flamm, 1987 (any GA cohort study) 485 0.004 (0.001, 0.016)
Flamm, 1997 (any GA cohort study) 453 0.013 (0.006, 0.029)
Hammoud, 2004 (Any GA cohort study) 685 0.015 (0.008, 0.027)
Locatelli, 2004 (any GA cohort study) 310 0.003 (0, 0.023)
Lydon-Rochelle, 2001 (any GA cohort study) 2,326 0.010 (0.007, 0.015)
Rageth, 1999 (any GA cohort study) 2,459 0.007 (0.004, 0.011)
Ravasia, 2000 (any GA cohort study) 575 0.026 (0.016, 0.043)
Kayani, 2005 (any GA case series study) 205 0.020 (0.007, 0.051)
Meehan, 1989 (any GA case series study) 127 0.008 (0.001, 0.054)
Overall 0.012 (0.009, 0.016)
0.0 0.2 Uterine rupture rate (95% confidence interval)
*95% confidence intervals are exact Abbreviation: GA= gestational age
Unfortunately, studies that reported the proportion of women with induced or augmented labors reported other maternal outcomes too infrequently to be meaningfully assessed.
Amnioinfusion. One small cohort study of women with prior cesarean delivery compared the rate of uterine rupture, defined as “full thickness separation of scar requiring operative intervention”, in women who underwent amnioinfusion during labor and those who did not.138
However, exploration of the uterus was only undertaken among those with VBAC. The total number of women studied was1,436, with 122 having received amnioinfusion. The rate of rupture was 0.8 percent in the amnioinfusion group and 1.1 percent in the group without amnioinfusion. There was no statistically significant difference in the rate of rupture between the groups, RR 0.72 (0.10 to 5.39). A smaller study reported no ruptures, but the definition and ascertainment of rupture was unclear.212
Summary and strength of the evidence on effect of induction of labor on uterine rupture. The strength of evidence on the risk of uterine rupture with pharmacologic IOL methods was low due to lack of precision in estimates and inconsistency in findings. The overall risk of rupture with any IOL method at term was 1.5 percent and 1.0 percent when any GA is considered. Among women with GA greater than 40 weeks, the rate was highest at 3.2 percent. Evaluation of the evidence on specific methods of IOL reveal that the lowest rate occurs with oxytocin at 1.1 percent, then PGE2 at 2 percent, and the highest rate with misoprostol at 6 percent. These
67
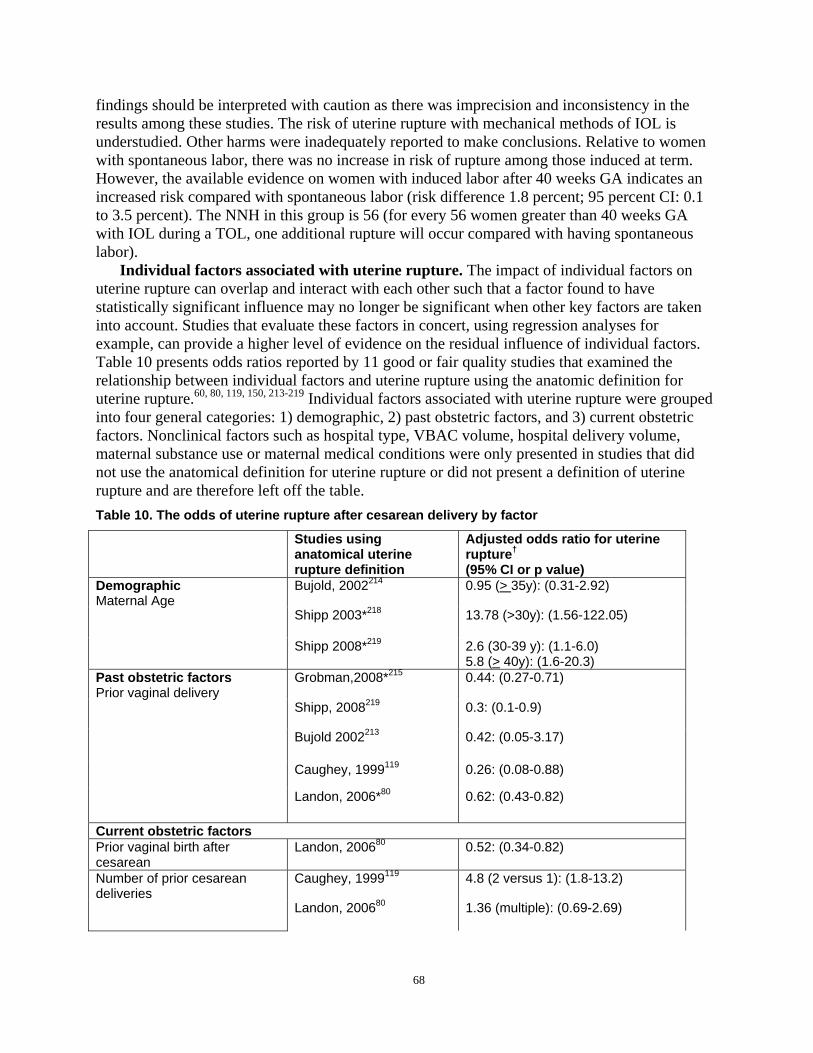
findings should be interpreted with caution as there was imprecision and inconsistency in the results among these studies. The risk of uterine rupture with mechanical methods of IOL is understudied. Other harms were inadequately reported to make conclusions. Relative to women with spontaneous labor, there was no increase in risk of rupture among those induced at term. However, the available evidence on women with induced labor after 40 weeks GA indicates an increased risk compared with spontaneous labor (risk difference 1.8 percent; 95 percent CI: 0.1 to 3.5 percent). The NNH in this group is 56 (for every 56 women greater than 40 weeks GA with IOL during a TOL, one additional rupture will occur compared with having spontaneous labor).
Individual factors associated with uterine rupture. The impact of individual factors on uterine rupture can overlap and interact with each other such that a factor found to have statistically significant influence may no longer be significant when other key factors are taken into account. Studies that evaluate these factors in concert, using regression analyses for example, can provide a higher level of evidence on the residual influence of individual factors. Table 10 presents odds ratios reported by 11 good or fair quality studies that examined the relationship between individual factors and uterine rupture using the anatomic definition for uterine rupture.60, 80, 119, 150, 213-219 Individual factors associated with uterine rupture were grouped into four general categories: 1) demographic, 2) past obstetric factors, and 3) current obstetric factors. Nonclinical factors such as hospital type, VBAC volume, hospital delivery volume, maternal substance use or maternal medical conditions were only presented in studies that did not use the anatomical definition for uterine rupture or did not present a definition of uterine rupture and are therefore left off the table. Table 10. The odds of uterine rupture after cesarean delivery by factor
Studies using anatomical uterine rupture definition
Adjusted odds ratio for uterine rupture†
(95% CI or p value) Demographic Maternal Age
Bujold, 2002214
Shipp 2003*218
Shipp 2008*219
0.95 (> 35y): (0.31-2.92)
13.78 (>30y): (1.56-122.05)
2.6 (30-39 y): (1.1-6.0) 5.8 (> 40y): (1.6-20.3)
Past obstetric factors Prior vaginal delivery
Grobman,2008*215
Shipp, 2008219
Bujold 2002213
Caughey, 1999119
Landon, 2006*80
0.44: (0.27-0.71)
0.3: (0.1-0.9)
0.42: (0.05-3.17)
0.26: (0.08-0.88)
0.62: (0.43-0.82)
Current obstetric factors Prior vaginal birth after cesarean
Landon, 200680 0.52: (0.34-0.82)
Number of prior cesarean deliveries
Caughey, 1999119
Landon, 200680
4.8 (2 versus 1): (1.8-13.2)
1.36 (multiple): (0.69-2.69)
68
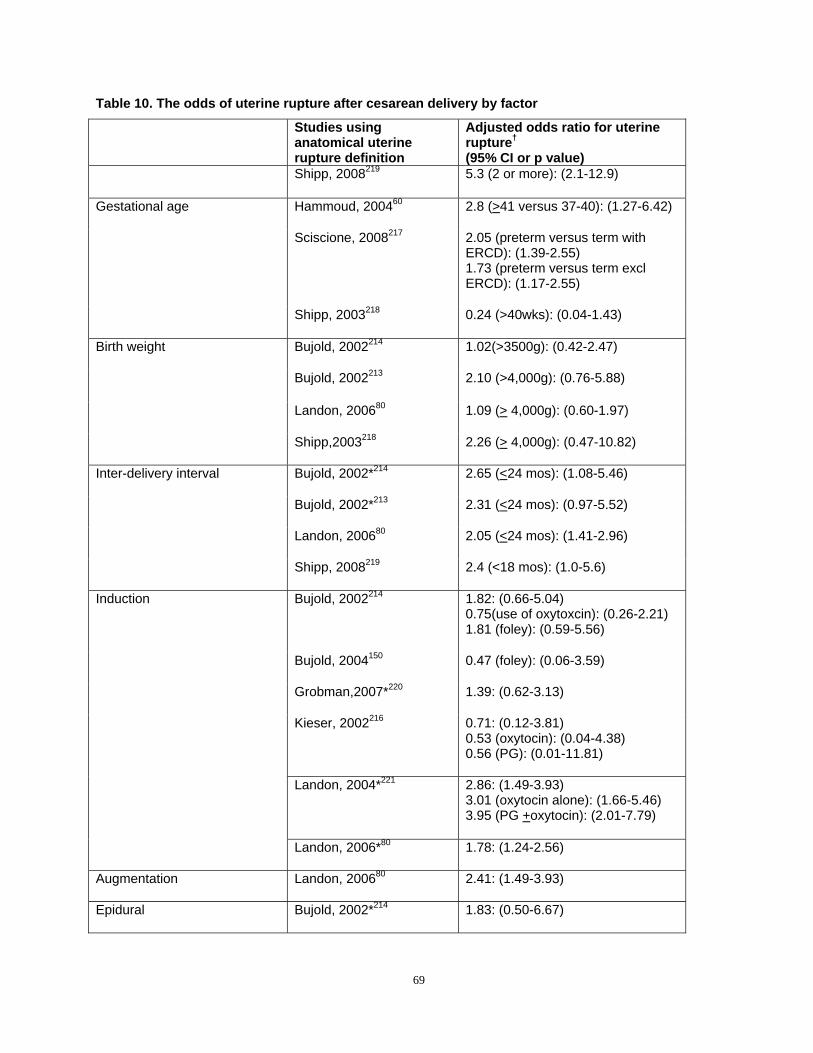
Table 10. The odds of uterine rupture after cesarean delivery by factor
Studies using anatomical uterine rupture definition
Adjusted odds ratio for uterine rupture†
(95% CI or p value) Shipp, 2008219 5.3 (2 or more): (2.1-12.9)
Gestational age Hammoud, 200460
Sciscione, 2008217
Shipp, 2003218
2.8 (>41 versus 37-40): (1.27-6.42)
2.05 (preterm versus term with ERCD): (1.39-2.55) 1.73 (preterm versus term excl ERCD): (1.17-2.55)
0.24 (>40wks): (0.04-1.43)
Birth weight Bujold, 2002214
Bujold, 2002213
Landon, 200680
Shipp,2003218
1.02(>3500g): (0.42-2.47)
2.10 (>4,000g): (0.76-5.88)
1.09 (> 4,000g): (0.60-1.97)
2.26 (> 4,000g): (0.47-10.82)
Inter-delivery interval Bujold, 2002*214
Bujold, 2002*213
Landon, 200680
Shipp, 2008219
2.65 (<24 mos): (1.08-5.46)
2.31 (<24 mos): (0.97-5.52)
2.05 (<24 mos): (1.41-2.96)
2.4 (<18 mos): (1.0-5.6)
Induction Bujold, 2002214
Bujold, 2004150
Grobman,2007*220
Kieser, 2002216
1.82: (0.66-5.04) 0.75(use of oxytoxcin): (0.26-2.21) 1.81 (foley): (0.59-5.56)
0.47 (foley): (0.06-3.59)
1.39: (0.62-3.13)
0.71: (0.12-3.81) 0.53 (oxytocin): (0.04-4.38) 0.56 (PG): (0.01-11.81)
Landon, 2004*221 2.86: (1.49-3.93) 3.01 (oxytocin alone): (1.66-5.46) 3.95 (PG +oxytocin): (2.01-7.79)
Landon, 2006*80 1.78: (1.24-2.56)
Augmentation Landon, 200680 2.41: (1.49-3.93)
Epidural Bujold, 2002*214 1.83: (0.50-6.67)
69
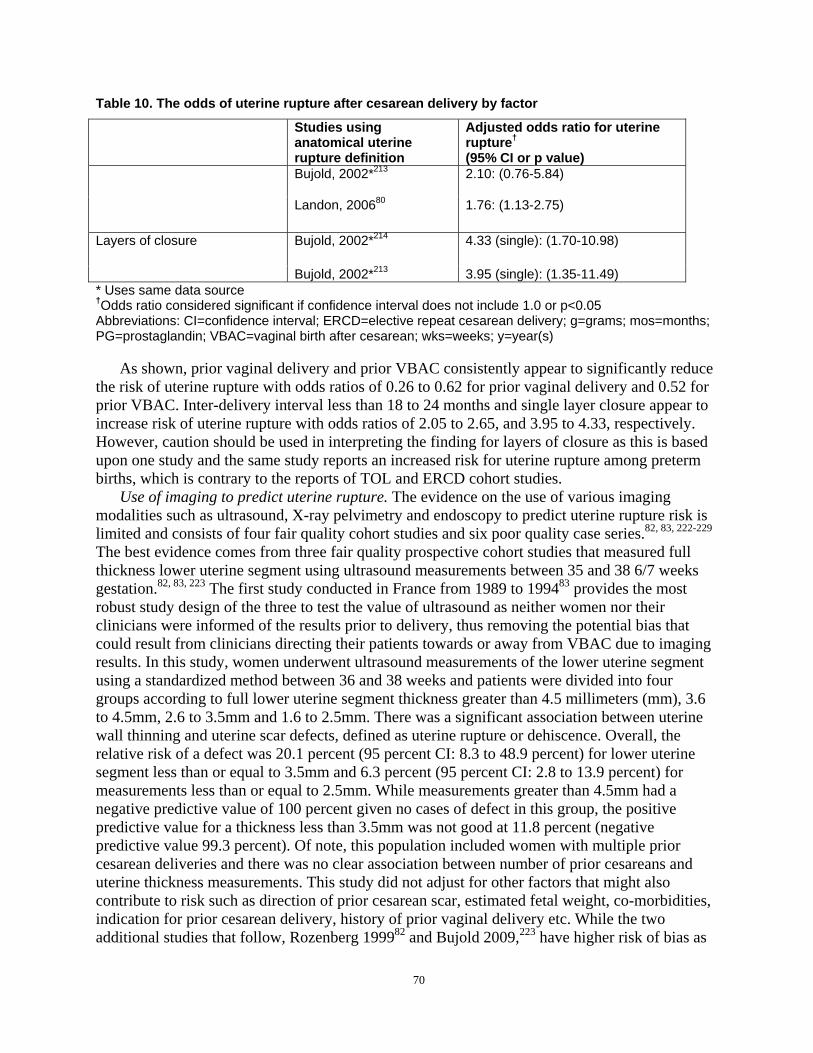
Table 10. The odds of uterine rupture after cesarean delivery by factor
Studies using anatomical uterine rupture definition
Adjusted odds ratio for uterine rupture†
(95% CI or p value) Bujold, 2002*213 2.10: (0.76-5.84)
Landon, 200680 1.76: (1.13-2.75)
Layers of closure Bujold, 2002*214 4.33 (single): (1.70-10.98)
Bujold, 2002*213 3.95 (single): (1.35-11.49) * Uses same data source †Odds ratio considered significant if confidence interval does not include 1.0 or p<0.05 Abbreviations: CI=confidence interval; ERCD=elective repeat cesarean delivery; g=grams; mos=months; PG=prostaglandin; VBAC=vaginal birth after cesarean; wks=weeks; y=year(s)
As shown, prior vaginal delivery and prior VBAC consistently appear to significantly reduce the risk of uterine rupture with odds ratios of 0.26 to 0.62 for prior vaginal delivery and 0.52 for prior VBAC. Inter-delivery interval less than 18 to 24 months and single layer closure appear to increase risk of uterine rupture with odds ratios of 2.05 to 2.65, and 3.95 to 4.33, respectively. However, caution should be used in interpreting the finding for layers of closure as this is based upon one study and the same study reports an increased risk for uterine rupture among preterm births, which is contrary to the reports of TOL and ERCD cohort studies.
Use of imaging to predict uterine rupture. The evidence on the use of various imaging modalities such as ultrasound, X-ray pelvimetry and endoscopy to predict uterine rupture risk is limited and consists of four fair quality cohort studies and six poor quality case series.82, 83, 222-229
The best evidence comes from three fair quality prospective cohort studies that measured full thickness lower uterine segment using ultrasound measurements between 35 and 38 6/7 weeks gestation.82, 83, 223 The first study conducted in France from 1989 to 199483 provides the most robust study design of the three to test the value of ultrasound as neither women nor their clinicians were informed of the results prior to delivery, thus removing the potential bias that could result from clinicians directing their patients towards or away from VBAC due to imaging results. In this study, women underwent ultrasound measurements of the lower uterine segment using a standardized method between 36 and 38 weeks and patients were divided into four groups according to full lower uterine segment thickness greater than 4.5 millimeters (mm), 3.6 to 4.5mm, 2.6 to 3.5mm and 1.6 to 2.5mm. There was a significant association between uterine wall thinning and uterine scar defects, defined as uterine rupture or dehiscence. Overall, the relative risk of a defect was 20.1 percent (95 percent CI: 8.3 to 48.9 percent) for lower uterine segment less than or equal to 3.5mm and 6.3 percent (95 percent CI: 2.8 to 13.9 percent) for measurements less than or equal to 2.5mm. While measurements greater than 4.5mm had a negative predictive value of 100 percent given no cases of defect in this group, the positive predictive value for a thickness less than 3.5mm was not good at 11.8 percent (negative predictive value 99.3 percent). Of note, this population included women with multiple prior cesarean deliveries and there was no clear association between number of prior cesareans and uterine thickness measurements. This study did not adjust for other factors that might also contribute to risk such as direction of prior cesarean scar, estimated fetal weight, co-morbidities, indication for prior cesarean delivery, history of prior vaginal delivery etc. While the two additional studies that follow, Rozenberg 199982 and Bujold 2009,223 have higher risk of bias as
70

clinicians were informed of the imaging results prior to delivery, both support the association between uterine thickness and uterine rupture (Table 11). Table 11. Lower uterine segment thickness and uterine defect Author, year
Study years/Population
LUS Thickness (mm) and Uterine Defect Additional Results
Rozenberg, Prospective Cohort 1.6-2.5mm – 8/51 (16%) Cut off 3.5mm 199683 1989-1994 2.6-3.5mm 14/136 (10%) Sensitivity 88%
Single University 3.6-4.5mm – 3/177 (2%) Specificity 73.2% hospital 4.5mm – 0/278 (0%) PPV 11.8% Paris, France NPV 99.3%
Bujold, Prospective Cohort < 2.0mm – 4/35 (11%) Single layer closure & inter2009223 2004-2006
Single University institution Montreal Canada
2.0-2.4 – 2/52 (3.8%) 2.5-2.9 – 1/40 (2.5%) 3.0-3.4 – 1/50 (2%) >3.5 - 1/59 (1.7%)
delivery interval <24 months associated with defect (not rupture)
In TOL group LUS thickness of <2.3mm & UR results in Sensitivity 100% Specificity 75% 9.1% UR in TOL
Abbreviations: LUS=lower uterine segment; mm=millimeter; NPV=negative predictive value; PPV=positive predictive value; TOL=trial of labor; UR=uterine rupture
Strength of evidence for individual factors as predictors of uterine rupture. Studies of individual factors that may increase or decrease a woman’s risk of uterine rupture are largely exploratory, as few factors have been confirmed in prospective studies as suggested by Simon and Altman, 1994.193 There is cross validating evidence to suggest that women with prior vaginal delivery have lower risk for uterine rupture and women undergoing IOL have higher risk of uterine rupture compared with spontaneously laboring women. Similarly, evidence from IOL studies suggest that women who are postdates may have a higher risk of uterine rupture. The evidence on the role of imaging to predict uterine rupture is low due to limited studies with high-risk for bias; however, the existing data suggest that there may be value to ultrasound measurements of uterine thickness for women with prior cesarean delivery.
Predictive models for uterine rupture. Because uterine rupture is such an important consideration for women with prior cesarean delivery, several investigators have attempted to build predictive tools that would combine the individual predictors to estimate a woman’s risk for uterine rupture. Four studies attempted to develop predictive models for uterine rupture (see Appendix P for study details).104, 215, 219, 230 Only two tested their predictive model in a validation group.104, 215 No study was able to produce a reliable and robust model to predict uterine rupture.
Signs of uterine rupture and management to reduce uterine rupture related mortality. Given the serious potential consequences for morbidity and mortality given uterine rupture, it would be ideal to understand signs and symptoms of uterine rupture and what, if any interventions might reduce the likelihood of morbidity or mortality in the event that a uterine rupture does occur. As stated in a prior VBAC evidence report, and echoed in studies contained in this report, there is no single sign for the occurrence of uterine rupture; however, fetal heart tracing abnormalities, particularly fetal bradycardia (reported in 33 to 100 percent of all studies) is the most frequently reported sign of uterine rupture.62, 206-208 Other signs reported in uterine rupture studies in descending order are maternal vaginal bleeding, maternal pain, and uterine contraction disturbances. 62
71
The next important question is whether there are any management or system factors that might reduce the likelihood for an adverse outcome in the event of uterine rupture. Two fair quality case series231, 232 have specifically studied whether time from signal of uterine rupture to delivery predicts perinatal outcomes. Leung et al were the first to perform an exploratory analysis to study risk factors for poor neonatal and maternal outcome; particularly fetal heart rate (FHR) and uterine contraction patterns.233 They identified 106 cases of symptomatic uterine rupture from 11,179 TOLs in women with prior cesarean delivery at Los Angeles County University of Southern California Women’s Hospital, from which they were able to review 99 records. The scar type was unknown in 99 percent of their population. They categorized cases of uterine rupture based on complete, partial, or no extrusion of the fetus. Combining death, asphyxia, and respiratory distress, they concluded that perinatal morbidity and mortality was significantly greater in cases where the fetus was extruded. Looking for premonitory signs of uterine rupture, they found that prolonged decelerations occurred in 17/41 (41.5 percent) patients with extrusion and 15/58 (25.9 percent) without and that no patient who had prolonged deceleration only as their sign of rupture had significant clinical morbidity when delivery occurred within 17 minutes of the onset of deceleration. Four of six infants (67 percent) who died due to uterine rupture presented to labor and delivery in “fetal distress” and two of six occurred in women undergoing TOL. It is important to note that 57 percent of uterine ruptures with fetal extrusions occurred in women with two or more prior cesarean deliveries; 21 percent in classical or vertical incisions, 21 percent in unknown incisional type, and 58 percent in LTCD.
A second case series of 23 uterine ruptures out of Canada found no relation between time from FHR deceleration and infant outcome.231 As above, the study was conducted in a tertiary care hospital with in-house anesthesia and obstetrics. Fetal heart rate abnormalities—which included tachycardia and late, variable, or prolonged (not defined) decelerations—were the initial sign of uterine rupture in 20/23 (87 percent) of cases (four had pain, one vaginal bleeding, and one hematuria). Prolonged deceleration was the first sign of uterine rupture in 6/6 (100 percent) of the extruded patients versus 8/17 (47 percent) without extrusion. There was one perinatal death that occurred in the non-extruded group (late decelerations more than 25 minutes before delivery, failed vacuum extraction, then cesarean delivery), and three cases of impaired motor development diagnosed as hypoxic-ischemic encephalopathy (HIE), occurring in the extruded group; delivery occurred 15, 16, and 23 minutes from onset of prolonged deceleration. When they looked at metabolic acidosis (their primary outcome, defined as umbilical artery pH less than 7.0 with base deficit greater than 12mMol/L), they found a non-significant trend towards less time between first sign to delivery (18 versus 24 minutes) and decision to delivery (13 versus 17 minutes) in the group with metabolic acidosis compared with those without acidosis (p=0.11). In this case, the greater time delays in the group without metabolic acidosis could reflect less concern by the physician and thus a slower overall movement, rather than programmatic delays.
Summary and strength of the evidence on uterine rupture. Overall, the literature relating to response time between premonitory signs of uterine rupture and perinatal mortality are insufficient. This is due to study designs that are more prone to bias, inconsistent findings, imprecision and difficulty accounting for time among women who presented with concerning fetal tracings (e.g. whether the patient had concerning tracing at arrival to the hospital). However, there is suggestion that fetal bradycardia is an ominous sign for fetal extrusion, which is associated with poor perinatal outcomes, and prompt delivery in this setting is warranted.
72

Hysterectomy Overall there were 16 cohort studies reporting hysterectomy as a complication of ERCD,
VBAC, and RCD after a TOL;10, 77, 78, 80, 81, 93, 100, 108, 137, 164, 201, 204, 228, 234-236 eight provided information comparing risks for hysterectomy between TOL and ERCD (Table 12).10, 77, 81, 93, 108,
201, 204, 234 As shown in Figures 19 and 20, while the occurrence of hysterectomy was higher for ERCD at 0.28 percent (95 percent CI: 0.12 percent to 0.67 percent) compared to 0.17 percent (95 percent CI: 0.12 to 0.26 percent) for TOL but the difference was not statistically significant. Three of the eight studies focused exclusively on women delivering at term.93, 108, 204 Among these studies, the combined risk of hysterectomy was 0.14 percent (95 percent CI: 0.08 to 0.22 percent) in the TOL group and 0.16 percent (95 percent CI: 0.07 to 0.36 percent) in the ERCD group. The risk was not significantly different between the two groups (p=0.672). Among the five studies including women delivering at any gestational age, the combined risk of hysterectomy was 0.22 percent (95 percent CI: 0.13 to 0.38 percent) for TOL and 0.43 percent (95 percent CI: 0.11 to 0.17 percent) for ERCD. Compared with ERCD, TOL had a significantly lower risk of hysterectomy (RR, 0.40; 95 percent CI: 0.18 to 0.92, p=0.03). Using 0.43 percent as the baseline risk for ERCD, the calculated risk difference was -0.26 percent (95 percent CI: 0.35 to -0.04 percent), translating to 2.6 fewer hysterectomies per 1,000 for TOL.
There was significant heterogeneity among the studies. In particular, Phelan and Eglinton appeared to be outliers for ERCD among term studies and because of its size, Wen is exerting significant effect on all analyses and particularly for ERCD; this study has a low occurrence of hysterectomy. Studies were explored for factors that might explain the observed heterogeneity. Considered factors included setting (university versus community), gestational age, number, and direction of scar, and no clear pattern was observed across the eight studies.
Individual studies looked for factors that may affect the occurrence of hysterectomy among women with prior cesarean. In particular, several publications from the MFMU study, report interesting potential contributors. Grobman et al examined the influence of induction of labor and reported that induction was associated with almost a 4-fold increase in the occurrence of hysterectomy (odds ratio 3.92; 95 percent CI: 1.10 to 13.9) among women without a history of prior vaginal delivery. Mercer et al evaluated the risk of hysterectomy with increasing number of VBACs found a non-significant decrease in the rate of hysterectomy from 0.23 percent with no prior VBAC to 0.016 percent in subjects with two or more previous VBACs (p=0.15).192 Perhaps the most intriguing factors reported from this group is in regards to the influence of multiple prior cesarean deliveries and prior vaginal delivery. In subjects undergoing multiple cesarean deliveries, there was a decrease in hysterectomy rate between the first and second cesarean delivery, followed by an increase from 0.42 percent after two cesarean deliveries to 9.0 percent after six or more previous cesarean deliveries.236 Only one study evaluating this cohort compared hysterectomy rate among VBAC after one cesarean delivery, VBAC after greater than one cesarean delivery, and ERCD. This study found the lowest proportion of hysterectomy among those with VBAC after a single cesarean delivery (0.2 percent), intermediate levels after ERCD (0.4 percent), and the highest among those with VBAC after multiple previous cesarean deliveries (0.6 percent).80 These two studies suggest multiple cesarean deliveries increase risk for hysterectomy at the time of delivery; VBAC may be protective against hysterectomy after multiple cesarean deliveries. However, this comparison is limited by a lack of information about the actual number of previous cesarean deliveries and TOL in the latter article, and therefore a dose–dependent effect of increasing number of cesarean deliveries with TOL and VBAC cannot be determined. Furthermore, the inclusion criteria for ERCD limited its applicability, as only low
73

risk ERCD candidates were included. Using data from a California state database, Gregory et al found that underlying medical and obstetrical risk may increase a woman’s chance for hysterectomy reporting a two-fold increase in hysterectomy for ERCD compared with TOL among women with high-risk pregnancies (0.41 versus 0.22 percent).93
74
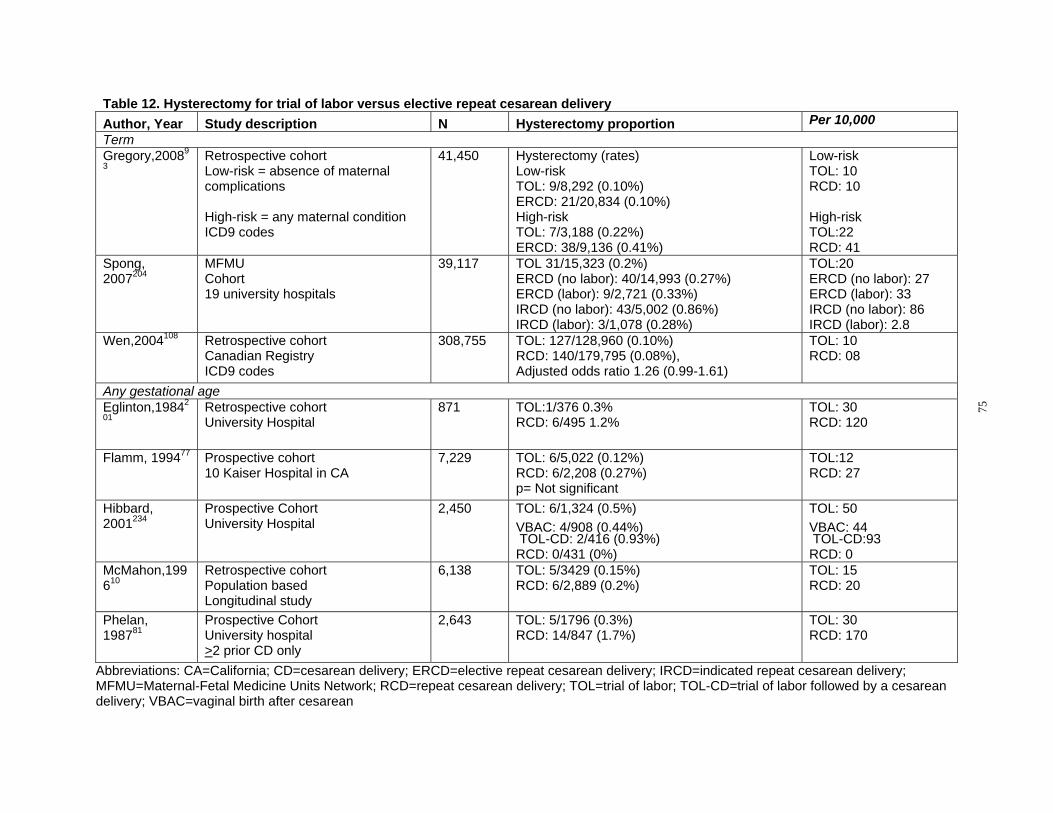
Table 12. Hysterectomy for trial of labor versus elective repeat cesarean delivery Author, Year Study description N Hysterectomy proportion Per 10,000 Term Gregory,20089
3 Retrospective cohort Low-risk = absence of maternal complications
High-risk = any maternal condition ICD9 codes
41,450 Hysterectomy (rates) Low-risk TOL: 9/8,292 (0.10%) ERCD: 21/20,834 (0.10%) High-risk TOL: 7/3,188 (0.22%) ERCD: 38/9,136 (0.41%)
Low-risk TOL: 10 RCD: 10
High-risk TOL:22 RCD: 41
Spong, 2007204
MFMU Cohort 19 university hospitals
39,117 TOL 31/15,323 (0.2%) ERCD (no labor): 40/14,993 (0.27%) ERCD (labor): 9/2,721 (0.33%) IRCD (no labor): 43/5,002 (0.86%) IRCD (labor): 3/1,078 (0.28%)
TOL:20 ERCD (no labor): 27 ERCD (labor): 33 IRCD (no labor): 86 IRCD (labor): 2.8
Wen,2004108 Retrospective cohort Canadian Registry ICD9 codes
308,755 TOL: 127/128,960 (0.10%) RCD: 140/179,795 (0.08%), Adjusted odds ratio 1.26 (0.99-1.61)
TOL: 10 RCD: 08
Any gestational age Eglinton,19842
01 Retrospective cohort University Hospital
871 TOL:1/376 0.3% RCD: 6/495 1.2%
TOL: 30 RCD: 120
Flamm, 199477 Prospective cohort 10 Kaiser Hospital in CA
7,229 TOL: 6/5,022 (0.12%) RCD: 6/2,208 (0.27%) p= Not significant
TOL:12 RCD: 27
Hibbard, 2001234
Prospective Cohort University Hospital
2,450 TOL: 6/1,324 (0.5%) VBAC: 4/908 (0.44%) TOL-CD: 2/416 (0.93%) RCD: 0/431 (0%)
TOL: 50 VBAC: 44 TOL-CD:93 RCD: 0
McMahon,199 610
Retrospective cohort Population based Longitudinal study
6,138 TOL: 5/3429 (0.15%) RCD: 6/2,889 (0.2%)
TOL: 15 RCD: 20
Phelan, 198781
Prospective Cohort University hospital >2 prior CD only
2,643 TOL: 5/1796 (0.3%) RCD: 14/847 (1.7%)
TOL: 30 RCD: 170
75
Abbreviations: CA=California; CD=cesarean delivery; ERCD=elective repeat cesarean delivery; IRCD=indicated repeat cesarean delivery; MFMU=Maternal-Fetal Medicine Units Network; RCD=repeat cesarean delivery; TOL=trial of labor; TOL-CD=trial of labor followed by a cesarean delivery; VBAC=vaginal birth after cesarean
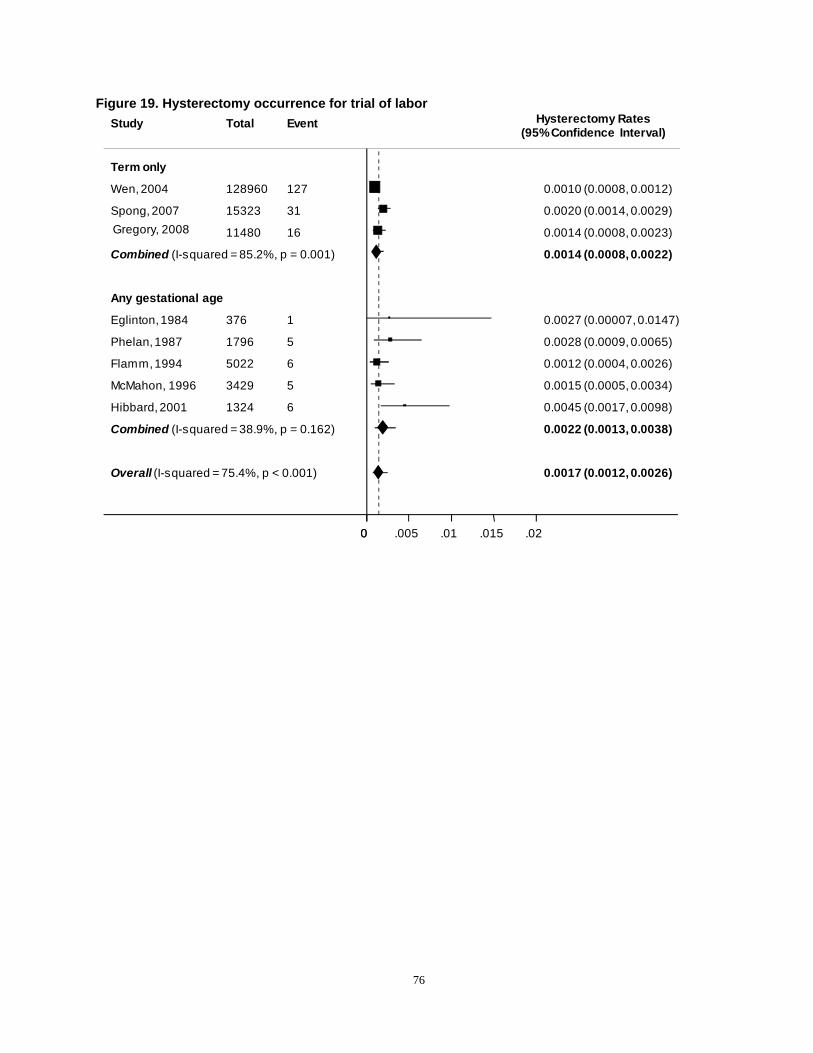
(95%Confidence Interval)
Overall (I-squared = 75.4%, p < 0.001)
Gregory, 2008
Any gestational age
Combined (I-squared = 38.9%, p = 0.162)
Flamm,1994
Phelan,1987
Eglinton,1984
Spong, 2007
Wen, 2004
Combined (I-squared = 85.2%, p = 0.001)
Hibbard, 2001
McMahon, 1996
Term only
11480
5022
1796
376
15323
128960
1324
3429
16
6
5
1
31
127
6
5
0.0017 (0.0012, 0.0026)
0.0014 (0.0008, 0.0023)
0.0022 (0.0013, 0.0038)
0.0012 (0.0004, 0.0026)
0.0028 (0.0009, 0.0065)
0.0027 (0.00007,0.0147)
0.0020 (0.0014, 0.0029)
0.0010 (0.0008, 0.0012)
0.0014 (0.0008, 0.0022)
0.0045 (0.0017, 0.0098)
0.0015 (0.0005, 0.0034)
00 .005 .01 .015 .02
Figure 19. Hysterectomy occurrence for trial of labor Hysterectomy RatesStudy Total Event
76
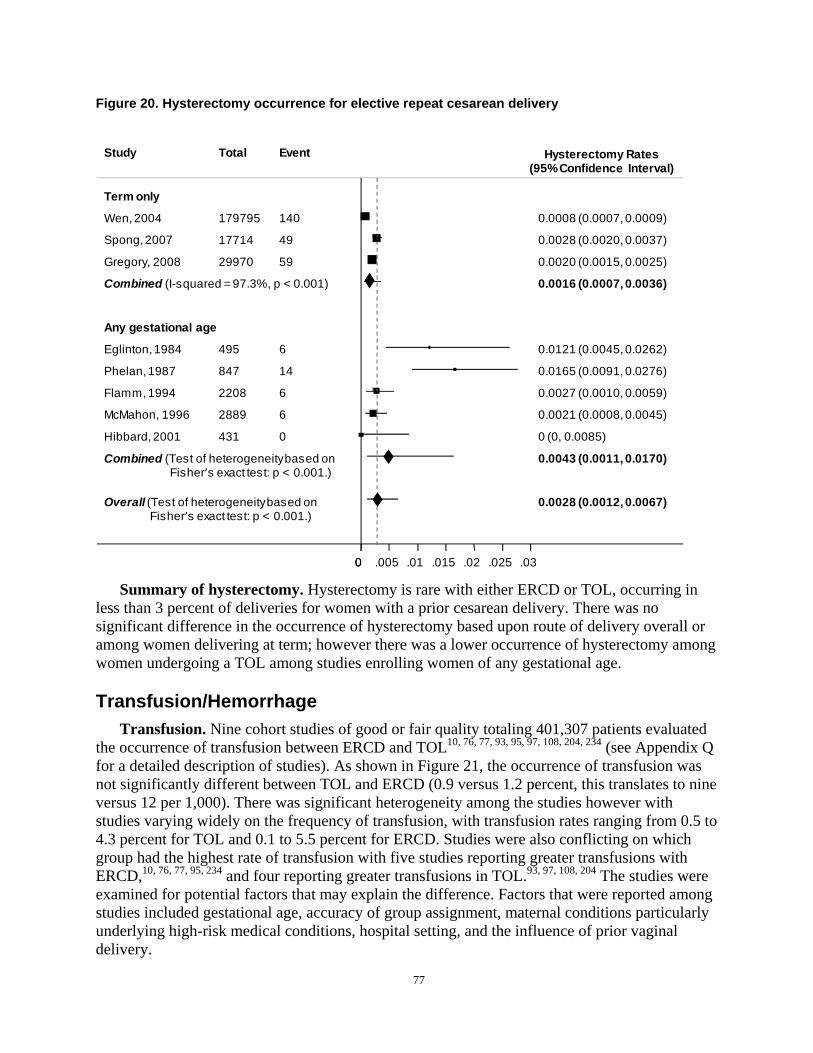
Figure 20. Hysterectomy occurrence for elective repeat cesarean delivery
Study Total Event Hysterectomy Rates (95%Confidence Interval)
Term only
Wen,2004 179795 140 0.0008 (0.0007, 0.0009)
Spong, 2007 17714 49 0.0028 (0.0020, 0.0037)
Gregory, 2008 29970 59 0.0020 (0.0015, 0.0025)
Combined (I-squared = 97.3%, p < 0.001) 0.0016 (0.0007, 0.0036)
Any gestational age
Eglinton,1984 495 6 0.0121 (0.0045, 0.0262)
Phelan,1987 847 14 0.0165 (0.0091, 0.0276)
Flamm,1994 2208 6 0.0027 (0.0010, 0.0059)
McMahon, 1996 2889 6 0.0021 (0.0008, 0.0045)
Hibbard, 2001 431 0 0 (0, 0.0085)
Combined (Test of heterogeneitybased on 0.0043 (0.0011, 0.0170) Fisher’s exact test: p < 0.001.)
Overall (Test of heterogeneitybased on 0.0028 (0.0012, 0.0067) Fisher’s exact test: p < 0.001.)
00 .005 .01 .015 .02 .025 .03
Summary of hysterectomy. Hysterectomy is rare with either ERCD or TOL, occurring in less than 3 percent of deliveries for women with a prior cesarean delivery. There was no significant difference in the occurrence of hysterectomy based upon route of delivery overall or among women delivering at term; however there was a lower occurrence of hysterectomy among women undergoing a TOL among studies enrolling women of any gestational age.
Transfusion/Hemorrhage Transfusion. Nine cohort studies of good or fair quality totaling 401,307 patients evaluated
the occurrence of transfusion between ERCD and TOL10, 76, 77, 93, 95, 97, 108, 204, 234 (see Appendix Q for a detailed description of studies). As shown in Figure 21, the occurrence of transfusion was not significantly different between TOL and ERCD (0.9 versus 1.2 percent, this translates to nine versus 12 per 1,000). There was significant heterogeneity among the studies however with studies varying widely on the frequency of transfusion, with transfusion rates ranging from 0.5 to 4.3 percent for TOL and 0.1 to 5.5 percent for ERCD. Studies were also conflicting on which group had the highest rate of transfusion with five studies reporting greater transfusions with ERCD,10, 76, 77, 95, 234 and four reporting greater transfusions in TOL.93, 97, 108, 204 The studies were examined for potential factors that may explain the difference. Factors that were reported among studies included gestational age, accuracy of group assignment, maternal conditions particularly underlying high-risk medical conditions, hospital setting, and the influence of prior vaginal delivery.
77
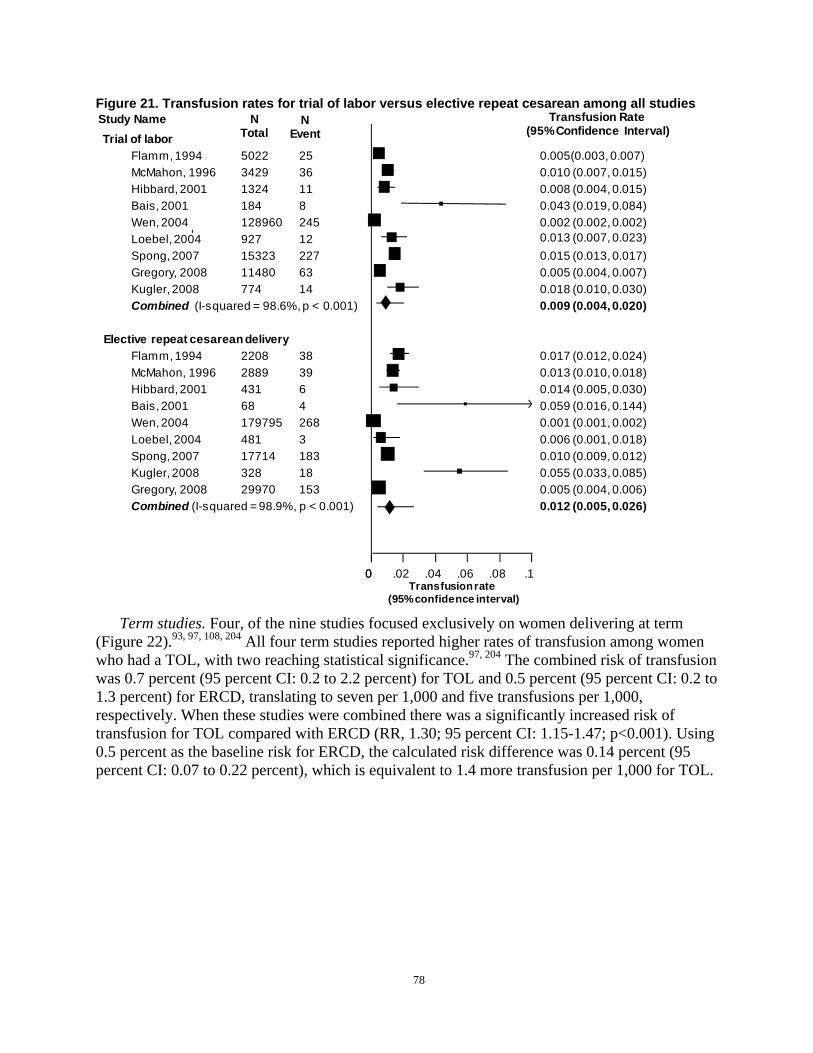
Total Event (95%Confidence Interval)Trial of labor
Flamm, 1994 5022 25 0.005(0.003, 0.007) McMahon, 1996 3429 36 0.010 (0.007, 0.015) Hibbard, 2001 1324 11 0.008 (0.004, 0.015) Bais, 2001 184 8 0.043 (0.019, 0.084) Wen, 2004 128960 245 0.002 (0.002, 0.002) Loebel, 2004 927 12 0.013 (0.007, 0.023) Spong, 2007 15323 227 0.015 (0.013, 0.017) Gregory, 2008 11480 63 0.005 (0.004, 0.007) Kugler, 2008 774 14 0.018 (0.010, 0.030) Combined (I-squared = 98.6%, p < 0.001) 0.009 (0.004, 0.020)
Elective repeat cesarean delivery Flamm, 1994 2208 38 0.017 (0.012, 0.024) McMahon, 1996 2889 39 0.013 (0.010, 0.018) Hibbard, 2001 431 6 0.014 (0.005, 0.030) Bais, 2001 68 4 0.059 (0.016, 0.144) Wen, 2004 179795 268 0.001 (0.001, 0.002) Loebel, 2004 481 3 0.006 (0.001, 0.018) Spong, 2007 17714 183 0.010 (0.009, 0.012) Kugler, 2008 328 18 0.055 (0.033, 0.085) Gregory, 2008 29970 153 0.005 (0.004, 0.006) Combined (I-squared = 98.9%, p < 0.001) 0.012 (0.005, 0.026)
00 .02 .04 .06 .08 .1 Transfusionrate
(95%confidence interval)
Figure 21. Transfusion rates for trial of labor versus elective repeat cesarean among all studies Study Name N N Transfusion Rate
Term studies. Four, of the nine studies focused exclusively on women delivering at term (Figure 22).93, 97, 108, 204 All four term studies reported higher rates of transfusion among women who had a TOL, with two reaching statistical significance.97, 204 The combined risk of transfusion was 0.7 percent (95 percent CI: 0.2 to 2.2 percent) for TOL and 0.5 percent (95 percent CI: 0.2 to 1.3 percent) for ERCD, translating to seven per 1,000 and five transfusions per 1,000, respectively. When these studies were combined there was a significantly increased risk of transfusion for TOL compared with ERCD (RR, 1.30; 95 percent CI: 1.15-1.47; p<0.001). Using 0.5 percent as the baseline risk for ERCD, the calculated risk difference was 0.14 percent (95 percent CI: 0.07 to 0.22 percent), which is equivalent to 1.4 more transfusion per 1,000 for TOL.
78
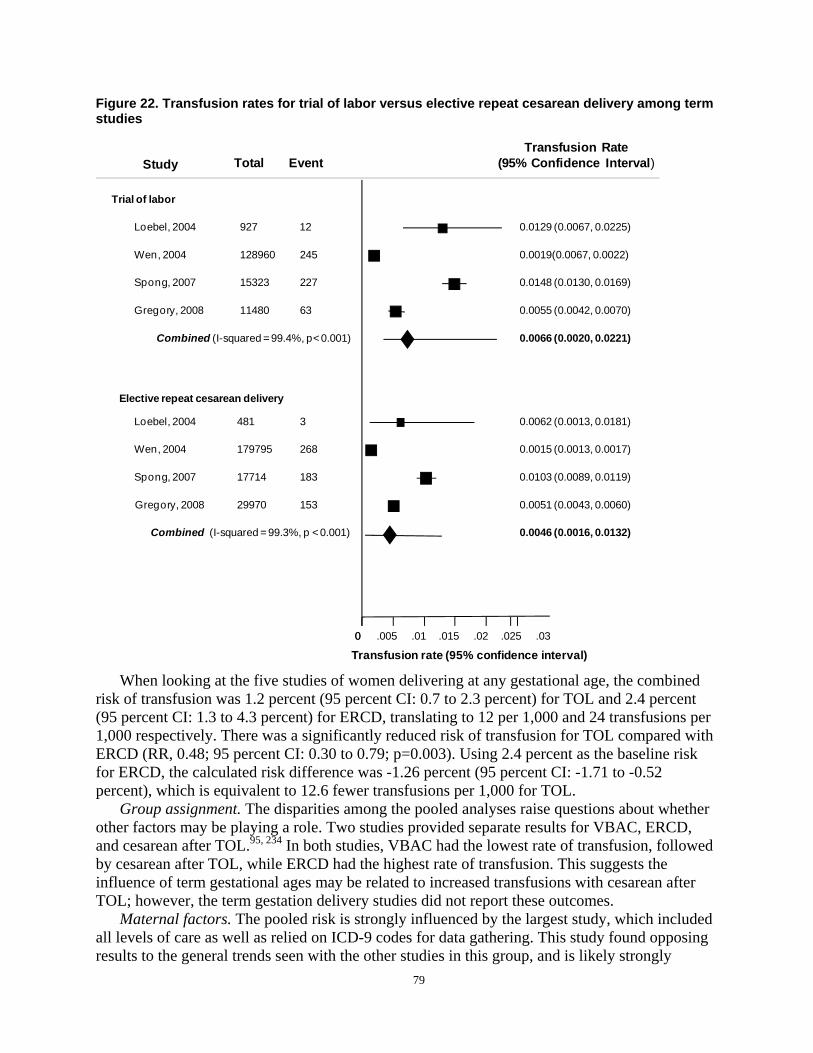
Transfusion Rate Study Total Event (95% Confidence Interval)
Trial of labor
Loebel, 2004 927 12
Wen, 2004 128960 245
Spong, 2007 15323 227
Gregory, 2008 11480 63
Combined (I-squared = 99.4%, p< 0.001)
Elective repeat cesarean delivery
Loebel, 2004 481 3
Wen, 2004 179795 268
Spong, 2007 17714 183
Gregory, 2008 29970 153
Combined (I-squared = 99.3%, p < 0.001)
0.0129 (0.0067, 0.0225)
0.0019(0.0067, 0.0022)
0.0148 (0.0130, 0.0169)
0.0055 (0.0042, 0.0070)
0.0066 (0.0020, 0.0221)
0.0062 (0.0013, 0.0181)
0.0015 (0.0013, 0.0017)
0.0103 (0.0089, 0.0119)
0.0051 (0.0043, 0.0060)
0.0046 (0.0016, 0.0132)
00 .005 .01 .015 .02 .025 .03
Figure 22. Transfusion rates for trial of labor versus elective repeat cesarean delivery among term studies
Transfusion rate (95% confidence interval)
When looking at the five studies of women delivering at any gestational age, the combined risk of transfusion was 1.2 percent (95 percent CI: 0.7 to 2.3 percent) for TOL and 2.4 percent (95 percent CI: 1.3 to 4.3 percent) for ERCD, translating to 12 per 1,000 and 24 transfusions per 1,000 respectively. There was a significantly reduced risk of transfusion for TOL compared with ERCD (RR, 0.48; 95 percent CI: 0.30 to 0.79; p=0.003). Using 2.4 percent as the baseline risk for ERCD, the calculated risk difference was -1.26 percent (95 percent CI: -1.71 to -0.52 percent), which is equivalent to 12.6 fewer transfusions per 1,000 for TOL.
Group assignment. The disparities among the pooled analyses raise questions about whether other factors may be playing a role. Two studies provided separate results for VBAC, ERCD, and cesarean after TOL.95, 234 In both studies, VBAC had the lowest rate of transfusion, followed by cesarean after TOL, while ERCD had the highest rate of transfusion. This suggests the influence of term gestational ages may be related to increased transfusions with cesarean after TOL; however, the term gestation delivery studies did not report these outcomes.
Maternal factors. The pooled risk is strongly influenced by the largest study, which included all levels of care as well as relied on ICD-9 codes for data gathering. This study found opposing results to the general trends seen with the other studies in this group, and is likely strongly
79

contributing to the effect seem with the pooled data.108 Two studies examined the affect of medical conditions upon transfusion rates.93, 204 Both studies found an association between high-risk pregnancies with medical conditions and increased transfusion. Gregory found that among high-risk patients, women who delivered by ERCD had more transfusions than those who had a TOL (0.92 versus 0.78 percent, p=NS) and that the overall rate of transfusions was greater among higher risk pregnancies compared with the low-risk group (0.46 versus 0.33 percent, p=NS).93 Similarly, using data from the MFMU cohort, Spong et al divided the type of cesarean delivery into ERCD and indicated repeat cesarean (IRCD) with and without labor, and found the highest proportion of transfusion with IRCD in the absence of labor, again suggesting an influence of maternal co-morbid conditions contributing to increased transfusion risk.204 An analysis of the MFMU cohort focusing only on low-risk ERCD found a statistically significant increase in transfusion with TOL compared with ERCD prior to labor (one versus 1.7 percent, p<0.001), further supporting the idea that maternal co-morbid conditions influence the risk of transfusion.221 In this same cohort, however, increasing maternal BMI and morbid obesity were not found to be associated with increased risk of transfusion in the MFMU cohort.78
Hospital setting. One study evaluated the impact of hospital delivery volume on the risk of transfusion.108 In low volume hospitals (less than 500 deliveries per year) the odds of transfusion with TOL was 1.39 (1.02 to 1.88) compared with ERCD. In high volume centers (greater than 500 deliveries per year) the odds ratio was 1.66 (1.32 to 2.08) for transfusion with TOL compared with ERCD.108 This study differs in its findings from other studies as described previously; confounding factors that may contribute to this difference is that this review of a birth registry was based on ICD-9 codes; also, unlike the other studies, this study does report only on Canadian hospitals, and includes multiple different levels of hospital acuity.
Influence of prior deliveries. Within the MFMU cohort, multiple studies evaluated the impact of previous deliveries on the risk of transfusion.80, 181, 192, 236 Subjects with only one prior cesarean delivery undergoing TOL had a rate comparable with ERCD (1.6 versus 1.5 percent), while those with multiple prior cesareans undergoing TOL had a higher transfusion rate compared with ERCD (3.2 versus 1.5 percent).80 This study did not distinguish those with ERCD undergoing multiple cesareans versus first RCD. However, increasing number of cesareans was found to be a risk factor for transfusion.236 The MFMU cohort had a decreasing rate of transfusion with increasing number of previous VBACs, implying a protective role for prior vaginal delivery against transfusion (zero prior VBAC: 1.89 percent; one prior VBAC: 0.24 percent; two or more prior VBAC: 0.99 percent; p=0.002).192 One study of this cohort found no difference in women with a prior vaginal delivery when comparing those who were induced with those who went into spontaneous labor (odds ratio 1.13; 95 percent CI: 0.66 to 1.95). However, in those women without a previous vaginal delivery, there was a higher rate of transfusion in the induced group compared with the spontaneous labor group, suggesting a role of induction as a risk for transfusion in women with no prior vaginal delivery only (odds ratio 1.65; 95 percent CI: 1.10 to 2.48).156
Hemorrhage. Six fair quality cohort studies report on the occurrence of hemorrhage for TOL versus ERCD.76, 93, 95, 100, 203, 234 Among the six studies the rates of hemorrhage with ERCD ranged from 0.3 percent to as high as 29 percent. In general, studies reported increased occurrence of hemorrhage associated with ERCD compared to TOL. However, studies were inconsistent regarding the definition of hemorrhage. Several studies did not report the process by which this outcome was measured; studies that quantified blood loss used different amounts of blood loss to qualify as hemorrhage. The highest rate of hemorrhage was from a study that defined hemorrhage as greater than 500mL blood loss.76 Further complicating evaluation of these
80
data is the known difficulty in recording blood loss. Multiple studies demonstrate physician perception of blood loss differs from actual blood loss, impeding accurate recording of this measure.237, 238 All studies found a trend toward increased blood loss with ERCD. However, none of the studies found a statistically significant difference between hemorrhage rates for TOL and ERCD. Because these studies did not define hemorrhage similarly, these data were not pooled for analysis. Interesting findings from individual studies are discussed below.
Term studies. Only one of the six studies,93 provided data regarding hemorrhage specifically in term pregnancies. In this study, low-risk patients were separated from high-risk patients based on antenatal conditions. The low-risk group had a lower rate of hemorrhage with TOL compared with ERCD (2.36 versus 6.82 percent, p=NS); however in the high-risk group, there was an increase in hemorrhage with TOL compared with ERCD (3.26 versus 1.57 percent). In the one study that reported both, the rates of transfusion are in direct opposition to the rates of hemorrhage for every subset, such that in groups with higher rates of hemorrhage, there were overall fewer transfusions given.93 This was a study that used an administrative database and demonstrates the difficulty in reporting and interpreting a subjective term such as hemorrhage.
Group assignment. Three studies separated the TOL data by VBAC and cesarean after a TOL.95, 203, 234 Rates of hemorrhage for VBAC ranged from 0.3 to 6 percent, compared with cesarean after TOL which ranged from 0.86 to 14.8 percent. In three of these studies, cesarean after a TOL had the highest rate of hemorrhage compared to VBAC and ERCD. One study found a statistically significant increase in hemorrhage with ERCD compared to cesarean after a TOL and VBAC (0.91 versus 0.64 versus 0.81 percent, p<0.001).95 This study did not define hemorrhage; in addition, this university-based Israeli study focused on a grand multiparous subgroup, possibly confounding the results given the global increased risk of hemorrhage. One database study from Norway described the incidence of postpartum hemorrhage. Though it did not specifically evaluate women undergoing TOL or ERCD, it did find 333 cases of hemorrhage in women with a history of previous cesarean delivery. This study found an increased risk of hemorrhage with both vaginal delivery (odds ratio 1.63; 95 percent CI: 1.34 to 1.98) and emergency cesarean (1.41; 95 percent CI: 1.12 to 1.78) in women with a previous history of cesarean compared to women without a history of cesarean.239 This study found no difference in hemorrhage between these two groups for pre-labor cesarean; however, for women with prior cesarean, pre-labor cesarean carried a 28 percent higher risk of hemorrhage compared to spontaneous labor delivery.239
Summary and strength of evidence on transfusion/hemorrhage. Overall, evidence regarding the rate of hemorrhage for TOL and ERCD is low due to inconsistency in definitions and subjectivity in measurement. In general, studies reported increased occurrence of hemorrhage associated with ERCD compared to TOL. There was only one study that provided data for term populations. This study suggested that medical complications may modify the effect of route of delivery upon hemorrhage with low-risk patients similarly having higher hemorrhage rates for ERCD but with high-risk patients experiencing higher rates of hemorrhage for TOL. Further studies are needed to understand the true relationship.
Infection Twenty-two studies of good or fair quality evaluated infectious morbidity (e.g., fever, infection, endometritis, or chorioamnionitis) in TOL compared with ERCD (see Appendix R for study details).10, 76-79, 81, 89, 95, 97, 108, 114, 201-205, 221, 234, 240-243 Ten studies 10, 89, 95, 97, 108, 202-204, 234, 240 report on infection in some manner. As shown in Figure 23, there was no significant difference in infection between TOL and ERCD. ). The I2 statistic for heterogeneity was 89 percent. However,
81
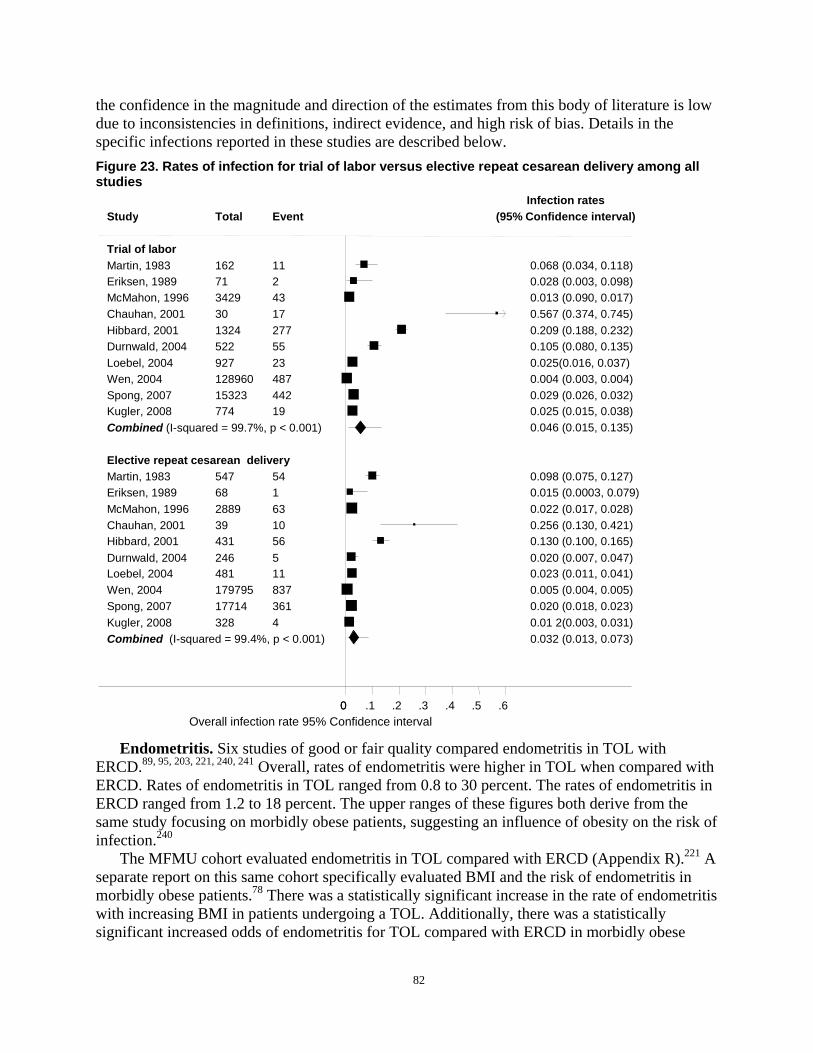
the confidence in the magnitude and direction of the estimates from this body of literature is low due to inconsistencies in definitions, indirect evidence, and high risk of bias. Details in the specific infections reported in these studies are described below. Figure 23. Rates of infection for trial of labor versus elective repeat cesarean delivery among all studies
Infection rates Study Total Event (95% Confidence interval)
Trial of labor Martin, 1983 162 11 0.068 (0.034, 0.118)Eriksen, 1989 71 2 0.028 (0.003, 0.098)McMahon, 1996 3429 43 0.013 (0.090, 0.017)Chauhan, 2001 30 17 0.567 (0.374, 0.745)Hibbard, 2001 1324 277 0.209 (0.188, 0.232)Durnwald, 2004 522 55 0.105 (0.080, 0.135)Loebel, 2004 927 23 0.025(0.016, 0.037)Wen, 2004 128960 487 0.004 (0.003, 0.004)Spong, 2007 15323 442 0.029 (0.026, 0.032)Kugler, 2008 774 19 0.025 (0.015, 0.038)Combined (I-squared = 99.7%, p < 0.001) 0.046 (0.015, 0.135)
Elective repeat cesarean delivery Martin, 1983 547 54 0.098 (0.075, 0.127)Eriksen, 1989 68 1 0.015 (0.0003, 0.079)McMahon, 1996 2889 63 0.022 (0.017, 0.028)Chauhan, 2001 39 10 0.256 (0.130, 0.421)Hibbard, 2001 431 56 0.130 (0.100, 0.165)Durnwald, 2004 246 5 0.020 (0.007, 0.047)Loebel, 2004 481 11 0.023 (0.011, 0.041)Wen, 2004 179795 837 0.005 (0.004, 0.005)Spong, 2007 17714 361 0.020 (0.018, 0.023)Kugler, 2008 328 4 0.01 2(0.003, 0.031)Combined (I-squared = 99.4%, p < 0.001) 0.032 (0.013, 0.073)
00 .1 .2 .3 .4 .5 .6
Overall infection rate 95% Confidence interval
Endometritis. Six studies of good or fair quality compared endometritis in TOL with ERCD.89, 95, 203, 221, 240, 241 Overall, rates of endometritis were higher in TOL when compared with ERCD. Rates of endometritis in TOL ranged from 0.8 to 30 percent. The rates of endometritis in ERCD ranged from 1.2 to 18 percent. The upper ranges of these figures both derive from the same study focusing on morbidly obese patients, suggesting an influence of obesity on the risk of infection.240
The MFMU cohort evaluated endometritis in TOL compared with ERCD (Appendix R).221 A separate report on this same cohort specifically evaluated BMI and the risk of endometritis in morbidly obese patients.78 There was a statistically significant increase in the rate of endometritis with increasing BMI in patients undergoing a TOL. Additionally, there was a statistically significant increased odds of endometritis for TOL compared with ERCD in morbidly obese
82
(BMI greater than 40) subjects. (odds ratio 2.4; 95 percent CI: 1.7 to 3.5).78 This again suggests maternal weight influences the risk of endometritis in this population.
In studies where outcomes of TOL were evaluated separately, cesarean after labor patients consistently had a higher rate of endometritis than did VBAC or ERCD patients.89, 95, 203 This suggests the increased rates of endometritis seen with TOL may be more associated with cesarean delivery than with the labor itself.
Chorioamnionitis. In total, two cohort studies compared chorioamnionitis rates for TOL and ERCD in deliveries.89, 95 Both found a higher rate of chorioamnionitis in the TOL group. Based on this, there is evidence that chorioamnionitis is associated with TOL, regardless of ultimate mode of delivery.
Wound infection. Wound infection was evaluated in three cohort studies.10, 203, 240 Two of the three found ERCD to be associated with a higher rate of wound infection, 10, 203 while one found a higher rate with TOL. This study was limited to women over 300lbs at delivery, which complicates any direct comparison of this data with the others.240 None of these studies reached statistical significance with their findings.
Fever. Ten good or fair quality cohort studies compared maternal fever between TOL and ERCD.10, 76, 77, 79, 81, 89, 95, 201, 202, 205 As shown in Figure 24, the combined absolute risk for any fever with TOL was 6.5 percent (95 percent CI: 4.4 to 9.3 percent) which translates to 65 per 1,000 (95 percent CI: 44 to 93 per 1,000) and for ERCD was 7.2 percent (95 percent CI: 2.5 to 18.9 percent) which translates to 72 per 1,000 (95 percent CI: 25 to 189 per 1,000). Compared with ERCD, TOL demonstrated a significant decrease in the risk of fever (RR, 0.63; 95 percent CI: 0.43 to 0.91; p=0.013). Using 7.2 percent as the baseline risk for ERCD, the calculated risk difference was -2.7 percent (95 percent CI: -4.10 to -0.68 percent), which is equivalent to 27 fewer fevers per 1,000 from the TOL There was considerable heterogeneity among studies (I2 = 92.7 percent), which demonstrates the variability in the definition of the term “fever” among studies. Only one study in this pooled analysis defined fever by an absolute number (greater than 38 degrees Celsius); it is interesting to note this study did serve as the most apparent outlier in the pooled analysis.79 When this study was excluded from analysis, the combined risk of fever for ERCD group was 11.0 percent and TOL still had a significantly lower risk of fever (RR, 0.58; 95 percent CI: 0.40 to 0.82; p=0.002). Using 11.0 percent as the baseline risk for ERCD, the calculated risk difference was -4.68 percent (95 percent CI: -6.58 to -1.95 percent), which is equivalent to 47 fewer fevers per 1,000 for TOL. The I2 statistic for heterogeneity remained 92.7 percent, demonstrating that this outlier did not explain the heterogeneity seen among studies.
Four cohort studies evaluated maternal fever stratified by outcome of TOL.81, 89, 95, 201 Three of the four studies found increased rates of fever in cesarean after a TOL compared with VBAC.81, 89, 201 This suggests a higher febrile morbidity associated with cesarean delivery after labor compared with VBAC. However, in all but one of these studies ERCD continued to have the highest rate of febrile morbidity, suggesting surgery as a risk factor for maternal infectious morbidity. This would imply the rate of fever seen with TOL may be influenced by the higher risk of fever with RCD after a TOL and not be associated with VBAC. The one outlier study in this group found a rate of 32 percent for cesarean after a TOL compared with 18 percent for ERCD. However, the population of this study was limited to subjects with two prior cesarean deliveries. Increased complications with second cesarean after labor may have influenced the higher rates seen with ERCD.81 Within women who underwent a TOL, there appears to be an increased risk for febrile morbidity with operative delivery.
83

Figure 24. Rates of fever for trial of labor versus elective repeat cesarean delivery among all studies
Study N Total N Event 95% Confidence interval
Trial of labor Eglington, 1984 376 33 0.088 (0.061, 0.121) Phelan, 1987 1796 159 0.089(0.076, 0.103) Eriksen, 1989 71 4 0.056 (0.016, 0.138) Flamm, 1994 5022 638 0.127 (0.118, 0.137) Mcmahon, 1996 3424 171 0.050 (0.043, 0.058) Hook, 1997 492 38 0.077(0.055, 0.104) Bias, 2001 184 16 0.087 (0.051, 0.137) Durnwald, 2004 522 27 0.052 (0.034, 0.074) Cahill, 2006 5041 329 0.065 (0.059, 0.072) Kugler, 2008 619 9 0.015 (0.007, 0.027) Combined (I-squared = 96.0%, p < 0.001) 0.065 (0.044, 0.093)
Elective repeat cesarean delivery Eglington, 1984 495 176 0.356 (0.313, 0.399) Phelan, 1987 314 56 0.178 (0.138, 0.225) Eriksen, 1989 68 7 0.103 (0.042, 0.201) Flamm, 1994 2208 362 0.164 (0.149, 0.180) Mcmahon, 1996 2889 185 0.064 (0.055, 0.074) Hook, 1997 497 0 0 (0, 0.0074) Bias, 2001 68 7 0.103 (0.042, 0.201) Durnwald, 2004 246 6 0.024 (0.009, 0.052) Cahill, 2006 1578 294 0.186 (0.167, 0.206) Kugler, 2008 328 10 0.030 (0.015, 0.055) Combined (Test of heterogeneity is based on 0.072 (0.025, 0.189)
Fisher’ Exact test, p < 0.001)
-.1 00 .1 .2 .3
Fever rate (95% Confidence interval)
Summary and strength of evidence on infection. Overall, the evidence regarding rate of both infection (all definitions) and fever for women with a prior cesarean delivery is low in strength with inconsistent definitions, high-risk of bias and indirect evidence. The high heterogeneity in these studies demonstrates the variability in the definition of the term “fever” among studies. Overall there was no significant difference in infection between TOL and ERCD.
Surgical injury In good or fair quality cohort studies, surgical injury was defined differently between studies
and variably reported on. Seven studies compared surgical injury between TOL and ERCD.10, 78,
80, 97, 204, 205, 236 Four of these are from the same cohort of patients (MFMU); however they report differently on surgical injury rates and therefore are presented separately (Table 13).78, 80, 204, 236
Overall, these were found to be rare events. None of the stratifications from the MFMU studies found a significant difference between ERCD and TOL for rate of surgical injury.78, 80, 204,
236 When a specific injury was evaluated, such as bladder, there did tend to be an increased rate
84
of injury with a cesarean after a TOL. However, this trend was not found to be statistically significant.205
One case-control study evaluating women with bladder injury at the time of cesarean delivery found attempted VBAC to be proportionately higher in the cases compared with controls (64 versus 22 percent, p<0.1) This study found no difference in type of uterine incision with risk of bladder injury.244
One study of 3,164 women evaluated the impact of skin incision direction on the risk of bowel or bladder injury. This retrospective study found an increased odds ratio of bladder injury with a midline sub-umbilical incision compared with a Pfannenstiel (6.7; 95 percent CI: 2.6 to 16.5). The RR for bowel injury was also increased with vertical incision at five and a half fold risk. After multivariate analysis, vertical abdominal incision remained a significant risk factor for bladder injury at the time of cesarean. There was a trend toward increased injury with increasing numbers of cesarean deliveries, though this was not statistically significant.245
85
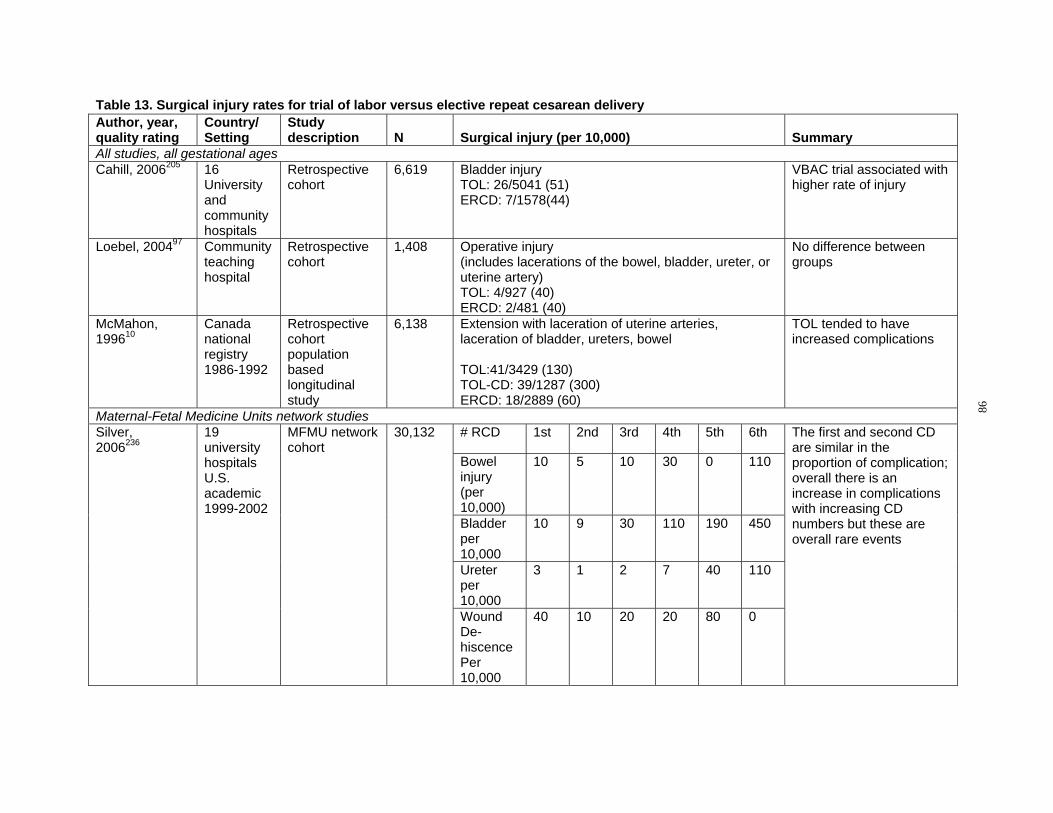
Table 13. Surgical injury rates for trial of labor versus elective repeat cesarean delivery Author, year, quality rating
Country/ Setting
Study description N Surgical injury (per 10,000) Summary
All studies, all gestational ages Cahill, 2006205 16
University and community hospitals
Retrospective cohort
6,619 Bladder injury TOL: 26/5041 (51) ERCD: 7/1578(44)
VBAC trial associated with higher rate of injury
Loebel, 200497 Community teaching hospital
Retrospective cohort
1,408 Operative injury (includes lacerations of the bowel, bladder, ureter, or uterine artery) TOL: 4/927 (40) ERCD: 2/481 (40)
No difference between groups
McMahon, 199610
Canada national registry 1986-1992
Retrospective cohort population based longitudinal study
6,138 Extension with laceration of uterine arteries, laceration of bladder, ureters, bowel
TOL:41/3429 (130) TOL-CD: 39/1287 (300) ERCD: 18/2889 (60)
TOL tended to have increased complications
Maternal-Fetal Medicine Units network studies Silver, 2006236
19 university hospitals U.S. academic 1999-2002
MFMU network cohort
30,132 # RCD 1st 2nd 3rd 4th 5th 6th The first and second CD are similar in the proportion of complication; overall there is an increase in complications with increasing CD numbers but these are overall rare events
Bowel injury (per 10,000)
10 5 10 30 0 110
Bladder per 10,000
10 9 30 110 190 450
Ureter per 10,000
3 1 2 7 40 110
Wound Dehiscence Per 10,000
40 10 20 20 80 0
86
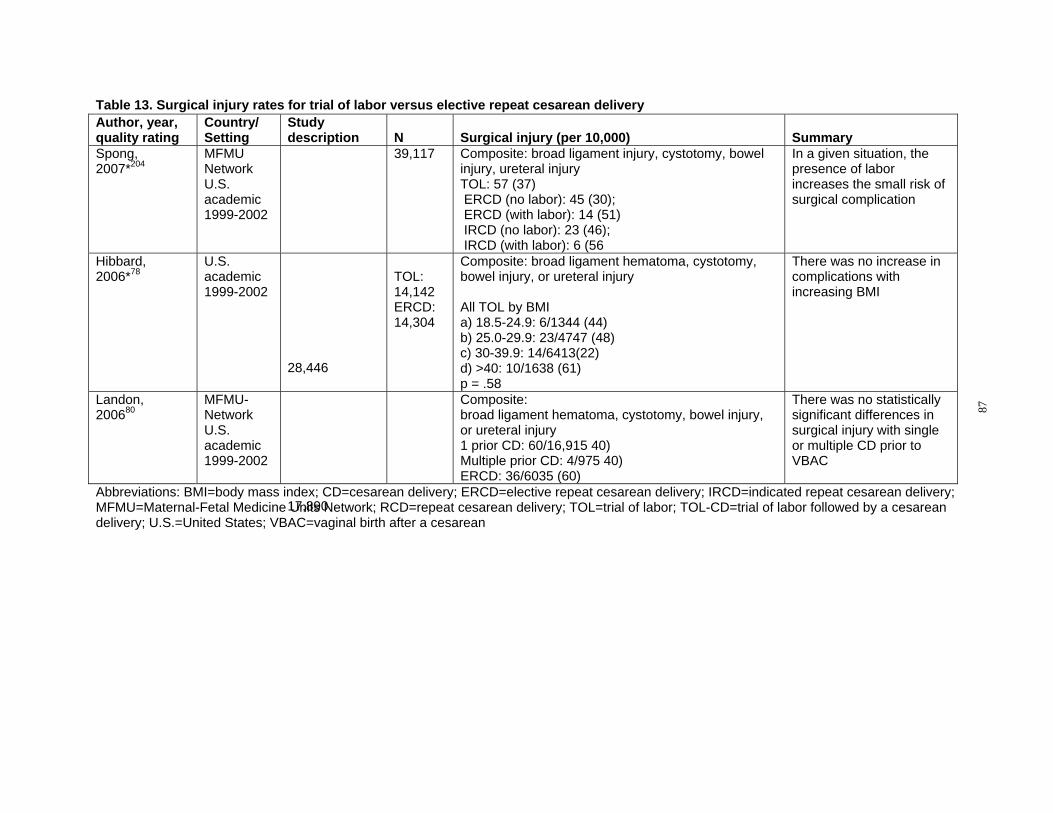
Table 13. Surgical injury rates for trial of labor versus elective repeat cesarean delivery Author, year, Country/ Study quality rating Setting description N Surgical injury (per 10,000) Summary Spong, MFMU 39,117 Composite: broad ligament injury, cystotomy, bowel In a given situation, the 2007*204 Network injury, ureteral injury presence of labor
U.S. TOL: 57 (37) increases the small risk of academic 1999-2002
ERCD (no labor): 45 (30); ERCD (with labor): 14 (51)
surgical complication
IRCD (no labor): 23 (46); IRCD (with labor): 6 (56
Hibbard, U.S.
28,446
Composite: broad ligament hematoma, cystotomy, There was no increase in 2006*78 academic TOL: bowel injury, or ureteral injury complications with
1999-2002 14,142 ERCD: All TOL by BMI
increasing BMI
14,304 a) 18.5-24.9: 6/1344 (44) b) 25.0-29.9: 23/4747 (48) c) 30-39.9: 14/6413(22) d) >40: 10/1638 (61) p = .58
Landon, MFMU
17,890
Composite: There was no statistically 200680 Network
U.S. academic 1999-2002
broad ligament hematoma, cystotomy, bowel injury, or ureteral injury 1 prior CD: 60/16,915 40) Multiple prior CD: 4/975 40) ERCD: 36/6035 (60)
significant differences in surgical injury with single or multiple CD prior to VBAC
Abbreviations: BMI=body mass index; CD=cesarean delivery; ERCD=elective repeat cesarean delivery; IRCD=indicated repeat cesarean delivery; MFMU=Maternal-Fetal Medicine Units Network; RCD=repeat cesarean delivery; TOL=trial of labor; TOL-CD=trial of labor followed by a cesarean delivery; U.S.=United States; VBAC=vaginal birth after a cesarean
87
Summary of surgical injury. Rate of surgical injury may be increased with TOL but definitive studies are lacking. Vertical skin incision increases risk of surgical injury to the bladder. Hospital Stay
Hospital stay was reported as length of total stay in days. A total of eight cohort studies examined length of stay data in the U.S., comparing ERCD and TOL (Appendix S).77, 79, 81, 93, 97,
201, 202, 234 All studies were affiliated with teaching institutions. In general, as expected, ERCD had a longer length of hospital stay compared with TOL. The large MFMU cohort studies did not report length of stay data comparing ERCD with TOL. One study did evaluate the risk of extended stay, defined as greater than 4 days, with ERCD compared with TOL in morbidly obese patients; this study found increased length of stay with ERCD (odds ratio 1.2; 95 percent CI: 1.1 to 1.4).78
Pooled analysis of any gestational age studies. For any GA cohorts, the pooled analysis using a random effects model demonstrated that the mean length of stay for TOL was 2.55 days (95 percent CI: 2.34 to 2.76 days). Pooled mean length of stay for ERCD was 3.92 days (95 percent CI: 3.56 to 4.29 days). There was significant heterogeneity among studies (Q=221.06, p<0.001) and the I2 statistic for heterogeneity was 98.2 percent (between-study heterogeneity accounts for 98.2 percent of the total heterogeneity) (Figure 25).
Summary of hospital stay. Elective repeat cesarean delivery is associated with a longer hospital stay compared with TOL.
88
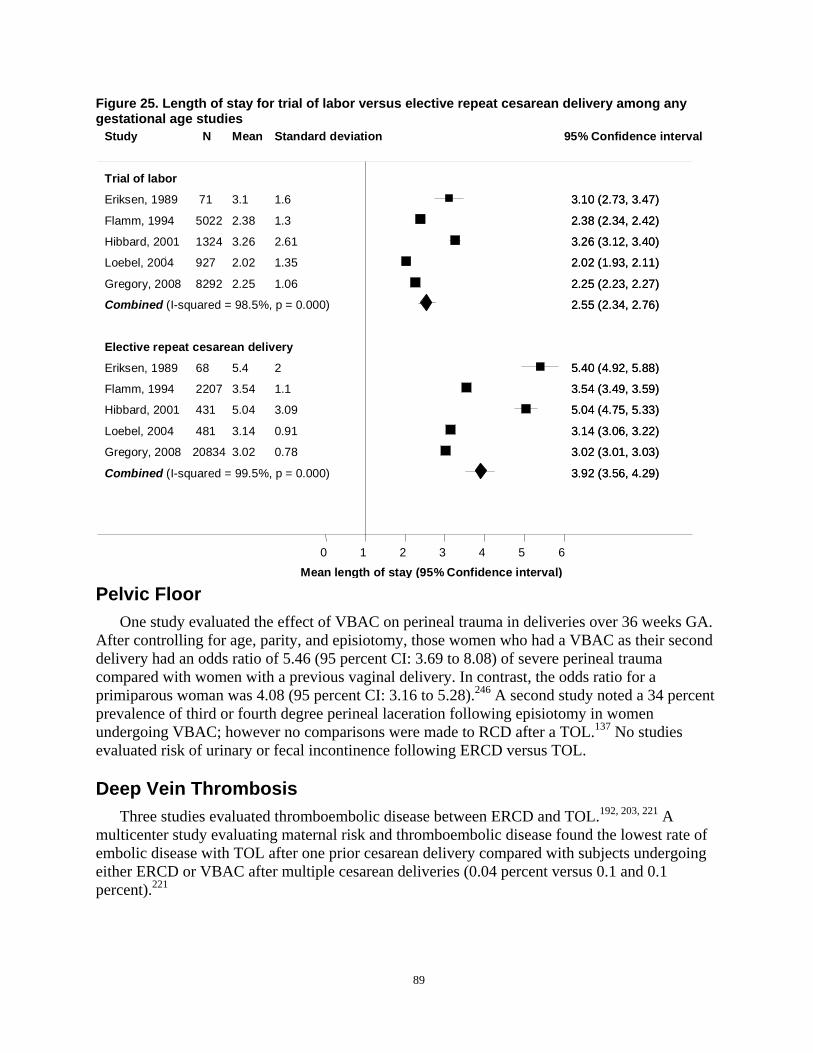
Figure 25. Length of stay for trial of labor versus elective repeat cesarean delivery among any gestational age studies
Study N Mean Standard deviation 95% Confidence interval
Trial of labor
Eriksen, 1989
Flamm, 1994
71
5022
3.1
2.38
1.6
1.3
3.3.1100 ((22..7733,, 3.3.4747))
2.2.3388 ((22..3344,, 2.2.4242))
Hibbard, 2001
Loebel, 2004
1324
927
3.26
2.02
2.61
1.35
3.3.2266 ((33..1122,, 3.3.4040))
2.2.0022 ((11..9933,, 2.2.1111))
Gregory, 2008 8292 2.25 1.06 2.2.2255 ((22..2233,, 2.2.2727))
Combined (I-squared = 98.5%, p = 0.000) 2.2.5555 ((22..3344,, 2.2.7676))
Elective repeat cesarean delivery
Eriksen, 1989
Flamm, 1994
68
2207
5.4
3.54
2
1.1
92,5.5.4400 ((4.4.92, 5.5.8888))
3.3.5544 ((33..4499,, 3.3.5959))
Hibbard, 2001 431 5.04 3.09 5.5.0044 ((44..7755,, 5.5.3333))
Loebel, 2004
Gregory, 2008
481
20834
3.14
3.02
0.91
0.78
3.3.1144 ((33..0066,, 3.3.2222))
3.3.0022 ((33..0011,, 3.3.0303))
Combined (I-squared = 99.5%, p = 0.000) 3.3.9922 ((33..5566,, 4.4.2929))
0 1 2 3 4 5 6
Mean length of stay (95% Confidence interval)
Pelvic Floor One study evaluated the effect of VBAC on perineal trauma in deliveries over 36 weeks GA.
After controlling for age, parity, and episiotomy, those women who had a VBAC as their second delivery had an odds ratio of 5.46 (95 percent CI: 3.69 to 8.08) of severe perineal trauma compared with women with a previous vaginal delivery. In contrast, the odds ratio for a primiparous woman was 4.08 (95 percent CI: 3.16 to 5.28).246 A second study noted a 34 percent prevalence of third or fourth degree perineal laceration following episiotomy in women undergoing VBAC; however no comparisons were made to RCD after a TOL.137 No studies evaluated risk of urinary or fecal incontinence following ERCD versus TOL.
Deep Vein Thrombosis Three studies evaluated thromboembolic disease between ERCD and TOL.192, 203, 221 A
multicenter study evaluating maternal risk and thromboembolic disease found the lowest rate of embolic disease with TOL after one prior cesarean delivery compared with subjects undergoing either ERCD or VBAC after multiple cesarean deliveries (0.04 percent versus 0.1 and 0.1 percent).221
89
Special Considerations Effect of hospital setting. In total, eight studies reported outcomes in both community and
academic centers.10, 61, 77, 93, 97, 98, 108, 205 Three of these studies reported on the same cohort of patients.61, 98, 205 Of these eight studies, only one specifically described the community data separately.108 As described previously, this study evaluated maternal risk with ERCD, TOL, VBAC, and RCD using the Canadian birth registry. This evaluation focused specifically on the risks of each mode of delivery in low volume (less than 500 deliveries per year) and high volume (greater than 500 deliveries per year) medical centers. This study demonstrated an increased odds of short-term complications in low volume maternity wards. Specifically, the odds ratio of a particular outcome associated with TOL when compared with ERCD were higher for death (odds ratio 2.68; 95 percent CI: 0.16 to 45.5 versus odds ratio 0.16; 95 percent CI: 0.02 to 1.29) and uterine rupture (odds ratio 4.02; 95 percent CI: 2.48 to 6.51 versus odds ratio 2.30; 95 percent CI: 2.04 to 2.59) in low volume maternity wards.108
Abnormal placentation. Prior cesarean delivery is a risk factor for abnormal placentation in future pregnancies. As the number of cesarean deliveries continues to rise, the incidence of abnormal placentation, which includes placenta previa, accreta, increta, and percreta, is anticipated to increase as well. Abnormal placentation has been associated with both maternal and neonatal morbidity including need for antepartum hospitalization, preterm delivery, emergent cesarean delivery, hysterectomy, blood transfusion, surgical injury, intensive care unit (ICU) stay, and fetal and maternal death. In order to effectively counsel women about their risk of complications due to the placenta in future pregnancies, it is essential to have a clear understanding of the incidence of these potentially life-threatening complications in women with prior cesarean delivery.
Incidence of abnormal placentation following cesarean section. Eighty-two full text articles were reviewed to evaluate the evidence regarding the incidence and outcomes of pregnancies complicated by abnormal placentation, including abruption, placenta previa, and placenta accreta, following prior cesarean delivery. Nineteen articles met inclusion criteria and consisted of eight good or fair quality cohort studies,11, 220, 236, 247-251 seven fair quality case-control studies,176, 235, 252-256 and four good or fair quality case series.257-260 Individual studies provided evidence for one or more of the separate topics of abruption, previa, and accreta, respectively. The studies that made up the body of evidence for each subset of abnormal placentation are listed below.
Abruption. Six fair quality studies, five cohort studies11, 247, 249-251 and one case-control study235 examined abruption following a prior cesarean delivery. Studies were inconsistent in their definition for placental abruption with three studies relying on ICD-9 coding11, 247, 250 and no definition offered by the other three.235, 249, 251
The overall incidence of placental abruption with any prior cesarean delivery was 1.2 to 1.5 percent.250, 251 For women with one prior cesarean delivery, the odds ratio for abruption was 1.0 to 1.3 and only one of four studies reached statistical significance. The majority of studies did not find an increased incidence of abruption in women with increasing numbers of prior cesarean delivery (Table 14).
90
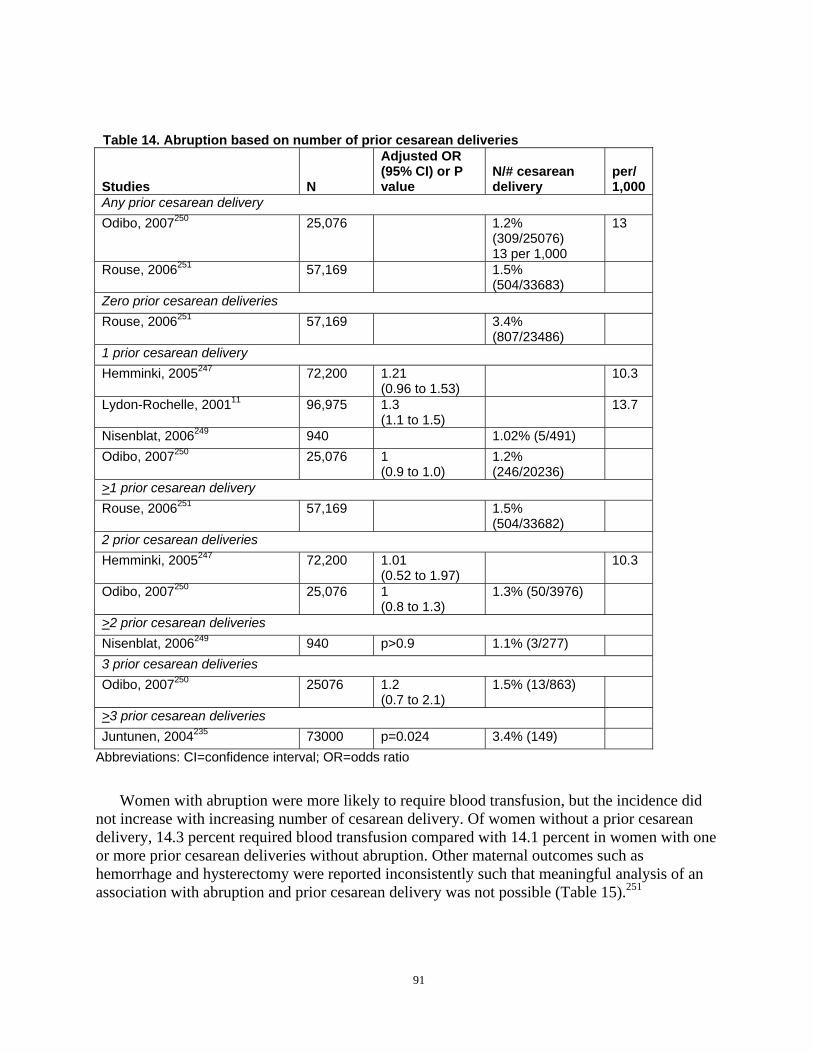
Table 14. Abruption based on number of prior cesarean deliveries
Studies N
Adjusted OR (95% CI) or P value
N/# cesarean delivery
per/ 1,000
Any prior cesarean delivery Odibo, 2007250 25,076 1.2%
(309/25076) 13 per 1,000
13
Rouse, 2006251 57,169 1.5% (504/33683)
Zero prior cesarean deliveries Rouse, 2006251 57,169 3.4%
(807/23486) 1 prior cesarean delivery Hemminki, 2005247 72,200 1.21
(0.96 to 1.53) 10.3
Lydon-Rochelle, 200111 96,975 1.3 (1.1 to 1.5)
13.7
Nisenblat, 2006249 940 1.02% (5/491) Odibo, 2007250 25,076 1
(0.9 to 1.0) 1.2% (246/20236)
>1 prior cesarean delivery Rouse, 2006251 57,169 1.5%
(504/33682) 2 prior cesarean deliveries Hemminki, 2005247 72,200 1.01
(0.52 to 1.97) 10.3
Odibo, 2007250 25,076 1 (0.8 to 1.3)
1.3% (50/3976)
>2 prior cesarean deliveries Nisenblat, 2006249 940 p>0.9 1.1% (3/277) 3 prior cesarean deliveries Odibo, 2007250 25076 1.2
(0.7 to 2.1) 1.5% (13/863)
>3 prior cesarean deliveries Juntunen, 2004235 73000 p=0.024 3.4% (149)
Abbreviations: CI=confidence interval; OR=odds ratio
Women with abruption were more likely to require blood transfusion, but the incidence did not increase with increasing number of cesarean delivery. Of women without a prior cesarean delivery, 14.3 percent required blood transfusion compared with 14.1 percent in women with one or more prior cesarean deliveries without abruption. Other maternal outcomes such as hemorrhage and hysterectomy were reported inconsistently such that meaningful analysis of an association with abruption and prior cesarean delivery was not possible (Table 15).251
91
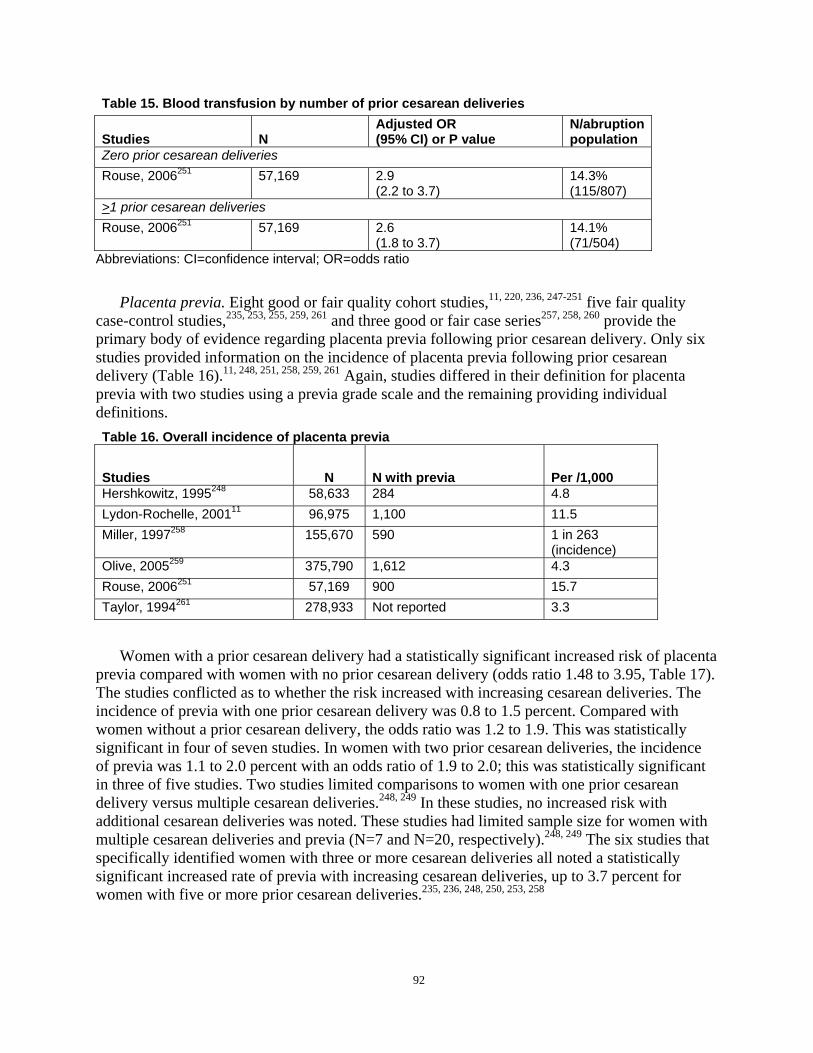
Table 15. Blood transfusion by number of prior cesarean deliveries
Studies N Adjusted OR (95% CI) or P value
N/abruption population
Zero prior cesarean deliveries Rouse, 2006251 57,169 2.9
(2.2 to 3.7) 14.3% (115/807)
>1 prior cesarean deliveries Rouse, 2006251 57,169 2.6
(1.8 to 3.7) 14.1% (71/504)
Abbreviations: CI=confidence interval; OR=odds ratio
Placenta previa. Eight good or fair quality cohort studies,11, 220, 236, 247-251 five fair quality case-control studies,235, 253, 255, 259, 261 and three good or fair case series257, 258, 260 provide the primary body of evidence regarding placenta previa following prior cesarean delivery. Only six studies provided information on the incidence of placenta previa following prior cesarean delivery (Table 16).11, 248, 251, 258, 259, 261 Again, studies differed in their definition for placenta previa with two studies using a previa grade scale and the remaining providing individual definitions. Table 16. Overall incidence of placenta previa
Studies N N with previa Per /1,000 Hershkowitz, 1995248 58,633 284 4.8 Lydon-Rochelle, 200111 96,975 1,100 11.5 Miller, 1997258 155,670 590 1 in 263
(incidence) Olive, 2005259 375,790 1,612 4.3 Rouse, 2006251 57,169 900 15.7 Taylor, 1994261 278,933 Not reported 3.3
Women with a prior cesarean delivery had a statistically significant increased risk of placenta previa compared with women with no prior cesarean delivery (odds ratio 1.48 to 3.95, Table 17). The studies conflicted as to whether the risk increased with increasing cesarean deliveries. The incidence of previa with one prior cesarean delivery was 0.8 to 1.5 percent. Compared with women without a prior cesarean delivery, the odds ratio was 1.2 to 1.9. This was statistically significant in four of seven studies. In women with two prior cesarean deliveries, the incidence of previa was 1.1 to 2.0 percent with an odds ratio of 1.9 to 2.0; this was statistically significant in three of five studies. Two studies limited comparisons to women with one prior cesarean delivery versus multiple cesarean deliveries.248, 249 In these studies, no increased risk with additional cesarean deliveries was noted. These studies had limited sample size for women with multiple cesarean deliveries and previa (N=7 and N=20, respectively).248, 249 The six studies that specifically identified women with three or more cesarean deliveries all noted a statistically significant increased rate of previa with increasing cesarean deliveries, up to 3.7 percent for women with five or more prior cesarean deliveries.235, 236, 248, 250, 253, 258
92
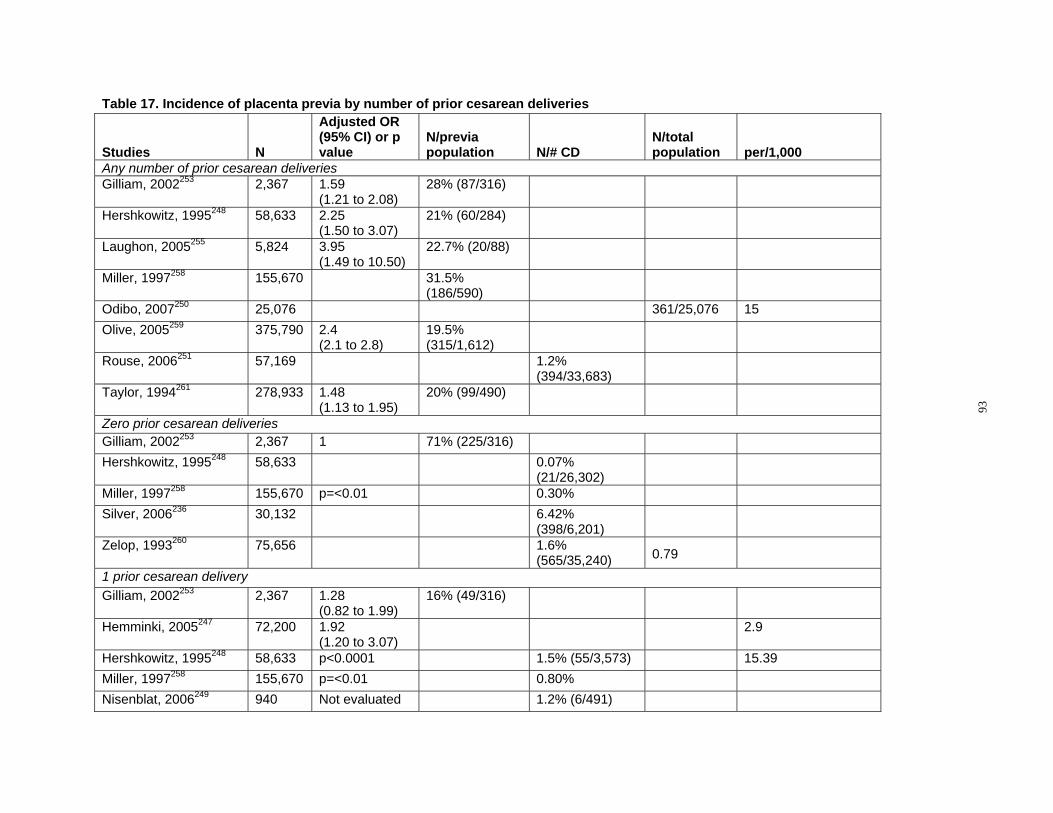
Table 17. Incidence of placenta previa by number of prior cesarean deliveries
Studies N
Adjusted OR (95% CI) or p value
N/previa population N/# CD
N/total population per/1,000
Any number of prior cesarean deliveries Gilliam, 2002253 2,367 1.59
(1.21 to 2.08) 28% (87/316)
Hershkowitz, 1995248 58,633 2.25 (1.50 to 3.07)
21% (60/284)
Laughon, 2005255 5,824 3.95 (1.49 to 10.50)
22.7% (20/88)
Miller, 1997258 155,670 31.5% (186/590)
Odibo, 2007250 25,076 361/25,076 15 Olive, 2005259 375,790 2.4 19.5%
(2.1 to 2.8) (315/1,612) Rouse, 2006251 57,169 1.2%
(394/33,683) Taylor, 1994261 278,933 1.48
(1.13 to 1.95) 20% (99/490)
Zero prior cesarean deliveries Gilliam, 2002253 2,367 1 71% (225/316) Hershkowitz, 1995248 58,633 0.07%
0.79
(21/26,302)Miller, 1997258 155,670 p=<0.01 0.30% Silver, 2006236 30,132 6.42%
(398/6,201) Zelop, 1993260 75,656 1.6%
(565/35,240) 1 prior cesarean delivery Gilliam, 2002253 2,367 1.28
(0.82 to 1.99) 16% (49/316)
Hemminki, 2005247 72,200 1.92 2.9 (1.20 to 3.07)
Hershkowitz, 1995248 58,633 p<0.0001 1.5% (55/3,573) 15.39 Miller, 1997258 155,670 p=<0.01 0.80% Nisenblat, 2006249 940 Not evaluated 1.2% (6/491)
93
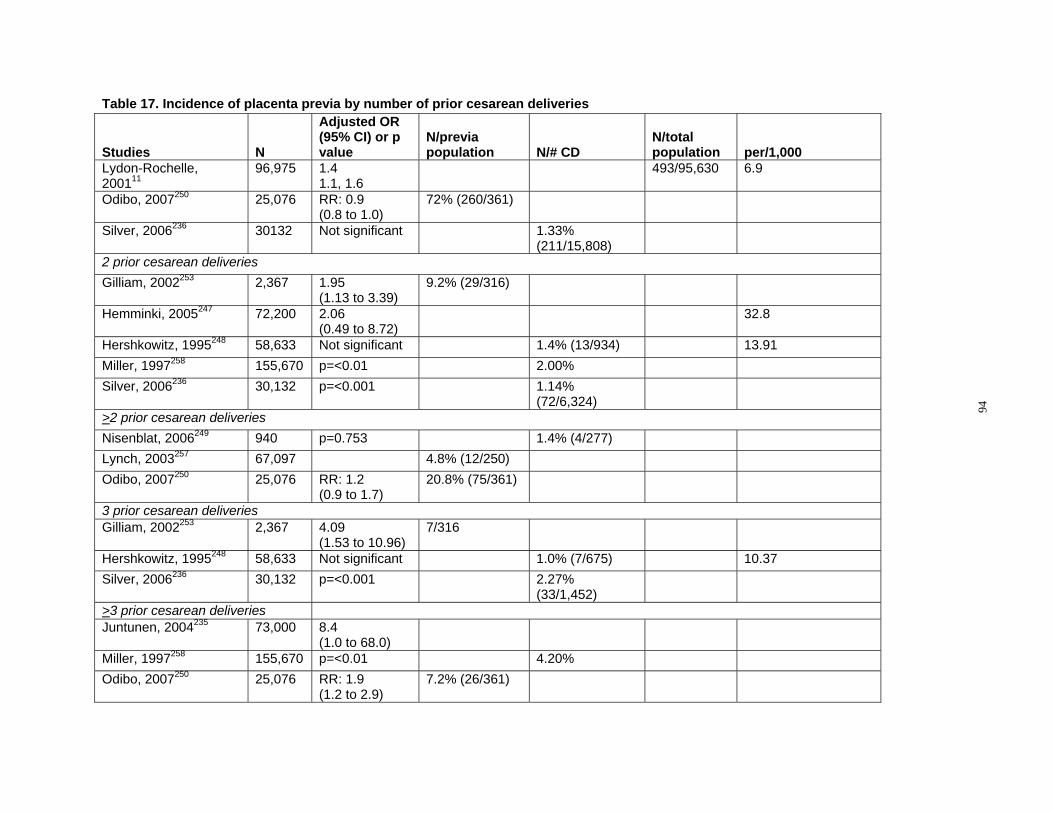
Table 17. Incidence of placenta previa by number of prior cesarean deliveries
Studies N
Adjusted OR (95% CI) or p value
N/previa population N/# CD
Lydon-Rochelle, 200111
96,975 1.4 1.1, 1.6
Odibo, 2007250 25,076 RR: 0.9 (0.8 to 1.0)
72% (260/361)
Silver, 2006236 30132 Not significant 1.33% (211/15,808)
2 prior cesarean deliveries Gilliam, 2002253 2,367 1.95
(1.13 to 3.39) 9.2% (29/316)
Hemminki, 2005247 72,200 2.06 (0.49 to 8.72)
Hershkowitz, 1995248 58,633 Not significant 1.4% (13/934) Miller, 1997258 155,670 p=<0.01 2.00% Silver, 2006236 30,132 p=<0.001 1.14%
(72/6,324) >2 prior cesarean deliveries Nisenblat, 2006249 940 p=0.753 1.4% (4/277) Lynch, 2003257 67,097 4.8% (12/250) Odibo, 2007250 25,076 RR: 1.2
(0.9 to 1.7) 20.8% (75/361)
3 prior cesarean deliveries Gilliam, 2002253 2,367 4.09
(1.53 to 10.96) 7/316
Hershkowitz, 1995248 58,633 Not significant 1.0% (7/675) Silver, 2006236 30,132 p=<0.001 2.27%
(33/1,452) >3 prior cesarean deliveries Juntunen, 2004235 73,000 8.4
(1.0 to 68.0) Miller, 1997258 155,670 p=<0.01 4.20% Odibo, 2007250 25,076 RR: 1.9
(1.2 to 2.9) 7.2% (26/361)
N/total population 493/95,630
per/1,000 6.9
32.8
13.91
10.37
94
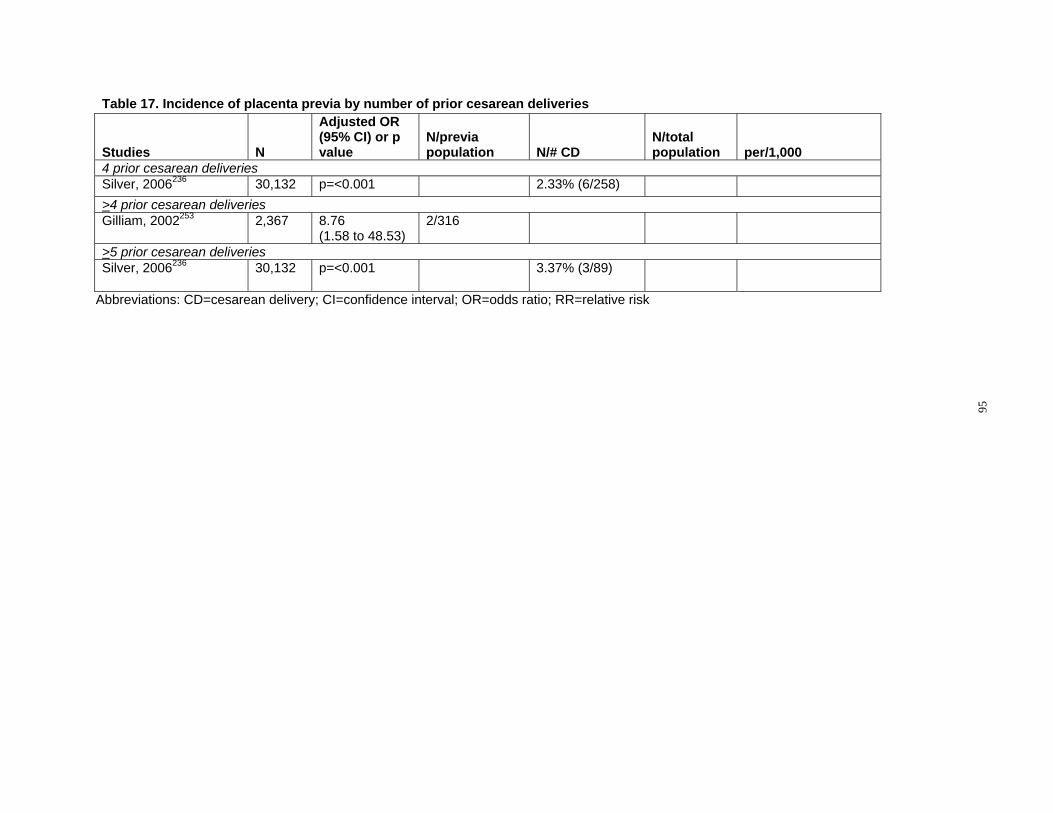
Table 17. Incidence of placenta previa by number of prior cesarean deliveries
Studies N
Adjusted OR (95% CI) or p value
N/previa population N/# CD
N/total population per/1,000
4 prior cesarean deliveries Silver, 2006236 30,132 p=<0.001 2.33% (6/258) >4 prior cesarean deliveries Gilliam, 2002253 2,367 8.76
(1.58 to 48.53) 2/316
>5 prior cesarean deliveries Silver, 2006236 30,132 p=<0.001 3.37% (3/89)
Abbreviations: CD=cesarean delivery; CI=confidence interval; OR=odds ratio; RR=relative risk
95
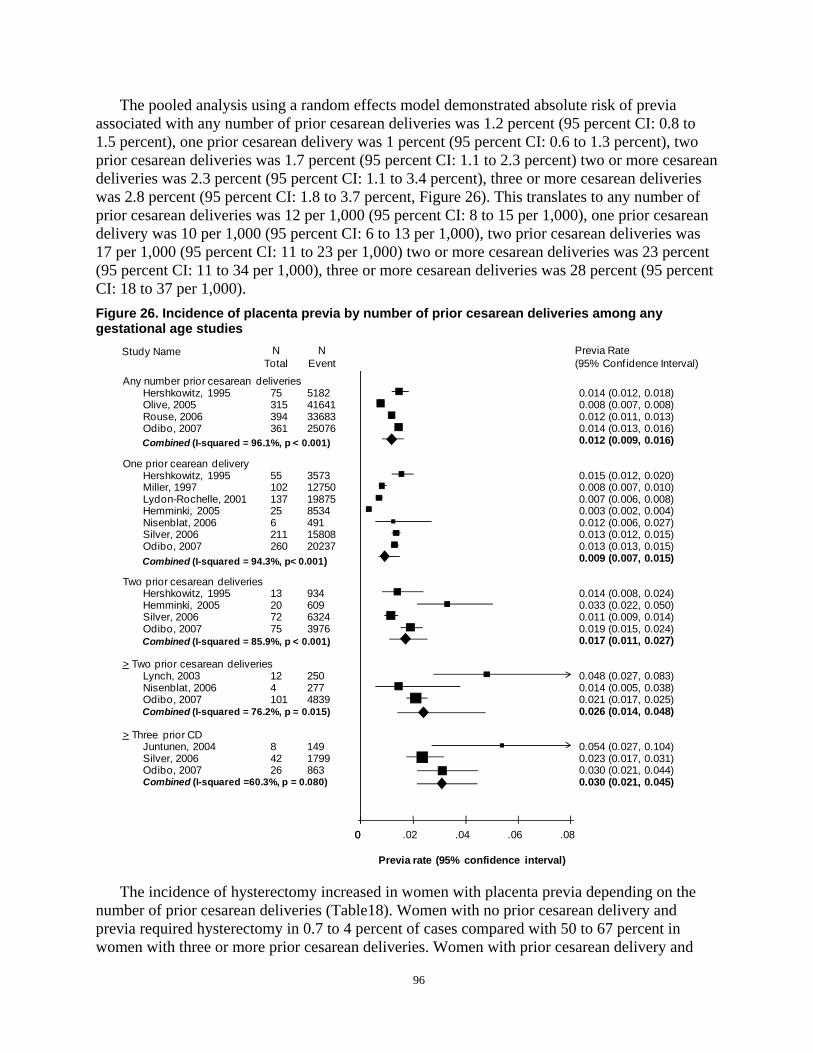
The pooled analysis using a random effects model demonstrated absolute risk of previa associated with any number of prior cesarean deliveries was 1.2 percent (95 percent CI: 0.8 to 1.5 percent), one prior cesarean delivery was 1 percent (95 percent CI: 0.6 to 1.3 percent), two prior cesarean deliveries was 1.7 percent (95 percent CI: 1.1 to 2.3 percent) two or more cesarean deliveries was 2.3 percent (95 percent CI: 1.1 to 3.4 percent), three or more cesarean deliveries was 2.8 percent (95 percent CI: 1.8 to 3.7 percent, Figure 26). This translates to any number of prior cesarean deliveries was 12 per 1,000 (95 percent CI: 8 to 15 per 1,000), one prior cesarean delivery was 10 per 1,000 (95 percent CI: 6 to 13 per 1,000), two prior cesarean deliveries was 17 per 1,000 (95 percent CI: 11 to 23 per 1,000) two or more cesarean deliveries was 23 percent (95 percent CI: 11 to 34 per 1,000), three or more cesarean deliveries was 28 percent (95 percent CI: 18 to 37 per 1,000). Figure 26. Incidence of placenta previa by number of prior cesarean deliveries among any gestational age studies
Study Name N N Previa Rate Total Event (95% Conf idence Interval)
Any number prior cesarean deliveries Hershkowitz, 1995 75 5182 0.014 (0.012, 0.018) Olive, 2005 315 41641 0.008 (0.007, 0.008) Rouse, 2006 394 33683 0.012 (0.011, 0.013) Odibo, 2007 361 25076 0.014 (0.013, 0.016)
0.012 (0.009, 0.016)Combined (I-squared = 96.1%, p < 0.001)
One prior cearean delivery Hershkowitz, 1995 55 3573 0.015 (0.012, 0.020) Miller, 1997 102 12750 0.008 (0.007, 0.010) Lydon-Rochelle, 2001 137 19875 0.007 (0.006, 0.008) Hemminki, 2005 25 8534 0.003 (0.002, 0.004) Nisenblat, 2006 6 491 0.012 (0.006, 0.027) Silver, 2006 211 15808 0.013 (0.012, 0.015) Odibo, 2007 260 20237 0.013 (0.013, 0.015)
0.009 (0.007, 0.015)Combined (I-squared = 94.3%, p< 0.001)
Two prior cesarean deliveries Hershkowitz, 1995 13 934 0.014 (0.008, 0.024) Hemminki, 2005 20 609 0.033 (0.022, 0.050) Silver, 2006 72 6324 0.011 (0.009, 0.014) Odibo, 2007 75 3976 0.019 (0.015, 0.024)
0.017 (0.011, 0.027)Combined (I-squared = 85.9%, p < 0.001)
> Two prior cesarean deliveries Lynch, 2003 12 250 0.048 (0.027, 0.083) Nisenblat, 2006 4 277 0.014 (0.005, 0.038) Odibo, 2007 101 4839 0.021 (0.017, 0.025)
0.026 (0.014, 0.048)Combined (I-squared = 76.2%, p = 0.015)
> Three prior CD Juntunen, 2004 8 149 0.054 (0.027, 0.104) Silver, 2006 42 1799 0.023 (0.017, 0.031) Odibo, 2007 26 863 0.030 (0.021, 0.044) Combined (I-squared =60.3%, p = 0.080) 0.030 (0.021, 0.045)
00 .02 .04 .06 .08
Previa rate (95% confidence interval)
The incidence of hysterectomy increased in women with placenta previa depending on the number of prior cesarean deliveries (Table18). Women with no prior cesarean delivery and previa required hysterectomy in 0.7 to 4 percent of cases compared with 50 to 67 percent in women with three or more prior cesarean deliveries. Women with prior cesarean delivery and
96

previa were more likely to require a blood transfusion (odds ratio 15.9; 95 percent CI: 12.0 to 21.0). Two authors also reported composite major maternal morbidity in women with prior cesarean delivery and previa. One study evaluated severe postpartum hemorrhage, acute renal failure, ICU admission, mechanical ventilation, shock, disseminated intravascular coagulopathy, hysterectomy, other procedures to stop bleeding, and/or death.259 Thirty percent of women with prior cesarean delivery and previa experienced major maternal morbidity (odds ratio 3.1; 95 percent CI: 2.0 to 4.7). A second study combined transfusion, hysterectomy, operative injury, coagulopathy, venous thromboembolism, pulmonary edema, and/or death.220 There was a statistically significant increase in composite major maternal morbidity with increasing number of cesarean delivery from 15 percent with no prior cesarean delivery to 83 percent with three or more prior cesarean deliveries (odds ratio 33.6; 95 percent CI: 14.6 to 77.4). Table 18. Incidence of hysterectomy in women with previa by number of prior cesarean deliveries
Studies N N/# cesarean deliveries
Zero prior cesarean deliveries Grobman, 2007*220 70,442 4% (488) Zelop, 1993260 75,656 0.7% (4/565) 1 prior cesarean delivery Grobman, 2007*220 70,442 10% (252) 2 prior cesarean deliveries Grobman, 2007*220 70,442 45% (76) >3 prior cesarean deliveries Grobman, 2007*220 70,442 67% (52) Juntunen, 2004235 73,000 50% (4/8) >4 prior cesarean deliveries Lynch, 2003257 67,097 50% (2/4)
*Transfusion, hysterectomy, operative injury, coagulopathy, venous thromboembolism, pulmonary edema, or death
Placenta accreta. Three good or fair quality cohort studies236, 249, 258, one fair quality case-control study,256 and one fair quality case series study260 examined placenta accreta and prior cesarean delivery and the relationship between placenta previa and accreta (Table 19). Two fair quality studies evaluated placenta accreta and hysterectomy.252, 254 Studies varied widely on the definition of placenta accreta, with one study limited analysis to cases with histopathologically confirmed accreta,258 two used histopathologic diagnosis or clinical findings of adherent placenta or difficult manual removal,236, 256 one used ICD-9 codes,252 and two did not describe diagnostic criteria.249, 254
Table 19. Overall incidence of placenta accreta
Studies N Adjusted OR (95% CI) or P value
N/previa population
N/total population Incidence
Miller, 1997258 155,670 62/155,670 1 in 2,510 Silver, 2006236 30,132 1.75
(1.533 to 1.997) Wu, 2005256 64,359 111/64,359 1 in 533 Zelop 1993260 75,656 75/75,656
Abbreviations: CI=confidence interval; OR=odds ratio
97
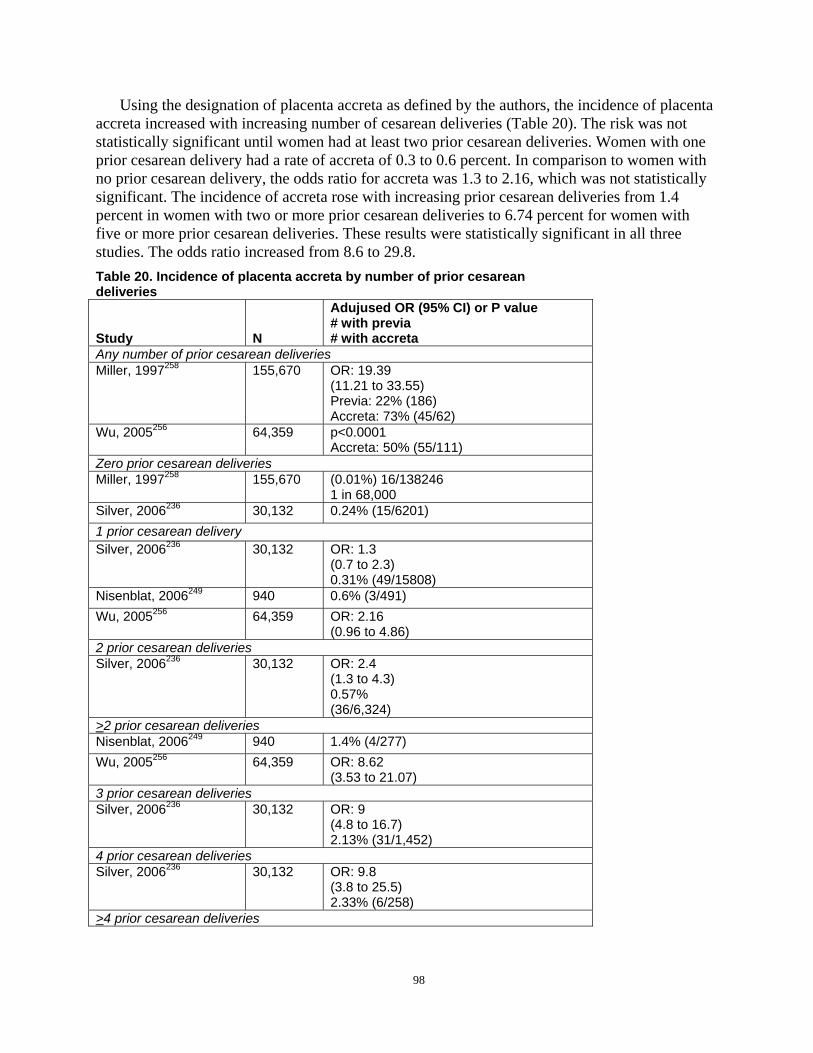
Using the designation of placenta accreta as defined by the authors, the incidence of placenta accreta increased with increasing number of cesarean deliveries (Table 20). The risk was not statistically significant until women had at least two prior cesarean deliveries. Women with one prior cesarean delivery had a rate of accreta of 0.3 to 0.6 percent. In comparison to women with no prior cesarean delivery, the odds ratio for accreta was 1.3 to 2.16, which was not statistically significant. The incidence of accreta rose with increasing prior cesarean deliveries from 1.4 percent in women with two or more prior cesarean deliveries to 6.74 percent for women with five or more prior cesarean deliveries. These results were statistically significant in all three studies. The odds ratio increased from 8.6 to 29.8. Table 20. Incidence of placenta accreta by number of prior cesarean deliveries
Study N
Adujused OR (95% CI) or P value # with previa # with accreta
Any number of prior cesarean deliveries Miller, 1997258 155,670 OR: 19.39
(11.21 to 33.55) Previa: 22% (186) Accreta: 73% (45/62)
Wu, 2005256 64,359 p<0.0001 Accreta: 50% (55/111)
Zero prior cesarean deliveries Miller, 1997258 155,670 (0.01%) 16/138246
1 in 68,000 Silver, 2006236 30,132 0.24% (15/6201) 1 prior cesarean delivery Silver, 2006236 30,132 OR: 1.3
(0.7 to 2.3) 0.31% (49/15808)
Nisenblat, 2006249 940 0.6% (3/491) Wu, 2005256 64,359 OR: 2.16
(0.96 to 4.86) 2 prior cesarean deliveries Silver, 2006236 30,132 OR: 2.4
(1.3 to 4.3) 0.57% (36/6,324)
>2 prior cesarean deliveries Nisenblat, 2006249 940 1.4% (4/277) Wu, 2005256 64,359 OR: 8.62
(3.53 to 21.07) 3 prior cesarean deliveries Silver, 2006236 30,132 OR: 9
(4.8 to 16.7) 2.13% (31/1,452)
4 prior cesarean deliveries Silver, 2006236 30,132 OR: 9.8
(3.8 to 25.5) 2.33% (6/258)
>4 prior cesarean deliveries
98
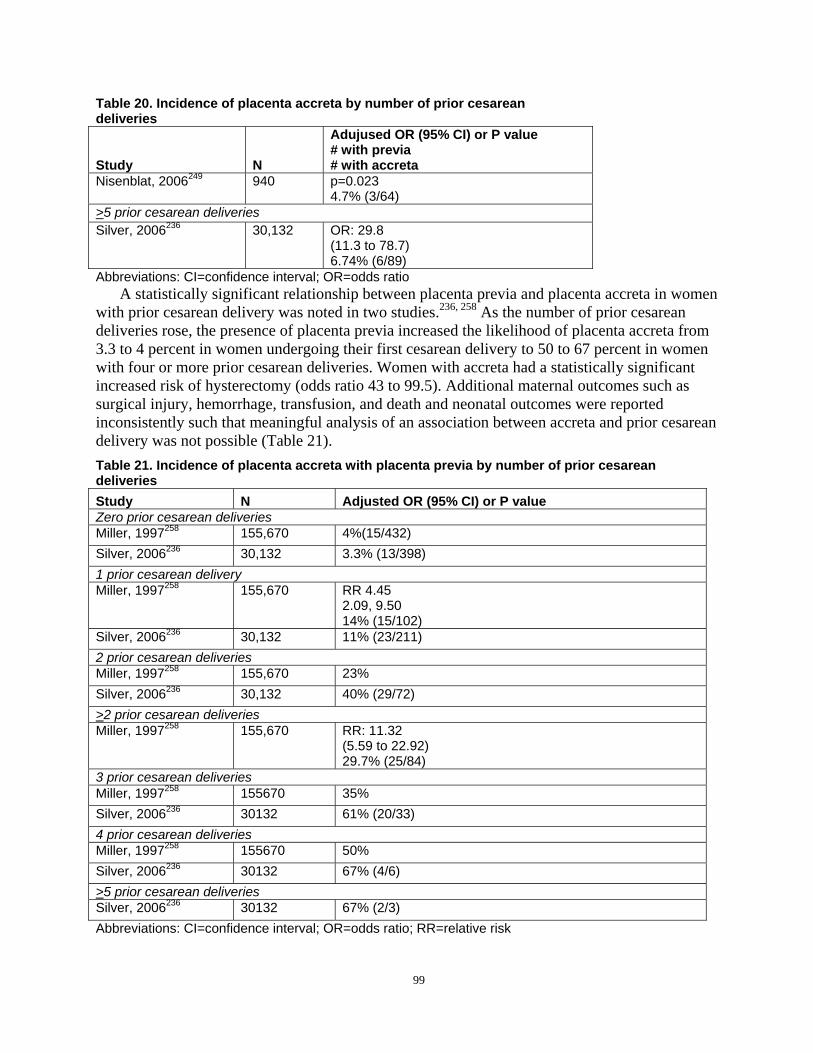
Table 20. Incidence of placenta accreta by number of prior cesarean deliveries
Study N
Adujused OR (95% CI) or P value # with previa # with accreta
Nisenblat, 2006249 940 p=0.023 4.7% (3/64)
>5 prior cesarean deliveries Silver, 2006236 30,132 OR: 29.8
(11.3 to 78.7) 6.74% (6/89)
Abbreviations: CI=confidence interval; OR=odds ratio A statistically significant relationship between placenta previa and placenta accreta in women
with prior cesarean delivery was noted in two studies.236, 258 As the number of prior cesarean deliveries rose, the presence of placenta previa increased the likelihood of placenta accreta from 3.3 to 4 percent in women undergoing their first cesarean delivery to 50 to 67 percent in women with four or more prior cesarean deliveries. Women with accreta had a statistically significant increased risk of hysterectomy (odds ratio 43 to 99.5). Additional maternal outcomes such as surgical injury, hemorrhage, transfusion, and death and neonatal outcomes were reported inconsistently such that meaningful analysis of an association between accreta and prior cesarean delivery was not possible (Table 21). Table 21. Incidence of placenta accreta with placenta previa by number of prior cesarean deliveries Study N Adjusted OR (95% CI) or P value Zero prior cesarean deliveries Miller, 1997258 155,670 4%(15/432) Silver, 2006236 30,132 3.3% (13/398) 1 prior cesarean delivery Miller, 1997258 155,670 RR 4.45
2.09, 9.50 14% (15/102)
Silver, 2006236 30,132 11% (23/211) 2 prior cesarean deliveries Miller, 1997258 155,670 23% Silver, 2006236 30,132 40% (29/72) >2 prior cesarean deliveries Miller, 1997258 155,670 RR: 11.32
(5.59 to 22.92) 29.7% (25/84)
3 prior cesarean deliveries Miller, 1997258 155670 35% Silver, 2006236 30132 61% (20/33) 4 prior cesarean deliveries Miller, 1997258 155670 50% Silver, 2006236 30132 67% (4/6) >5 prior cesarean deliveries Silver, 2006236 30132 67% (2/3) Abbreviations: CI=confidence interval; OR=odds ratio; RR=relative risk
99
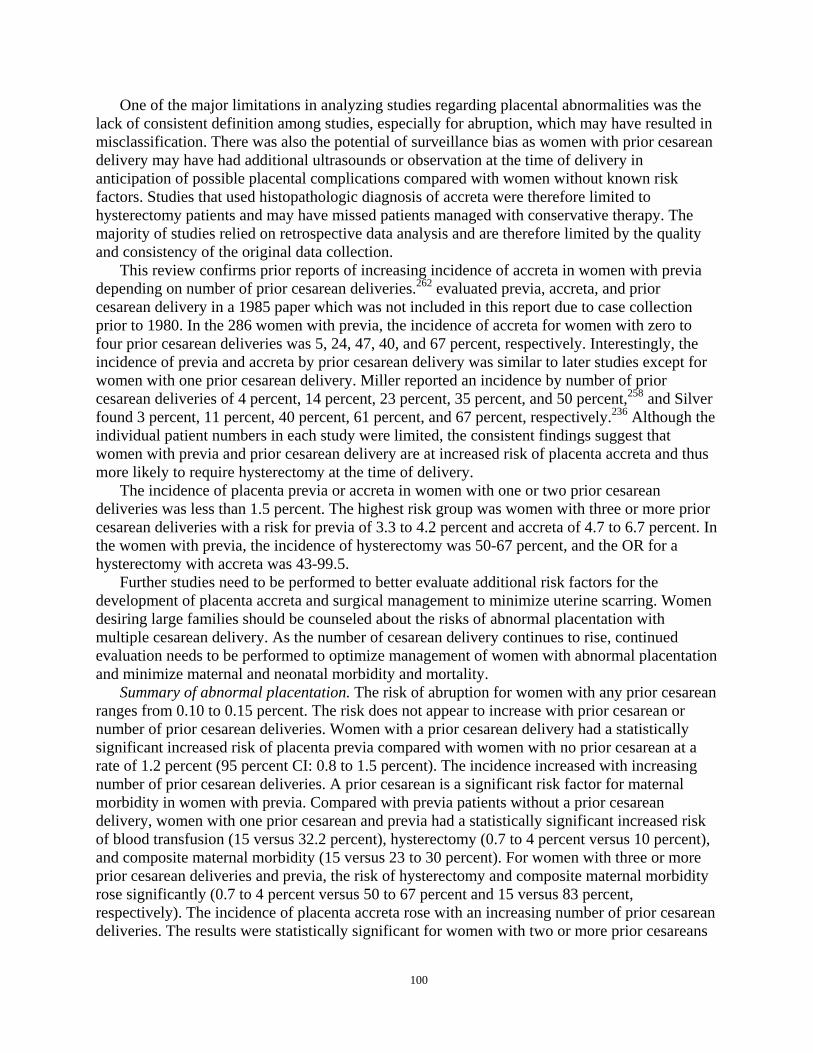
One of the major limitations in analyzing studies regarding placental abnormalities was the lack of consistent definition among studies, especially for abruption, which may have resulted in misclassification. There was also the potential of surveillance bias as women with prior cesarean delivery may have had additional ultrasounds or observation at the time of delivery in anticipation of possible placental complications compared with women without known risk factors. Studies that used histopathologic diagnosis of accreta were therefore limited to hysterectomy patients and may have missed patients managed with conservative therapy. The majority of studies relied on retrospective data analysis and are therefore limited by the quality and consistency of the original data collection.
This review confirms prior reports of increasing incidence of accreta in women with previa depending on number of prior cesarean deliveries.262 evaluated previa, accreta, and prior cesarean delivery in a 1985 paper which was not included in this report due to case collection prior to 1980. In the 286 women with previa, the incidence of accreta for women with zero to four prior cesarean deliveries was 5, 24, 47, 40, and 67 percent, respectively. Interestingly, the incidence of previa and accreta by prior cesarean delivery was similar to later studies except for women with one prior cesarean delivery. Miller reported an incidence by number of prior cesarean deliveries of 4 percent, 14 percent, 23 percent, 35 percent, and 50 percent,258 and Silver found 3 percent, 11 percent, 40 percent, 61 percent, and 67 percent, respectively.236 Although the individual patient numbers in each study were limited, the consistent findings suggest that women with previa and prior cesarean delivery are at increased risk of placenta accreta and thus more likely to require hysterectomy at the time of delivery.
The incidence of placenta previa or accreta in women with one or two prior cesarean deliveries was less than 1.5 percent. The highest risk group was women with three or more prior cesarean deliveries with a risk for previa of 3.3 to 4.2 percent and accreta of 4.7 to 6.7 percent. In the women with previa, the incidence of hysterectomy was 50-67 percent, and the OR for a hysterectomy with accreta was 43-99.5.
Further studies need to be performed to better evaluate additional risk factors for the development of placenta accreta and surgical management to minimize uterine scarring. Women desiring large families should be counseled about the risks of abnormal placentation with multiple cesarean delivery. As the number of cesarean delivery continues to rise, continued evaluation needs to be performed to optimize management of women with abnormal placentation and minimize maternal and neonatal morbidity and mortality.
Summary of abnormal placentation. The risk of abruption for women with any prior cesarean ranges from 0.10 to 0.15 percent. The risk does not appear to increase with prior cesarean or number of prior cesarean deliveries. Women with a prior cesarean delivery had a statistically significant increased risk of placenta previa compared with women with no prior cesarean at a rate of 1.2 percent (95 percent CI: 0.8 to 1.5 percent). The incidence increased with increasing number of prior cesarean deliveries. A prior cesarean is a significant risk factor for maternal morbidity in women with previa. Compared with previa patients without a prior cesarean delivery, women with one prior cesarean and previa had a statistically significant increased risk of blood transfusion (15 versus 32.2 percent), hysterectomy (0.7 to 4 percent versus 10 percent), and composite maternal morbidity (15 versus 23 to 30 percent). For women with three or more prior cesarean deliveries and previa, the risk of hysterectomy and composite maternal morbidity rose significantly (0.7 to 4 percent versus 50 to 67 percent and 15 versus 83 percent, respectively). The incidence of placenta accreta rose with an increasing number of prior cesarean deliveries. The results were statistically significant for women with two or more prior cesareans
100

(odds ratio 8.6 to 29.8). Women with placenta previa are at increased risk for placenta accreta, and the risk increased with the increasing number of prior cesareans. Women with more than three prior cesareans and previa had a 50 to 67 percent incidence of accreta.
Maternal complications associated with multiple cesarean deliveries. As the number of women who attempt TOL decreases, the obvious consequence is an increase in the number of RCD. Conventional wisdom has suggested questioning women with a prior cesarean delivery about their plans for future childbearing as part of the discussion regarding mode of delivery due to the increased risk of multiple cesarean deliveries, but the actual risks remains unclear. Maternal morbidity resulting from multiple cesarean deliveries may consist of adhesions, hemorrhage/transfusion, surgical injury, postoperative infection, hysterectomy, abnormal placentation, and death.
The evidence regarding the outcome of multiple cesarean deliveries is limited and consists of 11 good or fair quality studies.81, 220, 235, 236, 249, 251, 252, 254, 257, 260, 263
Hemorrhage. Three fair quality cohort studies evaluated the impact of multiple cesarean deliveries on maternal hemorrhage and/or blood transfusion rates (Table 22).249, 251, 263
Definitions of hemorrhage varied. Rouse et al used MFMU data to identify women who received a transfusion of packed red blood cells prior to hospital discharge.251 Among women undergoing primary cesarean delivery, 3.2 percent (762/23486) received a blood transfusion. Of women with a prior cesarean delivery, the percentage of women with blood transfusions increased with increasing number of prior cesarean delivery from 1.8, 2.6, 4.3, 4.6, and 14.6 percent from one prior to five or more cesarean deliveries, respectively. The odds ratio for women with five or more cesarean deliveries was 7.6 (95 percent CI: 4.0 to 14.3). Nisenblat et al compared outcomes for women at a single institution in Israel undergoing a second versus three or more cesarean deliveries.249 Women were identified who experienced “excessive blood loss” of greater than 1000 mL or were transfused two or more units. Among women having their second cesarean delivery, 3.3 percent (16/491) met this definition compared with 7.9 percent (22/277) of those with two or more prior cesarean delivery (odds ratio 2.3; 95 percent CI: 1.1 to 4.5). Macones et al performed a secondary analysis of a multicenter, retrospective cohort study and examined incidence of blood transfusion.263 In women with two prior cesarean deliveries who did not attempt a TOL, 1.18 percent of 2,888 women received a transfusion (odds ratio 0.54; 95 percent CI: 0.23 to 1.27). These studies suggest that overall rates of hemorrhage/transfusion are less than 5 percent but the risk appears to increase with increasing numbers of cesarean delivery. Table 22. Multiple cesarean deliveries effect on rates of hemorrhage
Studies Adjusted odds ratio 95% CI or P value N
Zero prior cesarean deliveries Rouse, 2006251 3.2% (762/23486) 1 prior cesarean delivery Rouse, 2006251 1.8% (427/23579) Nisenblat 2006249 3.3% (16/491) 2 prior cesarean deliveries Rouse, 2006251 2.6% (202/7902) Macones 2005263 0.54
(0.23 to 1.27) 1.18% (2888) ERCD versus VBAC
>2 prior cesarean deliveries Nisenblat 2006249 2.3
(1.1 to 4.5) 7.9% (22/277)
101
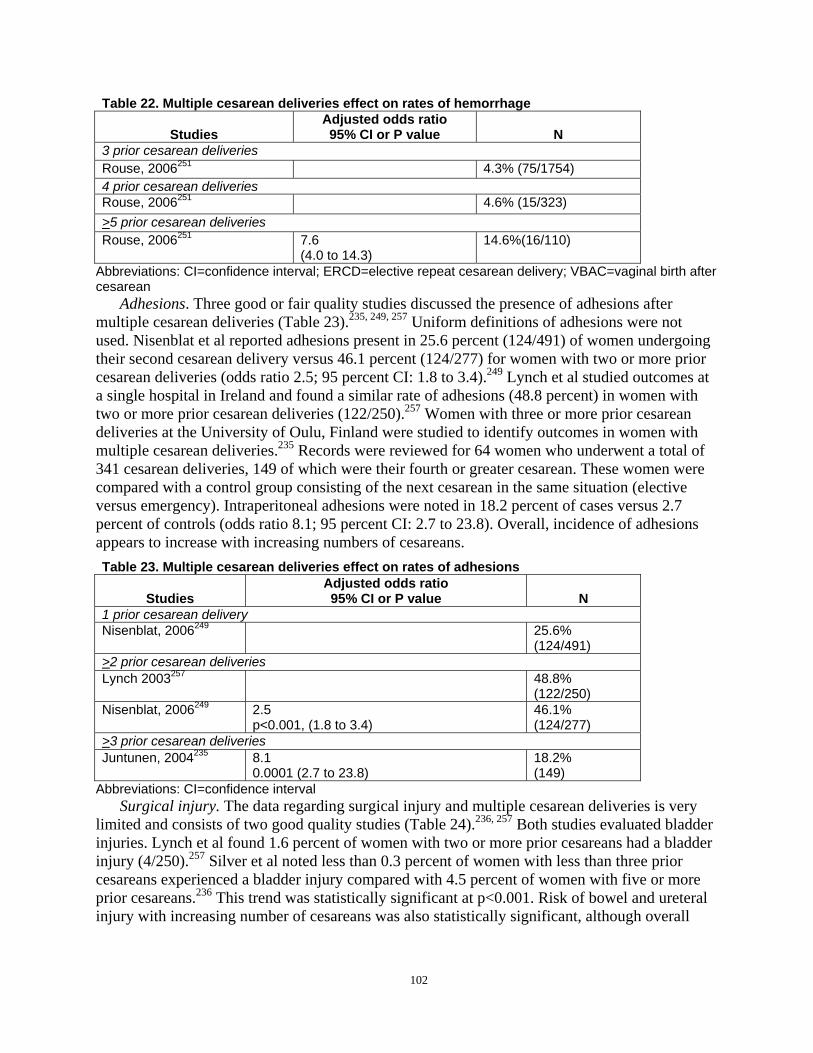
Table 22. Multiple cesarean deliveries effect on rates of hemorrhage
Studies Adjusted odds ratio 95% CI or P value N
3 prior cesarean deliveries Rouse, 2006251 4.3% (75/1754) 4 prior cesarean deliveries Rouse, 2006251 4.6% (15/323) >5 prior cesarean deliveries Rouse, 2006251 7.6
(4.0 to 14.3) 14.6%(16/110)
Abbreviations: CI=confidence interval; ERCD=elective repeat cesarean delivery; VBAC=vaginal birth after cesarean
Adhesions. Three good or fair quality studies discussed the presence of adhesions after multiple cesarean deliveries (Table 23).235, 249, 257 Uniform definitions of adhesions were not used. Nisenblat et al reported adhesions present in 25.6 percent (124/491) of women undergoing their second cesarean delivery versus 46.1 percent (124/277) for women with two or more prior cesarean deliveries (odds ratio 2.5; 95 percent CI: 1.8 to 3.4).249 Lynch et al studied outcomes at a single hospital in Ireland and found a similar rate of adhesions (48.8 percent) in women with two or more prior cesarean deliveries (122/250).257 Women with three or more prior cesarean deliveries at the University of Oulu, Finland were studied to identify outcomes in women with multiple cesarean deliveries.235 Records were reviewed for 64 women who underwent a total of 341 cesarean deliveries, 149 of which were their fourth or greater cesarean. These women were compared with a control group consisting of the next cesarean in the same situation (elective versus emergency). Intraperitoneal adhesions were noted in 18.2 percent of cases versus 2.7 percent of controls (odds ratio 8.1; 95 percent CI: 2.7 to 23.8). Overall, incidence of adhesions appears to increase with increasing numbers of cesareans. Table 23. Multiple cesarean deliveries effect on rates of adhesions
Studies Adjusted odds ratio 95% CI or P value N
1 prior cesarean delivery Nisenblat, 2006249 25.6%
(124/491) >2 prior cesarean deliveries Lynch 2003257 48.8%
(122/250) Nisenblat, 2006249 2.5
p<0.001, (1.8 to 3.4) 46.1% (124/277)
>3 prior cesarean deliveries Juntunen, 2004235 8.1
0.0001 (2.7 to 23.8) 18.2% (149)
Abbreviations: CI=confidence interval Surgical injury. The data regarding surgical injury and multiple cesarean deliveries is very
limited and consists of two good quality studies (Table 24).236, 257 Both studies evaluated bladder injuries. Lynch et al found 1.6 percent of women with two or more prior cesareans had a bladder injury (4/250).257 Silver et al noted less than 0.3 percent of women with less than three prior cesareans experienced a bladder injury compared with 4.5 percent of women with five or more prior cesareans.236 This trend was statistically significant at p<0.001. Risk of bowel and ureteral injury with increasing number of cesareans was also statistically significant, although overall
102
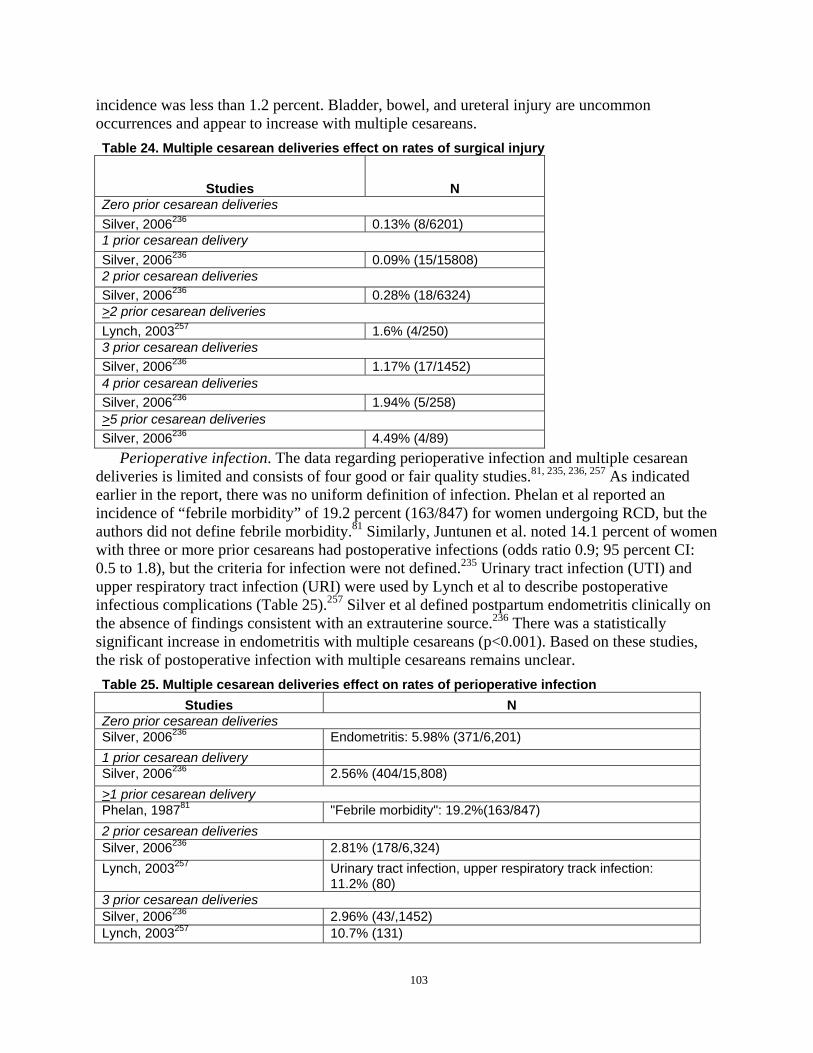
incidence was less than 1.2 percent. Bladder, bowel, and ureteral injury are uncommon occurrences and appear to increase with multiple cesareans. Table 24. Multiple cesarean deliveries effect on rates of surgical injury
Studies N Zero prior cesarean deliveries Silver, 2006236 0.13% (8/6201) 1 prior cesarean delivery Silver, 2006236 0.09% (15/15808) 2 prior cesarean deliveries Silver, 2006236 0.28% (18/6324) >2 prior cesarean deliveries Lynch, 2003257 1.6% (4/250) 3 prior cesarean deliveries Silver, 2006236 1.17% (17/1452) 4 prior cesarean deliveries Silver, 2006236 1.94% (5/258) >5 prior cesarean deliveries Silver, 2006236 4.49% (4/89)
Perioperative infection. The data regarding perioperative infection and multiple cesarean deliveries is limited and consists of four good or fair quality studies.81, 235, 236, 257 As indicated earlier in the report, there was no uniform definition of infection. Phelan et al reported an incidence of “febrile morbidity” of 19.2 percent (163/847) for women undergoing RCD, but the authors did not define febrile morbidity.81 Similarly, Juntunen et al. noted 14.1 percent of women with three or more prior cesareans had postoperative infections (odds ratio 0.9; 95 percent CI: 0.5 to 1.8), but the criteria for infection were not defined.235 Urinary tract infection (UTI) and upper respiratory tract infection (URI) were used by Lynch et al to describe postoperative infectious complications (Table 25).257 Silver et al defined postpartum endometritis clinically on the absence of findings consistent with an extrauterine source.236 There was a statistically significant increase in endometritis with multiple cesareans (p<0.001). Based on these studies, the risk of postoperative infection with multiple cesareans remains unclear. Table 25. Multiple cesarean deliveries effect on rates of perioperative infection
Studies N Zero prior cesarean deliveries Silver, 2006236 Endometritis: 5.98% (371/6,201) 1 prior cesarean delivery Silver, 2006236 2.56% (404/15,808) >1 prior cesarean delivery Phelan, 198781 "Febrile morbidity": 19.2%(163/847) 2 prior cesarean deliveries Silver, 2006236 2.81% (178/6,324) Lynch, 2003257 Urinary tract infection, upper respiratory track infection:
11.2% (80) 3 prior cesarean deliveries Silver, 2006236 2.96% (43/,1452) Lynch, 2003257 10.7% (131)
103

Table 25. Multiple cesarean deliveries effect on rates of perioperative infection Studies N
>3 prior cesarean deliveries Juntunen, 2004235 "Postoperative infections": 14.1% (149)
Adjusted odds ratio: 0.9 95% confidence interval: 0.869 (0.5, 1.8)
4 prior cesarean deliveries Silver, 2006236 1.55% (4/258) >4 prior cesarean deliveries Lynch, 2003257 23% (39) >5 prior cesarean deliveries Silver, 2006236 6.74% (6/89)
p=0.001 Wound complications. Two good quality studies report incidence of wound complications
with multiple cesarean deliveries.236, 257 Silver et al reviewed wound infection and wound dehiscence and found no statistically significant change with multiple cesareans (p=0.09 and 0.18, respectively).236 Similarly, Lynch et al. found no correlation between number of cesareans and wound problems (Table 26).257
Table 26. Multiple cesarean deliveries effect on rates of wound complications Studies N
Zero prior cesarean deliveries Silver, 2006236 Dehiscence, infection: 1.9% (118/6201) 1 prior cesarean delivery Silver, 2006236 1.05% (165/15808) 2 prior cesarean deliveries Lynch, 2003257 "Problem": 6.2% (80) Silver, 2006236 1.69% (107/6324) 3 prior cesarean deliveries Lynch, 2003257 7.6% (131) Silver, 2006236 1.52% (22/1452) 4 prior cesarean deliveries Silver, 2006236 4.23% (11/258) >4 prior cesarean deliveries Lynch, 2003257 5.1% (39) 5 prior cesarean deliveries Silver, 2006236 3.37% (3/89)
Hysterectomy. Seven good or fair quality studies evaluated the rate of hysterectomy with multiple cesarean deliveries (Table 27).81, 236, 249, 252, 254, 257, 260 Women requiring hysterectomy due to abnormal placentation were discussed previously in this report (see Abnormal Placentation section). There are three population-based, matched case-control studies with women requiring peripartum hysterectomy chosen as cases.252, 254, 260 Bodelon et al used the Washington State birth certificate registry. Women undergoing their first cesarean delivery were more likely to require hysterectomy than were women delivering vaginally (odds ratio 4.6; 95 percent CI: 3.5 to 6.0). Women with one or more prior cesarean were significantly more likely to require hysterectomy (odds ratio 7.9; 95 percent CI: 5.8 to 10.7).252 Knight et al used the United Kingdom Obstetric Surveillance System and similarly noted an increased risk for hysterectomy
104
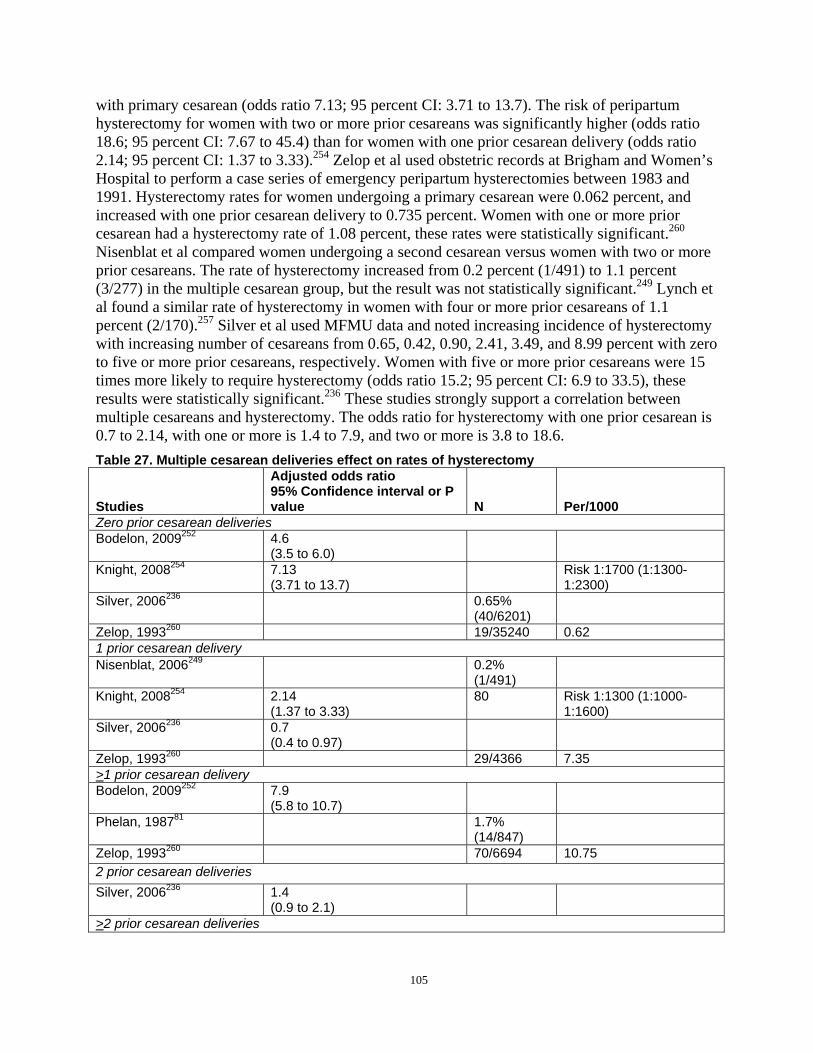
with primary cesarean (odds ratio 7.13; 95 percent CI: 3.71 to 13.7). The risk of peripartum hysterectomy for women with two or more prior cesareans was significantly higher (odds ratio 18.6; 95 percent CI: 7.67 to 45.4) than for women with one prior cesarean delivery (odds ratio 2.14; 95 percent CI: 1.37 to 3.33).254 Zelop et al used obstetric records at Brigham and Women’s Hospital to perform a case series of emergency peripartum hysterectomies between 1983 and 1991. Hysterectomy rates for women undergoing a primary cesarean were 0.062 percent, and increased with one prior cesarean delivery to 0.735 percent. Women with one or more prior cesarean had a hysterectomy rate of 1.08 percent, these rates were statistically significant.260
Nisenblat et al compared women undergoing a second cesarean versus women with two or more prior cesareans. The rate of hysterectomy increased from 0.2 percent (1/491) to 1.1 percent (3/277) in the multiple cesarean group, but the result was not statistically significant.249 Lynch et al found a similar rate of hysterectomy in women with four or more prior cesareans of 1.1 percent (2/170).257 Silver et al used MFMU data and noted increasing incidence of hysterectomy with increasing number of cesareans from 0.65, 0.42, 0.90, 2.41, 3.49, and 8.99 percent with zero to five or more prior cesareans, respectively. Women with five or more prior cesareans were 15 times more likely to require hysterectomy (odds ratio 15.2; 95 percent CI: 6.9 to 33.5), these results were statistically significant.236 These studies strongly support a correlation between multiple cesareans and hysterectomy. The odds ratio for hysterectomy with one prior cesarean is 0.7 to 2.14, with one or more is 1.4 to 7.9, and two or more is 3.8 to 18.6. Table 27. Multiple cesarean deliveries effect on rates of hysterectomy
Studies
Adjusted odds ratio 95% Confidence interval or P value N Per/1000
Zero prior cesarean deliveries Bodelon, 2009252 4.6
(3.5 to 6.0) Knight, 2008254 7.13
(3.71 to 13.7) Risk 1:1700 (1:13001:2300)
Silver, 2006236 0.65% (40/6201)
Zelop, 1993260 19/35240 0.62 1 prior cesarean delivery Nisenblat, 2006249 0.2%
(1/491) Knight, 2008254 2.14
(1.37 to 3.33) 80 Risk 1:1300 (1:1000
1:1600) Silver, 2006236 0.7
(0.4 to 0.97) Zelop, 1993260 29/4366 7.35 >1 prior cesarean delivery Bodelon, 2009252 7.9
(5.8 to 10.7) Phelan, 198781 1.7%
(14/847) Zelop, 1993260 70/6694 10.75 2 prior cesarean deliveries Silver, 2006236 1.4
(0.9 to 2.1) >2 prior cesarean deliveries
105
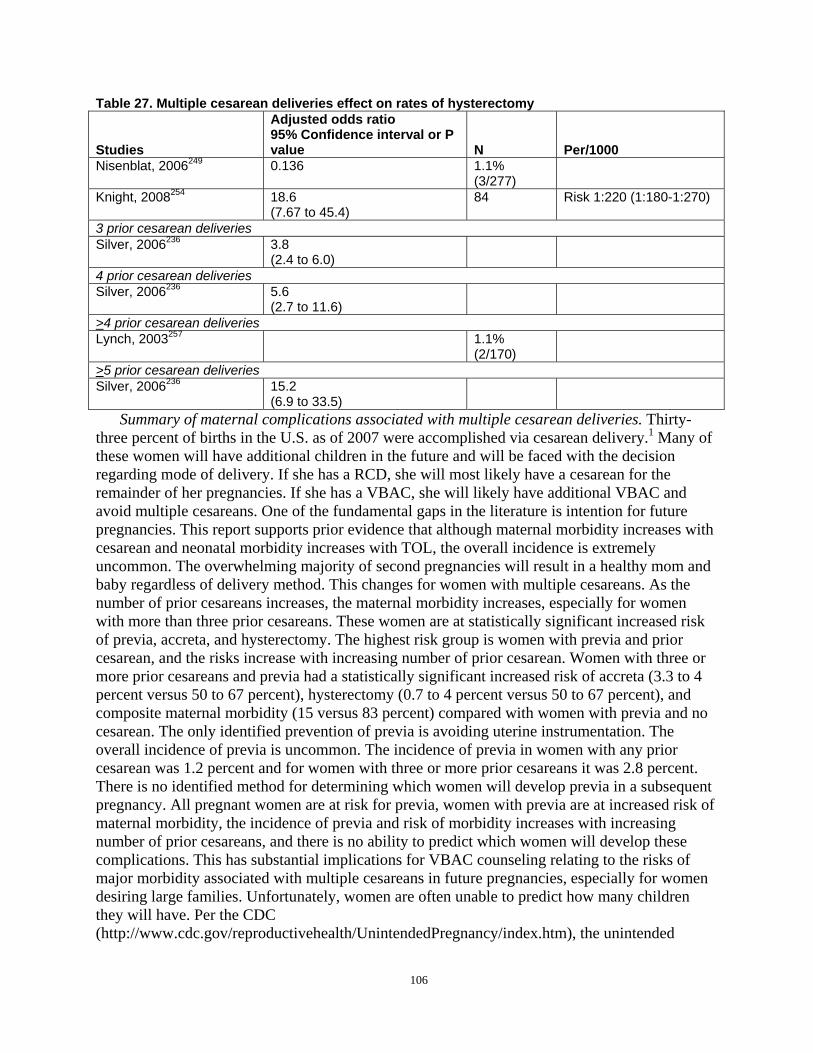
Table 27. Multiple cesarean deliveries effect on rates of hysterectomy
Studies
Adjusted odds ratio 95% Confidence interval or P value N Per/1000
Nisenblat, 2006249 0.136 1.1% (3/277)
Knight, 2008254 18.6 (7.67 to 45.4)
84 Risk 1:220 (1:180-1:270)
3 prior cesarean deliveries Silver, 2006236 3.8
(2.4 to 6.0) 4 prior cesarean deliveries Silver, 2006236 5.6
(2.7 to 11.6) >4 prior cesarean deliveries Lynch, 2003257 1.1%
(2/170) >5 prior cesarean deliveries Silver, 2006236 15.2
(6.9 to 33.5) Summary of maternal complications associated with multiple cesarean deliveries. Thirty-
three percent of births in the U.S. as of 2007 were accomplished via cesarean delivery.1 Many of these women will have additional children in the future and will be faced with the decision regarding mode of delivery. If she has a RCD, she will most likely have a cesarean for the remainder of her pregnancies. If she has a VBAC, she will likely have additional VBAC and avoid multiple cesareans. One of the fundamental gaps in the literature is intention for future pregnancies. This report supports prior evidence that although maternal morbidity increases with cesarean and neonatal morbidity increases with TOL, the overall incidence is extremely uncommon. The overwhelming majority of second pregnancies will result in a healthy mom and baby regardless of delivery method. This changes for women with multiple cesareans. As the number of prior cesareans increases, the maternal morbidity increases, especially for women with more than three prior cesareans. These women are at statistically significant increased risk of previa, accreta, and hysterectomy. The highest risk group is women with previa and prior cesarean, and the risks increase with increasing number of prior cesarean. Women with three or more prior cesareans and previa had a statistically significant increased risk of accreta (3.3 to 4 percent versus 50 to 67 percent), hysterectomy (0.7 to 4 percent versus 50 to 67 percent), and composite maternal morbidity (15 versus 83 percent) compared with women with previa and no cesarean. The only identified prevention of previa is avoiding uterine instrumentation. The overall incidence of previa is uncommon. The incidence of previa in women with any prior cesarean was 1.2 percent and for women with three or more prior cesareans it was 2.8 percent. There is no identified method for determining which women will develop previa in a subsequent pregnancy. All pregnant women are at risk for previa, women with previa are at increased risk of maternal morbidity, the incidence of previa and risk of morbidity increases with increasing number of prior cesareans, and there is no ability to predict which women will develop these complications. This has substantial implications for VBAC counseling relating to the risks of major morbidity associated with multiple cesareans in future pregnancies, especially for women desiring large families. Unfortunately, women are often unable to predict how many children they will have. Per the CDC (http://www.cdc.gov/reproductivehealth/UnintendedPregnancy/index.htm), the unintended
106
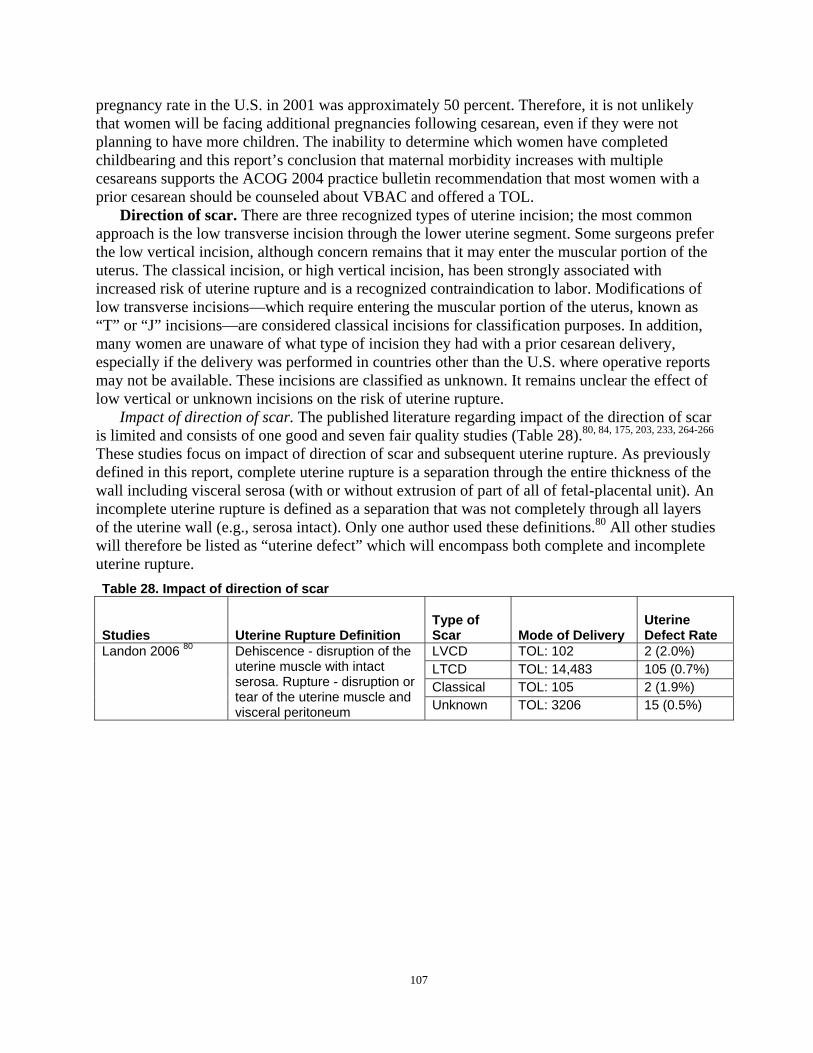
pregnancy rate in the U.S. in 2001 was approximately 50 percent. Therefore, it is not unlikely that women will be facing additional pregnancies following cesarean, even if they were not planning to have more children. The inability to determine which women have completed childbearing and this report’s conclusion that maternal morbidity increases with multiple cesareans supports the ACOG 2004 practice bulletin recommendation that most women with a prior cesarean should be counseled about VBAC and offered a TOL.
Direction of scar. There are three recognized types of uterine incision; the most common approach is the low transverse incision through the lower uterine segment. Some surgeons prefer the low vertical incision, although concern remains that it may enter the muscular portion of the uterus. The classical incision, or high vertical incision, has been strongly associated with increased risk of uterine rupture and is a recognized contraindication to labor. Modifications of low transverse incisions—which require entering the muscular portion of the uterus, known as “T” or “J” incisions—are considered classical incisions for classification purposes. In addition, many women are unaware of what type of incision they had with a prior cesarean delivery, especially if the delivery was performed in countries other than the U.S. where operative reports may not be available. These incisions are classified as unknown. It remains unclear the effect of low vertical or unknown incisions on the risk of uterine rupture.
Impact of direction of scar. The published literature regarding impact of the direction of scar is limited and consists of one good and seven fair quality studies (Table 28).80, 84, 175, 203, 233, 264-266
These studies focus on impact of direction of scar and subsequent uterine rupture. As previously defined in this report, complete uterine rupture is a separation through the entire thickness of the wall including visceral serosa (with or without extrusion of part of all of fetal-placental unit). An incomplete uterine rupture is defined as a separation that was not completely through all layers of the uterine wall (e.g., serosa intact). Only one author used these definitions.80 All other studies will therefore be listed as “uterine defect” which will encompass both complete and incomplete uterine rupture. Table 28. Impact of direction of scar
Studies Uterine Rupture Definition Type of Scar Mode of Delivery
Uterine Defect Rate
Landon 2006 80 Dehiscence - disruption of the uterine muscle with intact serosa. Rupture - disruption or tear of the uterine muscle and visceral peritoneum
LVCD TOL: 102 2 (2.0%) LTCD TOL: 14,483 105 (0.7%) Classical TOL: 105 2 (1.9%) Unknown TOL: 3206 15 (0.5%)
107

Table 28. Impact of direction of scar
Studies Uterine Rupture Definition Type of Scar Mode of Delivery
Uterine Defect Rate
Paul, 1985 175 Dehiscence - nontraumatic LVCD TOL: 50 0 separation of the uterine scar without bleeding or extrusion of the fetus into the wound. Rupture - scar separation with bleeding, hematoma formation, or extrusion of the fetus
LTCD TOL: 701 16 (2.3%)
Martin, 1983203 Dehiscence - palpable and/or visualized uterine defect. Rupture - dehiscence that
LVCD VBAC: 6/12 (50%) TOL-CD: 6 ERCD: 64
0 0 0
required intervention LTCD VBAC: 95/150 (64%) TOL-CD: 55 ERCD: 483
1 (1.1%) 4 (7.2%) 6 (1.2%)
Stovall, 1987 84 Dehiscence - palpable and/or visualized defect in the previous scar. Rupture -
LVCD VBAC: 57/64 (89%) TOL-CD: 7
0 0
dehiscence requiring surgical intervention or blood component.
LTCD VBAC: 159/208 (76%) TOL-CD: 49
0 1 (2.0%)
Tahilramaney, 1984266
Dehiscence - silent separation of the uterine scar.
LVCD VBAC: 0 CD: 11
0 1 (9%)
different #s text/table
Rupture - sudden separation of the scar with hemorrhage
LVCD or fundal
VBAC: 5 CD: 16
0 2 (12%)
requiring immediate intervention.
LTCD VBAC: 156 CD: 218
3 (2.2%) 7 (3.3%)
Unknown VBAC: 104 CD: 347
0 11 (3.2%)
Leung, 1993233 Rupture - symptomatic uterine scar separation that required
LTCD Study of ruptures only
64
emergency laparotomy. Asymptomatic dehiscences were excluded.
LVCD or classical
Study of ruptures only
11
Unclassified Study of ruptures only
24
Lin, 2004265 Rupture - uterine scar separation associated with
LVCD 39 0
abnormal fetal heart rate LTCD 1931 0.60% tracing, extrusion of fetal parts, Classical 145 0 or hemorrhage. Unknown 1312 0.50%
Grubb, 1996264 Dehiscence - scar separation noted incidentally in asymptomatic patient. Rupture - scar separation with either fetal distress or maternal complication requiring operative intervention.
Unknown 197 5 (2.5%)
Abbreviations: LTCD=low transverse cesarean delivery; LVCD=low vertical cesarean delivery; TOL=trial of labor; TOL-CD=trial of labor followed by cesarean delivery; VBAC=vaginal birth after cesarean delivery
108

Uterine rupture. Landon et al 2006 used the MFMU database to study the risk of uterine rupture based on direction of scar for women attempting a TOL.80 For women with a prior LTCD in that study, the overall rupture rate was 105/14,483 deliveries (0.7 percent). The rate with a prior LVCD was 2.0 percent (2/102 deliveries). There were also two uterine ruptures in 102 women with prior classical, J, or T incisions who refused cesarean delivery or presented in advanced labor, resulting in a rupture rate of 1.9 percent.
Uterine defect, prior low vertical incision - trial of labor. Three fair quality cohort studies reported on prior LVCS and incidence of uterine defects in women undergoing TOL.84, 175, 203
Paul et al examined 16,200 deliveries, of which 751 women had a prior cesarean delivery and attempted a TOL.175 Fifty women had a prior LVCD, and per the authors, there were no serious complications. Martin et al studied 717 patients with prior cesarean who were separated into groups based on intended mode of delivery.203 For women who elected a TOL, six had a prior LVCD with no cases of uterine defects. Ninety-five women with a prior LTCD had VBAC deliveries with one uterine defect. Of the 61 women who required abdominal delivery after TOL, six had a prior LVCD with no cases of uterine defects, and 55 women had prior LTCD with four defects. The authors concluded that the evidence did not support the theory that low-vertical incisions are more likely to rupture than LTCD. Stovall et al performed a prospective cohort study of 272 women with a prior cesarean attempting a TOL at the University of Tennessee College of Medicine.84 One hundred and fifty-nine out of 208 women with a prior LTCD underwent VBAC deliveries with one uterine defect. Fifty-seven out of 64 women with a prior LVCD underwent VBAC deliveries with no defects. These studies suggest that TOL with a prior LVCD does not have an increased rate of uterine dehiscence compared with prior LTCD, but the total number of TOL attempts with prior LVCD reported in these three studies is 126. This suggests that the sample size may have not been large enough to capture the true risk of uterine defect with a prior LVCD, but it is reassuring that there were no cases of uterine defects in this series.
Uterine defect, prior low vertical incision - elective repeat cesarean delivery. Martin et al studied 717 patients with a prior cesarean delivery separated into groups based on intended mode of delivery.203 Of the participants, 547 chose ERCD, 483 with a prior LTCD and 64 with a prior LVCD. There were six uterine defects in the LTCD group and no cases in the LVCD group.
Uterine defect, prior low vertical incision - unknown intended mode of delivery. Three fair quality cohort studies evaluated a prior LVCD and incidence of uterine defect but did not discuss intended mode of delivery.233, 265, 266 As the authors did not report which patients attempted TOL, it is unclear whether patients with scar disruption presented with asymptomatic defects at the time of ERCD or after attempted TOL. Tahilramaney et al reported defects in 2.8 percent of 374 patients with prior LTCD.266 One hundred and thirty-four women delivered vaginally with uterine defects in three versus 211 delivering via cesarean with seven cases of defect. For the 11 patients with a prior LVCD, all were delivered via cesarean with one defect (9 percent). For the 21 prior classical or vertical incisions of unknown type, there were five vaginal deliveries without complications and two cases of uterine defects with cesarean (14 percent). The authors concluded that type of uterine incision was not statistically significant in regards to uterine dehiscence. Leung et al reviewed cases of uterine defects at one institution over a 10 year period.233 There were 16,467 women who had a prior cesarean with 107 cases of uterine defects, 99 with complete records. Per patient history, 90 percent of scar types were unknown, but, when possible, scars were classified at the time of laparotomy. Eleven were recorded as classical/vertical, 64 were transverse, and 24 remained unknown. A database at Emory
109
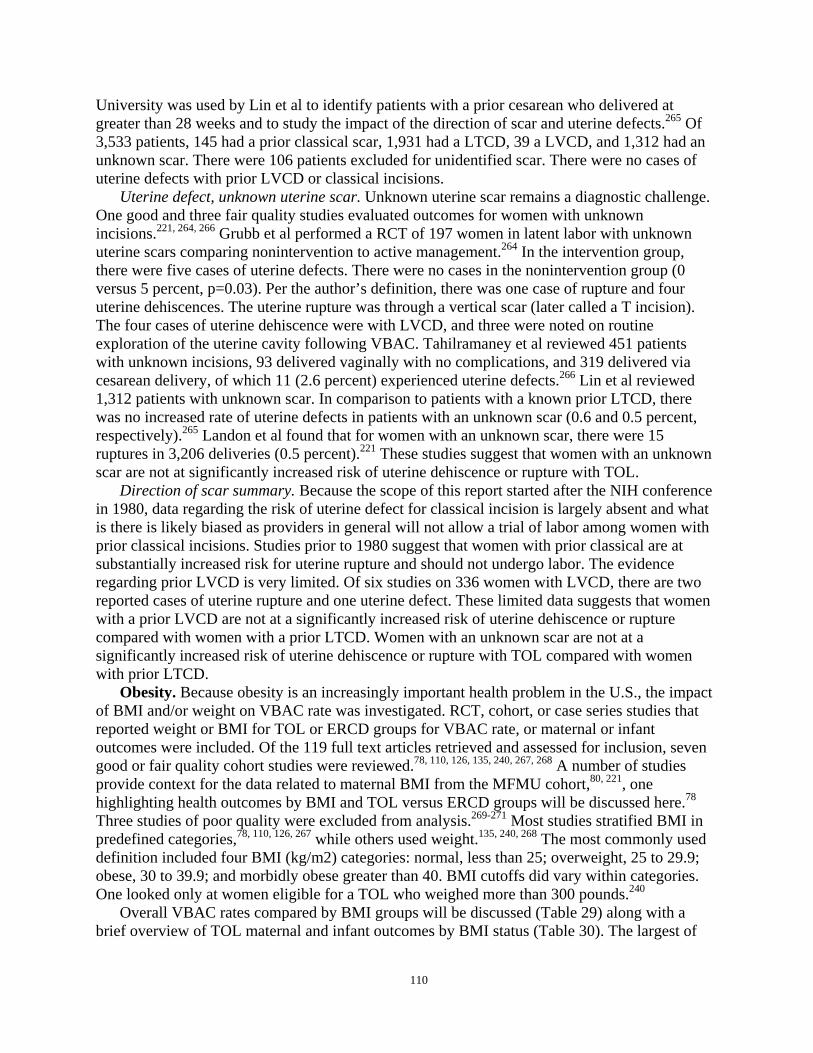
University was used by Lin et al to identify patients with a prior cesarean who delivered at greater than 28 weeks and to study the impact of the direction of scar and uterine defects.265 Of 3,533 patients, 145 had a prior classical scar, 1,931 had a LTCD, 39 a LVCD, and 1,312 had an unknown scar. There were 106 patients excluded for unidentified scar. There were no cases of uterine defects with prior LVCD or classical incisions.
Uterine defect, unknown uterine scar. Unknown uterine scar remains a diagnostic challenge. One good and three fair quality studies evaluated outcomes for women with unknown incisions.221, 264, 266 Grubb et al performed a RCT of 197 women in latent labor with unknown uterine scars comparing nonintervention to active management.264 In the intervention group, there were five cases of uterine defects. There were no cases in the nonintervention group (0 versus 5 percent, p=0.03). Per the author’s definition, there was one case of rupture and four uterine dehiscences. The uterine rupture was through a vertical scar (later called a T incision). The four cases of uterine dehiscence were with LVCD, and three were noted on routine exploration of the uterine cavity following VBAC. Tahilramaney et al reviewed 451 patients with unknown incisions, 93 delivered vaginally with no complications, and 319 delivered via cesarean delivery, of which 11 (2.6 percent) experienced uterine defects.266 Lin et al reviewed 1,312 patients with unknown scar. In comparison to patients with a known prior LTCD, there was no increased rate of uterine defects in patients with an unknown scar (0.6 and 0.5 percent, respectively).265 Landon et al found that for women with an unknown scar, there were 15 ruptures in 3,206 deliveries (0.5 percent).221 These studies suggest that women with an unknown scar are not at significantly increased risk of uterine dehiscence or rupture with TOL.
Direction of scar summary. Because the scope of this report started after the NIH conference in 1980, data regarding the risk of uterine defect for classical incision is largely absent and what is there is likely biased as providers in general will not allow a trial of labor among women with prior classical incisions. Studies prior to 1980 suggest that women with prior classical are at substantially increased risk for uterine rupture and should not undergo labor. The evidence regarding prior LVCD is very limited. Of six studies on 336 women with LVCD, there are two reported cases of uterine rupture and one uterine defect. These limited data suggests that women with a prior LVCD are not at a significantly increased risk of uterine dehiscence or rupture compared with women with a prior LTCD. Women with an unknown scar are not at a significantly increased risk of uterine dehiscence or rupture with TOL compared with women with prior LTCD.
Obesity. Because obesity is an increasingly important health problem in the U.S., the impact of BMI and/or weight on VBAC rate was investigated. RCT, cohort, or case series studies that reported weight or BMI for TOL or ERCD groups for VBAC rate, or maternal or infant outcomes were included. Of the 119 full text articles retrieved and assessed for inclusion, seven good or fair quality cohort studies were reviewed.78, 110, 126, 135, 240, 267, 268 A number of studies provide context for the data related to maternal BMI from the MFMU cohort,80, 221, one highlighting health outcomes by BMI and TOL versus ERCD groups will be discussed here.78
Three studies of poor quality were excluded from analysis.269-271 Most studies stratified BMI in predefined categories,78, 110, 126, 267 while others used weight.135, 240, 268 The most commonly used definition included four BMI (kg/m2) categories: normal, less than 25; overweight, 25 to 29.9; obese, 30 to 39.9; and morbidly obese greater than 40. BMI cutoffs did vary within categories. One looked only at women eligible for a TOL who weighed more than 300 pounds.240
Overall VBAC rates compared by BMI groups will be discussed (Table 29) along with a brief overview of TOL maternal and infant outcomes by BMI status (Table 30). The largest of
110
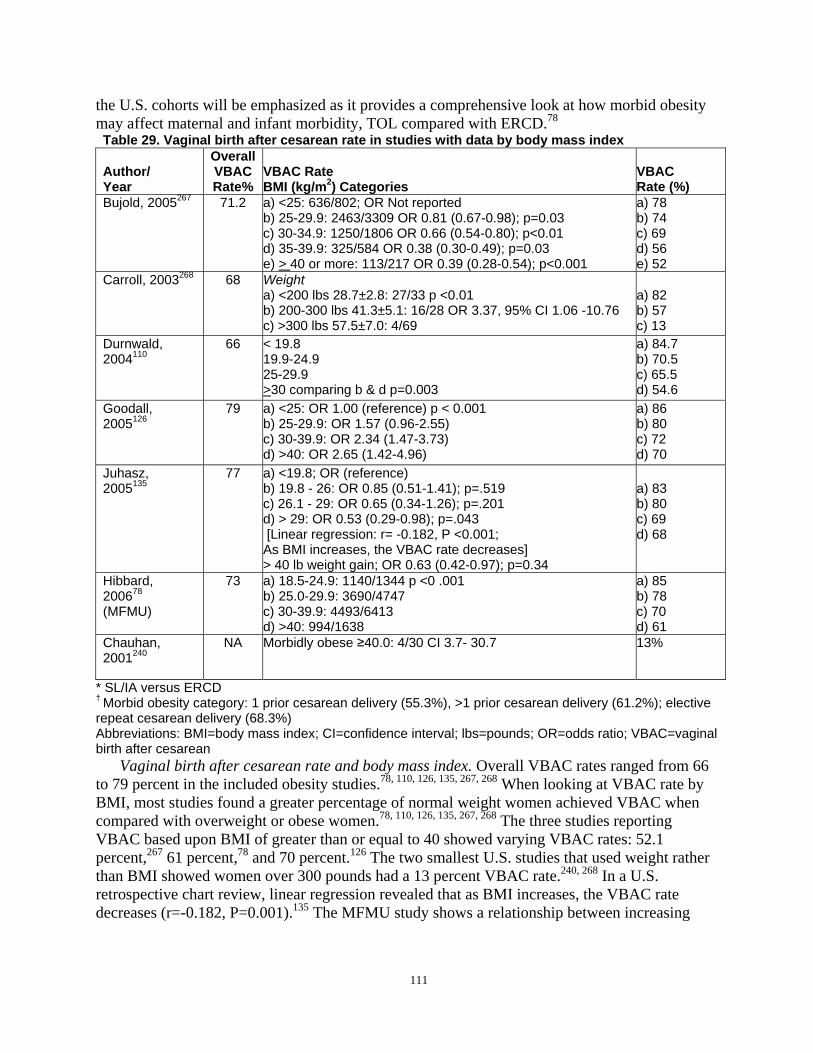
the U.S. cohorts will be emphasized as it provides a comprehensive look at how morbid obesity may affect maternal and infant morbidity, TOL compared with ERCD.78
Table 29. Vaginal birth after cesarean rate in studies with data by body mass index
Author/ Year
Overall VBAC Rate%
VBAC Rate BMI (kg/m2) Categories
VBAC Rate (%)
Bujold, 2005267 71.2 a) <25: 636/802; OR Not reported b) 25-29.9: 2463/3309 OR 0.81 (0.67-0.98); p=0.03 c) 30-34.9: 1250/1806 OR 0.66 (0.54-0.80); p<0.01 d) 35-39.9: 325/584 OR 0.38 (0.30-0.49); p=0.03 e) > 40 or more: 113/217 OR 0.39 (0.28-0.54); p<0.001
a) 78 b) 74 c) 69 d) 56 e) 52
Carroll, 2003268 68 Weight a) <200 lbs 28.7±2.8: 27/33 p <0.01 b) 200-300 lbs 41.3±5.1: 16/28 OR 3.37, 95% CI 1.06 -10.76 c) >300 lbs 57.5±7.0: 4/69
a) 82 b) 57 c) 13
Durnwald, 2004110
66 < 19.8 19.9-24.9 25-29.9 >30 comparing b & d p=0.003
a) 84.7 b) 70.5 c) 65.5 d) 54.6
Goodall, 2005126
79 a) <25: OR 1.00 (reference) p < 0.001 b) 25-29.9: OR 1.57 (0.96-2.55) c) 30-39.9: OR 2.34 (1.47-3.73) d) >40: OR 2.65 (1.42-4.96)
a) 86 b) 80 c) 72 d) 70
Juhasz, 2005135
77 a) <19.8; OR (reference) b) 19.8 - 26: OR 0.85 (0.51-1.41); p=.519 c) 26.1 - 29: OR 0.65 (0.34-1.26); p=.201 d) > 29: OR 0.53 (0.29-0.98); p=.043 [Linear regression: r= -0.182, P <0.001; As BMI increases, the VBAC rate decreases] > 40 lb weight gain; OR 0.63 (0.42-0.97); p=0.34
a) 83 b) 80 c) 69 d) 68
Hibbard, 200678
(MFMU)
73 a) 18.5-24.9: 1140/1344 p <0 .001 b) 25.0-29.9: 3690/4747 c) 30-39.9: 4493/6413 d) >40: 994/1638
a) 85 b) 78 c) 70 d) 61
Chauhan, 2001240
NA Morbidly obese ≥40.0: 4/30 CI 3.7- 30.7 13%
* SL/IA versus ERCD † Morbid obesity category: 1 prior cesarean delivery (55.3%), >1 prior cesarean delivery (61.2%); elective repeat cesarean delivery (68.3%) Abbreviations: BMI=body mass index; CI=confidence interval; lbs=pounds; OR=odds ratio; VBAC=vaginal birth after cesarean
Vaginal birth after cesarean rate and body mass index. Overall VBAC rates ranged from 66 to 79 percent in the included obesity studies.78, 110, 126, 135, 267, 268 When looking at VBAC rate by BMI, most studies found a greater percentage of normal weight women achieved VBAC when compared with overweight or obese women.78, 110, 126, 135, 267, 268 The three studies reporting VBAC based upon BMI of greater than or equal to 40 showed varying VBAC rates: 52.1 percent,267 61 percent,78 and 70 percent.126 The two smallest U.S. studies that used weight rather than BMI showed women over 300 pounds had a 13 percent VBAC rate.240, 268 In a U.S. retrospective chart review, linear regression revealed that as BMI increases, the VBAC rate decreases (r=-0.182, P=0.001).135 The MFMU study shows a relationship between increasing
111
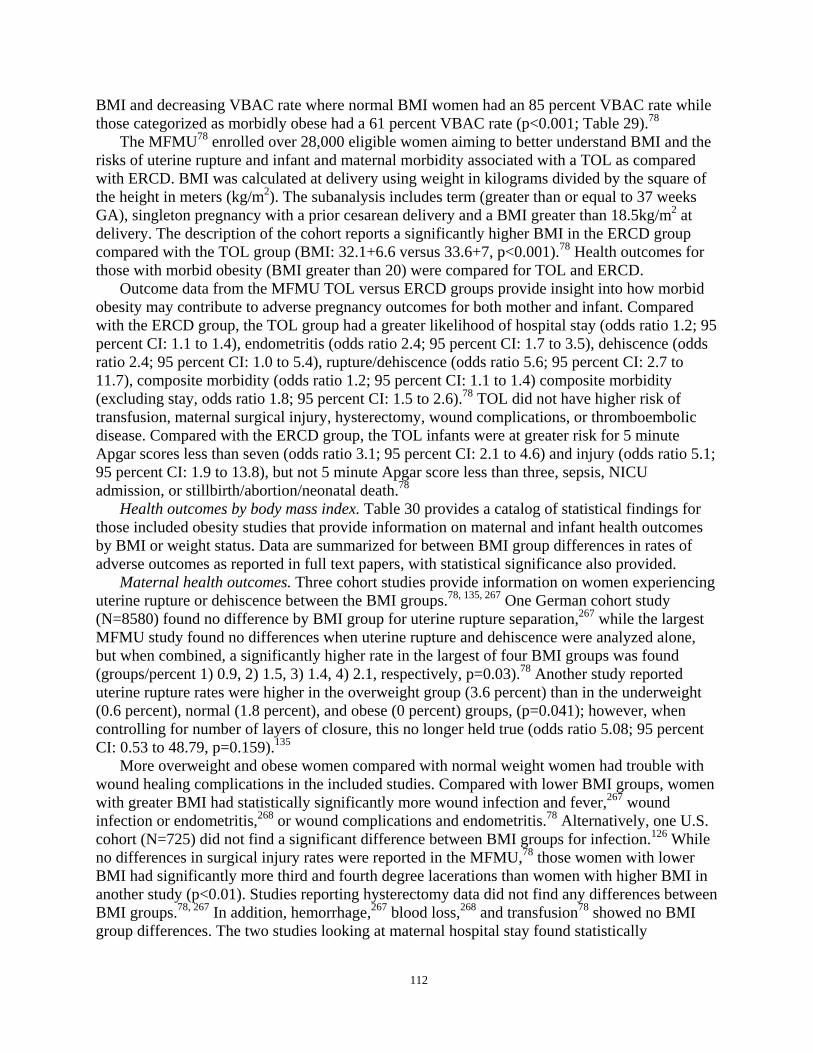
BMI and decreasing VBAC rate where normal BMI women had an 85 percent VBAC rate while those categorized as morbidly obese had a 61 percent VBAC rate (p<0.001; Table 29).78
The MFMU78 enrolled over 28,000 eligible women aiming to better understand BMI and the risks of uterine rupture and infant and maternal morbidity associated with a TOL as compared with ERCD. BMI was calculated at delivery using weight in kilograms divided by the square of the height in meters (kg/m2). The subanalysis includes term (greater than or equal to 37 weeks GA), singleton pregnancy with a prior cesarean delivery and a BMI greater than 18.5kg/m2 at delivery. The description of the cohort reports a significantly higher BMI in the ERCD group compared with the TOL group (BMI: 32.1+6.6 versus 33.6+7, p<0.001).78 Health outcomes for those with morbid obesity (BMI greater than 20) were compared for TOL and ERCD.
Outcome data from the MFMU TOL versus ERCD groups provide insight into how morbid obesity may contribute to adverse pregnancy outcomes for both mother and infant. Compared with the ERCD group, the TOL group had a greater likelihood of hospital stay (odds ratio 1.2; 95 percent CI: 1.1 to 1.4), endometritis (odds ratio 2.4; 95 percent CI: 1.7 to 3.5), dehiscence (odds ratio 2.4; 95 percent CI: 1.0 to 5.4), rupture/dehiscence (odds ratio 5.6; 95 percent CI: 2.7 to 11.7), composite morbidity (odds ratio 1.2; 95 percent CI: 1.1 to 1.4) composite morbidity (excluding stay, odds ratio 1.8; 95 percent CI: 1.5 to 2.6).78 TOL did not have higher risk of transfusion, maternal surgical injury, hysterectomy, wound complications, or thromboembolic disease. Compared with the ERCD group, the TOL infants were at greater risk for 5 minute Apgar scores less than seven (odds ratio 3.1; 95 percent CI: 2.1 to 4.6) and injury (odds ratio 5.1; 95 percent CI: 1.9 to 13.8), but not 5 minute Apgar score less than three, sepsis, NICU admission, or stillbirth/abortion/neonatal death.78
Health outcomes by body mass index. Table 30 provides a catalog of statistical findings for those included obesity studies that provide information on maternal and infant health outcomes by BMI or weight status. Data are summarized for between BMI group differences in rates of adverse outcomes as reported in full text papers, with statistical significance also provided.
Maternal health outcomes. Three cohort studies provide information on women experiencing uterine rupture or dehiscence between the BMI groups.78, 135, 267 One German cohort study (N=8580) found no difference by BMI group for uterine rupture separation,267 while the largest MFMU study found no differences when uterine rupture and dehiscence were analyzed alone, but when combined, a significantly higher rate in the largest of four BMI groups was found (groups/percent 1) 0.9, 2) 1.5, 3) 1.4, 4) 2.1, respectively, p=0.03).78 Another study reported uterine rupture rates were higher in the overweight group (3.6 percent) than in the underweight (0.6 percent), normal (1.8 percent), and obese (0 percent) groups, (p=0.041); however, when controlling for number of layers of closure, this no longer held true (odds ratio 5.08; 95 percent CI: 0.53 to 48.79, p=0.159).135
More overweight and obese women compared with normal weight women had trouble with wound healing complications in the included studies. Compared with lower BMI groups, women with greater BMI had statistically significantly more wound infection and fever,267 wound infection or endometritis,268 or wound complications and endometritis.78 Alternatively, one U.S. cohort (N=725) did not find a significant difference between BMI groups for infection.126 While no differences in surgical injury rates were reported in the MFMU,78 those women with lower BMI had significantly more third and fourth degree lacerations than women with higher BMI in another study (p<0.01). Studies reporting hysterectomy data did not find any differences between BMI groups.78, 267 In addition, hemorrhage,267 blood loss,268 and transfusion78 showed no BMI group differences. The two studies looking at maternal hospital stay found statistically
112
significantly higher rates of hospital stay with higher BMI.78, 268 The MFMU sub analysis showed maternal stay of 4 or more days in the hospital at 30.3 percent in the morbidly obese BMI category, versus 9.4 percent, 12 percent, and 18.9 percent, in the other weight categories respectively, p<0.001.78 Finally, there was no significant difference in the adverse event thromboembolism in BMI groups.78
Infant health outcomes. Two studies reporting on infant death did not find a statistically significant difference between BMI groups.78, 267 The MFMU secondary analysis did note that stillbirth/abortion and neonatal death were the highest in the morbid obesity group (BMI greater than 40 was 0.5 percent versus 0.2, 0.3, and 0.3, in the other weight categories, respectively, p=0.14).78 When comparing with lower BMI categories, neonatal resuscitation with intubation267
and NICU admission78 were highest in the morbidly obese groups as well (greater than 40 BMI) (p=0.03 and p<0.001, respectively).
GA and birth weight were common outcomes evaluated in all studies with BMI group data; however, results were mixed. Two studies showed no effects for GA,135, 268 while two studies indicate that younger GA is associated with lower BMI.126, 267 The largest MFMU study found older GA in the overweight and obese BMI groups, when compared with the underweight or normal BMI groups (p<0.001).78 Similarly, a U.S. university clinic cohort found older GA in higher BMI patients, compared with lower BMI patients.126 A similar picture emerges with infant weight and maternal BMI, where three large U.S. studies showed infant weights greater than 4,000 grams were more likely in the largest BMI categories,126, 135, 267 and two where infant weight was higher in high BMI groups.78, 126 In contrast, one study reported no infant weight differences in BMI groups.268
Apgar scores less than seven taken at 1 minute following delivery showed no differences by BMI,126, 267 while Apgar less than seven taken at 5 minutes were more likely in the high BMI group compared with lower BMI group.267 The MFMU analysis showed 5 minute Apgar scores less than or equal to three were not significantly different between BMI groups.78 In addition, infant injury and sepsis were similar for all maternal BMI groups.78
Summary of obesity. Assessing the risks and benefits of VBAC using BMI is a complex exercise. Data show that increasing BMI is linked to decreased VBAC, with morbidly obese women and their infants being at the highest risk for adverse outcomes. Compared with normal weight mothers, data suggest that obese and morbidly obese women are more likely to suffer rupture and/or dehiscence, wound infection, and/or increased hospital stay, while their infants may experience more injury and greater weights, specifically greater than 4,000 grams. BMI categories use different cut offs and patient inclusion and exclusion criteria vary. Comparison across studies for VBAC rate and important health outcomes is further complicated by lack of consensus on definitions and priorities. Future research in community practice settings with reproducible and valid outcome measures could provide more insight in this field.
113
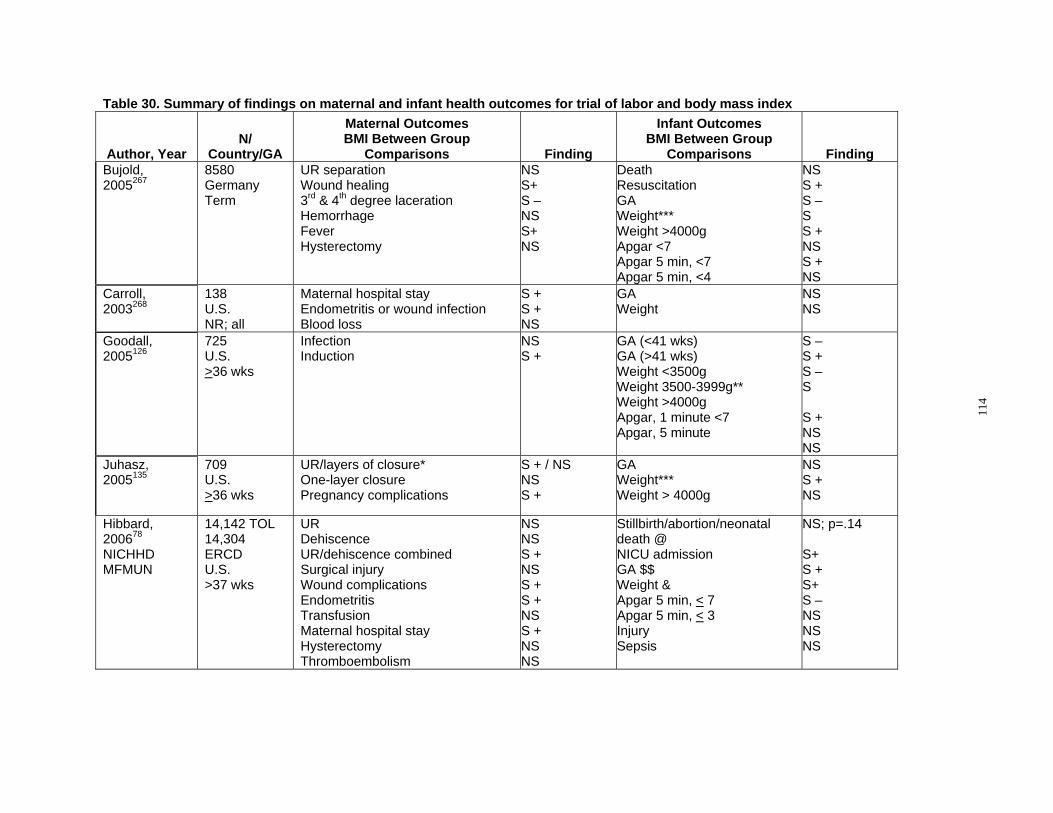
Table 30. Summary of findings on maternal and infant health outcomes for trial of labor and body mass index
Author, Year N/
Country/GA
Maternal Outcomes BMI Between Group
Comparisons Finding
Infant Outcomes BMI Between Group
Comparisons Finding Bujold, 8580 UR separation NS Death NS 2005267 Germany Wound healing S+ Resuscitation S +
Term 3rd & 4th degree laceration S – GA S – Hemorrhage NS Weight*** S Fever S+ Weight >4000g S + Hysterectomy NS Apgar <7 NS
Apgar 5 min, <7 S + Apgar 5 min, <4 NS
Carroll, 2003268
138 U.S. NR; all
Maternal hospital stay Endometritis or wound infection Blood loss
S + S + NS
GA Weight
NS NS
Goodall, 725 Infection NS GA (<41 wks) S – 2005126 U.S. Induction S + GA (>41 wks) S +
>36 wks Weight <3500g S – Weight 3500-3999g** S Weight >4000g Apgar, 1 minute <7 S + Apgar, 5 minute NS
NS Juhasz, 2005135
709 U.S. >36 wks
UR/layers of closure* One-layer closure Pregnancy complications
S + / NS NS S +
GA Weight*** Weight > 4000g
NS S + NS
Hibbard, 14,142 TOL UR NS Stillbirth/abortion/neonatal NS; p=.14 200678 14,304 Dehiscence NS death @ NICHHD ERCD UR/dehiscence combined S + NICU admission S+ MFMUN U.S. Surgical injury NS GA $$ S +
>37 wks Wound complications S + Weight & S+ Endometritis S + Apgar 5 min, < 7 S – Transfusion NS Apgar 5 min, < 3 NS Maternal hospital stay S + Injury NS Hysterectomy NS Sepsis NS Thromboembolism NS
114
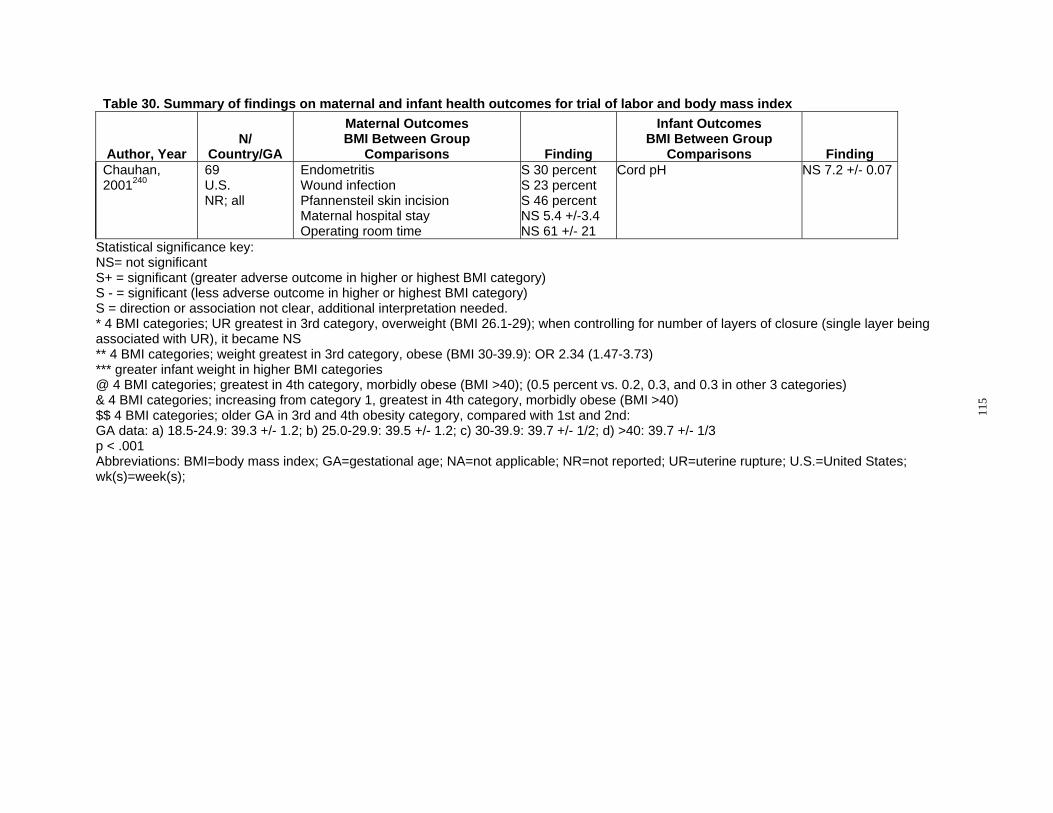
Table 30. Summary of findings on maternal and infant health outcomes for trial of labor and body mass index
Author, Year N/
Country/GA
Maternal Outcomes BMI Between Group
Comparisons Finding
Infant Outcomes BMI Between Group
Comparisons Finding Chauhan, 2001240
69 U.S. NR; all
Endometritis Wound infection Pfannensteil skin incision Maternal hospital stay Operating room time
S 30 percent S 23 percent S 46 percent NS 5.4 +/-3.4 NS 61 +/- 21
Cord pH NS 7.2 +/- 0.07
Statistical significance key:
NS= not significant
S+ = significant (greater adverse outcome in higher or highest BMI category)
S - = significant (less adverse outcome in higher or highest BMI category)
S = direction or association not clear, additional interpretation needed.
* 4 BMI categories; UR greatest in 3rd category, overweight (BMI 26.1-29); when controlling for number of layers of closure (single layer being
associated with UR), it became NS
** 4 BMI categories; weight greatest in 3rd category, obese (BMI 30-39.9): OR 2.34 (1.47-3.73)
*** greater infant weight in higher BMI categories
@ 4 BMI categories; greatest in 4th category, morbidly obese (BMI >40); (0.5 percent vs. 0.2, 0.3, and 0.3 in other 3 categories)
& 4 BMI categories; increasing from category 1, greatest in 4th category, morbidly obese (BMI >40)
$$ 4 BMI categories; older GA in 3rd and 4th obesity category, compared with 1st and 2nd: GA data: a) 18.5-24.9: 39.3 +/- 1.2; b) 25.0-29.9: 39.5 +/- 1.2; c) 30-39.9: 39.7 +/- 1/2; d) >40: 39.7 +/- 1/3
p < .001
Abbreviations: BMI=body mass index; GA=gestational age; NA=not applicable; NR=not reported; UR=uterine rupture; U.S.=United States;
wk(s)=week(s);
115
Effects of management of trial of labor using a protocol on maternal outcomes. In a small cohort study examining the impact of using a strict protocol for managing a trial of labor in 841 women with prior cesarean delivery compared with 467 women undergoing ERCD maternal harms were evaluated.91 The rate of major complications (uterine rupture, hysterectomy, relaparotomy, operative injury, or greater than two units of blood transfused) was not statistically significantly different between the TOL and ERCD groups (1.8 versus 1.3 percent, p=0.50).
Adhesions One concerning complication from multiple cesarean deliveries is increased complications
from adhesive disease. This may result in a more difficult RCD, increased postoperative complications, or increased complications with future gynecological surgeries. Studies looking at adhesions are limited. One study described increased adhesions with increased number of cesarean deliveries at the time of cesarean.235 Another study found increased perioperative complications with vaginal hysterectomy to be associated with women who underwent one or more cesarean in the past (frequency 18.31 versus 3.58 percent, p<0.0001). Specifically, in women with a history of cesarean, there was a 5.63 percent rate of bladder injuries compared with 0.89 percent in women without cesarean delivery (p= 0.01). A history of cesarean was also associated with increased need for adhesiolysis, intestinal injuries, and longer operating time, but none of these factors were significant. This study did not delineate one versus multiple cesareans, however, and did not evaluate patients with a history of VBAC.272
A similar study evaluating factors relating to complications during hysterectomy found a history of cesarean delivery to be significantly associated with an increase in complications. Again, however, this study did not evaluate multiple cesareans or VBAC separately.273 Another study evaluated the benefit of closing the peritoneum at the time of initial cesarean to decrease the incidence of adhesions in future cesareans. This study found a statistically significant increase in the number of patients with severe adhesive disease in those without peritoneal closure compared with those who had closure at the time of RCD. (6 versus 42 percent, p=0.003) This study did not report the rate of severe adhesions in those patients undergoing multiple RCDs; however it does provide evidence that even one cesarean can result in significant adhesions. The presence of adhesions can result in complications with subsequent cesareans.274
This finding was supported by a Canadian study evaluating the presence of adhesions in subsequent cesarean. This study found a dose dependent relationship with the prevalence of adhesions with the number of cesareans, from 0 percent at primary cesarean delivery to 47.9 percent at the fourth cesarean.275 In addition, this study found a statistical increase in both delivery time as well as total operative time for deliveries complicated by adhesions compared with those without adhesions. Operative and delivery times did not increase however with increasing number of cesareans.275
One study evaluating the incidence of postoperative small bowel obstruction, thought to be associated with increased adhesive disease, found a smaller rate of obstruction in the cesarean delivery group than among those with hysterectomy, adenexal surgery, or myomectomy (0.05 percent versus 1.63, 0.87, and 0.39 percent; p<0.001).276
Reproductive Health Several studies have attempted to define the impact of cesarean delivery on overall
reproductive health. One of the important factors emphasized by clinicians is the ultimate family
116
plan of patients, due to the increased risk perceived with multiple cesareans. However, there is also a concern for impaired fertility due to surgery on the uterus. However, this is not well studied with only two studies evaluating impaired fertility. One study of fair quality looking at future pregnancies after vaginal delivery, operative vaginal delivery, and cesarean found there to be a statistically significant difference in the ability to conceive in subjects undergoing a cesarean compared with those who underwent an instrumented vaginal delivery (odds ratio 0.33; 95 percent CI: 0.12 to 0.98). This study however, did not distinguish between VBAC and primary deliveries in the cohort.277 The second study of fair quality found a history of cesarean associated with an increased odds of taking greater than one year to conceive after adjusting for confounders including maternal and paternal age, demographics, and BMI (odds ratio 1.53; 95 percent CI: 1.09 to 2.14). Though this study did not evaluate VBAC or multiple cesareans separately, there was an increased risk of delayed fertility with increasing parity, suggesting a continued effect of at least one cesarean (odds ratio 2.97; 95 percent CI: 1.72 to 5.10).278
One case-control study found an increased odds ratio of multiple cesarean deliveries (greater than or equal to two priors) compared with no pelvic surgery in women with early menopause (odds ratio 2.69; 95 percent CI: 1.16 to 6.22) This study however, did not evaluate VBAC and this association was not evaluated in a multivariate model.279 No studies evaluated TOL and/or RCD with respect to pelvic pain, risk of ectopic pregnancy, and general health risks, such as diabetes or high blood pressure. What are the short- and long-term benefits and harms to the baby of maternal attempt at trial of labor after prior cesarean versus elective repeat cesarean delivery, and what factors
influence benefits and harms? This section reviews the infant benefits and harms associated with VBAC compared with
ERCD. The goal of this endeavor is not only to describe the current knowledge of risks of each type of delivery, but to highlight important gaps in the literature. As part of this report, the following outcomes were examined: perinatal mortality, respiratory conditions, hypoxic ischemic encephalopathy (HIE)/Asphyxia, Sepsis, Birth Trauma, Apgar scores, NICU admissions, and breastfeeding. In addition factors that may modify the outcomes associated with mode of delivery such as induction of labor, fetal macrosomia and fetal presentation are also discussed.
Perinatal and fetal mortality studies were open to all gestational ages but excluded studies that did not specifically exclude infants with known congenital or lethal anomalies.
Perinatal Mortality The definitions accepted by the National Center for Vital Statistics63 were used to review and
describe the data relating to perinatal mortality and the subsets of fetal and neonatal mortality in women with a prior cesarean delivery. The definition of perinatal mortality (perinatal II) included infants less than 28 days of age and fetal deaths of 20 weeks or more gestation. To study the frequency of stillbirth (antepartum and intrapartum) we used both the intermediate (20 to 27 weeks gestation) and late (28 weeks or greater gestation) fetal definitions of fetal death in an attempt to capture the most studies and allow comparisons to national statistics for the general population. Studies that reported fetal loss less than 20 weeks gestation or less than 500 grams were not included in the review. Neonatal (infant) mortality was defined as death in the first 28
117
days of life.63 . To reduce the effects of prematurity on the neonatal mortality rate, we limited our analyses of neonatal mortality to term infants. Two studies,280, 281 which focused specifically on the risk of a stillbirth in a subsequent pregnancy after prior cesarean delivery (irrespective of mode of delivery in the next pregnancy), were included and are discussed in the section of long-term outcomes and the impact of the mode of delivery on subsequent pregnancies. Eight cohort studies of good or fair quality and reporting data on mortality using at least one of these definitions of mortality are included.79, 93, 103, 204, 228, 282-284
Perinatal morality rate. The U.S. perinatal mortality rate (PMR) for infants 28 weeks gestation to less than 7 days of life was reported to be 0.66 percent for the year 2005, but notably does not exclude infants with congenital anomalies.63 Five good or fair quality cohort studies, involving 76,899 infants reported perinatal mortality associated with TOL and ERCD (Table 31).103, 204, 228, 282, 284 The definition of perinatal mortality among the five studies included fetal and neonatal deaths up to 28 days of life. Perinatal mortality was also used to categorize studies if it was unclear if the death occurred during labor or after delivery.284 All five studies focused exclusively on women delivering at term. Three of the studies occurred in tertiary or university settings204, 228, 284 and two utilized population databases.103, 282
There were 72 perinatal deaths/41,213 births in women having a TOL. The combined PMR for women undergoing a TOL was 0.13 percent (95 percent CI: 0.06 to 0.3 percent), translating to 1.3 per 1,000 (95 percent CI: 0.6 to 3 per 1,000). There were 46 perinatal deaths/35,686 births for women undergoing an ERCD. The combined PMR for ERCD was 0.05 percent (95 percent CI: 0.007 to 0.38 percent) this translates to 0.5 per 1,000 (95 percent CI: 0.07 to 3.8 per 1,000 (Figure 27)). The risk of perinatal mortality was significantly higher for TOL as compared with ERCD (RR 1.82; 95 percent CI: 1.24 to 2.67; p=0.041). Using 0.05 percent as the baseline risk for ERCD, the calculated risk difference was 0.41 percent (95 percent CI: 0.012 to 0.08 percent) which is equivalent to .41 more deaths among women who attempt TOL. One study204 examined the influence of labor and underlying maternal medical complications (indications) upon perinatal mortality. The PMR was higher among women with underlying medical conditions (indications) with and without labor compared with women without indications. Interestingly, the impact of labor upon perinatal mortality appeared to differ based upon indication status with PMR being higher among the labor group for women without indications (0.22 percent labored versus 0.12 percent no labor) and lower for the labor group for women without indications (0.19 percent labor versus 0.34 percent no labor).204
118

Table 31. Perinatal mortality rate (20 weeks or greater gestation to 7 days of life) among any gestational age studies Number of Perinatal Deaths
Study, Year Study Description Years of
Study N Comparison PMR* TOL PMR* IRCD PMR* ERCD Bujold, 2005282
Retrospective cohort, Perinatal Database, Germany
19911997
8580 Term infants
TOL versus ERCD
4/6,718 (0.6/1,000) 0.06%
2/1,862 (1.1/1,000) 0.11%
Richardson, 2005284
Retrospective cohort Administrative database; 1 tertiary hospital in Canada
19922002
3,489 Term infants
TOL versus no labor
3/2,646 (1.1/1,000) 0.11%
0/843 (0/1,000)
Sibony, 2006228
Retrospective cohort; University hospital France
19962003
1190 Term infants
TOL versus ERCD
1/1,015 (0.9/1,000) 0.10%
0/175 (0/1,000)
Smith, 2002103
Population-based retrospective cohort Administrative Database Scotland
19921997
24,529 Term infants
TOL versus ERCD
20/15,515 (1.3/1,000) 0.13%
1/9,014 (1.1/1,000) 0.01%
Spong, 2007204
Prospective cohort, MFMU Network
19992002
39,111 Term infants
TOL versus ERCD with labor
TOL versus ERCD (without labor)
44/15,319 (2.9/1,000) 0.29%
Labor: 2/1,077 (1.9/1,000) 0.19% No labor: 17/5,002 (3.4/1,000) 0.34%
All: 43/23,792 (1.8/1,000) 0.18% Labor: 6/2,721 (2.2/1,000) 0.22% No labor: 18/14,992 (1.2/1,000) 0.12%
*Number of deaths per 1,000 Abbreviations: ERCD=elective repeat cesarean delivery; IRCD=indicated repeat cesarean delivery; PMR=perinatal mortality rate; TOL=trial of labor
119
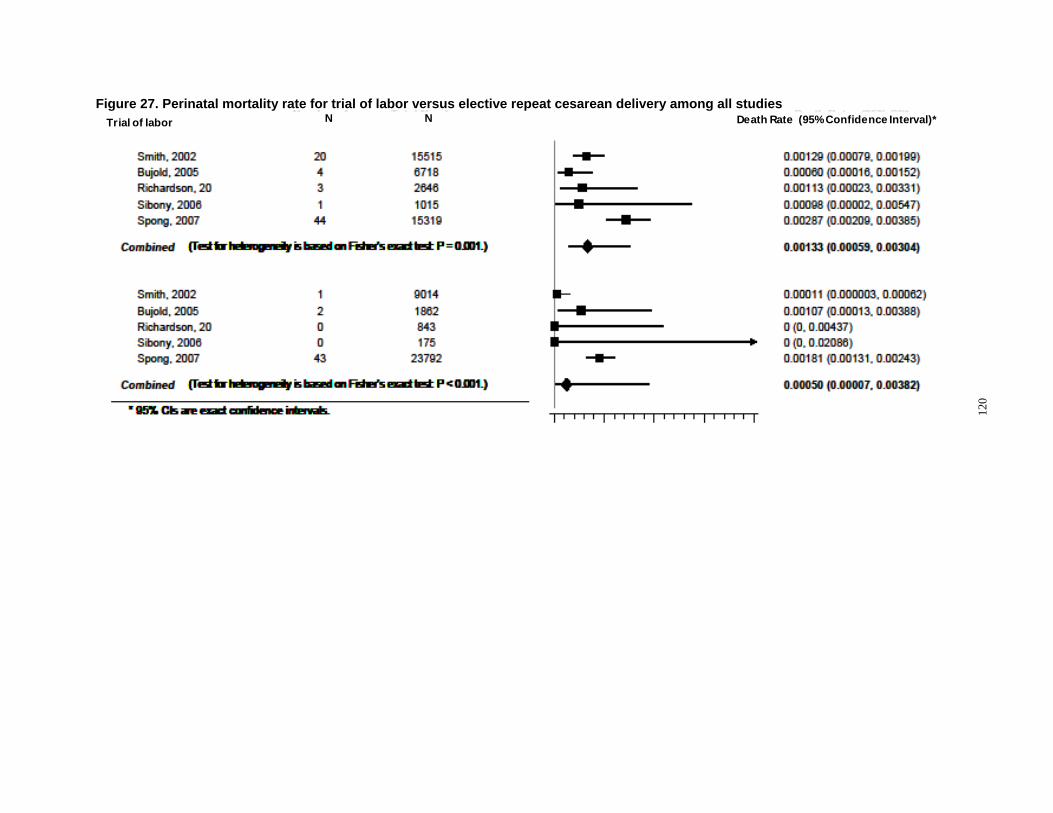
Elective repeat cesarean delivery
Deaths Total
•95% confidence intervals are exact
Smith, 2002 20 15,515 Bujold, 2005 4 6,718 Richardson, 2005 3 2,646 Sibony, 2006 1 1,015 Spong, 2007 44 15,319
Smith, 2002 1 9,014 Bujold, 2005 2 1,862 Richardson, 2005 0 843 Sibony, 2006 0 175 Spong, 2007 43 23,792
Com bined (Test for heterogeneity is based on Fisher’s exact text P=0.001)
Com bined (Test for heterogeneity is based on Fisher’s exact text P<0.001)
0.000 0.002 0.004 0.006 0.008 Death rate (95% confidence interval)
0.00129 (0.00079, 0.00199) 0.00060 (0.00016, 0.00152) 0.00113 (0.00023, 0.00331) 0.00098 (0.00002, 0.00547) 0.00287 (0.00209, 0.00385)
0.00133 (0.00059, 0.00304)
0.00011 (0.000003, 0.00062) 0.00107 (0.00013, 0.00388) 0 (0, 0.00437) 0 (0, 0.02086) 0.00181 (0.00131, 0.00243)
0.00050 (0.00007, 0.00382)
Figure 27. Perinatal mortality rate for trial of labor versus elective repeat cesarean delivery among all studies
120
Trial of labor N N Death Rate (95% Confidence Interval)*
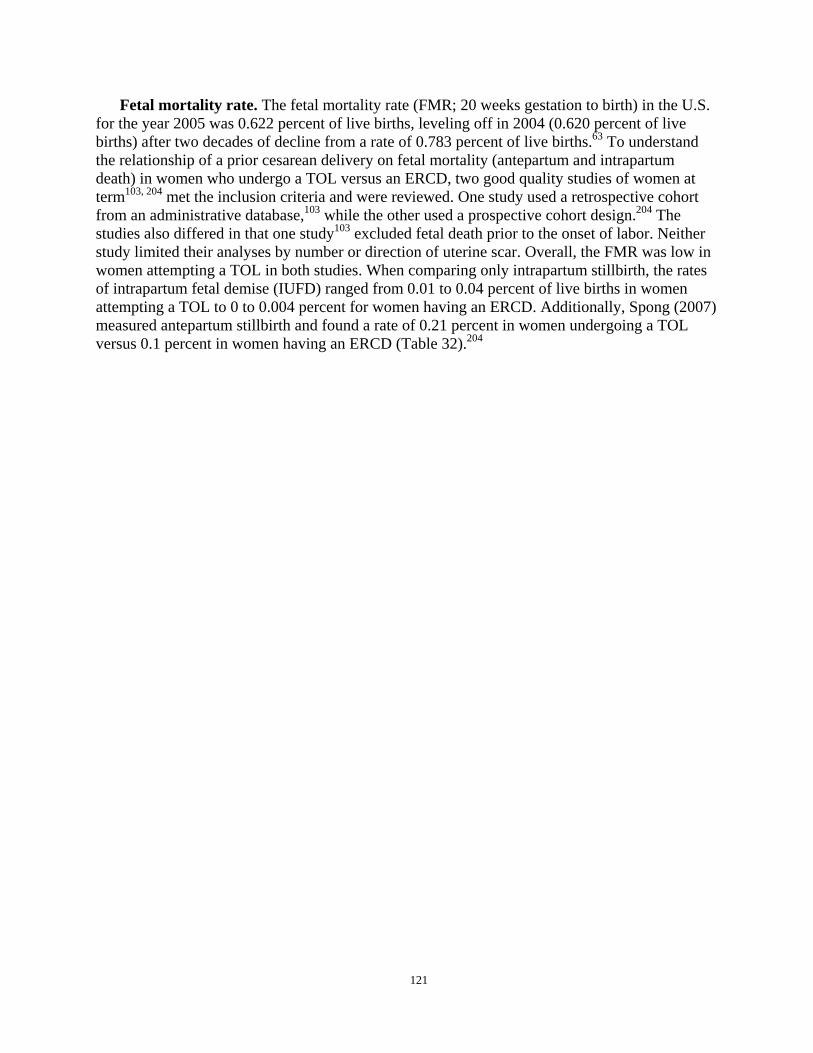
Fetal mortality rate. The fetal mortality rate (FMR; 20 weeks gestation to birth) in the U.S. for the year 2005 was 0.622 percent of live births, leveling off in 2004 (0.620 percent of live births) after two decades of decline from a rate of 0.783 percent of live births.63 To understand the relationship of a prior cesarean delivery on fetal mortality (antepartum and intrapartum death) in women who undergo a TOL versus an ERCD, two good quality studies of women at term103, 204 met the inclusion criteria and were reviewed. One study used a retrospective cohort from an administrative database,103 while the other used a prospective cohort design.204 The studies also differed in that one study103 excluded fetal death prior to the onset of labor. Neither study limited their analyses by number or direction of uterine scar. Overall, the FMR was low in women attempting a TOL in both studies. When comparing only intrapartum stillbirth, the rates of intrapartum fetal demise (IUFD) ranged from 0.01 to 0.04 percent of live births in women attempting a TOL to 0 to 0.004 percent for women having an ERCD. Additionally, Spong (2007) measured antepartum stillbirth and found a rate of 0.21 percent in women undergoing a TOL versus 0.1 percent in women having an ERCD (Table 32).204
121
Table 32. Fetal mortality rate (20 weeks or greater gestation and before birth) among term studies Number of Fetal Deaths
Study, Year Study
Description Years of
Study N Comparison FMR* TOL FMR* IRCD FMR* ERCD Total FMR*
CD Smith, Population 1992 24,529 TOL versus Intrapartum Intrapartum 2002103 based 1997 (Intra- ERCD only stillbirth: stillbirth only:
retrospective partum 7/15,515 0/9,014 cohort data (0.5/1,000) (0/1000) Administrative only) 0.04% Database Term Scotland infants
Spong, Prospective 1999 39,111 1. TOL Antepartum/ Labor: 1.3/2,721 23/23,792 2007204 cohort, MFMU 2002 Term versus ERCD Intrapartum: 1.1/1,077 (1.1/1,000) (1/1,000)
Network infants with labor 32/15,319 (1.8/1,000) 0.05% 0.1% 2. TOL (2.3/1,000) 0.10% Intrapartum-versus ERCD 0.21% No labor: 212/14,992 only: 1/23,792 (without Intrapartum- 2.7/5,002 (0.8/1,000) (0.04/1,000) labor) only:
2/15,319 (0.13/1,000) 0.01%
(1.3/1,000) 0.05%
1.4% 0.004%
*Number of deaths per 1,000 Abbreviations: ERCD=elective repeat cesarean delivery; FMR=fetal mortality rate; IRCD=indicated repeat cesarean delivery; MFMU=Maternal Fetal Medicine Units Network; TOL=trial of labor
122
Neonatal morality rate. Six good or fair quality cohort studies reported on the neonatal mortality rate (NMR) in women undergoing a TOL versus an ERCD (Table 33).79, 93, 103, 204, 228,
283 There was a wide range of hospital settings among the six studies, with two studies representative of academic medical centers,204, 228 two studies representative of population databases,92, 103 and two studies representative of a diversity of hospital types.79, 283 Overall, the neonatal mortality rate for TOL was low with a total of 51 neonatal deaths in a total of 44,485 subjects, for a combined NMR of 0.11 percent (95 percent CI: 0.06 to 0.2 percent). A total of 40 neonatal deaths occurred in 63,843 women who had either an IRCD or ERCD for a combined NMR of 0.6 percent (95 percent CI: 0.02 to 0.15 percent) in the cesarean delivery group (Figure 28). The risk of neonatal mortality was significantly higher for TOL compared with ERCD with a calculated risk difference of 0.058 percent (95 percent CI 0.019 to 0.117 percent), which is equivalent to .58 additional perinatal deaths per 1,000 for TOL.
Two studies provided insight into classifications of patients who appeared to have higher NMRs when compared with subgroups.93, 204 In women who were classified as having high-risk conditions,93 the NMR in the TOL group was 0.38 percent compared with women without high-risk maternal conditions undergoing a TOL (0.13 percent) and women undergoing ERCD (highrisk women: 0.1 percent NMR; no high-risk condition: 0.05 percent NMR). In another study representing the MFMU cohort, Spong et al classified cesarean delivery by IRCD (labor versus no labor) and ERCD (labor versus no labor). In this individual study, the NMR was highest in the IRCD (no labor) at 0.2 percent.204 Overall, there was no difference in the TOL NMR (0.08 percent) versus overall cesarean delivery group NMR (0.08 percent).
While overall rates of perinatal mortality are lower in the reviewed studies in comparison with U.S. data for the general population, a noticeable pattern is the association between country of origin and perinatal death. The three studies conducted in the U.S. 79, 93, 204 reported higher perinatal, fetal, and neonatal mortality, particularly among TOL patients, compared with studies conducted outside of the U.S. The U.S. does have a higher infant mortality rate compared with either the United Kingdom or Canada (0.626 percent, 0.504 percent and 0.485 percent, respectively).285 The studies do not consistently provide details about demographic, societal, or health systems issues to explore the potential contributors.
123
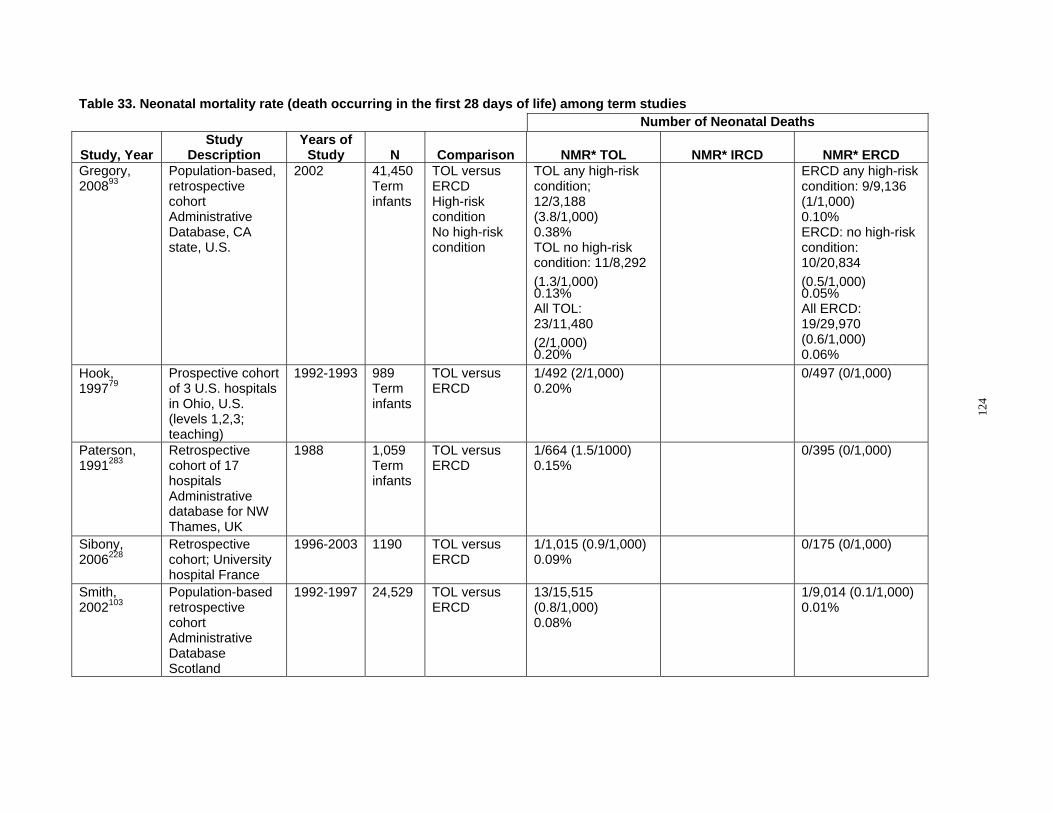
Table 33. Neonatal mortality rate (death occurring in the first 28 days of life) among term studies Number of Neonatal Deaths
Study, Year Study
Description Years of
Study N Comparison NMR* TOL NMR* IRCD NMR* ERCD Gregory, 200893
Population-based, retrospective cohort Administrative Database, CA state, U.S.
2002 41,450 Term infants
TOL versus ERCD High-risk condition No high-risk condition
TOL any high-risk condition; 12/3,188 (3.8/1,000) 0.38% TOL no high-risk condition: 11/8,292 (1.3/1,000) 0.13% All TOL: 23/11,480 (2/1,000) 0.20%
ERCD any high-risk condition: 9/9,136 (1/1,000) 0.10% ERCD: no high-risk condition: 10/20,834 (0.5/1,000) 0.05% All ERCD: 19/29,970 (0.6/1,000) 0.06%
Hook, 199779
Prospective cohort of 3 U.S. hospitals in Ohio, U.S. (levels 1,2,3; teaching)
1992-1993 989 Term infants
TOL versus ERCD
1/492 (2/1,000) 0.20%
0/497 (0/1,000)
Paterson, 1991283
Retrospective cohort of 17 hospitals Administrative database for NW Thames, UK
1988 1,059 Term infants
TOL versus ERCD
1/664 (1.5/1000) 0.15%
0/395 (0/1,000)
Sibony, 2006228
Retrospective cohort; University hospital France
1996-2003 1190 TOL versus ERCD
1/1,015 (0.9/1,000) 0.09%
0/175 (0/1,000)
Smith, 2002103
Population-based retrospective cohort Administrative Database Scotland
1992-1997 24,529 TOL versus ERCD
13/15,515 (0.8/1,000) 0.08%
1/9,014 (0.1/1,000) 0.01%
124

Table 33. Neonatal mortality rate (death occurring in the first 28 days of life) among term studies Number of Neonatal Deaths
Study, Year Study
Description Years of
Study N Comparison NMR* TOL NMR* IRCD NMR* ERCD Spong, 2007204
Prospective cohort, MFMU Network
1999-2002 39,111 TOL versus ERCD 1.With labor 2.Without labor
12/15,319 (0.8/1,000) 0.08%
1.1/1,077 (0.9/1,000) 0.09% 2.10/5,002 (2/1,000) 0.2%
3/2,721 (1.1/1,000) 0.11% 6/14,992 (0.4/1,000) 0.04% Total CD: 20/23,792 (0.8/1,000) 0.08%
*Number of deaths per 1,000 Abbreviations: CA=California; CD=cesarean delivery; ERCD=elective repeat cesarean delivery; IRCD=indicated repeat cesarean delivery; MFMU=maternal-Fetal Medicine Units Network; NMR=neonatal mortality rate; TOL=trial of labor; NW=Northwest; UK=United Kingdom; U.S.=United States
125

Figure 28. Neonatal mortality rate for trial of labor versus elective repeat cesarean delivery among term studies
Trial of labor
Elective repeat cesarean delivery
N Deaths
N Total
Death Rate (95% Confidence Interval)*
0.000 0.002 0.004 0.006 0.008 Death rate (95% confidence interval)
*95% confidence intervals are exact
Paterson, 1991 1 664 Hook, 1997 1 492 Smith, 2002 1 15515 Sibony, 2006 13 1015 Spong, 2007 12 15319 Gregory, 2008 23 11480
Paterson, 1991 0 395 Hook, 1997 0 497 Smith, 2002 1 9014 Sibony, 2006 0 175 Spong, 2007 20 23792 Gregory, 2008 19 29970
Combined (Test for heterogeneity is based on Fisher’s exact text P=0.037)
Combined (Test for heterogeneity is based on Fisher’s exact text P=0.218)
0.00150 (0.00004, 0.00836) 0.00203 (0.00005, 0.01127) 0.00084 (0.00045, 0.00143) 0.00099 (0.00002, 0.00547) 0.00078 (0.00040, 0.00138) 0.00200 (0.00127, 0.00301)
0.00114 (0.00063, 0.00204)
0 (0, 0.00930) 0 (0, 0.00740) 0.00011 (0.000003, 0.00062) 0 (0, 0.02086) 0.00084 (0.00051, 0.00130) 0.00063 (0.00038, 0.00099)
0.00055 (0.00020, 0.00150)
126
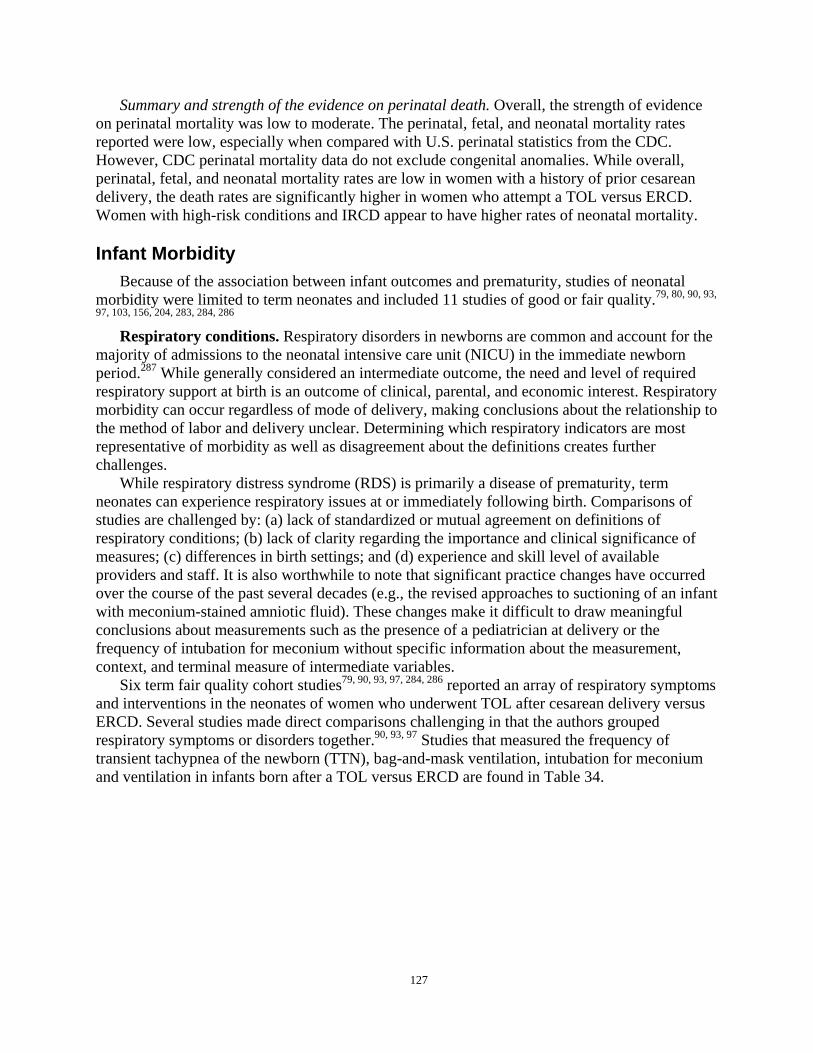
Summary and strength of the evidence on perinatal death. Overall, the strength of evidence on perinatal mortality was low to moderate. The perinatal, fetal, and neonatal mortality rates reported were low, especially when compared with U.S. perinatal statistics from the CDC. However, CDC perinatal mortality data do not exclude congenital anomalies. While overall, perinatal, fetal, and neonatal mortality rates are low in women with a history of prior cesarean delivery, the death rates are significantly higher in women who attempt a TOL versus ERCD. Women with high-risk conditions and IRCD appear to have higher rates of neonatal mortality.
Infant Morbidity Because of the association between infant outcomes and prematurity, studies of neonatal
morbidity were limited to term neonates and included 11 studies of good or fair quality.79, 80, 90, 93,
97, 103, 156, 204, 283, 284, 286
Respiratory conditions. Respiratory disorders in newborns are common and account for the majority of admissions to the neonatal intensive care unit (NICU) in the immediate newborn period.287 While generally considered an intermediate outcome, the need and level of required respiratory support at birth is an outcome of clinical, parental, and economic interest. Respiratory morbidity can occur regardless of mode of delivery, making conclusions about the relationship to the method of labor and delivery unclear. Determining which respiratory indicators are most representative of morbidity as well as disagreement about the definitions creates further challenges.
While respiratory distress syndrome (RDS) is primarily a disease of prematurity, term neonates can experience respiratory issues at or immediately following birth. Comparisons of studies are challenged by: (a) lack of standardized or mutual agreement on definitions of respiratory conditions; (b) lack of clarity regarding the importance and clinical significance of measures; (c) differences in birth settings; and (d) experience and skill level of available providers and staff. It is also worthwhile to note that significant practice changes have occurred over the course of the past several decades (e.g., the revised approaches to suctioning of an infant with meconium-stained amniotic fluid). These changes make it difficult to draw meaningful conclusions about measurements such as the presence of a pediatrician at delivery or the frequency of intubation for meconium without specific information about the measurement, context, and terminal measure of intermediate variables.
Six term fair quality cohort studies79, 90, 93, 97, 284, 286 reported an array of respiratory symptoms and interventions in the neonates of women who underwent TOL after cesarean delivery versus ERCD. Several studies made direct comparisons challenging in that the authors grouped respiratory symptoms or disorders together.90, 93, 97 Studies that measured the frequency of transient tachypnea of the newborn (TTN), bag-and-mask ventilation, intubation for meconium and ventilation in infants born after a TOL versus ERCD are found in Table 34.
127
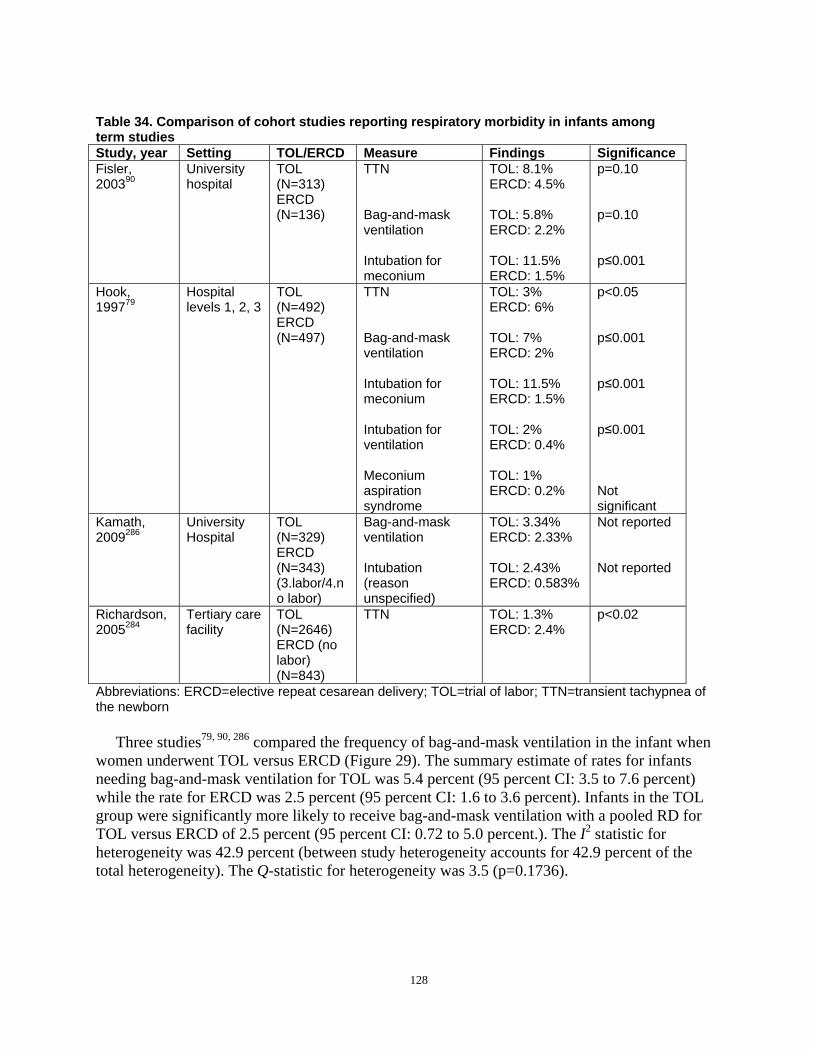
Table 34. Comparison of cohort studies reporting respiratory morbidity in infants among term studies Study, year Setting TOL/ERCD Measure Findings Significance Fisler, University TOL TTN TOL: 8.1% p=0.10 200390 hospital (N=313) ERCD: 4.5%
ERCD (N=136) Bag-and-mask TOL: 5.8% p=0.10
ventilation ERCD: 2.2%
Intubation for TOL: 11.5% p≤0.001 meconium ERCD: 1.5%
Hook, Hospital TOL TTN TOL: 3% p<0.05 199779 levels 1, 2, 3 (N=492)
ERCD ERCD: 6%
(N=497) Bag-and-mask TOL: 7% p≤0.001 ventilation ERCD: 2%
Intubation for TOL: 11.5% p≤0.001 meconium ERCD: 1.5%
Intubation for TOL: 2% p≤0.001 ventilation ERCD: 0.4%
Meconium TOL: 1% aspiration syndrome
ERCD: 0.2% Not significant
Kamath, University TOL Bag-and-mask TOL: 3.34% Not reported 2009286 Hospital (N=329)
ERCD ventilation ERCD: 2.33%
(N=343) Intubation TOL: 2.43% Not reported (3.labor/4.n o labor)
(reason unspecified)
ERCD: 0.583%
Richardson, Tertiary care TOL TTN TOL: 1.3% p<0.02 2005284 facility (N=2646)
ERCD (no labor) (N=843)
ERCD: 2.4%
Abbreviations: ERCD=elective repeat cesarean delivery; TOL=trial of labor; TTN=transient tachypnea of the newborn
Three studies79, 90, 286 compared the frequency of bag-and-mask ventilation in the infant when women underwent TOL versus ERCD (Figure 29). The summary estimate of rates for infants needing bag-and-mask ventilation for TOL was 5.4 percent (95 percent CI: 3.5 to 7.6 percent) while the rate for ERCD was 2.5 percent (95 percent CI: 1.6 to 3.6 percent). Infants in the TOL group were significantly more likely to receive bag-and-mask ventilation with a pooled RD for TOL versus ERCD of 2.5 percent (95 percent CI: 0.72 to 5.0 percent.). The I2 statistic for heterogeneity was 42.9 percent (between study heterogeneity accounts for 42.9 percent of the total heterogeneity). The Q-statistic for heterogeneity was 3.5 (p=0.1736).
128
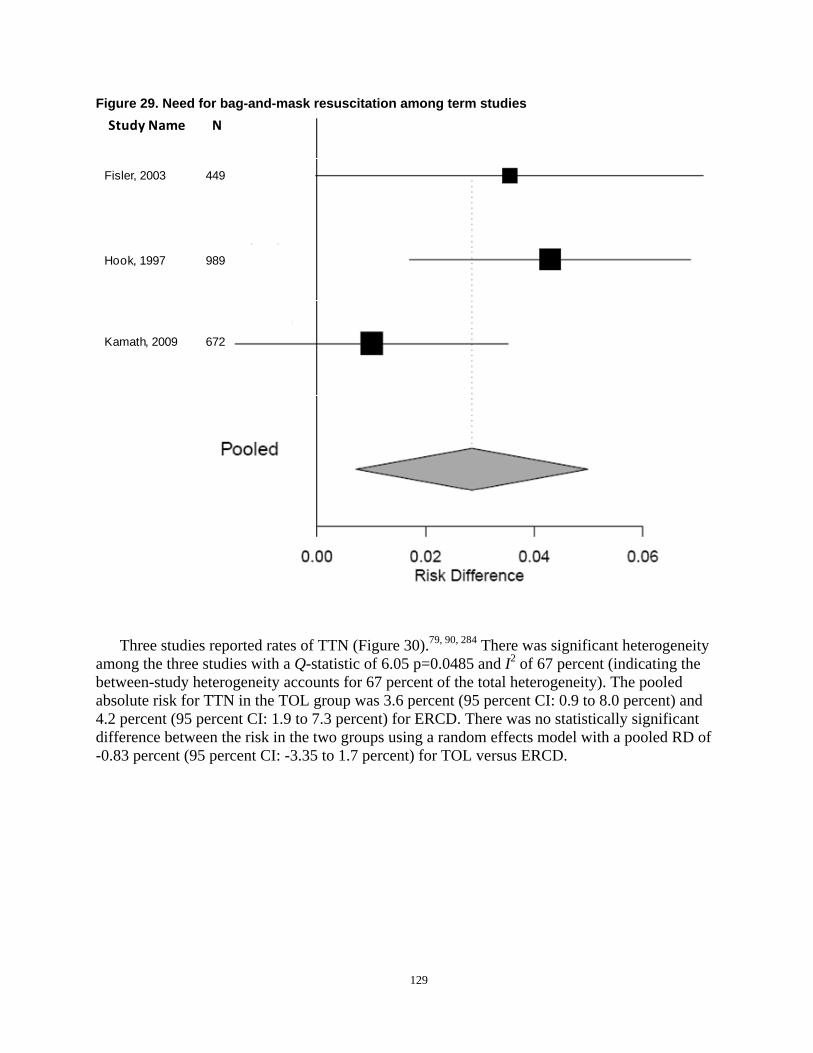
Figure 29. Need for bag-and-mask resuscitation among term studies Study Name N
Fisler, 2003 449
Hook, 1997 989
Kamath, 2009 672
Three studies reported rates of TTN (Figure 30).79, 90, 284 There was significant heterogeneity among the three studies with a Q-statistic of 6.05 p=0.0485 and I2 of 67 percent (indicating the between-study heterogeneity accounts for 67 percent of the total heterogeneity). The pooled absolute risk for TTN in the TOL group was 3.6 percent (95 percent CI: 0.9 to 8.0 percent) and 4.2 percent (95 percent CI: 1.9 to 7.3 percent) for ERCD. There was no statistically significant difference between the risk in the two groups using a random effects model with a pooled RD of -0.83 percent (95 percent CI: -3.35 to 1.7 percent) for TOL versus ERCD.
129

Study Name NStudy Name
Fisler, 2003
Hook, 1997
Richardson, 2004
449
989
3489
N
Figure 30. Rates of transient tachypnea of the newborn for trial of labor versus elective repeat cesarean delivery among term studies
Only two studies79, 90 measured respiratory care of the infant with meconium-stained amniotic fluid. While one study90 measured intubation for meconium, Hook et al79 measured meconium aspiration syndrome. Both studies found respiratory care due to meconium-stained amniotic fluid to be greater in infants undergoing a TOL versus ERCD (Table 34).
One study examined respiratory morbidity occurring in infants born by planned and actual route of delivery (e.g., ERCD with and without labor, VBAC, and TOL resulting in RCD).286
This study found infants born after a TOL resulting in CD required the most bag-and-mask ventilation and intubation, while infants born by ERCD ( with our without no labor) required the most oxygen therapy (blow-by oxygen, continuous positive airway pressure).286
Ultimately, there were very few studies that reported on respiratory outcomes for term infants born by VBAC or ERCD. While infants born after a TOL were more likely to require bag-andmask ventilation compared with infants born by ERCD, other respiratory outcomes revealed no differences between routes of delivery. The fact that there are so few studies that measure respiratory outcomes for term infants is an important issue as respiratory outcomes are very important to clinicians and patients.
Summary and strength of the evidence on infant respiratory morbidity. The strength of evidence on the respiratory morbidity of the infant for VBAC versus ERCD was low due to lack of precision in estimates and inconsistency in findings. Respiratory distress syndrome was not included in this review of the literature because RDS is primarily a disease of prematurity and
130
neonatal outcomes were primarily focused on term neonates to reduce the confounding by prematurity. Studies were conflicting regarding whether VBAC or ERCD resulted in more TTN. Two studies found significantly more infants required intubation for meconium in infants undergoing TOL versus ERCD. is a general lack of consensus among studies regarding what types of respiratory indicators are most representative of health or morbidity.
Hypoxic-ischemic encephalopathy/asphyxia. Hypoxic ischemic encephalopathy (HIE), neonatal encephalopathy, asphyxia, perinatal asphyxia, and hypoxia are terms used in the literature to describe a potentially serious neonatal complications. These descriptors attempt to link a hypoxic event during birth to intermediate and/or long-term neonatal outcomes. Several challenges exist in trying to capture the frequency and severity of such an outcome including lack of agreement regarding definition, timing, and measurement. Proposed criteria to define an acute intrapartum hypoxic event as sufficient to cause a long-term outcome such as cerebral palsy have been advanced by ACOG and the International Cerebral Palsy Task Force.288 The presence of four essential criteria have been proposed in order to link an intrapartum hypoxic-ischemic insult causing a moderate to severe neonatal encephalopathy resulting in cerebral palsy: 1) evidence of metabolic acidosis in fetal umbilical cord arterial blood obtained at delivery (pH less than 7 and base deficit of 12 mmol/L or more), 2) early onset of severe or moderate neonatal encephalopathy in infants born at 34 or more weeks' gestation, 3) cerebral palsy of the spastic quadriplegic or dyskinetic type, and 4) exclusion of other identifiable etiologies, such as trauma, coagulation disorders, infectious conditions, or genetic disorders.288
Three fair quality cohort studies attempted to measure this phenomenon in some manner.80, 93,
284 Gregory et al, in a large, population-based study, measured the frequency of hypoxia (by ICD-9 codes) in high- and low-risk women who underwent TOL and ERCD at term.93 High-risk antepartum conditions contributing to neonatal hypoxia in women with a prior cesarean delivery were antepartum bleeding (odds ratio 2.9; 95 percent CI: 1.3 to 6.6) and oligohydramnios (odds ratio 2.5; 95 percent CI: 1.1 to 5.7). Overall, there was little difference in the frequency of hypoxic events (defined by ICD 9 category codes 768.0,1,2,3,4,5,6,9) in infants born to mothers with no high-risk clinical condition (TOL: 0.89 percent, ERCD: 0.32 percent) versus infants whose mothers had any number of high-risk clinical conditions (TOL: 1.29 percent versus ERCD: 0.20 percent). Landon et al, as part of the MFMU cohort, measured but did not offer a definition of HIE.80 This study did not find the frequency of HIE to be significantly different in term women with one prior cesarean delivery compared with those with multiple prior cesarean deliveries (0.1 percent versus 0, p=1.0) or when comparing TOL versus ERCD in women with multiple prior cesarean deliveries (0 versus 0). Richardson et al used a very different approach from either of the other two and measured and reported on umbilical cord pH.284 This study found a slight decrease in the mean cord pH of women undergoing a TOL versus women who had an ERCD with no labor (7.24±0.07 versus 7.27±0.05, p< 0.001). There was a statistically significant difference in base excess in the TOL versus ERCD group (-5.3mmol/L ±3.1 versus 2.9mmol/L±2.5, p< 0.001). There were no significant differences in infants with umbilical artery pH of less than 7.00 in the same groups (TOL: 0.5 percent versus ERCD without labor: 0.1 percent, p=NS).
Summary and strength of the evidence on infant respiratory morbidity The strength of evidence on the HIE of the infant for VBAC versus ERCD was low due to lack of consistency in measurement and few studies. While the studies consistently report higher risk for HIE for TOL compared with ERCD, it is not possible to know the true relationship due to the low strength of overall evidence.
131
Sepsis Three fair quality cohort studies were found to address sepsis in the neonates of women who
attempted a VBAC versus ERCD.79, 90, 97 Fisler et al found that neonates in a university setting who had a TOL had significantly more sepsis evaluations than did infants who underwent ERCD (23.3 versus 12.5 percent, p=0.0008) and significantly more antibiotic treatments (11.5 versus 4.4 percent, p=0.02).90 The absence of predefined criteria for a sepsis evaluation and subsequent antibiotic therapy make interpretation of these results difficult. However, the impact of these interventions are not insignificant as the authors note that an evaluation for sepsis consisted of a complete blood count, blood culture, with lumbar puncture performed at the discretion of the practitioner. Sub analysis of the TOL neonates found increased sepsis evaluations and antibiotic therapy in the TOL group with an epidural compared with TOL neonates without an epidural (29.6 versus 6.0 percent, p=0.0001). Loebel et al also measured “suspected” sepsis, but found no significant differences in neonates born after a TOL versus those delivered by ERCD (3.5 versus 2.7 percent, p= 0.38).97
Hook et al similarly reported the incidence of sepsis in neonates who underwent TOL versus those delivered by ERCD. This study was unique in that it was conducted in three hospital settings (Level 1, 2, and 3) and measured the incidence of proven sepsis as well as suspected sepsis.79 While suspected sepsis was significantly increased for neonates born by VBAC compared with infants born after a TOL who then delivered by cesarean (12 versus 2 percent, p= 0.001), there were no statistically significant differences between these groups when the outcome was “proven sepsis” (three infants [two percent] versus one infant [0.3 percent], p=NS). Infants without “proven sepsis” still received blood cultures and antibiotic therapy, but were not considered proven to be septic unless a positive blood culture was obtained.
Summary and strength of the evidence on sepsis The overall strength of evidence for the impact of route of delivery upon infant sepsis is low due to imprecise and inconsistent definitions and few studies. While existing studies suggest that there is no significant difference between TOL and ERCD, serious limitations prevent a true understanding of the relationship between route of delivery and sepsis.
Birth Trauma Two fair quality studies90, 93 provided information regarding neonatal trauma. In a large,
population based study, Gregory et al found the frequency of trauma to be higher in women who attempted VBAC versus ERCD, regardless of whether the mother had a high-risk clinical condition (3.73 percent attempted VBAC versus 0.77 percent ERCD).93 Subanalyses found that among women who attempt VBAC those with a history of substance abuse were more likely to have neonatal trauma (odds ratio 4.4; 95 percent CI: 1.1 to 18.2) as were those with ruptured membranes longer than 24 hours (odds ratio 4.2; 95 percent CI: 1.7 to 10.2). This study used ICD-9 codes to define trauma (763.1,2,3,4; 7.67.2,3,4,5,6,7,8,9). These codes represented fetal malpositions and varying types of delivery affecting the fetus, as well as skeletal, nerve, and cranial injuries.
In a prospective cohort study comparing neonatal outcome in low-risk women at term undergoing a TOL and low-risk women at term electing a RCD, Fisler et al measured mild bruising (defined as bruising confined to a single extremity) as well as birth injury (not defined).90 There was a significant increase in the number of infants who had mild bruising in the TOL group compared with the ERCD group (TOL: 8 percent versus ERCD: 1.5 percent,
132
p=0.0008); however no statistically significant differences were noted between TOL versus ERCD for birth injury (TOL: 1 percent versus ERCD: 1.5 percent, p=0.6). In this study, birth injury was not defined, but the authors noted three infants in the TOL group had cephaohematoma, while two infants in the ERCD group (no labor; scheduled repeat cesarean delivery group) experienced facial nerve palsy.
Summary and strength of evidence on birth trauma The overall strength of evidence for the impact of route of delivery on birth trauma is low largely due to few studies. While existing studies suggest that there a nonsignificant increase in birth trauma for TOL, serious limitations prevent a true understanding of the risk of birth trauma for VBAC compared with ERCD.
Apgar Scores While Apgar scores suffer from subjectivity and have little long-term predictive value, it is
an established and accepted part of the neonatal assessment at the time of delivery. Four good or fair quality cohort studies79, 90, 103, 284 all reported no significant difference in 5 minute Apgar scores between infants in TOL groups versus infants in ERCD groups.
Hook et al found no significant differences in an Apgar score of six or less at 5 minutes in infants who underwent a TOL (6/492, 1 percent) versus ERCD (3/497, 1 percent).79 Closer examination of the TOL group found significantly fewer neonates had an Apgar score of six or less at 5 minutes if they underwent a VBAC versus when the TOL resulted in a cesarean delivery (26/336, 8 percent versus 22/156, 14 percent, p<0.05). In a fair quality study, Richardson et al similarly found no significant differences in an Apgar score less than seven at 5 minutes in women who underwent a TOL after cesarean delivery versus those who underwent an ERCD (odds ratio 0.5; CI 95 percent 0.2 to 1.2. p= NS).284 However, in a smaller retrospective cohort, fair quality study, Fisler et al found no significant difference in neonates with an Apgar score of less than seven at 5 minutes between neonates who underwent a TOL (regardless of whether they had a VBAC) versus ERCD (1 percent versus 0, p=0.06).90 Smith et al, in a large, fair quality population study, found that while the overall incidence of very low Apgar (less than four) at 5 minutes was rare, it occurred more frequently in infants who underwent a TOL (than among those who were delivered by an ERCD (105/15,515 [0.68 percent] versus 40/9014 [0.44 percent] p=0.02).103
Summary and strength of evidence on birth trauma. Four studies found no differences in Apgar scores of less than six and seven at 5 minutes in infants undergoing a TOL versus ERCD. Three studies examined the differences in low Apgars (less than seven) at 5 minutes in VBAC versus RCD after a TOL; two of these studies found no difference in Apgar scores of infants born by VBAC versus RCD after a TOL. Future studies that include Apgar score results in their measures of morbidity could be improved by further followup of infants with low Apgar scores as an Apgar score is an intermediate measure of infant health, as well as close attention to classification of exposure to labor and delivery outcome.
Neonatal Intensive Care Unit Admissions Admission to the NICU is a frequently measured short-term neonatal outcome and has been
used as a proxy for serious morbidity. The significance of admission to the NICU can vary by hospital setting, provider experience, provider availability, and pre-established admission criteria. The amount of time a neonate spends in a NICU can vary from a short observation period to a lengthy stay, reflecting the severity of the neonate’s condition.
133
Eight studies that measured NICU admission met the criteria for review,78-80, 90, 97, 156, 284, 286
but none explicated the criteria for NICU admission despite the existence of an American Academy of Pediatrics (AAP) policy statement on levels of neonatal care.289 While admission to a NICU can occur for multiple reasons, it is generally agreed that admission to the NICU results in separation of the neonate from its mother as well as contributing to an increase in the cost of healthcare. Three studies78, 80, 156 used reported on the same MFMU cohort. In a fair quality study on risk of uterine rupture in women undergoing TOL, Landon et al isolated term neonates to measure the frequency and likelihood of NICU admission in women who underwent TOL with one previous cesarean delivery compared with women with multiple cesarean deliveries.80 Of the 17,898 women in the study, 95 percent had only one prior cesarean; the remainder of women undergoing TOL (N= 975) had two, three, and four prior cesareans. Nine percent of the term neonates whose mothers had one prior cesarean were admitted to the NICU compared with 11.2 percent of the neonates whose mothers had greater than one prior (odds ratio 1.53; 95 percent CI: 1.19 to 1.96, p=0.05); however this study did not find multiple prior cesareans to be predictive of uterine rupture (odds ratio 1.36; 95 percent CI: 0.69 to 2.69, p=0.37). Grobman et al, in a good quality study from the MFMU cohort, examined the effect of IOL on perinatal outcomes in neonates at term with one prior cesarean differentiating between one prior vaginal delivery and no previous vaginal delivery.156 There were no significant differences in admission to the NICU regardless of type of labor (spontaneous, induced , augmented) or whether women had a pervious vaginal delivery (odds ratio 1.19; 95 percent CI: 0 to 1.47) or no prior vaginal delivery (odds ratio 1.03; 95 percent CI: 0.85 to 1.24). In another study of good quality from the MFMU cohort, Hibbard et al set out to determine whether morbidly obese women have greater maternal and perinatal morbidity with TOL compared with ERCD.78 In this secondary analysis she found an increased incidence in the frequency of admission of term neonates to the NICU in women who were obese/morbidly obese (10 percent/13.8 percent) compared with women with a normal BMI (7.4 percent) or who were overweight (7.7 percent, p<0.001). However, neonates of morbidly obese women undergoing TOL were no more likely than neonates of women who had ERCD to experience admission to the NICU (13.8 versus 12.6 percent, odds ratio 1.1; 95 percent CI: 0.9 to 1.3 percent).
The remaining five studies79, 90, 97, 284, 286 addressing frequency and likelihood of NICU admission are summarized in Table 35. Two studies attempted to distinguish NICU admission after delivery by VBAC or RCD after TOL. In a study of good quality across all three hospital levels ,Hook et al found no significant increase in admissions to a Level 3 NICU in neonates born by TOL compared with ERCD (3 versus 2 percent, p=NS), but found significantly more neonates admitted to NICU if they were born by RCD following a TOL compared with those born by VBAC (7 versus 2 percent, p< 0.007).79 Similarly, Kamath et al, in a fair quality study, also found that RCD after TOL increased the likelihood of NICU admission (odds ratio 2.26; 95 percent CI: 0.85 to 6.0, p=0.10).286 However, the greatest likelihood of admission to the NICU (adjusted for multiple covariates of maternal education level, chronic, disease, amniocentesis, choriamnionitis, non-reassuring fetal heart tones, and GA by week) was for term infants who did not experience labor and were born by ERCD (odds ratio 2.93; 95 percent CI: 1.28 to 6.72, p=0.011).
While costs associated with care vary greatly by setting and region of the U.S., Kamath et al analyzed neonatal length of stay and found neonates born by VBAC stayed 3 days on average compared with 4 days for ERCD (with or without labor) and RCD after TOL (p<0.001).286
134

Summary and strength of evidence on neonatal intensive care unit admissions. Overall the strength of evidence on the impact of route of delivery on NICU admission is low due to inconsistent and imprecise measures. No studies defined the criteria for admission to the NICU. Six studies found no significant differences in frequency of NICU admissions between TOL and ERCD whereas one reported the greatest risk for NICU admission in infants undergoing an ERCD without labor (odds ratio 2.93) versus a successful VBAC (odds ratio 1.0). Future studies would benefit by description of NICU admission criteria, the reason for admission, and level of support provided to the infant.
135

Table 35. Neonatal intensive care unit admissions among term studies Study, year Design/Population N Comparison NICU measurement Outcome Fisler, 200390 Prospective cohort
University hospital 449 1. TOL versus ERCD
2.TOL with epidural versus TOL without epidural
Any NICU admission 1.TOL (26.2%) versus ERCD (17.6%), p= 0.001 2.TOL w/epidural (5.2%) versus TOL w/o epidural (1.2%), p=0.2
Hook, 199779 Prospective cohort Level 1, 2, 3 hospital settings
989 1. TOL versus ERCD 2. VBAC versus TOLCD
NICU admission 1. TOL (3%) versus ERCD (2%), p=NS 2. VBAC (2%) versus TOL-CD (7%), p< 0.007
Grobman, 2007156
Prospective cohort MFMU 19 academic medical centers
11,778 1.No prior VD (SL v. IOL) 2.Prior VD (SL v. IOL)
Special care nursery admission
1.OR 1.03 2.OR 1.19
Hibbard, 200678
Prospective observational cohort MFMU 19 academic medical centers
28,446 TOL versus ERCD in obese women
NICU admission by BMI
Obese TOL (13.8%) versus ERCD (12.6%),OR 1.1
Landon, 200680
Observational cohort MFMU 19 academic medical centers
17,890 1.TOL in women with 1 prior CD 2.TOL in women with >2 prior CD
NICU admission not specified
1 prior CD (9%) versus multiple prior CD (11.2%), OR 1.28
Loebel, 200497
Retrospective cohort Large community hospital affiliated with a university
1,408 1.TOL versus ERCD 2.VBAC versus ERCD 3. TOL-CD versus ERCD
NICU admissions 1. TOL (4.2%) versus ERCD (5.6%), p= 0.24 2.VBAC (3.7%) versus ERCD (5.6%), p= 0.12 3. TOL-CD (6.2%) versus ERCD (5.6%) p= 0.78
Richardson, 2005284
Prospective cohort Tertiary care hospital
3,489 TOL versus ERCD (no labor)
1.NICU triage 2.NICU admission 3.NICU stay > 7 days
1.TOL (0.8%) versus ERCD (1.5%), Adjusted OR 2.0, p=0.06 2. TOL (8.8%) versus ERCD (8.3%) Adjusted OR 0.8, p=NS 3. NICU >7 days TOL (0.9%) versus ERCD (0.6%) Adjusted OR: 0.4 (0.1-1.1) p=0.08;
136

Table 35. Neonatal intensive care unit admissions among term studies Study, year Design/Population N Comparison NICU measurement Outcome Kamath, 2009286
Retrospective cohort university hospital
672 Planned TOL VBAC TOL-CD ERCD Labor No labor
NICU Admission Planned TOL OR 1.0 OR 1.91 ERCD OR 2.26 OR 2.93
Abbreviations: CD=cesarean delivery; ERCD=elective repeat cesarean delivery; MFMU=Maternal-Fetal Medicine Units Network; NICU=neonatal intensive care unit; NS=not significant; OR=odds ratio; TOL=trial of labor; TOL-CD=trial of labor followed by a cesarean delivery; VBAC=vaginal birth after cesarean; VD=vaginal delivery
137
Breastfeeding No studies were found that explored the effect of a TOL versus an ERCD on breastfeeding
initiation or continuation.
Impact of the Mode of Delivery on Subsequent Babies Two fair quality studies were found addressing the impact of a previous cesarean delivery on
subsequent unexplained stillbirth in the next pregnancy.280, 281 Smith et al, using linked discharge data from a large, population database in Scotland, estimated the risk of antepartum stillbirth in a second pregnancy comparing women with a previous cesarean (N=17,754) to women with no previous cesarean.281 The study group included women with a second pregnancy from 1992 to 1998 and excluded fetuses less than 500 grams, deaths due to congenital anomalies, and rhesus isoimmunization. There were 68 stillbirths in the previous cesarean delivery group. After attributed causes for the stillbirths (e.g., toxemia, hemorrhage, mechanical, maternal issues) were noted, there were more unexplained stillbirths found in the previous cesarean delivery group (43 unexplained stillbirths out of 17,754 births or 0.24 percent of births) compared with women without a prior scar (163 unexplained stillbirths out of 102,879 births or 0.16 percent of births). Adjusting for maternal and demographic characteristics did not lessen the association between previous cesarean and unexplained stillbirth. Smith also used time-to-event analyses to predict the prospective risk of a stillbirth at 39 weeks or greater gestation to be 0.11 percent of women compared with 0.05 percent of women without a prior cesarean delivery. The authors noted that despite a wealth of clinical and demographic data in the dataset they did not have access to maternal weight, and therefore were unable to adjust for BMI and obesity as a maternal risk factor.
In another large U.S. dataset, Bahtiyar et al conducted a cross-sectional study of singleton, term pregnancies from 1995 to 1997 in women with a prior cesarean delivery compared with women without a prior cesarean delivery, excluding any underlying maternal or fetal abnormality.280 Women were stratified in order to detect the study group of interest and to reduce potential confounders, with the final group of women with only one prior delivery (cesarean versus vaginal birth). Rate of stillbirth in the subsequent pregnancy was compared between the two groups. While not statistically significant, there were fewer stillbirths in the previous cesarean group compared with women without a prior cesarean in the second pregnancy (0.072 percent of births compared with 0.080 percent of births, RR 0.90; 95 percent CI: 0.076 to 0.106 percent). While this study is strengthened by its large cohort size (1.7 million for comparison in the study group described), it was difficult to determine the exact number of cases in each current pregnancy group. The authors did not attempt to classify stillbirths by cause and based study data on birth and death certificates.
Summary of mode of delivery on subsequent babies. Two studies were reviewed to determine the risk of stillbirth in subsequent pregnancies in women with a prior cesarean delivery. These studies produced conflicting results with one study showing that prior cesarean increases the risk for unexplained stillbirth in next pregnancy and the other study showing no difference in risk for stillbirth in the next pregnancy. One study included early gestations, while the other study was limited to term gestations. Both studies are limited by their retrospective design and relied on large perinatal databases while employing various methodologies to overcome confounding.
138
Neurological Development No studies were found that measured the impact of a TOL versus an ERCD on neonatal
neurological development. In order to examine the neurological development, studies that extend beyond the immediate postpartum period would be required.
Special Considerations Impact of induction upon infant outcomes. Prostaglandin E2. Several studies reported the rate of infants with Apgar scores of less than
seven at 5 minutes among those with PGE2 induction, ranging from 0 to 8 percent, but rates were similar to the control group in each individual study.145, 148, 149, 153, 161, 168 Other infant harms were not reported consistently.
Misoprostol. Evidence for infant harms associated with misoprostol used for cervical ripening and labor induction is not adequate to make conclusions. As described in previous sections, a small cohort study (N=226) of term gestations, comparing PGE2 (administered as a gel or pessary) with misoprostol (25 to 50 mcg) included only 16 of 145 women in the misoprostol group and nine of 81 in the PGE2 group who had a history of a prior cesarean delivery.211 Only the results for uterine rupture were stratified by history of a prior cesarean with two of 16 in the misoprostol group (13 percent) and zero of nine in the PGE2 group having a low transverse rupture. In one case, the Apgar scores were two and seven at 1 and 5 minutes respectively, and the neonate’s outcome was good. The other resulted in a stillbirth. The only other study made comparisons among women with a history of prior cesarean delivery to those without prior cesarean delivery (with no limit on GA), a comparison that is not relevant to this review.172 Among the group with a prior cesarean delivery and a TOL with misoprostol for cervical ripening (N=48) fetal distress was reported in 23 percent, and 13 percent of infants had an Apgar score of less than seven at 5 minutes.
Mifepristone. In a small (N=32), fair quality trial of mifepristone compared with placebo— each given for 2 days followed 2 days later by induction with prostaglandins, oxytocin, and/or artificial rupture of membranes as needed in women with term gestations—neonatal outcomes were similar between groups, but one baby in the mifepristone group had hypoglycemia at birth.173
Oxytocin versus prostaglandin. None of the studies comparing oxytocin and PGE2 for induction stratified neonatal outcomes based on which drug was used.
Mechanical methods of induction. Reporting of infant harms was inadequate in the limited number of studies of mechanical induction to allow comparative assessment.
Macrosomia. Fetal macrosomia is a common obstetric condition known to present in approximately 10 percent of all infants in the U.S. and has the potential to influence the route of delivery on infant outcomes. Though there is inconsistency in definitions, macrosomia most commonly is used to refer to fetal weights greater than 4,000 or 4,500 grams. Clinicians are frequently called upon to weigh the risks and benefits of a TOL after a prior cesarean delivery in women with suspected fetal macrosomia. Neither ultrasound nor physical examination is able to accurately estimate fetal weight.
Eleven good or fair quality studies reported on the impact of fetal macrosmia on infant outcomes for VBAC compared with ERCD.60, 78, 117, 123, 124, 126, 139, 161, 188, 221, 267 Studies that examined the relationship of fetal macrosomia and uterine rupture as well as the incidence of macrosomia in the presence of maternal obesity are also discussed.
139
The incidence of macrosomia increases as gestational age increases. Rates of macrosomia increased from 2 percent in a cohort of preterm women to 9.1 percent of women at term to 25.5 percent of women at 41 weeks or greater.60
Nine studies were reviewed that addressed the VBAC rate within cohorts when the birth weight exceeded 4,000 grams.60, 117, 123, 124, 139, 146, 161, 221, 267 Five of these studies used regression analyses to compute the likelihood of VBAC or RCD after TOL based upon birth weight greater than or less than 4,000 grams.123, 124, 139, 146, 267 In a retrospective cohort study of good quality, Bujold et al evaluated VBAC in women according to their BMI (N=8580) and found women who delivered infants weighing 4,000 grams or greater were less likely to have a VBAC (odds ratio 0.62; 95 percent CI: 0.54 to 0.71, p<0.001).267 This study excluded patients with known pregestational diabetes, but did not control for gestational diabetes or for the indication for prior cesarean delivery, which is acknowledged to influence VBAC rate.
The majority of studies reported the relationship of VBAC in infants weighing greater than 4,000 grams with those weighing less than 4,000 grams.60, 126, 139, 161, 188, 221, 267 Two fair quality studies117, 124 furthered their analyses by examining VBAC rates in mothers whose infants weighed greater than 4,000 grams and less than 4,500 grams. Without controlling for parity, number of prior cesarean deliveries, or vaginal births, El-Sayed et al found a higher VBAC rate in women delivering infants greater than 4,000 grams (11.6 percent) compared with women delivering infants greater than 4,500 grams (1.3 percent, p<0.001).124 Birth weight greater than 4,000 grams was associated with a RCD after a TOL (odds ratio 2.65; 95 percent CI: 1.70 to 4.13). Likewise, in a prospective descriptive study of women in 25 free-standing birth centers in the U.S., Lieberman et al found a VBAC rate of 17.4 percent in women whose infants weighed 4,000 to 4,499 grams compared with 5.8 percent in women whose infants weighed 4,500 grams or greater.117
Elkousy et al, in a fair quality study, differentiated VBAC rates in women delivering macrosomic infants into two categories (4,000 to 4,249 grams and 4,250 to 4,500 grams) as well as comparing VBAC rates in women with infants weighing less than 4,000 grams versus those whose infants weighed greater than 4,000 grams and greater than 4,500 grams.123 The adjusted incidence ratios for VBAC were reduced only slightly in each infant weight category: 4,000 to 4,249 grams (0.85; 95 percent CI: 0.77 to 0.93); 4,249 to 4,500 grams (0.77; 95 percent CI: 0.66 to 0.89); greater than 4,500 grams (0.70; 95 percent CI: 0.57 to 0.077).
Three studies examining the relationship of neonatal macrosomia in women with increased BMI and VBAC were reviewed.78, 126, 267 The impact of increasing maternal weight gain on VBAC rate was previously discussed in the section on Special Considerations of maternal outcomes. In a good quality retrospective cohort of women (N=6718) undergoing a TOL, Bujold et al noted increases in the mean birth weight of infants and rates of macrosomia as maternal BMI increased.267 Likewise, in a secondary analysis of a prospective good quality study, Hibbard et al noted a significant increase in the birth weights of women of normal BMI (3,196±445 grams), compared with women who were overweight, obese, or morbidly obese (3,370.5±451.3, 3,4692±471.5, 3,493.8±503.4, p<0.001).78 While no separate analysis was performed on infants specifically weighing 4,000 grams or greater in this study, it is clear from these two studies there is positive correlation of increased birth weight with increasing maternal BMI. A fair quality study by Goodall et al also found that compared with women with a normal BMI, morbidly obese women were more likely to have infants greater than 4,000 grams (p=0.004).126
There were no studies that examined neonatal trauma in infants whose birth weights exceeded 4,000 grams.
140

Summary of macrosomia. There is a trend toward an increase in mean birth weight as maternal BMI increases. There is evidence for a decreased likelihood of VBAC in infants weighing 4,000 grams or greater (odds ratio 2.65); this trend is more pronounced in infants weighing 4,500 grams or greater compared with less than 4,500 grams (1.3 percent if greater than 4,500 grams versus 11.6 percent if less than 4,500 grams, p<0.001).
Fetal presentation. No studies were found that measured the impact of fetal presentation on the benefits or harms of a TOL versus an ERCD.
Gestational age. Because of the potential confounding for neonatal harms introduced by preterm gestation, a review of neonatal benefits and harms after a TOL versus an ERCD were limited to term infant outcomes. One fair quality study of term infants by Kamath et al reported selected neonatal outcomes at 37, 38, 39, 40, and greater than or equal to 41 completed weeks of gestation.286 Because neonatal outcomes were compared by GA rather than denoting the intended mode of delivery in this study, it is impossible to draw any conclusions regarding the influence of GA on neonatal outcomes in women who attempt a TOL versus ERCD.286
Recent recommendations by ACOG state that infants not be delivered by ERCD or elective IOL before 39 weeks due to the increased risk of iatrogenic prematurity and the potential for respiratory complications. Likewise, post term pregnancies carry an increased risk of complications (e.g., meconium passage and non-reassuring fetal heart rate patterns), potentially influencing the route of delivery. While the study by Kamath et al stratified neonatal outcomes by GA and found that infants delivered at 37 weeks had the highest rates of oxygen use in the delivery area (38.8 percent, p=0.003) and the most admissions to the NICU (15 percent, p=0.018), they do not go on to stratify those outcomes by the intended or actual mode of delivery. Future studies that examine the influence of GA on VBAC rate compared with RCD after TOL and ERCD are warranted.286
Summary of gestational age. Analysis was limited to term neonates due to the potential for confounding for neonatal harms introduced by preterm gestational age. Only one study reported selected neonatal outcomes by gestational age in the term infant, but did not classify the infant by mode of delivery. There is insufficient data to determine that gestational age in term neonates influences benefits or harms to the neonate undergoing TOL versus ERCD.
141
1
1
Chapter 4. Discussion Each year 1.5 million childbearing women have cesarean deliveries, and this population
continues to increase. While cesarean deliveries represent a third of all births, they account for almost half of the childbirth-related expenses of hospitalization at $7.8 billion annually.1
Therefore, the appropriate and safe use of cesarean and vaginal birth after cesarean (VBAC) is not only an individual patient- and provider-level concern but it is also a national health policy concern.
Prior cesarean delivery is the most common indication for cesarean, accounting for over a third (534,180,000) of cesarean deliveries, almost twice the rate of any other indication. Thus, an important contributor to the increase in cesareans is the rapid decline in VBACs witnessed over the last decade. In 2007, only 8.7 percent of childbirth-related hospitalizations among women with a previous cesarean delivery were VBACs, suggesting that over 90 percent of all women with a previous cesarean will deliver by planned or elective repeat cesarean delivery (ERCD).
One of the major findings of this report is that the best evidence suggests that VBAC is a reasonable and safe choice for the majority of women with prior cesarean. Moreover, the report raises concerns over the serious morbidity accruing from multiple cesareans, a result of the increased use of ERCD over VBAC. In addition to health outcomes, some relatively unexamined contextual factors relating to VBAC drive patient, provider, hospital, and policy decisionmaking. Regional-, hospital-, and individual-level liability have all been associated with increased cesarean delivery rates. Even a perception of increased risk for liability was reported to be associated with increased use of cesarean. Similarly, some data suggest that economic incentives appear to affect cesarean delivery rates. It is financially untenable for many rural hospitals to offer the 24-hour in-house availability that is suggested to allow VBAC as an option. Economic incentives may need to be changed to prioritize access to VBAC services. Patients and providers are influenced by the short- and long-term benefits and risks of route of delivery as well as family obligations, costs, societal norms, and regional availability of options. Although studies of VBAC are numerous, the numbers of studies providing high quality information on important clinical questions are limited.
The literature concerning trial of labor (TOL) and ERCD is flawed in several ways: imprecise measurement of outcomes (e.g., maternal infection, perinatal death), making it difficult to determine the portion of events directly attributable to route of delivery; lack of standards for terminology (e.g., no standard classification for severity of health consequences related to uterine rupture); and limited attention to comparability between groups (e.g., studies of ERCD in which it is unclear whether patients were eligible for TOL). Data on maternal and infant outcomes, of great interest to most patients, suffer from a lack of standardization of terminology and measurement. This is especially highlighted by the trends seen with studies reporting both hemorrhage and transfusion in TOL and ERCD. In studies where hemorrhage was reported as higher in one group, the transfusion rates were lower. Additionally, alternative interventions to transfusion, such as IV iron therapy, were not reported. Investigations into the neonatal effects of ERCD and VBAC suffer even greater problems of measurement, lack of standardization, and insufficient data. How, then, are these studies to be interpreted by the individual clinician, much less combined for guidance? Further complicating interpretation are both the unreported societal and monetary costs of intervention associated with these modes of delivery. This highlights a
Appendixes and evidence tables cited in this report are available at http://www.ahrq.gov/downloads/pub/evidence/pdf/vbacup/vbacup.pdf.
143
particular problem with the research in this area; the easiest outcomes to measure are not generally the outcomes most pertinent to the clinician or the patient.
Studies of VBAC versus ERCD have traditionally reported outcomes based upon actual route of delivery rather than intended route, leading to misclassification of patients who intend ERCD but go into labor prior to their cesarean or women who intend TOL but who are delivered by cesarean. A good demonstration of the complexity of this issue comes from the first National Institute of Child Health and Human Development Maternal-Fetal Medicine Units Network (MFMU) studies. The studies report on 45,988 women with singleton gestation and prior cesarean delivery at term. The original article by Landon published in 2004221 considered women who presented in labor at 4 cm or greater cervical dilation or anyone receiving oxytocin in the TOL group; and women who presented in early labor who subsequently underwent cesarean were excluded. Ultimately, 12,289 women (27 percent of population at term with prior cesarean delivery)--9,013 who had an indicated repeat cesarean delivery (IRCD) and 3,276 women who presented in early labor and subsequently delivered by cesarean delivery--were excluded from the analysis. Thus Landon’s analysis presented data for 33,699 women: 17,898 women classified as undergoing TOL and 15,801 undergoing an ERCD. Uterine rupture rates in these two groups were 124/17,898 (0.7 percent) in TOL versus 0/15,801 (0 percent) in ERCD. A subsequent analysis performed by Spong in 2007204 aimed to provide information that would be clinically useful to the clinician providing antepartum counseling for VBAC and classified patients quite differently. She broke the group into three main categories: TOL (15,323), ERCD (17,714, without medical indication), and IRCD (6,080). Ultimately, not only did she include 5,418 additional patients for a total of 39,117, but 2,575 women who were initially considered TOL in Landon’s study were now distributed to either IRCD or ERCD with labor. While this reclassification did not change the uterine rupture rate for the TOL group (0.74 percent in Spong204 versus 0.7 percent for Landon221), it substantially changed the uterine rupture rate among the ERCD group (without indication).
The design of most studies, including the largest and widely cited Spong study discussed above, render them unable to identify the ideal population - women who plan VBAC or plan RCD. The evidence from these studies is at best indirect and difficult to apply to a woman who plans for either option. These studies also lack data concerning important contextual factors such as whether and how hospital structure, setting, staffing, economics, and liability affect processes and outcomes. Each potential bias leaves clinicians and patients uncertain of the ramification for their decisionmaking and masks potential adverse effects of desiring one route of delivery but having another.
A longitudinal study design that begins after first cesarean and measures patient intent would allow measurement of outcomes, preferences, and adverse events throughout the entire spectrum of concepts presented in the analytic framework. Because issues of access and capacity to handle obstetric emergencies, such as uterine rupture, are likely to impact a woman’s ability to have the delivery she desires as well as the ultimate outcome of any emergency, a national study that could examine regional variation would be ideal.
Table 36 summarizes the strength of evidence and findings for all key questions reviewed in this report. Briefly, there is moderate evidence that women who have a TOL have a high probability of having a vaginal delivery (74 percent) which can be enhanced by maximizing favorable clinical conditions such as waiting for a favorable cervical examination if possible. Overall, maternal morbidity is reduced from TOL compared with ERCD. Of particular note is the significantly decreased risk of maternal mortality and the serious morbidity associated with
144
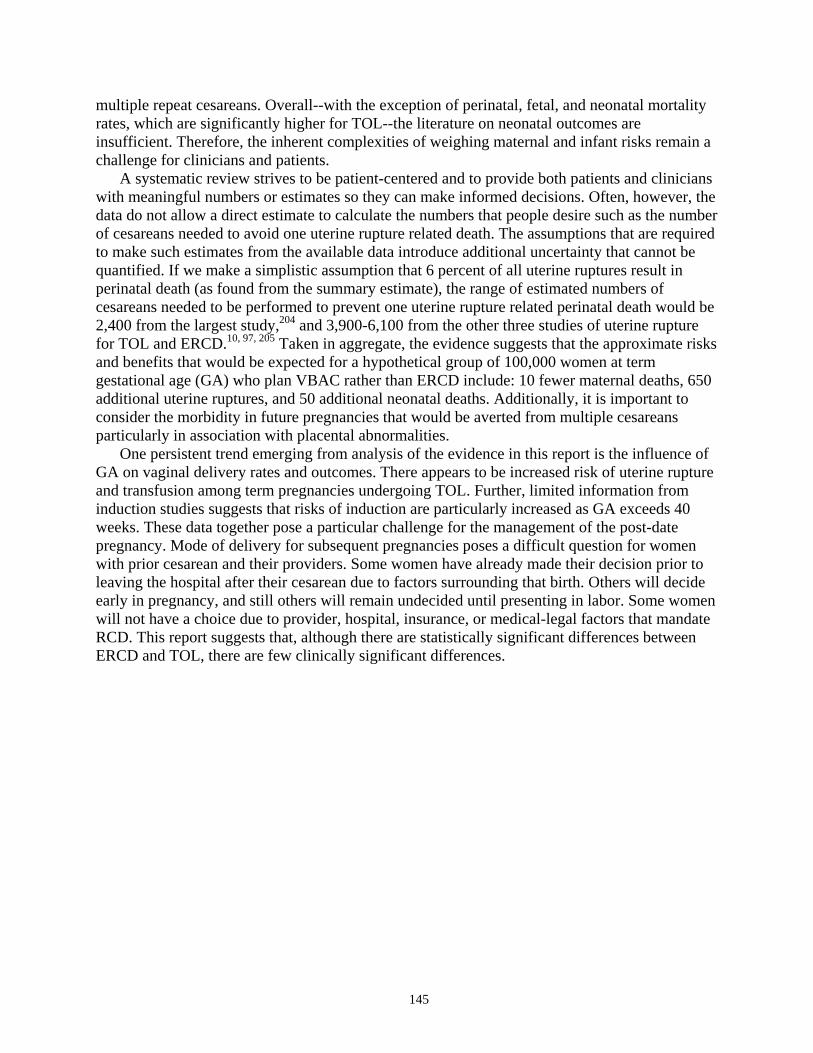
multiple repeat cesareans. Overall--with the exception of perinatal, fetal, and neonatal mortality rates, which are significantly higher for TOL--the literature on neonatal outcomes are insufficient. Therefore, the inherent complexities of weighing maternal and infant risks remain a challenge for clinicians and patients.
A systematic review strives to be patient-centered and to provide both patients and clinicians with meaningful numbers or estimates so they can make informed decisions. Often, however, the data do not allow a direct estimate to calculate the numbers that people desire such as the number of cesareans needed to avoid one uterine rupture related death. The assumptions that are required to make such estimates from the available data introduce additional uncertainty that cannot be quantified. If we make a simplistic assumption that 6 percent of all uterine ruptures result in perinatal death (as found from the summary estimate), the range of estimated numbers of cesareans needed to be performed to prevent one uterine rupture related perinatal death would be 2,400 from the largest study,204 and 3,900-6,100 from the other three studies of uterine rupture for TOL and ERCD.10, 97, 205 Taken in aggregate, the evidence suggests that the approximate risks and benefits that would be expected for a hypothetical group of 100,000 women at term gestational age (GA) who plan VBAC rather than ERCD include: 10 fewer maternal deaths, 650 additional uterine ruptures, and 50 additional neonatal deaths. Additionally, it is important to consider the morbidity in future pregnancies that would be averted from multiple cesareans particularly in association with placental abnormalities.
One persistent trend emerging from analysis of the evidence in this report is the influence of GA on vaginal delivery rates and outcomes. There appears to be increased risk of uterine rupture and transfusion among term pregnancies undergoing TOL. Further, limited information from induction studies suggests that risks of induction are particularly increased as GA exceeds 40 weeks. These data together pose a particular challenge for the management of the post-date pregnancy. Mode of delivery for subsequent pregnancies poses a difficult question for women with prior cesarean and their providers. Some women have already made their decision prior to leaving the hospital after their cesarean due to factors surrounding that birth. Others will decide early in pregnancy, and still others will remain undecided until presenting in labor. Some women will not have a choice due to provider, hospital, insurance, or medical-legal factors that mandate RCD. This report suggests that, although there are statistically significant differences between ERCD and TOL, there are few clinically significant differences.
145
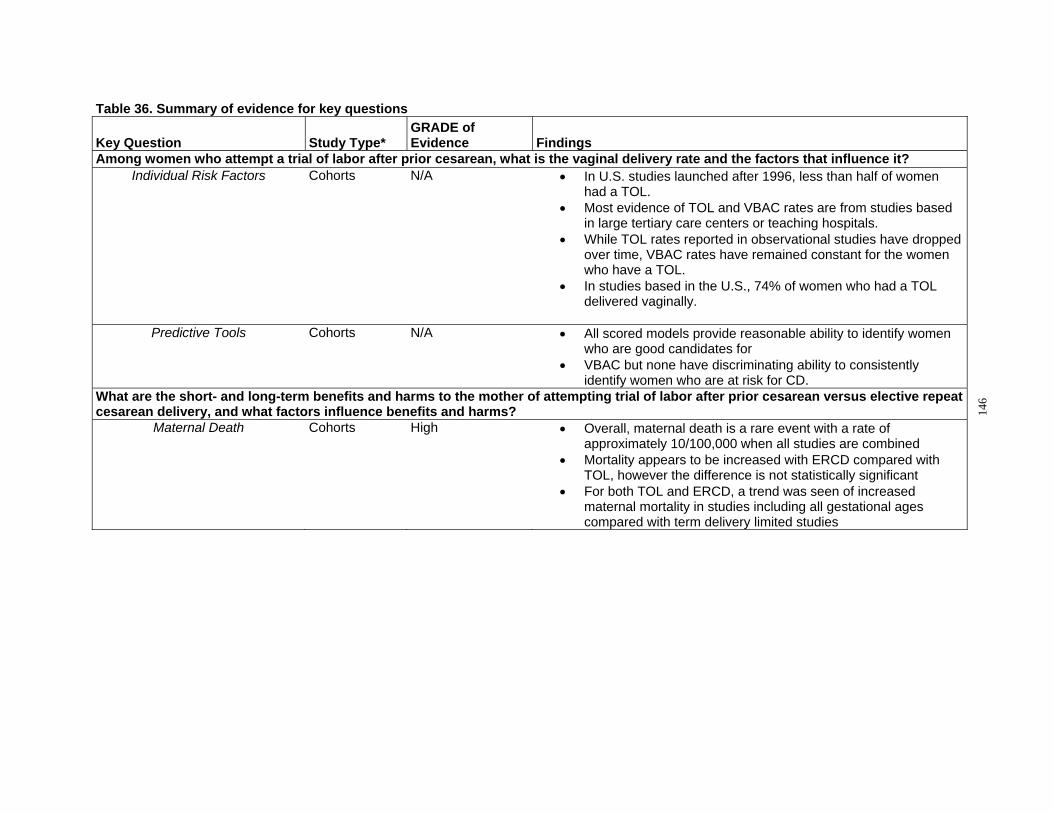
Table 36. Summary of evidence for key questions
Key Question Study Type* GRADE of Evidence Findings
Among women who attempt a trial of labor after prior cesarean, what is the vaginal delivery rate and the factors that influence it? Individual Risk Factors Cohorts N/A • In U.S. studies launched after 1996, less than half of women
had a TOL. • Most evidence of TOL and VBAC rates are from studies based
in large tertiary care centers or teaching hospitals. • While TOL rates reported in observational studies have dropped
over time, VBAC rates have remained constant for the women who have a TOL.
• In studies based in the U.S., 74% of women who had a TOL delivered vaginally.
Predictive Tools Cohorts N/A • All scored models provide reasonable ability to identify women who are good candidates for
• VBAC but none have discriminating ability to consistently identify women who are at risk for CD.
What are the short- and long-term benefits and harms to the mother of attempting trial of labor after prior cesarean versus elective repeat cesarean delivery, and what factors influence benefits and harms?
Maternal Death Cohorts High • Overall, maternal death is a rare event with a rate of approximately 10/100,000 when all studies are combined
• Mortality appears to be increased with ERCD compared with TOL, however the difference is not statistically significant
• For both TOL and ERCD, a trend was seen of increased maternal mortality in studies including all gestational ages compared with term delivery limited studies
146

Table 36. Summary of evidence for key questions
Key Question Study Type* GRADE of Evidence Findings
Uterine Rupture Cohorts Moderate (Low uterine segment thickness studies only)
• The rate of uterine rupture for all women with prior cesarean is very low 0.30% (3/1,000)
• the risk of uterine rupture for women undergoing a TOL is 0.47% ten times higher than for women undergoing an ERCD 0.03%
• Overall, the risk of perinatal death in the event of a uterine rupture was 6.2%
• There were no uterine rupture associated maternal deaths among term studies
• The overall risk of rupture with any induction method at term was 1.5% and 1.0% when any gestational age is considered.
• Among women with gestational age > 40 weeks, the rate was highest at 3.2%.
• There was significant heterogeneity among studies • Study design appeared to play a role in reported frequencies of
uterine rupture Predictors of uterine rupture Cohorts, case
series and case-controls
N/A • Uterine rupture risk is decreased by prior vaginal delivery and prior VBAC
• Uterine rupture risk is increased by short inter-delivery intervals <18-24 months and gestational age
• There is insufficient or conflicting evidence regarding the role of single layer closure, preterm delivery, maternal age, post-term status, birth weight, oxytocin, prostaglandin and epidural use.
• ultrasound measurements of uterine thickness may play a promising role in predicting populations at risk for uterine rupture
Predictive Tool Cohorts N/A • Accurate and reliable tool to predict an individual woman’s risk of uterine rupture has not been achieved.
Hysterectomy Cohorts Medium • Hysterectomy is rare with either ERCD or TOL, occurring in less than 3% of deliveries
• Hysterectomy rate for ERCD ranged from 0% to 1.7% • Hysterectomy rates for TOL ranged from 0.1%-0.5% • The majority of studies report a non-significant increase in
hysterectomy for ERCD • High-risk populations (maternal complications) may be at increased
risk for hysterectomy
147
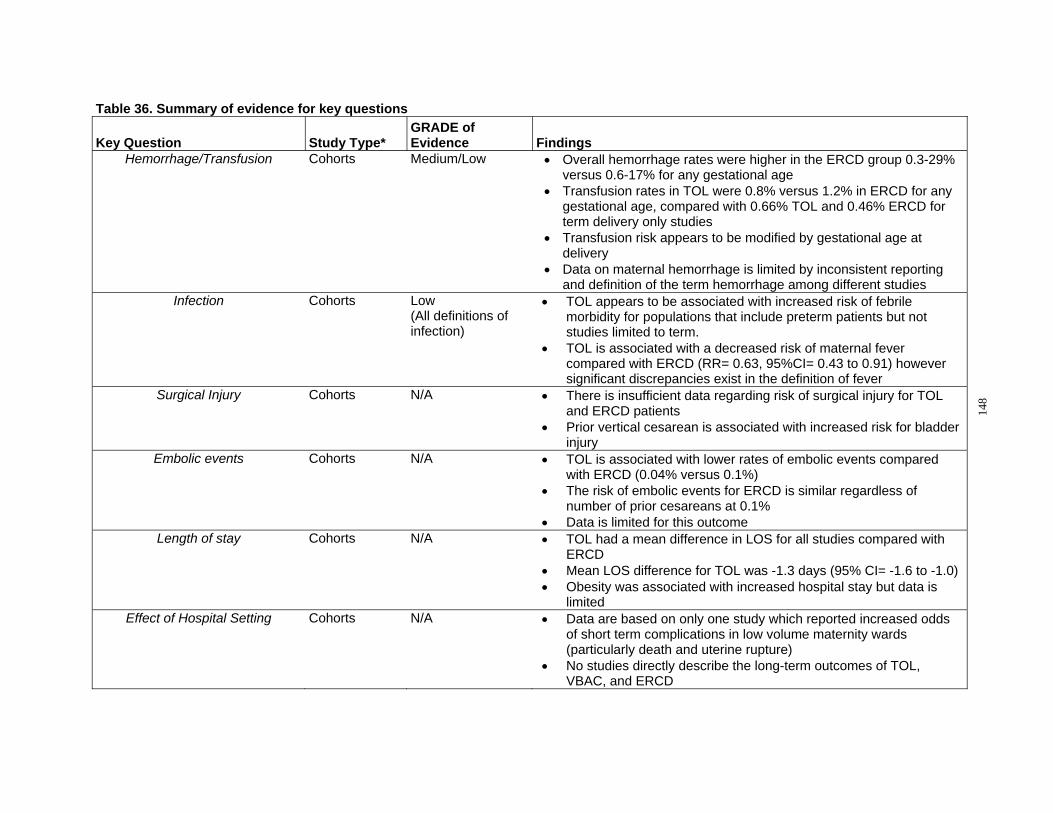
Table 36. Summary of evidence for key questions
Key Question Study Type* GRADE of Evidence Findings
Hemorrhage/Transfusion Cohorts Medium/Low • Overall hemorrhage rates were higher in the ERCD group 0.3-29% versus 0.6-17% for any gestational age
• Transfusion rates in TOL were 0.8% versus 1.2% in ERCD for any gestational age, compared with 0.66% TOL and 0.46% ERCD for term delivery only studies
• Transfusion risk appears to be modified by gestational age at delivery
• Data on maternal hemorrhage is limited by inconsistent reporting and definition of the term hemorrhage among different studies
Infection Cohorts Low (All definitions of infection)
• TOL appears to be associated with increased risk of febrile morbidity for populations that include preterm patients but not studies limited to term.
• TOL is associated with a decreased risk of maternal fever compared with ERCD (RR= 0.63, 95%CI= 0.43 to 0.91) however significant discrepancies exist in the definition of fever
Surgical Injury Cohorts N/A • There is insufficient data regarding risk of surgical injury for TOL and ERCD patients
• Prior vertical cesarean is associated with increased risk for bladder injury
Embolic events Cohorts N/A • TOL is associated with lower rates of embolic events compared with ERCD (0.04% versus 0.1%)
• The risk of embolic events for ERCD is similar regardless of number of prior cesareans at 0.1%
• Data is limited for this outcome Length of stay Cohorts N/A • TOL had a mean difference in LOS for all studies compared with
ERCD • Mean LOS difference for TOL was -1.3 days (95% CI= -1.6 to -1.0) • Obesity was associated with increased hospital stay but data is
limited Effect of Hospital Setting Cohorts N/A • Data are based on only one study which reported increased odds
of short term complications in low volume maternity wards (particularly death and uterine rupture)
• No studies directly describe the long-term outcomes of TOL, VBAC, and ERCD
148
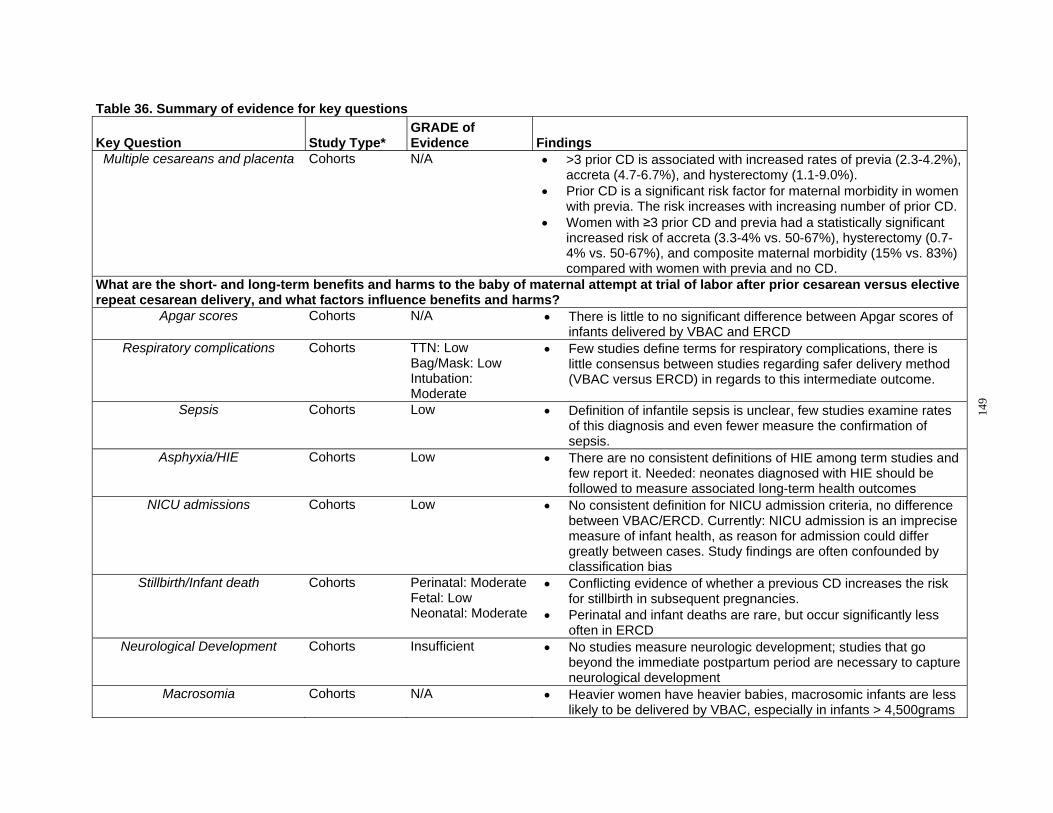
Table 36. Summary of evidence for key questions
Key Question Study Type* GRADE of Evidence Findings
Multiple cesareans and placenta Cohorts N/A • >3 prior CD is associated with increased rates of previa (2.3-4.2%), accreta (4.7-6.7%), and hysterectomy (1.1-9.0%).
• Prior CD is a significant risk factor for maternal morbidity in women with previa. The risk increases with increasing number of prior CD.
• Women with ≥3 prior CD and previa had a statistically significant increased risk of accreta (3.3-4% vs. 50-67%), hysterectomy (0.7-4% vs. 50-67%), and composite maternal morbidity (15% vs. 83%) compared with women with previa and no CD.
What are the short- and long-term benefits and harms to the baby of maternal attempt at trial of labor after prior cesarean versus elective repeat cesarean delivery, and what factors influence benefits and harms?
Apgar scores Cohorts N/A • There is little to no significant difference between Apgar scores of infants delivered by VBAC and ERCD
Respiratory complications Cohorts TTN: Low Bag/Mask: Low Intubation: Moderate
• Few studies define terms for respiratory complications, there is little consensus between studies regarding safer delivery method (VBAC versus ERCD) in regards to this intermediate outcome.
Sepsis Cohorts Low • Definition of infantile sepsis is unclear, few studies examine rates of this diagnosis and even fewer measure the confirmation of sepsis.
Asphyxia/HIE Cohorts Low • There are no consistent definitions of HIE among term studies and few report it. Needed: neonates diagnosed with HIE should be followed to measure associated long-term health outcomes
NICU admissions Cohorts Low • No consistent definition for NICU admission criteria, no difference between VBAC/ERCD. Currently: NICU admission is an imprecise measure of infant health, as reason for admission could differ greatly between cases. Study findings are often confounded by classification bias
Stillbirth/Infant death Cohorts Perinatal: Moderate Fetal: Low Neonatal: Moderate
• Conflicting evidence of whether a previous CD increases the risk for stillbirth in subsequent pregnancies.
• Perinatal and infant deaths are rare, but occur significantly less often in ERCD
Neurological Development Cohorts Insufficient • No studies measure neurologic development; studies that go beyond the immediate postpartum period are necessary to capture neurological development
Macrosomia Cohorts N/A • Heavier women have heavier babies, macrosomic infants are less likely to be delivered by VBAC, especially in infants > 4,500grams
149
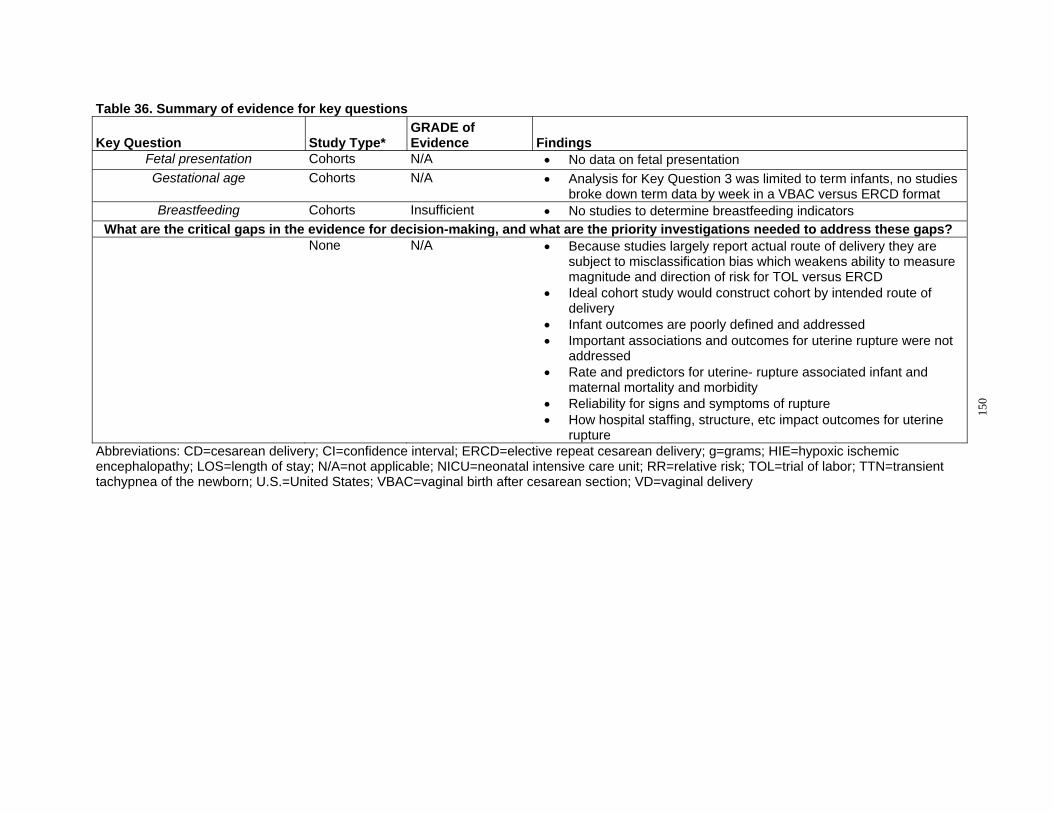
Table 36. Summary of evidence for key questions
Key Question Study Type* GRADE of Evidence Findings
Fetal presentation Cohorts N/A • No data on fetal presentation Gestational age Cohorts N/A • Analysis for Key Question 3 was limited to term infants, no studies
broke down term data by week in a VBAC versus ERCD format Breastfeeding Cohorts Insufficient • No studies to determine breastfeeding indicators
What are the critical gaps in the evidence for decision-making, and what are the priority investigations needed to address these gaps? None N/A • Because studies largely report actual route of delivery they are
subject to misclassification bias which weakens ability to measure magnitude and direction of risk for TOL versus ERCD
• Ideal cohort study would construct cohort by intended route of delivery
• Infant outcomes are poorly defined and addressed • Important associations and outcomes for uterine rupture were not
addressed • Rate and predictors for uterine- rupture associated infant and
maternal mortality and morbidity • Reliability for signs and symptoms of rupture • How hospital staffing, structure, etc impact outcomes for uterine
rupture Abbreviations: CD=cesarean delivery; CI=confidence interval; ERCD=elective repeat cesarean delivery; g=grams; HIE=hypoxic ischemic encephalopathy; LOS=length of stay; N/A=not applicable; NICU=neonatal intensive care unit; RR=relative risk; TOL=trial of labor; TTN=transient tachypnea of the newborn; U.S.=United States; VBAC=vaginal birth after cesarean section; VD=vaginal delivery
150
What are the critical gaps in the evidence for decisionmaking, and what are the priority investigations
needed to address these gaps? Future research sections of evidence reports have been criticized for not providing sufficient
detail to provide researchers the information they need to improve their study designs.290 Further, evidence reports have been dismissed for cataloging all possible research efforts rather than prioritizing future research. To take advantage of the peer review process—which distributes the draft report to federal agencies, including the FDA, CDC, and NIH; maternity and pediatric clinicians; advocacy groups; payers; policymakers; content experts; and researchers—our peer reviewers were asked to provide feedback on both investigator ideas on important gaps in the literature and to provide their own perspectives and priorities for future research. Specifically, experts were asked if stated topic areas were of low, medium, or high priority for future research, and to also provide additional clarification on their positions. Those areas that were rated as highest priority are discussed here (highest priority means that 50 percent of the experts rated the domain as high).
The decision on route of delivery for women with prior cesarean delivery is particularly challenging and complex for patients, providers, and decisionmakers. Patients and providers are influenced by the short- and long-term benefits and risks of route of delivery as well as family obligations, costs, societal norms, and regional availability of options. Although the numbers of studies on VBAC are numerous, the numbers of studies providing high quality information on important clinical questions are limited. An analysis of the areas with the most uncertainty, gaps in the evidence, is presented in Table 37. While many believe the ideal study design for an intervention such as TOL versus ERCD would be a randomized controlled trial, none has been done, and several papers indicate that such a trial is unlikely in the U.S.291 The evidence for this systematic review is based almost entirely on observational studies, which are more susceptible to bias. Misclassification of patients and outcomes is a challenge to this literature. Steps to improve these areas in research are necessary to provide clinicians and families with accurate and timely information on route of delivery. In particular, studies of VBAC versus ERCD have traditionally reported outcomes based upon actual route of delivery rather than intended route. This can lead to misclassification of patients who intend ERCD but go into labor prior to their cesarean or women who intended TOL but who are delivered by cesarean delivery. Each leads to misclassification of outcomes for a particular group, and leaves clinicians and patients still uncertain of the ramification for their decisionmaking. It also masks the potential adverse effects of desiring one route of delivery but having another either due to medical complications or other reasons.
National Childbirth Study Investigators and reviewers agree that the existing evidence is insufficient to adequately
answer several questions (Table 37). Additionally, it was agreed that the most effective way to address these gaps in the literature is the undertaking of a large, prospective longitudinal national childbirth randomized trial or cohort study. Participants would need to be enrolled early in their pregnancy, and grouped by their intended route of delivery. Whether randomized or a cohort, this landmark study would use clearly defined outcomes, preferences, and risk factors. Such a study would be designed to follow women and their fetuses/infants from early pregnancy to
151
long-term followup. This type of study would allow researchers and clinicians to establish a cohort at risk. Investigators and experts also agreed on the importance of establishing the appropriate definitions for maternal outcomes (such as, infection, hemorrhage, and surgical injury) and for infant outcomes (such as death or respiratory or neurological issues). A prospective approach is paramount, given the problems with variation in patient classification, outcome definition, and method of measurement found in retrospective studies. Outcome definition was noted as being critical to interpretation of the literature by peer reviewers, and as a main problem in synthesizing existing evidence by reviewers. Composite outcomes are particularly problematic, although even individual outcomes were often poorly defined or defined with wide variation in the existing literature. A consensus conference on health outcome definitions with key leaders in the field should be held prior to conducting such a study. It is recognized that enormous challenges may exist in developing such a large scale effort. These include but are not limited to establishing consensus on definitions; acquiring funding; delineating external influences (litigation; popular press; and societal, patient, and provider assumptions); and obstacles to randomization, IRB approval, and long-term followup.
In addition to, or in support of, such a study, there are specific questions for which an RCT is possible and the best methodological approach. Administrative or other types of databases may be useful in assessing some outcomes, particularly long-term harms. However, methods for using such databases in studying VBAC need to be developed.
Specific areas identified that require additional research included prediction tools, maternal health outcomes, infant health outcomes, and cost.
Prediction Tools Of priority to the experts surveyed in this domain include the ability to predict uterine
rupture, VBAC, or emergency cesarean delivery (failed TOL). This report identifies gaps in the ability of existing prediction tools at selecting women for a successful TOL. Studies need to be large and prospective in nature and should use standard health outcome definitions. Such tools should address non-medical factors associated with a successful or failed TOL; the impact of induction; and whether there are differences among racial, ethnic, or socioeconomic groups. Where differences exist, future research should be designed to identify the reasons for such differences.
Maternal Health Outcomes Better understanding of the short- and long-term outcomes comparing VBAC with ERCD is
needed, particularly in order to inform women’s choices, especially among those who will have future pregnancies. This is especially important looking at the proportion of women who have three or more children and the extent of unplanned pregnancies. Future studies must include a full range of reproductive outcomes, including quality of life. Current evidence is lacking in standardization of definitions of short-term outcomes as well as methods of ascertainment and reporting. Examples of short-term outcomes that require better research are infection and surgical injury. Outcomes that affect both mother and infant, such as those related to breastfeeding and parental attachment, have not been studied in relation to VBAC. Comparison of long-term outcomes between VBAC and ERCD are also in need of better examination, with better evaluation of the impact of the age of the mother being taken into account along with multiple other factors.
152
Uterine rupture. Interpretation of the uterine rupture research is difficult for the many reasons previously described. A potentially promising area of inquiry might be using imaging to predict UR or outcomes; however, the current evidence in this area is insufficient for using ultrasound imaging of the uterine scar or lower uterine segment to predict the risk of uterine rupture with TOL. A large multi-centered RCT could take one of two approaches: randomize patients to ultrasound or no ultrasound, or perform ultrasound on all patients but randomize which providers receive the results prior to delivery.
The impact of setting on the short- and long-term outcomes for mothers and infants has not been well studied. A prospective study of uterine rupture could be created to answer several questions. The study would need to use a standard definition and method of ascertainment to compare events at various types of hospital and non-hospital settings, with variation in staffing and the ability to provide “immediate access to cesarean delivery.” Implementation of a national registry of ruptures and using linked data systems may be a way to approach these questions.
Evidence on the risk of uterine rupture when induction or augmentation is needed is lacking appropriate comparison groups and long- or short-term evidence on infant and maternal harms. Women who are candidates for induction should be compared with similar women who undergo expectant management. Additionally, the role of uterine wall thickness has not been studied in relation to induction for TOL. The best study to answer these questions is an RCT of induction or expectant management. The effect of uterine wall thickness could be examined within such a study or as a separate study.
Infant Health Outcomes Experts and reviewers agreed that two pressing issues in VBAC continue to be identifying
and then studying the most meaningful infant outcomes and agreeing on clear and precise definitions and methods of ascertainment. Although similar issues are seen with maternal outcomes and definitions, those reported as specific to infants include evaluation of variation in gestational age associated with the different delivery methods (ERCD and TOL with and without induction).
Cost Costs were not examined explicitly in this report, but experts expressed the need to correlate
beneficial or harmful outcomes to health-system costs. Economic analyses could be designed to coincide with studies described here. Additional studies to identify the best reimbursement model to provide financial incentives for critical elements of VBAC—which may include increased access in rural areas, 24 hour in-house surgical coverage, etc.—are needed. Again, clear definitions of outcomes are essential.
153
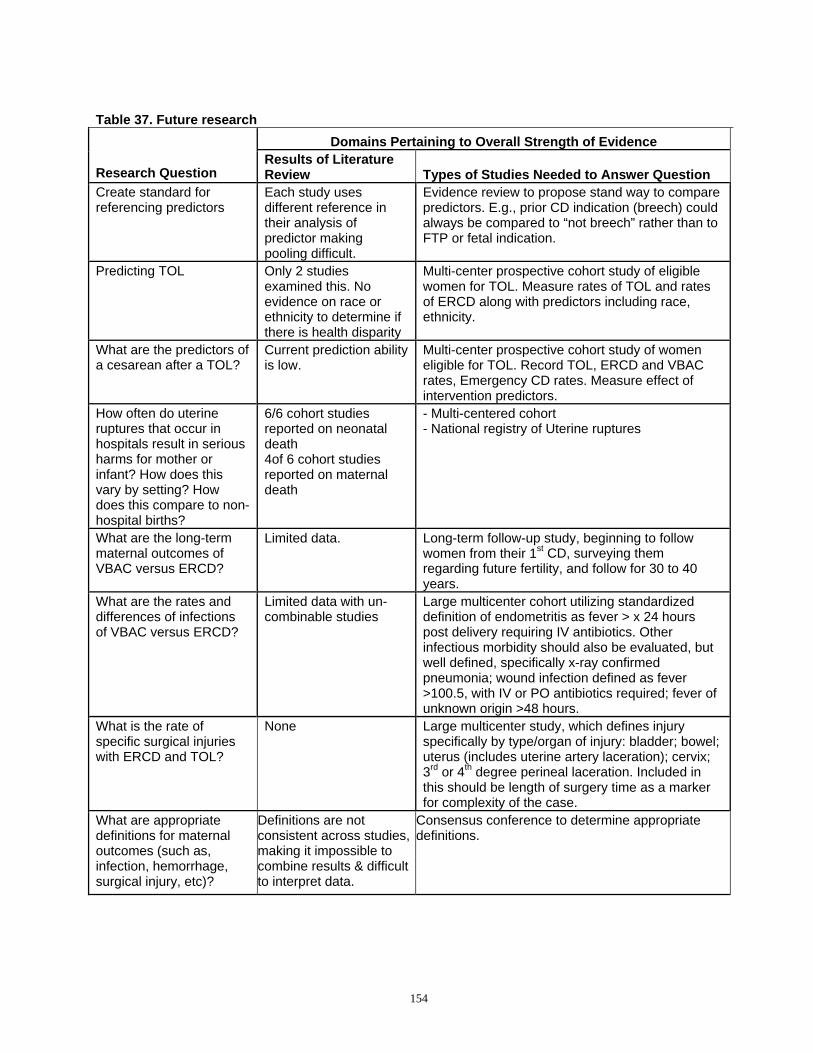
Table 37. Future research
Research Question Create standard for referencing predictors
Predicting TOL
What are the predictors of a cesarean after a TOL?
How often do uterine ruptures that occur in hospitals result in serious harms for mother or infant? How does this vary by setting? How does this compare to non-hospital births? What are the long-term maternal outcomes of VBAC versus ERCD?
What are the rates and differences of infections of VBAC versus ERCD?
What is the rate of specific surgical injuries with ERCD and TOL?
What are appropriate definitions for maternal outcomes (such as, infection, hemorrhage, surgical injury, etc)?
Domains Pertaining to Overall Strength of Evidence Results of Literature Review Types of Studies Needed to Answer Question Each study uses different reference in their analysis of predictor making pooling difficult.
Evidence review to propose stand way to compare predictors. E.g., prior CD indication (breech) could always be compared to “not breech” rather than to FTP or fetal indication.
Only 2 studies examined this. No evidence on race or ethnicity to determine if there is health disparity
Multi-center prospective cohort study of eligible women for TOL. Measure rates of TOL and rates of ERCD along with predictors including race, ethnicity.
Current prediction ability is low.
Multi-center prospective cohort study of women eligible for TOL. Record TOL, ERCD and VBAC rates, Emergency CD rates. Measure effect of intervention predictors.
6/6 cohort studies reported on neonatal death 4of 6 cohort studies reported on maternal death
- Multi-centered cohort - National registry of Uterine ruptures
Limited data. Long-term follow-up study, beginning to follow women from their 1st CD, surveying them regarding future fertility, and follow for 30 to 40 years.
Limited data with un-combinable studies
Large multicenter cohort utilizing standardized definition of endometritis as fever > x 24 hours post delivery requiring IV antibiotics. Other infectious morbidity should also be evaluated, but well defined, specifically x-ray confirmed pneumonia; wound infection defined as fever >100.5, with IV or PO antibiotics required; fever of unknown origin >48 hours.
None Large multicenter study, which defines injury specifically by type/organ of injury: bladder; bowel; uterus (includes uterine artery laceration); cervix; 3rd or 4th degree perineal laceration. Included in this should be length of surgery time as a marker for complexity of the case.
Definitions are not consistent across studies, making it impossible to combine results & difficult to interpret data.
Consensus conference to determine appropriate definitions.
154
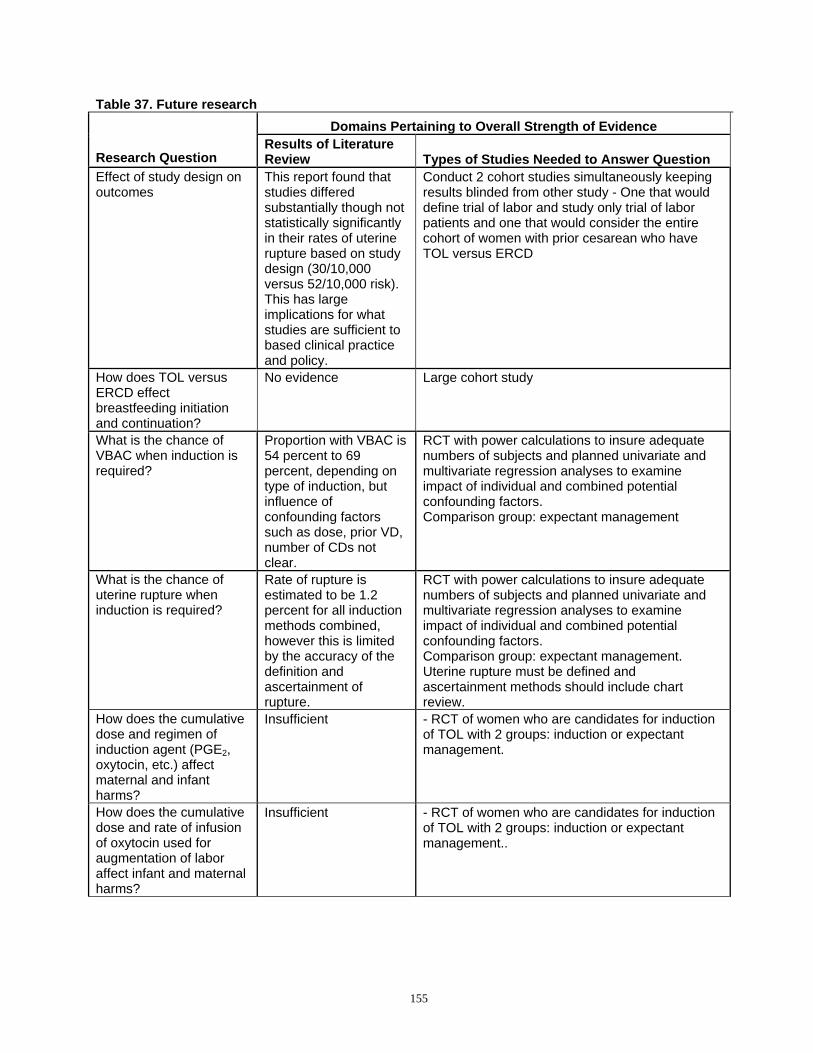
Table 37. Future research
Research Question Effect of study design on outcomes
How does TOL versus ERCD effect breastfeeding initiation and continuation? What is the chance of VBAC when induction is required?
What is the chance of uterine rupture when induction is required?
How does the cumulative dose and regimen of induction agent (PGE2, oxytocin, etc.) affect maternal and infant harms? How does the cumulative dose and rate of infusion of oxytocin used for augmentation of labor affect infant and maternal harms?
Domains Pertaining to Overall Strength of Evidence Results of Literature Review Types of Studies Needed to Answer Question This report found that studies differed substantially though not statistically significantly in their rates of uterine rupture based on study design (30/10,000 versus 52/10,000 risk). This has large implications for what studies are sufficient to based clinical practice and policy.
Conduct 2 cohort studies simultaneously keeping results blinded from other study - One that would define trial of labor and study only trial of labor patients and one that would consider the entire cohort of women with prior cesarean who have TOL versus ERCD
No evidence Large cohort study
Proportion with VBAC is 54 percent to 69 percent, depending on type of induction, but influence of confounding factors such as dose, prior VD, number of CDs not clear.
RCT with power calculations to insure adequate numbers of subjects and planned univariate and multivariate regression analyses to examine impact of individual and combined potential confounding factors. Comparison group: expectant management
Rate of rupture is estimated to be 1.2 percent for all induction methods combined, however this is limited by the accuracy of the definition and ascertainment of rupture.
RCT with power calculations to insure adequate numbers of subjects and planned univariate and multivariate regression analyses to examine impact of individual and combined potential confounding factors. Comparison group: expectant management. Uterine rupture must be defined and ascertainment methods should include chart review.
Insufficient - RCT of women who are candidates for induction of TOL with 2 groups: induction or expectant management.
Insufficient - RCT of women who are candidates for induction of TOL with 2 groups: induction or expectant management..
155
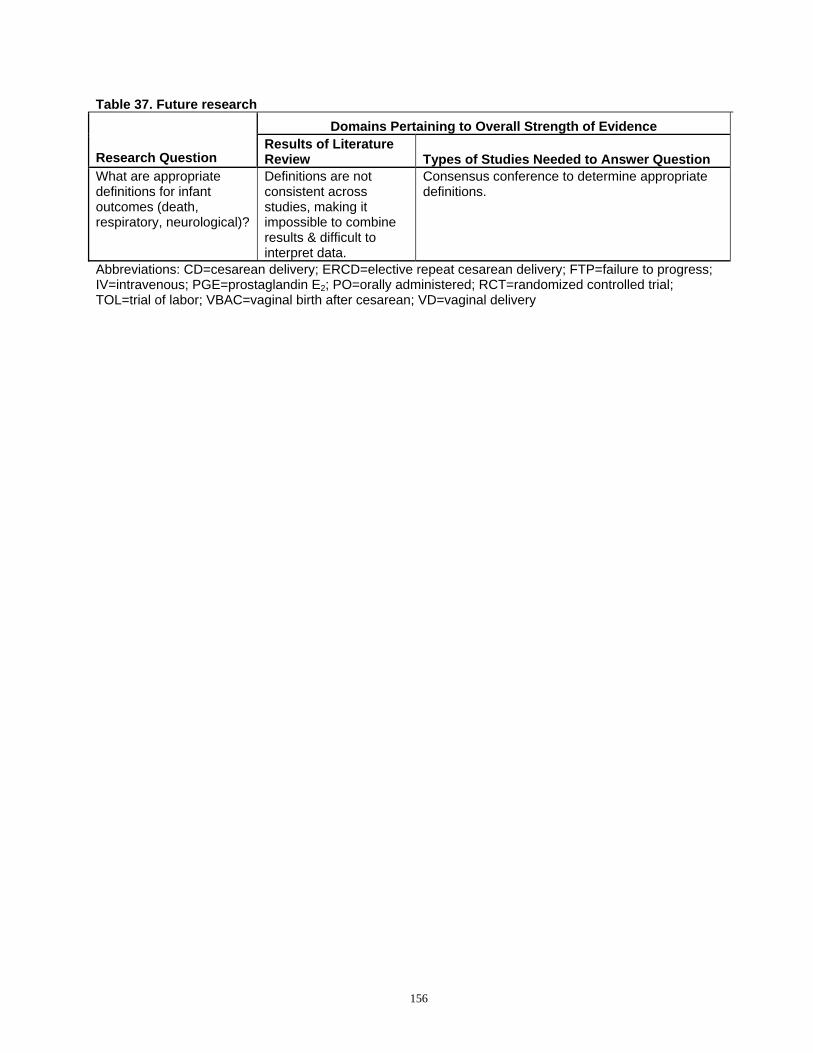
Table 37. Future research Domains Pertaining to Overall Strength of Evidence
Results of Literature Research Question Review Types of Studies Needed to Answer Question What are appropriate definitions for infant outcomes (death, respiratory, neurological)?
Definitions are not consistent across studies, making it impossible to combine results & difficult to interpret data.
Consensus conference to determine appropriate definitions.
Abbreviations: CD=cesarean delivery; ERCD=elective repeat cesarean delivery; FTP=failure to progress; IV=intravenous; PGE=prostaglandin E2; PO=orally administered; RCT=randomized controlled trial; TOL=trial of labor; VBAC=vaginal birth after cesarean; VD=vaginal delivery
156
References
1. Agency for Healthcare Research and Quality. Healthcare Cost and Utilization Project (HCUP). http://hcupnet.ahrq.gov/. Accessed Dec 9, 2009.
2. Taffel SM, Placek PJ, Liss T. Trends in the United States cesarean section rate and reasons for the 1980-85 rise. Am J Public Health. 1987;77(8):955-959.
3. Cesarean Childbirth. NIH Consenus Statement Online 1980;3(6):1-30.
4. Martin JA, Hamilton BE, Sutton PD, Ventura SJ, Menacker F, Kirmeyer S. Births: final data for 2004. Natl Vital Stat Rep. 2006;55(1):1-101.
5. Placek PJ, Taffel S, Moien M. Cesarean section delivery rates: United States, 1981. Am J Public Health. 1981;73(8):861-862.
6. Placek PJ, Taffel SM. The Frequency of Complications in Cesarean and Noncesarean Deliveries, 1970 and 1978. Public Health Rep. 1983;98(4):396-400.
7. Healthy People 2010. http://www.healthypeople.gov/. Accessed Dec 4, 2009.
8. Hamilton B, Martin J, Ventura S. Births: Preliminary data for 2007. Natl Vital Stat Rep, Web Release. Hyattsville, MD: National Center for Vital Statistics; March 18, 2009.
9. Martin JA, Hamilton BE, Sutton PD, et al. Births: Final Data for 2006. Natl Vital Stat Rep. 2009;57(7):1-102.
10. McMahon MJ, Luther ER, Bowes WA, Jr., Olshan AF. Comparison of a trial of labor with an elective second cesarean section. N Engl J Med. 1996;335(10):689-695.
11. Lydon-Rochelle M, Holt VL, Easterling TR, Martin DP. Risk of uterine rupture during labor among women with a prior cesarean delivery. N Engl J Med. 2001;345(1):3-8.
12. Development OfECa. OECD health data 2007: statistics and indicators for 30 countries 2007. 6-30-2009; http://www.oecd.org/document/30/0,2340,en_264 9_34631_12968734_1_1_1_1,00.html. Accessed Dec 16, 2009.
13. Eden KB, Hashima JN, Osterweil P, Nygren P, Guise J-M. Childbirth preferences after cesarean birth: a review of the evidence. Birth. 2004;31(1):49-60.
14. Fawcett J, Tulman L, Spedden J. Responses to vaginal birth after cesarean section. J Obstet Gynecol Neonatal Nurs. 1994;23(3):253-259.
15. Kirk EP, Doyle KA, Leigh J, Garrard ML. Vaginal birth after cesarean or repeat cesarean section: medical risks or social realities? Am J Obstet Gynecol. 1990;162(6):1398-1403; discussion 1403-1395.
16. Lau TK, Wong SH, Li CY. A study of patients' acceptance towards vaginal birth after caesarean section. Aust N Z J Obstet Gynaecol. 1996;36(2):155-158.
17. Murphy MC, Harvey SM. Choice of a childbirth method after cesarean. Women Health. 1989;15(2):67-85.
18. Moffat MA, Bell JS, Porter MA, et al. Decision making about mode of delivery among pregnant women who have previously had a caesarean section: A qualitative study. BJOG. 2007;114(1):86-93.
19. Farnworth A, Robson SC, Thomson RG, Watson DB, Murtagh MJ. Decision support for women choosing mode of delivery after a previous caesarean section: a developmental study. Patient Educ Couns. 2008;71(1):116-124.
20. McClain CS. The making of a medical tradition: vaginal birth after cesarean. Soc Sci Med. 1990;31(2):203-210.
21. Dilks FM, Beal JA. Role of self-efficacy in birth choice. J Perinat Neonatal Nurs. 1997;11(1):1-9.
22. Meddings F, Phipps FM, Haith-Cooper M, Haigh J. Vaginal birth after caesarean section (VBAC): exploring women's perceptions. J Clin Nurs. 2007;16(1):160-167.
23. Cleary-Goldman J, Cornelisse K, Simpson LL, Robinson JN. Previous cesarean delivery: understanding and satisfaction with mode of delivery in a subsequent pregnancy in patients participating in a formal vaginal birth after cesarean counseling program. Am J Perinatol. 2005;22(4):217-221.
24. Lucas A. Information for women after CS: are they getting enough? RCM Midwives. 2004;7(11):472-475.
25. Melnikow J, Romano P, Gilbert WM, Schembri M, Keyzer J, Kravitz RL. Vaginal birth after cesarean in California. Obstet Gynecol. 2001;98(3):421-426.
26. Norman P, Kostovcik S, Lanning A. Elective repeat cesarean sections: how many could be vaginal births? CMAJ. 1993;149(4):431-435.
27. Selo-Ojeme D, Abulhassan N, Mandal R, Tirlapur S, Selo-Ojeme U. Preferred and actual delivery mode after a cesarean in London, UK. Int J Gynaecol Obstet. 2008;102(2):156-159.
28. Fraser W, Maunsell E, Hodnett E, Moutquin JM. Randomized controlled trial of a prenatal vaginal birth after cesarean section education and support program. Childbirth Alternatives Post-Cesarean Study Group. Am J Obstet Gynecol. 1997;176(2):419-425.
29. Renner RM, Eden KB, Osterweil P, Chan BK, Guise JM. Informational factors influencing patient's childbirth preferences after prior cesarean. Am J Obstet Gynecol. 2007;196(5):e14-16.
157
30. Sur S, Mackenzie IZ. Does discussion of possible scar rupture influence preferred mode of delivery after a caesarean section? J Obstet Gynaecol. 2005;25(4):338-341.
31. Eden KB, Dolan JG, Perrin NA, et al. Patients were more consistent in randomized trial at prioritizing childbirth preferences using graphic-numeric than verbal formats. J Clin Epidemiol. 2009;62(4):415-424.e413.
32. Montgomery AA, Emmett CL, Fahey T, et al. Two decision aids for mode of delivery among women with previous caesarean section: randomised controlled trial. BMJ. 2007;334(7607):1305.
33. Shorten A, Shorten B, Keogh J, West S, Morris J. Making choices for childbirth: a randomized controlled trial of a decision-aid for informed birth after cesarean. Birth. 2005;32(4):252-261.
34. Frost J, Shaw A, Montgomery A, Murphy DJ. Women's views on the use of decision aids for decision making about the method of delivery following a previous caesarean section: qualitative interview study. BJOG. 2009;116(7):896-905.
35. Caron A, Neuhauser D. The effect of public accountability on hospital performance: trends in rates for cesarean sections and vaginal births after cesarean section in Cleveland, Ohio. Qual Manag Health Care. 1999;7(2):1-10.
36. Macones GA. Clinical outcomes in VBAC attempts: what to say to patients? Am J Obstet Gynecol. 2008;199(1):1-2.
37. ACOG Releases 2009 Medical Liability Survey. Results Paint Dismal Reality for Ob-Gyns and Their Patients. http://www.acog.org/from_home/publications/pre ss_releases/nr09-11-09.cfm. Accessed Dec 1, 2009.
38. Angelini DJ, Greenwald L. Closed claims analysis of 65 medical malpractice cases involving nurse-midwives. J Midwifery Womens Health. 2005;50(6):454-460.
39. Clark SL, Vines VL, Belfort MA. Fetal injury associated with routine vacuum use during cesarean delivery. Am J Obstet Gynecol. 2008;198(4):e4.
40. Stalnaker BL, Maher JE, Kleinman GE, Macksey JM, Fishman LA, Bernard JM. Characteristics of successful claims for payment by the Florida Neurologic Injury Compensation Association Fund. Am J Obstet Gynecol. 1997;177(2):268-271; discussion 271-263.
41. Localio AR, Lawthers AG, Bengston JM, et al. Relationship Between Malpractice Claims and Cesarean Delivery. JAMA. 1993;269(3):366-373.
42. Murthy K, Grobman WA, Lee TA, Holl JL. Association Between Rising Professional Liability Insurance Premiums and Primary Cesarean Delivery Rates. Obstet Gynecol. 2007;110(6):1264-1269.
43. Yang YT, Mello MM, Subramanian SV, Studdert DM. Relationship between malpractice litigation pressure and rates of cesarean section and vaginal birth after cesarean section. Med Care. 2009;47(2):234-242.
44. Brill Y, Kingdom J, Thomas J, et al. The management of VBAC at term: a survey of Canadian obstetricians. J Obstet Gynaecol Can. 2003;25(4):300-310.
45. Coleman VH, Erickson K, Schulkin J, Zinberg S, Sachs BP. Vaginal birth after cesarean delivery: practice patterns of obstetrician-gynecologists. J Reprod Med. 2005;50(4):261-266.
46. Dodd J, Crowther CA. Vaginal birth after Caesarean section: a survey of practice in Australia and New Zealand. Aust N Z J Obstet Gynaecol. 2003;43(3):226-231.
47. Kamal P, Dixon-Woods M, Kurinczuk JJ, Oppenheimer C, Squire P, Waugh J. Factors influencing repeat caesarean section: qualitative exploratory study of obstetricians' and midwives' accounts. BJOG. 2005;112(8):1054-1060.
48. Kenton K, Brincat C, Mutone M, Brubaker L. Repeat cesarean section and primary elective cesarean section: recently trained obstetrician-gynecologist practice patterns and opinions. Am J Obstet Gynecol. 2005;192(6):1872-1875; discussion 1875-1876.
49. Sur S, Murphy KW, Mackenzie IZ. Delivery after caesarean section: consultant obstetricians' professional advice and personal preferences. J Obstet Gynaecol. 2009;29(3):212-216.
50. Guise J-M. Anticipating and responding to obstetric emergencies. Best Pract Res Clin Obstet Gynaecol. 2007;21(4):625-638.
51. Guise J-M, Segel S. Teamwork in obstetric critical care. Best Pract Res Clin Obstet Gynaecol. 2008;22(5):937-951.
52. Veltman L. Vaginal birth after cesarean checklist; an evidence-based approach to improving care during VBAC trials. J Healthc Risk Manag. 2009;29(1):22-27.
53. ACOG practice bulletin. Vaginal birth after previous cesarean delivery. Number 5, July 1999 (replaces practice bulletin number 2, October 1998). Clinical management guidelines for obstetrician-gynecologists. American College of Obstetricians and Gynecologists. Int J Gynaecol Obstet. 1999;66(2):197-204.
54. Pinette MG, Kahn J, Gross KL, Wax JR, Blackstone J, Cartin A. Vaginal birth after Cesarean rates are declining rapidly in the rural state of Maine. J Matern Fetal Neonatal Med. 2004;16(1):37-43.
55. Misra A. Impact of the HealthChoice program on cesarean section and vaginal birth after C-section deliveries: a retrospective analysis. Matern Child Health J. 2008;12(2):266-274.
56. Roberts RG, Deutchman M, King VJ, Fryer GE, Miyoshi TJ. Changing policies on vaginal birth after cesarean: impact on access. Birth. 2007;34(4):316-322.
158
57. Oleske DM, Linn ES, Nachman KL, Marder RJ, Thompson LD. Cesarean and VBAC delivery rates in Medicaid managed care, Medicaid fee-for-service, and private managed care. Birth. 1998;25(2):125-127.
58. Wagner CL, Metts AK. Rates of successful vaginal delivery after cesarean for patients with private versus public insurance. J Perinatol. 1999;19(1):14-18.
59. Grant D. Physician financial incentives and cesarean delivery: new conclusions from the healthcare cost and utilization project. J Health Econ. 2009;28(1):244-250.
60. Hammoud A, Hendler I, Gauthier RJ, Berman S, Sansregret A, Bujold E. The effect of gestational age on trial of labor after Cesarean section. J Matern Fetal Neonatal Med. 2004;15(3):202-206.
61. Quinones JN, Stamilio DM, Pare E, Peipert JF, Stevens E, Macones GA. The effect of prematurity on vaginal birth after cesarean delivery: success and maternal morbidity. Obstet Gynecol. 2005;105(3):519-524.
62. Guise JM, McDonagh MS, Hashima J, et al. Vaginal birth after cesarean (VBAC). Evid Rep Technol Assess (Summ). 2003(71):1-8.
63. MacDorman MF, Kirmeyer S, MacDorman MF, Kirmeyer S. Fetal and perinatal mortality, United States, 2005. Natl Vital Stat Rep. 2009;57(8):1-19.
64. Slavin RE. Best Evidence Synthesis: An Intelligent Alternative to Meta-Analysis. J Clin Epidemiol. 1995;48(1):9-18.
65. Agency for Healthcare Research and Quality. Methods Reference Guide for Effectiveness and Comparative Effectiveness Reviews, Version 1.0. Rockville, MD 2007.
66. Deeks JJ, Dinnes J, D'Amico R, et al. Evaluating non-randomised intervention studies. Health Tech Assess. 2003;7(27):iii-x, 1-173.
67. Altman DG. Practical Statistics for Medical Research. London: Chapman & Hall; 1991.
68. DerSimonian R, Laird N. Meta-analysis in clinical trials. Control Clin Trials. 1986;7(3):177-188.
69. Higgins JP, Green S. Cochrane Handbook for Systematic Reviews of Interventions Version 5.0.2. The Cochrane Collaboration. 2009.
70. Tufts Medical Center. MetaAnalyst: Powerful meta-analysis software. http://tuftscaes.org/meta_analyst/. Accessed Dec 8, 2009.
71. Turner RM, Omar RZ, Yang M, Goldstein H, Thompson SG. A multilevel model framework for meta-analysis of clinical trials with binary outcomes. Stat Med. 2000;19:3417-3432.
72. Hamza TH, van Houwelingen HC, Stijnen T, Hamza TH, van Houwelingen HC, Stijnen T. The binomial distribution of meta-analysis was preferred to model within-study variability. J Clin Epidemiol. 2008;61(1):41-51.
73. Lewis S, Clarke M. Forest plots: trying to see the wood and the trees. BMJ. 2001;322(7300):1479-1480.
74. Sutton AJ, Abrams KR, Jones DR, Sheldon TA, Song F. Methods for Meta-Analysis in Medical Research: John Wiley & Sons, Inc.; 2000.
75. Thompson SG, Sharp SJ. Explaining heterogeneity in meta-analysis: a comparison of methods. Stat Med. 1999;18(20):2693-2708.
76. Bais JM, van der Borden DM, Pel M, et al. Vaginal birth after caesarean section in a population with a low overall caesarean section rate. Eur J Obstet Gynecol Reprod Biol. 2001;96(2):158-162.
77. Flamm BL, Goings JR, Liu Y, Wolde-Tsadik G. Elective repeat cesarean delivery versus trial of labor: a prospective multicenter study. Obstet Gynecol. 1994;83(6):927-932.
78. Hibbard JU, Gilbert S, Landon MB, et al. Trial of labor or repeat cesarean delivery in women with morbid obesity and previous cesarean delivery. Obstet Gynecol. 2006;108(1):125-133.
79. Hook B, Kiwi R, Amini SB, Fanaroff A, Hack M. Neonatal morbidity after elective repeat cesarean section and trial of labor. Pediatrics. 1997;100(3 Pt 1):348-353.
80. Landon MB, Spong CY, Thom E, et al. Risk of uterine rupture with a trial of labor in women with multiple and single prior cesarean delivery. Obstet Gynecol. 2006;108(1):12-20.
81. Phelan JP, Clark SL, Diaz F, Paul RH. Vaginal birth after cesarean. Am J Obstet Gynecol. 1987;157(6):1510-1515.
82. Rozenberg P, Goffinet F, Philippe HJ, Nisand I. Thickness of the lower uterine segment: its influence in the management of patients with previous cesarean sections. Eur J Obstet Gynecol Reprod Biol. 1999;87(1):39-45.
83. Rozenberg P, Goffinet F, Phillippe HJ, Nisand I. Ultrasonographic measurement of lower uterine segment to assess risk of defects of scarred uterus. Lancet. 1996;347(8997):281-284.
84. Stovall TG, Shaver DC, Solomon SK, Anderson GD. Trial of labor in previous cesarean section patients, excluding classical cesarean sections. Obstet Gynecol. 1987;70(5):713-717.
85. Strong JM, McQuillan K. Factors affecting mode of delivery in labour following a single previous birth by cesarean. J Obstet Gynaecol. 1996;16(5).
86. Cameron CA, Roberts CL, Peat B. Predictors of labor and vaginal birth after cesarean section. Int J Gynaecol Obstet. 2004;85(3):267-269.
87. DeFranco EA, Rampersad R, Atkins KL, et al. Do vaginal birth after cesarean outcomes differ based on hospital setting? Am J Obstet Gynecol. 2007;197(4):400.e401-406.
88. DiMaio H, Edwards RK, Euliano TY, Treloar RW, Cruz AC. Vaginal birth after cesarean delivery: an historic cohort cost analysis. Am J Obstet Gynecol. 2002;186(5):890-892.
159
89. Durnwald C, Mercer B. Vaginal birth after Cesarean delivery: predicting success, risks of failure. J Matern Fetal Neonatal Med. 2004;15(6):388-393.
90. Fisler RE, Cohen A, Ringer SA, Lieberman E. Neonatal outcome after trial of labor compared with elective repeat cesarean section. Birth. 2003;30(2):83-88.
91. Gonen R, Nisenblat V, Barak S, Tamir A, Ohel G. Results of a well-defined protocol for a trial of labor after prior cesarean delivery. Obstet Gynecol. 2006;107(2 Pt 1):240-245.
92. Gregory KD, Korst LM, Cane P, Platt LD, Kahn K. Vaginal birth after cesarean and uterine rupture rates in California. Obstet Gynecol. 1999;94(6):985-989.
93. Gregory KD, Korst LM, Fridman M, et al. Vaginal birth after cesarean: clinical risk factors associated with adverse outcome. Am J Obstet Gynecol. 2008;198(4):452.e451-410; discussion 452.e410-452.
94. Hueston WJ, Rudy M. Factors predicting elective repeat cesarean delivery. Obstet Gynecol. 1994;83(5 Pt 1):741-744.
95. Kugler E, Shoham-Vardi I, Burstien E, Mazor M, Hershkovitz R. The safety of a trial of labor after cesarean section in a grandmultiparous population. Arch Gynecol Obstet. 2008;277(4):339-344.
96. Locatelli A, Regalia AL, Ghidini A, Ciriello E, Biffi A, Pezzullo JC. Risks of induction of labour in women with a uterine scar from previous low transverse caesarean section. BJOG. 2004;111(12):1394-1399.
97. Loebel G, Zelop CM, Egan JFX, Wax J. Maternal and neonatal morbidity after elective repeat Cesarean delivery versus a trial of labor after previous Cesarean delivery in a community teaching hospital. J Matern Fetal Neonatal Med. 2004;15(4):243-246.
98. Macones GA, Peipert J, Nelson DB, et al. Maternal complications with vaginal birth after cesarean delivery: a multicenter study. Am J Obstet Gynecol. 2005;193(5):1656-1662.
99. McNally OM, Turner MJ. Induction of labour after 1 previous Caesarean section. Aust N Z J Obstet Gynaecol. 1999;39(4):425-429.
100. Obara H, Minakami H, Koike T, Takamizawa S, Matsubara S, Sato I. Vaginal birth after cesarean delivery: results in 310 pregnancies. J Obstet Gynaecol Res. 1998;24(2):129-134.
101. Pang MW, Law LW, Leung TY, Lai PY, La TK. Sociodemographic factors and pregnancy events associated with women who declined vaginal birth after cesarean section. Eur J Obstet Gynecol Reprod Biol. 2009;143(1):24-28.
102. Pickhardt MG, Martin JN, Jr., Meydrech EF, et al. Vaginal birth after cesarean delivery: are there useful and valid predictors of success or failure? Am J Obstet Gynecol. 1992;166(6 Pt 1):1811-1815; discussion 1815-1819.
103. Smith GCS, Pell JP, Cameron AD, Dobbie R. Risk of perinatal death associated with labor after previous cesarean delivery in uncomplicated term pregnancies. JAMA. 2002;287(20):2684-2690.
104. Smith GCS, White IR, Pell JP, Dobbie R. Predicting cesarean section and uterine rupture among women attempting vaginal birth after prior cesarean section. PLoS Med. 2005;2(9):e252.
105. Socol ML, Peaceman AM. Vaginal birth after cesarean: an appraisal of fetal risk. Obstet Gynecol. 1999;93(5 Pt 1):674-679.
106. Spaans WA, Sluijs MB, van Roosmalen J, Bleker OP. Risk factors at caesarean section and failure of subsequent trial of labour. Eur J Obstet Gynecol Reprod Biol. 2002;100(2):163-166.
107. Troyer LR, Parisi VM. Obstetric parameters affecting success in a trial of labor: designation of a scoring system. Am J Obstet Gynecol. 1992;167(4 Pt 1):1099-1104.
108. Wen SW, Rusen ID, Walker M, et al. Comparison of maternal mortality and morbidity between trial of labor and elective cesarean section among women with previous cesarean delivery. Am J Obstet Gynecol. 2004;191(4):1263-1269.
109. Martin JA, Hamilton BE, Menacker F, Sutton PD, Mathews JT. Preliminary births for 2004: Infant and maternal health. Health E-stats. Hyattsville, MD: National Center for Health Statistics; 2005.
110. Durnwald CP, Ehrenberg HM, Mercer BM. The impact of maternal obesity and weight gain on vaginal birth after cesarean section success. Am J Obstet Gynecol. 2004;191(3):954-957.
111. Kabir AA, Pridjian G, Steinmann WC, Herrera EA, Khan MM. Racial differences in cesareans: an analysis of U.S. 2001 National Inpatient Sample Data.[see comment][erratum appears in Obstet Gynecol. 2005 Jun;105(6):1495]. Obstet Gynecol. 2005;105(4):710-718.
112. Bujold E. Uterine rupture during a trial of labor after a one- versus two-layer closure of low transverse cesarean. Am J Obstet Gynecol. 2001;184(suppl)(S18).
113. Chang JJ, Stamilio DM, Macones GA. Effect of hospital volume on maternal outcomes in women with prior cesarean delivery undergoing trial of labor. Am J Epidemiol. 2008;167(6):711-718.
114. Harper LM, Cahill AG, Stamilio DM, Odibo AO, Peipert JF, Macones GA. Effect of gestational age at the prior cesarean delivery on maternal morbidity in subsequent VBAC attempt. Am J Obstet Gynecol. 2009;200(3):276.e271-276.
115. Hendler I, Bujold E. Effect of prior vaginal delivery or prior vaginal birth after cesarean delivery on obstetric outcomes in women undergoing trial of labor. Obstet Gynecol. 2004;104(2):273-277.
160
116. Jakobi P, Weissman A, Peretz BA, Hocherman I. Evaluation of prognostic factors for vaginal delivery after cesarean section. J Reprod Med. 1993;38(9):729-733.
117. Lieberman E, Ernst EK, Rooks JP, Stapleton S, Flamm B. Results of the national study of vaginal birth after cesarean in birth centers. Obstet Gynecol. 2004;104(5 Pt 1):933-942.
118. van Gelderen CJ, England MJ, Naylor GA, Katzeff TC. Labour in patients with a caesarean section scar. The place of oxytocin augmentation. S Afr Med J. 1986;70(9):529-532.
119. Caughey AB, Shipp TD, Repke JT, Zelop CM, Cohen A, Lieberman E. Rate of uterine rupture during a trial of labor in women with one or two prior cesarean deliveries. Am J Obstet Gynecol. 1999;181(4):872-876.
120. Costantine MM, Fox K, Byers BD, et al. Validation of the prediction model for success of vaginal birth after cesarean delivery. Obstet Gynecol. 2009;114(5):1029-1033.
121. Delaney T, Young DC. Spontaneous versus induced labor after a previous cesarean delivery. Obstet Gynecol. 2003;102(1):39-44.
122. Dinsmoor MJ, Brock EL. Predicting failed trial of labor after primary cesarean delivery. Obstet Gynecol. 2004;103(2):282-286.
123. Elkousy MA, Sammel M, Stevens E, Peipert JF, Macones G. The effect of birth weight on vaginal birth after cesarean delivery success rates. Am J Obstet Gynecol. 2003;188(3):824-830.
124. El-Sayed YY, Watkins MM, Fix M, Druzin ML, Pullen KM, Caughey AB. Perinatal outcomes after successful and failed trials of labor after cesarean delivery. Am J Obstet Gynecol. 2007;196(6):583.e581-585; discussion 583.e585.
125. Flamm BL, Goings JR, Fuelberth NJ, Fischermann E, Jones C, Hersh E. Oxytocin during labor after previous cesarean section: results of a multicenter study. Obstet Gynecol. 1987;70(5):709-712.
126. Goodall PT, Ahn JT, Chapa JB, Hibbard JU. Obesity as a risk factor for failed trial of labor in patients with previous cesarean delivery. Am J Obstet Gynecol. 2005;192(5):1423-1426.
127. Gyamfi C, Juhasz G, Gyamfi P, Stone JL. Increased success of trial of labor after previous vaginal birth after cesarean. Obstet Gynecol. 2004;104(4):715-719.
128. Hashima JN, Guise J-M. Vaginal birth after cesarean: a prenatal scoring tool. Am J Obstet Gynecol. 2007;196(5):e22-23.
129. Hollard AL, Wing DA, Chung JH, et al. Ethnic disparity in the success of vaginal birth after cesarean delivery. J Matern Fetal Neonatal Med. 2006;19(8):483-487.
130. Horenstein JM, Eglinton GS, Tahilramaney MP, Boucher M, Phelan JP. Oxytocin use during a trial of labor in patients with previous cesarean section. J Reprod Med. 1984;29(1):26-30.
131. Horenstein JM, Phelan JP. Previous cesarean section: the risks and benefits of oxytocin usage in a trial of labor. Am J Obstet Gynecol. 1985;151(5):564-569.
132. Hoskins IA, Gomez JL. Correlation between maximum cervical dilatation at cesarean delivery and subsequent vaginal birth after cesarean delivery. Obstet Gynecol. 1997;89(4):591-593.
133. Huang WH, Nakashima DK, Rumney PJ, Keegan KA, Jr., Chan K. Interdelivery interval and the success of vaginal birth after cesarean delivery. Obstet Gynecol. 2002;99(1):41-44.
134. Johnson C, Oriol N, Flood K. Trial of labor: a study of 110 patients. J Clin Anesth. 1991;3(3):216-218; discussion 214-215.
135. Juhasz G, Gyamfi C, Gyamfi P, Tocce K, Stone JL. Effect of body mass index and excessive weight gain on success of vaginal birth after cesarean delivery. Obstet Gynecol. 2005;106(4):741-746.
136. Learman LA, Evertson LR, Shiboski S. Predictors of repeat cesarean delivery after trial of labor: do any exist? J Am Coll Surg. 1996;182(3):257-262.
137. Nguyen TV, Dinh TV, Suresh MS, Kinch RA, Anderson GD. Vaginal birth after cesarean section at the University of Texas. J Reprod Med. 1992;37(10):880-882.
138. Ouzounian JG, Miller DA, Paul RH. Amnioinfusion in women with previous cesarean births: a preliminary report. Am J Obstet Gynecol. 1996;174(2):783-786.
139. Pathadey SD, Van Woerden HC, Jenkinson SD. Induction of labour after a previous caesarean section: a retrospective study in a district general hospital. J Obstet Gynaecol. 2005;25(7):662-665.
140. Raynor BD. The experience with vaginal birth after cesarean delivery in a small rural community practice. Am J Obstet Gynecol. 1993;168(1 Pt 1):60-62.
141. Sakala EP, Kaye S, Murray RD, Munson LJ. Oxytocin use after previous cesarean: why a higher rate of failed labor trial? Obstet Gynecol. 1990;75(3 Pt 1):356-359.
142. Vinueza CA, Chauhan SP, Barker L, Hendrix NW, Scardo JA. Predicting the success of a trial of labor with a simple scoring system. J Reprod Med. 2000;45(4):332-336.
143. Weinstein D, Benshushan A, Tanos V, Zilberstein R, Rojansky N. Predictive score for vaginal birth after cesarean section. Am J Obstet Gynecol. 1996;174(1 Pt 1):192-198.
144. Yetman TJ, Nolan TE. Vaginal birth after cesarean section: a reappraisal of risk. Am J Obstet Gynecol. 1989;161(5):1119-1123.
145. Yogev Y, Ben-Haroush A, Lahav E, Horowitz E, Hod M, Kaplan B. Induction of labor with prostaglandin E2 in women with previous cesarean section and unfavorable cervix. Eur J Obstet Gynecol Reprod Biol. 2004;116(2):173-176.
161
146. Zelop CM, Shipp TD, Cohen A, Repke JT, 161. Rayburn WF, Gittens LN, Lucas MJ, Gall SA, Lieberman E. Trial of labor after 40 weeks' Martin ME. Weekly administration of gestation in women with prior cesarean. Obstet prostaglandin E2 gel compared with expectant Gynecol. 2001;97(3):391-393. management in women with previous cesareans.
147. Agnew G, Turner MJ. Vaginal prostaglandin gel Prepidil Gel Study Group. Obstet Gynecol. to induce labour in women with one previous 1999;94(2):250-254. caesarean section. J Obstet Gynaecol. 162. Silver RK, Gibbs RS. Predictors of vaginal 2009;29(3):209-211. delivery in patients with a previous cesarean
148. Ben-Aroya Z, Hallak M, Segal D, Friger M, Katz section, who require oxytocin. Am J Obstet M, Mazor M. Ripening of the uterine cervix in a Gynecol. 1987;156(1):57-60. post-cesarean parturient: prostaglandin E2 versus 163. Umeadi UP, Mehta R, Thomas S. Delivery Foley catheter. J Matern Fetal Neonatal Med. outcome after induction of labour using 2002;12(1):42-45. prostaglandin in women with one previous
149. Blanco JD, Collins M, Willis D, Prien S. caesarean section. J Obstet Gynaecol. Prostaglandin E2 gel induction of patients with a 2007;27(8):810-811. prior low transverse cesarean section. Am J 164. Zelop CM, Shipp TD, Repke JT, Cohen A, Perinatol. 1992;9(2):80-83. Caughey AB, Lieberman E. Uterine rupture
150. Bujold E, Blackwell SC, Gauthier RJ. Cervical during induced or augmented labor in gravid ripening with transcervical foley catheter and the women with one prior cesarean delivery. Am J risk of uterine rupture. Obstet Gynecol. Obstet Gynecol. 1999;181(4):882-886. 2004;103(1):18-23. 165. Ardiet E, Subtil D, Puech F. Cervical ripening
151. Chilaka VN, Cole MY, Habayeb OMH, Konje with dinoprostone gel and previous cesarean JC. Risk of uterine rupture following induction of delivery. Int J Gynaecol Obstet. 2005;91(3):260-labour in women with a previous caesarean 261. section in a large UK teaching hospital. J Obstet 166. Cnattingius R, Hoglund B, Kieler H. Emergency Gynaecol. 2004;24(3):264-265. cesarean delivery in induction of labor: an
152. Del Valle GO, Adair CD, Sanchez-Ramos L, evaluation of risk factors. Acta Obstet Gynecol Gaudier FL, McDyer DC, Delke I. Cervical Scand. 2005;84(5):456-462. ripening in women with previous cesarean 167. Flamm BL, Geiger AM. Vaginal birth after deliveries. Int J Gynaecol Obstet. 1994;47(1):17- cesarean delivery: an admission scoring system. 21. Obstet Gynecol. 1997;90(6):907-910.
153. Flamm BL, Anton D, Goings JR, Newman J. 168. Locatelli A, Ghidini A, Ciriello E, Incerti M, Prostaglandin E2 for cervical ripening: a Bonardi C, Regalia AL. Induction of labor: multicenter study of patients with prior cesarean comparison of a cohort with uterine scar from delivery. Am J Perinatol. 1997;14(3):157-160. previous cesarean section vs. a cohort with intact
154. Gibson DH. Vaginal delivery after caesarean uterus. J Matern Fetal Neonatal Med. section in primigravidae. Ir J Med Sci. 2006;19(8):471-475. 1988;157(9):290-292. 169. Ravasia DJ, Wood SL, Pollard JK. Uterine
155. Goldberger SB, Rosen DJ, Michaeli G, Markov rupture during induced trial of labor among S, Ben-Nun I, Fejgin MD. The use of PGE2 for women with previous cesarean delivery. Am J induction of labor in parturients with a previous Obstet Gynecol. 2000;183(5):1176-1179. cesarean section scar. Acta Obstet Gynecol 170. Taylor DR, Doughty AS, Kaufman H, Yang L, Scand. 1989;68(6):523-526. Iannucci TA. Uterine rupture with the use of
156. Grobman WA, Gilbert S, Landon MB, et al. PGE2 vaginal inserts for labor induction in Outcomes of induction of labor after one prior women with previous cesarean sections. J Reprod cesarean. Obstet Gynecol. 2007;109(2 Pt 1):262- Med. 2002;47(7):549-554. 269. 171. Katz VL, Farmer RM, Dean CA, Carpenter ME.
157. Kayani SI, Alfirevic Z. Uterine rupture after Use of misoprostol for cervical ripening. South induction of labour in women with previous Med J. 2000;93(9):881-884. caesarean section. BJOG. 2005;112(4):451-455. 172. Choy-Hee L, Raynor BD. Misoprostol induction
158. Meehan FP, Burke G. Trial of labour following of labor among women with a history of cesarean prior section; a 5 year prospective study (1982- delivery. Am J Obstet Gynecol. 1987). Eur J Obstet Gynecol Reprod Biol. 2001;184(6):1115-1117. 1989;31(2):109-117. 173. Lelaidier C, Baton C, Benifla JL, Fernandez H,
159. Norman M, Ekman G. Preinductive cervical Bourget P, Frydman R. Mifepristone for labour ripening with prostaglandin E2 in women with induction after previous caesarean section. Br J one previous cesarean section. Acta Obstet Obstet Gynaecol. 1994;101(6):501-503. Gynecol Scand. 1992;71(5):351-355. 174. Goetzl L, Shipp TD, Cohen A, Zelop CM, Repke
160. Rageth JC, Juzi C, Grossenbacher H. Delivery JT, Lieberman E. Oxytocin dose and the risk of after previous cesarean: a risk evaluation. Swiss uterine rupture in trial of labor after cesarean. Working Group of Obstetric and Gynecologic Obstet Gynecol. 2001;97(3):381-384. Institutions. Obstet Gynecol. 1999;93(3):332-337.
162
175. Paul RH, Phelan JP, Yeh SY. Trial of labor in the 188. Zelop CM, Shipp TD, Repke JT, Cohen A, patient with a prior cesarean birth. Am J Obstet Lieberman E. Outcomes of trial of labor Gynecol. 1985;151(3):297-304. following previous cesarean delivery among
176. Taylor AVG, Sellers S, Ah-Moye M, MacKenzie women with fetuses weighing >4000 g. Am J IZ. A prospective random allocation trial to Obstet Gynecol. 2001;185(4):903-905. compare vaginal prostaglandin E2 with 189. Macones GA, Hausman N, Edelstein R, Stamilio intravenous oxytocin for labour induction in DM, Marder SJ. Predicting outcomes of trials of women previously delivered by caesarean labor in women attempting vaginal birth after section. J Obstet Gynecol. 1993;13(5):333-336. cesarean delivery: a comparison of multivariate
177. Hannah ME, Ohlsson A, Farine D, et al. methods with neural networks. Am J Obstet Induction of labor compared with expectant management for prelabor rupture of the 190.
Gynecol. 2001;184(3):409-413. Cahill AG, Stamilio DM, Odibo AO, Peipert J,
membranes at term. N Engl J Med. Stevens E, Macones GA. Racial disparity in the 1996;334(16):1005-1010. success and complications of vaginal birth after
178. Peleg D, Hannah ME, Hodnett ED, Foster GA, Willan AR, Farine D. Predictors of cesarean
cesarean delivery. Obstet Gynecol. 2008;111(3):654-658.
delivery after prelabor rupture of membranes at 191. Caughey AB, Shipp TD, Repke JT, Zelop C, term. Obstet Gynecol. 1999;93(6):1031-1035. Cohen A, Lieherman E. Trial of labor after
179. Khotaba S, Volfson M, Tarazova L, et al. cesarean delivery: the effect of previous vaginal Induction of labor in women with previous delivery. Am J Obstet Gynecol. 1998;179(4):938-cesarean section using the double balloon device. 941. Acta Obstet Gynecol Scand. 2001;80(11):1041- 192. Mercer BM, Gilbert S, Landon MB, et al. Labor 1042. outcomes with increasing number of prior vaginal
180. Segal S, Gemer O, Zohav E, Siani M, Sassoon E. births after cesarean delivery. Obstet Gynecol. Evaluation of breast stimulation for induction of 2008;111(2 Pt 1):285-291. labor in women with a prior cesarean section and 193. Simon R, Altman D. Statistical aspects of in grandmultiparas. Acta Obstet Gynecol Scand. 1995;74(1):40-41.
prognostic factor studies in oncology. Br J Cancer. 1994;69:979-985.
181. Grobman WA, Lai Y, Landon MB, et al. 194. Hashima JN, Eden KB, Osterweil P, Nygren P, Development of a nomogram for prediction of Guise J-M. Predicting vaginal birth after cesarean vaginal birth after cesarean delivery. Obstet Gynecol. 2007;109(4):806-812.
delivery: a review of prognostic factors and screening tools. Am J Obstet Gynecol.
182. Landon MB, Leindecker S, Spong CY, et al. The 2004;190(2):547-555. MFMU Cesarean Registry: factors affecting the 195. Altman D. Prognosis and prognostic research: success of trial of labor after previous cesarean delivery. Am J Obstet Gynecol. 2005;193(3 Pt
validating prognostic model. BMJ. 2009;338:1430-1435.
2):1016-1023. 196. Alamia VJ, Meyer BA, Selioutski O, Vohra N. 183. Bujold E, Blackwell SC, Hendler I, Berman S, Can a VBAC scoring system predict uterine
Sorokin Y, Gauthier RJ. Modified Bishop's score rupture in patients attempting a trial of labor? and induction of labor in patients with a previous cesarean delivery. Am J Obstet Gynecol.
Paper presented at: ACOG 47th Annual Clinical Meeting; May 19, 1999.
2004;191(5):1644-1648. 197. Macones GA. The utility of clinical tests of 184. Gonen R, Tamir A, Degani S, Ohel G. Variables eligibility for a trial of labour following a
associated with successful vaginal birth after one cesarean section: a proposed vaginal birth after
caesarean section: a decision analysis. Br J Obstet Gynaecol. 1999;106(7):642-646.
cesarean section score. Am J Perinatol. 198. Hoyert DL, Hoyert DL. Maternal mortality and 2004;21(8):447-453. related concepts. Vital Health Stat [3].
185. King DE, Lahiri K. Socioeconomic factors and the odds of vaginal birth after cesarean delivery. 199.
2007(33):1-13. Kung HC, Hoyert DL, Xu J, et al. Deaths: final
JAMA. 1994;272(7):524-529. data for 2005. Natl Vital Stat Rep. 2008;56(10):1-186. Shipp TD, Zelop CM, Repke JT, Cohen A, 120.
Caughey AB, Lieberman E. Labor after previous cesarean: influence of prior indication and parity.
200. Minino AM, Heron MP, Murphy SL, et al. Deaths: final data for 2004. Natl Vital Stat Rep.
Obstet Gynecol. 2000;95(6 Pt 1):913-916. 2007;55(19):1-119. 187. Srinivas SK, Stamilio DM, Stevens EJ, Odibo 201. Eglinton GS, Phelan JP, Yeh S, Diaz FP, Wallace
AO, Peipert JF, Macones GA. Predicting failure of a vaginal birth attempt after cesarean delivery.
TM, Paul RH. Outcome of a trial of labor after prior cesarean delivery. J Reprod Med.
Obstet Gynecol. 2007;109(4):800-805. 1984;29(1):3-8. 202. Eriksen NL, Buttino L, Jr. Vaginal birth after
cesarean: a comparison of maternal and neonatal morbidity to elective repeat cesarean section. Am J Perinatol. 1989;6(4):375-379.
163
203. Martin JN, Jr., Harris BA, Jr., Huddleston JF, et 217. Sciscione AC, Landon MB, Leveno KJ, et al. al. Vaginal delivery following previous cesarean Previous preterm cesarean delivery and risk of
204.
birth. Am J Obstet Gynecol. 1983;146(3):255-263. Spong CY, Landon MB, Gilbert S, et al. Risk of uterine rupture and adverse perinatal outcome at
218.
subsequent uterine rupture. Obstet Gynecol. 2008;111(3):648-653. Shipp TD, Zelop C, Cohen A, Repke JT, Lieberman E. Post-cesarean delivery fever and
205.
term after cesarean delivery. Obstet Gynecol. 2007;110(4):801-807. Cahill AG, Stamilio DM, Odibo AO, et al. Is vaginal birth after cesarean (VBAC) or elective
219.
uterine rupture in a subsequent trial of labor. Obstet Gynecol. 2003;101(1):136-139. Shipp TD, Zelop C, Lieberman E. Assessment of the rate of uterine rupture at the first prenatal
206.
207.
repeat cesarean safer in women with a prior vaginal delivery? Am J Obstet Gynecol. 2006;195(4):1143-1147. Cowan RK, Kinch RA, Ellis B, Anderson R. Trial of labor following cesarean delivery. Obstet Gynecol. 1994;83(6):933-936. Flamm BL, Lim OW, Jones C, Fallon D,
220.
visit: a preliminary evaluation. J Matern Fetal Neonatal Med. 2008;21(2):129-133. Grobman WA, Gersnoviez R, Landon MB, et al. Pregnancy outcomes for women with placenta previa in relation to the number of prior cesarean deliveries. Obstet Gynecol. 2007;110(6):1249-1255.
208.
209.
210.
211.
Newman LA, Mantis JK. Vaginal birth after cesarean section: results of a multicenter study. Am J Obstet Gynecol. 1988;158(5):1079-1084. Flamm BL, Newman LA, Thomas SJ, Fallon D, Yoshida MM. Vaginal birth after cesarean delivery: results of a 5-year multicenter collaborative study. Obstet Gynecol. 1990;76(5 Pt 1):750-754. Caughey AB. Maternal mortality: more than just anecdotal evidence.[comment]. J Perinatol. 2007;27(10):595-596. Weiss JB, Nannini A, Fogerty S. From the Centers for Disease Control and Prevention. Use of hospital discharge data to monitor uterine rupture--Massachusetts, 1990-1997. JAMA. 2000;283(16):2098-2100. Blanchette HA, Nayak S, Erasmus S. Comparison of the safety and efficacy of intravaginal misoprostol (prostaglandin E1) with those of dinoprostone (prostaglandin E2) for cervical ripening and induction of labor in a community hospital. Am J Obstet Gynecol.
221.
222.
223.
224.
225.
Landon MB, Hauth JC, Leveno KJ, et al. Maternal and perinatal outcomes associated with a trial of labor after prior cesarean delivery. N Engl J Med. 2004;351(25):2581-2589. Asakura H, Nakai A, Ishikawa G, Suzuki S, Araki T. Prediction of uterine dehiscence by measuring lower uterine segment thickness prior to the onset of labor: evaluation by transvaginal ultrasonography. J Nippon Med Sch. 2000;67(5):352-356. Bujold E, Jastrow N, Simoneau J, Brunet S, Gauthier R. Prediction of complete uterine rupture by sonographic evaluation of the lower uterine segment. Am J Obstet Gynecol. 2009;201(3):320-322. Cheung VYT. Sonographic measurement of the lower uterine segment thickness in women with previous caesarean section. J Obstet Gynaecol Can. 2005;27(7):674-681. Gotoh H, Masuzaki H, Yoshida A, Yoshimura S, Miyamura T, Ishimaru T. Predicting incomplete uterine rupture with vaginal sonography during
212.
213.
214.
215.
216.
1999;180(6 Pt 1):1551-1559. Strong TH, Jr., Vega JS, O'Shaughnessy MJ, Feldman DB, Koemptgen JG. Amnioinfusion among women attempting vaginal birth after cesarean delivery. Obstet Gynecol. 1992;79(5 ( Pt 1)):673-674. Bujold E, Bujold C, Hamilton EF, Harel F, Gauthier RJ. The impact of a single-layer or double-layer closure on uterine rupture. Am J Obstet Gynecol. 2002;186(6):1326-1330. Bujold E, Gauthier RJ. Neonatal morbidity associated with uterine rupture: what are the risk factors? Am J Obstet Gynecol. 2002;186(2):311-314. Grobman WA, Lai Y, Landon MB, et al. Prediction of uterine rupture associated with attempted vaginal birth after cesarean delivery. Am J Obstet Gynecol. 2008;199(1):30.e31-35. Kieser KE, Baskett TF. A 10-year population-based study of uterine rupture. Obstet Gynecol.
226.
227.
228.
229.
the late second trimester in women with prior cesarean. Obstet Gynecol. 2000;95(4):596-600. Michaels WH, Thompson HO, Boutt A, Schreiber FR, Michaels SL, Karo J. Ultrasound diagnosis of defects in the scarred lower uterine segment during pregnancy. Obstet Gynecol. 1988;71(1):112-120. Petrikovsky BM. Endoscopic assessment of the integrity of the postcesarean uterine wall before a trial of labor. Transcervical Endoscopy Registry. J Reprod Med. 1994;39(6):464-466. Sibony O, Alran S, Oury J-F. Vaginal birth after cesarean section: X-ray pelvimetry at term is informative. J Perinat Med. 2006;34(3):212-215. Tanik A, Ustun C, Cil E, Arslan A. Sonographic evaluation of the wall thickness of the lower uterine segment in patients with previous cesarean section. J Clin Ultrasound. 1996;24(7):355-357.
2002;100(4):749-753.
164
230. Macones GA, Cahill AG, Stamilio DM, Odibo A, Peipert J, Stevens EJ. Can uterine rupture in
244. Phipps MG, Watabe B, Clemons JL, Weitzen S, Myers DL. Risk factors for bladder injury during
231.
patients attempting vaginal birth after cesarean delivery be predicted? Am J Obstet Gynecol. 2006;195(4):1148-1152. Bujold E, Mehta SH, Bujold C, Gauthier RJ.
245.
cesarean delivery. Obstet Gynecol. 2005;105(1):156-160. Makoha FW, Fathuddien MA, Felimban HM. Choice of abdominal incision and risk of trauma
232.
233.
234.
235.
Interdelivery interval and uterine rupture. Am J Obstet Gynecol. 2002;187(5):1199-1202. Leung AS, Farmer RM, Leung EK, Medearis AL, Paul RH. Risk factors associated with uterine rupture during trial of labor after cesarean delivery: a case-control study. Am J Obstet Gynecol. 1993;168(5):1358-1363. Leung AS, Leung EK, Paul RH. Uterine rupture after previous cesarean delivery: maternal and fetal consequences. Am J Obstet Gynecol. 1993;169(4):945-950. Hibbard JU, Ismail MA, Wang Y, Te C, Karrison T. Failed vaginal birth after a cesarean section: how risky is it? I. Maternal morbidity. Am J Obstet Gynecol. 2001;184(7):1365-1371; discussion 1371-1363. Juntunen K, Makarainen L, Kirkinen P. Outcome
246.
247.
248.
to the urinary bladder and bowel in multiple cesarean sections. Eur J Obstet Gynecol Reprod Biol. 2006;125(1):50-53. Richter HE, Brumfield CG, Cliver SP, Burgio KL, Neely CL, Varner RE. Risk factors associated with anal sphincter tear: a comparison of primiparous patients, vaginal births after cesarean deliveries, and patients with previous vaginal delivery. Am J Obstet Gynecol. 2002;187(5):1194-1198. Hemminki E, Shelley J, Gissler M. Mode of delivery and problems in subsequent births: a register-based study from Finland. Am J Obstet Gynecol. 2005;193(1):169-177. Hershkowitz R, Fraser D, Mazor M, Leiberman JR. One or multiple previous cesarean sections are associated with similar increased frequency of
236.
237.
238.
239.
after a high number (4-10) of repeated caesarean sections. BJOG. 2004;111(6):561-563. Silver RM, Landon MB, Rouse DJ, et al. Maternal morbidity associated with multiple repeat cesarean deliveries. Obstet Gynecol. 2006;107(6):1226-1232. Stafford I, Dildy GA, Clark SL, Belfort MA. Visually estimated and calculated blood loss in vaginal and cesarean delivery. Am J Obstet Gynecol. 2008;199(5):e1-7. Toledo P, McCarthy RJ, Hewlett BJ, Fitzgerald PC, Wong CA. The accuracy of blood loss estimation after simulated vaginal delivery. Anesth Analg. 2007;105(6):1736-1740. Al-Zirqi I, Vangen S, Forsen L, Stray-Pedersen B. Effects of onset of labor and mode of delivery
249.
250.
251.
placenta previa. Eur J Obstet Gynecol Reprod Biol. 1995;62(2):185-188. Nisenblat V, Barak S, Griness OB, Degani S, Ohel G, Gonen R. Maternal complications associated with multiple cesarean deliveries. Obstet Gynecol. 2006;108(1):21-26. Odibo AO, Cahill AG, Stamilio DM, Stevens EJ, Peipert JF, Macones GA. Predicting placental abruption and previa in women with a previous cesarean delivery. Am J Perinatol. 2007;24(5):299-305. Rouse DJ, MacPherson C, Landon M, et al. Blood transfusion and cesarean delivery.[erratum appears in Obstet Gynecol. 2006 Dec;108(6):1556]. Obstet Gynecol. 2006;108(4):891-897.
240.
241.
242.
on severe postpartum hemorrhage. Am J Obstet Gynecol. 2009;201(3):273.e271-279. Chauhan SP, Magann EF, Carroll CS, Barrilleaux PS, Scardo JA, Martin JN, Jr. Mode of delivery for the morbidly obese with prior cesarean delivery: vaginal versus repeat cesarean section. Am J Obstet Gynecol. 2001;185(2):349-354. Upadhyaya CD, Upadhyaya DM, Carlan SJ. Vaginal birth after cesarean delivery in a small rural community with a solo practice. Am J Perinatol. 2003;20(2):63-67. Hansell RS, McMurray KB, Huey GR. Vaginal birth after two or more cesarean sections: a five-
252.
253.
254.
Bodelon C, Bernabe-Ortiz A, Schiff MA, Reed SD. Factors associated with peripartum hysterectomy. Obstet Gynecol. 2009;114(1):115-123. Gilliam M, Rosenberg D, Davis F. The likelihood of placenta previa with greater number of cesarean deliveries and higher parity. Obstet Gynecol. 2002;99(6):976-980. Knight M, Kurinczuk JJ, Spark P, Brocklehurst P, United Kingdom Obstetric Surveillance System Steering C. Cesarean delivery and peripartum hysterectomy. Obstet Gynecol. 2008;111(1):97-105.
243.
year experience. Birth. 1990;17(3):146-150; discussion 150-141. Granovsky-Grisaru S, Shaya M, Diamant YZ. The management of labor in women with more than one uterine scar: is a repeat cesarean section really the only "safe" option? J Perinat Med. 1994;22(1):13-17.
255.
256.
Laughon SK, Wolfe HM, Visco AG. Prior cesarean and the risk for placenta previa on second-trimester ultrasonography. Obstet Gynecol. 2005;105(5 Pt 1):962-965. Wu S, Kocherginsky M, Hibbard JU. Abnormal placentation: twenty-year analysis. Am J Obstet Gynecol. 2005;192(5):1458-1461.
165
257. Lynch CM, Kearney R, Turner MJ. Maternal 272. Boukerrou M, Lambaudie E, Collinet P, Crepin morbidity after elective repeat caesarean section G, Cosson M. A history of cesareans is a risk after two or more previous procedures. Eur J factor in vaginal hysterectomies. Acta Obstet Obstet Gynecol Reprod Biol. 2003;106(1):10-13. Gynecol Scand. 2003;82(12):1135-1139.
258. Miller DA, Chollet JA, Goodwin TM. Clinical 273. David-Montefiore E, Rouzier R, Chapron C, risk factors for placenta previa-placenta accreta. Darai E, Collegiale d'Obstetrique et Gynecologie Am J Obstet Gynecol. 1997;177(1):210-214. de Paris-Ile de F. Surgical routes and
259. Olive EC, Roberts CL, Algert CS, Morris JM. complications of hysterectomy for benign Placenta praevia: maternal morbidity and place of disorders: a prospective observational study in birth. Aust N Z J Obstet Gynaecol. French university hospitals. Hum Reprod. 2005;45(6):499-504. 2007;22(1):260-265.
260. Zelop CM, Harlow BL, Frigoletto FD, Jr., Safon 274. Myers SA, Bennett TL. Incidence of significant LE, Saltzman DH. Emergency peripartum adhesions at repeat cesarean section and the hysterectomy. Am J Obstet Gynecol. relationship to method of prior peritoneal closure. 1993;168(5):1443-1448. J Reprod Med. 2005;50(9):659-662.
261. Taylor VM, Kramer MD, Vaughan TL, Peacock 275. Tulandi T, Agdi M, Zarei A, Miner L, Sikirica V. S. Placenta previa and prior cesarean delivery: Adhesion development and morbidity after repeat how strong is the association? Obstet Gynecol. cesarean delivery. Am J Obstet Gynecol. 1994;84(1):55-57. 2009;201(1):56.e51-56.
262. Clark SL, Koonings PP, Phelan JP. Placenta 276. Al-Took S. Adhesion-related small-bowel previa/accreta and prior cesarean section. Obstet obstruction after gynecologic operations. Am J Gynecol. 1985;66(1):89-92. Obstet Gynecol. 1999;180(2):313-315.
263. Macones GA, Cahill A, Pare E, et al. Obstetric 277. Bahl R, Strachan B, Murphy DJ. Outcome of outcomes in women with two prior cesarean subsequent pregnancy three years after previous deliveries: is vaginal birth after cesarean delivery operative delivery in the second stage of labour: a viable option? Am J Obstet Gynecol. cohort study. BMJ. 2004;328(7435):311. 2005;192(4):1223-1228; discussion 1228-1229. 278. Murphy DJ, Stirrat GM, Heron J, Team AS. The
264. Grubb DK, Kjos SL, Paul RH. Latent labor with relationship between Caesarean section and an unknown uterine scar. Obstet Gynecol. subfertility in a population-based sample of 14 1996;88(3):351-355. 541 pregnancies. Hum Reprod. 2002;17(7):1914-
265. Lin C, Raynor BD. Risk of uterine rupture in 1917. labor induction of patients with prior cesarean 279. Cramer DW, Xu H, Harlow BL. Does "incessant" section: an inner city hospital experience. Am J ovulation increase risk for early menopause? Am Obstet Gynecol. 2004;190(5):1476-1478. J Obstet Gynecol. 1995;172(2 Pt 1):568-573.
266. Tahilramaney MP, Boucher M, Eglinton GS, 280. Bahtiyar MO, Julien S, Robinson JN, et al. Prior Beall M, Phelan JP. Previous cesarean section cesarean delivery is not associated with an and trial of labor. Factors related to uterine increased risk of stillbirth in a subsequent dehiscence. J Reprod Med. 1984;29(1):17-21. pregnancy: analysis of U.S. perinatal mortality
267. Bujold E, Hammoud A, Schild C, Krapp M, data, 1995-1997. Am J Obstet Gynecol. Baumann P. The role of maternal body mass 2006;195(5):1373-1378. index in outcomes of vaginal births after 281. Smith GCS, Pell JP, Dobbie R. Caesarean section cesarean. Am J Obstet Gynecol. and risk of unexplained stillbirth in subsequent 2005;193(4):1517-1521. pregnancy. Lancet. 2003;362(9398):1779-1784.
268. Carroll CS, Sr., Magann EF, Chauhan SP, 282. Bujold E, Francoeur D. Neonatal morbidity and Klauser CK, Morrison JC. Vaginal birth after decision-delivery interval in patients with uterine cesarean section versus elective repeat cesarean rupture.[comment]. J Obstet Gynaecol Can. delivery: Weight-based outcomes. Am J Obstet 2005;27(7):671-673; author reply 673. Gynecol. 2003;188(6):1516-1520; discussion 283. Paterson CM, Saunders NJ. Mode of delivery 1520-1512. after one caesarean section: audit of current
269. Edwards RK, Harnsberger DS, Johnson IM, practice in a health region. BMJ. Treloar RW, Cruz AC. Deciding on route of 1991;303(6806):818-821. delivery for obese women with a prior cesarean 284. Richardson BS, Czikk MJ, daSilva O, Natale R. delivery. Am J Obstet Gynecol. 2003;189(2):385- The impact of labor at term on measures of 389; discussion 389-390. neonatal outcome. Am J Obstet Gynecol.
270. Hamel KJ. Incidence of adhesions at repeat 2005;192(1):219-226. cesarean delivery. Am J Obstet Gynecol. 285. The World Factbook 2008. Washington, D. C.: 2007;196(5):e31-32. Central Intelligence Agency; 2008.
271. Ogunyemi D, Hullett S, Leeper J, Risk A. 286. Kamath BD, Todd JK, Glazner JE, Lezotte D, Prepregnancy body mass index, weight gain Lynch AM. Neonatal outcomes after elective during pregnancy, and perinatal outcome in a cesarean delivery. Obstet Gynecol. rural black population. J Matern Fetal Med. 2009;113(6):1231-1238. 1998;7(4):190-193.
166

287. Warren J, Anderson JM. Respiratory Distress in 290. Brown P. How to formulate research the Term Infant: A Review. [in press]. recommendations. BMJ. 2006;333(14):804-806. Pediatrics. 2009. 291. Ecker JL. Once a pregnancy, always a cesarean?
288. Hankin G, Speer M. Defining the pathogenesis Rationale and feasibility of a randomized and pathophysiology of neonatal encephalopathy controlled trial. . Am J Obstet Gynecol. and cerebral palsy. Obstet Gynecol. 2004;190(2):314-318. 2003;102(3):628-636.
289. Committee on Fetus and Newborn. Levels of Neonatal Care. Pediatrics. 2004;114(5):1341-1347.
167
CI
Abbreviations and Acronyms
ACOG American College of Obstetricians and Gynecologists AUROC Area Under the Receiver Operating Characteristic curve AHRQ Agency for Healthcare Research and Quality AAP American Academy of Pediatrics BMI Body mass index CDC Centers for Disease Control and Prevention
Confidence interval DARE Database of Abstracts of Reviews of Effectiveness EPC Evidence-based Practice Center ERCD Elective repeat cesarean delivery FDA Food and Drug Administration FHR Fetal heart rate FMR Fetal mortality rate FTP Failure to progress GA Gestational age HCUP Healthcare Cost and Utilization Project HIE Hypoxic-ischemic encephalopathy HMO Health Maintenance Organizations I/A Induction/augmentation ICD-9 International Classification of Diseases, 9th Edition/Revision ICU Intensive care unit IOL Induction of labor IRB Institutional review board IRCD Indicated repeat cesarean delivery IUFD Intrapartum fetal demise kg Kilograms LTCD Low transverse cesarean delivery
National Institute of Child Health and Human Development Maternal-Fetal Medicine MFMU Units mL Milliliters mm Millimeters NICU Neonatal intensive care unit NIH National Institutes of Health NMR Neonatal mortality rate NNH Number needed to harm NS Not significant OMAR National Institutes of Health Office of Medical Applications of Research OECD Organization for Economic Cooperation and Development OR Odds ratio PGE2 prostaglandin E2 PMR Perinatal mortality rate RCD Repeat cesarean delivery RCT Randomized controlled trial RD Risk difference RDS Respiratory distress syndrome ROC Receiver operating characteristic
169

Abbreviations and Acronyms
ROM Rupture of the membranes RR Relative risk TEP Technical expert panel TTN Transient tachypnea of the newborn UK United Kingdom US United States of America USPSTF US Preventive Services Task Force VBAC Vaginal birth after cesarean section wk Week(s)
170

Appendix A. Technical Expert Panel Members
Technical Expert Panel MembersEugene Declercq, Ph.D. Assistant Dean, Doctoral Education Professor, Department of Community Health Sciences at Boston University
Stanley Ip, M.D. Investigator, TUFTS University Evidence-based Practice Center at New England Medical Center
Amelia Psmythe Executive Director, Nursing Mothers Counsel of Oregon
Carol Sakala, Ph.D., M.S.P.H. Director of Programs with Childbirth Connections.
John M. Thorp, Jr., M.D. Division Director, Professor Adjunct Professor in the Department of Obstetrics and Gynecology at the University of North Carolina
Linda J. Van Marter, M.D., M.P.H. Associate Professor of Pediatrics at Harvard Medical School, Children's Hospital
Professional Organization Representation
American Academy of Family Physicians
Represented by: Lesley Atwood, M.D.
American Academy of Pediatrics
Represented by: Allen Merritt, M.D., M.P.A:HA
American College of Nurse-Midwives
Represented by: Mary Barger, C.N.M., M.P.H.
American College of Obstetricians and Gynecologists
Represented by: Carolyn Zelop, M.D.
A-1

Appendix B. Expert Reviewers
Individuals Eugene Declercq, Ph.D. Assistant Dean, Doctoral Education Professor, Department of Community Health Sciences at Boston University
William Grobman, M.D., M.B.A. Assistant Professor of Obstetrics and Gynecology, Section of Maternal-Fetal Medicine, Department of Obstetrics and Gynecology, Assistant Professor of Preventative Medicine, Department of Preventative Medicine, Northwestern University Medical School
Stanley Ip, M.D. Investigator, TUFTS University Evidence-based Practice Center at New England Medical Center
Diana Petitti, M.D., M.P.H. Professor of Biomedical Informatics at Arizona State University
Amelia Psmythe Executive Director, Nursing Mothers Counsel of Oregon
Carol Sakala, Ph.D., M.S.P.H. Director of Programs with Childbirth Connections.
James Scott, M.D. Professor of Obstetrics and Gynecology in the School of Medicine at the University of Utah and Editor of the Green Journal
Professional Organization RepresentationAmerican Academy of Family Physicians
Represented by: Eric Wall, M.D., FAAFP; Senior Medical Director of Qualis Health
American College of Nurse-Midwives
Represented by: Nancy Lowe, C.N.M., Ph.D.; Professor of Nurse-Midwifery in the college of Nursing at the University of Colorado Denver
American College of Obstetricians and Gynecologists
Represented by: Carolyn Zelop, M.D.; St. Francis Care, Department of Maternal Fetal Medicine
B-2

Appendix B. Expert Reviewers, continued
Federal Reviewers Suzanne Haynes, Ph.D. Senior Science Advisor, Office on Women’s Health, US Department of Health and Human Services
Mark Klebanoff, M.D., M.P.H. Senior Investigator, National Institute of Child Health and Human Development, Epidemiology (EPI) Branch
Miriam Kuppermann, Ph.D., M.P.H. Professor in the Department of Obstetrics, Gynecology & Reproductive Sciences at the University of California, San Francisco
Susan Meikle, M.D., M.S.P.H. Contraception & Reproductive Health (CRH) Branch, National Institute of Child Health and Human Development, Contraception & Reproductive Health (CRH) Branch
Jun Zhang, M.D., Ph.D. Senior Investigator, National Institute of Child Health and Human Development, Epidemiology (EPI) Branch
B-3

Appendix C. Search Strategies
Core Search
Database: Ovid MEDLINE(R) <1950 to August Week 4 2009> 1 exp Vaginal Birth after Cesarean/ (856) 2 vbac.mp. (264) 3 (vagina$ adj3 (birth$ or born or deliver$) adj7 ((after$ or follow$ or previous$ or prior or history) adj3 (cesarean$ or caesarean$))).mp. [mp=title, original title, abstract, name of substance word, subject heading word] (1448) 4 1 or 3 or 2 (1470) 5 exp "Trial of Labor"/ (682) 6 (trial of labor or trial of labour).mp. [mp=title, original title, abstract, name of substance word, subject heading word] (937) 7 tol.mp. (949) 8 6 or 7 (1833) 9 exp pregnancy/ or exp pregnancy complications/ (654827) 10 exp Infant, Newborn/ (429340) 11 exp Obstetrics/ (13288) 12 exp Obstetric Surgical Procedures/ (89545) 13 11 or 10 or 9 or 12 (981159) 14 8 and 13 (947) 15 14 or 5 (947) 16 exp Cesarean Section, Repeat/ (395) 17 ((repeat$ or multip$ or another or prior or previous$) adj3 (cesarean$ or caesarean$)).mp. [mp=title, original title, abstract, name of substance word, subject heading word] (2585) 18 ((second or third) adj cesarean).mp. [mp=title, original title, abstract, name of substance word, subject heading word] (30) 19 16 or 17 or 18 (2601) 20 4 or 19 or 15 (3607) 21 limit 20 to (english language and humans) (2888)
Database: EBM Reviews - Cochrane Central Register of Controlled Trials <3rd Quarter 2009> 1 vbac.mp. (6) 2 (vagina$ adj3 (birth$ or born or deliver$) adj7 ((after$ or follow$ or previous$ or prior or history) adj3 (cesarean$ or caesarean$))).mp. [mp=title, original title, abstract, mesh headings, heading words, keyword] (14) 3 1 or 2 (17) 4 (trial of labor or trial of labour).mp. [mp=title, original title, abstract, mesh headings, heading words, keyword] (38) 5 tol.mp. (16) 6 4 or 5 (53) 7 ((repeat$ or multip$ or another or prior or previous$) adj3 (cesarean$ or caesarean$)).mp. [mp=title, original title, abstract, mesh headings, heading words, keyword] (113) 8 ((second or third) adj cesarean).mp. [mp=title, original title, abstract, mesh headings, heading words, keyword] (1) 9 7 or 8 (113) 10 6 or 3 or 9 (160)
Database: EBM Reviews - Cochrane Database of Systematic Reviews <1st Quarter 2009> 1 vbac.mp. (4) 2 (vagina$ adj3 (birth$ or born or deliver$) adj7 ((after$ or follow$ or previous$ or prior or history) adj3 (cesarean$ or caesarean$))).mp. [mp=title, abstract, full text, keywords, caption text] (15) 3 1 or 2 (16) 4 (trial of labor or trial of labour).mp. [mp=title, abstract, full text, keywords, caption text] (13) 5 tol.mp. (2) 6 4 or 5 (15)
C-1

Appendix C. Search Strategies, continued
7 ((repeat$ or multip$ or another or prior or previous$) adj3 (cesarean$ or caesarean$)).mp. [mp=title, abstract, full text, keywords, caption text] (65) 8 ((second or third) adj cesarean).mp. [mp=title, abstract, full text, keywords, caption text] (0) 9 7 or 8 (65) 10 6 or 3 or 9 (72)
Database: EBM Reviews - Database of Abstracts of Reviews of Effects <3rd Quarter 2009> 1 vbac.mp. (2) 2 (vagina$ adj3 (birth$ or born or deliver$) adj7 ((after$ or follow$ or previous$ or prior or history) adj3 (cesarean$ or caesarean$))).mp. [mp=title, full text, keywords] (1) 3 1 or 2 (3) 4 (trial of labor or trial of labour).mp. [mp=title, full text, keywords] (8) 5 tol.mp. (3) 6 4 or 5 (9) 7 ((repeat$ or multip$ or another or prior or previous$) adj3 (cesarean$ or caesarean$)).mp. [mp=title, full text, keywords] (17) 8 ((second or third) adj cesarean).mp. [mp=title, full text, keywords] (0) 9 7 or 8 (17)
Uterine Rupture Specific Search
Database: Ovid MEDLINE(R) <1950 to August Week 4 2009> 1 exp Vaginal Birth after Cesarean/ (858) 2 vbac.mp. (266) 3 (vagina$ adj3 (birth$ or born or deliver$) adj7 ((after$ or follow$ or previous$ or prior or history) adj3 (cesarean$ or caesarean$))).mp. [mp=title, original title, abstract, name of substance word, subject heading word] (1450) 4 1 or 3 or 2 (1473) 5 exp "Trial of Labor"/ (682) 6 (trial of labor or trial of labour).mp. [mp=title, original title, abstract, name of substance word, subject heading word] (937) 7 tol.mp. (949) 8 6 or 7 (1833) 9 exp pregnancy/ or exp pregnancy complications/ (655357) 10 exp Infant, Newborn/ (429611) 11 exp Obstetrics/ (13301) 12 exp Obstetric Surgical Procedures/ (89607) 13 11 or 10 or 9 or 12 (981885) 14 8 and 13 (947) 15 14 or 5 (947) 16 exp Cesarean Section, Repeat/ (396) 17 ((repeat$ or multip$ or another or prior or previous$) adj3 (cesarean$ or caesarean$)).mp. [mp=title, original title, abstract, name of substance word, subject heading word] (2587) 18 ((second or third) adj cesarean).mp. [mp=title, original title, abstract, name of substance word, subject heading word] (30) 19 16 or 17 or 18 (2603) 20 4 or 19 or 15 (3610) 21 limit 20 to (english language and humans) (2891) 22 ((uterine or uterus) adj5 (ruptur$ or tear$ or torn or perforat$ or lacerat$ or trauma$ or damag$ or injur$)).mp. (5413) 23 22 and 21 (611)
Obesity Specific Search
Database: Ovid MEDLINE(R) <1950 to August Week 4 2009>
C-2

Appendix C. Search Strategies, continued
1 exp Vaginal Birth after Cesarean/ (858) 2 vbac.mp. (266) 3 (vagina$ adj3 (birth$ or born or deliver$) adj7 ((after$ or follow$ or previous$ or prior or history) adj3 (cesarean$ or caesarean$))).mp. [mp=title, original title, abstract, name of substance word, subject heading word] (1450) 4 1 or 3 or 2 (1473) 5 exp "Trial of Labor"/ (682) 6 (trial of labor or trial of labour).mp. [mp=title, original title, abstract, name of substance word, subject heading word] (937) 7 tol.mp. (949) 8 6 or 7 (1833) 9 exp pregnancy/ or exp pregnancy complications/ (655357) 10 exp Infant, Newborn/ (429611) 11 exp Obstetrics/ (13301) 12 exp Obstetric Surgical Procedures/ (89607) 13 11 or 10 or 9 or 12 (981885) 14 8 and 13 (947) 15 14 or 5 (947) 16 exp Cesarean Section, Repeat/ (396) 17 ((repeat$ or multip$ or another or prior or previous$) adj3 (cesarean$ or caesarean$)).mp. [mp=title, original title, abstract, name of substance word, subject heading word] (2587) 18 ((second or third) adj cesarean).mp. [mp=title, original title, abstract, name of substance word, subject heading word] (30) 19 16 or 17 or 18 (2603) 20 4 or 19 or 15 (3610) 21 limit 20 to (english language and humans) (2891) 22 exp Obesity/ (91434) 23 body weight/ or exp body weight changes/ or exp overweight/ or thinness/ (239228) 24 exp "Body Weights and Measures"/ (322374) 25 22 or 24 or 23 (342869) 26 21 and 25 (207)
Multiple Cesarean Specific Search
Database: Ovid MEDLINE(R) <1950 to October Week 4 2009> 1 exp Cesarean Section, Repeat/ (429) 2 ((repeat$ or multip$ or another) adj3 cesarean).mp. (1041) 3 ((second or third) adj cesarean).mp. (32) 4 3 or 1 or 2 (1061) 5 limit 4 to (english language and humans) (855) 6 limit 5 to yr="1980 -Current" (833) 7 4 not 1 (632) 8 limit 1 to (english language and humans and yr="1980 -Current") (364) 9 exp "Outcome and Process Assessment (Health Care)"/ (471672) 10 exp Postoperative Complications/ (344232) 11 (ae or co).fs. (2302892) 12 11 or 10 or 9 (2833102) 13 ((repeat$ or multip$ or another or subsequent$ or previous$ or prior) adj3 cesarean).mp. (2237) 14 3 or 13 (2254) 15 12 and 14 (910) 16 limit 15 to (english language and humans and yr="1980 -Current") (716) 17 16 not 8 (535) 18 9 and 14 (107) 19 limit 18 to (english language and humans and yr="1980 -Current") (96) 20 19 not 8 (75) 21 17 not 20 (460)
C-3

Appendix C. Search Strategies, continued
22 from 21 keep 1-460 (460)
Background Questions Specific Search
Database: Ovid MEDLINE(R) <1950 to October Week 1 2009> 1 exp Vaginal Birth after Cesarean/ (888) 2 vbac.mp. (275) 3 (vagina$ adj3 (birth$ or born or deliver$) adj7 ((after$ or follow$ or previous$ or prior or history) adj3 cesarean)).mp. (1347) 4 1 or 2 or 3 (1374) 5 exp "Trial of Labor"/ (691) 6 (trial adj2 labor).mp. (927) 7 tol.mp. (984) 8 6 or 7 (1856) 9 exp pregnancy/ or exp pregnancy complications/ (655043) 10 exp Infant, Newborn/ (431654) 11 exp Obstetrics/ (13439) 12 exp Obstetric Surgical Procedures/ (89191) 13 9 or 10 or 11 or 12 (985177) 14 8 and 13 (938) 15 5 or 14 (938) 16 exp Cesarean Section, Repeat/ (428) 17 ((repeat$ or multip$ or another) adj3 cesarean).mp. (1039) 18 ((second or third) adj cesarean).mp. (32) 19 18 or 16 or 17 (1059) 20 4 or 19 or 15 (2507) 21 exp LEGISLATION as topic/ (55190) 22 exp JURISPRUDENCE/ (137951) 23 lj.fs. (171704) 24 22 or 21 or 23 (295921) 25 24 and 20 (68) 26 exp bioethical issues/ (3229) 27 exp bioethics/ (8140) 28 (ethic$ or bioethic$).mp. [mp=title, original title, abstract, name of substance word, subject heading word, unique identifier] (106986) 29 27 or 28 or 26 (106986) 30 29 and 20 (22) 31 exp human rights/ (97424) 32 31 and 20 (36) 33 25 or 32 or 30 (95) 34 Physician's Practice Patterns/ (29292) 35 20 and 34 (55) 36 exp Attitude to Health/ (216292) 37 20 and 36 (138) 38 exp Economics/ (415371) 39 ec.fs. (262834) 40 38 or 39 (490853) 41 20 and 40 (112) 42 exp Decision Making/ (86984) 43 20 and 42 (93) 44 exp Counseling/ (26819) 45 20 and 44 (14) 46 "attitude of health personnel"/ or refusal to treat/ (75034) 47 20 and 46 (32) 48 exp Health Services Accessibility/ (64701) 49 20 and 48 (6)
C-4

Appendix C. Search Strategies, continued
50 exp "Health Services Needs and Demand"/ (36937) 51 20 and 50 (5) 52 exp Social Control Policies/ (94601) 53 20 and 52 (16) 54 exp Hospital Administration/ (183749) 55 20 and 54 (35) 56 35 or 33 or 53 or 51 or 41 or 47 or 49 or 37 or 45 or 43 or 55 (424) 57 from 56 keep 1-424 (424)
C-5

Appendix D. List of Developed Countries
Excerpt from CIA World Factbook 20081
Developed Countries: The top group in the hierarchy of developed countries (DCs), former USSR/Eastern Europe (former USSR/EE), and less developed countries (LDCs); includes the market-oriented economies of the mainly democratic nations in the Organization for Economic Cooperation and Development (OECD), Bermuda, Israel, South Africa, and the European ministates; also known as the First World, high-income countries, the North, industrial countries; generally have a per capita GDP in excess of $10,000 although four OECD countries and South Africa have figures well under $10,000 and two of the excluded OPEC countries have figures of more than $10,000.
The 34 DCs are: Andorra Australia Austria Belgium Bermuda Canada Denmark Faroe Islands Finland
France Germany Greece Holy See Iceland Ireland Israel Italy Japan
Liechtenstein Luxembourg Malta Monaco Netherlands NZ Norway Portugal San Marino
South Africa Spain, Sweden Switzerland Turkey UK US
1. The World Factbook 2008. Washington, D. C.: Central Intelligence Agency; 2008.
D-1

Appendix E. Inclusion and Exclusion Criteria
Abstract Review Coding
Inclusions
• IN for a specific key question or topic area • Background for general, question 1 or question 2
Exclusions
• No data • Wrong Population (animal study, abortion, multiple gestations, etc) • Opinion or Letter with No Data • No previous cesarean • Developing country
Full-Text Paper Review Coding
Inclusions
• IN for a specific key question or topic area • In, but no comparator • Background for general, question 1 or question 2
Exclusions
• No data for topic • Wrong Population (specify reason: no previous cesarean, animal study, abortion, multiple
gestations, pre-existing medical condition, pre-term (<37 weeks), cadavers, etc) • No full-text paper or Opinion or Letter with No Data • Cannot isolate our population of interest (specify reason) • Developing country/Not in English • < 10 subjects • Study began or published before 1980 • Insufficient to determine population
E-1

Appendix F. Excluded Studies List
Exclusion codes key: Code Reason
4 No data for topic 5 Wrong Population (specify reason: no previous cesarean, animal study, abortion,
multiple gestations, pre-existing medical condition, pre-term (<37 weeks), cadavers, etc) 6 No full-text paper, opinion or letter with no data 7 Cannot isolate our population of interest (specify reason) 8 Developing country/Not in English 9 Less than 10 subjects 10 Study began or published before 1980 11 Insufficient to determine population
List of studies:
1. Vaginal delivery after cesarean section. Am Fam Physician, 1985. 32(3): p. 90.
Exclusion code: 6
2. Cesarean births and trial of labor rates. Jama, 1987. 257(20): p. 2757-9.
Exclusion code: 6
3. A method of predicting the likelihood of success or failure in a trial of labor in any given set of circumstances is a laudable goal.[comment]. J Reprod Med, 1991. 36(11): p. 829-31.
Exclusion code: 4
4. Nonclinical factors and repeat C-section.[comment]. Jama, 1991. 265(18): p. 2338-9.
Exclusion code: 6
5. Improving the timeliness of emergency C-sections at Southwestern Vermont Medical Center leads to improved patient care and increased physician satisfaction. Qual Lett Healthc Lead, 1993. 5(1): p. 6-8.
Exclusion code: 6
6. Repeat cesarean section vs. VBACs: helping women decide. AWHONN Voice, 1994. 2(8): p. 1.
Exclusion code: 6
7. Trial of labor vs. elective repeat cesarean section. AAFP Task Force on Clinical Policies for Patient Care. Am Fam Physician, 1995. 52(6): p. 1763-5.
Exclusion code: 4
8. Vaginal delivery after a previous cesarean birth. ACOG Committee opinion. Number 143-October 1994 (replaces No. 64, October 1988). Committee on Obstetric Practice. American College of Obstetricians and Gynecologists. Int J Gynaecol Obstet, 1995. 48(1): p. 127-9.
Exclusion code: 4
9. ACOG releases practice guidelines on vaginal delivery after previous cesarean birth. Am Fam Physician, 1996. 53(2): p. 775-6.
Exclusion code: 6
10. Vaginal delivery after previous cesarean birth. Number 1--August 1995. Committee on Practice
F-1
Appendix F. Excluded Studies List, continued
Patterns. American College of Obstetricians and Gynecologists. Int J Gynaecol Obstet, 1996. 52(1): p. 90-8.
Exclusion code: 4
11. VBAC (vaginal birth after cesareans): are cost concerns outweighing possible safety risks? Hosp Case Manag, 1996. 4(11): p. 161-4.
Exclusion code: 6
12. What is the right number of caesarean sections? Lancet, 1997. 349(9055): p. 815.
Exclusion code: 4
13. Case records of the Massachusetts General Hospital. Weekly clinicopathological exercises. Case 9-1998. Cardiovascular collapse after vaginal delivery in a patient with a history of cesarean section. N Engl J Med, 1998. 338(12): p. 821-6.
Exclusion code: 9
14. Outreach program slashes Florida health network's rate of cesarean sections. Health Care Cost Reengineering Rep, 1998. 3(9): p. 137-8.
Exclusion code: 6
15. Stats & facts. Vaginal births after cesarean sections: a need to revisit. Manag Care Interface, 2001. 14(11): p. 34-5.
Exclusion code: 4
16. Medical discipline--not guilty. N Z Med J, 2004. 117(1188): p. 2 p following U755.
Exclusion code: 6
17. National Institutes of Health state-of-the-science conference statement: Cesarean delivery on maternal request March 27-29, 2006. Obstet Gynecol, 2006. 107(6): p. 1386-97.
Exclusion code: 4
18. NIH State of the Science Conference: cesarean delivery on maternal request. Adv Neonat Care, 2006. 6(4): p. 171-2.
Exclusion code: 4
19. Risks and benefits of caesarean delivery on maternal request. Midwifery, 2006. 22(2): p. 98-9.
Exclusion code: 6
20. Aali, B.S. and B. Motamedi, Women's knowledge and attitude towards modes of delivery in Kerman, Islamic Republic of Iran. East Mediterr Health J, 2005. 11(4): p. 663-72.
Exclusion code: 5
21. Abbas, F., et al., Placenta percreta with bladder invasion as a cause of life threatening hemorrhage. J Urol, 2000. 164(4): p. 1270-4.
Exclusion code: 9
22. Abboud, T.K., et al., Isoflurane or halothane for cesarean section: comparative maternal and neonatal effects. Acta Anaesthesiol Scand, 1989. 33(7): p. 578-81.
Exclusion code: 5
23. Abboud, T.K., et al., Isoflurane or halothane for cesarean section: comparative maternal and neonatal effects. Acta Anaesthesiol Scand,
F-2

Appendix F. Excluded Studies List, continued
1989. 33(7): p. 578-81. Exclusion code: 5
24. Abboud, T.K., et al., Desflurane: a new volatile anesthetic for cesarean section. Maternal and neonatal effects. Acta Anaesthesiol Scand, 1995. 39(6): p. 723-6.
Exclusion code: 5
25. Abboud, T.K., et al., Intravenous propofol vs thiamylal-isoflurane for caesarean section, comparative maternal and neonatal effects. Acta Anaesthesiol Scand, 1995. 39(2): p. 205-9.
Exclusion code: 5
26. Abdelhak, Y.E., et al., Management of cervical cerclage at term: remove the suture in labor? J Perinat Med, 2000. 28(6): p. 453-7.
Exclusion code: 5
27. Abitbol, M.M., et al., The cephalopelvic disproportion index. Combined fetal sonography and x-ray pelvimetry for early detection of cephalopelvic disproportion. J Reprod Med, 1991. 36(5): p. 369-73.
Exclusion code: 4
28. Abouleish, E., et al., Combined intrathecal morphine and bupivacaine for cesarean section. Anesth Analg, 1988. 67(4): p. 370-4.
Exclusion code: 5
29. Aboulfalah, A., et al., Induction of labour with intravaginal misoprostol after prior cesarean delivery. Afr J Reprod Health, 2001. 5(2): p. 139-42.
Exclusion code: 4
30. Abu-Ghazzeh, Y.M. and R. Barqawi, An appraisal of computed tomography pelvimetry in patients with previous caesarean section. East Mediterr Health J, 2000. 6(2-3): p. 260-4.
Exclusion code: 8
31. Abu-Heija, A.T. and A.M. Ali, Induction of labor in grand multiparous women and previous cesarean section: is it safe? Gynecol Obstet Invest, 2002. 53(2): p. 121-4.
Exclusion code: 8
32. Abu-Heija, A.T., F. El-Jallad, and S. Ziadeh, Placenta previa: effect of age, gravidity, parity and previous caesarean section. Gynecol Obstet Invest, 1999. 47(1): p. 6-8.
Exclusion code: 8
33. Afriat, C.I., Vaginal birth after cesarean section: a review of the literature. J Perinat Neonatal Nurs, 1990. 3(3): p. 1-13.
Exclusion code: 10
34. Agostini, A., et al., Risk of bladder injury during vaginal hysterectomy in women with a previous cesarean section. J Reprod Med, 2005. 50(12): p. 940-2.
Exclusion code: 6
35. Al Nuaim, L.A., S. Kattan, and M.S. Mustafa, Vesicouterine fistula after a previous low vertical cesarean section (DeLee incision). Int J Gynaecol Obstet, 1996. 55(2): p. 161-2.
Exclusion code: 4
F-3
Appendix F. Excluded Studies List, continued
36. Al Sakka, M., W. Dauleh, and S. Al Hassani, Case series of uterine rupture and subsequent pregnancy outcome. Int J Fertil Womens Med, 1999. 44(6): p. 297-300.
Exclusion code: 8
37. Al Sakka, M., A. Hamsho, and L. Khan, Rupture of the pregnant uterus--a 21-year review. Int J Gynaecol Obstet, 1998. 63(2): p. 105-8.
Exclusion code: 8
38. Alarab, M., et al., Singleton vaginal breech delivery at term: still a safe option. Obstet Gynecol, 2004. 103(3): p. 407-12.
Exclusion code: 5
39. Albers, L.L., Safety of VBACs in birth centers: choices and risks. Birth, 2005. 32(3): p. 229-31.
Exclusion code: 4
40. Alexander, J.M., et al., Fetal injury associated with cesarean delivery. Obstet Gynecol, 2006. 108(4): p. 885-90.
Exclusion code: 5
41. Alexiadis, G., et al., Abdominal wall endometriosis--ultrasound research: a diagnostic problem. Clin Exp Obstet Gynecol, 2001. 28(2): p. 121-2.
Exclusion code: 4
42. Alfirevic, Z., Oral misoprostol for induction of labour.[update in Cochrane Database Syst Rev. 2001;(2):CD001338; PMID: 11405987][update of Cochrane Database Syst Rev.
2000;(2):CD001338; PMID: 10796260]. Cochrane Database Syst Rev, 2000(4): p. CD001338.
Exclusion code: 4
43. Alfirevic, Z. and A. Weeks, Oral misoprostol for induction of labour. Cochrane Database Syst Rev, 2006.
Exclusion code: 4
44. Algert, C.S., et al., Labor before a primary cesarean delivery: reduced risk of uterine rupture in a subsequent trial of labor for vaginal birth after cesarean. Obstet Gynecol, 2008. 112(5): p. 1061-6.
Exclusion code: 6
45. Al-Kadri, H., et al., Failed individual and sequential instrumental vaginal delivery: contributing risk factors and maternal-neonatal complications.[erratum appears in Acta Obstet Gynecol Scand. 2003 Oct;82(10):976]. Acta Obstet Gynecol Scand, 2003. 82(7): p. 642-8.
Exclusion code: 8
46. Alkatib, M., A.V.M. Franco, and M.M. Fynes, Vesicouterine fistula following Cesarean delivery--ultrasound diagnosis and surgical management. Ultrasound Obstet Gynecol, 2005. 26(2): p. 183-5.
Exclusion code: 4
47. Almeida, E.C.S., et al., Cesarean section as a cause of chronic pelvic pain. Int J Gynaecol Obstet, 2002. 79(2): p. 101-4.
Exclusion code: 7
48. Al-Najjar, F.S. and A.M. Al-Shafiai,
F-4
Appendix F. Excluded Studies List, continued
Safety of vaginal breech delivery. Saudi Med J, 2004. 25(10): p. 1517-8.
Exclusion code: 5
49. Alran, S., et al., Maternal and neonatal outcome of 93 consecutive triplet pregnancies with 71% vaginal delivery. Acta Obstet Gynecol Scand, 2004. 83(6): p. 554-9.
Exclusion code: 5
50. Altman, D., et al., Symptoms of anal and urinary incontinence following cesarean section or spontaneous vaginal delivery. Am J Obstet Gynecol, 2007. 197(5): p. 512.e1-7.
Exclusion code: 5
51. Al-Took, S., Adhesion-related small-bowel obstruction after gynecologic operations. Am J Obstet Gynecol, 1999. 180(2): p. 313-5.
Exclusion code: 4
52. Amon, E., B.M. Sibai, and G.D. Anderson, How perinatologists manage the problem of the presenting breech. Am J Perinatol, 1988. 5(3): p. 247-50.
Exclusion code: 4
53. Andersen, H.F., et al., Neonatal status in relation to incision intervals, obstetric factors, and anesthesia at cesarean delivery. Am J Perinatol, 1987. 4(4): p. 279-83.
Exclusion code: 4
54. Andersen, J.R., et al., Decidual prolactin content and secretion at term. Correlations with the clinical data. Acta Obstet Gynecol Scand, 1987. 66(7): p. 591-6.
Exclusion code: 7
55. Anderson, G. and C. Strong, The premature breech: caesarean section or trial of labour? J Med Ethics, 1988. 14(1): p. 18-24.
Exclusion code: 5
56. Andrews, W.W., et al., Effect of type of anesthesia on blood loss at elective repeat cesarean section. Am J Perinatol, 1992. 9(3): p. 197-200.
Exclusion code: 4
57. Angelini, D.J. and L. Greenwald, Closed claims analysis of 65 medical malpractice cases involving nurse-midwives. J Midwifery Womens Health, 2005. 50(6): p. 454-60.
Exclusion code: 6
58. Annibale, D.J., et al., Comparative neonatal morbidity of abdominal and vaginal deliveries after uncomplicated pregnancies. Arch Pediatr Adolesc Med, 1995. 149(8): p. 862-7.
Exclusion code: 5
59. Anteby, S.O., A. Birkenfeld, and D. Weinstein, Post cesarean section urinary tract infections, risk factors and prophylactic antibiotic treatment. Clin Exp Obstet Gynecol, 1984. 11(4): p. 161-4.
Exclusion code: 5
60. Antoine, C. and B.K. Young, Fetal lactic acidosis with epidural anesthesia. Am J Obstet Gynecol, 1982. 142(1): p. 55-9.
Exclusion code: 10
61. Appleton, B., et al., Knowledge and
F-5
Appendix F. Excluded Studies List, continued
attitudes about vaginal birth after Caesarean section in Australian hospitals. VBAC Study Group. Vaginal Birth After Caesarean. Aust N Z J Obstet Gynaecol, 2000. 40(2): p. 195-9.
Exclusion code: 4
62. Ardiet, E., D. Subtil, and F. Puech, Cervical ripening with dinoprostone gel and previous cesarean delivery. Int J Gynaecol Obstet, 2005. 91(3): p. 260-1.
Exclusion code: 6
63. Arias, E., et al., Annual summary of vital statistics--2002. Pediatrics, 2003. 112(6 Pt 1): p. 1215-30.
Exclusion code: 4
64. Armstrong, V., et al., Detection of cesarean scars by transvaginal ultrasound. Obstet Gynecol, 2003. 101(1): p. 61-5.
Exclusion code: 4
65. Arraztoa, J.A., et al., [Delivery conduction in patients with cicatrix of a prior cesarean section. Pilot study]. Revista chilena de obstetricia y ginecologia, 1994. 59(2): p. 95-100; discussion 100-1.
Exclusion code: 8
66. Arulkumaran, S., et al., Uterine activity during spontaneous labour after previous lower-segment caesarean section. Br J Obstet Gynaecol, 1989. 96(8): p. 933-8.
Exclusion code: 8
67. Arulkumaran, S., I. Ingemarsson, and S.S. Ratnam, Oxytocin augmentation in dysfunctional
labour after previous caesarean section. Br J Obstet Gynaecol, 1989. 96(8): p. 939-41.
Exclusion code: 8
68. Ash, A., A. Smith, and D. Maxwell, Caesarean scar pregnancy. Bjog, 2007. 114(3): p. 253-63.
Exclusion code: 4
69. Ashton, P., et al., Return to theatre--experience at the Mercy Maternity Hospital, Melbourne 1971-1982. Aust N Z J Obstet Gynaecol, 1985. 25(3): p. 159-69.
Exclusion code: 7
70. Asole, S., et al., Effect of hospital practices on breastfeeding: A survey in the Italian region of Lazio. Journal of Human Lactation, 2009. 25(3): p. 333-340.
Exclusion code: 7
71. Atad, J., et al., Ripening and dilatation of the unfavourable cervix for induction of labour by a double balloon device: experience with 250 cases. Br J Obstet Gynaecol, 1997. 104(1): p. 29-32.
Exclusion code: 7
72. Atad, J., et al., Continuous extraovular prostaglandin F2 alpha instillation for late pregnancy termination in patients with previous cesarean section delivery. Int J Gynaecol Obstet, 1986. 24(4): p. 315-9.
Exclusion code: 5
73. Atalla, R.K., et al., Reactive thrombocytosis after caesarean section and vaginal delivery:
F-6
Appendix F. Excluded Studies List, continued
implications for maternal thromboembolism and its prevention. Bjog, 2000. 107(3): p. 411-4.
Exclusion code: 4
74. Atug, F., et al., Delivery of dead fetus from inside urinary bladder with uterine perforation: case report and review of literature. Urology, 2005. 65(4): p. 797.
Exclusion code: 9
75. Austin, S.E., Childbirth classes for couples desiring VBAC (vaginal birth after cesarean). MCN Am J Matern Child Nurs, 1986. 11(4): p. 250-5.
Exclusion code: 4
76. Avery, J.K., Loss prevention case of the month. Would guidelines have helped? Tenn Med, 2003. 96(10): p. 461-2.
Exclusion code: 9
77. Avery, J.K., The obstetrical dilemma. J Ark Med Soc, 2005. 102(6): p. 156-7.
Exclusion code: 6
78. Bader, D., et al., Breathing patterns in term infants delivered by caesarean section. Acta Paediatr, 2004. 93(9): p. 1216-20.
Exclusion code: 7
79. Bai, S.W., et al., Peripartum hysterectomy and associated factors. J Reprod Med, 2003. 48(3): p. 148-52.
Exclusion code: 7
80. Bainbridge, J., Choices after cesarean. Birth, 2002. 29(3): p. 203-
6. Exclusion code: 4
81. Bakshi, S. and B.A. Meyer, Indications for and outcomes of emergency peripartum hysterectomy. A five-year review. J Reprod Med, 2000. 45(9): p. 733-7.
Exclusion code: 7
82. Barker, G., et al., Placental water content and distribution. Placenta, 1994. 15(1): p. 47-56.
Exclusion code: 4
83. Barnsley, J.M., et al., Cesarean section in Ontario: practice patterns and responses to hypothetical cases. Can J Surg, 1990. 33(2): p. 128-32.
Exclusion code: 4
84. Barton, D.P., M.J. Turner, and J.M. Stronge, Outcome of the second labour in patients whose first labour was prolonged: the Dublin experience. Eur J Obstet Gynecol Reprod Biol, 1991. 42(1): p. 15-8.
Exclusion code: 7
85. Baskett, T.F., Emergency obstetric hysterectomy. J Obstet Gynaecol, 2003. 23(4): p. 353-5.
Exclusion code: 7
86. Baskett, T.F., Uterine compression sutures for postpartum hemorrhage: efficacy, morbidity, and subsequent pregnancy. Obstet Gynecol, 2007. 110(1): p. 68-71.
Exclusion code: 5
87. Basson, E., H.J. Odendaal, and D. Grove, Oxytocin use in South Africa--a review. Samj, S, 2004. Suid-
F-7

Appendix F. Excluded Studies List, continued
Afrikaanse Tydskrif Vir Geneeskunde. 94(10): p. 839-45.
Exclusion code: 4
88. Beall, M., et al., Vaginal delivery after cesarean section in women with unknown types of uterine scar. J Reprod Med, 1984. 29(1): p. 31-5.
Exclusion code: 6
89. Beckett, V.A. and L. Regan, Vaginal birth after cesarean: the European experience. Clin Obstet Gynecol, 2001. 44(3): p. 594-603.
Exclusion code: 4
90. Ben Nagi, J., et al., Reproductive outcomes of women with a previous history of Caesarean scar ectopic pregnancies. Hum Reprod, 2007. 22(7): p. 2012-5.
Exclusion code: 5
91. Ben Shachar, I. and D. Weinstein, High risk pregnancy outcome by route of delivery. Curr Opin Obstet Gynecol, 1998. 10(6): p. 447-52.
Exclusion code: 4
92. Benedetti, T.J., L. Platt, and M. Druzin, Vaginal delivery after previous cesarean section for a nonrecurrent cause. Am J Obstet Gynecol, 1982. 142(3): p. 358-9.
Exclusion code: 10
93. Ben-Haroush, A., et al., Indicated labor induction with vaginal prostaglandin E2 increases the risk of cesarean section even in multiparous women with no previous cesarean section. J Perinat Med, 2004. 32(1): p. 31-6.
Exclusion code: 7
94. Ben-Haroush, A., et al., Accuracy of sonographically estimated fetal weight in 840 women with different pregnancy complications prior to induction of labor. Ultrasound Obstet Gynecol, 2004. 23(2): p. 172-6.
Exclusion code: 5
95. Benterud, T., Cesarean section is associated with more frequent pneumothorax and respiratory problems in the neonate. Acta Obstet Gynecol Scand, 2009. 88(3): p. 359-61.
Exclusion code: 7
96. Berard, J., et al., Fetal macrosomia: risk factors and outcome. A study of the outcome concerning 100 cases >4500 g. Eur J Obstet Gynecol Reprod Biol, 1998. 77(1): p. 51-9.
Exclusion code: 5
97. Berg, C.J., et al., Overview of Maternal Morbidity During Hospitalization for Labor and Delivery in the United States. 1993-1997 and 2001-2005. Obstet Gynecol, 2009. 113(5): p. 1075-1081.
Exclusion code: 4
98. Bergeron, M.-E., et al., Sonography of lower uterine segment thickness and prediction of uterine rupture. Obstet Gynecol, 2009. 113(2 Pt 2): p. 520-2.
Exclusion code: 9
99. Bergholt, T., et al., Prevalence and risk factors of adenomyosis at hysterectomy. Hum Reprod, 2001.
F-8

Appendix F. Excluded Studies List, continued
16(11): p. 2418-21. Exclusion code: 5
100. Bergholt, T., et al., Intraoperative surgical complication during cesarean section: an observational study of the incidence and risk factors. Acta Obstet Gynecol Scand, 2003. 82(3): p. 251-6.
Exclusion code: 4
101. Berglund, L. and O. Axelsson, Breech extraction versus cesarean section for the remaining second twin. Acta Obstet Gynecol Scand, 1989. 68(5): p. 435-8.
Exclusion code: 5
102. Bernstein, P., Prostaglandin E2 gel for cervical ripening and labour induction: a multicentre placebo-controlled trial.[erratum appears in Can Med Assoc J 1992 Apr 15;146(8):1290]. Cmaj, 1991. 145(10): p. 1249-54.
Exclusion code: 5
103. Bhal, P.S., A. Sharma, and K. Asaad, Vaginal delivery after caesarean section: factors influencing success rates.[comment]. Aust N Z J Obstet Gynaecol, 1996. 36(4): p. 497-8.
Exclusion code: 6
104. Bhattacharjee, N., R.P. Ganguly, and S.P. Saha, Misoprostol for termination of mid-trimester post-Caesarean pregnancy. Aust N Z J Obstet Gynaecol, 2007. 47(1): p. 23-5.
Exclusion code: 8
105. Biasucci, G., et al., Cesarean delivery may affect the early
biodiversity of intestinal bacteria. J Nutr, 2008. 138(9): p. 1796S-1800S.
Exclusion code: 5
106. Binder, T., et al., Conducting labor in women with previous caesarean section in a low gestational week. A prospective case-controlled study. Gynecol Obstet Invest, 2008. 66(3): p. 197-202.
Exclusion code: 5
107. Bingham, P., V. Hird, and R.J. Lilford, Management of the mature selected breech presentation: an analysis based on the intended method of delivery. Br J Obstet Gynaecol, 1987. 94(8): p. 746-52.
Exclusion code: 5
108. Biswas, A., Management of previous cesarean section. Curr Opin Obstet Gynecol, 2003. 15(2): p. 123-9.
Exclusion code: 6
109. Bjelic-Radisic, V., et al., Neonatal outcome of second twins depending on presentation and mode of delivery. Twin Res Hum Genet, 2007. 10(3): p. 521-7.
Exclusion code: 5
110. Black, C., J.A. Kaye, and H. Jick, Cesarean delivery in the United Kingdom: time trends in the general practice research database. Obstet Gynecol, 2005. 106(1): p. 151-5.
Exclusion code: 4
111. Blackwell, S.C., et al., Influence of maternal-fetal medicine subspecialization on the frequency of trial of labor in term pregnancies with breech presentation. J Matern
F-9
Appendix F. Excluded Studies List, continued
Fetal Med, 2000. 9(4): p. 229-32. Exclusion code: 5
112. Blanchette, H., Comparison of obstetric outcome of a primary-care access clinic staffed by certified nurse-midwives and a private practice group of obstetricians in the same community. Am J Obstet Gynecol, 1995. 172(6): p. 1864-8; discussion 1868-71.
Exclusion code: 4
113. Blumenthal, N.J., et al., Changing caesarean section rates. Experience at a Sydney obstetric teaching hospital. Aust N Z J Obstet Gynaecol, 1984. 24(4): p. 246-51.
Exclusion code: 7
114. Bolaji, I.I. and F.P. Meehan, Caesarean section survey in Galway--1973 through 1987. Eur J Obstet Gynecol Reprod Biol, 1993. 48(1): p. 1-8.
Exclusion code: 10
115. Bolaji, I.I. and F.P. Meehan, Post caesarean section delivery. Eur J Obstet Gynecol Reprod Biol, 1993. 51(3): p. 181-92.
Exclusion code: 4
116. Bossert, R., et al., Early postpartum discharge at a university hospital. Outcome analysis. J Reprod Med, 2001. 46(1): p. 39-43.
Exclusion code: 4
117. Boucher, M., et al., Maternal morbidity as related to trial of labor after previous cesarean delivery. A quantitative analysis. J Reprod Med, 1984. 29(1): p. 12-6.
Exclusion code: 4
118. Boulet, S.B., Macrosomic births in the United States: determinants, outcomes, and proposed grades of risk. Am J Obstet Gynecol, 2003. 188: p. 1372-1378.
Exclusion code: 5
119. Boulet, S.L., H.M. Salihu, and G.R. Alexander, Mode of delivery and birth outcomes of macrosomic infants. J Obstet Gynaecol, 2004. 24(6): p. 622-9.
Exclusion code: 4
120. Boulvain, M., et al., Trial of labour after caesarean section in sub-Saharan Africa: a meta-analysis. Br J Obstet Gynaecol, 1997. 104(12): p. 1385-90.
Exclusion code: 4
121. Boulvain, M., A.J. Kelly, and O. Irion, Intracervical prostaglandins for induction of labour. Cochrane Database Syst Rev, 2008.
Exclusion code: 4
122. Boulvain, M., C. Stan, and O. Irion, Elective delivery in diabetic pregnant women. Cochrane Database Syst Rev, 2001.
Exclusion code: 4
123. Bowers, S.K., H.M. MacDonald, and E.D. Shapiro, Prevention of iatrogenic neonatal respiratory distress syndrome: elective repeat cesarean section and spontaneous labor. Am J Obstet Gynecol, 1982. 143(2): p. 186-9.
Exclusion code: 5
F-10

Appendix F. Excluded Studies List, continued
124. Bradley, C.F., S.E. Ross, and J. Warnyca, A prospective study of mothers' attitudes and feelings following cesarean and vaginal births. Birth, 1983. 10(2): p. 79-83.
Exclusion code: 5
125. Brahams, D., Caesarean sections by court order. Lancet, 1996. 348(9030): p. 770.
Exclusion code: 6
126. Bricker, L. and M. Luckas, Amniotomy alone for induction of labour. Cochrane Database Syst Rev, 2000.
Exclusion code: 4
127. Brill, Y., et al., The management of VBAC at term: a survey of Canadian obstetricians. J Obstet Gynaecol Can, 2003. 25(4): p. 300-10.
Exclusion code: 4
128. Brill, Y. and R. Windrim, Vaginal birth after Caesarean section: review of antenatal predictors of success. J Obstet Gynaecol Can, 2003. 25(4): p. 275-86.
Exclusion code: 4
129. Brink, S., C-sections rise but may not be the kindest cut. US News World Rep, 2000. 129(9): p. 63.
Exclusion code: 6
130. Brody, C.Z., et al., Vaginal birth after cesarean section in Hawaii. Experience at Kapiolani Medical Center for Women and Children. Hawaii Med J, 1993. 52(2): p. 38-42.
Exclusion code: 7
131. Brown, C.E., et al., Puerperal septic
pelvic thrombophlebitis: incidence and response to heparin therapy. Am J Obstet Gynecol, 1999. 181(1): p. 143-8.
Exclusion code: 4
132. Brubaker, L., Outcomes of trial of labor after previous cesarean delivery.[comment]. Am J Obstet Gynecol, 2002. 186(5): p. 1104-5.
Exclusion code: 6
133. Bucklin, B.A., Vaginal birth after cesarean delivery. Anesthesiology, 2003. 99(6): p. 1444-8.
Exclusion code: 6
134. Buechner, J.S., Rate of vaginal births among women with previous cesarean deliveries. Med Health R I, 1997. 80(2): p. 63-4.
Exclusion code: 4
135. Buist, R., J. Brown, and T. McNamara, For whom is the Caesarean section rate high? N Z Med J, 1999. 112(1101): p. 469-71.
Exclusion code: 6
136. Bujold, E., Uterine rupture and labour after a previous low transverse caesarean section.[comment]. Bjog, 2006. 113(11): p. 1337; author reply 1337-8.
Exclusion code: 6
137. Bujold, E., A. Hammoud, and I. Hendler, Safety and efficacy of vaginal birth after cesarean delivery attempts at or beyond 40 weeks of gestation.[comment]. Obstet Gynecol, 2006. 107(1): p. 205; author reply 205.
F-11
Appendix F. Excluded Studies List, continued
Exclusion code: 6
138. Burda, D., Motives suspect in caesarean repeats--study. Mod Healthc, 1991. 21(1): p. 14.
Exclusion code: 6
139. Burt, R.D., T.L. Vaughan, and J.R. Daling, Evaluating the risks of cesarean section: low Apgar score in repeat C-section and vaginal deliveries. Am J Public Health, 1988. 78(10): p. 1312-4.
Exclusion code: 7
140. Cahill, A., et al., Vaginal birth after cesarean (VBAC) attempt in twin pregnancies: is it safe? Am J Obstet Gynecol, 2005. 193(3 Pt 2): p. 1050-5.
Exclusion code: 5
141. Cahill, A.G. and G.A. Macones, Vaginal birth after cesarean delivery: evidence-based practice. Clin Obstet Gynecol, 2007. 50(2): p. 518-25.
Exclusion code: 6
142. Cahill, A.G., et al., Racial disparity in the success and complications of vaginal birth after cesarean delivery. Obstet Gynecol, 2008. 111(3): p. 654-8.
Exclusion code: 7
143. Cahill, A.G., et al., Does a maximum dose of oxytocin affect risk for uterine rupture in candidates for vaginal birth after cesarean delivery? Am J Obstet Gynecol, 2007. 197(5): p. 495.e1-5.
Exclusion code: 7
144. Cahill, A.G., et al., Risk factors for bladder injury in patients with a prior hysterotomy. Obstet Gynecol, 2008. 112(1): p. 116-20.
Exclusion code: 7
145. Cahill, A.G., et al., Higher maximum doses of oxytocin are associated with an unacceptably high risk for uterine rupture in patients attempting vaginal birth after cesarean delivery. Am J Obstet Gynecol, 2008. 199(1): p. 32.e1-5.
Exclusion code: 7
146. Cakmak, H. and S. Kuguoglu, Comparison of the breastfeeding patterns of mothers who delivered their babies per vagina and via cesarean section: An observational study using the LATCH breastfeeding charting system. Internation Journal of Nursing Studies, 2006. 44: p. 1128-1137.
Exclusion code: 8
147. Carayol, M., et al., Changes in the rates of caesarean delivery before labour for breech presentation at term in France: 1972-2003. Eur J Obstet Gynecol Reprod Biol, 2007. 132(1): p. 20-6.
Exclusion code: 6
148. Carlomagno, G., et al., Vaginal birth after caesarean section: further contribution to counteract caesarean section epidemic. Ann Ig, 1992. 4(4): p. 199-202.
Exclusion code: 4
149. Carlsson, C., G. Nybell-Lindahl, and I. Ingemarsson, Extradural block in patients who have previously
F-12
Appendix F. Excluded Studies List, continued
undergone caesarean section. Br J Anaesth, 1980. 52(8): p. 827-30.
Exclusion code: 10
150. Caron, A. and D. Neuhauser, The effect of public accountability on hospital performance: trends in rates for cesarean sections and vaginal births after cesarean section in Cleveland, Ohio. Qual Manag Health Care, 1999. 7(2): p. 1-10.
Exclusion code: 4
151. Carpenter, M.W., et al., Practice environment is associated with obstetric decision making regarding abnormal labor. Obstet Gynecol, 1987. 70(4): p. 657-62.
Exclusion code: 6
152. Carr, C.A., P. Burkhardt, and M. Avery, Vaginal birth after cesarean birth: a national survey of U.S. midwifery practice. J Midwifery Womens Health, 2002. 47(5): p. 347-52.
Exclusion code: 4
153. Carroli, G., et al., Epidemiology of postpartum haemorrhage: a systematic review. Best Pract Res Clin Obstet Gynaecol, 2008. 22(6): p. 999-1012.
Exclusion code: 4
154. Catanzarite, V.A., et al., Maternal death due to rupture of a low transverse cesarean section incision during labor at home. West J Med, 1992. 157(4): p. 454-5.
Exclusion code: 9
155. Cesario, S.K., Reevaluation of Friedman's Labor Curve: a pilot
study. J Obstet Gynecol Neonatal Nurs, 2004. 33(6): p. 713-22.
Exclusion code: 4
156. Chadha, Y.C., et al., Breech delivery and epidural analgesia. Br J Obstet Gynaecol, 1992. 99(2): p. 96-100.
Exclusion code: 10
157. Chaim, W., et al., Prevalence and clinical significance of postpartum endometritis and wound infection. Infect Dis Obstet Gynecol, 2000. 8(2): p. 77-82.
Exclusion code: 5
158. Chang, C., Trial of labor with prior vertical cesarean incision. J Fam Pract, 1997. 45(5): p. 380-1.
Exclusion code: 6
159. Chang, C.-Y., et al., Preservation of uterine integrity via transarterial embolization under postoperative massive vaginal bleeding due to cesarean scar pregnancy. Taiwan, 2006. 45(2): p. 183-7.
Exclusion code: 5
160. Chanrachakul, B., S. Hamontri, and Y. Herabutya, A randomized comparison of postcesarean pain between closure and nonclosure of peritoneum. Eur J Obstet Gynecol Reprod Biol, 2002. 101(1): p. 31-5.
Exclusion code: 8
161. Chattopadhyay, K., et al., Vaginal birth after cesarean section: management debate. Int J Gynaecol Obstet, 1988. 26(2): p. 189-96.
Exclusion code: 8
162. Chattopadhyay, S.K., H. Kharif, and
F-13
Appendix F. Excluded Studies List, continued
M.M. Sherbeeni, Placenta praevia and accreta after previous caesarean section. Eur J Obstet Gynecol Reprod Biol, 1993. 52(3): p. 151-6.
Exclusion code: 8
163. Chattopadhyay, S.K., M.M. Sherbeeni, and C.C. Anokute, Planned vaginal delivery after two previous caesarean sections. Br J Obstet Gynaecol, 1994. 101(6): p. 498-500.
Exclusion code: 8
164. Chauhan, S.P., et al., Application of learning theory to obstetric maloccurrence. J Matern Fetal Neonatal Med, 2003. 13(3): p. 203-7.
Exclusion code: 4
165. Chauhan, S.P., et al., Maternal and perinatal complications with uterine rupture in 142,075 patients who attempted vaginal birth after cesarean delivery: A review of the literature. Am J Obstet Gynecol, 2003. 189(2): p. 408-17.
Exclusion code: 6
166. Chauhan, S.P., et al., Neonatal acidemia with trial of labor among parturients with prior cesarean delivery: a case-control study. J Matern Fetal Med, 2000. 9(5): p. 278-81.
Exclusion code: 7
167. Chazotte, C. and W.R. Cohen, Catastrophic complications of previous cesarean section. Am J Obstet Gynecol, 1990. 163(3): p. 738-42.
Exclusion code: 4
168. Chelmow, D. and R.K. Laros, Jr., Maternal and neonatal outcomes after oxytocin augmentation in patients undergoing a trial of labor after prior cesarean delivery. Obstet Gynecol, 1992. 80(6): p. 966-71.
Exclusion code: 10
169. Chen, H.Y., S.J. Chen, and F.J. Hsieh, Observation of cesarean section scar by transvaginal ultrasonography. Ultrasound Med Biol, 1990. 16(5): p. 443-7.
Exclusion code: 4
170. Chen, K.C. and T.T. Hsieh, Rupture of gravid uterus: a eight-year clinical analysis and review of the literature. Changgeng Yi Xue Za Zhi, 1992. 15(1): p. 15-22.
Exclusion code: 4
171. Chen, L.H., K.H. Tan, and G.S. Yeo, A ten-year review of uterine rupture in modern obstetric practice. Ann Acad Med Singapore, 1995. 24(6): p. 830-5.
Exclusion code: 8
172. Cheng, M. and M. Hannah, Breech delivery at term: a critical review of the literature. Obstet Gynecol, 1993. 82(4 Pt 1): p. 605-18.
Exclusion code: 4
173. Chestnut, D.H., Does epidural analgesia during labor affect the incidence of cesarean delivery? Reg Anesth, 1997. 22(6): p. 495-9.
Exclusion code: 6
174. Cheung, V.Y.T., Sonographic measurement of the lower uterine segment thickness: is it truly
F-14

Appendix F. Excluded Studies List, continued
predictive of uterine rupture? J Obstet Gynaecol Can, 2008. 30(2): p. 148-51.
Exclusion code: 9
175. Chez, R.A., Cervical ripening and labor induction after previous cesarean delivery. Clin Obstet Gynecol, 1995. 38(2): p. 287-92.
Exclusion code: 6
176. Chigbu, C.O., J.O. Enwereji, and A.C. Ikeme, Women's experiences following failed vaginal birth after cesarean delivery. Int J Gynaecol Obstet, 2007. 99(2): p. 113-6.
Exclusion code: 8
177. Cho, M.K., Y.H. Kim, and T.B. Song, Predictive factors for vaginal birth after cesarean delivery. Int J Gynaecol Obstet, 2004. 86(3): p. 392-3.
Exclusion code: 11
178. Christian, S.S., et al., Vaginal breech delivery: a five-year prospective evaluation of a protocol using computed tomographic pelvimetry. Am J Obstet Gynecol, 1990. 163(3): p. 848-55.
Exclusion code: 5
179. Chua, S. and S. Arulkumaran, Trial of scar. Aust N Z J Obstet Gynaecol, 1997. 37(1): p. 6-11.
Exclusion code: 6
180. Chuang, J.H. and R.A. Jenders, Trial of labor versus elective repeat cesarean section for the women with a previous cesarean section: a decision analysis. Proceedings / AMIA, 1999. Annual Symposium.:
p. 226-30. Exclusion code: 4
181. Chung, A., et al., Cost-effectiveness of a trial of labor after previous cesarean. Obstet Gynecol, 2001. 97(6): p. 932-41.
Exclusion code: 6
182. Cicinelli, E., et al., Predictive factors for pain experienced at office fluid minihysteroscopy. J Minim Invasive Gynecol, 2007. 14(4): p. 485-8.
Exclusion code: 4
183. Clark, S.L., Rupture of the scarred uterus. Obstet Gynecol Clin North Am, 1988. 15(4): p. 737-44.
Exclusion code: 6
184. Clark, S.L., et al., Reducing obstetric litigation through alterations in practice patterns. Obstet Gynecol, 2008. 112(6): p. 1279-83.
Exclusion code: 6
185. Clark, S.L., P.P. Koonings, and J.P. Phelan, Placenta previa/accreta and prior cesarean section. Obstet Gynecol, 1985. 66(1): p. 89-92.
Exclusion code: 10
186. Clark, S.L., et al., Is vaginal birth after cesarean less expensive than repeat cesarean delivery? Am J Obstet Gynecol, 2000. 182(3): p. 599-602.
Exclusion code: 6
187. Clark, S.L., et al., Emergency hysterectomy for obstetric hemorrhage. Obstet Gynecol, 1984. 64(3): p. 376-80.
Exclusion code: 10
F-15
Appendix F. Excluded Studies List, continued
188. Clarke, S.C. and S.M. Taffel, Rates of cesarean and VBAC delivery, United States, 1994. Birth, 1996. 23(3): p. 166-8.
Exclusion code: 6
189. Clarke, S.C. and S.M. Taffel, State variation in rates of cesarean and VBAC delivery: 1989 and 1993. Stat Bull Metrop Insur Co, 1996. 77(1): p. 28-36.
Exclusion code: 6
190. Clarkson, C., D.C. Derrick, and M. Newburn, Vaginal birth after caesarean (part 3). Pract Midwife, 2006. 9(11): p. 34-7.
Exclusion code: 4
191. Clarkson, C. and M. Newburn, Vaginal birth after caesarean (part 1). Pract Midwife, 2006. 9(9): p. 22-5.
Exclusion code: 4
192. Clarkson, C. and M. Newburn, Vaginal birth after caesarean (part 2). Pract Midwife, 2006. 9(10): p. 26-7.
Exclusion code: 4
193. Clock, C., et al., Cesarean risk after successful external cephalic version: a matched, retrospective analysis. J Perinatol, 2009. 29(2): p. 96-100.
Exclusion code: 7
194. Cohain, J.S., Vaginal births after C-section are not necessarily riskier in a birth center than in the hospital. Midwifery Today Int Midwife, 2006(77): p. 16-7.
Exclusion code: 6
195. Cohain, J.S., VBAC rupture & birth weight. Midwifery Today Int Midwife, 2007(83): p. 50.
Exclusion code: 6
196. Cohain, J.S. and S. Bewley, Vaginal birth after caesarean section versus elective repeat caesarean section: assess neonatal downstream outcomes too.[comment]. Bjog, 2006. 113(7): p. 852-3; author reply 853-4.
Exclusion code: 6
197. Coleman, V.H., et al., Vaginal birth after cesarean delivery: practice patterns of obstetrician-gynecologists. J Reprod Med, 2005. 50(4): p. 261-6.
Exclusion code: 6
198. Coleman, V.H., H. Lawrence, and J. Schulkin, Rising cesarean delivery rates: the impact of cesarean delivery on maternal request. Obstet Gynecol Surv, 2009. 64(2): p. 115-9.
Exclusion code: 6
199. Collins, C., Story of a VBAC rupture. Midwifery Today Int Midwife, 2007(82): p. 35.
Exclusion code: 6
200. Combs, C.A., E.L. Murphy, and R.K. Laros, Jr., Factors associated with hemorrhage in cesarean deliveries. Obstet Gynecol, 1991. 77(1): p. 77-82.
Exclusion code: 10
201. Committee on Obstetric, P., Induction of labor for vaginal birth after cesarean delivery. Int J
F-16

Appendix F. Excluded Studies List, continued
Gynaecol Obstet, 2002. 77(3): p. 303-4.
Exclusion code: 6
202. Conde-Agudelo, A., A. Rosas-Bermudez, and A.C. Kafury-Goeta, Effects of birth spacing on maternal health: a systematic review. Am J Obstet Gynecol, 2007. 196(4): p. 297-308.
Exclusion code: 4
203. Coniglio, C. and J.E. Dickinson, Pregnancy following prior Caesarean scar pregnancy rupture: Lessons for modern obstetric practice. Aust N Z J Obstet Gynaecol, 2004. 44(2): p. 162-5.
Exclusion code: 9
204. Coonrod, D.V., R.C. Bay, and G.Y. Kishi, The epidemiology of labor induction: Arizona, 1997. Am J Obstet Gynecol, 2000. 182(6): p. 1355-62.
Exclusion code: 4
205. Coulter, C.H. and R. Lehrfeld, When push comes to shove: implementing VBAC practice guidelines. Physician Exec, 1995. 21(6): p. 30-5.
Exclusion code: 6
206. Crane, J.M., et al., Maternal complications with placenta previa. Am J Perinatol, 2000. 17(2): p. 101-5.
Exclusion code: 5
207. Crane, S.S., et al., Association between pre-pregnancy obesity and the risk of cesarean delivery. Obstet Gynecol, 1997. 89(2): p. 213-6.
Exclusion code: 6
208. Crawford, P. and L. Kaufmann, How safe is vaginal birth after cesarean section for the mother and fetus? J Fam Pract, 2006. 55(2): p. 149-51; discussion 149.
Exclusion code: 4
209. Cunha, M., et al., Induction of labor by vaginal misoprostol in patients with previous cesarean delivery. Acta Obstet Gynecol Scand, 1999. 78(7): p. 653-4.
Exclusion code: 8
210. Curtin, S.C., L.J. Kozak, and K.D. Gregory, U.S. cesarean and VBAC rates stalled in the mid-1990s. Birth, 2000. 27(1): p. 54-7.
Exclusion code: 6
211. Daltveit, A.K., et al., Cesarean delivery and subsequent pregnancies. Obstet Gynecol, 2008. 111(6): p. 1327-34.
Exclusion code: 4
212. Dandolu, V., et al., Resident education regarding technical aspects of cesarean section. J Reprod Med, 2006. 51(1): p. 49-54.
Exclusion code: 4
213. Danforth, D.N., Cesarean section. Jama, 1985. 253(6): p. 811-8.
Exclusion code: 4
214. Daponte, A., et al., The use of vaginal misoprostol for second-trimester pregnancy termination in women with previous single cesarean section. Contraception, 2006. 74(4): p. 324-7.
Exclusion code: 5
F-17
Appendix F. Excluded Studies List, continued
215. Daponte, A., et al., Pregnancy termination using vaginal misoprostol in women with more than one caesarean section. J Obstet Gynaecol, 2007. 27(6): p. 597-600.
Exclusion code: 5
216. Dashow, E.E., J.A. Read, and F.H. Coleman, Randomized comparison of five irrigation solutions at cesarean section. Obstet Gynecol, 1986. 68(4): p. 473-8.
Exclusion code: 4
217. Daskalakis, G.J., et al., Misoprostol for second trimester pregnancy termination in women with prior caesarean section. Bjog, 2005. 112(1): p. 97-9.
Exclusion code: 5
218. Dauphinee, J.D., VBAC: safety for the patient and the nurse.[erratum appears in J Obstet Gynecol Neonatal Nurs. 2004 Nov-Dec;33(6):833]. J Obstet Gynecol Neonatal Nurs, 2004. 33(1): p. 105-15.
Exclusion code: 4
219. Davey, M.R., J. Moodley, and G.J. Hofmeyr, Labour after caesarean section--the problem of scar dehiscence. South African Medical Journal Suid-Afrikaanse Tydskrif Vir Geneeskunde, 1987. 71(12): p. 766-8.
Exclusion code: 8
220. David, M., et al., Prior cesarean section--an acceptable risk for vaginal delivery at free-standing midwife-led birth centers? Results of
the analysis of vaginal birth after cesarean section (VBAC) in German birth centers. Eur J Obstet Gynecol Reprod Biol, 2009. 142(2): p. 106-10.
Exclusion code: 4
221. David-Montefiore, E., et al., Surgical routes and complications of hysterectomy for benign disorders: a prospective observational study in French university hospitals. Hum Reprod, 2007. 22(1): p. 260-5.
Exclusion code: 5
222. Davies, G.A., P.M. Hahn, and M.M. McGrath, Vaginal birth after cesarean. Physicians' perceptions and practice. J Reprod Med, 1996. 41(7): p. 515-20.
Exclusion code: 4
223. Daviss, B.A., Vaginal delivery after caesarean section. Study's focus on induction v spontaneous labour neglects spontaneous deliver. Bmj, 2001. 323(7324): p. 1307.
Exclusion code: 6
224. de Costa, C., Vaginal birth after classical Caesarean section. Aust N Z J Obstet Gynaecol, 2005. 45(3): p. 182-6.
Exclusion code: 4
225. de Jong, P., Trial of labor following cesarean section--a study of 212 patients. Int J Gynaecol Obstet, 1987. 25(5): p. 405-11.
Exclusion code: 8
226. de Muylder, X. and M. Thiery, The cesarean delivery rate can be safely reduced in a developing country.
F-18
Appendix F. Excluded Studies List, continued
Obstet Gynecol, 1990. 75(3 Pt 1): p. 360-4.
Exclusion code: 8
227. de Regt, R.H., et al., Relation of private or clinic care to the cesarean birth rate. N Engl J Med, 1986. 315(10): p. 619-24.
Exclusion code: 7
228. Declercq, E., M. Barger, and J.P. O'Grady, Uterine rupture among women with a prior cesarean delivery. N Engl J Med, 2002. 346(2): p. 134-7.
Exclusion code: 6
229. DeJoy, S., J.P. O'Grady, and R.T. Burkman, The risks of lowering the cesarean-delivery rate.[comment]. N Engl J Med, 1999. 341(1): p. 53-4; author reply 54-5.
Exclusion code: 6
230. Delaney, T. and D.C. Young, Trial of labour compared to elective Caesarean in twin gestations with a previous Caesarean delivery. J Obstet Gynaecol Can, 2003. 25(4): p. 289-92.
Exclusion code: 5
231. Delpapa, E.H. and E. Mueller-Heubach, Pregnancy outcome following ultrasound diagnosis of macrosomia. Obstet Gynecol, 1991. 78(3 Pt 1): p. 340-3.
Exclusion code: 5
232. Demianczuk, N.N., D.J. Hunter, and D.W. Taylor, Trial of labor after previous cesarean section: prognostic indicators of outcome. Am J Obstet Gynecol, 1982. 142(6
Pt 1): p. 640-2. Exclusion code: 10
233. Deneux-Tharaux, C., et al., Postpartum maternal mortality and cesarean delivery. Obstet Gynecol, 2006. 108(3 Pt 1): p. 541-8.
Exclusion code: 5
234. Deutchman, M. and R.G. Roberts, VBAC: protecting patients, defending doctors. Am Fam Physician, 2003. 67(5): p. 931-2.
Exclusion code: 4
235. Diani, F., Fetal macrosomia and management of delivery. Clinical and experimental obstetrics & gynecology, 1997. 24: p. 212-214.
Exclusion code: 5
236. Diaz, S.D., et al., Uterine rupture and dehiscence: ten-year review and case-control study. South Med J, 2002. 95(4): p. 431-5.
Exclusion code: 7
237. Dildy, G.A., et al., Very advanced maternal age: pregnancy after age 45. Am J Obstet Gynecol, 1996. 175(3 Pt 1): p. 668-74.
Exclusion code: 5
238. Dilks, F.M. and J.A. Beal, Role of self-efficacy in birth choice. J Perinat Neonatal Nurs, 1997. 11(1): p. 1-9.
Exclusion code: 6
239. DiMaio, H., et al., Vaginal birth after cesarean delivery: an historic cohort cost analysis. Am J Obstet Gynecol, 2002. 186(5): p. 890-2.
Exclusion code: 6
F-19

Appendix F. Excluded Studies List, continued
240. Dodd, J. and C. Crowther, Induction of labour for women with a previous Caesarean birth: a systematic review of the literature. Aust N Z J Obstet Gynaecol, 2004. 44(5): p. 392-5.
Exclusion code: 6
241. Dodd, J. and C. Crowther, Vaginal birth after Caesarean versus elective repeat Caesarean for women with a single prior Caesarean birth: a systematic review of the literature. Aust N Z J Obstet Gynaecol, 2004. 44(5): p. 387-91.
Exclusion code: 4
242. Dodd, J. and C.A. Crowther, Vaginal birth after Caesarean section: a survey of practice in Australia and New Zealand. Aust N Z J Obstet Gynaecol, 2003. 43(3): p. 226-31.
Exclusion code: 6
243. Dodd, J., E. Pearce, and C. Crowther, Women's experiences and preferences following Caesarean birth. Aust N Z J Obstet Gynaecol, 2004. 44(6): p. 521-4.
Exclusion code: 6
244. Dodd, J.M., E.R. Anderson, and S. Gates, Surgical techniques for uterine incision and uterine closure at the time of caesarean section. Cochrane Database Syst Rev, 2008.
Exclusion code: 6
245. Dodd, J.M. and C.A. Crowther, Elective repeat caesarean section versus induction of labour for women with a previous caesarean birth. Cochrane Database Syst Rev, 2006(4): p. CD004906.
Exclusion code: 4
246. Dodd, J.M., et al., Birth after caesarean study--planned vaginal birth or planned elective repeat caesarean for women at term with a single previous caesarean birth: protocol for a patient preference study and randomised trial. BMC Pregnancy Childbirth, 2007. 7: p. 17.
Exclusion code: 4
247. Doherty, D.A., et al., Factors affecting caesarean operative time and the effect of operative time on pregnancy outcomes. Aust N Z J Obstet Gynaecol, 2008. 48(3): p. 286-91.
Exclusion code: 5
248. Doucette, R.C., H.T. Sharp, and S.C. Alder, Challenging generally accepted contraindications to vaginal hysterectomy. Am J Obstet Gynecol, 2001. 184(7): p. 1386-9; discussion 1390-1.
Exclusion code: 4
249. Duffield, C., et al., Endometrial and endocervical micro echogenic foci: sonographic appearance with clinical and histologic correlation. J Ultrasound Med, 2005. 24(5): p. 583-90.
Exclusion code: 4
250. Dunn, E.A. and C. O'Herlihy, Comparison of maternal satisfaction following vaginal delivery after caesarean section and caesarean section after previous vaginal delivery. Eur J Obstet Gynecol Reprod Biol, 2005. 121(1): p. 56-60.
Exclusion code: 6
F-20

Appendix F. Excluded Studies List, continued
251. Durnwald, C.P. and B.M. Mercer, Myometrial thickness according to uterine site, gestational age and prior cesarean delivery. J Matern Fetal Neonatal Med, 2008. 21(4): p. 247-50.
Exclusion code: 7
252. Durnwald, C.P., et al., The Maternal-Fetal Medicine Units Cesarean Registry: safety and efficacy of a trial of labor in preterm pregnancy after a prior cesarean delivery. Am J Obstet Gynecol, 2006. 195(4): p. 1119-26.
Exclusion code: 5
253. Dyack, C., P.F. Hughes, and J.B. Simbakalia, Vaginal birth after cesarean section in the grand multipara with a previous lower segment scar. Int J Gynaecol Obstet, 1996. 55(2): p. 167-8.
Exclusion code: 6
254. Dyack, C., P.F. Hughes, and J.B. Simbakalia, Vaginal delivery in the grand multipara following previous lower segment cesarian section. J Obstet Gynaecol Res, 1997. 23(2): p. 219-22.
Exclusion code: 4
255. Ebell, M.H., Predicting the likelihood of successful vaginal birth after cesarean delivery. Am Fam Physician, 2007. 76(8): p. 1192-4.
Exclusion code: 4
256. Ecker, J.L. and F.D. Frigoletto, Jr., Cesarean delivery and the risk-benefit calculus. N Engl J Med, 2007. 356(9): p. 885-8.
Exclusion code: 6
257. Eden, K.B., et al., Childbirth preferences after cesarean birth: a review of the evidence. Birth, 2004. 31(1): p. 49-60.
Exclusion code: 6
258. Elferink-Stinkens, P.M., R. Brand, and O.J. Van Hemel, Trends in caesarean section rates among high-and medium-risk pregnancies in The Netherlands 1983-1992. Eur J Obstet Gynecol Reprod Biol, 1995. 59(2): p. 159-67.
Exclusion code: 7
259. Eltabbakh, G.H. and J.D. Watson, Postpartum hysterectomy. Int J Gynaecol Obstet, 1995. 50(3): p. 257-62.
Exclusion code: 5
260. Emmett, C.L., et al., Decision-making about mode of delivery after previous caesarean section: development and piloting of two computer-based decision aids. Health Expect, 2007. 10(2): p. 161-72.
Exclusion code: 6
261. Emmett, C.L., et al., Women's experience of decision making about mode of delivery after a previous caesarean section: the role of health professionals and information about health risks. Bjog, 2006. 113(12): p. 1438-45.
Exclusion code: 6
262. Eniola, O.A., et al., Obstetric hysterectomy in a population of South East England. J Obstet Gynaecol, 2006. 26(2): p. 104-9.
F-21
Appendix F. Excluded Studies List, continued
Exclusion code: 4
263. Escamilla, J.O., Comments on trial of labor scoring system.[comment]. Am J Obstet Gynecol, 1993. 169(4): p. 1076-7.
Exclusion code: 4
264. Escamilla, J.O., A VBAC question.[comment]. Am J Obstet Gynecol, 2002. 186(4): p. 851; author reply 851.
Exclusion code: 6
265. Escudero, F. and H. Contreras, A comparative trial of labor induction with misoprostol versus oxytocin. Int J Gynaecol Obstet, 1997. 57(2): p. 139-43.
Exclusion code: 8
266. Esler, M.D. and J. Douglas, Planning for hemorrhage Steps an anesthesiologist can take to limit and treat hemorrhage in the obstetric patient. Anesthesiology Clin N Am, 2003. 21: p. 127-144.
Exclusion code: 4
267. Estrade, S., et al., History of cesarean before 32 weeks' gestation and trial of labor: what is the risk of uterine rupture? Acta Obstet Gynecol Scand, 2009. 88(2): p. 149-53.
Exclusion code: 4
268. Ewen, S.P., R.G. Notley, and P.M. Coats, Bladder laceration associated with uterine scar rupture during vaginal delivery. Br J Urol, 1994. 73(6): p. 712-3.
Exclusion code: 9
269. Faiz, A.S. and C.V. Ananth, Etiology and risk factors for placenta previa: an overview and meta-analysis of observational studies. J Matern Fetal Neonatal Med, 2003. 13(3): p. 175-90.
Exclusion code: 4
270. Fang, Y.M.V. and C.M. Zelop, Vaginal birth after cesarean: assessing maternal and perinatal risks--contemporary management. Clin Obstet Gynecol, 2006. 49(1): p. 147-53.
Exclusion code: 6
271. Farmakides, G., et al., Vaginal birth after two or more previous cesarean sections. Am J Obstet Gynecol, 1987. 156(3): p. 565-6.
Exclusion code: 10
272. Farmer, R.M., et al., Uterine rupture during trial of labor after previous cesarean section. Am J Obstet Gynecol, 1991. 165(4 Pt 1): p. 996-1001.
Exclusion code: 5
273. Farnworth, A., et al., Decision support for women choosing mode of delivery after a previous caesarean section: a developmental study. Patient Educ Couns, 2008. 71(1): p. 116-24.
Exclusion code: 6
274. Fedorkow, D.M., C.A. Nimrod, and P.J. Taylor, Ruptured uterus in pregnancy: a Canadian hospital's experience. Cmaj, 1987. 137(1): p. 27-9.
Exclusion code: 10
F-22
Appendix F. Excluded Studies List, continued
275. Fenwick, J., J. Gamble, and Y. Hauck, Reframing birth: a consequence of cesarean section. J Adv Nurs, 2006. 56(2): p. 121-30; discussion 131-2.
Exclusion code: 6
276. Fenwick, J., J. Gamble, and Y. Hauck, Believing in birth--choosing VBAC: the childbirth expectations of a self-selected cohort of Australian women. J Clin Nurs, 2007. 16(8): p. 1561-70.
Exclusion code: 6
277. Fenwick, J., J. Gamble, and J. Mawson, Women's experiences of Caesarean section and vaginal birth after Caesarian: a Birthrites initiative. Int J Nurs Pract, 2003. 9(1): p. 10-7.
Exclusion code: 6
278. Figueroa, R., D. Garry, and A.P. Mackenzie, Posterior uterine rupture in a woman with a previous Cesarean delivery. J Matern Fetal Neonatal Med, 2003. 14(2): p. 130-1.
Exclusion code: 9
279. Finley, B.E. and C.E. Gibbs, Emergent cesarean delivery in patients undergoing a trial of labor with a transverse lower-segment scar. Am J Obstet Gynecol, 1986. 155(5): p. 936-9.
Exclusion code: 10
280. Flamm, B.L., Vaginal birth after cesarean section: controversies old and new. Clin Obstet Gynecol, 1985. 28(4): p. 735-44.
Exclusion code: 4
281. Flamm, B.L., Vaginal birth after caesarean (VBAC). Best Pract Res Clin Obstet Gynaecol, 2001. 15(1): p. 81-92.
Exclusion code: 6
282. Flamm, B.L., Vaginal birth after cesarean: reducing medical and legal risks. Clin Obstet Gynecol, 2001. 44(3): p. 622-9.
Exclusion code: 6
283. Flamm, B.L., Vaginal birth after cesarean: what's new in the new millennium? Curr Opin Obstet Gynecol, 2002. 14(6): p. 595-9.
Exclusion code: 4
284. Flamm, B.L., et al., Prostaglandin E2 for cervical ripening: a multicenter study of patients with prior cesarean delivery. Am J Perinatol, 1997. 14(3): p. 157-60.
Exclusion code: 4
285. Flamm, B.L., et al., Vaginal delivery following cesarean section: use of oxytocin augmentation and epidural anesthesia with internal tocodynamic and internal fetal monitoring. Am J Obstet Gynecol, 1984. 148(6): p. 759-63.
Exclusion code: 10
286. Flamm, B.L., et al., External cephalic version after previous cesarean section. Am J Obstet Gynecol, 1991. 165(2): p. 370-2.
Exclusion code: 4
287. Fogelson, N.S., et al., Neonatal impact of elective repeat cesarean delivery at term: a comment on patient choice cesarean delivery. Am
F-23
Appendix F. Excluded Studies List, continued
J Obstet Gynecol, 2005. 192(5): p. 1433-6.
Exclusion code: 5
288. Ford, A.A.D., B.T. Bateman, and L.L. Simpson, Vaginal birth after cesarean delivery in twin gestations: a large, nationwide sample of deliveries. Am J Obstet Gynecol, 2006. 195(4): p. 1138-42.
Exclusion code: 5
289. Forna, F., A.M. Miles, and D.J. Jamieson, Emergency peripartum hysterectomy: a comparison of cesarean and postpartum hysterectomy. Am J Obstet Gynecol, 2004. 190(5): p. 1440-4.
Exclusion code: 7
290. Forsnes, E.V., J.E. Browning, and R.B. Gherman, Bladder rupture associated with uterine rupture. A report of two cases occurring during vaginal birth after cesarean. J Reprod Med, 2000. 45(3): p. 240-2.
Exclusion code: 9
291. Francois, K., J.M. Johnson, and C. Harris, Is placenta previa more common in multiple gestations? Am J Obstet Gynecol, 2003. 188(5): p. 1226-7.
Exclusion code: 5
292. Franz, M.B., et al., Stillbirth following previous cesarean section in Bavaria/Germany 1987-2005. Arch Gynecol Obstet, 2009. 279(1): p. 29-36.
Exclusion code: 4
293. Fraser, W., Women's mid-pregnancy motivation to attempt VBAC predicts
delivery method. International Journal of Gynecology & Obstetrics, 1994. 46(32).
Exclusion code: 6
294. Frederiksen, M.C., R. Glassenberg, and C.S. Stika, Placenta previa: a 22-year analysis. Am J Obstet Gynecol, 1999. 180(6 Pt 1): p. 1432-7.
Exclusion code: 10
295. French, L., Trial of labor after cesarean section. J Fam Pract, 1996. 43(6): p. 538-9.
Exclusion code: 6
296. Frost, J., et al., Women's views on the use of decision aids for decision making about the method of delivery following a previous caesarean section: qualitative interview study. Bjog, 2009. 116(7): p. 896-905.
Exclusion code: 6
297. Fruchter, O., Trial of labor compared with an elective second cesarean section.[comment]. N Engl J Med, 1997. 336(9): p. 658; author reply 659.
Exclusion code: 6
298. Fylstra, D.L., Ectopic pregnancy within a cesarean scar: a review. Obstet Gynecol Surv, 2002. 57(8): p. 537-43.
Exclusion code: 4
299. Gagnon, A.J., Individual or group antenatal education for childbirth/parenthood.[update in Cochrane Database Syst Rev. 2007;(3):CD002869; PMID: 17636711]. Cochrane Database Syst
F-24
Appendix F. Excluded Studies List, continued
Rev, 2000(4): p. CD002869. Exclusion code: 4
300. Gagnon, A.J. and J. Sandall, Individual or group antenatal education for childbirth or parenthood, or both.[update of Cochrane Database Syst Rev. 2000;(4):CD002869; PMID: 11034780]. Cochrane Database Syst Rev, 2007(3): p. CD002869.
Exclusion code: 4
301. Gamble, J.A. and D.K. Creedy, Women's preference for a cesarean section: incidence and associated factors. Birth, 2001. 28(2): p. 101-10.
Exclusion code: 4
302. Gardeil, F., S. Daly, and M.J. Turner, Uterine rupture in pregnancy reviewed. Eur J Obstet Gynecol Reprod Biol, 1994. 56(2): p. 107-10.
Exclusion code: 7
303. Garg, V.K. and E.N. Ekuma-Nkama, Vaginal birth following two cesarean sections. Int J Gynaecol Obstet, 2005. 88(1): p. 53-4.
Exclusion code: 8
304. Gates, P.E., Think globally, act locally: an approach to implementation of clinical practice guidelines. Jt Comm J Qual Improv, 1995. 21(2): p. 71-84.
Exclusion code: 6
305. Gellman, E., et al., Vaginal delivery after cesarean section. Experience in private practice. Jama, 1983. 249(21): p. 2935-7.
Exclusion code: 10
306. Gerhardstein, L.P., et al., Reduction in the rate of cesarean birth with active management of labor and intermediate-dose oxytocin. J Reprod Med, 1995. 40(1): p. 4-8.
Exclusion code: 7
307. Gherman, R.B., S. McBrayer, and J. Browning, Uterine rupture associated with vaginal birth after cesarean section: a complication of intravaginal misoprostol? Gynecol Obstet Invest, 2000. 50(3): p. 212-3.
Exclusion code: 9
308. Gibbs, C.E., Planned vaginal delivery following cesarean section. Clin Obstet Gynecol, 1980. 23(2): p. 507-15.
Exclusion code: 10
309. Gibbs, C.P., et al., Obstetric anesthesia: a national survey. Anesthesiology, 1986. 65(3): p. 298-306.
Exclusion code: 10
310. Gifford, D.S., E. Keeler, and K.L. Kahn, Reductions in cost and cesarean rate by routine use of external cephalic version: a decision analysis. Obstet Gynecol, 1995. 85(6): p. 930-6.
Exclusion code: 7
311. Gil, A. and C.J. Sultana, Vesicouterine fistula after vacuum delivery and two previous cesarean sections. A case report. J Reprod Med, 2001. 46(9): p. 853-5.
Exclusion code: 9
312. Gilmour, D.T., et al., Minimizing the
F-25
Appendix F. Excluded Studies List, continued
urological and psychological morbidity of urinary tract fistulae from VBAC. J Obstet Gynaecol Can, 2006. 28(2): p. 132-5.
Exclusion code: 9
313. Gleicher, N., Mandatory trial of labor after cesarean delivery: an alternative viewpoint.[comment]. Obstet Gynecol, 1991. 78(4): p. 727-8.
Exclusion code: 6
314. Gochnour, G., S. Ratcliffe, and M.B. Stone, The UTAH VBAC Study. Matern Child Health J, 2005. 9(2): p. 181-8.
Exclusion code: 6
315. Goer, H., Misoprostol and uterine rupture. Birth, 2000. 27(3): p. 224-5.
Exclusion code: 6
316. Goer, H., VBAC and the New England Journal of Medicine. Birth, 2002. 29(2): p. 150-1.
Exclusion code: 4
317. Goffman, D., et al., Predictors of maternal mortality and near-miss maternal morbidity. J Perinatol, 2007. 27(10): p. 597-601.
Exclusion code: 7
318. Goldman, G., et al., Effects of patient, physician and hospital characteristics on the likelihood of vaginal birth after previous cesarean section in Quebec. Cmaj, 1990. 143(10): p. 1017-24.
Exclusion code: 6
319. Gonzales, G.F. and A. Salirrosas, Pulse oxygen saturation and
neurologic assessment in human neonates after vaginal and cesarean delivery. Int J Gynaecol Obstet, 1998. 63(1): p. 63-6.
Exclusion code: 10
320. Gorgen, H., et al., Fetal torticollis and upper extremity haematoma after silent uterine rupture: a case report. Aust N Z J Obstet Gynaecol, 2007. 47(6): p. 513-4.
Exclusion code: 9
321. Goyert, G.L., et al., The physician factor in cesarean birth rates. N Engl J Med, 1989. 320(11): p. 706-9.
Exclusion code: 7
322. Graham, A.R., Trial labor following previous cesarean section. Am J Obstet Gynecol, 1984. 149(1): p. 35-45.
Exclusion code: 10
323. Granot, M., Postcesarean section pain prediction by preoperative pressure pain assessment. Anesthesiology, 2003. 98: p. 1422-26.
Exclusion code: 4
324. Gray, R., et al., Caesarean delivery and risk of stillbirth in subsequent pregnancy: a retrospective cohort study in an English population. Bjog, 2007. 114(3): p. 264-70.
Exclusion code: 10
325. Gregory, K.D., Maternal and infant complications in high and normal weight infants by method of delivery. Obstetrics and Gynecology, 1998. 92: p. 507-513.
Exclusion code: 7
F-26

Appendix F. Excluded Studies List, continued
326. Gregory, K.D., et al., Repeat cesareans: how many are elective? Obstet Gynecol, 1994. 84(4): p. 574-8.
Exclusion code: 4
327. Grobman, W.A., A.M. Peaceman, and M.L. Socol, Cost-effectiveness of elective cesarean delivery after one prior low transverse cesarean. Obstet Gynecol, 2000. 95(5): p. 745-51.
Exclusion code: 6
328. Gross, T., R.J. Sokol, and K.C. King, Obesity in pregnancy: risks and outcome. Obstet Gynecol, 1980. 56(4): p. 446-50.
Exclusion code: 6
329. Gross, T.L., et al., Avoiding prematurity in elective repeat cesarean section. A role for amniotic fluid phosphatidylglycerol. Acta Obstet Gynecol Scand, 1984. 63(8): p. 683-6.
Exclusion code: 6
330. Groutz, A., et al., Persistent postpartum urinary retention in contemporary obstetric practice. Definition, prevalence and clinical implications. J Reprod Med, 2001. 46(1): p. 44-8.
Exclusion code: 7
331. Grunebaum, A.N., et al., The relationship of maternal antibody levels to post-cesarean section endometritis. Am J Obstet Gynecol, 1983. 147(8): p. 919-22.
Exclusion code: 5
332. Gudgeon, C.W., Uterine rupture and scar dehiscence.[comment]. Anaesth Intensive Care, 1997. 25(4): p. 434.
Exclusion code: 6
333. Guleria, K., G.I. Dhall, and K. Dhall, Pattern of cervical dilatation in previous lower segment caesarean section patients. J Indian Med Assoc, 1997. 95(5): p. 131-4.
Exclusion code: 4
334. Gupta, A., et al., Meconium stained urine: an unusual sign of combined uterine and bladder rupture. Aust N Z J Obstet Gynaecol, 2005. 45(4): p. 334.
Exclusion code: 9
335. Haas, A.V., Homebirth after cesarean: the myth & the reality.[erratum appears in Midwifery Today Int Midwife. 2008 Winter;(88):8]. Midwifery Today Int Midwife, 2008(86): p. 44-7.
Exclusion code: 6
336. Habek, D. and R. Becarevic, Emergency peripartum hysterectomy in a tertiary obstetric center: 8-year evaluation. Fetal Diagn Ther, 2007. 22(2): p. 139-42.
Exclusion code: 5
337. Haberman, S., et al., Variations in compliance with documentation using computerized obstetric records. Obstet Gynecol, 2007. 110(1): p. 141-5.
Exclusion code: 6
338. Hales, K., Influence of labor and route of delivery on the frequency of respiratory morbidity in term
F-27
Appendix F. Excluded Studies List, continued
neonates. Int J Gynaecol Obstet, 1993. 43: p. 35-40.
Exclusion code: 4
339. Hall, M.H., Mode of delivery and future fertility. Br J Obstet Gynaecol, 1989. 96: p. 1297-1303.
Exclusion code: 4
340. Hamar, B.D., et al., Expectant management of uterine dehiscence in the second trimester of pregnancy. Obstet Gynecol, 2003. 102(5 Pt 2): p. 1139-42.
Exclusion code: 9
341. Hammond, H., Death from obstetrical hemorrhage. Calif Med, 1972. 117(2): p. 16-20.
Exclusion code: 10
342. Hamrick-Turner, J.E., P.E. Cranston, and B.S. Lantrip, Gravid uterine dehiscence: MR findings. Abdom Imaging, 1995. 20(5): p. 486-8.
Exclusion code: 4
343. Hankins, G.D.V., S.M. Clark, and M.B. Munn, Cesarean section on request at 39 weeks: impact on shoulder dystocia, fetal trauma, neonatal encephalopathy, and intrauterine fetal demise. Semin Perinatol, 2006. 30(5): p. 276-87.
Exclusion code: 4
344. Haq, C.L., Vaginal birth after cesarean delivery. Am Fam Physician, 1988. 37(6): p. 167-71.
Exclusion code: 4
345. Harper, L.M. and G.A. Macones, Predicting success and reducing the risks when attempting vaginal birth
after cesarean. Obstet Gynecol Surv, 2008. 63(8): p. 538-45.
Exclusion code: 6
346. Harris, W.J., J.F. Daniell, and J.W. Baxter, Prior cesarean section. A risk factor for adenomyosis? J Reprod Med, 1985. 30(3): p. 173-5.
Exclusion code: 10
347. Has, R., et al., Imaging features of postpartum uterine rupture: a case report. Abdom Imaging, 2008. 33(1): p. 101-3.
Exclusion code: 4
348. Hauth, J.C., G.D. Hankins, and L.C. Gilstrap, 3rd, Uterine contraction pressures achieved in parturients with active phase arrest. Obstet Gynecol, 1991. 78(3 Pt 1): p. 344-7.
Exclusion code: 5
349. Hawe, J.A. and K.S. Olah, Posterior uterine rupture in a patient with a lower segment caesarean section scar complicating prostaglandin induction of labour. Br J Obstet Gynaecol, 1997. 104(7): p. 857-8.
Exclusion code: 9
350. Hawkins, J.L., Obstetric anesthesia work force survey, 1981 versus 1992. Anesthesiology, 1997. 87: p. 135-43.
Exclusion code: 6
351. Hawkins, J.L., et al., Oral intake policies on labor and delivery: A national survey. J Clin Anesth, 1998. 10(6): p. 449-451.
Exclusion code: 4
352. Hawkins, J.L., et al., A reevaluation of the association between
F-28

Appendix F. Excluded Studies List, continued
instrument delivery and epidural analgesia. Reg Anesth, 1995. 20(1): p. 50-6.
Exclusion code: 7
353. Hawkins, J.L., et al., Anesthesia-related deaths during obstetric delivery in the United States, 1979-1990. Anesthesiology, 1997. 86(2): p. 277-284.
Exclusion code: 4
354. Heddleston, L.N. and W.J. Watson, Vaginal birth after cesarean section in a small hospital. Mil Med, 1991. 156(5): p. 239-40.
Exclusion code: 6
355. Heffner, L.J., Uterine rupture among women with a prior cesarean delivery. N Engl J Med, 2002. 346(2): p. 134-7.
Exclusion code: 6
356. Hendricks, M.S., et al., Previous cesarean section and abortion as risk factors for developing placenta previa. J Obstet Gynaecol Res, 1999. 25(2): p. 137-42.
Exclusion code: 4
357. Henrich, W., et al., Ultrasound finding and operative management of a uterine rupture during vaginal delivery after Cesarean section. Ultrasound Obstet Gynecol, 2005. 25(2): p. 203-5.
Exclusion code: 9
358. Henriksen, T.B., et al., Cesarean section in twin pregnancies in two Danish counties with different cesarean section rates. Acta Obstet Gynecol Scand, 1994. 73(2): p. 123-
8. Exclusion code: 5
359. Heritage, C.K. and M.D. Cunningham, Association of elective repeat cesarean delivery and persistent pulmonary hypertension of the newborn. Am J Obstet Gynecol, 1985. 152(6 Pt 1): p. 627-9.
Exclusion code: 7
360. Hicks, P., Systematic review of the risk of uterine rupture with the use of amnioinfusion after previous cesarean delivery. South Med J, 2005. 98(4): p. 458-61.
Exclusion code: 4
361. Hildingsson, I., et al., Few women wish to be delivered by caesarean section. Bjog, 2002. 109(6): p. 618-23.
Exclusion code: 6
362. Hill, D.A., et al., Uterine rupture and dehiscence associated with intravaginal misoprostol cervical ripening. J Reprod Med, 2000. 45(10): p. 823-6.
Exclusion code: 9
363. Hodgkinson, R., Repeat caesarean section associated with gross obesity. Br J Anaesth, 1981. 53(10): p. 1108.
Exclusion code: 6
364. Hodnett, E.D., et al., Continuous support for women during childbirth. Cochrane Database Syst Rev, 2007.
Exclusion code: 4
365. Hoffman, M.K., et al., Uterine rupture in patients with a prior
F-29
Appendix F. Excluded Studies List, continued
cesarean delivery: the impact of cervical ripening. Am J Perinatol, 2004. 21(4): p. 217-22.
Exclusion code: 7
366. Hofmeyr, G.J., et al., Methods for cervical ripening and labour induction in late pregnancy: generic protocol. Cochrane Database Syst Rev, 2000.
Exclusion code: 4
367. Hofmeyr, G.J. and A.M. Gulmezoglu, Vaginal misoprostol for cervical ripening and induction of labour. Cochrane Database Syst Rev, 2004.
Exclusion code: 4
368. Hofmeyr, G.J. and M.E. Hannah, Planned caesarean section for term breech delivery. Cochrane Database Syst Rev, 2003.
Exclusion code: 4
369. Hofmeyr, G.J. and R. Kulier, External cephalic version for breech presentation at term. Cochrane Database Syst Rev, 2006.
Exclusion code: 7
370. Hofmeyr, G.J., L. Say, and A.M. Gulmezoglu, WHO systematic review of maternal mortality and morbidity: the prevalence of uterine rupture. Bjog, 2005. 112(9): p. 1221-8.
Exclusion code: 6
371. Horey, D., J. Weaver, and H. Russell, Information for pregnant women about caesarean birth. Cochrane Database Syst Rev, 2004(1): p. CD003858.
Exclusion code: 6
372. Howarth, G.R. and D.J. Botha, Amniotomy plus intravenous oxytocin for induction of labour. Cochrane Database Syst Rev, 2001.
Exclusion code: 4
373. Hsu, C.D., et al., Rupture of uterine scar with extensive maternal bladder laceration after cocaine abuse. Am J Obstet Gynecol, 1992. 167(1): p. 129-30.
Exclusion code: 9
374. Hurry, D.J., B. Larsen, and D. Charles, Effects of postcesarean section febrile morbidity on subsequent fertility. Obstet Gynecol, 1984. 64(2): p. 256-60.
Exclusion code: 10
375. Hutton, E. and E. Mozurkewich, Extra-amniotic prostaglandin for induction of labour. Cochrane Database Syst Rev, 2001.
Exclusion code: 4
376. Hutton, E.K. and G.J. Hofmeyr, External cephalic version for breech presentation before term. Cochrane Database Syst Rev, 2006.
Exclusion code: 4
377. Iglesias, S., R. Burn, and L.D. Saunders, Reducing the cesarean section rate in a rural community hospital.[see comment][erratum appears in Can Med Assoc J 1992 May 15;146(10):1701]. Cmaj, 1991. 145(11): p. 1459-64.
Exclusion code: 4
378. Imberti, R., et al., Blood transfusion
F-30
Appendix F. Excluded Studies List, continued
during cesarean section. A 12 years' retrospective analysis. Acta Anaesthesiol Belg, 1990. 41(2): p. 139-44.
Exclusion code: 7
379. Imoh-Ita, F. and S. Williams, Prostaglandin E2 induction of labour proceeding to vaginal delivery after two previous caesarean sections. J Obstet Gynaecol, 2002. 22(5): p. 559-60.
Exclusion code: 9
380. Jackson, N. and S. Paterson-Brown, Physical sequelae of caesarean section. Best Pract Res Clin Obstet Gynaecol, 2001. 15(1): p. 49-61.
Exclusion code: 6
381. Jacob, J. and J. Pfenninger, Cesarean deliveries: when is a pediatrician necessary? Obstet Gynecol, 1997. 89(2): p. 217-20.
Exclusion code: 7
382. Jaillard, S., V. Houfflin-Debarge, and L. Storme, Higher risk of persistent pulmonary hypertension of the newborn after cesarean. J Perinat Med, 2003. 31(6): p. 538-9.
Exclusion code: 4
383. Janke, J.R., Breastfeeding duration following cesarean and vaginal births. J Nurse Midwifery, 1988. 33(4): p. 159-64.
Exclusion code: 7
384. Janni, W., et al., The prognostic impact of a prolonged second stage of labor on maternal and fetal outcome. Acta Obstet Gynecol Scand, 2002. 81(3): p. 214-21.
Exclusion code: 5
385. Janssen, P.A., et al., Outcomes of planned home birth with registered midwife versus planned hospital birth with midwife or physician. CMAJ : Canadian Medical Association journal = journal de l'Association medicale canadienne, 2009. 181(6/7): p. 377-383.
Exclusion code: 4
386. Jarrell, M.A., G.G. Ashmead, and L.I. Mann, Vaginal delivery after cesarean section: a five-year study. Obstet Gynecol, 1985. 65(5): p. 628-32.
Exclusion code: 10
387. Jastrow, N., et al., Inter- and intraobserver variability in sonographic measurement of the lower uterine segment after a previous Cesarean section. Ultrasound Obstet Gynecol, 2006. 27(4): p. 420-4.
Exclusion code: 4
388. Jerbi, M., et al., Predictive factors of vaginal birth after cesarean delivery. Int J Gynaecol Obstet, 2006. 94(1): p. 43-4.
Exclusion code: 8
389. Jerbi, M., et al., Previous cesarean scar exploration following vaginal delivery and hemorrhagic morbidity. Int J Gynaecol Obstet, 2006. 92(2): p. 135-6.
Exclusion code: 8
390. Johnson, C. and N. Oriol, The role of epidural anesthesia in trial of labor. Reg Anesth, 1990. 15(6): p. 304-8.
F-31
Appendix F. Excluded Studies List, continued
Exclusion code: 6 Exclusion code: 7
391. Johnson, K.C. and I.M. Gaskin, Vaginal delivery after caesarean section. Safety of single-layer suturing in caesarean sections must be proved. Bmj, 2001. 323(7324): p. 1307-8.
Exclusion code: 6
392. Johnson, S.R., et al., Obstetric decision-making: responses to patients who request cesarean delivery. Obstet Gynecol, 1986. 67(6): p. 847-50.
Exclusion code: 4
393. Jolly, M.C., Risk factors for macrosomia and its clinical consequences: a study of 350,311 pregnancies. European Journal of Obstetrics Gynecology and Reproductive Biology, 2003. 111: p. 9-14.
Exclusion code: 7
394. Jonas, H.A., N. Khalid, and S.M. Schwartz, The relationship between Caesarean section and neonatal mortality in very-low-birthweight infants born in Washington State, USA. Paediatr Perinat Epidemiol, 1999. 13(2): p. 170-89.
Exclusion code: 5
395. Jonas, H.A. and J.M. Lumley, The effect of mode of delivery on neonatal mortality in very low birthweight infants born in Victoria, Australia: Caesarean section is associated with increased survival in breech-presenting, but not vertex-presenting, infants. Paediatr Perinat Epidemiol, 1997. 11(2): p. 181-99.
396. Jones, R.O., et al., Rupture of low transverse cesarean scars during trial of labor. Obstet Gynecol, 1991. 77(6): p. 815-7.
Exclusion code: 9
397. Joseph, G.F., Jr., C.M. Stedman, and A.G. Robichaux, Vaginal birth after cesarean section: the impact of patient resistance to a trial of labor. Am J Obstet Gynecol, 1991. 164(6 Pt 1): p. 1441-4; discussion 1444-7.
Exclusion code: 4
398. Joura, E.A., Minimal wound closure at cesarean delivery. Geburtsh Frauenheilkd, 1998. 58: p. 651-3.
Exclusion code: 4
399. Joyce, D.N., F. Giwa-Osagie, and G.W. Stevenson, Role of pelvimetry in active management of labour. Br Med J, 1975. 4(5995): p. 505-7.
Exclusion code: 10
400. Kabir, A.A., et al., Unnecessary cesarean delivery in Louisiana: an analysis of birth certificate data. Am J Obstet Gynecol, 2004. 190(1): p. 10-9; discussion 3A.
Exclusion code: 6
401. Kaczmarczyk, M., et al., Risk factors for uterine rupture and neonatal consequences of uterine rupture: a population-based study of successive pregnancies in Sweden. Bjog, 2007. 114(10): p. 1208-14.
Exclusion code: 5
402. Kamal, P., et al., Factors influencing repeat caesarean section: qualitative
F-32
Appendix F. Excluded Studies List, continued
exploratory study of obstetricians' and midwives' accounts. Bjog, 2005. 112(8): p. 1054-60.
Exclusion code: 6
403. Kaplan, B., et al., Routine revision of uterine scar after prior cesarean section. Acta Obstet Gynecol Scand, 1994. 73(6): p. 473-5.
Exclusion code: 7
404. Kaplan, D.L., Outcomes associated with a trial of labor after prior cesarean delivery.[comment]. N Engl J Med, 2005. 352(16): p. 1718-20; author reply 1718-20.
Exclusion code: 6
405. Karaer, A., F.A. Avsar, and S. Batioglu, Risk factors for ectopic pregnancy: a case-control study. Aust N Z J Obstet Gynaecol, 2006. 46(6): p. 521-7.
Exclusion code: 4
406. Kastner, E.S., et al., Emergency peripartum hysterectomy: experience at a community teaching hospital. Obstet Gynecol, 2002. 99(6): p. 971-5.
Exclusion code: 5
407. Kavak, Z.N., A. Basgul, and N. Ceyhan, Short-term outcome of newborn infants: spinal versus general anesthesia for elective cesarean section. A prospective randomized study. Eur J Obstet Gynecol Reprod Biol, 2001. 100(1): p. 50-4.
Exclusion code: 5
408. Kavanagh, J., A.J. Kelly, and J. Thomas, Sexual intercourse for
cervical ripening and induction of labour. Cochrane Database Syst Rev, 2001.
Exclusion code: 4
409. Kavanagh, J., A.J. Kelly, and J. Thomas, Breast stimulation for cervical ripening and induction of labour. Cochrane Database Syst Rev, 2005.
Exclusion code: 4
410. Kavanagh, J., A.J. Kelly, and J. Thomas, Corticosteroids for cervical ripening and induction of labour. Cochrane Database Syst Rev, 2006.
Exclusion code: 4
411. Kavanagh, J., A.J. Kelly, and J. Thomas, Hyaluronidase for cervical ripening and induction of labour. Cochrane Database Syst Rev, 2006.
Exclusion code: 4
412. Kayani, S.I. and Z. Alfirevic, Induction of labour with previous caesarean delivery: where do we stand? Curr Opin Obstet Gynecol, 2006. 18(6): p. 636-41.
Exclusion code: 4
413. Keeler, E.B., et al., Adjusting cesarean delivery rates for case mix. Health Serv Res, 1997. 32(4): p. 511-28.
Exclusion code: 7
414. Kelly, A., et al., Induction of labour in specific clinical situations: generic protocol. Cochrane Database Syst Rev, 2001.
Exclusion code: 4
415. Kelly, A.J. and J. Kavanagh, Nitric
F-33
Appendix F. Excluded Studies List, continued
oxide donors for cervical ripening and induction of labour. Cochrane Database Syst Rev, 2008.
Exclusion code: 5
416. Kelly, A.J., J. Kavanagh, and J. Thomas, Castor oil, bath and/or enema for cervical priming and induction of labour. Cochrane Database Syst Rev, 2001.
Exclusion code: 4
417. Kelly, A.J., J. Kavanagh, and J. Thomas, Relaxin for cervical ripening and induction of labour. Cochrane Database Syst Rev, 2001.
Exclusion code: 4
418. Kelly, A.J., J. Kavanagh, and J. Thomas, Vaginal prostaglandin (PGE2 and PGF2a) for induction of labour at term. Cochrane Database Syst Rev, 2003.
Exclusion code: 4
419. Kelly, A.J. and B. Tan, Intravenous oxytocin alone for cervical ripening and induction of labour. Cochrane Database Syst Rev, 2001.
Exclusion code: 4
420. Kendrick, J.S., et al., Previous cesarean delivery and the risk of ectopic pregnancy. Obstet Gynecol, 1996. 87(2): p. 297-301.
Exclusion code: 5
421. Khan, K.S. and A. Rizvi, The partograph in the management of labor following cesarean section. Int J Gynaecol Obstet, 1995. 50(2): p. 151-7.
Exclusion code: 8
422. Khan, K.S., A. Rizvi, and J.H. Rizvi, Risk of uterine rupture after the partographic 'alert' line is crossed--an additional dimension in the quest towards safe motherhood in labour following caesarean section. JPMA J Pak Med Assoc, 1996. 46(6): p. 120-2.
Exclusion code: 8
423. Kirk, E.P., et al., Vaginal birth after cesarean or repeat cesarean section: medical risks or social realities? Am J Obstet Gynecol, 1990. 162(6): p. 1398-403; discussion 403-5.
Exclusion code: 4
424. Kirkinen, P., Multiple caesarean sections: outcomes and complications. Br J Obstet Gynaecol, 1988. 95(8): p. 778-82.
Exclusion code: 10
425. Kirkinen, P., Ultrasonography of the lower uterine segment after multiple caesarean sections. Ann Med, 1990. 22(2): p. 137-9.
Exclusion code: 4
426. Kishor, T., et al., Study of vaginal delivery in patients with one previous lower segment caesarean section. Aust N Z J Obstet Gynaecol, 1986. 26(4): p. 245-8.
Exclusion code: 8
427. Kline, J. and F. Arias, Analysis of factors determining the selection of repeated cesarean section or trial of labor in patients with histories of prior cesarean delivery. J Reprod Med, 1993. 38(4): p. 289-92.
Exclusion code: 4
F-34

Appendix F. Excluded Studies List, continued
428. Knight, M., et al., Cesarean delivery and peripartum hysterectomy. Obstet Gynecol, 2008. 111(1): p. 97-105.
Exclusion code: 7
429. Kobelin, C.G., Intrapartum management of vaginal birth after cesarean section. Clin Obstet Gynecol, 2001. 44(3): p. 588-93.
Exclusion code: 4
430. Kolas, T., et al., Indications for cesarean deliveries in Norway. Am J Obstet Gynecol, 2003. 188(4): p. 864-70.
Exclusion code: 7
431. Kolderup, L.B., R.K. Laros, Jr., and T.J. Musci, Incidence of persistent birth injury in macrosomic infants: association with mode of delivery. Am J Obstet Gynecol, 1997. 177(1): p. 37-41.
Exclusion code: 10
432. Kopelman, J.N., et al., Computed tomographic pelvimetry in the evaluation of breech presentation. Obstet Gynecol, 1986. 68(4): p. 455-8.
Exclusion code: 5
433. Koroukian, S.M., Uterine rupture among women with a prior cesarean delivery. N Engl J Med, 2002. 346(2): p. 134-7.
Exclusion code: 6
434. Koroukian, S.M., D. Bush, and A.A. Rimm, Comparison of cesarean section rates in fee-for-service versus managed care patients in the Ohio Medicaid population, 1992-1997. Am J Manag Care, 2001. 7(2): p.
134-42. Exclusion code: 6
435. Koroukian, S.M. and A.A. Rimm, Declining trends in cesarean deliveries, Ohio 1989-1996: an analysis by indications. Birth, 2000. 27(1): p. 12-8.
Exclusion code: 6
436. Koroukian, S.M., B. Trisel, and A.A. Rimm, Estimating the proportion of unnecessary Cesarean sections in Ohio using birth certificate data.[erratum appears in J Clin Epidemiol 1999 Apr;52(4):379]. J Clin Epidemiol, 1998. 51(12): p. 1327-34.
Exclusion code: 6
437. Korst, L.M., et al., Hospital rates of maternal and neonatal infection in a low-risk population. Matern Child Health J, 2005. 9(3): p. 307-16.
Exclusion code: 7
438. Kotagal, U.R., et al., The impact of legislation and secular trends on newborn length of stay for Medicaid infants in Ohio. J Pediatr, 2002. 141(3): p. 392-7.
Exclusion code: 6
439. Kozak, L.J. and J.D. Weeks, U.S. trends in obstetric procedures, 1990-2000. Birth, 2002. 29(3): p. 157-61.
Exclusion code: 6
440. Krishnamurthy, S., et al., The role of postnatal x-ray pelvimetry after caesarean section in the management of subsequent delivery. Br J Obstet Gynaecol, 1991. 98(7): p. 716-8.
F-35
Appendix F. Excluded Studies List, continued
Exclusion code: 10
441. Kuczkowski, K.M., Vaginal birth after previous cesarean delivery: what are the most common signs of uterine rupture?[comment]. West Afr J Med, 2004. 23(4): p. 329.
Exclusion code: 6
442. Kwee, A., et al., Uterine rupture and its complications in the Netherlands: a prospective study. Eur J Obstet Gynecol Reprod Biol, 2006. 128(1-2): p. 257-61.
Exclusion code: 5
443. Kwee, A., et al., Outcome of subsequent delivery after a previous early preterm cesarean section. J Matern Fetal Neonatal Med, 2007. 20(1): p. 33-7.
Exclusion code: 5
444. Lagrew, D.C., Jr. and J.A. Adashek, Lowering the cesarean section rate in a private hospital: comparison of individual physicians' rates, risk factors, and outcomes. Am J Obstet Gynecol, 1998. 178(6): p. 1207-14.
Exclusion code: 6
445. Lam, C.M., S.F. Wong, and L.Y. Chan, Labor outcomes of short multiparous women with a previous successful vaginal delivery. Int J Gynaecol Obstet, 2001. 75(3): p. 313-4.
Exclusion code: 5
446. Landon, M.B., Vaginal birth after cesarean delivery. Clin Perinatol, 2008. 35(3): p. 491-504.
Exclusion code: 6
447. Langer, O., Shoulder dystocia: should the fetus weighing greater than or equal to 4000 grams be delivered by caesarean section? Am J Obstet Gynecol, 1991. 165: p. 831-837.
Exclusion code: 10
448. Lao, T.T. and B.F. Leung, Rupture of the gravid uterus. Eur J Obstet Gynecol Reprod Biol, 1987. 25(3): p. 175-80.
Exclusion code: 8
449. Laopaiboon, M., et al., Music during caesarean section under regional anesthesia for improving maternal and infant outcomes. Cochrane Database Syst Rev, 2008.
Exclusion code: 4
450. Laros, R.K., Jr., T.A. Flanagan, and S.J. Kilpatrick, Management of term breech presentation: a protocol of external cephalic version and selective trial of labor. Am J Obstet Gynecol, 1995. 172(6): p. 1916-23; discussion 1923-5.
Exclusion code: 5
451. Latendresse, G., P.A. Murphy, and J.T. Fullerton, A description of the management and outcomes of vaginal birth after cesarean birth in the homebirth setting. J Midwifery Womens Health, 2005. 50(5): p. 386-91.
Exclusion code: 5
452. Latthe, P., et al., Factors predisposing women to chronic pelvic pain: systematic review. Bmj, 2006. 332(7544): p. 749-55.
Exclusion code: 4
F-36

Appendix F. Excluded Studies List, continued
453. Lavin, J.P., et al., Vaginal delivery in patients with a prior cesarean section. Obstet Gynecol, 1982. 59(2): p. 135-48.
Exclusion code: 4
454. Leaphart, W.L., M.C. Meyer, and E.L. Capeless, Labor induction with a prenatal diagnosis of fetal macrosomia. J Matern Fetal Med, 1997. 6(2): p. 99-102.
Exclusion code: 5
455. Lee, K.S., et al., Relationship of cesarean delivery to lower birth weight-specific neonatal mortality in singleton breech infants in the United States. Obstet Gynecol, 1998. 92(5): p. 769-74.
Exclusion code: 5
456. Leeman, L. and R. Leeman, A Native American community with a 7% cesarean delivery rate: does case mix, ethnicity, or labor management explain the low rate? Ann Fam Med, 2003. 1(1): p. 36-43.
Exclusion code: 6
457. Lewis, S. and M. Collins, Induction of vaginal birth after cesarean using intracervical Foley bulb. J Midwifery Womens Health, 2008. 53(6): p. 563-6.
Exclusion code: 6
458. Lieberman, E., Risk factors for uterine rupture during a trial of labor after cesarean. Clin Obstet Gynecol, 2001. 44(3): p. 609-21.
Exclusion code: 6
459. Lieberman, E., et al., Assessing the
role of case mix in cesarean delivery rates. Obstet Gynecol, 1998. 92(1): p. 1-7.
Exclusion code: 5
460. Linton, A. and M.R. Peterson, Effect of managed care enrollment on primary and repeat cesarean rates among U.S. Department of Defense health care beneficiaries in military and civilian hospitals worldwide, 1999-2002. Birth, 2004. 31(4): p. 254-64.
Exclusion code: 6
461. Linton, A., M.R. Peterson, and T.V. Williams, Effects of maternal characteristics on cesarean delivery rates among U.S. Department of Defense healthcare beneficiaries, 1996-2002. Birth, 2004. 31(1): p. 3-11.
Exclusion code: 6
462. Lipscomb, K.R., K. Gregory, and K. Shaw, The outcome of macrosomic infants weighing at least 4500 grams: Los Angeles County + University of Southern California experience. Obstet Gynecol, 1995. 85(4): p. 558-64.
Exclusion code: 5
463. Liston, F.A., et al., Neonatal outcomes with caesarean delivery at term. Arch Dis Child Fetal Neonatal Ed, 2008. 93(3): p. F176-82.
Exclusion code: 7
464. Little, M.O., et al., Mode of delivery: toward responsible inclusion of patient preferences. Obstet Gynecol, 2008. 112(4): p. 913-8.
Exclusion code: 6
F-37

Appendix F. Excluded Studies List, continued
465. Localio, A.R., et al., Relationship Between Malpractice Claims and Cesarean Delivery. JAMA : the journal of the American Medical Association, 1993. 269(3): p. 366-373.
Exclusion code: 4
466. Lomas, J., et al., Opinion leaders vs audit and feedback to implement practice guidelines. Delivery after previous cesarean section. Jama, 1991. 265(17): p. 2202-7.
Exclusion code: 6
467. Longo, D.R., et al., Consumer reports in health care. Do they make a difference in patient care? Jama, 1997. 278(19): p. 1579-84.
Exclusion code: 6
468. Lucas, A., Information for women after CS: are they getting enough? RCM Midwives, 2004. 7(11): p. 472-5.
Exclusion code: 6
469. Lurie, S., et al., Routine previous cesarean scar exploration following successful vaginal delivery. Is it necessary? Eur J Obstet Gynecol Reprod Biol, 1992. 45(3): p. 185-6.
Exclusion code: 11
470. Lyerly, A.D., et al., Risks, values, and decision making surrounding pregnancy. Obstet Gynecol, 2007. 109(4): p. 979-84.
Exclusion code: 6
471. Lynch, J.C. and J.P. Pardy, Uterine rupture and scar dehiscence. A five-year survey. Anaesth Intensive Care,
1996. 24(6): p. 699-704. Exclusion code: 6
472. Macario, A., Y.Y. El-Sayed, and M.L. Druzin, Cost-effectiveness of a trial of labor after previous cesarean delivery depends on the a priori chance of success. Clin Obstet Gynecol, 2004. 47(2): p. 378-85.
Exclusion code: 6
473. MacDorman, M.F., et al., Fetal and perinatal mortality, United States, 2005. Natl Vital Stat Rep, 2009. 57(8): p. 1-19.
Exclusion code: 6
474. MacDorman, M.F., F. Menacker, and E. Declercq, Cesarean birth in the United States: epidemiology, trends, and outcomes. Clin Perinatol, 2008. 35(2): p. 293-307.
Exclusion code: 6
475. MacKenzie, I.Z., S. Bradley, and M.P. Embrey, Vaginal prostaglandins and labour induction for patients previously delivered by caesarean section. Br J Obstet Gynaecol, 1984. 91(1): p. 7-10.
Exclusion code: 5
476. Macones, G.A., The utility of clinical tests of eligibility for a trial of labour following a caesarean section: a decision analysis. Br J Obstet Gynaecol, 1999. 106(7): p. 642-6.
Exclusion code: 4
477. Magee, B.D., Uterine rupture among women with a prior cesarean delivery. N Engl J Med, 2002. 346(2): p. 134-7.
Exclusion code: 6
F-38
Appendix F. Excluded Studies List, continued
478. Mahmood, T.A., Maternal height, birthweight, obstetric conjugate and their influence on the management of parturients with a previous cesarean scar. Acta Obstet Gynecol Scand, 1989. 68(7): p. 595-8.
Exclusion code: 10
479. Mahmood, T.A., The influence of maternal height, obstetrical conjugate and fetal birth-weight in the management of patients with breech presentation. Aust N Z J Obstet Gynaecol, 1990. 30(1): p. 10-4.
Exclusion code: 5
480. Mahony, R., et al., Outcome of second delivery after prior macrosomic infant in women with normal glucose tolerance. Obstet Gynecol, 2006. 107(4): p. 857-62.
Exclusion code: 5
481. Makino, S., et al., Prospective comparison of delivery outcomes of vaginal births after cesarean section versus laparoscopic myomectomy. J Obstet Gynaecol Res, 2008. 34(6): p. 952-6.
Exclusion code: 4
482. Makoha, F.W., et al., Multiple cesarean section morbidity. Int J Gynaecol Obstet, 2004. 87(3): p. 227-32.
Exclusion code: 8
483. Mankuta, D.D., et al., Vaginal birth after cesarean section: trial of labor or repeat cesarean section? A decision analysis. Am J Obstet Gynecol, 2003. 189(3): p. 714-9.
Exclusion code: 4
484. Many, A., et al., Neonatal respiratory morbidity after elective cesarean section. J Matern Fetal Neonatal Med, 2006. 19(2): p. 75-8.
Exclusion code: 5
485. Martel, M.-J., et al., Guidelines for vaginal birth after previous Caesarean birth. J Obstet Gynaecol Can, 2004. 26(7): p. 660-83; quiz 684-6.
Exclusion code: 4
486. Martel, M.-J., et al., Guidelines for vaginal birth after previous Caesarean birth. J Obstet Gynaecol Can, 2005. 27(2): p. 164-88.
Exclusion code: 4
487. Martin, J.N., Jr., J.C. Morrison, and W.L. Wiser, Vaginal birth after cesarean section: the demise of routine repeat abdominal delivery. Obstet Gynecol Clin North Am, 1988. 15(4): p. 719-36.
Exclusion code: 4
488. Martin, J.N., Jr., et al., The case for trial of labor in the patient with a prior low-segment vertical cesarean incision. Am J Obstet Gynecol, 1997. 177(1): p. 144-8.
Exclusion code: 7
489. Martin, L.F., K.M. Finigan, and T.E. Nolan, Pregnancy after adjustable gastric banding. Obstet Gynecol, 2000. 95(6 Pt 1): p. 927-30.
Exclusion code: 5
490. Maslow, A.S. and A.L. Sweeny, Elective induction of labor as a risk
F-39
Appendix F. Excluded Studies List, continued
factor for cesarean delivery among low-risk women at term. Obstet Gynecol, 2000. 95(6 Pt 1): p. 917-22.
Exclusion code: 7
491. Mastrobattista, J.M., Vaginal birth after cesarean delivery. Obstet Gynecol Clin North Am, 1999. 26(2): p. 295-304.
Exclusion code: 6
492. Matalon, S., et al., Relationship of treated maternal hypothyroidism and perinatal outcome. J Reprod Med, 2006. 51(1): p. 59-63.
Exclusion code: 7
493. Mathelier, A.C., Radiopelvimetry after cesarean section. J Reprod Med, 1996. 41(6): p. 427-30.
Exclusion code: 4
494. Mauldin, J.G. and R.B. Newman, Prior cesarean: a contraindication to labor induction? Clin Obstet Gynecol, 2006. 49(3): p. 684-97.
Exclusion code: 4
495. Mawson, A.R., Reducing cesarean delivery rates in managed care organizations. Am J Manag Care, 2002. 8(8): p. 730-40.
Exclusion code: 6
496. Maymon, E., et al., Peripartum complications in grand multiparous women: para 6-9 versus para > or =10. Eur J Obstet Gynecol Reprod Biol, 1998. 81(1): p. 21-5.
Exclusion code: 5
497. McCarthy, F.P., A. Ades, and W.C. Ang, Spontaneous combined bladder and uterine rupture in pregnancy.
Aust N Z J Obstet Gynaecol, 2009. 49(2): p. 234-5.
Exclusion code: 9
498. McClain, C.S., Why women choose trial of labor or repeat cesarean section.[erratum appears in J Fam Pract 1986 Nov;23(5):425]. J Fam Pract, 1985. 21(3): p. 210-6.
Exclusion code: 4
499. McClain, C.S., Patient decision making: the case of delivery method after a previous cesarean section. Cult Med Psychiatry, 1987. 11(4): p. 495-508.
Exclusion code: 4
500. McClain, C.S., The making of a medical tradition: vaginal birth after cesarean. Soc Sci Med, 1990. 31(2): p. 203-10.
Exclusion code: 4
501. McCracken, L., Issue 57: Cesarean prevention/VBAC. Midwifery Today Int Midwife, 2001(58): p. 4.
Exclusion code: 4
502. McDonagh, M.S., P. Osterweil, and J.-M. Guise, The benefits and risks of inducing labour in patients with prior caesarean delivery: a systematic review. Bjog, 2005. 112(8): p. 1007-15.
Exclusion code: 6
503. McShane, P.M., P.S. Heyl, and M.F. Epstein, Maternal and perinatal morbidity resulting from placenta previa. Obstet Gynecol, 1985. 65(2): p. 176-82.
Exclusion code: 5
F-40
Appendix F. Excluded Studies List, continued
504. Meddings, F., et al., Vaginal birth after caesarean section (VBAC): exploring women's perceptions. J Clin Nurs, 2007. 16(1): p. 160-7.
Exclusion code: 6
505. Meehan, F.P., Delivery following prior cesarean section: an obstetrician's dilemma? Obstet Gynecol Surv, 1988. 43(10): p. 582-9.
Exclusion code: 6
506. Meehan, F.P., Trial of scar with induction/oxytocin in delivery following prior section. Clin Exp Obstet Gynecol, 1988. 15(4): p. 117-23.
Exclusion code: 10
507. Meehan, F.P., et al., Delivery following cesarean section and perinatal mortality. Am J Perinatol, 1989. 6(1): p. 90-4.
Exclusion code: 10
508. Meehan, F.P., G. Burke, and J.T. Kehoe, Update on delivery following prior cesarean section: a 15-year review 1972-1987. Int J Gynaecol Obstet, 1989. 30(3): p. 205-12.
Exclusion code: 10
509. Meehan, F.P., et al., True rupture/scar dehiscence in delivery following prior section. Int J Gynaecol Obstet, 1990. 31(3): p. 249-55.
Exclusion code: 10
510. Meehan, F.P. and I.M. Magani, True rupture of the caesarean section scar (a 15 year review, 1972-1987). Eur J Obstet Gynecol Reprod Biol, 1989.
30(2): p. 129-35. Exclusion code: 10
511. Megafu, U., Factors influencing maternal survival in ruptured uterus. Int J Gynaecol Obstet, 1985. 23(6): p. 475-80.
Exclusion code: 8
512. Mehta, S.H., et al., Shoulder dystocia and the next delivery: outcomes and management. J Matern Fetal Neonatal Med, 2007. 20(10): p. 729-33.
Exclusion code: 5
513. Meikle, S.F., et al., A national estimate of the elective primary cesarean delivery rate. Obstet Gynecol, 2005. 105(4): p. 751-6.
Exclusion code: 5
514. Menacker, F., E. Declercq, and M.F. Macdorman, Cesarean delivery: background, trends, and epidemiology. Semin Perinatol, 2006. 30(5): p. 235-41.
Exclusion code: 6
515. Menihan, C.A., The effect of uterine rupture on fetal heart rate patterns. J Nurse Midwifery, 1999. 44(1): p. 40-6.
Exclusion code: 9
516. Menticoglou, S.M., Must macrosomic fetuses be delivered by a caesarean section? A review of outcome for 786 babies greater than or equal to 4,500 g. Aust N Z J Obstet Gynaecol, 1992. 32: p. 100-103.
Exclusion code: 4
F-41

Appendix F. Excluded Studies List, continued
517. Merrill, B.S. and C.E. Gibbs, Planned vaginal delivery following cesarean section. Obstet Gynecol, 1978. 52(1): p. 50-2.
Exclusion code: 10
518. Meyer, M.C., Translating data to dialogue: how to discuss mode of delivery with your patient with twins. Am J Obstet Gynecol, 2006. 195(4): p. 899-906.
Exclusion code: 5
519. Miller, D.A., et al., Intrapartum rupture of the unscarred uterus. Obstet Gynecol, 1997. 89(5 Pt 1): p. 671-3.
Exclusion code: 5
520. Miller, D.A., et al., Vaginal birth after cesarean section in twin gestation. Am J Obstet Gynecol, 1996. 175(1): p. 194-8.
Exclusion code: 5
521. Miller, E.S., J. Partezana, and R.L. Montgomery, Vaginal birth after cesarean: a 5-year experience in a family practice residency program. J Am Board Fam Pract, 1995. 8(5): p. 357-60.
Exclusion code: 6
522. Miller, P.J., et al., The relationship between surgeon experience and endometritis after cesarean section. Surg Gynecol Obstet, 1987. 165(6): p. 535-9.
Exclusion code: 4
523. Milsom, I., et al., Influence of maternal, obstetric and fetal risk factors on the prevalence of birth asphyxia at term in a Swedish urban
population. Acta Obstet Gynecol Scand, 2002. 81(10): p. 909-17.
Exclusion code: 7
524. Minkoff, H. and S. McCalla, Uterine rupture among women with a prior cesarean delivery. N Engl J Med, 2002. 346(2): p. 134-7.
Exclusion code: 6
525. Minkoff, H.L., et al., The relationship of amniotic fluid phosphate-to-zinc ratios to post-cesarean section infection. Am J Obstet Gynecol, 1982. 142(8): p. 988-91.
Exclusion code: 4
526. Misra, A., Impact of the HealthChoice program on cesarean section and vaginal birth after C-section deliveries: a retrospective analysis. Matern Child Health J, 2008. 12(2): p. 266-74.
Exclusion code: 6
527. Mo, A. and M.S. Rogers, Sonographic examination of uteroplacental separation during the third stage of labor. Ultrasound Obstet Gynecol, 2008. 31(4): p. 427-31.
Exclusion code: 4
528. Moffat, M.A., et al., Decision making about mode of delivery among pregnant women who have previously had a caesarean section: A qualitative study. Bjog, 2007. 114(1): p. 86-93.
Exclusion code: 6
529. Molloy, B.G., O. Sheil, and N.M. Duignan, Delivery after caesarean
F-42
Appendix F. Excluded Studies List, continued
section: review of 2176 consecutive cases. British Medical Journal Clinical Research Ed, 1987. 294(6588): p. 1645-7.
Exclusion code: 10
530. Montgomery, A.A., et al., Two decision aids for mode of delivery among women with previous caesarean section: randomised controlled trial. Bmj, 2007. 334(7607): p. 1305.
Exclusion code: 6
531. Mootabar, H., et al., Vaginal delivery following previous cesarean section in 1983. Int J Gynaecol Obstet, 1984. 22(2): p. 155-60.
Exclusion code: 10
532. Moran, C., et al., Gastrin levels in mothers and neonates at delivery in various perinatal conditions. Acta Obstet Gynecol Scand, 1996. 75(7): p. 608-11.
Exclusion code: 8
533. Morency, A.-M., N. Brassard, and R.J. Gauthier, Can uterine rupture in patients attempting vaginal birth after cesarean delivery be predicted?[comment]. Am J Obstet Gynecol, 2007. 196(6): p. e6; author reply e6.
Exclusion code: 4
534. Moriel, E.Z., et al., Experience with the immediate treatment of iatrogenic bladder injuries and the repair of complex vesico-vaginal fistulae by the transvesical approach. Arch Gynecol Obstet, 1993. 253(3): p. 127-30.
Exclusion code: 4
535. Morin, K.H. and L. Reilly, Caring for obese pregnant women. J Obstet Gynecol Neonatal Nurs, 2007. 36(5): p. 482-9.
Exclusion code: 6
536. Morrison, J., Neonatal respiratory morbidity and mode of delivery at term: influence of timing of elective cesarean section. Br J Obstet Gynaecol, 1995. 102: p. 101-6.
Exclusion code: 4
537. Mor-Yosef, S., A. Samueloff, and J.G. Schenker, The Israel perinatal census. Asia Oceania J Obstet Gynaecol, 1992. 18(2): p. 139-45.
Exclusion code: 4
538. Mor-Yosef, S., et al., Vaginal delivery following one previous cesarean birth: nation wide survey. Asia Oceania J Obstet Gynaecol, 1990. 16(1): p. 33-7.
Exclusion code: 5
539. Mozurkewich, E.L. and E.K. Hutton, Elective repeat cesarean delivery versus trial of labor: a meta-analysis of the literature from 1989 to 1999. Am J Obstet Gynecol, 2000. 183(5): p. 1187-97.
Exclusion code: 10
540. Muench, M.V., et al., Gravid hysterectomy: a decade of experience at an academic referral center. J Reprod Med, 2008. 53(4): p. 271-8.
Exclusion code: 7
541. Mulik, V., The outcome of macrosomic fetuses in a low risk
F-43
Appendix F. Excluded Studies List, continued
primigravid population. Int J Gynaecol Obstet, 2003. 80: p. 15-22.
Exclusion code: 5
542. Murphy, D.J., Uterine rupture. Curr Opin Obstet Gynecol, 2006. 18(2): p. 135-40.
Exclusion code: 6
543. Murphy, D.J., et al., The relationship between Caesarean section and subfertility in a population-based sample of 14 541 pregnancies. Hum Reprod, 2002. 17(7): p. 1914-7.
Exclusion code: 4
544. Murphy, H., Uterine rupture without previous caesarean section. Review of twelve cases. Ir Med J, 1976. 69(20): p. 531-2.
Exclusion code: 10
545. Murphy, M.C. and S.M. Harvey, Choice of a childbirth method after cesarean. Women Health, 1989. 15(2): p. 67-85.
Exclusion code: 6
546. Murray, T.M., Case 9-1998: uterine rupture.[comment]. N Engl J Med, 1998. 339(4): p. 268; author reply 269.
Exclusion code: 6
547. Murta, E.F.C. and R.S. Nomelini, Is repeated caesarean section a consequence of elective caesarean section? Lancet, 2004. 364(9435): p. 649-50.
Exclusion code: 4
548. Murtha, A.P., et al., Umbilical venous D-dimer concentrations with and without labor. Obstet Gynecol,
1998. 92(2): p. 184-6. Exclusion code: 5
549. Murthy, K., et al., Association Between Rising Professional Liability Insurance Premiums and Primary Cesarean Delivery Rates. Obstetrics and Gynecology, 2007. 110(6): p. 1264-1269.
Exclusion code: 4
550. Myers, S.A. and T.L. Bennett, Incidence of significant adhesions at repeat cesarean section and the relationship to method of prior peritoneal closure. J Reprod Med, 2005. 50(9): p. 659-62.
Exclusion code: 6
551. Myers, S.A. and N. Gleicher, A successful program to lower cesarean-section rates. N Engl J Med, 1988. 319(23): p. 1511-6.
Exclusion code: 4
552. Myles, T., Vaginal birth of twins after a previous Cesarean section. J Matern Fetal Med, 2001. 10(3): p. 171-4.
Exclusion code: 5
553. Nasrat, H. and A. Warda, X-ray pelvimetry-reappraisal. Clin Exp Obstet Gynecol, 1991. 18(1): p. 27-33.
Exclusion code: 8
554. Nather, A., et al., Nonclosure of peritoneum at cesarean delivery and future fertility. Fertil Steril, 2002. 78(2): p. 424-5.
Exclusion code: 6
555. Naulty, J.S., et al., Epidural fentanyl
F-44
Appendix F. Excluded Studies List, continued
for postcesarean delivery pain management. Anesthesiology, 1985. 63(6): p. 694-698.
Exclusion code: 4
556. Ngu, A. and M.A. Quinn, Vaginal delivery following caesarean section. Aust N Z J Obstet Gynaecol, 1985. 25(1): p. 41-3.
Exclusion code: 10
557. Ni, H.Y., et al., Previous abdominal surgery and tubal pregnancy. Obstet Gynecol, 1990. 75(6): p. 919-22.
Exclusion code: 4
558. Nicoll, A.E., et al., An audit of neonatal respiratory morbidity following elective caesarean section at term. Scott Med J, 2004. 49(1): p. 22-5.
Exclusion code: 5
559. Nielsen, T.F., H. Hagberg, and U. Ljungblad, Placenta previa and antepartum hemorrhage after previous cesarean section. Gynecol Obstet Invest, 1989. 27(2): p. 88-90.
Exclusion code: 4
560. Nielsen, T.F. and K.H. Hokegard, The course of subsequent pregnancies after previous cesarean section. Acta Obstet Gynecol Scand, 1984. 63(1): p. 13-6.
Exclusion code: 10
561. Nielsen, T.F., U. Ljungblad, and H. Hagberg, Rupture and dehiscence of cesarean section scar during pregnancy and delivery. Am J Obstet Gynecol, 1989. 160(3): p. 569-73.
Exclusion code: 10
562. Nordin, A.J. and J.A. Richardson, Lower segment uterine scar rupture during induction of labour with vaginal prostaglandin E2. Postgrad Med J, 1993. 69(813): p. 592.
Exclusion code: 9
563. Norman, P., S. Kostovcik, and A. Lanning, Elective repeat cesarean sections: how many could be vaginal births? Cmaj, 1993. 149(4): p. 431-5.
Exclusion code: 6
564. Norris, M.C., Are combined spinal epidural catheters reliable? Int, 2000. 9(1): p. 3-6.
Exclusion code: 4
565. November, M.T., Cost analysis of vaginal birth after cesarean. Clin Obstet Gynecol, 2001. 44(3): p. 571-87.
Exclusion code: 4
566. Nuthalapaty, F.S., D.J. Rouse, and J. Owen, The association of maternal weight with cesarean risk, labor duration, and cervical dilation rate during labor induction.[erratum appears in Obstet Gynecol. 2004 May;103(5 Pt 1):1019]. Obstet Gynecol, 2004. 103(3): p. 452-6.
Exclusion code: 6
567. Nwokoro, C.A., et al., Vaginal birth after primary cesarean section: the fetal size factor. J Obstet Gynaecol, 2003. 23(4): p. 392-3.
Exclusion code: 8
568. O'Brien-Abel, N., Uterine rupture during VBAC trial of labor: risk factors and fetal response. J
F-45
Appendix F. Excluded Studies List, continued
Midwifery Womens Health, 2003. 48(4): p. 249-57.
Exclusion code: 4
569. Odibo, A.O. and G.A. Macones, Current concepts regarding vaginal birth after cesarean delivery. Curr Opin Obstet Gynecol, 2003. 15(6): p. 479-82.
Exclusion code: 6
570. O'Driscoll, K., Rupture of the uterus. Proceedings of the Royal Society of Medicine, 1966. 59: p. 65.
Exclusion code: 10
571. Ofir, K., et al., Uterine rupture: risk factors and pregnancy outcome. Am J Obstet Gynecol, 2003. 189(4): p. 1042-6.
Exclusion code: 5
572. Ohkuchi, A., et al., Effect of maternal age on blood loss during parturition: a retrospective multivariate analysis of 10,053 cases. J Perinat Med, 2003. 31(3): p. 209-15.
Exclusion code: 5
573. Ojo, V.A. and J.Y. Aliyu, Determinant factors in uterine rupture following previous caesarean section. East Afr Med J, 1988. 65(5): p. 307-13.
Exclusion code: 8
574. Okereafor, A., et al., Patterns of brain injury in neonates exposed to perinatal sentinel events. Pediatrics, 2008. 121(5): p. 906-14.
Exclusion code: 7
575. Ola, E.R., O.D. Imosemi, and O.O.
Abudu, Vaginal birth after one previous Caesarean section--evaluation of predictive factors. Afr J Med Med Sci, 2001. 30(1-2): p. 61-6.
Exclusion code: 8
576. Oladipo, A. and A. Syed, The views of obstetricians in the south-west of England on the use of prostaglandins and syntocinon in VBAC. J Obstet Gynaecol, 2008. 28(2): p. 177-82.
Exclusion code: 4
577. Oleske, D.M., et al., Cesarean and VBAC delivery rates in Medicaid managed care, Medicaid fee-for-service, and private managed care. Birth, 1998. 25(2): p. 125-7.
Exclusion code: 6
578. Olive, E.C., et al., Placenta praevia: maternal morbidity and place of birth. Aust N Z J Obstet Gynaecol, 2005. 45(6): p. 499-504.
Exclusion code: 7
579. Ollendorff, D.A., et al., Vaginal birth after cesarean section for arrest of labor: is success determined by maximum cervical dilatation during the prior labor? Am J Obstet Gynecol, 1988. 159(3): p. 636-9.
Exclusion code: 4
580. Onwude, J.L., S. Rao, and D.O. Selo-Ojeme, Large babies and unplanned Caesarean delivery. Eur J Obstet Gynecol Reprod Biol, 2005. 118(1): p. 36-9.
Exclusion code: 5
581. Ophir, E., et al., Breech presentation after cesarean section: always a
F-46
Appendix F. Excluded Studies List, continued
section? Am J Obstet Gynecol, 1989. 161(1): p. 25-8.
Exclusion code: 5
582. Ophir, E., et al., Delivery mode and maternal rehospitalization. Arch Gynecol Obstet, 2008. 277(5): p. 401-4.
Exclusion code: 5
583. Ophir, E., et al., Trial of labor following cesarean section: dilemma. Obstet Gynecol Surv, 1989. 44(1): p. 19-24.
Exclusion code: 6
584. O'Sullivan, M.J., et al., Vaginal delivery after cesarean section. Clin Perinatol, 1981. 8(1): p. 131-43.
Exclusion code: 6
585. Oyelese, Y. and J.C. Smulian, Placenta previa, placenta accreta, and vasa previa. Obstet Gynecol, 2006. 107(4): p. 927-41.
Exclusion code: 6
586. Ozdemir, I., N. Yucel, and O. Yucel, Rupture of the pregnant uterus: a 9-year review. Arch Gynecol Obstet, 2005. 272(3): p. 229-31.
Exclusion code: 7
587. Pan, P., Multifactorial preoperative predictors for postcesarean section pain and analgesic requirement. Anesthesiology, 2006. 104: p. 417-25.
Exclusion code: 4
588. Parazzini, F., et al., Risk factors for placenta praevia. Placenta, 1994. 15(3): p. 321-6.
Exclusion code: 5
589. Parilla, B.V., et al., Iatrogenic respiratory distress syndrome following elective repeat cesarean delivery. Obstet Gynecol, 1993. 81(3): p. 392-5.
Exclusion code: 5
590. Penn, Z. and S. Ghaem-Maghami, Indications for caesarean section. Best Pract Res Clin Obstet Gynaecol, 2001. 15(1): p. 1-15.
Exclusion code: 6
591. Penso, C., Vaginal birth after cesarean section: an update on physician trends and patient perceptions. Curr Opin Obstet Gynecol, 1994. 6(5): p. 417-25.
Exclusion code: 6
592. Perez-Rios, N., G. Ramos-Valencia, and A.P. Ortiz, Cesarean Delivery as a Barrier for Breastfeeding Initiation: The Puerto Rican Experience. Journal of Human Lactation, 2008. 24(3): p. 293-302.
Exclusion code: 8
593. Persadie, R.J. and R.J. McDonagh, Vaginal birth after caesarean section: clinical and legal perspectives. J Obstet Gynaecol Can, 2003. 25(10): p. 846-52.
Exclusion code: 6
594. Perveen, F. and Q. Shah, Obstetric outcome after one previous caesarean section. J Obstet Gynaecol Res, 1997. 23(4): p. 341-6.
Exclusion code: 8
595. Peschers, U., et al., Changes in vesical neck mobility following
F-47

Appendix F. Excluded Studies List, continued
vaginal delivery. Obstet Gynecol, 1996. 88(6): p. 1001-6.
Exclusion code: 4
596. Petitti, D.B., Maternal mortality and morbidity in cesarean section. Clin Obstet Gynecol, 1985. 28(4): p. 763-9.
Exclusion code: 4
597. Petitti, D.B., et al., In-hospital maternal mortality in the United States: time trends and relation to method of delivery. Obstet Gynecol, 1982. 59(1): p. 6-12.
Exclusion code: 10
598. Petrikovsky, B.M., Endoscopic assessment of the integrity of the postcesarean uterine wall before a trial of labor. Transcervical Endoscopy Registry. J Reprod Med, 1994. 39(6): p. 464-6.
Exclusion code: 4
599. Peyrat, L., et al., Prevalence and risk factors of urinary incontinence in young and middle-aged women. BJU Int, 2002. 89(1): p. 61-6.
Exclusion code: 5
600. Phelan, J.P., Uterine rupture. Clin Obstet Gynecol, 1990. 33(3): p. 432-7.
Exclusion code: 10
601. Phelan, J.P., L.M. Korst, and D.K. Settles, Uterine activity patterns in uterine rupture: a case-control study. Obstet Gynecol, 1998. 92(3): p. 394-7.
Exclusion code: 7
or non-clusure at cesarean. Obstetrics and Gynecology, 1991. 77(2): p. 293-6.
Exclusion code: 4
603. Pinette, M.G., et al., Vaginal birth after Cesarean rates are declining rapidly in the rural state of Maine. J Matern Fetal Neonatal Med, 2004. 16(1): p. 37-43.
Exclusion code: 6
604. Piver, M.S. and R.A. Johnston, Sr., The safety of multiple cesarean sections. Obstet Gynecol, 1969. 34(5): p. 690-3.
Exclusion code: 10
605. Placek, P.J., S. Taffel, and M. Moien, Cesarean section delivery rates: United States, 1981. Am J Public Health, 1981. 73(8): p. 861-862.
Exclusion code: 6
606. Placek, P.J. and S.M. Taffel, The Frequency of Complications in Cesarean and Noncesarean Deliveries, 1970 and 1978. Public Health Rep, 1983. 98(4): p. 396-400.
Exclusion code: 4
607. Placek, P.J. and S.M. Taffel, Recent patterns in cesarean delivery in the United States. Obstet Gynecol Clin North Am, 1988. 15(4): p. 607-27.
Exclusion code: 6
608. Placek, P.J. and S.M. Taffel, Vaginal birth after cesarean (VBAC) in the 1980s. Am J Public Health, 1988. 78(5): p. 512-5.
Exclusion code: 6 602. Pietrantoni, M., Peritoneal closure
F-48
Appendix F. Excluded Studies List, continued
609. Plauche, W.C., W. Von Almen, and R. Muller, Catastrophic uterine rupture. Obstet Gynecol, 1984. 64(6): p. 792-7.
Exclusion code: 10
610. Plaut, M.M., M.L. Schwartz, and S.L. Lubarsky, Uterine rupture associated with the use of misoprostol in the gravid patient with a previous cesarean section. Am J Obstet Gynecol, 1999. 180(6 Pt 1): p. 1535-42.
Exclusion code: 9
611. Pollio, F., et al., Uterine dehiscence in term pregnant patients with one previous cesarean delivery: growth factor immunoexpression and collagen content in the scarred lower uterine segment. Am J Obstet Gynecol, 2006. 194(2): p. 527-34.
Exclusion code: 4
612. Poma, P.A., Effect of departmental policies on cesarean delivery rates: a community hospital experience. Obstet Gynecol, 1998. 91(6): p. 1013-8.
Exclusion code: 6
613. Poma, P.A., Correlation of birth weights with cesarean rates. Int J Gynaecol Obstet, 1999. 65(2): p. 117-23.
Exclusion code: 5
614. Poma, P.A., Effects of obstetrician characteristics on cesarean delivery rates. A community hospital experience. Am J Obstet Gynecol, 1999. 180(6 Pt 1): p. 1364-72.
Exclusion code: 6
615. Poma, P.A., Rupture of a cesarean-scarred uterus: a community hospital experience. J Natl Med Assoc, 2000. 92(6): p. 295-300.
Exclusion code: 7
616. Ponkey, S.E., et al., Persistent fetal occiput posterior position: obstetric outcomes. Obstet Gynecol, 2003. 101(5 Pt 1): p. 915-20.
Exclusion code: 5
617. Porreco, R.P. and J.A. Thorp, The cesarean birth epidemic: trends, causes, and solutions. Am J Obstet Gynecol, 1996. 175(2): p. 369-74.
Exclusion code: 6
618. Porter, T.F., Survival and neurologic outcome of apparently stillborn infants. Am J Obstet Gynecol, 1997. 176(1 (2)): p. S15.
Exclusion code: 6
619. Practice, A.C.o.O., Committee opinion. Induction of labor for vaginal birth after cesarean delivery. Obstet Gynecol, 2002. 99(4): p. 679-80.
Exclusion code: 6
620. Pridjian, G., Labor after prior cesarean section. Clin Obstet Gynecol, 1992. 35(3): p. 445-56.
Exclusion code: 4
621. Pridjian, G., J.U. Hibbard, and A.H. Moawad, Cesarean: changing the trends. Obstet Gynecol, 1991. 77(2): p. 195-200.
Exclusion code: 4
622. Qublan, H.S. and Y. Tahat, Multiple cesarean section. The impact on
F-49

Appendix F. Excluded Studies List, continued
maternal and fetal outcome. Saudi Med J, 2006. 27(2): p. 210-4.
Exclusion code: 8
623. Qureshi, B., et al., Ultrasonographic evaluation of lower uterine segment to predict the integrity and quality of cesarean scar during pregnancy: a prospective study. Tohoku J Exp Med, 1997. 183(1): p. 55-65.
Exclusion code: 5
624. Qureshi, S., Uterine rupture after induction of labour in women with previous caesarean section.[comment]. Bjog, 2005. 112(12): p. 1668-9; author reply 1669.
Exclusion code: 4
625. Rahman, J., et al., Emergency obstetric hysterectomy in a university hospital: A 25-year review. J Obstet Gynaecol, 2008. 28(1): p. 69-72.
Exclusion code: 8
626. Rasmussen, S., S. Albrechtsen, and K. Dalaker, Obstetric history and the risk of placenta previa. Acta Obstet Gynecol Scand, 2000. 79(6): p. 502-7.
Exclusion code: 4
627. Rattan, P.K., et al., Cesarean delivery of the second twin after vaginal delivery of the first twin. Am J Obstet Gynecol, 1986. 154(4): p. 936-9.
Exclusion code: 5
628. Rayburn, W., et al., Attempted vaginal birth after cesarean section: a multicenter comparison of outpatient prostaglandin E2 gel with
expectant management [abstract]. Primary Care Update for Ob/Gyns, 1998. 5(4): p. 182-183.
Exclusion code: 6
629. Read, A.W., et al., Trends in caesarean section in Western Australia, 1980-1987. Med J Aust, 1990. 153(6): p. 318-23.
Exclusion code: 5
630. Read, J.A., The scheduling of repeat cesarean section operations: prospective management protocol experience. Am J Obstet Gynecol, 1985. 151(5): p. 557-63.
Exclusion code: 4
631. Rees, K.M., et al., Healthcare professionals' views on two computer-based decision aids for women choosing mode of delivery after previous caesarean section: a qualitative study. Bjog, 2009. 116(7): p. 906-14.
Exclusion code: 6
632. Reime, B., et al., Do maternity care provider groups have different attitudes towards birth? Bjog, 2004. 111(12): p. 1388-93.
Exclusion code: 6
633. Renner, R.M., et al., Informational factors influencing patient's childbirth preferences after prior cesarean. Am J Obstet Gynecol, 2007. 196(5): p. e14-6.
Exclusion code: 6
634. Rhodes, J.C., K.C. Schoendorf, and J.D. Parker, Contribution of excess weight gain during pregnancy and macrosomia to the cesarean delivery
F-50

Appendix F. Excluded Studies List, continued
rate, 1990-2000. Pediatrics, 2003. 111(5 Part 2): p. 1181-5.
Exclusion code: 6
635. Ridgeway, J.J., D.L. Weyrich, and T.J. Benedetti, Fetal heart rate changes associated with uterine rupture. Obstet Gynecol, 2004. 103(3): p. 506-12.
Exclusion code: 7
636. Ridley, R.T., et al., What influences a woman to choose vaginal birth after cesarean? J Obstet Gynecol Neonatal Nurs, 2002. 31(6): p. 665-72.
Exclusion code: 6
637. Rinehart, H., A VBAC primer. Technical issues for midwives. Midwifery Today Int Midwife, 2001(57): p. 16-20.
Exclusion code: 4
638. Roberts, H., et al., Ectopic pregnancy in lower segment uterine scar. Aust N Z J Obstet Gynaecol, 1998. 38(1): p. 114-6.
Exclusion code: 5
639. Roberts, R.G., et al., Trial of labor or repeated cesarean section. The woman's choice. Arch Fam Med, 1997. 6(2): p. 120-5.
Exclusion code: 6
640. Roberts, R.G., et al., Changing policies on vaginal birth after cesarean: impact on access. Birth, 2007. 34(4): p. 316-22.
Exclusion code: 6
641. Rock, S.M., Variability and consistency of rates of primary and
repeat cesarean sections among hospitals in two states. Public Health Rep, 1993. 108(4): p. 514-6.
Exclusion code: 4
642. Rogers, J.F. and W.L. Graves, Risk factors associated with low Apgar scores in a low-income population. Paediatr Perinat Epidemiol, 1993. 7(2): p. 205-16.
Exclusion code: 7
643. Roopnarinesingh, A.J., Abdominal delivery of the second twin. J Obstet Gynaecol, 2002. 22(4): p. 379-80.
Exclusion code: 5
644. Rosen, M.G. and J.C. Dickinson, Vaginal birth after cesarean: a meta-analysis of indicators for success. Obstet Gynecol, 1990. 76(5 Pt 1): p. 865-9.
Exclusion code: 6
645. Rosen, M.G., J.C. Dickinson, and C.L. Westhoff, Vaginal birth after cesarean: a meta-analysis of morbidity and mortality. Obstet Gynecol, 1991. 77(3): p. 465-70.
Exclusion code: 6
646. Rossi, A.C. and V. D'Addario, Maternal morbidity following a trial of labor after cesarean section vs elective repeat cesarean delivery: a systematic review with metaanalysis. Am J Obstet Gynecol, 2008. 199(3): p. 224-31.
Exclusion code: 4
647. Rothman, K.J., S. Greenland, and T. Lash, Modern Epidemiology. 3 ed. 2008, Philadelphia: Wolters Kluwer Health/Lippincott Williams &
F-51
Appendix F. Excluded Studies List, continued
Wilkins. Exclusion code: 4
648. Roumen, F.J., A.A. Janssen, and F.P. Vrouenraets, The course of delivery after previous cesarean section. Eur J Obstet Gynecol Reprod Biol, 1990. 34(1-2): p. 15-20.
Exclusion code: 10
649. Rouse, D.J., J. Owen, and J.C. Hauth, Active-phase labor arrest: oxytocin augmentation for at least 4 hours. Obstet Gynecol, 1999. 93(3): p. 323-8.
Exclusion code: 5
650. Rousseau, J.A., et al., A randomized study comparing skin closure in cesarean sections: staples vs subcuticular sutures. American Journal of Obstetrics and Gynecology, 2009. 200(3): p. 265.e1-4.
Exclusion code: 4
651. Ruiz-Velasco, V., J. Rosas-Arceo, and T. Quezada-Rocha, Hazards of multiple Cesarean sections. Int Surg, 1969. 51(4): p. 292-8.
Exclusion code: 10
652. Sachs, B.P., Vaginal birth after cesarean: a health policy perspective. Clin Obstet Gynecol, 2001. 44(3): p. 553-60.
Exclusion code: 6
653. Sachs, B.P., et al., The risks of lowering the cesarean-delivery rate. N Engl J Med, 1999. 340(1): p. 54-7.
Exclusion code: 6
654. Sadan, O., et al., Once a cesarean
always a cesarean? A computer-assisted decision analysis. Arch Gynecol Obstet, 2007. 276(5): p. 517-21.
Exclusion code: 4
655. Saglamtas, M., et al., Rupture of the uterus. Int J Gynaecol Obstet, 1995. 49(1): p. 9-15.
Exclusion code: 11
656. Sahala, D., A call to action: vaginal birth after cesarean (VBAC) in crisis in Florida. Midwifery Today Int Midwife, 2005(76): p. 41-2.
Exclusion code: 6
657. Saldana, L.R., H. Schulman, and L. Reuss, Management of pregnancy after cesarean section. Am J Obstet Gynecol, 1979. 135(5): p. 555-61.
Exclusion code: 10
658. Salihu, H.M., et al., Risk of stillbirth following a cesarean delivery: black-white disparity. Obstet Gynecol, 2006. 107(2 Pt 1): p. 383-90.
Exclusion code: 10
659. Salim, R., et al., Abdominal scar characteristics as a predictor of intra-abdominal adhesions at repeat cesarean delivery. Fertil Steril, 2008. 90(6): p. 2324-7.
Exclusion code: 4
660. Sanchez-Ramos, L., F.L. Gaudier, and A.M. Kaunitz, Cervical ripening and labor induction after previous cesarean delivery. Clin Obstet Gynecol, 2000. 43(3): p. 513-23.
Exclusion code: 6
661. Sanchez-Ramos, L. and A.M.
F-52
Appendix F. Excluded Studies List, continued
Kaunitz, Uterine rupture associated with the use of prostaglandin E1 in patients with previous cesarean delivery.[comment]. Am J Obstet Gynecol, 2000. 182(4): p. 990-1.
Exclusion code: 6
662. Sanchez-Ramos, L., et al., Route of breech delivery and maternal and neonatal outcomes. Int J Gynaecol Obstet, 2001. 73(1): p. 7-14.
Exclusion code: 5
663. Sansregret, A., E. Bujold, and R.J. Gauthier, Twin delivery after a previous caesarean: a twelve-year experience. J Obstet Gynaecol Can, 2003. 25(4): p. 294-8.
Exclusion code: 5
664. Sarno, A.P., Jr., et al., Vaginal birth after cesarean delivery. Trial of labor in women with breech presentation. J Reprod Med, 1989. 34(10): p. 831-3.
Exclusion code: 5
665. Saunders, L.D. and G. Flowerdew, Cesarean sections in Alberta from April 1979 to March 1988. Cmaj, 1991. 144(10): p. 1243-9.
Exclusion code: 10
666. Schimmel, L.M., et al., The Yolo County Midwifery Service. A descriptive study of 496 singleton birth outcomes, 1990. J Nurse Midwifery, 1992. 37(6): p. 398-403.
Exclusion code: 7
667. Schneider, J., D. Gallego, and R. Benito, Trial of labour in patients with a prior caesarean section and an intervening vaginal delivery. Aust
N Z J Obstet Gynaecol, 1987. 27(3): p. 178-9.
Exclusion code: 5
668. Schnitker, K.A., Uterine rupture during trial of labor: risk management recommendations. J Healthc Risk Manag, 1999. 19(4): p. 12-6.
Exclusion code: 6
669. Schreiner, R.L., et al., Respiratory distress associated with elective repeat cesarean section. A two-year experience in one medical community. Acta Obstet Gynecol Scand, 1981. 60(3): p. 261-4.
Exclusion code: 10
670. Schreiner, R.L., et al., Respiratory distress following elective repeat cesarean section. Am J Obstet Gynecol, 1982. 143(6): p. 689-92.
Exclusion code: 10
671. Sciscione, A.C., et al., A randomized comparison of transcervical Foley catheter to intravaginal misoprostol for preinduction cervical ripening. Obstet Gynecol, 2001. 97(4): p. 603-7.
Exclusion code: 9
672. Scott, J.R., Mandatory trial of labor after cesarean delivery: an alternative viewpoint. Obstet Gynecol, 1991. 77(6): p. 811-4.
Exclusion code: 4
673. Scott, J.R., Avoiding labor problems during vaginal birth after cesarean delivery. Clin Obstet Gynecol, 1997. 40(3): p. 533-41.
Exclusion code: 6
F-53
Appendix F. Excluded Studies List, continued
674. Scott, J.R., Vaginal birth after cesarean section. Book: Queenan JT, Hobbins JC, Spong CY (eds): Protocols in High Risk Pregnancy. 4th Ed., 2005: p. 559-64.
Exclusion code: 4
675. Segal, S., et al., Evaluation of breast stimulation for induction of labor in women with a prior cesarean section and in grandmultiparas. Acta Obstet Gynecol Scand, 1995. 74(1): p. 40-1.
Exclusion code: 8
676. Sela, H.Y., et al., Safety and efficacy of external cephalic version for women with a previous cesarean delivery. Eur J Obstet Gynecol Reprod Biol, 2009. 142(2): p. 111-4.
Exclusion code: 4
677. Sen, S., S. Malik, and S. Salhan, Ultrasonographic evaluation of lower uterine segment thickness in patients of previous cesarean section. Int J Gynaecol Obstet, 2004. 87(3): p. 215-9.
Exclusion code: 8
678. Seow, K.M., et al., Cesarean scar pregnancy: issues in management. Ultrasound Obstet Gynecol, 2004. 23(3): p. 247-53.
Exclusion code: 5
679. Seow, K.-M., et al., Subsequent pregnancy outcome after conservative treatment of a previous cesarean scar pregnancy. Acta Obstet Gynecol Scand, 2004. 83(12): p. 1167-72.
Exclusion code: 8
680. Shalev, E., et al., External cephalic version at term--using tocolysis. Acta Obstet Gynecol Scand, 1993. 72(6): p. 455-7.
Exclusion code: 9
681. Sheffield, J.S., et al., Valacyclovir prophylaxis to prevent recurrent herpes at delivery: a randomized clinical trial.[see comment][erratum appears in Obstet Gynecol. 2006 Sep;108(3 Pt 1):695]. Obstet Gynecol, 2006. 108(1): p. 141-7.
Exclusion code: 4
682. Sheiner, E., et al., Identifying risk factors for peripartum cesarean hysterectomy. A population-based study. J Reprod Med, 2003. 48(8): p. 622-6.
Exclusion code: 5
683. Sheiner, E., et al., Failed vacuum extraction. Maternal risk factors and pregnancy outcome. J Reprod Med, 2001. 46(9): p. 819-24.
Exclusion code: 5
684. Sherrard, A., et al., Maternal anthropometric risk factors for caesarean delivery before or after onset of labour. Bjog, 2007. 114(9): p. 1088-96.
Exclusion code: 10
685. Shihady, I.R., et al., Vaginal birth after cesarean: do California hospital policies follow national guidelines? J Reprod Med, 2007. 52(5): p. 349-58.
Exclusion code: 6
686. Shin, Y.K., Shoulder pain in a trial of labor after cesarean delivery.
F-54
Appendix F. Excluded Studies List, continued
South Med J, 1989. 82(10): p. 1320. Exclusion code: 6
687. Shipp, T.A., Maternal age as a predictor of symptomatic uterine rupture during a trial of labor after previous desarean delivery. Am J Obstet Gynecol, 2001. 184: p. S186.
Exclusion code: 4
688. Shorten, A., et al., Making choices for childbirth: development and testing of a decision-aid for women who have experienced previous caesarean. Patient Educ Couns, 2004. 52(3): p. 307-13.
Exclusion code: 6
689. Shorten, A., D.E. Lewis, and B. Shorten, Trial of labour versus elective repeat caesarean section: a cost-effectiveness analysis. Aust Health Rev, 1998. 21(1): p. 8-28.
Exclusion code: 6
690. Shorten, A., et al., Making choices for childbirth: a randomized controlled trial of a decision-aid for informed birth after cesarean. Birth, 2005. 32(4): p. 252-61.
Exclusion code: 6
691. Shukunami, K.-I., K. Nishijima, and F. Kotsuji, Re: Use of the Atad catheter for the induction of labour in women who have had a previous Caesarean section: a case series.[comment]. Aust N Z J Obstet Gynaecol, 2006. 46(1): p. 70; author reply 70.
Exclusion code: 6
692. Shy, K.K., J.P. LoGerfo, and L.E. Karp, Evaluation of elective repeat
cesarean section as a standard of care: an application of decision analysis. Am J Obstet Gynecol, 1981. 139(2): p. 123-9.
Exclusion code: 4
693. Silberstein, T., et al., Routine revision of uterine scar after cesarean section: has it ever been necessary? Eur J Obstet Gynecol Reprod Biol, 1998. 78(1): p. 29-32.
Exclusion code: 4
694. Silver, R.K. and J. Minogue, When does a statistical fact become an ethical imperative? Am J Obstet Gynecol, 1987. 157(2): p. 229-33.
Exclusion code: 4
695. Simon, R. and D. Altman, Statistical aspects of prognostic factor studies in oncology. Br J Cancer, 1994. 69: p. 979-85.
Exclusion code: 4
696. Singh, P.M., C. Rodrigues, and A.N. Gupta, Placenta previa and previous cesarean section. Acta Obstet Gynecol Scand, 1981. 60(4): p. 367-8.
Exclusion code: 10
697. Singhal, S.R., et al., Intrapartum posterior uterine wall rupture in lower segment cesarean section scarred uterus. Acta Obstet Gynecol Scand, 2005. 84(2): p. 196-7.
Exclusion code: 9
698. Skelly, H.R., A.M. Duthie, and R.H. Philpott, Rupture of the uterus: the preventable factors. Samj, S, 1976. Suid-Afrikaanse Tydskrif Vir Geneeskunde. 50(13): p. 505-9.
F-55
Appendix F. Excluded Studies List, continued
Exclusion code: 10
699. Smith, G.C.S., Predicting antepartum stillbirth. Curr Opin Obstet Gynecol, 2006. 18(6): p. 625-30.
Exclusion code: 5
700. Smith, G.C.S., J.P. Pell, and R. Dobbie, Caesarean section and risk of unexplained stillbirth in subsequent pregnancy. Lancet, 2003. 362(9398): p. 1779-84.
Exclusion code: 4
701. Smith, J.G. and D.C. Merrill, Oxytocin for induction of labor. Clin Obstet Gynecol, 2006. 49(3): p. 594-608.
Exclusion code: 6
702. Smith, J.G., H.L. Mertz, and D.C. Merrill, Identifying risk factors for uterine rupture. Clin Perinatol, 2008. 35(1): p. 85-99.
Exclusion code: 4
703. Sobande, A. and M. Eskandar, Multiple repeat caesarean sections: complications and outcomes. J Obstet Gynaecol Can, 2006. 28(3): p. 193-7.
Exclusion code: 8
704. Songane, F.F., et al., Balancing the risks of planned cesarean section and trial of vaginal delivery for the mature, selected, singleton breech presentation. J Perinat Med, 1987. 15(6): p. 531-43.
Exclusion code: 4
705. Spaulding, L.B. and D.G. Gallup, Current concepts of management of
rupture of the gravid uterus. Obstet Gynecol, 1979. 54(4): p. 437-41.
Exclusion code: 7
706. Spellacy, W.N., et al., Neonatal seizures after cesarean delivery: higher risk with labor. Am J Obstet Gynecol, 1987. 157(2): p. 377-9.
Exclusion code: 5
707. Spetz, J., M.W. Smith, and S.F. Ennis, Physician incentives and the timing of cesarean sections: evidence from California. Med Care, 2001. 39(6): p. 536-50.
Exclusion code: 6
708. Spurrett, B. and C.M. Cook, Why we choose caesarean section: a prospective study. Aust N Z J Obstet Gynaecol, 1997. 37(3): p. 297-300.
Exclusion code: 6
709. Stafford, R.S., The impact of nonclinical factors on repeat cesarean section. Jama, 1991. 265(1): p. 59-63.
Exclusion code: 6
710. Stalnaker, B.L., et al., Characteristics of successful claims for payment by the Florida Neurologic Injury Compensation Association Fund. Am J Obstet Gynecol, 1997. 177(2): p. 268-71; discussion 271-3.
Exclusion code: 6
711. Stevenson, D.K., et al., Increased immunoreactive erythropoietin in cord plasma and neonatal bilirubin production in normal term infants after labor. Obstet Gynecol, 1986. 67(1): p. 69-73.
F-56
Appendix F. Excluded Studies List, continued
Exclusion code: 7
712. Stone, J.L., et al., Use of cervical prostaglandin E2 gel in patients with previous cesarean section. Am J Perinatol, 1994. 11(4): p. 309-12.
Exclusion code: 5
713. Strong, T.H., Jr., et al., Vaginal birth after cesarean delivery in the twin gestation. Am J Obstet Gynecol, 1989. 161(1): p. 29-32.
Exclusion code: 5
714. Stubbs, T.M., Oxytocin for labor induction. Clin Obstet Gynecol, 2000. 43(3): p. 489-94.
Exclusion code: 6
715. Sumigama, S., et al., Placenta previa increta/percreta in Japan: a retrospective study of ultrasound findings, management and clinical course. J Obstet Gynaecol Res, 2007. 33(5): p. 606-11.
Exclusion code: 7
716. Sur, S. and I.Z. Mackenzie, Does discussion of possible scar rupture influence preferred mode of delivery after a caesarean section? J Obstet Gynaecol, 2005. 25(4): p. 338-41.
Exclusion code: 6
717. Sur, S., K.W. Murphy, and I.Z. Mackenzie, Delivery after caesarean section: consultant obstetricians' professional advice and personal preferences. J Obstet Gynaecol, 2009. 29(3): p. 212-6.
Exclusion code: 6
718. Swaim, L.S., C.S. Holste, and D.K. Waller, Umbilical cord blood pH
after prior cesarean delivery. Obstet Gynecol, 1998. 92(3): p. 390-3.
Exclusion code: 5
719. Szczesny, W., et al., Bishop score and the outcome of labor induction with misoprostol. Acta Obstet Gynecol Scand, 2006. 85(5): p. 579-82.
Exclusion code: 5
720. Takayama, T., Risks associated with cesarean section in women with placenta previa. J Obstet Gynaecol Res, 1997. 23: p. 375-9.
Exclusion code: 10
721. Tammelleo, A.D., Failure to "fully communicate": catastrophic results. Case in point: Baptist Medical Center v. Wilson 618 So. 2d 1335--AL (1993). Regan Rep Nurs Law, 1993. 34(3): p. 2.
Exclusion code: 9
722. Tan, P.C., R.N. Subramaniam, and S.Z. Omar, Predictors for caesarean delivery and neonatal admission after trial of labour in women with one previous lower segment caesarean scar. Singapore Med J, 2008. 49(3): p. 188-92.
Exclusion code: 8
723. Tan, P.C., R.N. Subramaniam, and S.Z. Omar, Trial of labor after one cesarean: role of the order and number of prior vaginal births on the risk of emergency cesarean delivery and neonatal admission. Taiwan, 2008. 47(3): p. 305-11.
Exclusion code: 5
724. Targett, C., Caesarean section and
F-57

Appendix F. Excluded Studies List, continued
trial of scar. Aust N Z J Obstet Gynaecol, 1988. 28(4): p. 249-62.
Exclusion code: 10
725. Tatar, M., et al., Women's perceptions of caesarean section: reflections from a Turkish teaching hospital. Soc Sci Med, 2000. 50(9): p. 1227-33.
Exclusion code: 6
726. Taylor, V.M., et al., Placenta previa and prior cesarean delivery: how strong is the association? Obstet Gynecol, 1994. 84(1): p. 55-7.
Exclusion code: 5
727. To, W.W. and W.C. Leung, Placenta previa and previous cesarean section. Int J Gynaecol Obstet, 1995. 51(1): p. 25-31.
Exclusion code: 7
728. Tripathi, J.B., H.U. Doshi, and P.J. Kotdawala, Vaginal birth after one caesarean section: analysis of indicators of success. J Indian Med Assoc, 2006. 104(3): p. 113-5.
Exclusion code: 8
729. Tuggy, M.L., Uterine-vesicular rupture during trial of labor. J Am Board Fam Pract, 1995. 8(5): p. 405-9.
Exclusion code: 9
730. Tuncer, R., et al., Emergency postpartum hysterectomy. J Gynecol Surg, 1995. 11(4): p. 209-13.
Exclusion code: 5
731. Turner, M.J., Delivery after one previous cesarean section. Am J Obstet Gynecol, 1997. 176(4): p.
741-4. Exclusion code: 7
732. Turner, M.J., Uterine rupture. Best Pract Res Clin Obstet Gynaecol, 2002. 16(1): p. 69-79.
Exclusion code: 6
733. Turner, M.J.A., G. Agnew, and H. Langan, Uterine rupture after a previous Caesarean section. Ir Med J, 2005. 98(8): p. 229-30.
Exclusion code: 4
734. Turner, M.J.A., G. Agnew, and H. Langan, Uterine rupture and labour after a previous low transverse caesarean section. Bjog, 2006. 113(6): p. 729-32.
Exclusion code: 11
735. Turnquest, M.A., et al., Vaginal birth after cesarean section in a university setting. J Ky Med Assoc, 1994. 92(6): p. 216-21.
Exclusion code: 4
736. Tutschek, B., H.G. Bender, and W. Henrich, Silent uterine rupture during vaginal delivery successfully managed conservatively. Ultrasound Obstet Gynecol, 2005. 26(2): p. 199-200.
Exclusion code: 9
737. Udayasankar, V., R. Padmagirison, and F. Majoko, National survey of obstetricians in Wales regarding induction of labour in women with a previous caesarean section. J Obstet Gynaecol, 2008. 28(1): p. 48-50.
Exclusion code: 6
738. Udo-Inyang, A., C. Lee, and E.
F-58
Appendix F. Excluded Studies List, continued
Evans, Gravid uterine rupture following cesarean section and intervening vaginal delivery. Henry Ford Hosp Med J, 1986. 34(3): p. 215-7.
Exclusion code: 9
739. Uppington, J., Epidural analgesia and previous Caesarean section. Anaesthesia, 1983. 38(4): p. 336-41.
Exclusion code: 9
740. Usta, I.M., et al., Placenta previa-accreta: risk factors and complications. Am J Obstet Gynecol, 2005. 193(3 Pt 2): p. 1045-9.
Exclusion code: 4
741. Usta, I.M. and A.H. Nassar, Advanced maternal age. Part I: obstetric complications. Am J Perinatol, 2008. 25(8): p. 521-34.
Exclusion code: 5
742. van Amerongen, D., Vaginal birth after cesarean section in an HMO. Hmo Pract, 1989. 3(3): p. 104-7.
Exclusion code: 4
743. van Amerongen, D., Vaginal birth after cesarean section. Experience in a community-based practice. J Reprod Med, 1989. 34(8): p. 531-4.
Exclusion code: 4
744. Van Bogaert, L.J., The relation between height, foot length, pelvic adequacy and mode of delivery. Eur J Obstet Gynecol Reprod Biol, 1999. 82(2): p. 195-9.
Exclusion code: 7
745. van Bogaert, L.J., Mode of delivery after one cesarean section. Int J
Gynaecol Obstet, 2004. 87(1): p. 9-13.
Exclusion code: 4
746. van Loon, A.J., et al., Randomised controlled trial of magnetic-resonance pelvimetry in breech presentation at term. Lancet, 1997. 350(9094): p. 1799-804.
Exclusion code: 5
747. van Roosmalen, J. and C.D. van der Does, Caesarean birth rates worldwide. A search for determinants. Trop Geogr Med, 1995. 47(1): p. 19-22.
Exclusion code: 6
748. Varner, M.W., et al., The Maternal-Fetal Medicine Unit cesarean registry: trial of labor with a twin gestation. Am J Obstet Gynecol, 2005. 193(1): p. 135-40.
Exclusion code: 5
749. Varner, M.W., et al., Trial of labor after one previous cesarean delivery for multifetal gestation. Obstet Gynecol, 2007. 110(4): p. 814-9.
Exclusion code: 5
750. Vause, S. and M. Macintosh, Evidence based case report: use of prostaglandins to induce labour in women with a caesarean section scar. Bmj, 1999. 318(7190): p. 1056-8.
Exclusion code: 9
751. Veille, J.C., et al., Human umbilical artery flow velocity waveforms before and after regional anesthesia for cesarean section. Obstet Gynecol, 1988. 72(6): p. 890-3.
F-59
Appendix F. Excluded Studies List, continued
Exclusion code: 4
752. Vellekoop, J., E.A.M. Roell-Schorer, and J. van Roosmalen, Uterine scar rupture after a previous cesarean section and induction of labor with prostaglandins. Acta Obstet Gynecol Scand, 2006. 85(2): p. 132-4.
Exclusion code: 9
753. Veltman, L., Vaginal birth after cesarean checklist; an evidence-based approach to improving care during VBAC trials. J Healthc Risk Manag, 2009. 29(1): p. 22-7.
Exclusion code: 6
754. Vendittelli, F., et al., Is a breech presentation at term more frequent in women with a history of cesarean delivery? Am J Obstet Gynecol, 2008. 198(5): p. 521.e1-6.
Exclusion code: 5
755. Vengadasalam, D., Vaginal delivery following caesarean section. Singapore Med J, 1986. 27(5): p. 396-8.
Exclusion code: 4
756. Veridiano, N.P., N.S. Thorner, and J. Ducey, Vaginal delivery after cesarean section. Int J Gynaecol Obstet, 1989. 29(4): p. 307-11.
Exclusion code: 5
757. Wadhawan, S. and J.N. Narone, Outcome of labor following previous cesarean section. Int J Gynaecol Obstet, 1983. 21(1): p. 7-10.
Exclusion code: 8
758. Wagner, M., What every midwife should know about ACOG and
VBAC. Critique of ACOG Practice Bulletin #5, July 1999, "Vaginal birth after previous cesarean section". Midwifery Today Int Midwife, 2001(59): p. 41-3.
Exclusion code: 6
759. Wallace, D.H., et al., Indirect sonographic guidance for epidural anesthesia in obese pregnant patients. Reg Anesth, 1992. 17(4): p. 233-6.
Exclusion code: 6
760. Wareham, V., C. Bain, and D. Cruickshank, Caesarean section audit by peer review. Eur J Obstet Gynecol Reprod Biol, 1993. 48(1): p. 9-14.
Exclusion code: 4
761. Warren, L., A revelation in birth--home VBAC. Midwifery Today Int Midwife, 2005(74): p. 40-1.
Exclusion code: 4
762. Wax, J.R., et al., Pregnancy following gastric bypass surgery for morbid obesity: maternal and neonatal outcomes. Obes Surg, 2008. 18(5): p. 540-4.
Exclusion code: 7
763. Wax, J.R., et al., Twin vaginal birth after cesarean. Conn Med, 2000. 64(4): p. 205-8.
Exclusion code: 5
764. Wax, J.R., et al., Interpregnancy interval as a risk factor for placenta accreta. Conn Med, 2000. 64(11): p. 659-61.
Exclusion code: 5
F-60
Appendix F. Excluded Studies List, continued
765. Weeks, A., et al., Misoprostol for induction of labor with a live fetus. Int J Gynaecol Obstet, 2007. 99 Suppl 2: p. S194-7.
Exclusion code: 6
766. Weeks, J.W., T. Pitman, and J.A. Spinnato, 2nd, Fetal macrosomia: does antenatal prediction affect delivery route and birth outcome? Am J Obstet Gynecol, 1995. 173(4): p. 1215-9.
Exclusion code: 5
767. Weiss, J., A. Nannini, and L. Bartlett, Uterine rupture among women with a prior cesarean delivery. N Engl J Med, 2002. 346(2): p. 134-7.
Exclusion code: 6
768. Whiteman, M.K., et al., Incidence and determinants of peripartum hysterectomy. Obstet Gynecol, 2006. 108(6): p. 1486-92.
Exclusion code: 4
769. Whiteside, D.C., C.S. Mahan, and J.C. Cook, Factors associated with successful vaginal delivery after cesarean section. J Reprod Med, 1983. 28(11): p. 785-8.
Exclusion code: 7
770. Wilson, P.D., R.M. Herbison, and G.P. Herbison, Obstetric practice and the prevalence of urinary incontinence three months after delivery. Br J Obstet Gynaecol, 1996. 103(2): p. 154-61.
Exclusion code: 5
771. Windrim, R., Vaginal delivery in birth centre after previous caesarean
section. Lancet, 2005. 365(9454): p. 106-7.
Exclusion code: 6
772. Wing, D.A. and C.A.L. Gaffaney, Vaginal misoprostol administration for cervical ripening and labor induction. Clin Obstet Gynecol, 2006. 49(3): p. 627-41.
Exclusion code: 4
773. Wing, D.A. and R.H. Paul, Vaginal birth after cesarean section: selection and management. Clin Obstet Gynecol, 1999. 42(4): p. 836-48.
Exclusion code: 6
774. Wood, S.L., et al., The risk of unexplained antepartum stillbirth in second pregnancies following caesarean section in the first pregnancy. Bjog, 2008. 115(6): p. 726-31.
Exclusion code: 7
775. Woods, J.R., Jr., et al., The effect of labor on maternal and fetal vitamins C and E. Am J Obstet Gynecol, 2002. 187(5): p. 1179-83.
Exclusion code: 5
776. Yamani, T.Y. and A.A. Rouzi, Induction of labor with vaginal prostaglandin-E2 in grand multiparous women with one previous cesarean section. Int J Gynaecol Obstet, 1999. 65(3): p. 251-3.
Exclusion code: 8
777. Yamani Zamzami, T.Y., Indication of emergency peripartum hysterectomy: review of 17 cases.
F-61
Appendix F. Excluded Studies List, continued
Arch Gynecol Obstet, 2003. 268(3): p. 131-5.
Exclusion code: 8
778. Yamani Zamzami, T.Y., Vaginal birth after cesarean section in grand multiparous women. Arch Gynecol Obstet, 2004. 270(1): p. 21-4.
Exclusion code: 8
779. Yamani-Zamzami, T.Y., Delivery outcomes at term after one previous cesarean section. Saudi Med J, 2007. 28(12): p. 1845-9.
Exclusion code: 8
780. Yang, J.I., et al., Sonographic findings of placental lacunae and the prediction of adherent placenta in women with placenta previa totalis and prior Cesarean section. Ultrasound Obstet Gynecol, 2006. 28(2): p. 178-82.
Exclusion code: 4
781. Yang, Y.T., et al., Relationship between malpractice litigation pressure and rates of cesarean section and vaginal birth after cesarean section. Med Care, 2009. 47(2): p. 234-42.
Exclusion code: 6
782. Yangzom, Y., et al., Outcome of hospital deliveries of women living at high altitude: a study from Lhasa in Tibet. Acta Paediatr, 2008. 97(3): p. 317-21.
Exclusion code: 8
783. Yap, O.W., E.S. Kim, and R.K. Laros, Jr., Maternal and neonatal outcomes after uterine rupture in labor. Am J Obstet Gynecol, 2001.
184(7): p. 1576-81. Exclusion code: 10
784. Yasumizu, T., et al., Trial of vaginal birth following cesarean section for arrest disorders of labor: analysis of patients with well-documented medical records. Asia Oceania J Obstet Gynaecol, 1994. 20(4): p. 407-13.
Exclusion code: 7
785. Yeh, S., X. Huang, and J.P. Phelan, Postterm pregnancy after previous cesarean section. J Reprod Med, 1984. 29(1): p. 41-4.
Exclusion code: 10
786. Yogev, Y., et al., Induction of labor with vaginal prostaglandin E2. J Matern Fetal Neonatal Med, 2003. 14(1): p. 30-4.
Exclusion code: 7
787. Yu, C.K.H., T.G. Teoh, and S. Robinson, Obesity in pregnancy. Bjog, 2006. 113(10): p. 1117-25.
Exclusion code: 6
788. Yudkin, P.L. and C.W. Redman, Caesarean section dissected, 1978-1983. Br J Obstet Gynaecol, 1986. 93(2): p. 135-44.
Exclusion code: 7
789. Zagorzycki, M.T. and C.R. Brinkman, 3rd, The effect of general and epidural anesthesia upon neonatal Apgar scores in repeat cesarean section. Surg Gynecol Obstet, 1982. 155(5): p. 641-5.
Exclusion code: 7
790. Zaideh, S.M., A.T. Abu-Heija, and
F-62
Appendix F. Excluded Studies List, continued
M.F. El-Jallad, Placenta praevia and accreta: analysis of a two-year experience. Gynecol Obstet Invest, 1998. 46(2): p. 96-8.
Exclusion code: 8
791. Zaki, Z.M., et al., Risk factors and morbidity in patients with placenta previa accreta compared to placenta previa non-accreta. Acta Obstet Gynecol Scand, 1998. 77(4): p. 391-4.
Exclusion code: 8
792. Zhang, J. and D.A. Savitz, Maternal age and placenta previa: a population-based, case-control study. Am J Obstet Gynecol, 1993. 168(2): p. 641-5.
Exclusion code: 4
793. Zhuang, Y.L., et al., [Treatment of pregnancy in a previous caesarean section scar with uterine artery embolization: analysis of 60 cases]. Zhonghua yi xue za zhi, 2008. 88(33): p. 2372-4.
Exclusion code: 8
794. Ziadeh, S.M. and A.T. Abu-Heija, Duration of labor in patients delivered vaginally after one previous lower segment cesarean section. Int J Gynaecol Obstet, 1994. 45(3): p. 213-5.
Exclusion code: 8
795. Ziadeh, S.M., M.R. Zakaria, and E.I. Sunna, Obstetric uterine rupture in north Jordan. J Obstet Gynaecol Res, 1996. 22(3): p. 209-13.
Exclusion code: 8
796. Zorlu, C.G., et al., Vaginal birth
following unmonitored labor in patients with prior cesarean section. Gynecol Obstet Invest, 1996. 42(4): p. 222-6.
Exclusion code: 4
797. Zweifler, J., et al., Vaginal birth after cesarean in California: before and after a change in guidelines. Ann Fam Med, 2006. 4(3): p. 228-34.
Exclusion code: 7
F-63
Appendix F. Excluded Studies List, continued
Studies excluded by specific topics of interest:
Trial of labor and vaginal birth after cesarean rates: Studies were excluded from the trial of labor and vaginal birth after cesarean rates sections for various reasons, these include: limited population that was not comparable to others included, poor quality studies, examined the same group of cohort as included studies, studies were not specific about all who was eligible for a trial of labor.
1. Blanchette, H., et al., Is vaginal birth 6. Gibson, D.H., Vaginal delivery after after cesarean safe? Experience at a community hospital. Am J Obstet Gynecol, 2001. 184(7): p. 1478-84;
caesarean section in primigravidae. Ir J Med Sci, 1988. 157(9): p. 290-2.
discussion 1484-7. 7. Gonen, R., et al., Variables
2. Bujold, E., et al., Modified Bishop's associated with successful vaginal birth after one cesarean section: a
score and induction of labor in patients with a previous cesarean delivery. Am J Obstet Gynecol, 2004. 191(5): p. 1644-8.
proposed vaginal birth after cesarean section score. Am J Perinatol, 2004. 21(8): p. 447-53.
8. Grobman, W.A., et al., Pregnancy 3. Cahill, A.G., et al., Is vaginal birth outcomes for women with placenta
after cesarean (VBAC) or elective repeat cesarean safer in women with a prior vaginal delivery? Am J Obstet Gynecol, 2006. 195(4): p.
previa in relation to the number of prior cesarean deliveries. Obstet Gynecol, 2007. 110(6): p. 1249-55.
1143-7. 9. Heddleston, L.N. and W.J. Watson,
4. Carroll, C.S., Sr., et al., Vaginal birth after cesarean section versus elective
Vaginal birth after cesarean section in a small hospital. Mil Med, 1991. 156(5): p. 239-40.
repeat cesarean delivery: Weight-based outcomes. Am J Obstet 10. Kabir, A.A., et al., Racial differences Gynecol, 2003. 188(6): p. 1516-20; in cesareans: an analysis of U.S. discussion 1520-2. 2001 National Inpatient Sample
5. Chauhan, S.P., et al., Mode of delivery for the morbidly obese with prior cesarean delivery: vaginal versus repeat cesarean section. Am J Obstet Gynecol, 2001. 185(2): p. 11.
Data.[see comment][erratum appears in Obstet Gynecol. 2005 Jun;105(6):1495]. Obstet Gynecol, 2005. 105(4): p. 710-8.
King, D.E. and K. Lahiri, 349-54. Socioeconomic factors and the odds
of vaginal birth after cesarean delivery. Jama, 1994. 272(7): p. 524-9.
F-64

Appendix F. Excluded Studies List, continued
12. Landon, M.B., et al., Maternal and perinatal outcomes associated with a trial of labor after prior cesarean delivery. N Engl J Med, 2004. 351(25): p. 2581-9.
13. Leung, A.S., E.K. Leung, and R.H. Paul, Uterine rupture after previous cesarean delivery: maternal and fetal consequences. Am J Obstet Gynecol, 1993. 169(4): p. 945-50.
14. Melnikow, J., et al., Vaginal birth after cesarean in California. Obstet Gynecol, 2001. 98(3): p. 421-6.
15. Mercer, B.M., et al., Labor outcomes with increasing number of prior vaginal births after cesarean delivery. Obstet Gynecol, 2008. 111(2 Pt 1): p. 285-91.
16. Montgomery, A.A., et al., Two decision aids for mode of delivery among women with previous caesarean section: randomised controlled trial. Bmj, 2007. 334(7607): p. 1305.
17. Paterson, C.M. and N.J. Saunders, Mode of delivery after one caesarean section: audit of current practice in a health region. Bmj, 1991. 303(6806): p. 818-21.
18. Paul, R.H., J.P. Phelan, and S.Y. Yeh, Trial of labor in the patient with a prior cesarean birth. Am J Obstet Gynecol, 1985. 151(3): p. 297-304.
19. Peaceman, A.M., et al., The MFMU Cesarean Registry: impact of fetal size on trial of labor success for patients with previous cesarean for dystocia. Am J Obstet Gynecol, 2006. 195(4): p. 1127-31.
20. Quinones, J.N., et al., The effect of prematurity on vaginal birth after cesarean delivery: success and maternal morbidity. Obstet Gynecol, 2005. 105(3): p. 519-24.
21. Rudick, V., et al., Epidural analgesia for planned vaginal delivery following previous cesarean section. Obstet Gynecol, 1984. 64(5): p. 621-3.
22. Shorten, A., et al., Making choices for childbirth: a randomized controlled trial of a decision-aid for informed birth after cesarean. Birth, 2005. 32(4): p. 252-61.
23. Srinivas, S.K., et al., Predicting failure of a vaginal birth attempt after cesarean delivery. Obstet Gynecol, 2007. 109(4): p. 800-5.
24. Stone, C., et al., Vaginal births after Caesarean (VBAC): a population study. Paediatr Perinat Epidemiol, 2000. 14(4): p. 340-8.
25. van der Walt, W.A., H.S. Cronje, and R.H. Bam, Vaginal delivery after one cesarean section. Int J Gynaecol Obstet, 1994. 46(3): p. 271-7.
F-65
Appendix F. Excluded Studies List, continued
Uterine rupture Studies not using the anatomical definition, defined as: complete uterine rupture – separation through the entire thickness of the wall including visceral serosa (with or without extrusion of part of all of fetal-placental unit). The following studies were excluded from the risk of uterine rupture section of the report because they did not use this definition. 1. Amir, W., J. Peter, and Z. Etan, Trial
of labor without oxytocin in patients with a previous cesarean section. Am J Perinatol, 1987. 4(2): p. 140-3.
8. Fisler, R.E., et al., Neonatal outcome after trial of labor compared with elective repeat cesarean section. Birth, 2003. 30(2): p. 83-8.
2. Bais, J.M., et al., Vaginal birth after caesarean section in a population 9. Flamm, B.L., et al., Elective repeat with a low overall caesarean section cesarean delivery versus trial of rate. Eur J Obstet Gynecol Reprod Biol, 2001. 96(2): p. 158-62.
labor: a prospective multicenter study. Obstet Gynecol, 1994. 83(6): p. 927-32.
3. Blanchette, H., et al., Is vaginal birth after cesarean safe? Experience at a 10. Granovsky-Grisaru, S., M. Shaya, community hospital. Am J Obstet Gynecol, 2001. 184(7): p. 1478-84;
and Y.Z. Diamant, The management of labor in women with more than
discussion 1484-7. one uterine scar: is a repeat cesarean section really the only
4. Bujold, E., S.C. Blackwell, and R.J. Gauthier, Cervical ripening with
"safe" option? J Perinat Med, 1994. 22(1): p. 13-7.
transcervical foley catheter and the risk of uterine rupture. Obstet Gynecol, 2004. 103(1): p. 18-23.
11. Gregory, K.D., et al., Vaginal birth after cesarean: clinical risk factors associated with adverse outcome.
5. Bujold, E., et al., The impact of a Am J Obstet Gynecol, 2008. 198(4): single-layer or double-layer closure p. 452.e1-10; discussion 452.e10-2. on uterine rupture. Am J Obstet Gynecol, 2002. 186(6): p. 1326-30. 12. Grossetti, E., et al., Rupture of the
6. Eglinton, G.S., et al., Outcome of a scarred uterus. Acta Obstet Gynecol Scand, 2007. 86(5): p. 572-8.
trial of labor after prior cesarean delivery. J Reprod Med, 1984. 29(1): 13. Grubb, D.K., S.L. Kjos, and R.H. p. 3-8. Paul, Latent labor with an unknown
7. Eriksen, N.L. and L. Buttino, Jr., uterine scar. Obstet Gynecol, 1996. 88(3): p. 351-5.
Vaginal birth after cesarean: a comparison of maternal and 14. Hammoud, A., et al., The effect of neonatal morbidity to elective repeat gestational age on trial of labor after cesarean section. Am J Perinatol, Cesarean section. J Matern Fetal 1989. 6(4): p. 375-9. Neonatal Med, 2004. 15(3): p. 202-6.
F-66
Appendix F. Excluded Studies List, continued
15. Hibbard, J.U., et al., Failed vaginal birth after a cesarean section: how risky is it? I. Maternal morbidity. Am J Obstet Gynecol, 2001. 184(7): p. 1365-71; discussion 1371-3.
16. Hollard, A.L., et al., Ethnic disparity in the success of vaginal birth after cesarean delivery. J Matern Fetal Neonatal Med, 2006. 19(8): p. 483-7.
17. Hook, B., et al., Neonatal morbidity after elective repeat cesarean section and trial of labor. Pediatrics, 1997. 100(3 Pt 1): p. 348-53.
18. Juhasz, G., et al., Effect of body mass index and excessive weight gain on success of vaginal birth after cesarean delivery. Obstet Gynecol, 2005. 106(4): p. 741-6.
19. Lieberman, E., et al., Results of the national study of vaginal birth after cesarean in birth centers. Obstet Gynecol, 2004. 104(5 Pt 1): p. 933-42.
20. Lin, C. and B.D. Raynor, Risk of uterine rupture in labor induction of patients with prior cesarean section: an inner city hospital experience. Am J Obstet Gynecol, 2004. 190(5): p. 1476-8.
21. Martin, J.N., Jr., et al., Vaginal delivery following previous cesarean birth. Am J Obstet Gynecol, 1983. 146(3): p. 255-63.
22. Meehan, F.P. and G. Burke, Trial of labour following prior section; a 5 year prospective study (1982-1987).
Eur J Obstet Gynecol Reprod Biol, 1989. 31(2): p. 109-17.
23. Meier, P.R. and R.P. Porreco, Trial of labor following cesarean section: a two-year experience. Am J Obstet Gynecol, 1982. 144(6): p. 671-8.
24. Menihan, C.A., Uterine rupture in women attempting a vaginal birth following prior cesarean birth. J Perinatol, 1998. 18(6 Pt 1): p. 440-3.
25. Nguyen, T.V., et al., Vaginal birth after cesarean section at the University of Texas. J Reprod Med, 1992. 37(10): p. 880-2.
26. Obara, H., et al., Vaginal birth after cesarean delivery: results in 310 pregnancies. J Obstet Gynaecol Res, 1998. 24(2): p. 129-34.
27. Phelan, J.P., et al., Vaginal birth after cesarean. Am J Obstet Gynecol, 1987. 157(6): p. 1510-5.
28. Quinones, J.N., et al., The effect of prematurity on vaginal birth after cesarean delivery: success and maternal morbidity. Obstet Gynecol, 2005. 105(3): p. 519-24.
29. Sakala, E.P., et al., Oxytocin use after previous cesarean: why a higher rate of failed labor trial? Obstet Gynecol, 1990. 75(3 Pt 1): p. 356-9.
30. Schneider, J., D. Gallego, and R. Benito, Trial of labor after an earlier cesarean section. A conservative approach. J Reprod Med, 1988. 33(5): p. 453-6.
F-67
Appendix F. Excluded Studies List, continued
31. Socol, M.L. and A.M. Peaceman, community with a solo practice. Am J Perinatol, 2003. 20(2): p. 63-7.
32.
Vaginal birth after cesarean: an appraisal of fetal risk. Obstet Gynecol, 1999. 93(5 Pt 1): p. 674-9.
Stovall, T.G., et al., Trial of labor in
35. van der Walt, W.A., H.S. Cronje, and R.H. Bam, Vaginal delivery after one cesarean section. Int J Gynaecol Obstet, 1994. 46(3): p. 271-7.
previous cesarean section patients, excluding classical cesarean sections. Obstet Gynecol, 1987. 70(5): p. 713-7.
36. Wen, S.W., et al., Comparison of maternal mortality and morbidity between trial of labor and elective
33. Tahilramaney, M.P., et al., Previous cesarean section and trial of labor.
cesarean section among women with previous cesarean delivery. Am J Obstet Gynecol, 2004. 191(4): p.
Factors related to uterine 1263-9. dehiscence. J Reprod Med, 1984. 29(1): p. 17-21. 37. Zwart, J.J., et al., Uterine rupture in
The Netherlands: a nationwide 34. Upadhyaya, C.D., D.M. Upadhyaya,
and S.J. Carlan, Vaginal birth after population-based cohort study. Bjog, 2009. 116(8): p. 1069-78; discussion
cesarean delivery in a small rural 1078-80.
F-68

Appendix G. List of Citations From the Maternal-Fetal Medicine Units Network Cohort
Overview: This appendix contains the full-text papers used from the National Institute of Child Health and Human Development Maternal-Fetal Medicine Units Network (MFMU) in this report by key question.
Description of overall cohort: The MFMU cohort drew subjects from 19 academic medical centers and report on 45,988 women with singleton gestation and prior cesarean delivery. The Network, established in 1986, was designed to focus on clinical questions in maternal-fetal medicine and obstetrics, particularly with respect to the continuing problem of preterm birth.
Key Question 1 • Grobman, 20071
• Landon, 20042
• Mercer, 20083
• Peaceman, 20064
Key Question 2 • Grobman, 20075
• Grobman, 20086
• Hibbard, 20067
• Landon, 20042
• Landon, 20068
• Mercer, 20083
• Rouse, 20069
• Silver, 200610
• Spong, 200711
Key Question 3 • Grobman, 20075
• Hibbard, 20067
• Landon, 20068
• Spong, 200711
G-1
Appendix G. List of Citations From the Maternal-Fetal Medicine Units Network Cohort, continued
References
1. Grobman WA, Lai Y, Landon MB, et al. Development of a nomogram for prediction of vaginal birth after cesarean delivery. Obstet Gynecol. 2007;109(4):806-812.
2. Landon MB, Hauth JC, Leveno KJ, et al. Maternal and perinatal outcomes associated with a trial of labor after prior cesarean delivery. N Engl J Med. 2004;351(25):2581-2589.
3. Mercer BM, Gilbert S, Landon MB, et al. Labor outcomes with increasing number of prior vaginal births after cesarean delivery. Obstet Gynecol. 2008;111(2 Pt 1):285-291.
4. Peaceman AM, Gersnoviez R, Landon MB, et al. The MFMU Cesarean Registry: impact of fetal size on trial of labor success for patients with previous cesarean for dystocia. American Journal of Obstetrics & Gynecology. 2006;195(4):1127-1131.
5. Grobman WA, Gilbert S, Landon MB, et al. Outcomes of induction of labor after one prior cesarean. Obstet Gynecol. 2007;109(2 Pt 1):262-269.
6. Grobman WA, Lai Y, Landon MB, et al. Prediction of uterine rupture associated with attempted vaginal birth after cesarean delivery. American Journal of Obstetrics & Gynecology. 2008;199(1):30.e31-35.
7. Hibbard JU, Gilbert S, Landon MB, et al. Trial of labor or repeat cesarean delivery in women with morbid obesity and previous cesarean delivery. Obstet Gynecol. 2006;108(1):125-133.
8. Landon MB, Spong CY, Thom E, et al. Risk of uterine rupture with a trial of labor in women with multiple and single prior cesarean delivery. Obstet Gynecol. 2006;108(1):12-20.
9. Rouse DJ, MacPherson C, Landon M, et al. Blood transfusion and cesarean delivery.[erratum appears in Obstet Gynecol. 2006 Dec;108(6):1556]. Obstet Gynecol. 2006;108(4):891-897.
10. Silver RM, Landon MB, Rouse DJ, et al. Maternal morbidity associated with multiple repeat cesarean deliveries. Obstet Gynecol. 2006;107(6):1226-1232.
11. Spong CY, Landon MB, Gilbert S, et al. Risk of uterine rupture and adverse perinatal outcome at term after cesarean delivery. Obstet Gynecol. 2007;110(4):801-807.
G-2

Appendix H. Quality Rating Criteria
Introduction
Quality assessment of individual studies is a critical and necessary step in conducting an evidence review. Quality assessment is an assessment of a study’s internal validity (the study’s ability to measure what it intends to measure). If a study is not conducted properly, the results that they produce are unlikely to represent the truth and thus are worthless (the old adage garbage in garbage out). If however, a study is structurally and analytically sound, then the results are valuable. A systematic review, is intended to evaluate the entire literature and distill those studies which are of the highest possible quality and therefore likely to be sound and defensible to affect practice.
Our senior advisory team reviewed the literature around quality assessment including:
We were searching for a system that was able to evaluate the entire breadth of study designs as the Obstetric literature and vaginal birth after cesarean literature spans all study types. Using one system that is able to cover all study designs, makes it easier for the reader to understand quality assessments across study designed that are included in any given topic. For example, the topic of uterine rupture will include randomized controlled trials of induction of labor or other interventions but will also necessarily include cohort, case series, and case control literature.
We concluded that the quality assessment tool that was used in the last report remained the optimal choice for this current review. We felt that this was likely to be widely applicable across clinical reviews, and as such, we have developed a user’s guide to the quality assessment tool to increase reliability across staff.
H-1

Appendix H. Quality Rating Criteria, continued
Taxonomy of study designs1
Experimental designs A study in which the investigator has control over at least some study conditions, particularly decisions concerning the allocation of participants to different intervention groups.
Randomized controlled trial Participants are randomly allocated to intervention or control groups and flowed up over time to assess any differences in outcome rates. Randomization with allocation concealment ensures that on average known and unknown determinants of outcome are evenly distributed between groups.
Observational designs A study in which natural variation in interventions (or exposure) among study participants is investigated to explore the effect of the interventions (or exposure) on health outcomes.
Cohort study A follow-up study that compares outcomes between participants who have received an intervention and those who have not. Participants are studied during the same (concurrent) period either prospectively or, more commonly, retrospectively.
Case-control study Participants with and without a given outcome are identified (cases and controls respectively) and exposure to a given intervention(s) between the two groups compared.
Cross-sectional study Examination of the relationship between disease and other variables of interest as they exist in a defined population at one particular time point.
Case series Description of a number of cases of an intervention and outcome (no comparison with a control group).
H-2
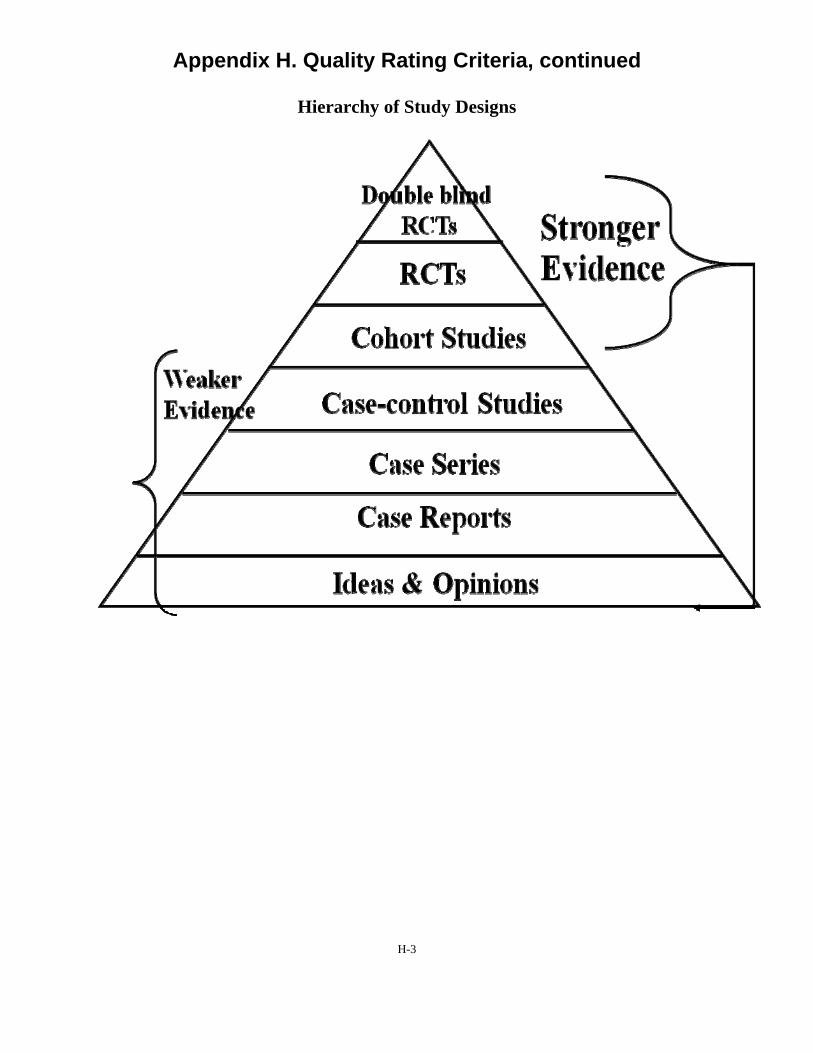
Appendix H. Quality Rating Criteria, continued
Hierarchy of Study Designs
H-3
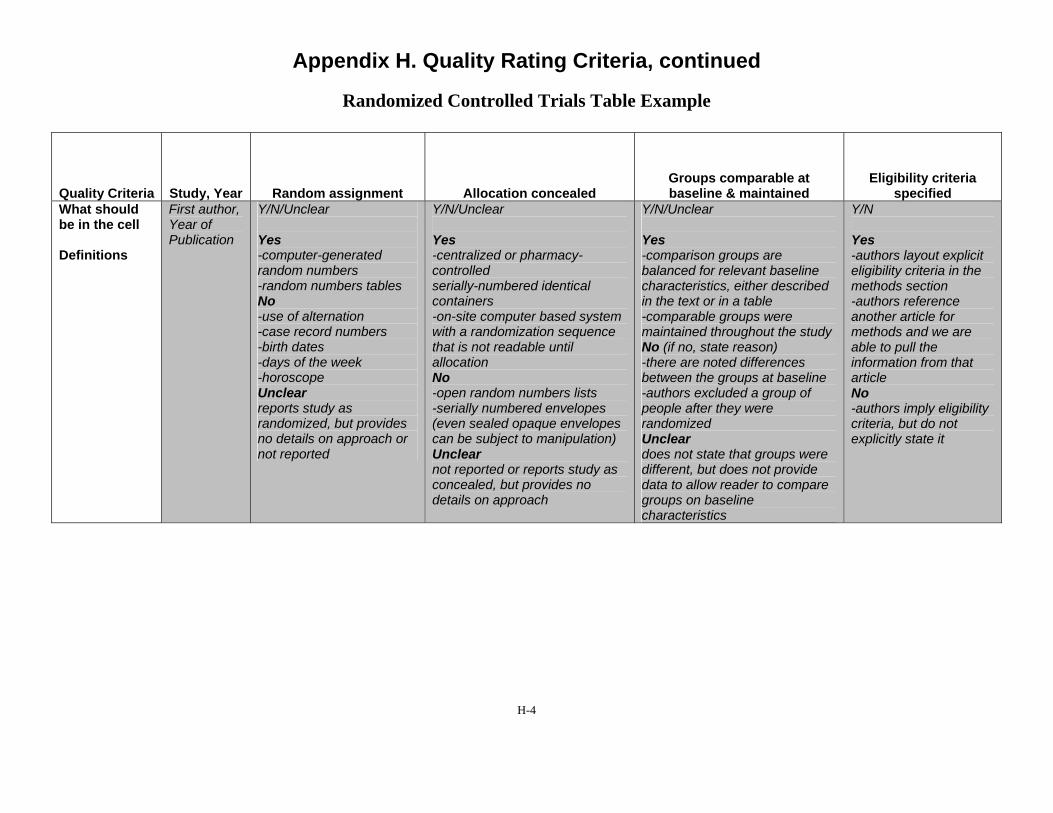
Appendix H. Quality Rating Criteria, continued
Randomized Controlled Trials Table Example
Quality Criteria Study, Year Random assignment Allocation concealed Groups comparable at baseline & maintained
Eligibility criteria specified
What should First author, Y/N/Unclear Y/N/Unclear Y/N/Unclear Y/N be in the cell Year of
Publication Yes Yes Yes Yes Definitions -computer-generated
random numbers -random numbers tables No -use of alternation -case record numbers -birth dates -days of the week -horoscope Unclear reports study as randomized, but provides no details on approach or not reported
-centralized or pharmacy-controlled serially-numbered identical containers -on-site computer based system with a randomization sequence that is not readable until allocation No -open random numbers lists -serially numbered envelopes (even sealed opaque envelopes can be subject to manipulation) Unclear not reported or reports study as concealed, but provides no details on approach
-comparison groups are balanced for relevant baseline characteristics, either described in the text or in a table -comparable groups were maintained throughout the study No (if no, state reason) -there are noted differences between the groups at baseline -authors excluded a group of people after they were randomized Unclear does not state that groups were different, but does not provide data to allow reader to compare groups on baseline characteristics
-authors layout explicit eligibility criteria in the methods section -authors reference another article for methods and we are able to pull the information from that article No -authors imply eligibility criteria, but do not explicitly state it
H-4

Appendix H. Quality Rating Criteria, continued
Randomized Controlled Trials Table Example, continued
Blinded: Outcome Assessors/ Care Provider/Patient
Report of attrition Differential loss to follow-up Analysis considerations Quality Score
Y/N/Unclear
Please note: answer for each person; outcome assessors, care providers and patients
Yes -Blinding is used to keep the participants, investigators and outcome assessors ignorant about the interventions which participants are receiving during a study. Blinding of outcome assessment can often be done even when blinding of participants and caregivers cannot. Blinding is used to protect against performance bias and detection bias. It may also contribute to adequate allocation concealment. No -open label -un-blinded Unclear reports as 'blind' or 'double blind' but no details are provided
Attrition rate=% Differential loss to follow-up=%
Report the actual attrition rate, per group - < 20% - Good - < 40% - Fair
Calculate the differential loss to follow-up
Y/N/Unclear
Yes -ITT analysis is followed, not only described but actually followed in the results section -included all who were randomized in the analysis -<5% missing data without including them in the analysis
No -specifically exclude people from the analysis -conduct ONLY a per protocol analysis
Unclear reports ITT, but provides no details of who is in analysis
Good/Fair/Poor
H-5

Appendix H. Quality Rating Criteria, continued
Randomized Controlled Trials Descriptors
Random assignment – The process by which study participants are allocated to treatment groups in a trial. Adequate (that is, unbiased) methods of randomization include computer generated schedules and random-numbers tables.
Allocation concealed – The process by which the person determining eligibility, consent, and enrollment is unaware of which group the next patient is to be assigned.
Groups comparable at baseline & maintained - The researchers need to explicitly describe their groups at baseline and how they may or may not differ on important prognostic factors. These types of comparable groups must be maintained throughout the study as well. This becomes very important and can be tricky to assess. We know that some women who end up with a cesarean will have opted for a trial of labor and some who opted for a cesarean prior to trial of labor will go into labor. Thus issues such as inclusion from intended cohort and intention to treat analyses are important.
Eligibility criteria specified – The researchers need to be explicit in laying out the eligibility criteria. This will include what inclusion criteria needed to be met to be eligible for the study as well as the reasons why they excluded particular individuals. This information is important to determine generalizability of the study.
Blinded: Outcome Assessors/Care Provider/Patient – A way of making sure that the people involved in a research study — participants, clinicians, or researchers —do not know which participants are assigned to each study group. Blinding usually is used in research studies that compare two or more types of treatment for an illness. Blinding is used to keep the participants, investigators and outcome assessors ignorant about the interventions which participants are receiving during a study. Blinding of outcome assessment can often be done even when blinding of participants and caregivers cannot. Blinding is used to protect against performance bias and detection bias. It may also contribute to adequate allocation concealment.
Report of attrition/Differential loss to follow-up – For every study, some proportion of participants is likely to dropout or be lost to follow-up due to a number of reasons. Loss to follow-up occurs when there is a loss of contact with some participants, so that researchers cannot complete data collection as planned, and do not know why the participants discontinued. Loss to follow-up is a common cause of missing data, especially in long-term studies. An acceptable attrition rate is < 20% for a good quality rating and < 40% for a fair quality rating.
Analysis considerations – The use of data from a randomized controlled trial in which data from all randomized patients are accounted for in the final results. Trials often incorrectly report results as being based on intention to treat despite the fact that some patients are excluded from the analysis. If co-interventions occurred the researchers need to describe how these were handled in the analysis.
H-6
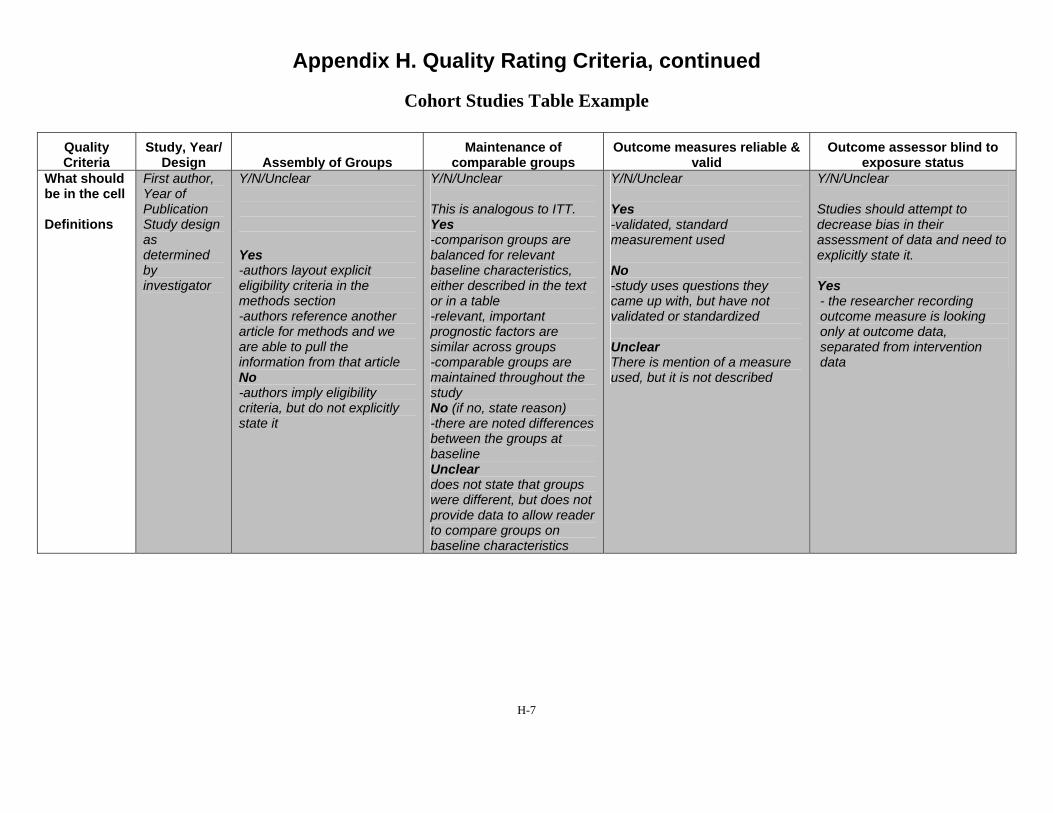
Appendix H. Quality Rating Criteria, continued
Cohort Studies Table Example
Quality Criteria
Study, Year/ Design Assembly of Groups
Maintenance of comparable groups
Outcome measures reliable & valid
Outcome assessor blind to exposure status
What should First author, Y/N/Unclear Y/N/Unclear Y/N/Unclear Y/N/Unclear be in the cell Year of
Publication This is analogous to ITT. Yes Studies should attempt to Definitions Study design
as determined by investigator
Yes -authors layout explicit eligibility criteria in the methods section -authors reference another article for methods and we are able to pull the information from that article No -authors imply eligibility criteria, but do not explicitly state it
Yes -comparison groups are balanced for relevant baseline characteristics, either described in the text or in a table -relevant, important prognostic factors are similar across groups -comparable groups are maintained throughout the study No (if no, state reason) -there are noted differences between the groups at baseline Unclear does not state that groups were different, but does not provide data to allow reader to compare groups on baseline characteristics
-validated, standard measurement used
No -study uses questions they came up with, but have not validated or standardized
Unclear There is mention of a measure used, but it is not described
decrease bias in their assessment of data and need to explicitly state it.
Yes - the researcher recording outcome measure is looking only at outcome data, separated from intervention data
H-7
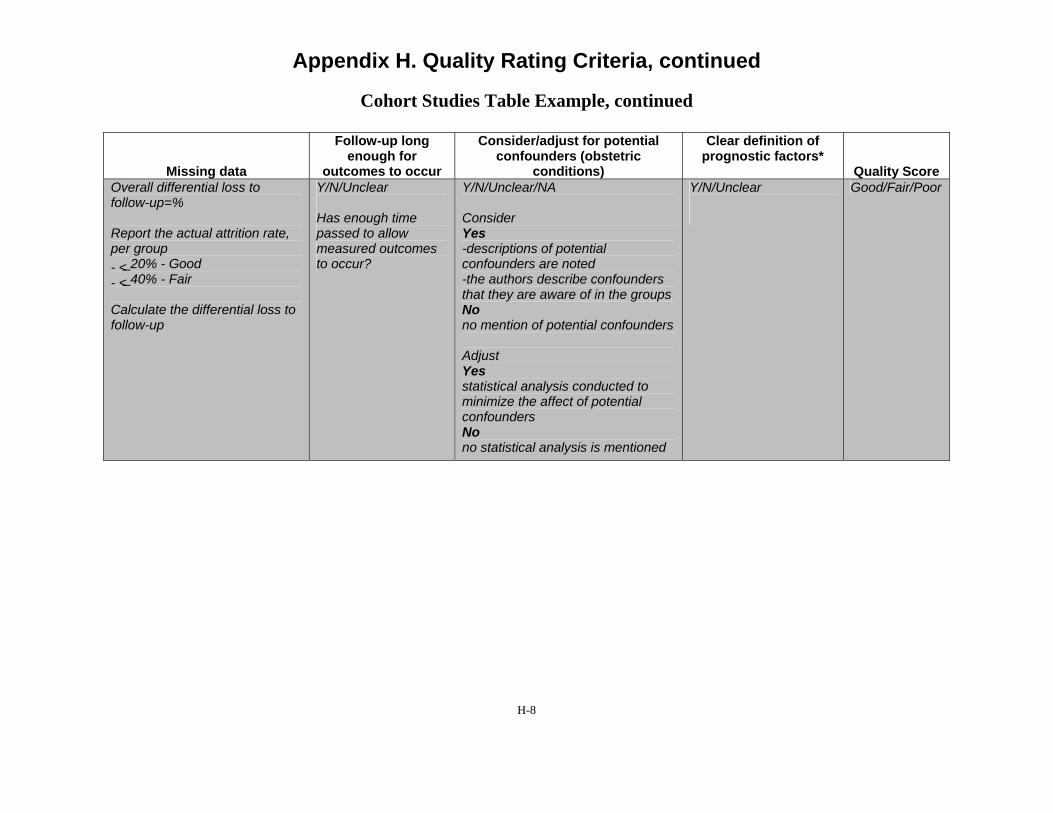
Appendix H. Quality Rating Criteria, continued
Cohort Studies Table Example, continued
Missing data
Follow-up long enough for
outcomes to occur
Consider/adjust for potential confounders (obstetric
conditions)
Clear definition of prognostic factors*
Quality Score Overall differential loss to follow-up=%
Report the actual attrition rate, per group - < 20% - Good - < 40% - Fair
Calculate the differential loss to follow-up
Y/N/Unclear
Has enough time passed to allow measured outcomes to occur?
Y/N/Unclear/NA
Consider Yes -descriptions of potential confounders are noted -the authors describe confounders that they are aware of in the groups No no mention of potential confounders
Adjust Yes statistical analysis conducted to minimize the affect of potential confounders No no statistical analysis is mentioned
Y/N/Unclear Good/Fair/Poor
H-8
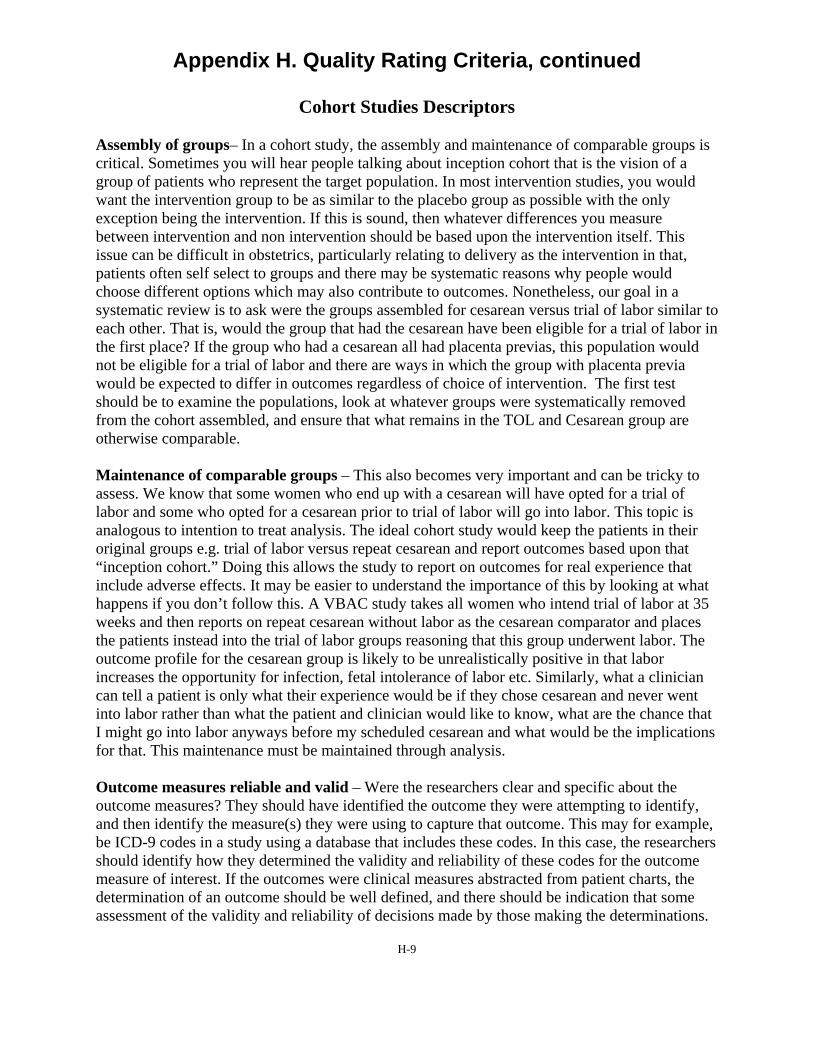
Appendix H. Quality Rating Criteria, continued
Cohort Studies Descriptors
Assembly of groups– In a cohort study, the assembly and maintenance of comparable groups is critical. Sometimes you will hear people talking about inception cohort that is the vision of a group of patients who represent the target population. In most intervention studies, you would want the intervention group to be as similar to the placebo group as possible with the only exception being the intervention. If this is sound, then whatever differences you measure between intervention and non intervention should be based upon the intervention itself. This issue can be difficult in obstetrics, particularly relating to delivery as the intervention in that, patients often self select to groups and there may be systematic reasons why people would choose different options which may also contribute to outcomes. Nonetheless, our goal in a systematic review is to ask were the groups assembled for cesarean versus trial of labor similar to each other. That is, would the group that had the cesarean have been eligible for a trial of labor in the first place? If the group who had a cesarean all had placenta previas, this population would not be eligible for a trial of labor and there are ways in which the group with placenta previa would be expected to differ in outcomes regardless of choice of intervention. The first test should be to examine the populations, look at whatever groups were systematically removed from the cohort assembled, and ensure that what remains in the TOL and Cesarean group are otherwise comparable.
Maintenance of comparable groups – This also becomes very important and can be tricky to assess. We know that some women who end up with a cesarean will have opted for a trial of labor and some who opted for a cesarean prior to trial of labor will go into labor. This topic is analogous to intention to treat analysis. The ideal cohort study would keep the patients in their original groups e.g. trial of labor versus repeat cesarean and report outcomes based upon that “inception cohort.” Doing this allows the study to report on outcomes for real experience that include adverse effects. It may be easier to understand the importance of this by looking at what happens if you don’t follow this. A VBAC study takes all women who intend trial of labor at 35 weeks and then reports on repeat cesarean without labor as the cesarean comparator and places the patients instead into the trial of labor groups reasoning that this group underwent labor. The outcome profile for the cesarean group is likely to be unrealistically positive in that labor increases the opportunity for infection, fetal intolerance of labor etc. Similarly, what a clinician can tell a patient is only what their experience would be if they chose cesarean and never went into labor rather than what the patient and clinician would like to know, what are the chance that I might go into labor anyways before my scheduled cesarean and what would be the implications for that. This maintenance must be maintained through analysis.
Outcome measures reliable and valid – Were the researchers clear and specific about the outcome measures? They should have identified the outcome they were attempting to identify, and then identify the measure(s) they were using to capture that outcome. This may for example, be ICD-9 codes in a study using a database that includes these codes. In this case, the researchers should identify how they determined the validity and reliability of these codes for the outcome measure of interest. If the outcomes were clinical measures abstracted from patient charts, the determination of an outcome should be well defined, and there should be indication that some assessment of the validity and reliability of decisions made by those making the determinations.
H-9
Appendix H. Quality Rating Criteria, continued
In the best studies, the researchers will discuss why they selected specific outcome measures, for example, why they selected the HAM-D scale rather than the MADRS scale to measure depression, what change on the scale indicated clinically meaningful improvement or response, and so on.
Outcome assessors blind to exposure status – Were the outcome assessors blinded to which group the patient belonged? Those making determinations of whether an outcome occurred or not should ideally be unaware of which group that patient was in. This can be achieved in most cases. When the outcomes are being assessed retrospectively, the researcher recording outcome measure should be looking only at outcome data, separated from intervention data. If this is truly not possible, for example, the outcome data are described in such a way that the group the patient is in is apparent, then researchers who are not aware of the study purpose at the time of abstracting the outcome measure data can be employed. Blinding of outcome measure assessment is important even when it seems like the determination of the outcome is black and white. Many outcome assessments are in fact subjective, because the data are not perfect such that judgments have to be made along the way. While identifying mortality may be quite clear in most cases, there are situations where the data may be less reliable. More difficult is identifying the cause of death, if that is an outcome measure.
Missing data – For every study, some proportion of participants is likely to dropout or be lost to follow-up due to a number of reasons. Loss to follow-up occurs when there is a loss of contact with some participants, so that researchers cannot complete data collection as planned, and do not know why the participants discontinued. Loss to follow-up is a common cause of missing data, especially in long-term studies. An acceptable attrition rate is < 20% for a good quality rating and < 40% for a fair quality rating.
Follow-up long enough for outcomes to occur – Was the follow-up period long enough? The researchers should indicate that they have thought through the disease process in detail when designing their study, such that the period of follow-up is long enough to allow the outcome to occur. If the outcome is mortality associated with hepatitis C, then a follow-up period of only several weeks is likely to be inadequate. If the researchers have not indicated reasoning for their selection of follow-up period, then you need to consider this determination.
Consider/adjust for potential important confounders – A confounder is a characteristic of study subjects that is a common cause of the exposure and the outcome. Researchers need to identify what potential confounders are possible given their study and when possible adjust for these confounders using statistical analysis.
Clear definition of prognostic factors* – In addition to these quality criteria, the evaluation of prediction modeling studies required that they provided a clear definitions of prognostic factors (1 extra criterion). The most important criteria for these studies were: comparable groups that included clear inclusion and exclusion criteria; clear definitions of the prognostic factors; adjustment (as needed, for studies without comparable groups) for confounders. To achieve a good rating, minimally, the study had to meet these three ratings. A study with comparable groups and no need for adjustment could still meet this standard. For studies that only met 2 of these 3 criteria, the highest rating they could achieve was fair.
H-10

Appendix H. Quality Rating Criteria, continued
*For prediction modeling studies only.
H-11
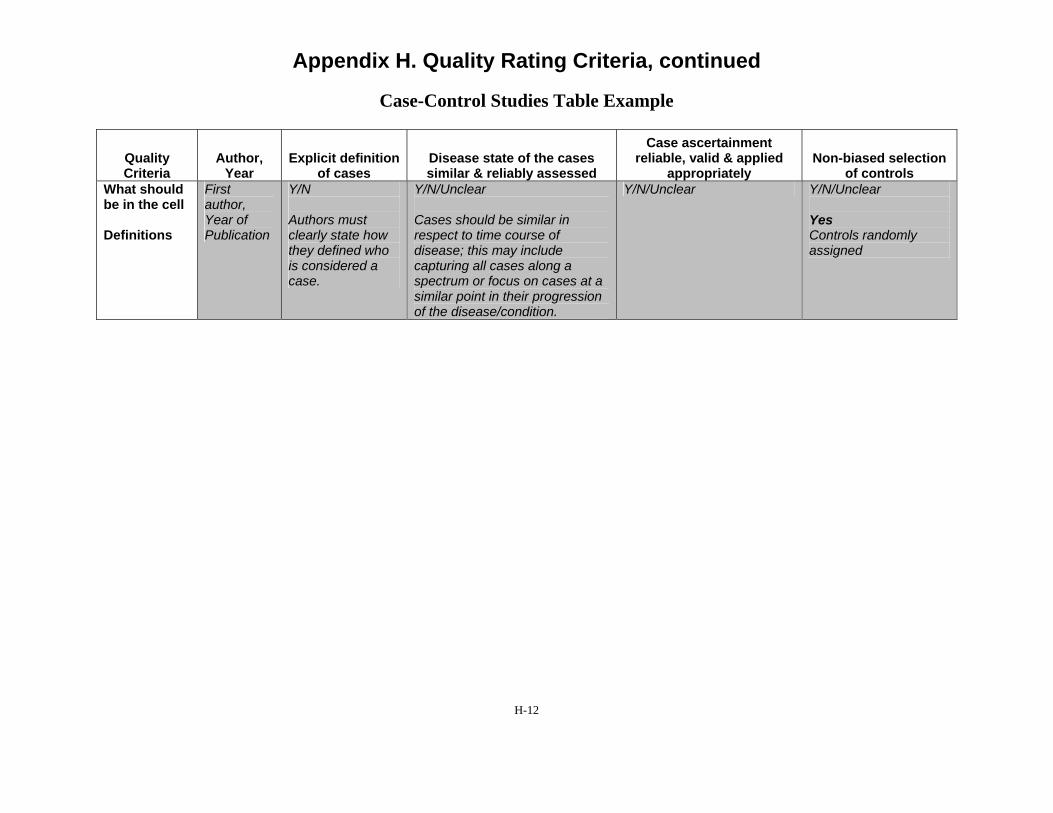
Appendix H. Quality Rating Criteria, continued
Case-Control Studies Table Example
Quality Criteria
Author, Year
Explicit definition of cases
Disease state of the cases similar & reliably assessed
Case ascertainment reliable, valid & applied
appropriately Non-biased selection
of controls What should be in the cell
Definitions
First author, Year of Publication
Y/N
Authors must clearly state how they defined who is considered a case.
Y/N/Unclear
Cases should be similar in respect to time course of disease; this may include capturing all cases along a spectrum or focus on cases at a similar point in their progression of the disease/condition.
Y/N/Unclear Y/N/Unclear
Yes Controls randomly assigned
H-12
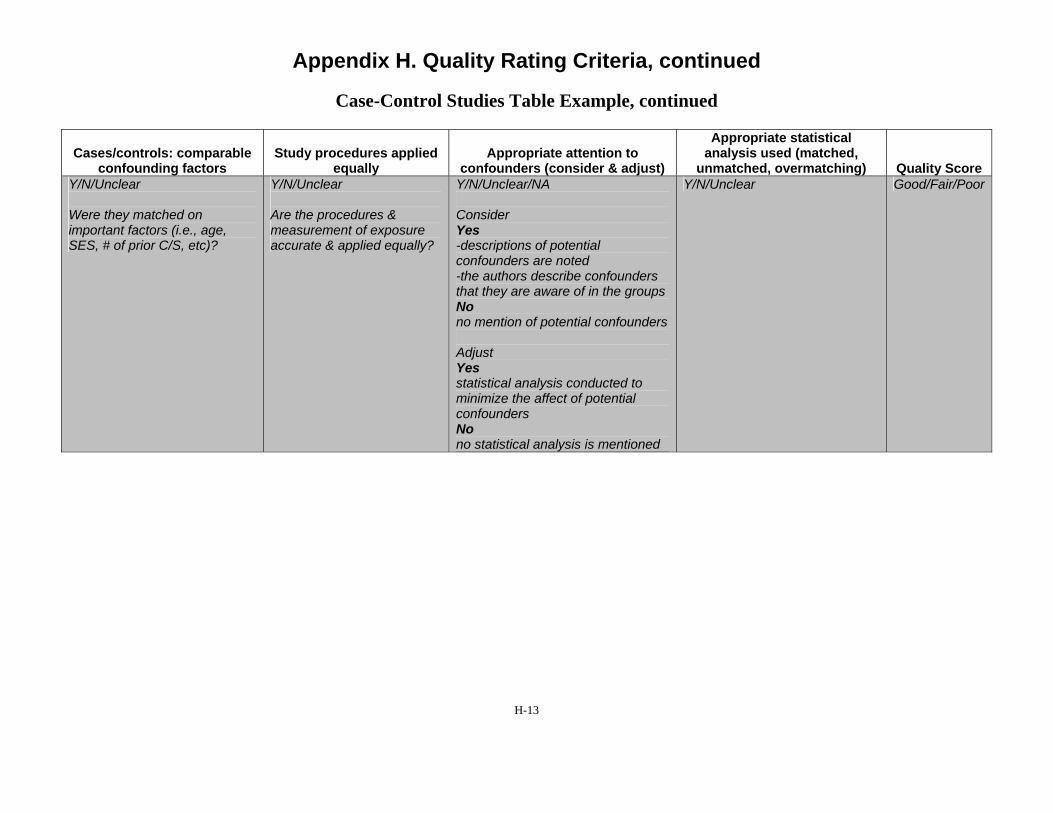
Appendix H. Quality Rating Criteria, continued
Case-Control Studies Table Example, continued
Cases/controls: comparable confounding factors
Study procedures applied equally
Appropriate attention to confounders (consider & adjust)
Appropriate statistical analysis used (matched,
unmatched, overmatching) Quality Score Y/N/Unclear
Were they matched on important factors (i.e., age, SES, # of prior C/S, etc)?
Y/N/Unclear
Are the procedures & measurement of exposure accurate & applied equally?
Y/N/Unclear/NA
Consider Yes -descriptions of potential confounders are noted -the authors describe confounders that they are aware of in the groups No no mention of potential confounders
Adjust Yes statistical analysis conducted to minimize the affect of potential confounders No no statistical analysis is mentioned
Y/N/Unclear Good/Fair/Poor
H-13

Appendix H. Quality Rating Criteria, continued
Case-Control Studies Descriptors
Explicit definition of cases – It is important to ensure that the authors clearly state how they defined who would be considered a case and that these cases are determined by outcome (e.g. cancer). A case definition may not be a definitive health outcome but rather an intermediate outcome such as in the case of uterine rupture for obstetric research.
Disease state of the cases similar and reliably assessed – When there is a spectrum of disease such as in the case of cancer or neurologic injury of a fetus, considerations of whether the cases are similar to one another in relation to time course of disease is important to consider. Depending on the stated objective, you may wish to capture all cases along the spectrum or to focus such that cases are at a similar point in their progression of disease.
Case ascertainment reliable, valid and applied appropriately – How did the authors assess whether the patient was a case, how reliable is this method, and how did they ascertain cases? For example in the case of leukemia research use of ICD-9 codes, not clearly stated, histological evaluation by 2 pathologists, excluded all adopted children (this may be important if you were evaluating the effect of exposure to radiation and this was geographically represented rather than biologically inherited). In the obstetric literature, case control studies have been conducted on cases of uterine rupture. Studies have used ICD-9 codes to ascertain cases, however there are several that may apply. Some of the codes are more specific to uterine rupture while others include not only uterine rupture but also surgical extension of uterine incisions, which is not a uterine rupture. Studies that include the latter would have a consistent mechanism to apply but research has shown that the latter code is unreliable to ascertain cases. The next question once you know what method people use to identify cases is where they apply them. For example, hospitals’ discharge summaries in a single institution, identification from a cancer registry, governmental databases, laboratory pathological diagnoses. Similar to the conceptual cohort idea of the cohort study this is where you are asking whether the methods are likely to capture all cases that would be of interest.
Nonbiased selection of controls – The issue of ensuring that controls are comparable to cases is critical to the quality and reliability of a case control study. Selecting a noncomparable control may skew the results and make then uninterruptable.
Cases/controls: comparable confounding factors – The cases and controls should be comparable with respect to potential confounding factors. Otherwise, the results must be interpreted with this bias in mind.
Study procedures applied equally - Are the procedures & measurement of exposure accurate & applied equally? All measurements should be applied to both cases and controls equally and accurately.
Appropriate attention to confounders (consider & adjust) - A confounder is a characteristic of study subjects that is a risk factor (determinant) for the outcome to the putative cause, or is associated (in a statistical sense) with exposure to the putative cause. Researchers need to
H-14

Appendix H. Quality Rating Criteria, continued
identify what potential confounders are possible given their study and when possible adjust for these confounders using statistical analysis.
Appropriate statistical analysis used (matched, unmatched, overmatching) – Was the method used for statistical analysis appropriate? Did the researchers match their controls and cases appropriately? Beware of overmatching by researchers as well, when they match the subjects on too many variables making the results uninterruptable as well.
H-15
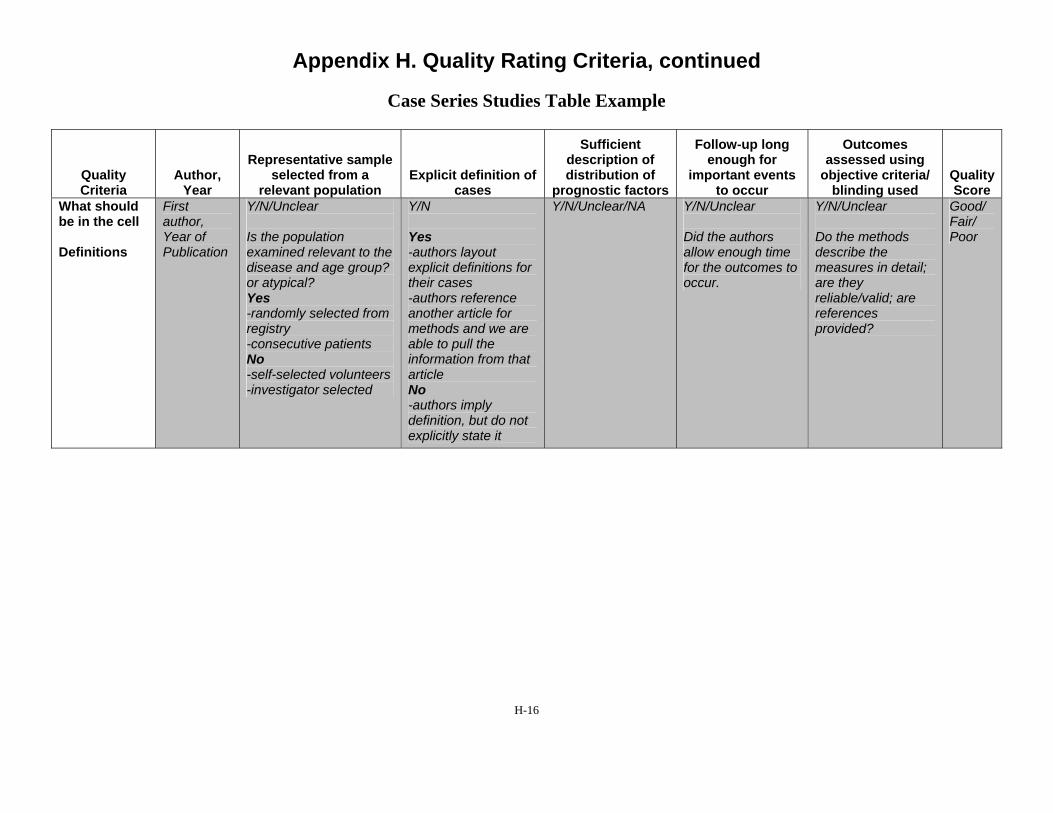
Appendix H. Quality Rating Criteria, continued
Case Series Studies Table Example
Sufficient Follow-up long Outcomes Representative sample description of enough for assessed using
Quality Author, selected from a Explicit definition of distribution of important events objective criteria/ Quality Criteria Year relevant population cases prognostic factors to occur blinding used Score
What should First Y/N/Unclear Y/N Y/N/Unclear/NA Y/N/Unclear Y/N/Unclear Good/ be in the cell author,
Year of Is the population Yes Did the authors Do the methods Fair/ Poor
Definitions Publication examined relevant to the -authors layout allow enough time describe the disease and age group? or atypical?
explicit definitions for their cases
for the outcomes to occur.
measures in detail; are they
Yes -randomly selected from
-authors reference another article for
reliable/valid; are references
registry methods and we are provided? -consecutive patients No -self-selected volunteers
able to pull the information from that article
-investigator selected No -authors imply definition, but do not explicitly state it
H-16

Appendix H. Quality Rating Criteria, continued
Case Series Studies Descriptors
Representative sample selected from a relevant population – For case series studies, the cases being selected must be representative of the overall population. This will require the judgment of experts in the particular subject matter being studied to understand if the cases represent the broader population they are being drawn from. The researchers need to describe the overall population and how their cases are a representative sample of this overall population.
Explicit definition of cases – It is important to ensure that the authors clearly state how they defined who will be considered a case and that these cases are determined by outcome (e.g. cancer). A case definition may not be a definitive health outcome but rather an intermediate outcome such as in the case of uterine rupture for obstetric research.
Sufficient description of distribution of prognostic factors – A prognostic factor is a situation or condition, or a characteristic of a patient, that can be used to estimate the chance of recovery from a disease or the chance of the disease recurring. The researchers should explicitly describe the prognostic factors that are relevant to the group(s).
Follow-up long enough for important outcomes to occur – Was the follow-up period long enough? The researchers should indicate that they have thought through the disease process in detail when designing their study, such that the period of follow-up is long enough to allow the outcome to occur. If the outcome is success of a trial of labor in a pregnant woman with a previous cesarean delivery, then a follow-up period of only several hours is adequate. However, if the outcome is neurological sequelae in the infant, then a much longer period of follow-up is necessary, possibly years are required. If the researchers have not indicated reasoning for their selection of follow-up period, then you will need to consider this determination.
Outcomes assessed using objective criteria/blinding used – Were the outcome assessors blinded to which group the patient belonged? Those making determinations of whether an outcome occurred or not should ideally be unaware of which group that patient was in. This can be achieved in most cases. When the outcomes are being assessed retrospectively, the researcher recording outcome measure should be looking only at outcome data, separated from intervention data. If this is truly not possible, for example, the outcome data are described in such a way that the group the patient is in is apparent, then researches who are not aware of the study purpose at the time of abstracting the outcome measure data can be employed. Blinding of outcome measure assessment is important even when it seems like the determination of the outcome is black and white. Many outcome assessments are in fact subjective, because the data are not perfect such that judgments have to be made along the way. While identifying mortality may be quite clear in most cases, there are situations where the data may be less reliable. More difficult is identifying the cause of death, if that is an outcome measure.
H-17

Appendix H. Quality Rating Criteria, continued
Rating Determinations2
Good (low risk of bias). These studies have the least bias and results are considered valid. A study that adheres mostly to the commonly held concepts of high quality including the following: a formal randomized controlled study; clear description of the population, setting, interventions, and comparison groups; appropriate measurement of outcomes; appropriate statistical and analytic methods and reporting; no reporting errors; low dropout rate; and clear reporting of dropouts.
Fair. These studies are susceptible to some bias, but it is not sufficient to invalidate the results. They do not meet all the criteria required for a rating of good quality because they have some deficiencies, but no flaw is likely to cause major bias. The study may be missing information, making it difficult to assess limitations and potential problems.
Poor (high risk of bias). These studies have significant flaws that imply biases of various types that may invalidate the results. They have serious errors in design, analysis, or reporting; large amounts of missing information; or discrepancies in reporting.
H-18

Appendix H. Quality Rating Criteria, continued
References
1. Adapted from: Deeks JJ, Dinnes J, D'Amico R, et al. Evaluating non-randomised intervention studies. Health Technology Assessment. 2003;7(27):iii-x, 1-173.
2. Agency for Healthcare Research and Quality. Methods Reference Guide for Effectiveness and Comparative Effectiveness Reviews, Version 1.0. Rockville, MD 2007.
H-19
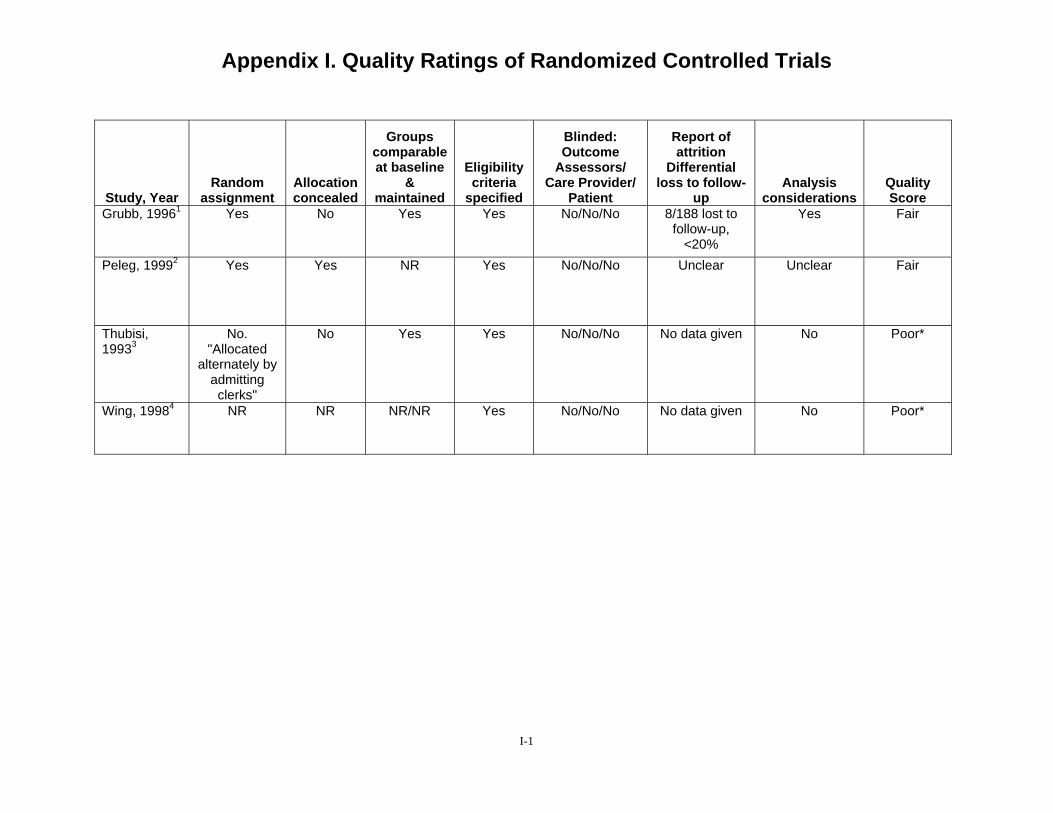
Appendix I. Quality Ratings of Randomized Controlled Trials Study, Year
Random assignment
Allocation concealed
Groups comparable at baseline
& maintained
Eligibility criteria
specified
Blinded: Outcome
Assessors/ Care Provider/
Patient
Report of attrition
Differential loss to follow-
up Analysis
considerations Quality Score
Grubb, 19961 Yes No Yes Yes No/No/No 8/188 lost to follow-up,
<20%
Yes Fair
Peleg, 19992 Yes Yes NR Yes No/No/No Unclear Unclear Fair
Thubisi, 19933
No. "Allocated
alternately by admitting clerks"
No Yes Yes No/No/No No data given No Poor*
Wing, 19984 NR NR NR/NR Yes No/No/No No data given No Poor*
I-1

Appendix I. Quality Ratings of Cohort Studies
Study, Year Assembly of Groups Maintenance of
comparable groups Outcome measures
reliable & valid Outcome assessor blind to
exposure status Amir, 19875 Yes Yes Unclear Unclear
Asakura, 19956 Unclear Unclear Unclear No
Bahtiyar, 20067 Yes Yes No No
Bais, 20018 Yes Unclear Yes Yes
Bashiri, 20089 Yes No Yes Yes
Blanchette, 199910
Yes Unclear Unclear Not reported
Blanchette, 200111
Unclear No No Unclear
Bujold, 200212 Yes No Unclear Unclear
Bujold, 200213 Yes Yes Yes No
Bujold, 200414 Yes Yes Unclear No
I-2
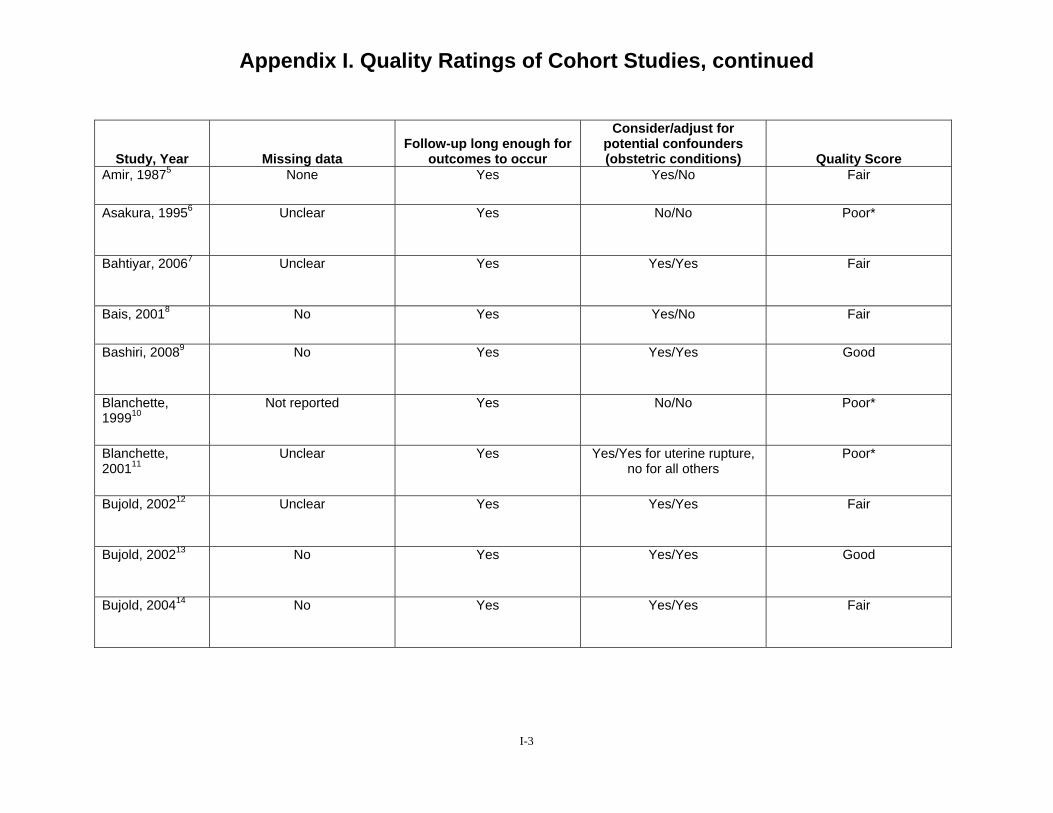
Appendix I. Quality Ratings of Cohort Studies, continued
Study, Year Missing data Follow-up long enough for
outcomes to occur
Consider/adjust for potential confounders (obstetric conditions) Quality Score
Amir, 19875 None Yes Yes/No Fair
Asakura, 19956 Unclear Yes No/No Poor*
Bahtiyar, 20067 Unclear Yes Yes/Yes Fair
Bais, 20018 No Yes Yes/No Fair
Bashiri, 20089 No Yes Yes/Yes Good
Blanchette, 199910
Not reported Yes No/No Poor*
Blanchette, 200111
Unclear Yes Yes/Yes for uterine rupture, no for all others
Poor*
Bujold, 200212 Unclear Yes Yes/Yes Fair
Bujold, 200213 No Yes Yes/Yes Good
Bujold, 200414 No Yes Yes/Yes Fair
I-3
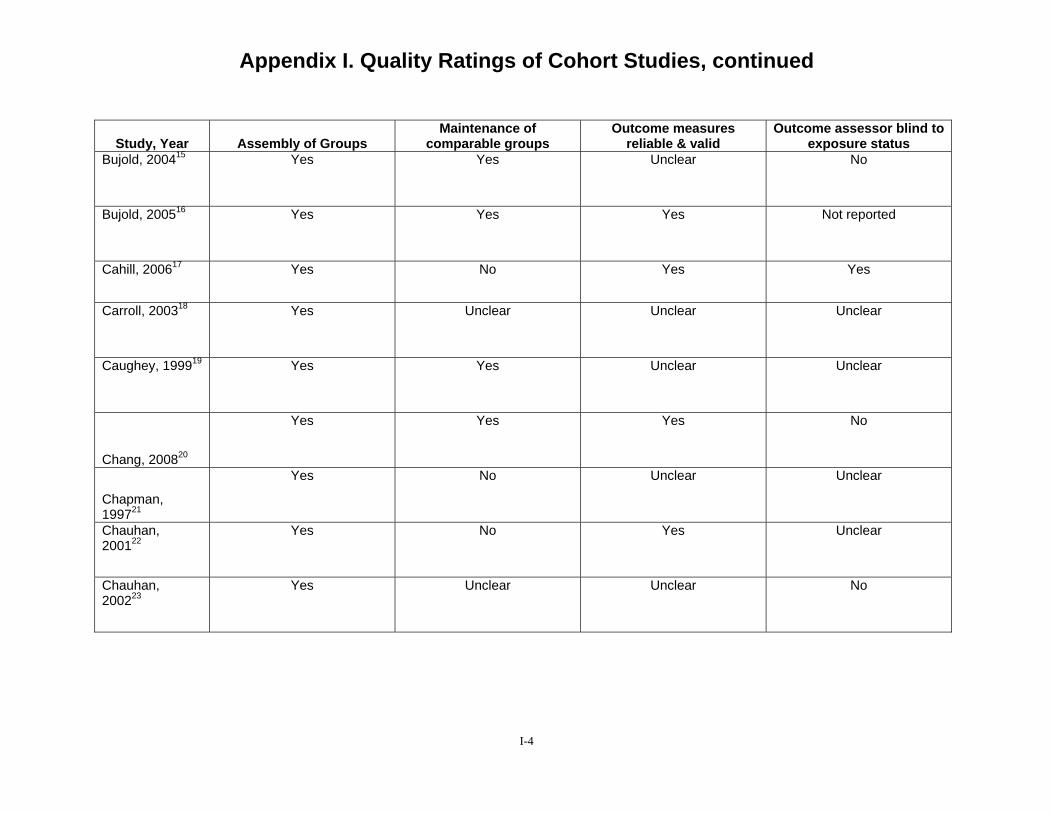
Appendix I. Quality Ratings of Cohort Studies, continued
Study, Year Assembly of Groups Maintenance of
comparable groups Outcome measures
reliable & valid Outcome assessor blind to
exposure status Bujold, 200415 Yes Yes Unclear No
Bujold, 200516 Yes Yes Yes Not reported
Cahill, 200617 Yes No Yes Yes
Carroll, 200318 Yes Unclear Unclear Unclear
Caughey, 199919 Yes Yes Unclear Unclear
Chang, 200820
Yes Yes Yes No
Chapman, 199721
Yes No Unclear Unclear
Chauhan, 200122
Yes No Yes Unclear
Chauhan, 200223
Yes Unclear Unclear No
I-4
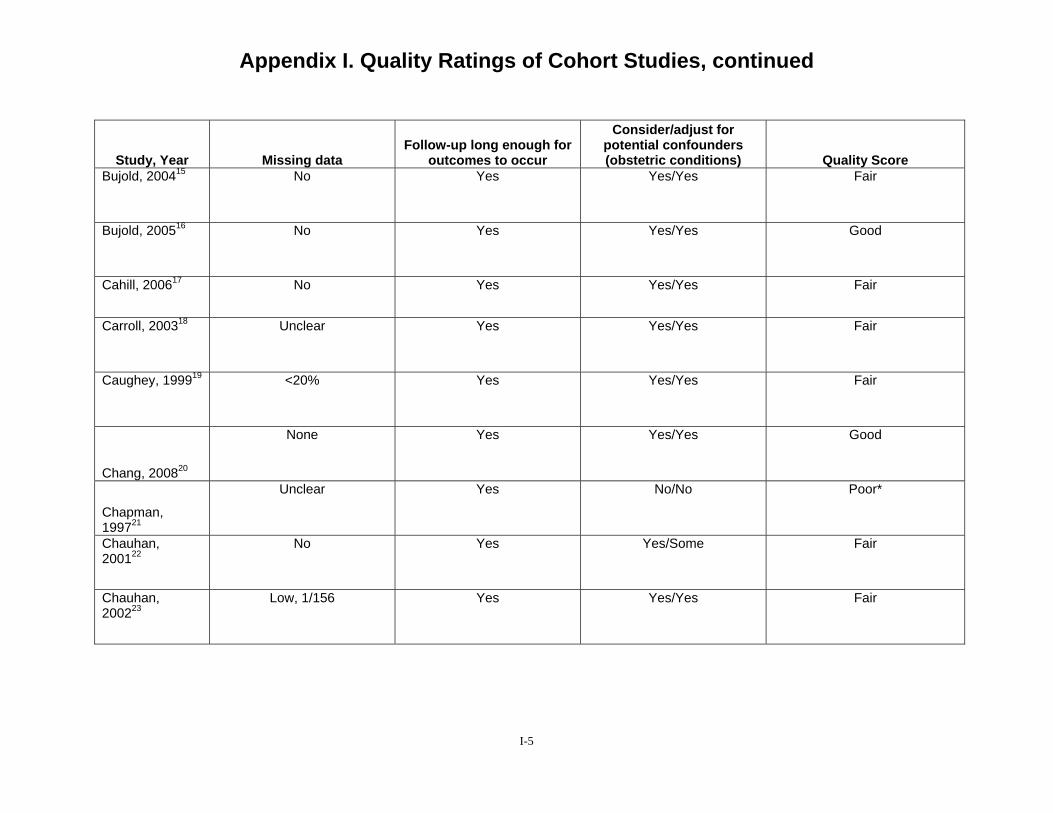
Appendix I. Quality Ratings of Cohort Studies, continued
Study, Year Missing data Follow-up long enough for
outcomes to occur
Consider/adjust for potential confounders (obstetric conditions) Quality Score
Bujold, 200415 No Yes Yes/Yes Fair
Bujold, 200516 No Yes Yes/Yes Good
Cahill, 200617 No Yes Yes/Yes Fair
Carroll, 200318 Unclear Yes Yes/Yes Fair
Caughey, 199919 <20% Yes Yes/Yes Fair
Chang, 200820
None Yes Yes/Yes Good
Chapman, 199721
Unclear Yes No/No Poor*
Chauhan, 200122
No Yes Yes/Some Fair
Chauhan, 200223
Low, 1/156 Yes Yes/Yes Fair
I-5
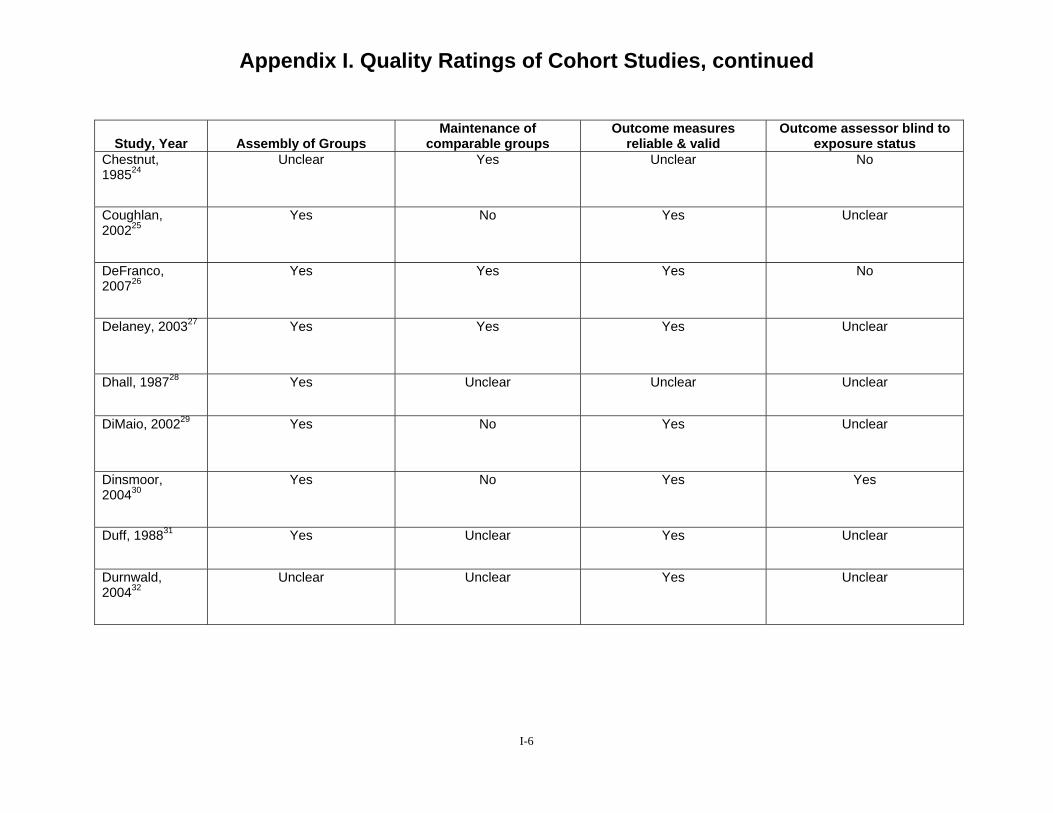
Appendix I. Quality Ratings of Cohort Studies, continued
Study, Year Assembly of Groups Maintenance of
comparable groups Outcome measures
reliable & valid Outcome assessor blind to
exposure status Chestnut, 198524
Unclear Yes Unclear No
Coughlan, 200225
Yes No Yes Unclear
DeFranco, 200726
Yes Yes Yes No
Delaney, 200327 Yes Yes Yes Unclear
Dhall, 198728 Yes Unclear Unclear Unclear
DiMaio, 200229 Yes No Yes Unclear
Dinsmoor, 200430
Yes No Yes Yes
Duff, 198831 Yes Unclear Yes Unclear
Durnwald, 200432
Unclear Unclear Yes Unclear
I-6
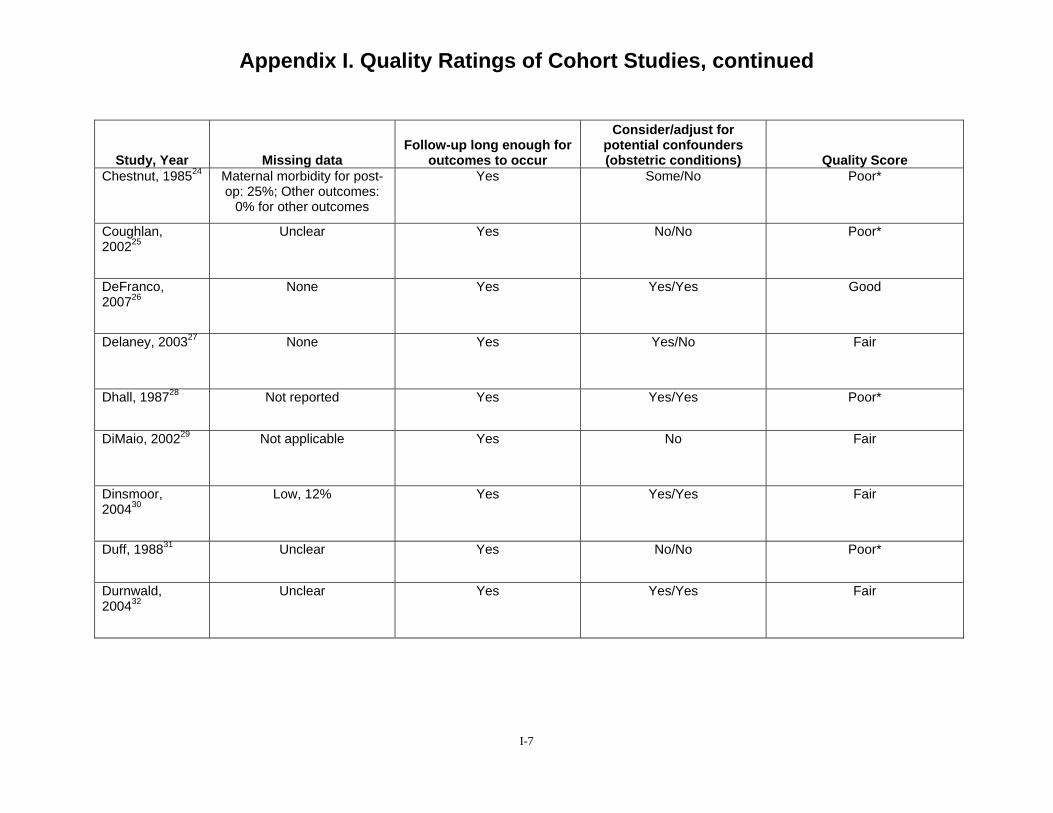
Appendix I. Quality Ratings of Cohort Studies, continued
Study, Year Missing data Follow-up long enough for
outcomes to occur
Consider/adjust for potential confounders (obstetric conditions) Quality Score
Chestnut, 198524 Maternal morbidity for post-op: 25%; Other outcomes:
0% for other outcomes
Yes Some/No Poor*
Coughlan, 200225
Unclear Yes No/No Poor*
DeFranco, 200726
None Yes Yes/Yes Good
Delaney, 200327 None Yes Yes/No Fair
Dhall, 198728 Not reported Yes Yes/Yes Poor*
DiMaio, 200229 Not applicable Yes No Fair
Dinsmoor, 200430
Low, 12% Yes Yes/Yes Fair
Duff, 198831 Unclear Yes No/No Poor*
Durnwald, 200432
Unclear Yes Yes/Yes Fair
I-7
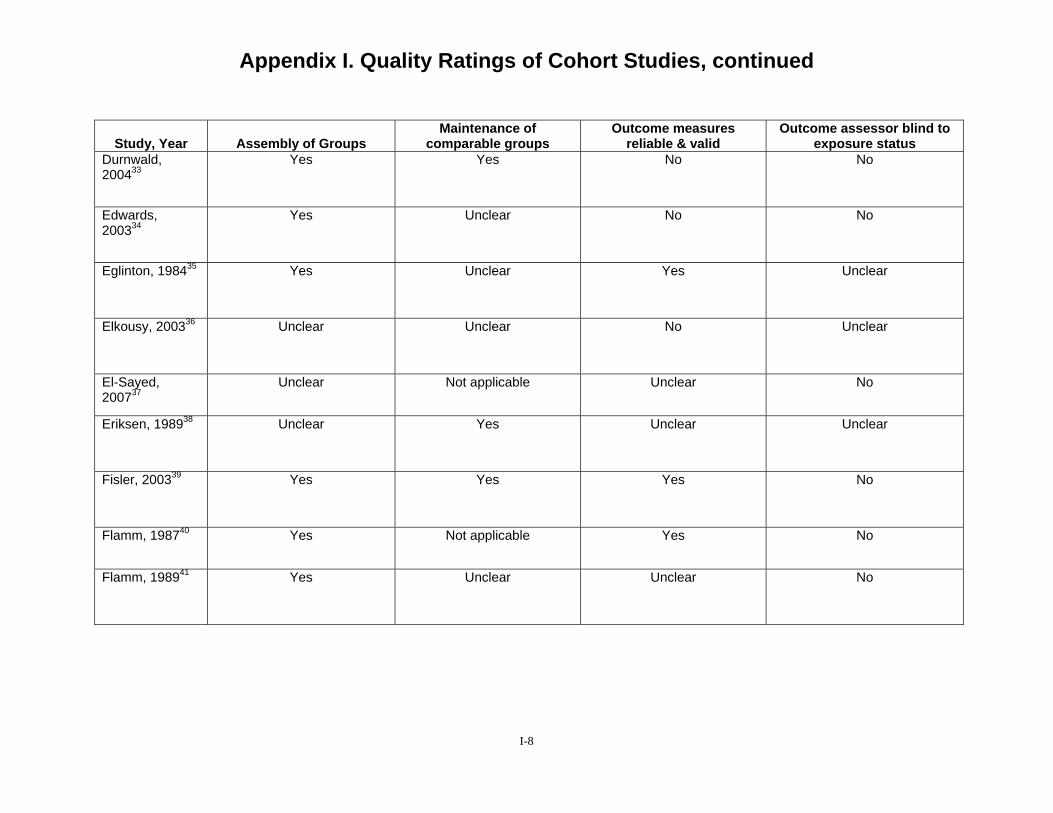
Appendix I. Quality Ratings of Cohort Studies, continued
Study, Year Assembly of Groups Maintenance of
comparable groups Outcome measures
reliable & valid Outcome assessor blind to
exposure status Durnwald, 200433
Yes Yes No No
Edwards, 200334
Yes Unclear No No
Eglinton, 198435 Yes Unclear Yes Unclear
Elkousy, 200336 Unclear Unclear No Unclear
El-Sayed, 200737
Unclear Not applicable Unclear No
Eriksen, 198938 Unclear Yes Unclear Unclear
Fisler, 200339 Yes Yes Yes No
Flamm, 198740 Yes Not applicable Yes No
Flamm, 198941 Yes Unclear Unclear No
I-8

Appendix I. Quality Ratings of Cohort Studies, continued
Study, Year Missing data Follow-up long enough for
outcomes to occur
Consider/adjust for potential confounders (obstetric conditions) Quality Score
Durnwald, 200433
No Yes No/No Fair
Edwards, 200334 No Yes Yes/No Poor*
Eglinton, 198435 Low, 5% Yes Yes/Yes Fair
Elkousy, 200336 Unclear Yes Yes/Yes Fair
El-Sayed, 200737
<20% Yes Yes/Yes Fair
Eriksen, 198938 No Yes Some/No Fair
Fisler, 200339 No Yes Yes/Yes Fair
Flamm, 198740 Not applicable Yes Yes/Yes Fair
Flamm, 198941 No Unclear No/No Poor*
I-9
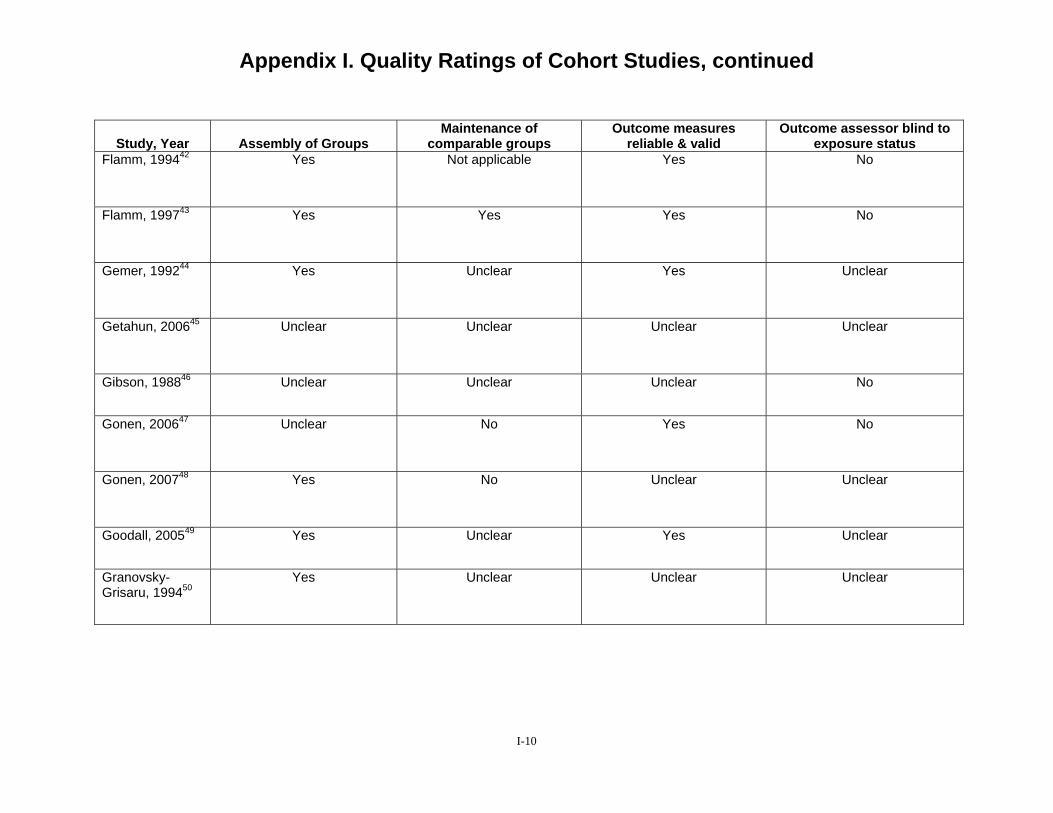
Appendix I. Quality Ratings of Cohort Studies, continued
Study, Year Assembly of Groups Maintenance of
comparable groups Outcome measures
reliable & valid Outcome assessor blind to
exposure status Flamm, 199442 Yes Not applicable Yes No
Flamm, 199743 Yes Yes Yes No
Gemer, 199244 Yes Unclear Yes Unclear
Getahun, 200645 Unclear Unclear Unclear Unclear
Gibson, 198846 Unclear Unclear Unclear No
Gonen, 200647 Unclear No Yes No
Gonen, 200748 Yes No Unclear Unclear
Goodall, 200549 Yes Unclear Yes Unclear
Granovsky-Grisaru, 199450
Yes Unclear Unclear Unclear
I-10
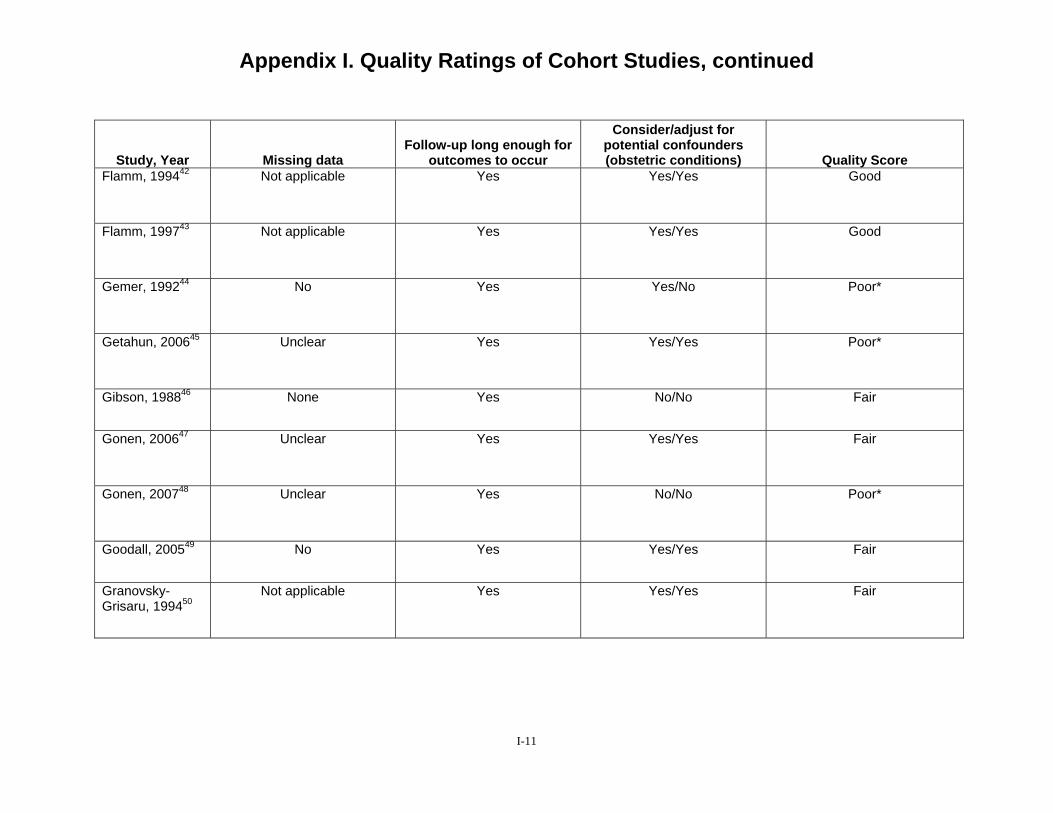
Appendix I. Quality Ratings of Cohort Studies, continued
Study, Year Missing data Follow-up long enough for
outcomes to occur
Consider/adjust for potential confounders (obstetric conditions) Quality Score
Flamm, 199442 Not applicable Yes Yes/Yes Good
Flamm, 199743 Not applicable Yes Yes/Yes Good
Gemer, 199244 No Yes Yes/No Poor*
Getahun, 200645 Unclear Yes Yes/Yes Poor*
Gibson, 198846 None Yes No/No Fair
Gonen, 200647 Unclear Yes Yes/Yes Fair
Gonen, 200748 Unclear Yes No/No Poor*
Goodall, 200549 No Yes Yes/Yes Fair
Granovsky-Grisaru, 199450
Not applicable Yes Yes/Yes Fair
I-11
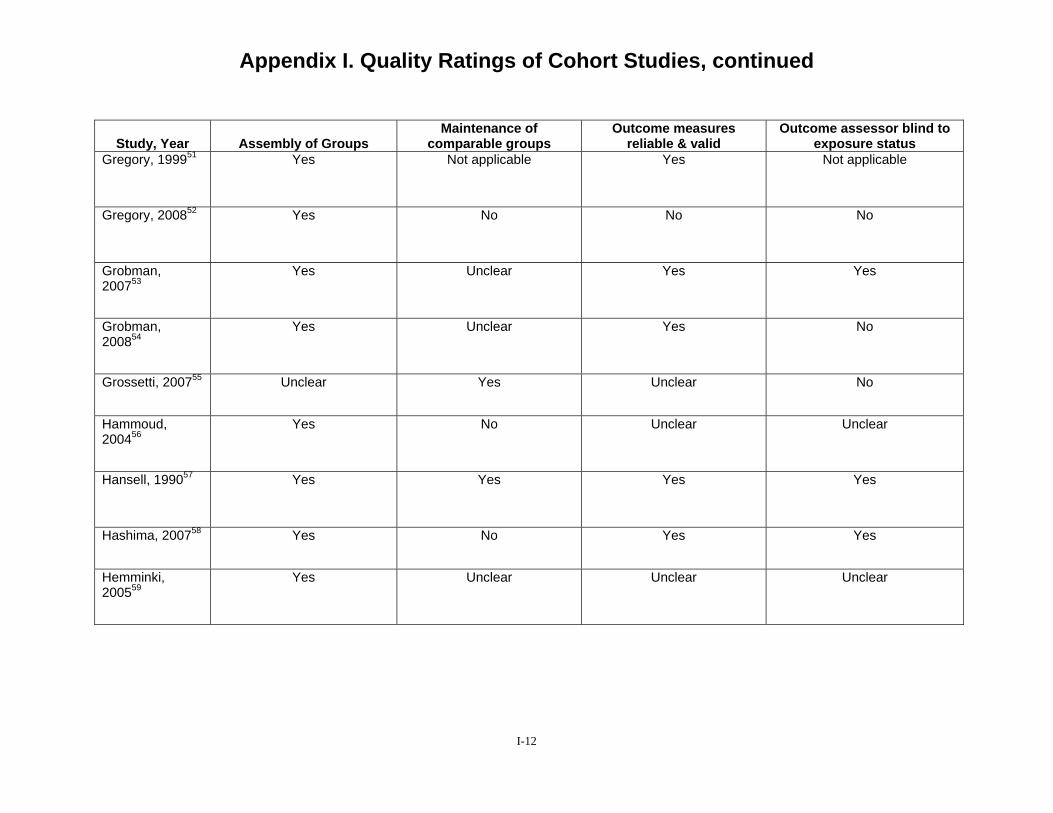
Appendix I. Quality Ratings of Cohort Studies, continued
Study, Year Assembly of Groups Maintenance of
comparable groups Outcome measures
reliable & valid Outcome assessor blind to
exposure status Gregory, 199951 Yes Not applicable Yes Not applicable
Gregory, 200852 Yes No No No
Grobman, 200753
Yes Unclear Yes Yes
Grobman, 200854
Yes Unclear Yes No
Grossetti, 200755 Unclear Yes Unclear No
Hammoud, 200456
Yes No Unclear Unclear
Hansell, 199057 Yes Yes Yes Yes
Hashima, 200758 Yes No Yes Yes
Hemminki, 200559
Yes Unclear Unclear Unclear
I-12
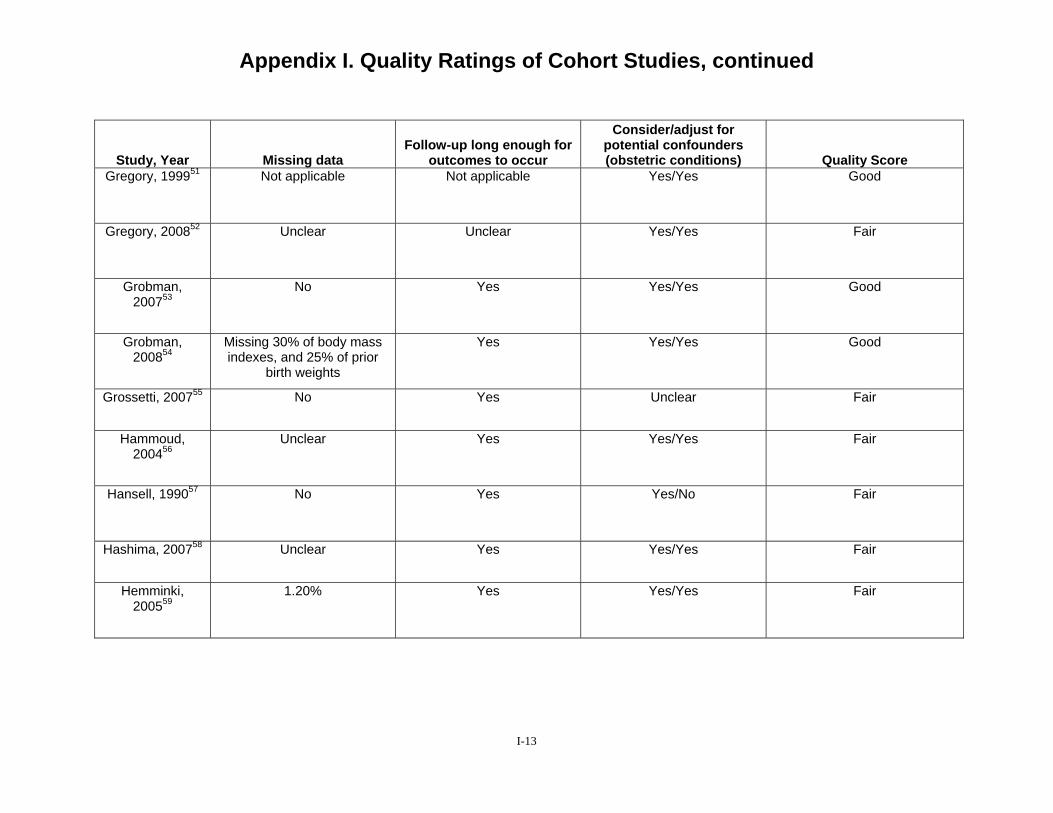
Appendix I. Quality Ratings of Cohort Studies, continued
Study, Year Missing data Follow-up long enough for
outcomes to occur
Consider/adjust for potential confounders (obstetric conditions) Quality Score
Gregory, 199951 Not applicable Not applicable Yes/Yes Good
Gregory, 200852 Unclear Unclear Yes/Yes Fair
Grobman, 200753
No Yes Yes/Yes Good
Grobman, 200854
Missing 30% of body mass indexes, and 25% of prior
birth weights
Yes Yes/Yes Good
Grossetti, 200755 No Yes Unclear Fair
Hammoud, 200456
Unclear Yes Yes/Yes Fair
Hansell, 199057 No Yes Yes/No Fair
Hashima, 200758 Unclear Yes Yes/Yes Fair
Hemminki, 200559
1.20% Yes Yes/Yes Fair
I-13
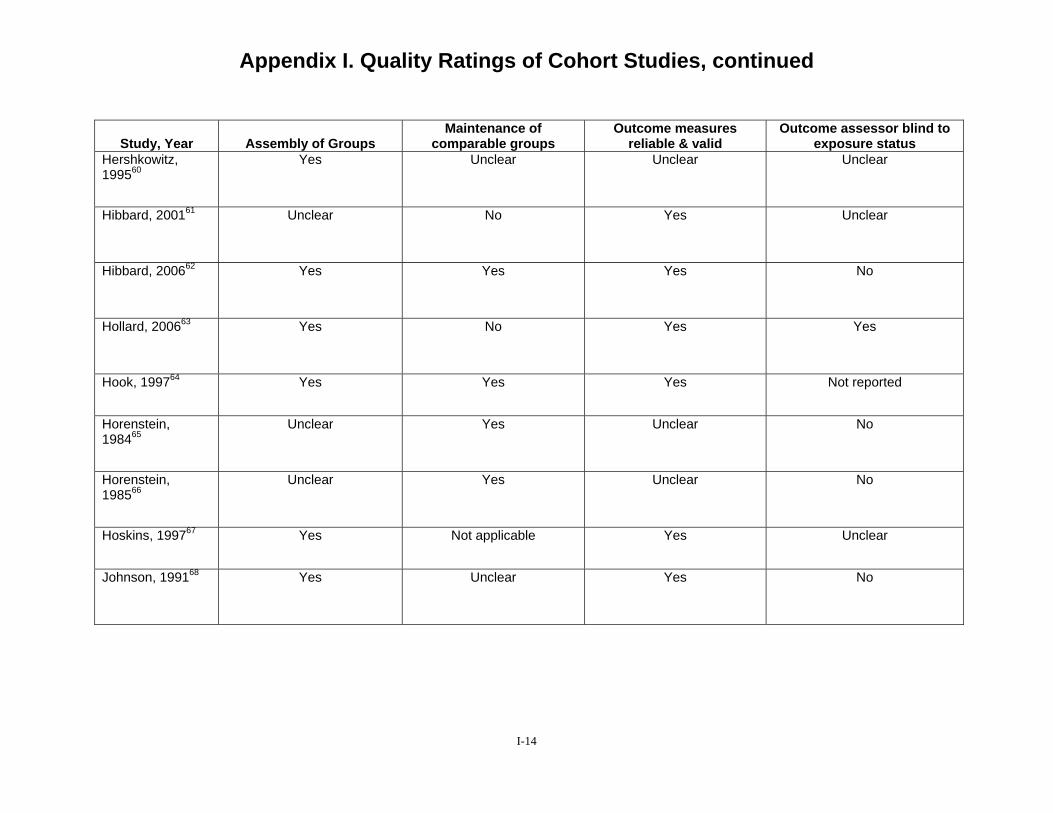
Appendix I. Quality Ratings of Cohort Studies, continued
Study, Year Assembly of Groups Maintenance of
comparable groups Outcome measures
reliable & valid Outcome assessor blind to
exposure status Hershkowitz, 199560
Yes Unclear Unclear Unclear
Hibbard, 200161 Unclear No Yes Unclear
Hibbard, 200662 Yes Yes Yes No
Hollard, 200663 Yes No Yes Yes
Hook, 199764 Yes Yes Yes Not reported
Horenstein, 198465
Unclear Yes Unclear No
Horenstein, 198566
Unclear Yes Unclear No
Hoskins, 199767 Yes Not applicable Yes Unclear
Johnson, 199168 Yes Unclear Yes No
I-14
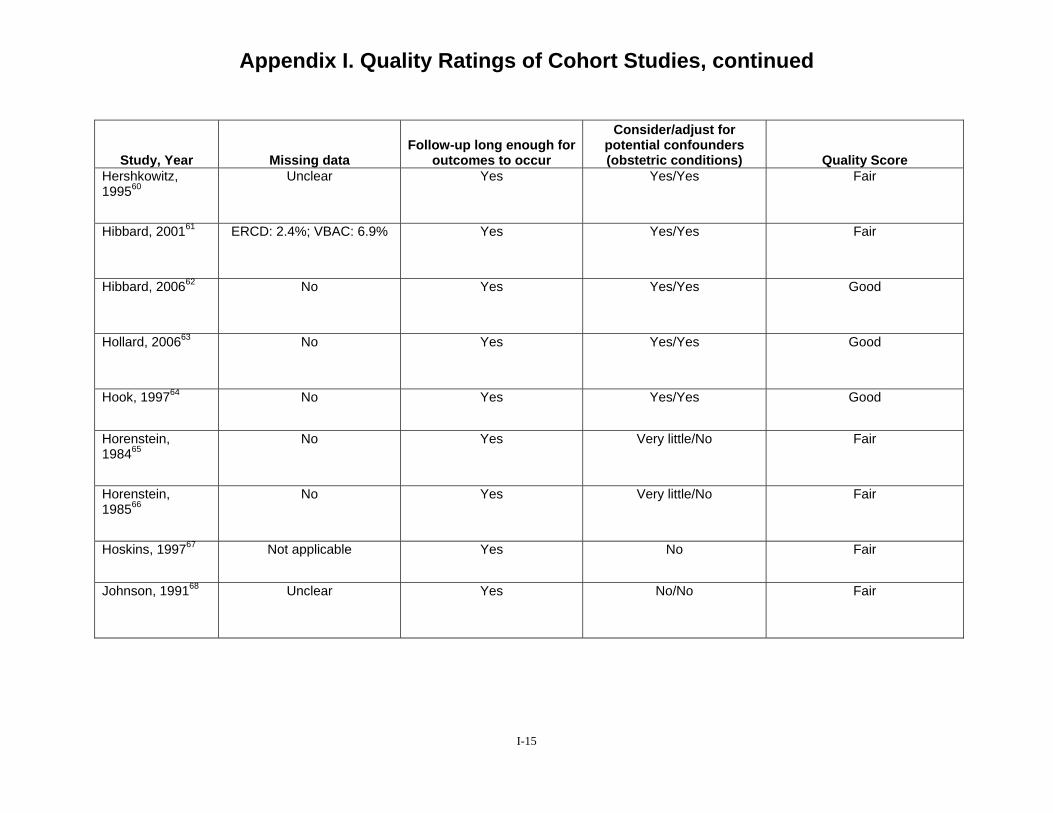
Appendix I. Quality Ratings of Cohort Studies, continued
Study, Year Missing data Follow-up long enough for
outcomes to occur
Consider/adjust for potential confounders (obstetric conditions) Quality Score
Hershkowitz, 199560
Unclear Yes Yes/Yes Fair
Hibbard, 200161 ERCD: 2.4%; VBAC: 6.9% Yes Yes/Yes Fair
Hibbard, 200662 No Yes Yes/Yes Good
Hollard, 200663 No Yes Yes/Yes Good
Hook, 199764 No Yes Yes/Yes Good
Horenstein, 198465
No Yes Very little/No Fair
Horenstein, 198566
No Yes Very little/No Fair
Hoskins, 199767 Not applicable Yes No Fair
Johnson, 199168 Unclear Yes No/No Fair
I-15
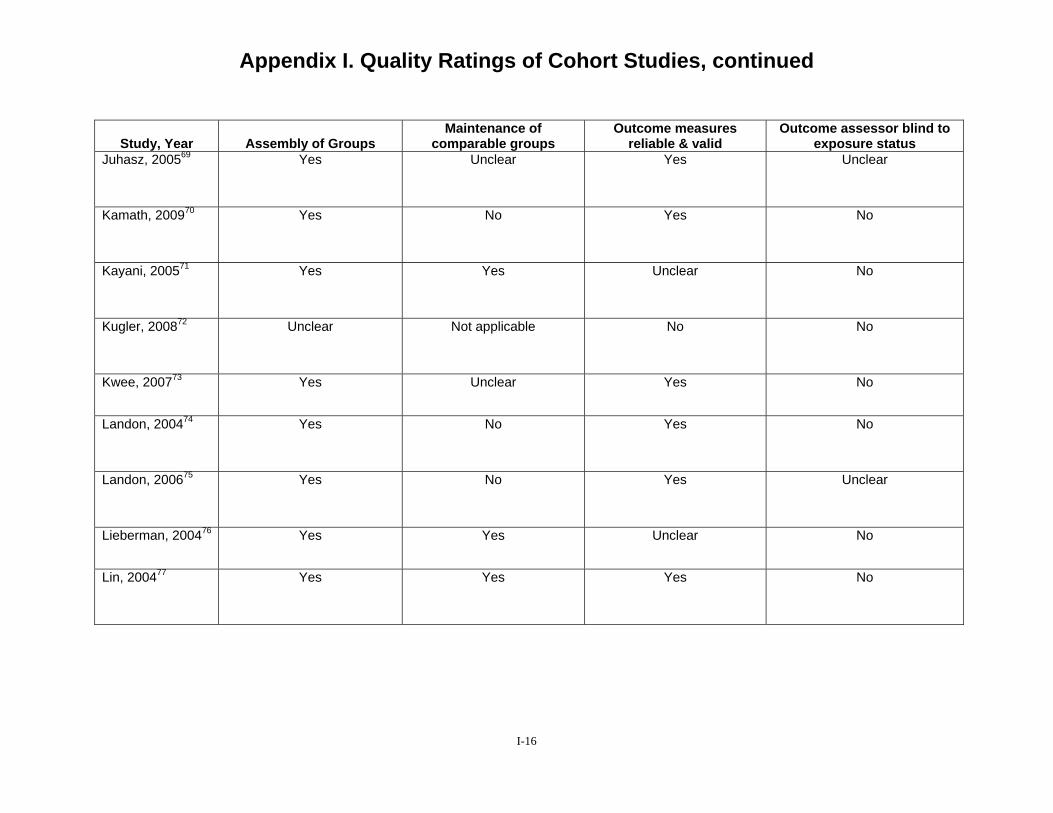
Appendix I. Quality Ratings of Cohort Studies, continued
Study, Year Assembly of Groups Maintenance of
comparable groups Outcome measures
reliable & valid Outcome assessor blind to
exposure status Juhasz, 200569 Yes Unclear Yes Unclear
Kamath, 200970 Yes No Yes No
Kayani, 200571 Yes Yes Unclear No
Kugler, 200872 Unclear Not applicable No No
Kwee, 200773 Yes Unclear Yes No
Landon, 200474 Yes No Yes No
Landon, 200675 Yes No Yes Unclear
Lieberman, 200476 Yes Yes Unclear No
Lin, 200477 Yes Yes Yes No
I-16
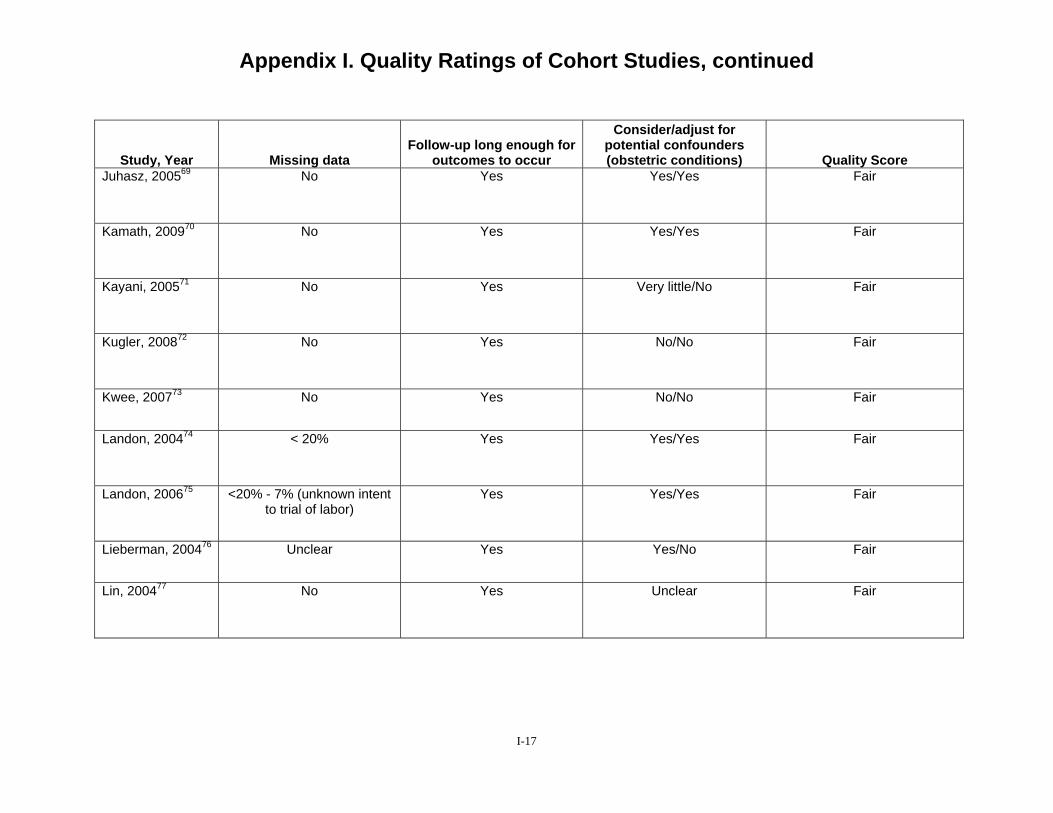
Appendix I. Quality Ratings of Cohort Studies, continued
Study, Year Missing data Follow-up long enough for
outcomes to occur
Consider/adjust for potential confounders (obstetric conditions) Quality Score
Juhasz, 200569 No Yes Yes/Yes Fair
Kamath, 200970 No Yes Yes/Yes Fair
Kayani, 200571 No Yes Very little/No Fair
Kugler, 200872 No Yes No/No Fair
Kwee, 200773 No Yes No/No Fair
Landon, 200474 < 20% Yes Yes/Yes Fair
Landon, 200675 <20% - 7% (unknown intent to trial of labor)
Yes Yes/Yes Fair
Lieberman, 200476 Unclear Yes Yes/No Fair
Lin, 200477 No Yes Unclear Fair
I-17
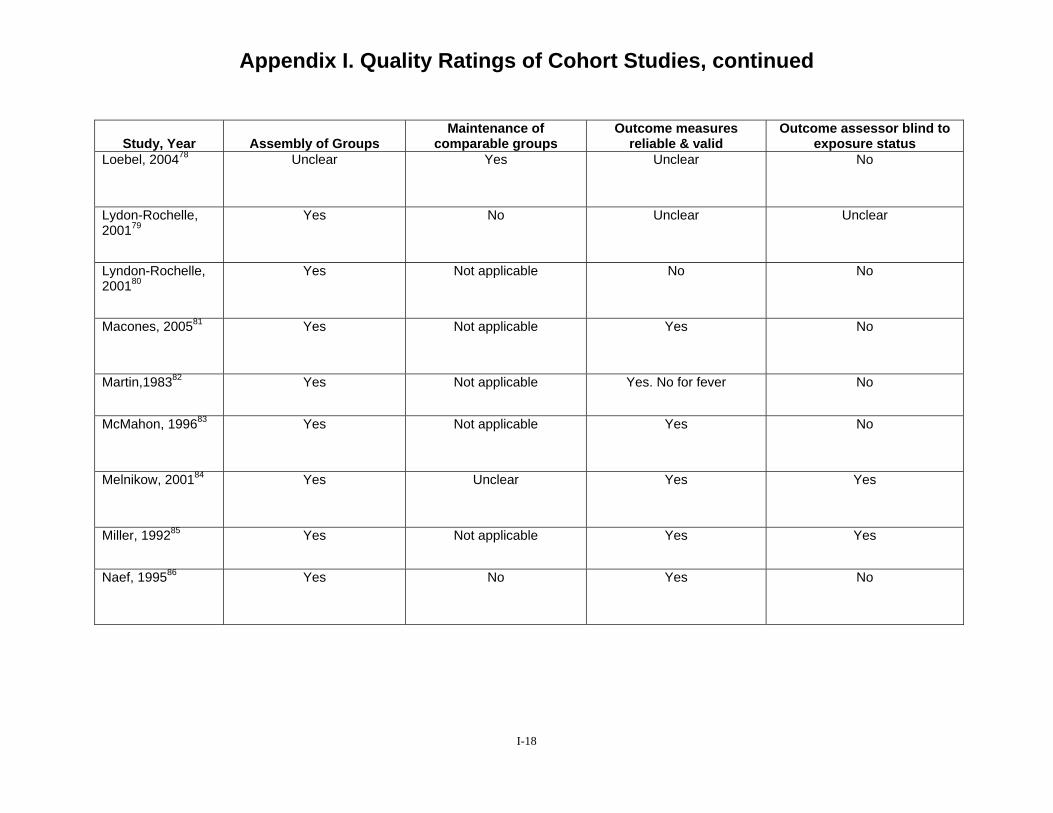
Appendix I. Quality Ratings of Cohort Studies, continued
Study, Year Assembly of Groups Maintenance of
comparable groups Outcome measures
reliable & valid Outcome assessor blind to
exposure status Loebel, 200478 Unclear Yes Unclear No
Lydon-Rochelle, 200179
Yes No Unclear Unclear
Lyndon-Rochelle, 200180
Yes Not applicable No No
Macones, 200581 Yes Not applicable Yes No
Martin,198382 Yes Not applicable Yes. No for fever No
McMahon, 199683 Yes Not applicable Yes No
Melnikow, 200184 Yes Unclear Yes Yes
Miller, 199285 Yes Not applicable Yes Yes
Naef, 199586 Yes No Yes No
I-18
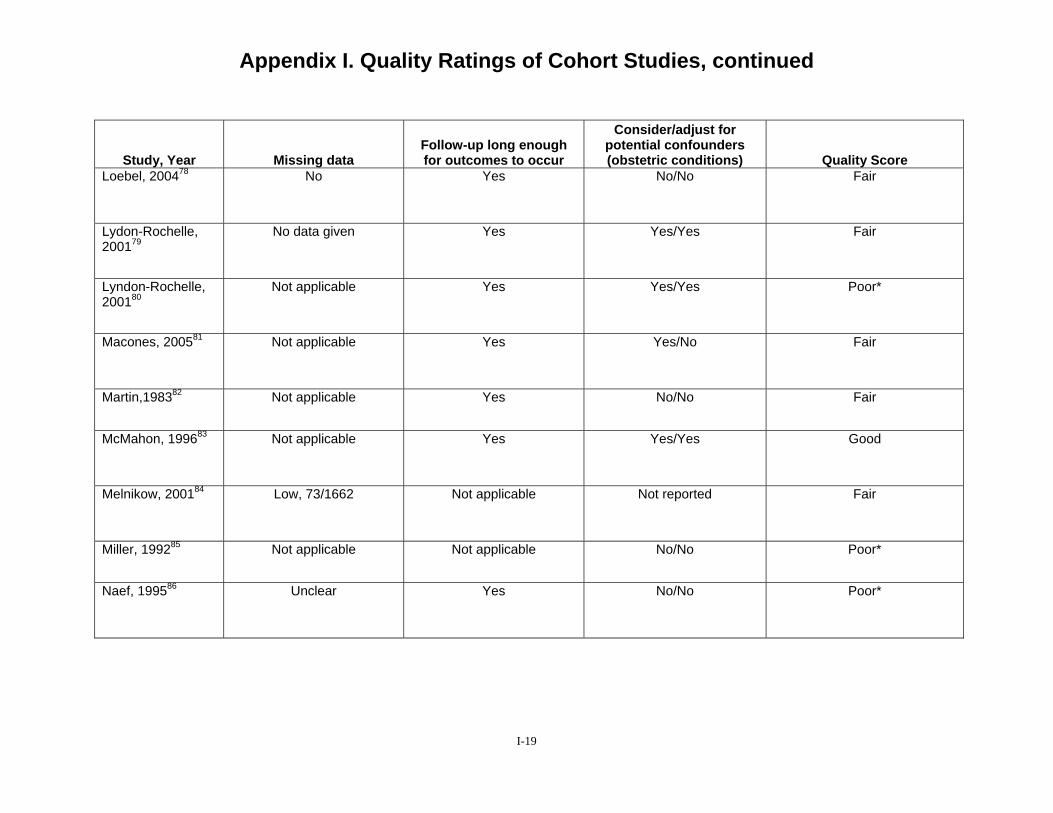
Appendix I. Quality Ratings of Cohort Studies, continued
Study, Year Missing data Follow-up long enough for outcomes to occur
Consider/adjust for potential confounders (obstetric conditions) Quality Score
Loebel, 200478 No Yes No/No Fair
Lydon-Rochelle, 200179
No data given Yes Yes/Yes Fair
Lyndon-Rochelle, 200180
Not applicable Yes Yes/Yes Poor*
Macones, 200581 Not applicable Yes Yes/No Fair
Martin,198382 Not applicable Yes No/No Fair
McMahon, 199683 Not applicable Yes Yes/Yes Good
Melnikow, 200184 Low, 73/1662 Not applicable Not reported Fair
Miller, 199285 Not applicable Not applicable No/No Poor*
Naef, 199586 Unclear Yes No/No Poor*
I-19
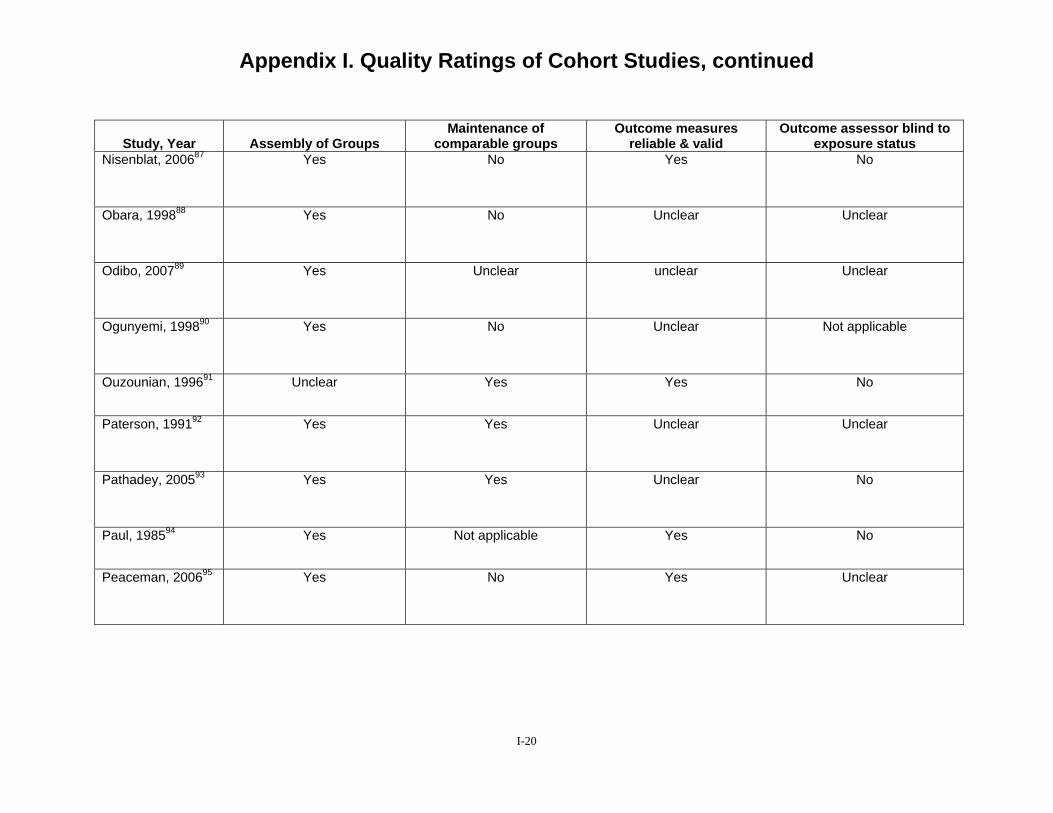
Appendix I. Quality Ratings of Cohort Studies, continued
Study, Year Assembly of Groups Maintenance of
comparable groups Outcome measures
reliable & valid Outcome assessor blind to
exposure status Nisenblat, 200687 Yes No Yes No
Obara, 199888 Yes No Unclear Unclear
Odibo, 200789 Yes Unclear unclear Unclear
Ogunyemi, 199890 Yes No Unclear Not applicable
Ouzounian, 199691 Unclear Yes Yes No
Paterson, 199192 Yes Yes Unclear Unclear
Pathadey, 200593 Yes Yes Unclear No
Paul, 198594 Yes Not applicable Yes No
Peaceman, 200695 Yes No Yes Unclear
I-20
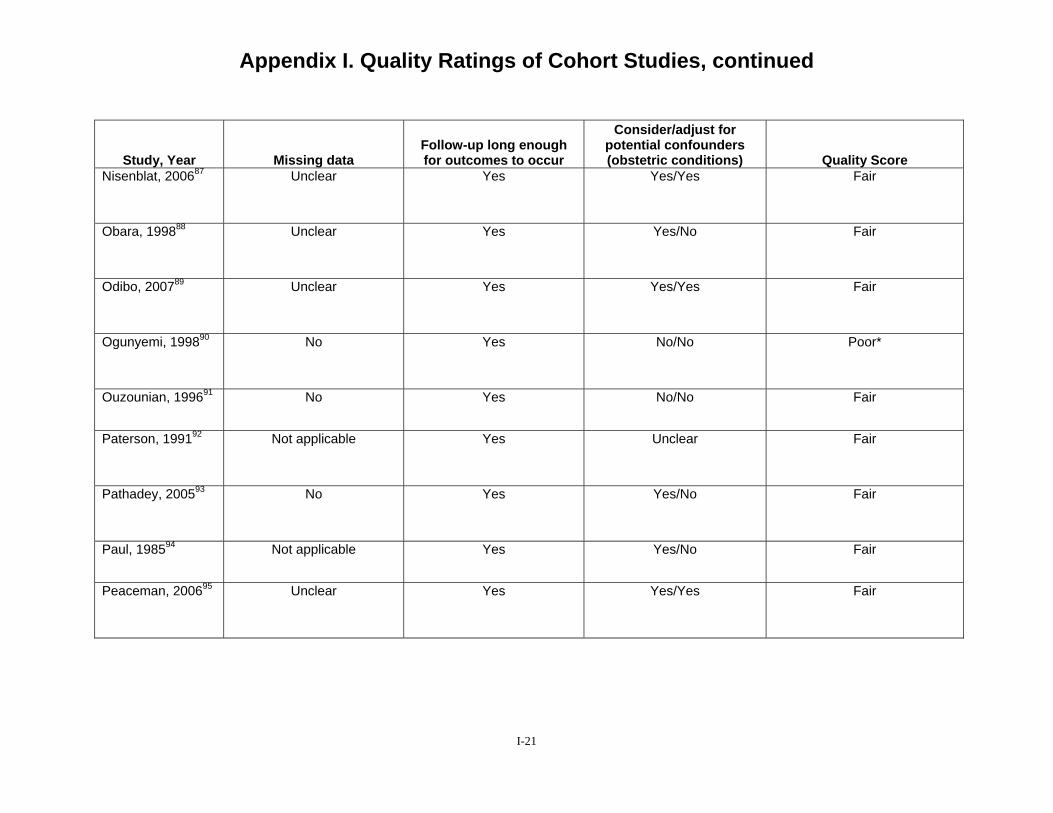
Appendix I. Quality Ratings of Cohort Studies, continued
Study, Year Missing data Follow-up long enough for outcomes to occur
Consider/adjust for potential confounders (obstetric conditions) Quality Score
Nisenblat, 200687 Unclear Yes Yes/Yes Fair
Obara, 199888 Unclear Yes Yes/No Fair
Odibo, 200789 Unclear Yes Yes/Yes Fair
Ogunyemi, 199890 No Yes No/No Poor*
Ouzounian, 199691 No Yes No/No Fair
Paterson, 199192 Not applicable Yes Unclear Fair
Pathadey, 200593 No Yes Yes/No Fair
Paul, 198594 Not applicable Yes Yes/No Fair
Peaceman, 200695 Unclear Yes Yes/Yes Fair
I-21
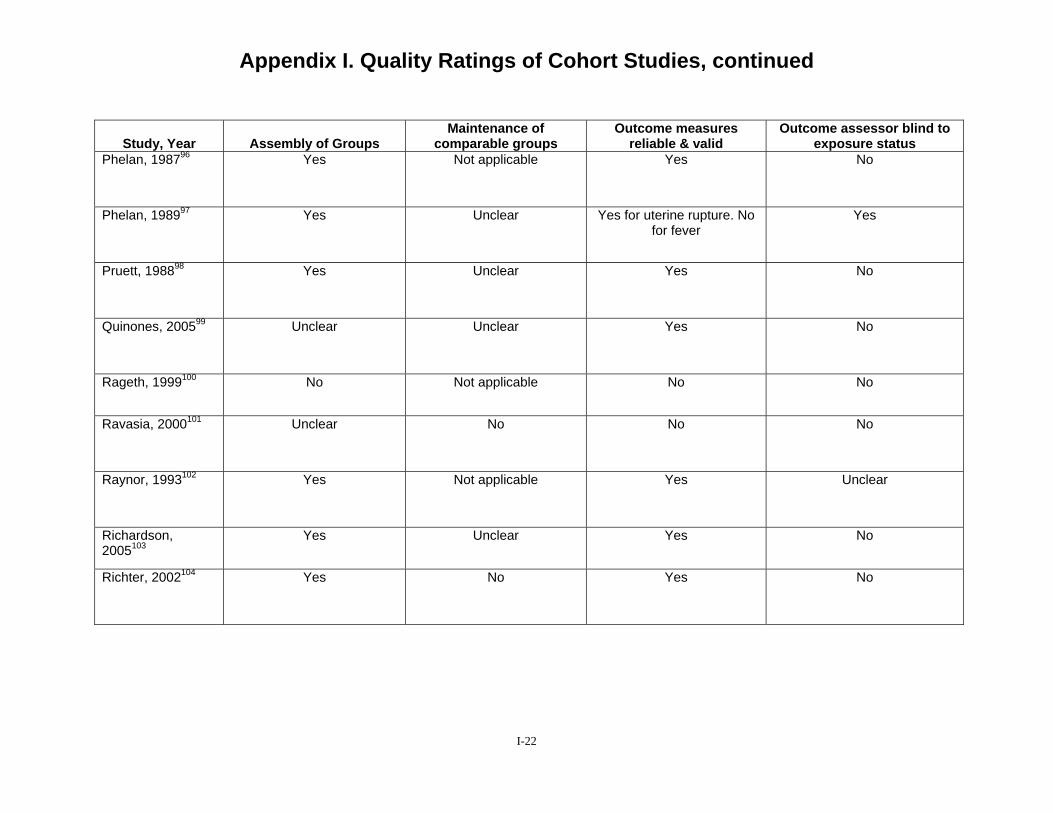
Appendix I. Quality Ratings of Cohort Studies, continued
Study, Year Assembly of Groups Maintenance of
comparable groups Outcome measures
reliable & valid Outcome assessor blind to
exposure status Phelan, 198796 Yes Not applicable Yes No
Phelan, 198997 Yes Unclear Yes for uterine rupture. No for fever
Yes
Pruett, 198898 Yes Unclear Yes No
Quinones, 200599 Unclear Unclear Yes No
Rageth, 1999100 No Not applicable No No
Ravasia, 2000101 Unclear No No No
Raynor, 1993102 Yes Not applicable Yes Unclear
Richardson, 2005103
Yes Unclear Yes No
Richter, 2002104 Yes No Yes No
I-22
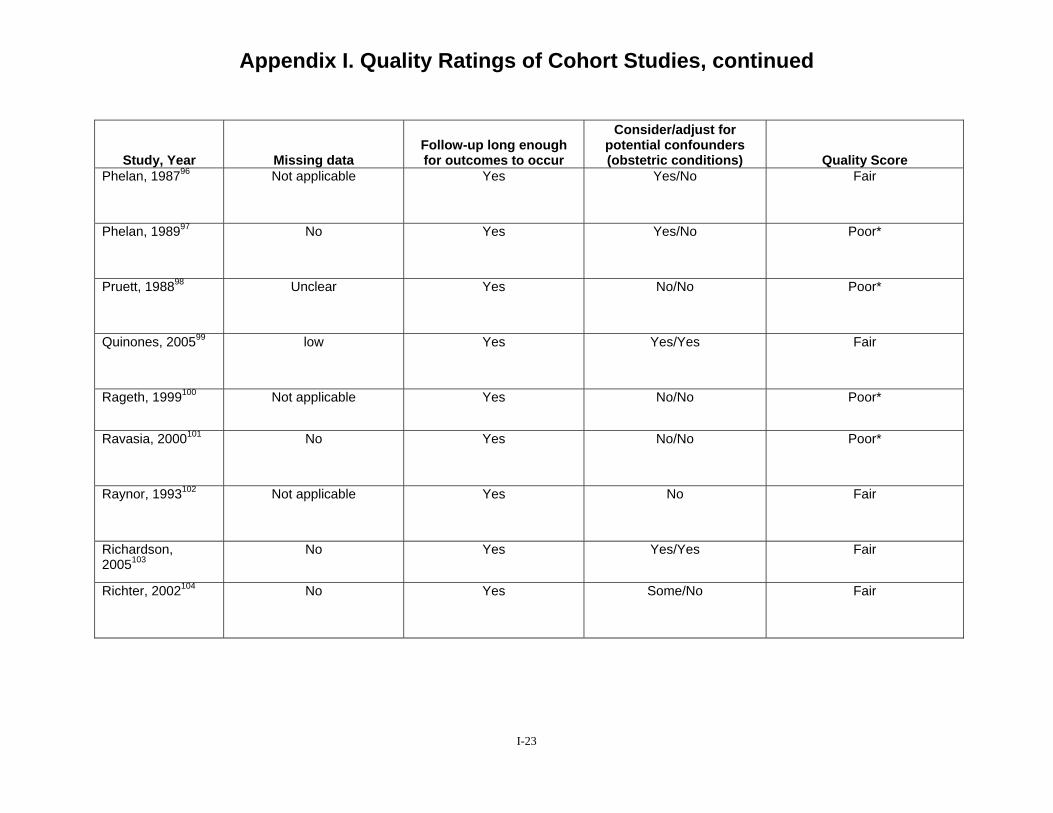
Appendix I. Quality Ratings of Cohort Studies, continued
Study, Year Missing data Follow-up long enough for outcomes to occur
Consider/adjust for potential confounders (obstetric conditions) Quality Score
Phelan, 198796 Not applicable Yes Yes/No Fair
Phelan, 198997 No Yes Yes/No Poor*
Pruett, 198898 Unclear Yes No/No Poor*
Quinones, 200599 low Yes Yes/Yes Fair
Rageth, 1999100 Not applicable Yes No/No Poor*
Ravasia, 2000101 No Yes No/No Poor*
Raynor, 1993102 Not applicable Yes No Fair
Richardson, 2005103
No Yes Yes/Yes Fair
Richter, 2002104 No Yes Some/No Fair
I-23
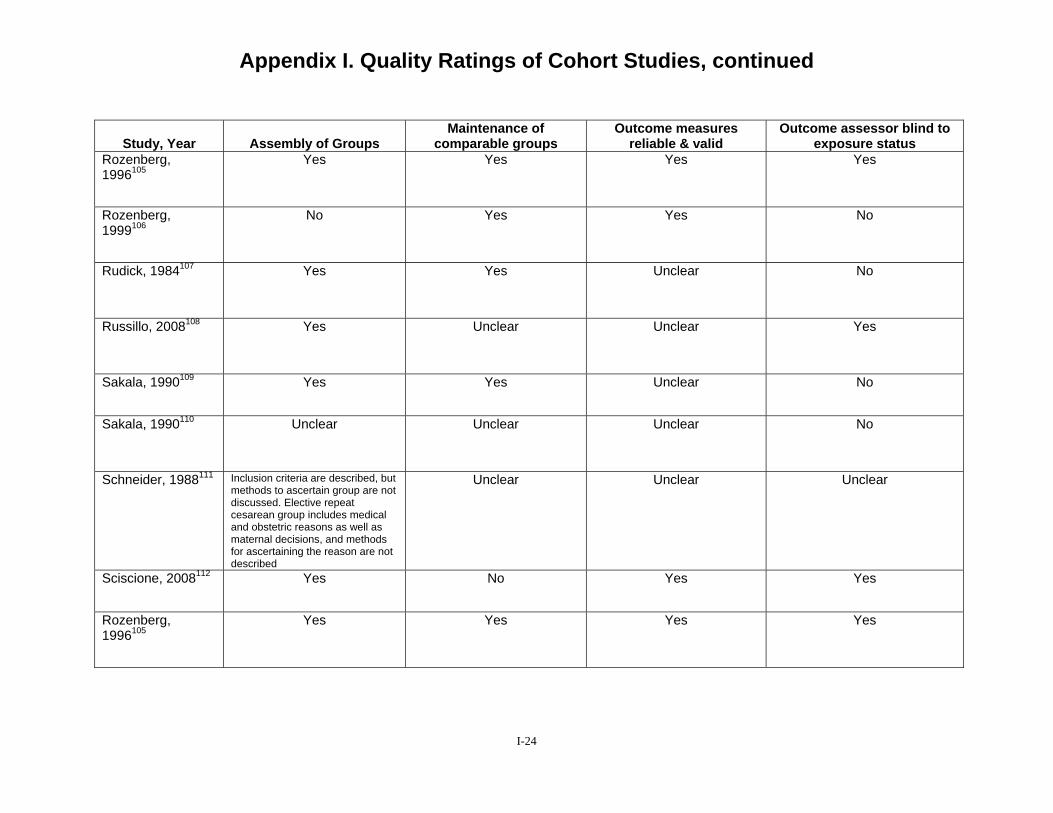
Appendix I. Quality Ratings of Cohort Studies, continued
Study, Year Assembly of Groups Maintenance of
comparable groups Outcome measures
reliable & valid Outcome assessor blind to
exposure status Rozenberg, 1996105
Yes Yes Yes Yes
Rozenberg, 1999106
No Yes Yes No
Rudick, 1984107 Yes Yes Unclear No
Russillo, 2008108 Yes Unclear Unclear Yes
Sakala, 1990109 Yes Yes Unclear No
Sakala, 1990110 Unclear Unclear Unclear No
Schneider, 1988111 Inclusion criteria are described, but methods to ascertain group are not discussed. Elective repeat cesarean group includes medical and obstetric reasons as well as maternal decisions, and methods for ascertaining the reason are not described
Unclear Unclear Unclear
Sciscione, 2008112 Yes No Yes Yes
Rozenberg, 1996105
Yes Yes Yes Yes
I-24
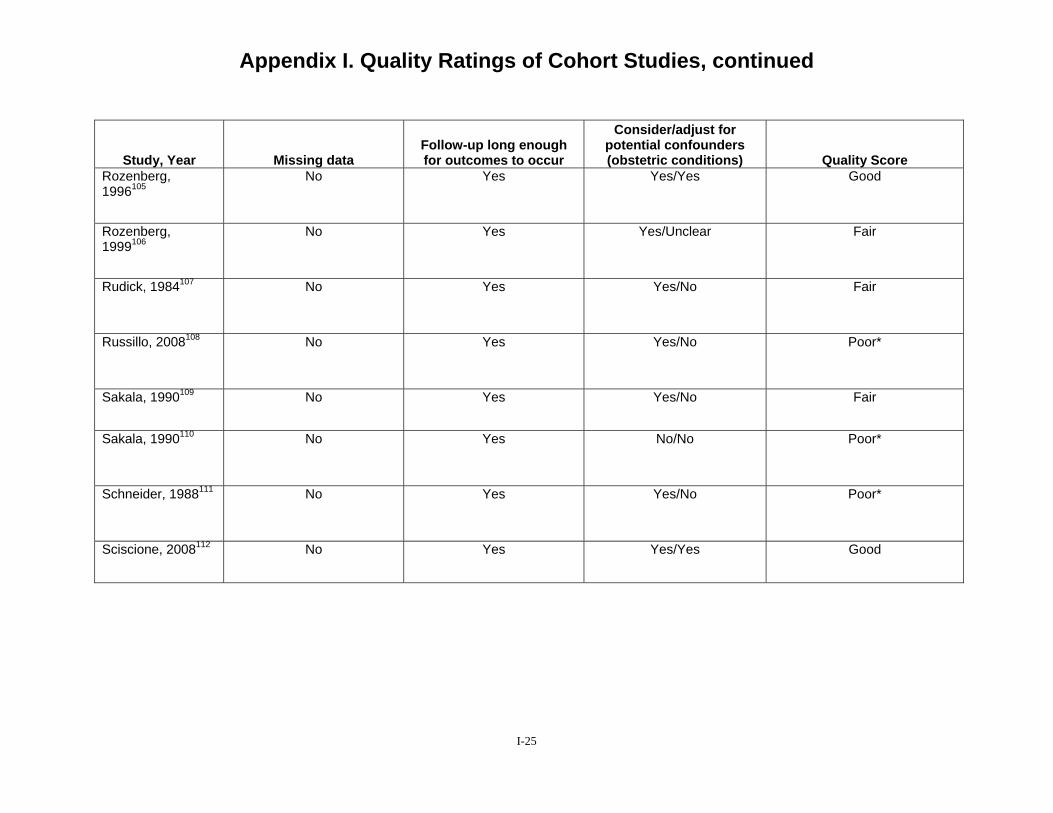
Appendix I. Quality Ratings of Cohort Studies, continued
Study, Year Missing data Follow-up long enough for outcomes to occur
Consider/adjust for potential confounders (obstetric conditions) Quality Score
Rozenberg, 1996105
No Yes Yes/Yes Good
Rozenberg, 1999106
No Yes Yes/Unclear Fair
Rudick, 1984107 No Yes Yes/No Fair
Russillo, 2008108 No Yes Yes/No Poor*
Sakala, 1990109 No Yes Yes/No Fair
Sakala, 1990110 No Yes No/No Poor*
Schneider, 1988111 No Yes Yes/No Poor*
Sciscione, 2008112 No Yes Yes/Yes Good
I-25
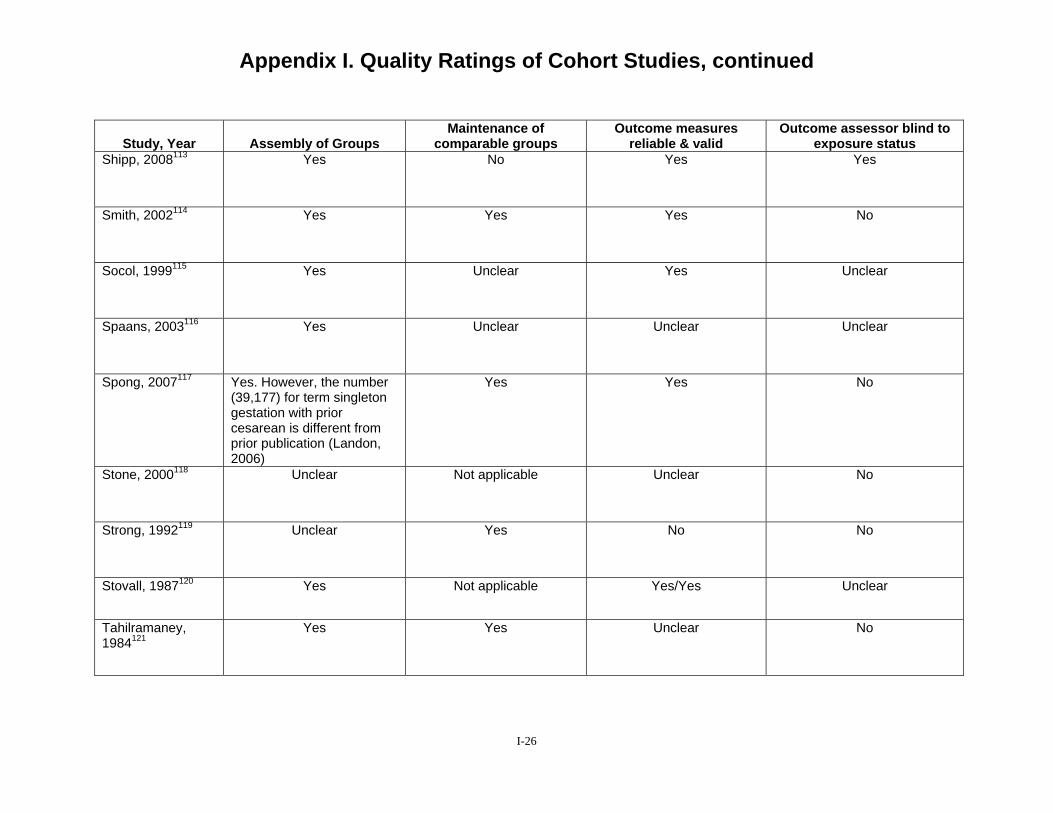
Appendix I. Quality Ratings of Cohort Studies, continued
Study, Year Assembly of Groups Maintenance of
comparable groups Outcome measures
reliable & valid Outcome assessor blind to
exposure status Shipp, 2008113 Yes No Yes Yes
Smith, 2002114 Yes Yes Yes No
Socol, 1999115 Yes Unclear Yes Unclear
Spaans, 2003116 Yes Unclear Unclear Unclear
Spong, 2007117 Yes. However, the number (39,177) for term singleton gestation with prior cesarean is different from prior publication (Landon, 2006)
Yes Yes No
Stone, 2000118 Unclear Not applicable Unclear No
Strong, 1992119 Unclear Yes No No
Stovall, 1987120 Yes Not applicable Yes/Yes Unclear
Tahilramaney, 1984121
Yes Yes Unclear No
I-26
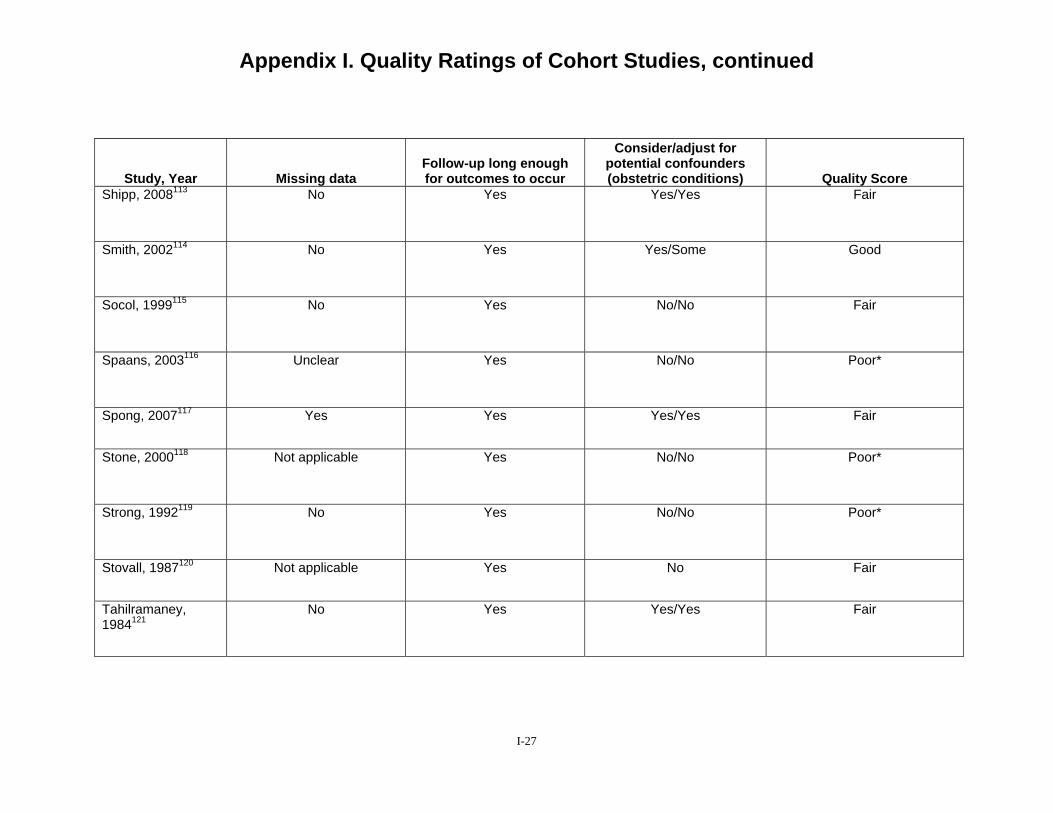
Appendix I. Quality Ratings of Cohort Studies, continued
Study, Year Missing data Follow-up long enough for outcomes to occur
Consider/adjust for potential confounders (obstetric conditions) Quality Score
Shipp, 2008113 No Yes Yes/Yes Fair
Smith, 2002114 No Yes Yes/Some Good
Socol, 1999115 No Yes No/No Fair
Spaans, 2003116 Unclear Yes No/No Poor*
Spong, 2007117 Yes Yes Yes/Yes Fair
Stone, 2000118 Not applicable Yes No/No Poor*
Strong, 1992119 No Yes No/No Poor*
Stovall, 1987120 Not applicable Yes No Fair
Tahilramaney, 1984121
No Yes Yes/Yes Fair
I-27

Appendix I. Quality Ratings of Cohort Studies, continued
Study, Year Assembly of Groups Maintenance of
comparable groups Outcome measures
reliable & valid Outcome assessor blind to
exposure status Tucker, 1993122 Yes Unclear No No
Upadhyaya, 2003123
Unclear Unclear Yes Unclear
Van der Walt, 1994124
Unclear Unclear Yes Unclear
Van Gelderen, 1986125
Unclear Yes Unclear No
Videla, 1995126 Yes Unclear No No
Weinstein, 1996127 Yes Yes For some, not for others No
Wen, 2004128 Unclear Yes Unclear No
Yetman, 1989129 Yes Unclear No Yes
Yogev, 2004130 Unclear Yes Yes No
I-28
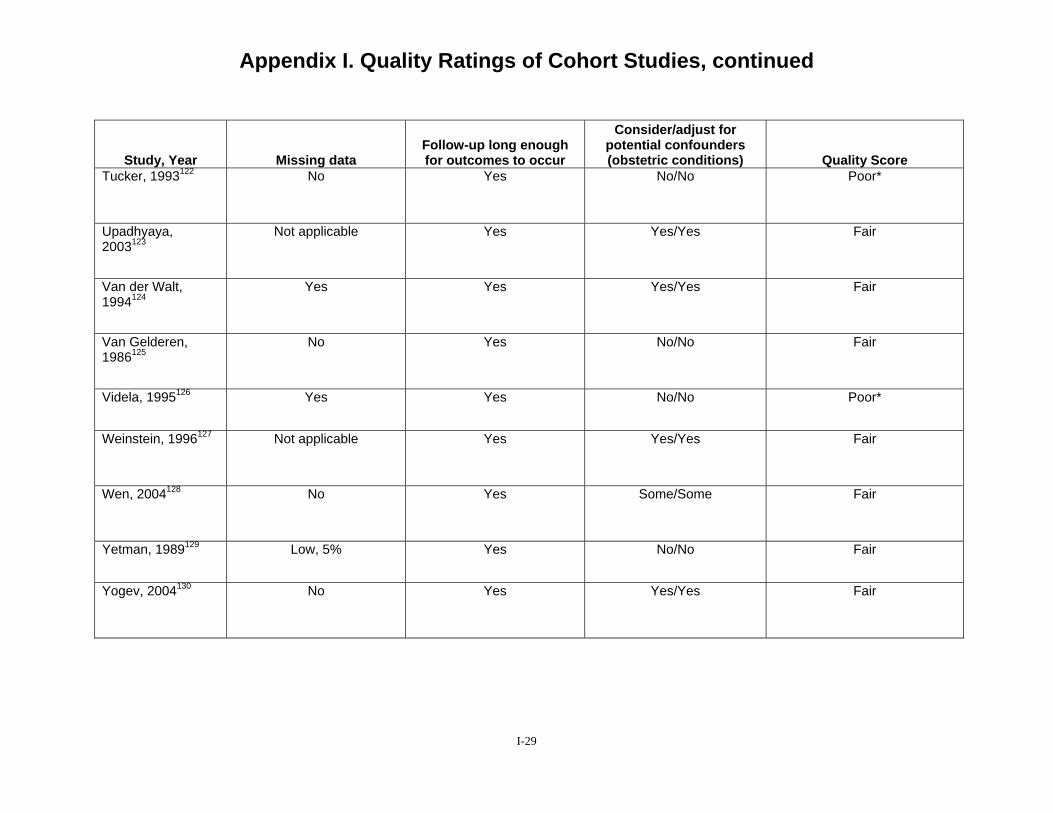
Appendix I. Quality Ratings of Cohort Studies, continued
Study, Year Missing data Follow-up long enough for outcomes to occur
Consider/adjust for potential confounders (obstetric conditions) Quality Score
Tucker, 1993122 No Yes No/No Poor*
Upadhyaya, 2003123
Not applicable Yes Yes/Yes Fair
Van der Walt, 1994124
Yes Yes Yes/Yes Fair
Van Gelderen, 1986125
No Yes No/No Fair
Videla, 1995126 Yes Yes No/No Poor*
Weinstein, 1996127 Not applicable Yes Yes/Yes Fair
Wen, 2004128 No Yes Some/Some Fair
Yetman, 1989129 Low, 5% Yes No/No Fair
Yogev, 2004130 No Yes Yes/Yes Fair
I-29

Appendix I. Quality Ratings of Cohort Studies, continued
Study, Year Assembly of Groups Maintenance of
comparable groups Outcome measures
reliable & valid Outcome assessor blind to
exposure status Zelop, 1999131 Yes Yes Yes No
Zelop, 2000132 Yes Unclear No No
Zelop, 2001133 Yes Yes Yes No
I-30

Appendix I. Quality Ratings of Cohort Studies, continued
Study, Year Missing data Follow-up long enough for outcomes to occur
Consider/adjust for potential confounders (obstetric conditions) Quality Score
Zelop, 1999131 No Yes No/No Fair
Zelop, 2000132 Yes Yes No/No Poor*
Zelop, 2001133 Not applicable Yes Yes/Yes Fair
I-31
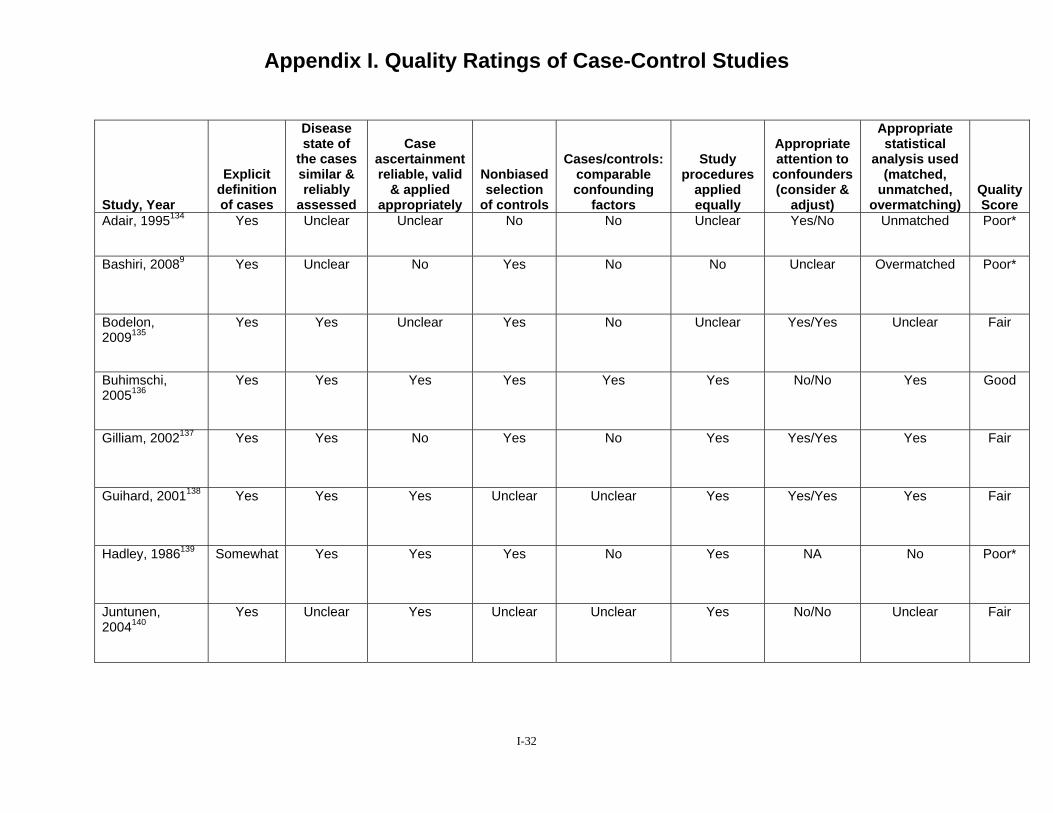
Appendix I. Quality Ratings of Case-Control Studies
Study, Year
Explicit definition of cases
Disease state of
the cases similar & reliably
assessed
Case ascertainment reliable, valid
& applied appropriately
Nonbiased selection
of controls
Cases/controls: comparable confounding
factors
Study procedures
applied equally
Appropriate attention to
confounders (consider &
adjust)
Appropriate statistical
analysis used (matched,
unmatched, overmatching)
Quality Score
Adair, 1995134 Yes Unclear Unclear No No Unclear Yes/No Unmatched Poor*
Bashiri, 20089 Yes Unclear No Yes No No Unclear Overmatched Poor*
Bodelon, 2009135
Yes Yes Unclear Yes No Unclear Yes/Yes Unclear Fair
Buhimschi, 2005136
Yes Yes Yes Yes Yes Yes No/No Yes Good
Gilliam, 2002137 Yes Yes No Yes No Yes Yes/Yes Yes Fair
Guihard, 2001138 Yes Yes Yes Unclear Unclear Yes Yes/Yes Yes Fair
Hadley, 1986139 Somewhat Yes Yes Yes No Yes NA No Poor*
Juntunen, 2004140
Yes Unclear Yes Unclear Unclear Yes No/No Unclear Fair
I-32
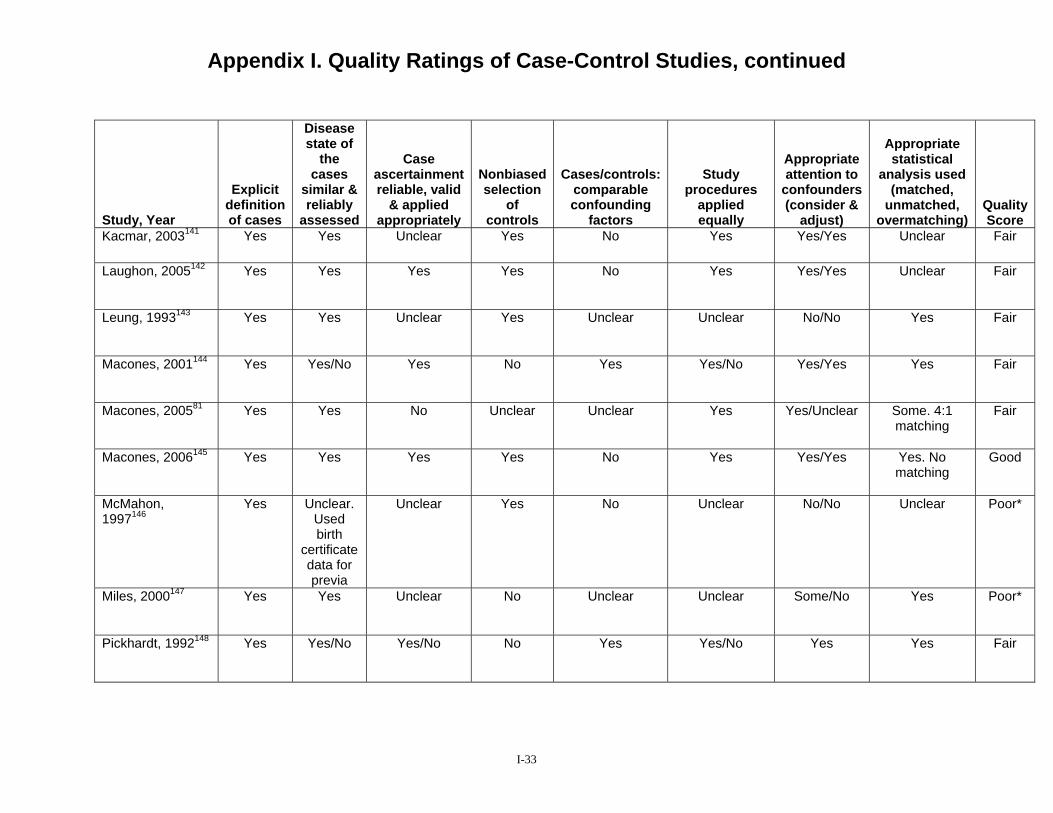
Appendix I. Quality Ratings of Case-Control Studies, continued Study, Year
Explicit definition of cases
Disease state of
the cases
similar & reliably
assessed
Case ascertainment reliable, valid
& applied appropriately
Nonbiased selection
of controls
Cases/controls: comparable confounding
factors
Study procedures
applied equally
Appropriate attention to
confounders (consider &
adjust)
Appropriate statistical
analysis used (matched,
unmatched, overmatching)
Quality Score
Kacmar, 2003141 Yes Yes Unclear Yes No Yes Yes/Yes Unclear Fair
Laughon, 2005142 Yes Yes Yes Yes No Yes Yes/Yes Unclear Fair
Leung, 1993143 Yes Yes Unclear Yes Unclear Unclear No/No Yes Fair
Macones, 2001144 Yes Yes/No Yes No Yes Yes/No Yes/Yes Yes Fair
Macones, 200581 Yes Yes No Unclear Unclear Yes Yes/Unclear Some. 4:1 matching
Fair
Macones, 2006145 Yes Yes Yes Yes No Yes Yes/Yes Yes. No matching
Good
McMahon, 1997146
Yes Unclear. Used birth
certificate data for previa
Unclear Yes No Unclear No/No Unclear Poor*
Miles, 2000147 Yes Yes Unclear No Unclear Unclear Some/No Yes Poor*
Pickhardt, 1992148 Yes Yes/No Yes/No No Yes Yes/No Yes Yes Fair
I-33
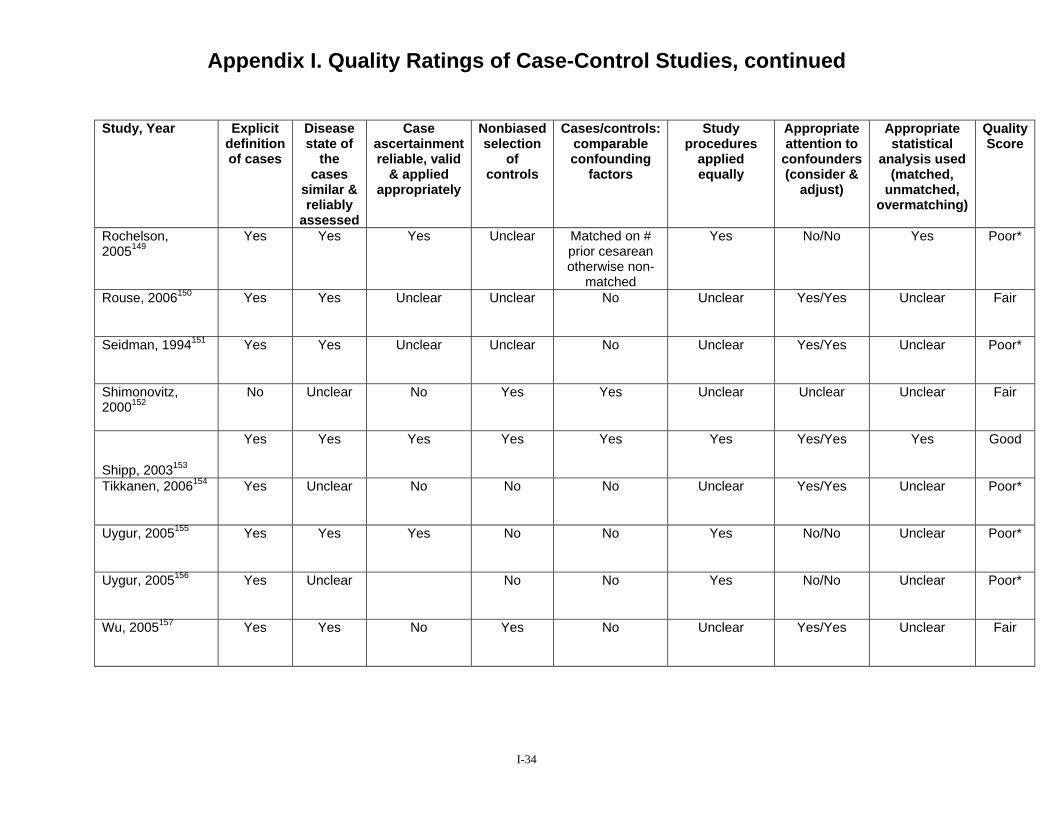
Appendix I. Quality Ratings of Case-Control Studies, continued
Study, Year Explicit definition of cases
Disease state of
the cases
similar & reliably
assessed
Case ascertainment reliable, valid
& applied appropriately
Nonbiased selection
of controls
Cases/controls: comparable confounding
factors
Study procedures
applied equally
Appropriate attention to
confounders (consider &
adjust)
Appropriate statistical
analysis used (matched,
unmatched, overmatching)
Quality Score
Rochelson, 2005149
Yes Yes Yes Unclear Matched on # prior cesarean otherwise non-
matched
Yes No/No Yes Poor*
Rouse, 2006150 Yes Yes Unclear Unclear No Unclear Yes/Yes Unclear Fair
Seidman, 1994151 Yes Yes Unclear Unclear No Unclear Yes/Yes Unclear Poor*
Shimonovitz, 2000152
No Unclear No Yes Yes Unclear Unclear Unclear Fair
Shipp, 2003153
Yes Yes Yes Yes Yes Yes Yes/Yes Yes Good
Tikkanen, 2006154 Yes Unclear No No No Unclear Yes/Yes Unclear Poor*
Uygur, 2005155 Yes Yes Yes No No Yes No/No Unclear Poor*
Uygur, 2005156 Yes Unclear No No Yes No/No Unclear Poor*
Wu, 2005157 Yes Yes No Yes No Unclear Yes/Yes Unclear Fair
I-34
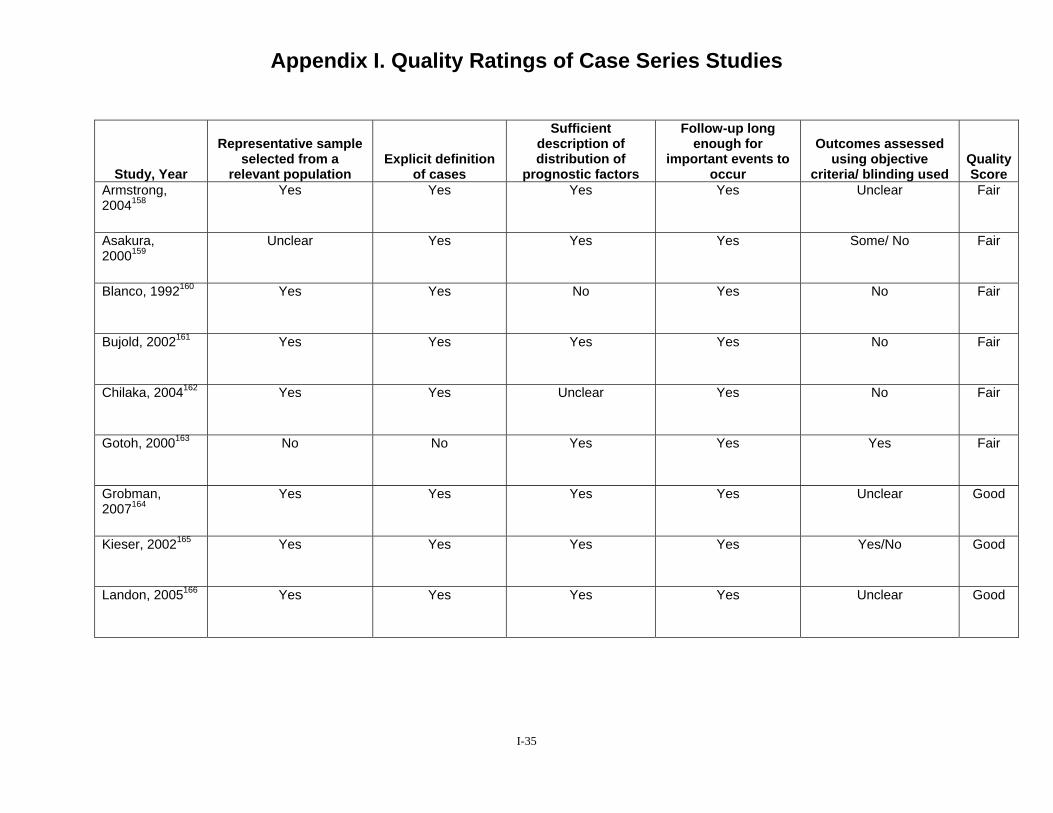
Appendix I. Quality Ratings of Case Series Studies
Study, Year
Representative sample selected from a
relevant population Explicit definition
of cases
Sufficient description of distribution of
prognostic factors
Follow-up long enough for
important events to occur
Outcomes assessed using objective
criteria/ blinding used Quality Score
Armstrong, 2004158
Yes Yes Yes Yes Unclear Fair
Asakura, 2000159
Unclear Yes Yes Yes Some/ No Fair
Blanco, 1992160 Yes Yes No Yes No Fair
Bujold, 2002161 Yes Yes Yes Yes No Fair
Chilaka, 2004162 Yes Yes Unclear Yes No Fair
Gotoh, 2000163 No No Yes Yes Yes Fair
Grobman, 2007164
Yes Yes Yes Yes Unclear Good
Kieser, 2002165 Yes Yes Yes Yes Yes/No Good
Landon, 2005166 Yes Yes Yes Yes Unclear Good
I-35
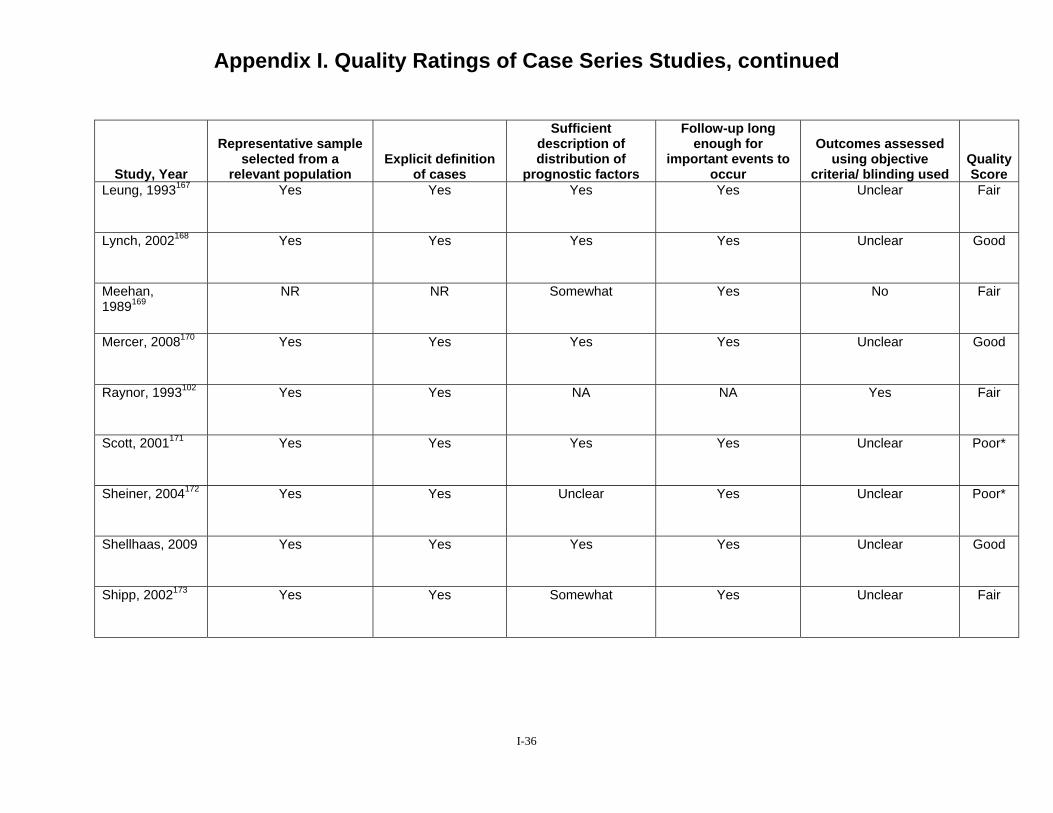
Appendix I. Quality Ratings of Case Series Studies, continued
Study, Year
Representative sample selected from a
relevant population Explicit definition
of cases
Sufficient description of distribution of
prognostic factors
Follow-up long enough for
important events to occur
Outcomes assessed using objective
criteria/ blinding used Quality Score
Leung, 1993167 Yes Yes Yes Yes Unclear Fair
Lynch, 2002168 Yes Yes Yes Yes Unclear Good
Meehan, 1989169
NR NR Somewhat Yes No Fair
Mercer, 2008170 Yes Yes Yes Yes Unclear Good
Raynor, 1993102 Yes Yes NA NA Yes Fair
Scott, 2001171 Yes Yes Yes Yes Unclear Poor*
Sheiner, 2004172 Yes Yes Unclear Yes Unclear Poor*
Shellhaas, 2009 Yes Yes Yes Yes Unclear Good
Shipp, 2002173 Yes Yes Somewhat Yes Unclear Fair
I-36
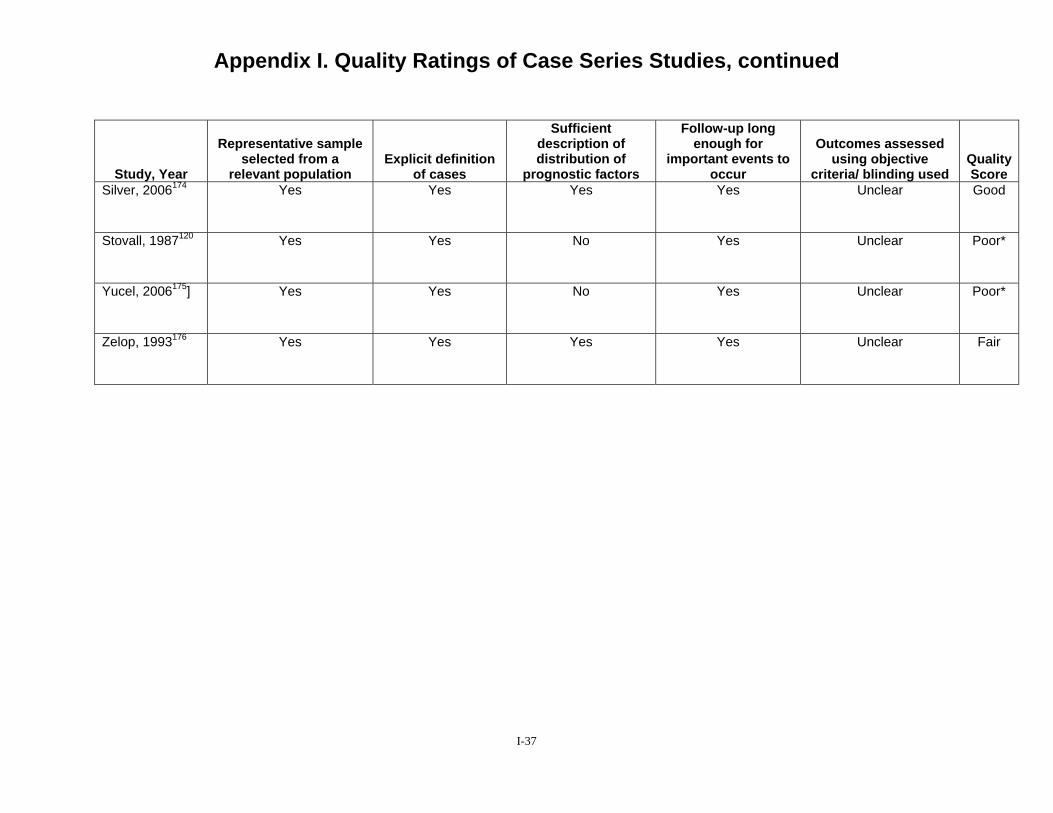
Appendix I. Quality Ratings of Case Series Studies, continued
Study, Year
Representative sample selected from a
relevant population Explicit definition
of cases
Sufficient description of distribution of
prognostic factors
Follow-up long enough for
important events to occur
Outcomes assessed using objective
criteria/ blinding used Quality Score
Silver, 2006174 Yes Yes Yes Yes Unclear Good
Stovall, 1987120 Yes Yes No Yes Unclear Poor*
Yucel, 2006175] Yes Yes No Yes Unclear Poor*
Zelop, 1993176 Yes Yes Yes Yes Unclear Fair
I-37

Appendix I. Quality Ratings of Cohort Prediction Studies Study, Year
Comparable Groups Clear
inclusion and exclusion criteria for
VBAC
Maintenance of
comparable groups
Clear definition
of prognostic
factors
Measures reliable,
valid
Unbiased assessment of data and analysis of
results
Loss/ Drop-out rate
Follow-up long
enough for outcomes to occur
Adjust for potential
confounders (obstetric
conditions) Quality Score
Bujold, 2001177 No NA Yes Yes/Yes Unclear NA Yes No Fair
Bujold, 200414 Yes NA Yes Yes/Yes Yes NA Yes Yes Good
Cameron, 2004178
Yes NA Yes Yes/Yes No NA Yes Yes Good
Chang, 200820 Yes NA Yes Yes/Yes Yes NA Yes Yes Good
Costantine, 2009179
Yes. Unclear for twins
NA Yes Yes/Yes No NA Yes Yes Good
Dinsmoor, 200430
Yes NA Yes Yes/Yes Unclear NA Yes No Fair
Flamm, 199743 Yes NA Yes Yes/Yes Yes NA Yes Yes Good
Gonen, 2004180 Yes NA Yes Yes/Yes Unclear NA Yes Yes Good
I-38
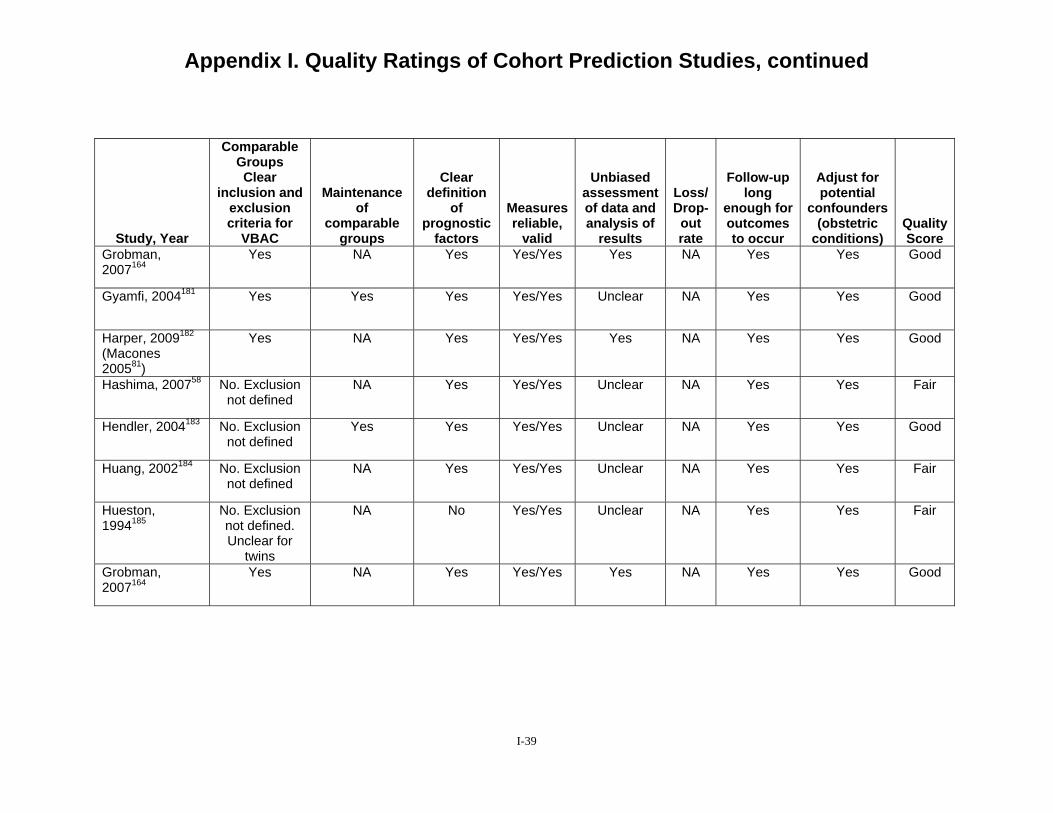
Appendix I. Quality Ratings of Cohort Prediction Studies, continued
Study, Year
Comparable Groups Clear
inclusion and exclusion criteria for
VBAC
Maintenance of
comparable groups
Clear definition
of prognostic
factors
Measures reliable,
valid
Unbiased assessment of data and analysis of
results
Loss/ Drop-out rate
Follow-up long
enough for outcomes to occur
Adjust for potential
confounders (obstetric
conditions) Quality Score
Grobman, 2007164
Yes NA Yes Yes/Yes Yes NA Yes Yes Good
Gyamfi, 2004181 Yes Yes Yes Yes/Yes Unclear NA Yes Yes Good
Harper, 2009182
(Macones 200581)
Yes NA Yes Yes/Yes Yes NA Yes Yes Good
Hashima, 200758 No. Exclusion not defined
NA Yes Yes/Yes Unclear NA Yes Yes Fair
Hendler, 2004183 No. Exclusion not defined
Yes Yes Yes/Yes Unclear NA Yes Yes Good
Huang, 2002184 No. Exclusion not defined
NA Yes Yes/Yes Unclear NA Yes Yes Fair
Hueston, 1994185
No. Exclusion not defined.
NA No Yes/Yes Unclear NA Yes Yes Fair
Unclear for twins
Grobman, 2007164
Yes NA Yes Yes/Yes Yes NA Yes Yes Good
I-39
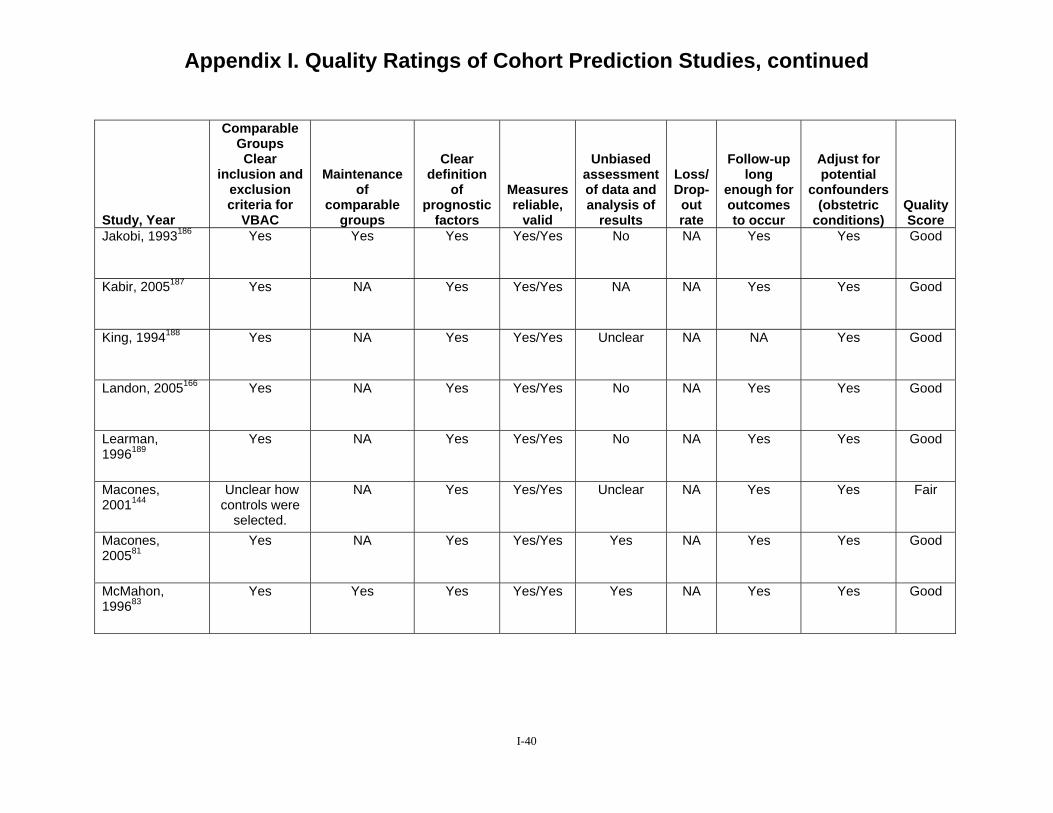
Appendix I. Quality Ratings of Cohort Prediction Studies, continued
Study, Year
Comparable Groups Clear
inclusion and exclusion criteria for
VBAC
Maintenance of
comparable groups
Clear definition
of prognostic
factors
Measures reliable,
valid
Unbiased assessment of data and analysis of
results
Loss/ Drop-out rate
Follow-up long
enough for outcomes to occur
Adjust for potential
confounders (obstetric
conditions) Quality Score
Jakobi, 1993186 Yes Yes Yes Yes/Yes No NA Yes Yes Good
Kabir, 2005187 Yes NA Yes Yes/Yes NA NA Yes Yes Good
King, 1994188 Yes NA Yes Yes/Yes Unclear NA NA Yes Good
Landon, 2005166 Yes NA Yes Yes/Yes No NA Yes Yes Good
Learman, 1996189
Yes NA Yes Yes/Yes No NA Yes Yes Good
Macones, 2001144
Unclear how controls were
selected.
NA Yes Yes/Yes Unclear NA Yes Yes Fair
Macones, 200581
Yes NA Yes Yes/Yes Yes NA Yes Yes Good
McMahon, 199683
Yes Yes Yes Yes/Yes Yes NA Yes Yes Good
I-40
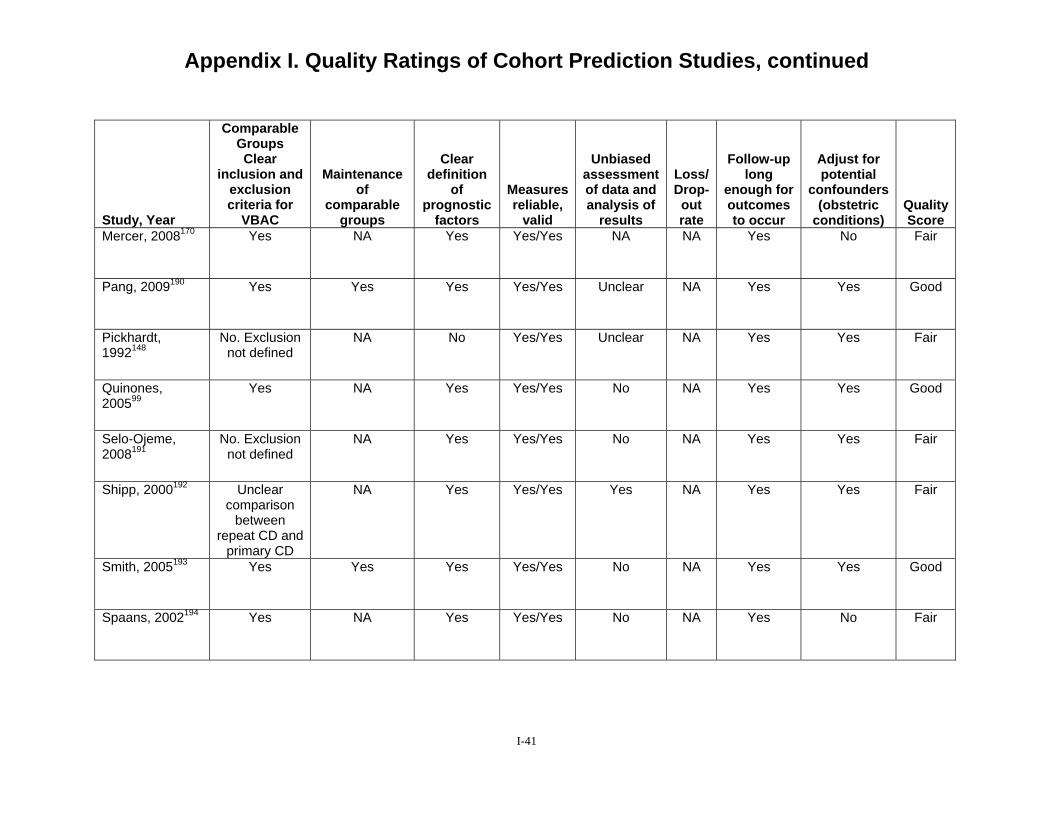
Appendix I. Quality Ratings of Cohort Prediction Studies, continued
Study, Year
Comparable Groups Clear
inclusion and exclusion criteria for
VBAC
Maintenance of
comparable groups
Clear definition
of prognostic
factors
Measures reliable,
valid
Unbiased assessment of data and analysis of
results
Loss/ Drop-out rate
Follow-up long
enough for outcomes to occur
Adjust for potential
confounders (obstetric
conditions) Quality Score
Mercer, 2008170 Yes NA Yes Yes/Yes NA NA Yes No Fair
Pang, 2009190 Yes Yes Yes Yes/Yes Unclear NA Yes Yes Good
Pickhardt, 1992148
No. Exclusion not defined
NA No Yes/Yes Unclear NA Yes Yes Fair
Quinones, 200599
Yes NA Yes Yes/Yes No NA Yes Yes Good
Selo-Ojeme, 2008191
No. Exclusion not defined
NA Yes Yes/Yes No NA Yes Yes Fair
Shipp, 2000192 Unclear comparison
between repeat CD and
primary CD
NA Yes Yes/Yes Yes NA Yes Yes Fair
Smith, 2005193 Yes Yes Yes Yes/Yes No NA Yes Yes Good
Spaans, 2002194 Yes NA Yes Yes/Yes No NA Yes No Fair
I-41
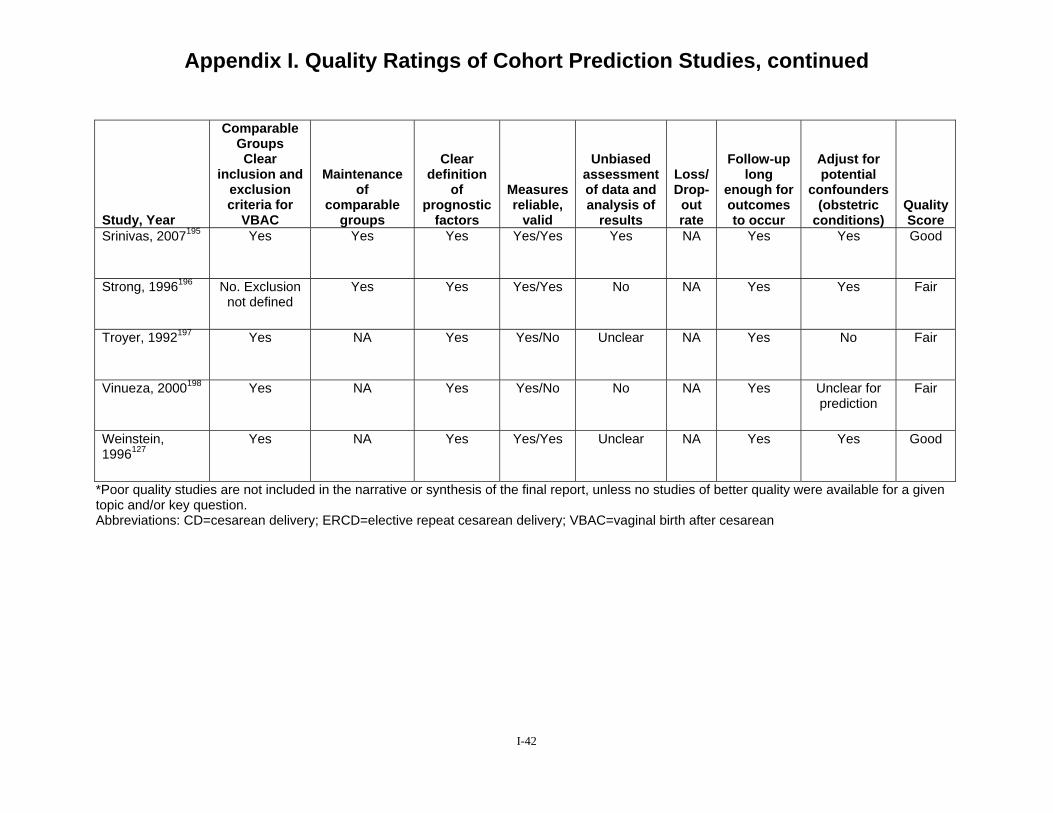
Appendix I. Quality Ratings of Cohort Prediction Studies, continued
Study, Year
Comparable Groups Clear
inclusion and exclusion criteria for
VBAC
Maintenance of
comparable groups
Clear definition
of prognostic
factors
Measures reliable,
valid
Unbiased assessment of data and analysis of
results
Loss/ Drop-out rate
Follow-up long
enough for outcomes to occur
Adjust for potential
confounders (obstetric
conditions) Quality Score
Srinivas, 2007195 Yes Yes Yes Yes/Yes Yes NA Yes Yes Good
Strong, 1996196 No. Exclusion not defined
Yes Yes Yes/Yes No NA Yes Yes Fair
Troyer, 1992197 Yes NA Yes Yes/No Unclear NA Yes No Fair
Vinueza, 2000198 Yes NA Yes Yes/No No NA Yes Unclear for prediction
Fair
Weinstein, 1996127
Yes NA Yes Yes/Yes Unclear NA Yes Yes Good
*Poor quality studies are not included in the narrative or synthesis of the final report, unless no studies of better quality were available for a given topic and/or key question. Abbreviations: CD=cesarean delivery; ERCD=elective repeat cesarean delivery; VBAC=vaginal birth after cesarean
I-42

References 1. Grubb DK, Kjos SL, Paul RH. 1995-1997. Am J Obstet
Latent labor with an unknown Gynecol. 2006;195(5):1373-uterine scar. Obstet Gynecol. 1378. 1996;88(3):351-355.
8. Bais JM, van der Borden DM, 2. Peleg D, Hannah ME, Hodnett Pel M, et al. Vaginal birth after
ED, Foster GA, Willan AR, caesarean section in a population Farine D. Predictors of cesarean with a low overall caesarean delivery after prelabor rupture of section rate. Eur J Obstet membranes at term. Obstet Gynecol Reprod Biol. Gynecol. 1999;93(6):1031-1035. 2001;96(2):158-162.
3. Thubisi M, Ebrahim A, Moodley 9. Bashiri A, Burstein E, Rosen S, J, Shweni PM. Vaginal delivery Smolin A, Sheiner E, Mazor M. after previous caesarean section: Clinical significance of uterine is X-ray pelvimetry necessary? scar dehiscence in women with Br J Obstet Gynaecol. previous cesarean delivery: 1993;100(5):421-424. prevalence and independent risk
factors. J Reprod Med. 4. Wing DA, Lovett K, Paul RH. 2008;53(1):8-14.
Disruption of prior uterine incision following misoprostol 10. Blanchette HA, Nayak S, for labor induction in women Erasmus S. Comparison of the with previous cesarean delivery. safety and efficacy of Obstet Gynecol. 1998;91(5 Pt intravaginal misoprostol 2):828-830. (prostaglandin E1) with those of
dinoprostone (prostaglandin E2) 5. Amir W, Peter J, Etan Z. Trial of for cervical ripening and
labor without oxytocin in patients induction of labor in a with a previous cesarean section. community hospital. Am J Obstet Am J Perinatol. 1987;4(2):140- Gynecol. 1999;180(6 Pt 1):1551-143. 1559.
6. Asakura H, Myers SA. More 11. Blanchette H, Blanchette M, than one previous cesarean McCabe J, Vincent S. Is vaginal delivery: a 5-year experience birth after cesarean safe? with 435 patients. Obstet Experience at a community Gynecol. 1995;85(6):924-929. hospital. Am J Obstet Gynecol.
2001;184(7):1478-1484; 7. Bahtiyar MO, Julien S, Robinson discussion 1484-1477.
JN, et al. Prior cesarean delivery is not associated with an 12. Bujold E, Mehta SH, Bujold C, increased risk of stillbirth in a Gauthier RJ. Interdelivery subsequent pregnancy: analysis interval and uterine rupture. Am J of U.S. perinatal mortality data,
I-43

Obstet Gynecol. 2002;187(5):1199-1202.
13. Bujold E, Bujold C, Hamilton EF, Harel F, Gauthier RJ. The impact of a single-layer or double-layer closure on uterine rupture. Am J Obstet Gynecol. 2002;186(6):1326-1330.
14. Bujold E, Blackwell SC, Hendler I, Berman S, Sorokin Y, Gauthier RJ. Modified Bishop's score and induction of labor in patients with a previous cesarean delivery. Am J Obstet Gynecol. 2004;191(5):1644-1648.
15. Bujold E, Hammoud AO, Hendler I, et al. Trial of labor in patients with a previous cesarean section: does maternal age influence the outcome? Am J Obstet Gynecol. 2004;190(4):1113-1118.
16. Bujold E, Hammoud A, Schild C, Krapp M, Baumann P. The role of maternal body mass index in outcomes of vaginal births after cesarean. Am J Obstet Gynecol. 2005;193(4):1517-1521.
17. Cahill AG, Stamilio DM, Odibo AO, et al. Is vaginal birth after cesarean (VBAC) or elective repeat cesarean safer in women with a prior vaginal delivery? Am J Obstet Gynecol. 2006;195(4):1143-1147.
18. Carroll CS, Sr., Magann EF, Chauhan SP, Klauser CK, Morrison JC. Vaginal birth after cesarean section versus elective repeat cesarean delivery: Weight-
based outcomes. Am J Obstet Gynecol. 2003;188(6):1516-1520; discussion 1520-1512.
19. Caughey AB, Shipp TD, Repke JT, Zelop CM, Cohen A, Lieberman E. Rate of uterine rupture during a trial of labor in women with one or two prior cesarean deliveries. Am J Obstet Gynecol. 1999;181(4):872-876.
20. Chang JJ, Stamilio DM, Macones GA. Effect of hospital volume on maternal outcomes in women with prior cesarean delivery undergoing trial of labor. Am J Epidemiol. 2008;167(6):711-718.
21. Chapman SJ, Owen J, Hauth JC. One- versus two-layer closure of a low transverse cesarean: the next pregnancy. Obstet Gynecol. 1997;89(1):16-18.
22. Chauhan SP, Magann EF, Carroll CS, Barrilleaux PS, Scardo JA, Martin JN, Jr. Mode of delivery for the morbidly obese with prior cesarean delivery: vaginal versus repeat cesarean section. Am J Obstet Gynecol. 2001;185(2):349-354.
23. Chauhan SP, Magann EF, Wiggs CD, Barrilleaux PS, Martin JN, Jr. Pregnancy after classic cesarean delivery. Obstet Gynecol. 2002;100(5 Pt 1):946-950.
24. Chestnut DH. Effect of anesthesia for repeat cesarean section on postoperative infectious morbidity. Obstet Gynecol. 1985;66(2):199-202.
I-44
25.
26.
Coughlan C, Kearney R, Turner MJ. What are the implications for the next delivery in primigravidae who have an elective caesarean section for breech presentation? BJOG: An International Journal of Obstetrics & Gynaecology. 2002;109(6):624-626.
DeFranco EA, Rampersad R, Atkins KL, et al. Do vaginal birth after cesarean outcomes differ based on hospital setting? Am J Obstet Gynecol. 2007;197(4):400.e401-406.
32.
33.
patients with a single previous low transverse cesarean section for dystocia. Obstet Gynecol. 1988;71(3 Pt 1):380-384.
Durnwald CP, Ehrenberg HM, Mercer BM. The impact of maternal obesity and weight gain on vaginal birth after cesarean section success. Am J Obstet Gynecol. 2004;191(3):954-957.
Durnwald C, Mercer B. Vaginal birth after Cesarean delivery: predicting success, risks of failure. J Matern Fetal Neonatal Med. 2004;15(6):388-393.
27.
28.
29.
Delaney T, Young DC. Spontaneous versus induced labor after a previous cesarean delivery. Obstet Gynecol. 2003;102(1):39-44.
Dhall K, Mittal SC, Grover V, Dhall GI. Childbirth following primary cesarean section--evaluation of a scoring system. Int J Gynaecol Obstet. 1987;25(3):199-205.
DiMaio H, Edwards RK, Euliano TY, Treloar RW, Cruz AC.
34.
35.
Edwards RK, Harnsberger DS, Johnson IM, Treloar RW, Cruz AC. Deciding on route of delivery for obese women with a prior cesarean delivery. Am J Obstet Gynecol. 2003;189(2):385-389; discussion 389-390.
Eglinton GS, Phelan JP, Yeh S, Diaz FP, Wallace TM, Paul RH. Outcome of a trial of labor after prior cesarean delivery. J Reprod Med. 1984;29(1):3-8.
30.
31.
Vaginal birth after cesarean delivery: an historic cohort cost analysis. Am J Obstet Gynecol. 2002;186(5):890-892.
Dinsmoor MJ, Brock EL. Predicting failed trial of labor after primary cesarean delivery. Obstet Gynecol. 2004;103(2):282-286.
Duff P, Southmayd K, Read JA. Outcome of trial of labor in
36.
37.
Elkousy MA, Sammel M, Stevens E, Peipert JF, Macones G. The effect of birth weight on vaginal birth after cesarean delivery success rates. Am J Obstet Gynecol. 2003;188(3):824-830.
El-Sayed YY, Watkins MM, Fix M, Druzin ML, Pullen KM, Caughey AB. Perinatal outcomes after successful and failed trials of labor after cesarean delivery.
I-45
Am J Obstet Gynecol. 2007;196(6):583.e581-585; discussion 583.e585.
cesarean section. Acta Obstet Gynecol Scand. 1992;71(7):540-542.
38. Eriksen NL, Buttino L, Jr. Vaginal birth after cesarean: a comparison of maternal and neonatal morbidity to elective repeat cesarean section. Am J Perinatol. 1989;6(4):375-379.
45. Getahun D, Oyelese Y, Salihu HM, Ananth CV. Previous cesarean delivery and risks of placenta previa and placental abruption. Obstet Gynecol. 2006;107(4):771-778.
39. Fisler RE, Cohen A, Ringer SA, Lieberman E. Neonatal outcome
46. Gibson DH. Vaginal delivery after caesarean section in
after trial of labor compared with elective repeat cesarean section. Birth. 2003;30(2):83-88.
47.
primigravidae. Ir J Med Sci. 1988;157(9):290-292.
Gonen R, Nisenblat V, Barak S, 40. Flamm BL, Goings JR, Fuelberth
NJ, Fischermann E, Jones C, Hersh E. Oxytocin during labor after previous cesarean section: results of a multicenter study. Obstet Gynecol. 1987;70(5):709-712. 48.
Tamir A, Ohel G. Results of a well-defined protocol for a trial of labor after prior cesarean delivery. Obstet Gynecol. 2006;107(2 Pt 1):240-245.
Gonen R, Barak S, Nissenblat V, Ohel G. The outcome and
41. Flamm BL, Goings JR. Vaginal birth after cesarean section: is
cumulative morbidity associated with the second and third
42.
43.
44.
suspected fetal macrosomia a contraindication? Obstet Gynecol. 1989;74(5):694-697.
Flamm BL, Goings JR, Liu Y, Wolde-Tsadik G. Elective repeat cesarean delivery versus trial of labor: a prospective multicenter study. Obstet Gynecol. 1994;83(6):927-932.
Flamm BL, Geiger AM. Vaginal birth after cesarean delivery: an admission scoring system. Obstet Gynecol. 1997;90(6):907-910.
Gemer O, Segal S, Sassoon E. Detection of scar dehiscence at
49.
50.
postcesarean delivery. Am J Perinatol. 2007;24(8):483-486.
Goodall PT, Ahn JT, Chapa JB, Hibbard JU. Obesity as a risk factor for failed trial of labor in patients with previous cesarean delivery. Am J Obstet Gynecol. 2005;192(5):1423-1426.
Granovsky-Grisaru S, Shaya M, Diamant YZ. The management of labor in women with more than one uterine scar: is a repeat cesarean section really the only "safe" option? J Perinat Med. 1994;22(1):13-17.
delivery in women with prior
I-46
51. Gregory KD, Korst LM, Cane P, Platt LD, Kahn K. Vaginal birth after cesarean and uterine rupture rates in California. Obstet Gynecol. 1999;94(6):985-989.
52. Gregory KD, Korst LM, Fridman M, et al. Vaginal birth after cesarean: clinical risk factors associated with adverse outcome. Am J Obstet Gynecol. 2008;198(4):452.e451-410; discussion 452.e410-452.
53. Grobman WA, Gilbert S, Landon MB, et al. Outcomes of induction of labor after one prior cesarean. Obstet Gynecol. 2007;109(2 Pt 1):262-269.
54. Grobman WA, Lai Y, Landon MB, et al. Prediction of uterine rupture associated with attempted vaginal birth after cesarean delivery. Am J Obstet Gynecol. 2008;199(1):30.e31-35.
55. Grossetti E, Vardon D, Creveuil C, Herlicoviez M, Dreyfus M. Rupture of the scarred uterus. Acta Obstet Gynecol Scand. 2007;86(5):572-578.
56. Hammoud A, Hendler I, Gauthier RJ, Berman S, Sansregret A, Bujold E. The effect of gestational age on trial of labor after Cesarean section. J Matern Fetal Neonatal Med. 2004;15(3):202-206.
57. Hansell RS, McMurray KB, Huey GR. Vaginal birth after two or more cesarean sections: a five-year experience. Birth.
1990;17(3):146-150; discussion 150-141.
58. Hashima JN, Guise J-M. Vaginal birth after cesarean: a prenatal scoring tool. Am J Obstet Gynecol. 2007;196(5):e22-23.
59. Hemminki E, Shelley J, Gissler M. Mode of delivery and problems in subsequent births: a register-based study from Finland. Am J Obstet Gynecol. 2005;193(1):169-177.
60. Hershkowitz R, Fraser D, Mazor M, Leiberman JR. One or multiple previous cesarean sections are associated with similar increased frequency of placenta previa. Eur J Obstet Gynecol Reprod Biol. 1995;62(2):185-188.
61. Hibbard JU, Ismail MA, Wang Y, Te C, Karrison T. Failed vaginal birth after a cesarean section: how risky is it? I. Maternal morbidity. Am J Obstet Gynecol. 2001;184(7):1365-1371; discussion 1371-1363.
62. Hibbard JU, Gilbert S, Landon MB, et al. Trial of labor or repeat cesarean delivery in women with morbid obesity and previous cesarean delivery. Obstet Gynecol. 2006;108(1):125-133.
63. Hollard AL, Wing DA, Chung JH, et al. Ethnic disparity in the success of vaginal birth after cesarean delivery. J Matern Fetal Neonatal Med. 2006;19(8):483-487.
I-47
64. Hook B, Kiwi R, Amini SB, Fanaroff A, Hack M. Neonatal morbidity after elective repeat cesarean section and trial of
cesarean delivery. Obstet Gynecol. 2009;113(6):1231-1238.
65.
labor. Pediatrics. 1997;100(3 Pt 1):348-353.
Horenstein JM, Eglinton GS, Tahilramaney MP, Boucher M, Phelan JP. Oxytocin use during a trial of labor in patients with previous cesarean section. J Reprod Med. 1984;29(1):26-30.
71.
72.
Kayani SI, Alfirevic Z. Uterine rupture after induction of labour in women with previous caesarean section. BJOG: An International Journal of Obstetrics & Gynaecology. 2005;112(4):451-455.
Kugler E, Shoham-Vardi I, Burstien E, Mazor M,
66. Horenstein JM, Phelan JP. Previous cesarean section: the
Hershkovitz R. The safety of a trial of labor after cesarean
risks and benefits of oxytocin usage in a trial of labor. Am J Obstet Gynecol. 1985;151(5):564-569.
73.
section in a grandmultiparous population. Arch Gynecol Obstet. 2008;277(4):339-344.
Kwee A, Bots ML, Visser GHA, 67. Hoskins IA, Gomez JL. Bruinse HW. Obstetric
Correlation between maximum cervical dilatation at cesarean delivery and subsequent vaginal birth after cesarean delivery. Obstet Gynecol. 1997;89(4):591-593.
management and outcome of pregnancy in women with a history of caesarean section in the Netherlands. Eur J Obstet Gynecol Reprod Biol. 2007;132(2):171-176.
68. Johnson C, Oriol N, Flood K. 74. Landon MB, Hauth JC, Leveno
69.
Trial of labor: a study of 110 patients. J Clin Anesth. 1991;3(3):216-218; discussion 214-215.
Juhasz G, Gyamfi C, Gyamfi P, Tocce K, Stone JL. Effect of body mass index and excessive weight gain on success of vaginal birth after cesarean delivery. Obstet Gynecol. 2005;106(4):741-746.
75.
KJ, et al. Maternal and perinatal outcomes associated with a trial of labor after prior cesarean delivery. N Engl J Med. 2004;351(25):2581-2589.
Landon MB, Spong CY, Thom E, et al. Risk of uterine rupture with a trial of labor in women with multiple and single prior cesarean delivery. Obstet Gynecol. 2006;108(1):12-20.
70. Kamath BD, Todd JK, Glazner 76. Lieberman E, Ernst EK, Rooks JE, Lezotte D, Lynch AM. Neonatal outcomes after elective
JP, Stapleton S, Flamm B. Results of the national study of
I-48
vaginal birth after cesarean in birth centers. Obstet Gynecol. 2004;104(5 Pt 1):933-942.
77. Lin C, Raynor BD. Risk of uterine rupture in labor induction of patients with prior cesarean section: an inner city hospital experience. Am J Obstet Gynecol. 2004;190(5):1476-1478.
78. Loebel G, Zelop CM, Egan JFX, Wax J. Maternal and neonatal morbidity after elective repeat Cesarean delivery versus a trial of labor after previous Cesarean delivery in a community teaching hospital. J Matern Fetal Neonatal Med. 2004;15(4):243-246.
79. Lydon-Rochelle M, Holt VL, Easterling TR, Martin DP. First-birth cesarean and placental abruption or previa at second birth(1). Obstet Gynecol. 2001;97(5 Pt 1):765-769.
80. Lydon-Rochelle M, Holt VL, Easterling TR, Martin DP. Risk of uterine rupture during labor among women with a prior cesarean delivery. N Engl J Med. 2001;345(1):3-8.
81. Macones GA, Peipert J, Nelson DB, et al. Maternal complications with vaginal birth after cesarean delivery: a multicenter study. Am J Obstet Gynecol. 2005;193(5):1656-1662.
82. Martin JN, Jr., Harris BA, Jr., Huddleston JF, et al. Vaginal
delivery following previous cesarean birth. Am J Obstet Gynecol. 1983;146(3):255-263.
83. McMahon MJ, Luther ER, Bowes WA, Jr., Olshan AF. Comparison of a trial of labor with an elective second cesarean section. N Engl J Med. 1996;335(10):689-695.
84. Melnikow J, Romano P, Gilbert WM, Schembri M, Keyzer J, Kravitz RL. Vaginal birth after cesarean in California. Obstet Gynecol. 2001;98(3):421-426.
85. Miller M, Leader LR. Vaginal delivery after caesarean section. Aust N Z J Obstet Gynaecol. 1992;32(3):213-216.
86. Naef RW, 3rd, Ray MA, Chauhan SP, Roach H, Blake PG, Martin JN, Jr. Trial of labor after cesarean delivery with a lower-segment, vertical uterine incision: is it safe? Am J Obstet Gynecol. 1995;172(6):1666-1673; discussion 1673-1664.
87. Nisenblat V, Barak S, Griness OB, Degani S, Ohel G, Gonen R. Maternal complications associated with multiple cesarean deliveries. Obstet Gynecol. 2006;108(1):21-26.
88. Obara H, Minakami H, Koike T, Takamizawa S, Matsubara S, Sato I. Vaginal birth after cesarean delivery: results in 310 pregnancies. J Obstet Gynaecol Res. 1998;24(2):129-134.
89. Odibo AO, Cahill AG, Stamilio DM, Stevens EJ, Peipert JF,
I-49
Macones GA. Predicting placental abruption and previa in women with a previous cesarean delivery. Am J Perinatol. 2007;24(5):299-305.
90. Ogunyemi D, Hullett S, Leeper J, Risk A. Prepregnancy body mass index, weight gain during pregnancy, and perinatal outcome in a rural black population. J Matern Fetal Med. 1998;7(4):190-193.
91. Ouzounian JG, Miller DA, Paul RH. Amnioinfusion in women with previous cesarean births: a preliminary report. Am J Obstet Gynecol. 1996;174(2):783-786.
92. Paterson CM, Saunders NJ. Mode of delivery after one caesarean section: audit of current practice in a health region. BMJ. 1991;303(6806):818-821.
93. Pathadey SD, Van Woerden HC, Jenkinson SD. Induction of labour after a previous caesarean section: a retrospective study in a district general hospital. J Obstet Gynaecol. 2005;25(7):662-665.
94. Paul RH, Phelan JP, Yeh SY. Trial of labor in the patient with a prior cesarean birth. Am J Obstet Gynecol. 1985;151(3):297-304.
95. Peaceman AM, Gersnoviez R, Landon MB, et al. The MFMU Cesarean Registry: impact of fetal size on trial of labor success for patients with previous cesarean for dystocia. Am J
Obstet Gynecol. 2006;195(4):1127-1131.
96. Phelan JP, Clark SL, Diaz F, Paul RH. Vaginal birth after cesarean. Am J Obstet Gynecol. 1987;157(6):1510-1515.
97. Phelan JP, Ahn MO, Diaz F, Brar HS, Rodriguez MH. Twice a cesarean, always a cesarean? Obstet Gynecol. 1989;73(2):161-165.
98. Pruett KM, Kirshon B, Cotton DB, Poindexter AN, 3rd. Is vaginal birth after two or more cesarean sections safe? Obstet Gynecol. 1988;72(2):163-165.
99. Quinones JN, Stamilio DM, Pare E, Peipert JF, Stevens E, Macones GA. The effect of prematurity on vaginal birth after cesarean delivery: success and maternal morbidity. Obstet Gynecol. 2005;105(3):519-524.
100. Rageth JC, Juzi C, Grossenbacher H. Delivery after previous cesarean: a risk evaluation. Swiss Working Group of Obstetric and Gynecologic Institutions. Obstet Gynecol. 1999;93(3):332-337.
101. Ravasia DJ, Wood SL, Pollard JK. Uterine rupture during induced trial of labor among women with previous cesarean delivery. Am J Obstet Gynecol. 2000;183(5):1176-1179.
102. Raynor BD. The experience with vaginal birth after cesarean delivery in a small rural
I-50
103.
community practice. Am J Obstet Gynecol. 1993;168(1 Pt 1):60-62.
Richardson BS, Czikk MJ, daSilva O, Natale R. The impact of labor at term on measures of
success, and fetal and maternal complications among family physicians and obstetricians. J Obstet Gynaecol Can. 2008;30(2):123-128.
104.
neonatal outcome. Am J Obstet Gynecol. 2005;192(1):219-226.
Richter HE, Brumfield CG,
109. Sakala EP, Kaye S, Murray RD, Munson LJ. Oxytocin use after previous cesarean: why a higher rate of failed labor trial? Obstet
Cliver SP, Burgio KL, Neely CL, Varner RE. Risk factors
Gynecol. 1990;75(3 Pt 1):356-359.
associated with anal sphincter tear: a comparison of primiparous patients, vaginal births after cesarean deliveries,
110. Sakala EP, Kaye S, Murray RD, Munson LJ. Epidural analgesia. Effect on the likelihood of a
and patients with previous vaginal delivery. Am J Obstet Gynecol. 2002;187(5):1194-1198.
successful trial of labor after cesarean section. J Reprod Med. 1990;35(9):886-890.
105. Rozenberg P, Goffinet F, Phillippe HJ, Nisand I. Ultrasonographic measurement of lower uterine segment to assess risk of defects of scarred
111. Schneider J, Gallego D, Benito R. Trial of labor after an earlier cesarean section. A conservative approach. J Reprod Med. 1988;33(5):453-456.
uterus. Lancet. 112. Sciscione AC, Landon MB,
106.
107.
1996;347(8997):281-284.
Rozenberg P, Goffinet F, Philippe HJ, Nisand I. Thickness of the lower uterine segment: its influence in the management of patients with previous cesarean sections. Eur J Obstet Gynecol Reprod Biol. 1999;87(1):39-45.
Rudick V, Niv D, Hetman-Peri
113.
Leveno KJ, et al. Previous preterm cesarean delivery and risk of subsequent uterine rupture. Obstet Gynecol. 2008;111(3):648-653.
Shipp TD, Zelop C, Lieberman E. Assessment of the rate of uterine rupture at the first prenatal visit: a preliminary evaluation. J Matern Fetal
108.
M, Geller E, Avni A, Golan A. Epidural analgesia for planned vaginal delivery following previous cesarean section. Obstet Gynecol. 1984;64(5):621-623. Russillo B, Sewitch MJ, Cardinal
114.
Neonatal Med. 2008;21(2):129-133.
Smith GCS, Pell JP, Cameron AD, Dobbie R. Risk of perinatal death associated with labor after
L, Brassard N. Comparing rates of trial of labour attempts, VBAC
previous cesarean delivery in
I-51
uncomplicated term pregnancies. JAMA. 2002;287(20):2684-2690.
115. Socol ML, Peaceman AM. Vaginal birth after cesarean: an appraisal of fetal risk. Obstet Gynecol. 1999;93(5 Pt 1):674-679.
116. Spaans WA, van der Vliet LME, Roell-Schorer EAM, Bleker OP, van Roosmalen J. Trial of labour after two or three previous caesarean sections. Eur J Obstet Gynecol Reprod Biol. 2003;110(1):16-19.
117. Spong CY, Landon MB, Gilbert S, et al. Risk of uterine rupture and adverse perinatal outcome at term after cesarean delivery. Obstet Gynecol. 2007;110(4):801-807.
118. Stone C, Halliday J, Lumley J, Brennecke S. Vaginal births after Caesarean (VBAC): a population study. Paediatr Perinat Epidemiol. 2000;14(4):340-348.
119. Strong TH, Jr., Vega JS, O'Shaughnessy MJ, Feldman DB, Koemptgen JG. Amnioinfusion among women attempting vaginal birth after cesarean delivery. Obstet Gynecol. 1992;79(5 ( Pt 1)):673-674.
120. Stovall TG, Shaver DC, Solomon SK, Anderson GD. Trial of labor in previous cesarean section patients, excluding classical cesarean sections. Obstet Gynecol. 1987;70(5):713-717.
121. Tahilramaney MP, Boucher M, Eglinton GS, Beall M, Phelan JP. Previous cesarean section and trial of labor. Factors related to uterine dehiscence. J Reprod Med. 1984;29(1):17-21.
122. Tucker JM, Hauth JC, Hodgkins P, Owen J, Winkler CL. Trial of labor after a one- or two-layer closure of a low transverse uterine incision. Am J Obstet Gynecol. 1993;168(2):545-546.
123. Upadhyaya CD, Upadhyaya DM, Carlan SJ. Vaginal birth after cesarean delivery in a small rural community with a solo practice. Am J Perinatol. 2003;20(2):63-67.
124. van der Walt WA, Cronje HS, Bam RH. Vaginal delivery after one cesarean section. Int J Gynaecol Obstet. 1994;46(3):271-277.
125. van Gelderen CJ, England MJ, Naylor GA, Katzeff TC. Labour in patients with a caesarean section scar. The place of oxytocin augmentation. Samj, S. 1986;70(9):529-532.
126. Videla FL, Satin AJ, Barth WH, Jr., Hankins GD. Trial of labor: a disciplined approach to labor management resulting in a high rate of vaginal delivery. Am J Perinatol. 1995;12(3):181-184.
127. Weinstein D, Benshushan A, Tanos V, Zilberstein R, Rojansky N. Predictive score for vaginal birth after cesarean section. Am J
I-52
128.
Obstet Gynecol. 1996;174(1 Pt 1):192-198.
Wen SW, Rusen ID, Walker M,
labor after 40 weeks' gestation in women with prior cesarean. Obstet Gynecol. 2001;97(3):391-393.
et al. Comparison of maternal mortality and morbidity between trial of labor and elective
134. Adair CD, Sanchez-Ramos L, Gaudier FL, Kaunitz AM,
cesarean section among women with previous cesarean delivery. Am J Obstet Gynecol. 2004;191(4):1263-1269.
McDyer DC, Briones D. Labor induction in patients with previous cesarean section. Am J Perinatol. 1995;12(6):450-454.
129. Yetman TJ, Nolan TE. Vaginal birth after cesarean section: a
135. Bodelon C, Bernabe-Ortiz A, Schiff MA, Reed SD. Factors
reappraisal of risk. Am J Obstet Gynecol. 1989;161(5):1119-1123.
associated with peripartum hysterectomy. Obstet Gynecol. 2009;114(1):115-123.
130. Yogev Y, Ben-Haroush A, Lahav E, Horowitz E, Hod M, Kaplan B. Induction of labor with prostaglandin E2 in women with previous cesarean section and unfavorable cervix. Eur J Obstet
136. Buhimschi CS, Buhimschi IA, Patel S, Malinow AM, Weiner CP. Rupture of the uterine scar during term labour: contractility or biochemistry? BJOG: An International Journal of
Gynecol Reprod Biol. 2004;116(2):173-176.
Obstetrics & Gynaecology. 2005;112(1):38-42.
131. Zelop CM, Shipp TD, Repke JT, Cohen A, Caughey AB, Lieberman E. Uterine rupture during induced or augmented labor in gravid women with one prior cesarean delivery. Am J Obstet Gynecol. 1999;181(4):882-886.
137.
138.
Gilliam M, Rosenberg D, Davis F. The likelihood of placenta previa with greater number of cesarean deliveries and higher parity. Obstet Gynecol. 2002;99(6):976-980.
Guihard P, Blondel B. Trends in risk factors for caesarean sections
132.
133.
Zelop CM, Shipp TD, Repke JT, Cohen A, Lieberman E. Effect of previous vaginal delivery on the risk of uterine rupture during a subsequent trial of labor. Am J Obstet Gynecol. 2000;183(5):1184-1186.
Zelop CM, Shipp TD, Cohen A, Repke JT, Lieberman E. Trial of
139.
in France between 1981 and 1995: lessons for reducing the rates in the future. BJOG: An International Journal of Obstetrics & Gynaecology. 2001;108(1):48-55.
Hadley CB, Mennuti MT, Gabbe SG. An evaluation of the relative risks of a trial of labor versus
I-53
140.
elective repeat cesarean section. Am J Perinatol. 1986;3(2):107-114.
Juntunen K, Makarainen L, Kirkinen P. Outcome after a high number (4-10) of repeated caesarean sections. BJOG: An
145. Macones GA, Cahill AG, Stamilio DM, Odibo A, Peipert J, Stevens EJ. Can uterine rupture in patients attempting vaginal birth after cesarean delivery be predicted? Am J Obstet Gynecol. 2006;195(4):1148-1152.
International Journal of 146. McMahon MJ, Li R, Schenck
141.
Obstetrics & Gynaecology. 2004;111(6):561-563.
Kacmar J, Bhimani L, Boyd M, Shah-Hosseini R, Peipert J. Route of delivery as a risk factor for emergent peripartum hysterectomy: a case-control study. Obstet Gynecol. 2003;102(1):141-145.
147.
AP, Olshan AF, Royce RA. Previous cesarean birth. A risk factor for placenta previa? J Reprod Med. 1997;42(7):409-412.
Miles AL, Monga M, Waller DK, Dande D, Pschirrer ER. Risk factors for symptomatic uterine rupture during a trial of labor: the 1990s. Am J Perinatol.
142. Laughon SK, Wolfe HM, Visco AG. Prior cesarean and the risk
2000;17(7):385-389.
for placenta previa on second-trimester ultrasonography. Obstet Gynecol. 2005;105(5 Pt 1):962-965.
148. Pickhardt MG, Martin JN, Jr., Meydrech EF, et al. Vaginal birth after cesarean delivery: are there useful and valid predictors of success or failure? Am J Obstet
143. Leung AS, Farmer RM, Leung EK, Medearis AL, Paul RH. Risk
Gynecol. 1992;166(6 Pt 1):1811-1815; discussion 1815-1819.
factors associated with uterine
144.
rupture during trial of labor after cesarean delivery: a case-control study. Am J Obstet Gynecol. 1993;168(5):1358-1363.
Macones GA, Hausman N,
149. Rochelson B, Pagano M, Conetta L, et al. Previous preterm cesarean delivery: identification of a new risk factor for uterine rupture in VBAC candidates. J Matern Fetal Neonatal Med.
Edelstein R, Stamilio DM, Marder SJ. Predicting outcomes of trials of labor in women 150.
2005;18(5):339-342.
Rouse DJ, Owen J, Hauth JC. attempting vaginal birth after cesarean delivery: a comparison of multivariate methods with neural networks. Am J Obstet Gynecol. 2001;184(3):409-413.
151.
Active-phase labor arrest: oxytocin augmentation for at least 4 hours. Obstet Gynecol. 1999;93(3):323-328.
Seidman DS, Paz I, Nadu A, et al. Are multiple cesarean sections
I-54
safe? Eur J Obstet Gynecol Reprod Biol. 1994;57(1):7-12.
152. Shimonovitz S, Botosneano A, Hochner-Celnikier D. Successful first vaginal birth after cesarean section: a predictor of reduced risk for uterine rupture in subsequent deliveries. Isr Med Assoc J. 2000;2(7):526-528.
153. Shipp TD, Zelop C, Cohen A, Repke JT, Lieberman E. Post-cesarean delivery fever and uterine rupture in a subsequent trial of labor. Obstet Gynecol. 2003;101(1):136-139.
154. Tikkanen M, Nuutila M, Hiilesmaa V, Paavonen J, Ylikorkala O. Prepregnancy risk factors for placental abruption. Acta Obstet Gynecol Scand. 2006;85(1):40-44.
155. Uygur D, Gun O, Kelekci S, Ozturk A, Ugur M, Mungan T. Multiple repeat caesarean section: is it safe? Eur J Obstet Gynecol Reprod Biol. 2005;119(2):171-175.
156. Uygur D, Tapisiz OL, Mungan T. Multiple repeat cesarean sections: maternal and neonatal outcomes. Int J Gynaecol Obstet. 2005;89(3):284-285.
157. Wu S, Kocherginsky M, Hibbard JU. Abnormal placentation: twenty-year analysis. Am J Obstet Gynecol. 2005;192(5):1458-1461.
158. Armstrong CA, Harding S, Matthews T, Dickinson JE. Is
placenta accreta catching up with us? Aust N Z J Obstet Gynaecol. 2004;44(3):210-213.
159. Asakura H, Nakai A, Ishikawa G, Suzuki S, Araki T. Prediction of uterine dehiscence by measuring lower uterine segment thickness prior to the onset of labor: evaluation by transvaginal ultrasonography. J Nippon Med Sch. 2000;67(5):352-356.
160. Blanco JD, Collins M, Willis D, Prien S. Prostaglandin E2 gel induction of patients with a prior low transverse cesarean section. Am J Perinatol. 1992;9(2):80-83.
161. Bujold E, Gauthier RJ. Neonatal morbidity associated with uterine rupture: what are the risk factors? Am J Obstet Gynecol. 2002;186(2):311-314.
162. Chilaka VN, Cole MY, Habayeb OMH, Konje JC. Risk of uterine rupture following induction of labour in women with a previous caesarean section in a large UK teaching hospital. J Obstet Gynaecol. 2004;24(3):264-265.
163. Gotoh H, Masuzaki H, Yoshida A, Yoshimura S, Miyamura T, Ishimaru T. Predicting incomplete uterine rupture with vaginal sonography during the late second trimester in women with prior cesarean. Obstet Gynecol. 2000;95(4):596-600.
164. Grobman WA, Lai Y, Landon MB, et al. Development of a nomogram for prediction of vaginal birth after cesarean
I-55
delivery. Obstet Gynecol. 2007;109(4):806-812.
165. Kieser KE, Baskett TF. A 10-year population-based study of uterine rupture. Obstet Gynecol. 2002;100(4):749-753.
166. Landon MB, Leindecker S, Spong CY, et al. The MFMU Cesarean Registry: factors affecting the success of trial of labor after previous cesarean delivery. Am J Obstet Gynecol. 2005;193(3 Pt 2):1016-1023.
167. Leung AS, Leung EK, Paul RH. Uterine rupture after previous cesarean delivery: maternal and fetal consequences. Am J Obstet Gynecol. 1993;169(4):945-950.
168. Lynch JC, Pardy JP. Uterine rupture and scar dehiscence. A five-year survey. Anaesth Intensive Care. 1996;24(6):699-704.
169. Meehan FP, Burke G. Trial of labour following prior section; a 5 year prospective study (1982-1987). Eur J Obstet Gynecol Reprod Biol. 1989;31(2):109-117.
170. Mercer BM, Gilbert S, Landon MB, et al. Labor outcomes with increasing number of prior vaginal births after cesarean delivery. Obstet Gynecol. 2008;111(2 Pt 1):285-291.
171. Scott JR. Mandatory trial of labor after cesarean delivery: an alternative viewpoint. Obstet Gynecol. 1991;77(6):811-814.
172. Sheiner E, Levy A, Menes TS, Silverberg D, Katz M, Mazor M. Maternal obesity as an independent risk factor for caesarean delivery. Paediatr Perinat Epidemiol. 2004;18(3):196-201.
173. Shipp TD, Zelop C, Repke JT, Cohen A, Caughey AB, Lieberman E. The association of maternal age and symptomatic uterine rupture during a trial of labor after prior cesarean delivery. Obstet Gynecol. 2002;99(4):585-588.
174. Silver RM, Landon MB, Rouse DJ, et al. Maternal morbidity associated with multiple repeat cesarean deliveries. Obstet Gynecol. 2006;107(6):1226-1232.
175. Yucel O, Ozdemir I, Yucel N, Somunkiran A. Emergency peripartum hysterectomy: a 9-year review. Arch Gynecol Obstet. 2006;274(2):84-87.
176. Zelop CM, Harlow BL, Frigoletto FD, Jr., Safon LE, Saltzman DH. Emergency peripartum hysterectomy. Am J Obstet Gynecol. 1993;168(5):1443-1448.
177. Bujold E. Uterine rupture during a trial of labor after a one- versus two-layer closure of low transverse cesarean. Am J Obstet Gynecol. 2001;184(suppl)(S18).
178. Cameron CA, Roberts CL, Peat B. Predictors of labor and vaginal
I-56
birth after cesarean section. Int J Gynaecol Obstet. 2004;85(3):267-269.
and the success of vaginal birth after cesarean delivery. Obstet Gynecol. 2002;99(1):41-44.
179. Costantine MM, Fox K, Byers BD, et al. Validation of the prediction model for success of vaginal birth after cesarean delivery. Obstet Gynecol. 2009;114(5):1029-1033.
185.
186.
Hueston WJ, Rudy M. Factors predicting elective repeat cesarean delivery. Obstet Gynecol. 1994;83(5 Pt 1):741-744.
Jakobi P, Weissman A, Peretz 180. Gonen R, Tamir A, Degani S,
Ohel G. Variables associated with successful vaginal birth after one cesarean section: a proposed vaginal birth after cesarean section score. Am J
BA, Hocherman I. Evaluation of prognostic factors for vaginal delivery after cesarean section. J Reprod Med. 1993;38(9):729-733.
Perinatol. 2004;21(8):447-453. 187. Kabir AA, Pridjian G, Steinmann WC, Herrera EA, Khan MM.
181.
182.
183.
184.
Gyamfi C, Juhasz G, Gyamfi P, Stone JL. Increased success of trial of labor after previous vaginal birth after cesarean. Obstet Gynecol. 2004;104(4):715-719.
Harper LM, Cahill AG, Stamilio DM, Odibo AO, Peipert JF, Macones GA. Effect of gestational age at the prior cesarean delivery on maternal morbidity in subsequent VBAC attempt. Am J Obstet Gynecol. 2009;200(3):276.e271-276.
Hendler I, Bujold E. Effect of prior vaginal delivery or prior vaginal birth after cesarean delivery on obstetric outcomes in women undergoing trial of labor. Obstet Gynecol. 2004;104(2):273-277.
Huang WH, Nakashima DK, Rumney PJ, Keegan KA, Jr., Chan K. Interdelivery interval
188.
189.
190.
Racial differences in cesareans: an analysis of U.S. 2001 National Inpatient Sample Data. Obstet Gynecol. 2005;105(4):710-718.
Fawcett J, Tulman L, Spedden J. Responses to vaginal birth after cesarean section. J Obstet Gynecol Neonatal Nurs. 1994;23(3):253-259.
Learman LA, Evertson LR, Shiboski S. Predictors of repeat cesarean delivery after trial of labor: do any exist? J Am Coll Surg. 1996;182(3):257-262.
Pang MW, Law LW, Leung TY, Lai PY, La TK. Sociodemographic factors and pregnancy events associated with women who declined vaginal birth after cesarean section. Eur J Obstet Gynecol Reprod Biol. 2009;143(1):24-28.
I-57
191.
192.
Selo-Ojeme D, Abulhassan N, Mandal R, Tirlapur S, Selo-Ojeme U. Preferred and actual delivery mode after a cesarean in London, UK. Int J Gynaecol Obstet. 2008;102(2):156-159.
Shipp TD, Zelop CM, Repke JT, Cohen A, Caughey AB, Lieberman E. Labor after previous cesarean: influence of prior indication and parity. Obstet Gynecol. 2000;95(6 Pt 1):913-916.
195.
196.
Srinivas SK, Stamilio DM, Stevens EJ, Odibo AO, Peipert JF, Macones GA. Predicting failure of a vaginal birth attempt after cesarean delivery. Obstet Gynecol. 2007;109(4):800-805.
Strong JM, McQuillan K. Factors affecting mode of delivery in labour following a single previous birth by cesarean. Journal of Obs & Gyn. 1996;16(5).
193. Smith GCS, White IR, Pell JP, Dobbie R. Predicting cesarean section and uterine rupture among women attempting vaginal birth after prior cesarean section. PLoS Med.
197. Troyer LR, Parisi VM. Obstetric parameters affecting success in a trial of labor: designation of a scoring system. Am J Obstet Gynecol. 1992;167(4 Pt 1):1099-1104.
2005;2(9):e252. 198. Vinueza CA, Chauhan SP,
194. Spaans WA, Sluijs MB, van Roosmalen J, Bleker OP. Risk factors at caesarean section and failure of subsequent trial of labour. Eur J Obstet Gynecol Reprod Biol. 2002;100(2):163-166.
Barker L, Hendrix NW, Scardo JA. Predicting the success of a trial of labor with a simple scoring system. J Reprod Med. 2000;45(4):332-336.
I-58

Appendix J. Strength of Evidence Table
Domains pertaining to strength of evidence Magnitude of effect
Strength of Evidence
# of Studies; # of Subjects
Risk of Bias (Design/ Quality) Consistency Directness Precision
Vaginal Birth After Cesarean Rate
Low, Moderate, High
Vaginal Birth After Cesarean Rate 67 368,304
Medium 16 cohort (Good Quality); 51 cohort (Fair Quality)
Inconsistent Direct for delivery outcome
Precise 74% (95% CI: 72% to 75%)
Moderate
# of Studies; # of Subjects
Risk of Bias (Design/ Quality) Consistency Directness Precision
Proportion of Induced Trials of Labor
Low, Moderate, High
Any Induction Method in Trial of Labor: Proportion with Vaginal Birth After Cesarean 28 11,938
Medium 1 RCT, 19 cohort, 9 case series (Fair Quality)
Consistent Direct Precise 63% (95% CI: 59% to 67%)
Moderate
Prostaglandin E2 Induction in Trial of Labor: Proportion with Vaginal Birth After Cesarean 5 1671
Medium 11 case series, 4 cohort (Fair Quality)
Inconsistent Direct Precise 63% (95% CI: 58% to 69%)
Moderate
Misoprostol Induction in TOL: Proportion with Vaginal Birth After Cesarean 2 96
Medium Cohort, (Fair Quality)
Inconsistent Direct Imprecise 61% (95% CI: 27% to 90%) Low
Oxytocin Induction in Trial of Labor: Proportion with Vaginal Birth After Cesarean 5 308
Low 2 cohort, 3 case series (Fair Quality)
Inconsistent Direct Imprecise 62% (95% CI: 53% to 70%)
Low
Oxytocin Augmentation in Trial of Labor: Proportion with Vaginal Birth After Cesarean 7 660*
Medium 5 cohort, 2 case series (Fair Quality)
Inconsistent Direct Imprecise 68% (95% CI: 64% to 72%)
Low
Oxytocin verses Prostaglandin E2 Induction in Trial of Labor: Proportion with Vaginal Birth After Cesarean
2 3301
1 RCT (Poor Quality) 1 cohort (Fair Quality)
Inconsistent Indirect Imprecise Not applicable Low
Mechanical Induction in Trial of Labor: Proportion with Vaginal Birth After Cesarean Foley Catheter 2 416
2 cohort (Fair Quality)
Consistent Direct Imprecise 54% (95% CI: 49% to 59%)
Moderate
J-1

Appendix J. Strength of Evidence, continued
Domains pertaining to strength of evidence Magnitude of effect
Strength of Evidence
# of Studies; # of Subjects
Risk of Bias (Design/ Quality) Consistency Directness Precision
Trial of Labor versus Elective Repeat Cesarean Delivery
Low, Moderate, High
Maternal Mortality 14 405,827
Medium 13 cohort (2 Good, 11 Fair Quality); 1 case control (Fair Quality)
Consistent Direct Precise TOL: 3.8/100,000 (95% CI: 0.9/100,000 to 15.5/100,000) ERCD: 13.4/100,000 (95% CI: 4.3/100,000 to 41.6/100,000)
High
Maternal Outcomes: Uterine Rupture Rate 8 63,499
Medium 4 prospective cohort; 4 retrospective cohort (4 include both TOL and ERCD)
Consistent Direct Precise Overall: 3% (95% CI: 0.2% to 0.4%) TOL: 0.47% (95% CI: 0.28% to 0.68%) ERCD: 0.04% (95% CI: 0.018% to 0.11%)
Moderate
# of Studies; # of Subjects
Risk of Bias (Design/ Quality) Consistency Directness Precision
Proportion of Induced Trials of Labor
Low, Moderate, High
Any Induction Method in Trial of Labor: Uterine Rupture 7 5296
Medium 5 cohort, 2 case series (Fair Quality)
Inconsistent Direct Imprecise 1.2% (95% CI: 0.7% to 1.9%)
Low
Prostaglandin E2 Induction in Trial of Labor: Uterine Rupture 12 6 cohort (5 Fair,
1 Good Quality) 6 case series (Fair Quality)
Inconsistent Direct Imprecise 2% (95% CI: 1.1% to 3.5%)
Low
Misoprostol Induction in Trial of Labor: Uterine Rupture 1 226
Cohort (Fair Quality)
NA Direct Imprecise 13% Low
Oxytocin Induction in Trial of Labor: Uterine Rupture 9 5713
Medium 1 case control, 5 cohort, 3 case series (Fair Quality)
Inconsistent Direct Precise 1.1% (95% CI: 0.9% to 1.5%)
Moderate
Oxytocin Augmentation in Trial of Labor: Uterine Rupture Insufficient data to assess
Oxytocin verses Prostaglandin E2 Induction in Trial of Labor: Uterine Rupture 1 3035
Medium 1 cohort (Fair Quality)
NA Direct Imprecise Increased risk found in oxytocin groups
Low
Mechanical Induction in Trial of Labor: Uterine Rupture Insufficient data to assess
Any Induction method in Trial of Labor: Other Harms Insufficient data to assess
J-2
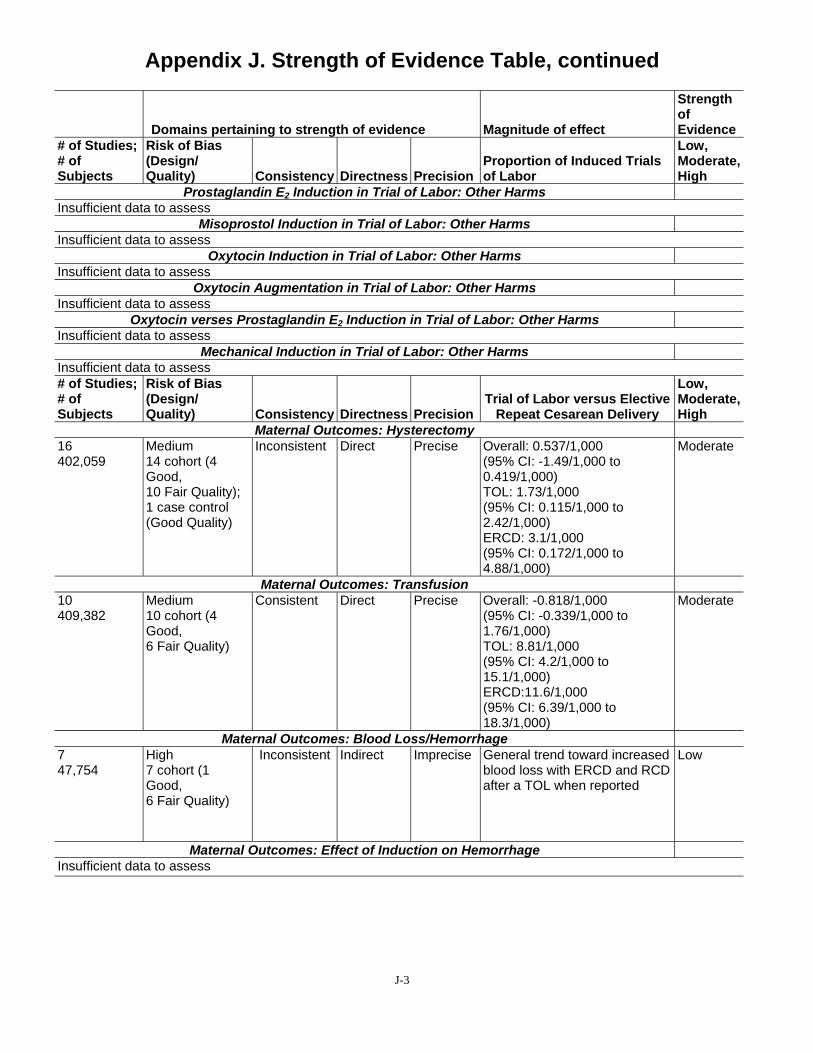
Appendix J. Strength of Evidence Table, continued
Domains pertaining to strength of evidence Magnitude of effect
Strength of Evidence
# of Studies; # of Subjects
Risk of Bias (Design/ Quality) Consistency Directness Precision
Proportion of Induced Trials of Labor
Low, Moderate, High
Prostaglandin E2 Induction in Trial of Labor: Other Harms Insufficient data to assess
Misoprostol Induction in Trial of Labor: Other Harms Insufficient data to assess
Oxytocin Induction in Trial of Labor: Other Harms Insufficient data to assess
Oxytocin Augmentation in Trial of Labor: Other Harms Insufficient data to assess
Oxytocin verses Prostaglandin E2 Induction in Trial of Labor: Other Harms Insufficient data to assess
Mechanical Induction in Trial of Labor: Other Harms Insufficient data to assess # of Studies; # of Subjects
Risk of Bias (Design/ Quality) Consistency Directness Precision
Trial of Labor versus Elective Repeat Cesarean Delivery
Low, Moderate, High
Maternal Outcomes: Hysterectomy 16 402,059
Medium 14 cohort (4 Good, 10 Fair Quality); 1 case control (Good Quality)
Inconsistent Direct Precise Overall: 0.537/1,000 (95% CI: -1.49/1,000 to 0.419/1,000) TOL: 1.73/1,000 (95% CI: 0.115/1,000 to 2.42/1,000) ERCD: 3.1/1,000 (95% CI: 0.172/1,000 to 4.88/1,000)
Moderate
Maternal Outcomes: Transfusion 10 409,382
Medium 10 cohort (4 Good, 6 Fair Quality)
Consistent Direct Precise Overall: -0.818/1,000 (95% CI: -0.339/1,000 to 1.76/1,000) TOL: 8.81/1,000 (95% CI: 4.2/1,000 to 15.1/1,000) ERCD:11.6/1,000 (95% CI: 6.39/1,000 to 18.3/1,000)
Moderate
Maternal Outcomes: Blood Loss/Hemorrhage 7 47,754
High 7 cohort (1 Good, 6 Fair Quality)
Inconsistent Indirect Imprecise General trend toward increased blood loss with ERCD and RCD after a TOL when reported
Low
Maternal Outcomes: Effect of Induction on Hemorrhage Insufficient data to assess
J-3

Appendix J. Strength of Evidence Table, continued
Domains pertaining to strength of evidence Magnitude of effect
Strength of Evidence
# of Studies; # of Subjects
Risk of Bias (Design/ Quality) Consistency Directness Precision
Trial of Labor versus Elective Repeat Cesarean Delivery
Low, Moderate, High
Maternal Outcomes: Infection, All Definitions 22 354,060
High 20 cohort (5 Good, 15 Fair Quality); 2 case control (Fair Quality)
Inconsistent Indirect Imprecise Overall: 0.93% (95% CI: 0.068% to 1.8%) TOL: 6.3% (95% CI: 3.4% to 10.1%) ERCD: 3.9% (95% CI: 2.3% to 5.8%)
Low
Maternal Outcomes: Fever 12;26,679 High
1 cohort (1 Good, 11 Fair Quality)
Inconsistent Direct Imprecise Overall: -5.4% (95% CI: -9.9% to -0.80%) TOL: 6.6% (95% CI: 4.4% to 9.3%) ERCD: 10.2% (95% CI: 4.9% to 17.1%)
Low
Long Term Maternal Outcomes: Adhesions Insufficient data to assess
Long Term Maternal Outcomes: Pelvic Pain Insufficient data to assess
Long Term Maternal Outcomes: Reproductive Health Insufficient data to assess
Infant Outcomes: Perinatal Mortality (infant death occurring ≥20 weeks-28 days life) 5 76,899
Medium 4 cohort (3 Good, 1 Fair Quality)
Consistent Indirect Imprecise TOL: 0.00133 (95% CI: 0.00059 to 0.00034) ERCD: 0.00050 (95% CI: 0.00007 to 0.00382)
Moderate
Infant Outcomes: Fetal Mortality (infant death occurring ≥20 weeks gestation, but prior to birth) 2 63,646
Medium 2 cohort (Good Quality, 1with AP/IP deaths; 1 IP only)
Consistent Indirect Imprecise TOL (overall): 39/30,834 (1.3/1000) ERCD (overall): 23/32,806 (0.7/1000)
Low (2 cohort studies)
Infant Outcomes: Neonatal Mortality (infant death occurring after birth but < 28 days of life) 6 108,328
Medium 6 cohorts (3 Fair, 3 Good Quality)
Consistent Indirect Imprecise TOL: 0.00114 (95% CI: 0.00063 to 0.00204) ERCD: 0.00055 (95% CI: 0.00020 to 0.00150)
Moderate
Term Infant Outcomes: Transient Tachypnea of the Newborn 3 4,927
Medium 3 cohort (Fair Quality)
Inconsistent Direct Imprecise TOL: 36.1/1,000 ERCD: 42/1,000
Low
Term Infant Outcomes: Neonatal Respiratory Morbidity with Bag & Mask Ventilation 3 2,110
Medium 3 cohort (Fair Quality)
Inconsistent Direct Imprecise TOL: 53.7/1000 ERCD: 25/1000
Low
J-4
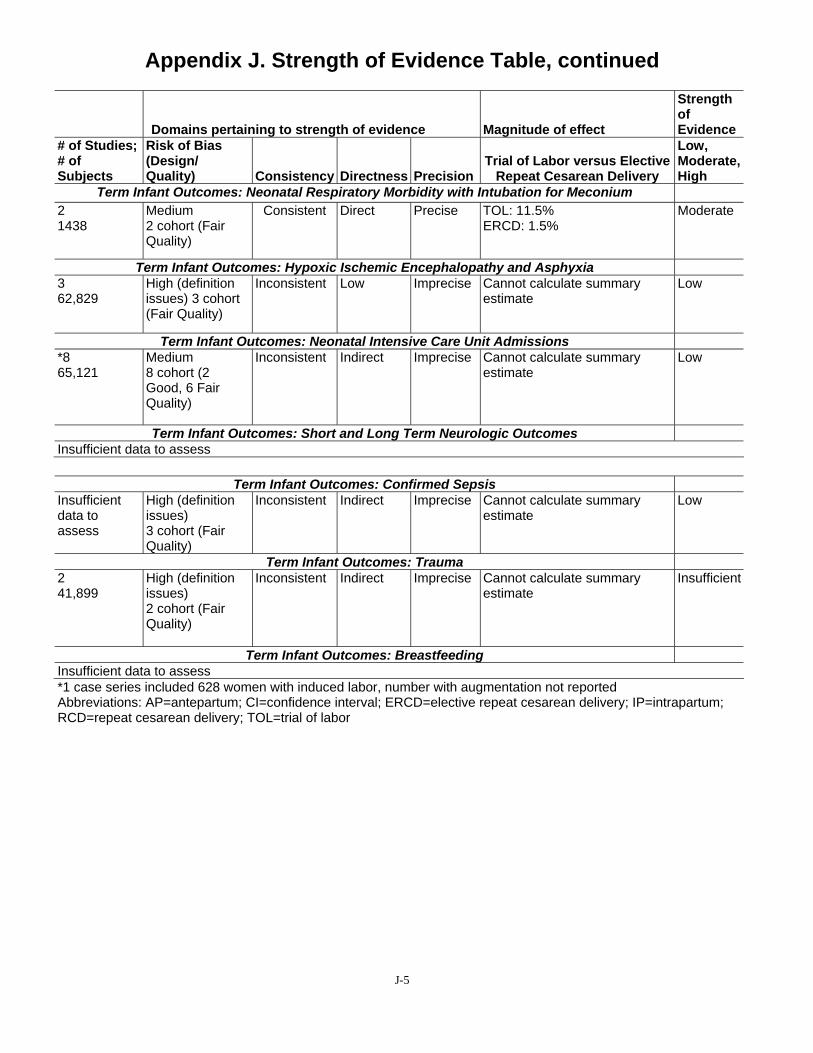
Appendix J. Strength of Evidence Table, continued
Domains pertaining to strength of evidence Magnitude of effect
Strength of Evidence
# of Studies; # of Subjects
Risk of Bias (Design/ Quality) Consistency Directness Precision
Trial of Labor versus Elective Repeat Cesarean Delivery
Low, Moderate, High
Term Infant Outcomes: Neonatal Respiratory Morbidity with Intubation for Meconium 2 1438
Medium 2 cohort (Fair Quality)
Consistent Direct Precise TOL: 11.5% ERCD: 1.5%
Moderate
Term Infant Outcomes: Hypoxic Ischemic Encephalopathy and Asphyxia 3 62,829
High (definition issues) 3 cohort (Fair Quality)
Inconsistent Low Imprecise Cannot calculate summary estimate
Low
Term Infant Outcomes: Neonatal Intensive Care Unit Admissions *8 65,121
Medium 8 cohort (2 Good, 6 Fair Quality)
Inconsistent Indirect Imprecise Cannot calculate summary estimate
Low
Term Infant Outcomes: Short and Long Term Neurologic Outcomes Insufficient data to assess
Term Infant Outcomes: Confirmed Sepsis Insufficient data to assess
High (definition issues) 3 cohort (Fair Quality)
Inconsistent Indirect Imprecise Cannot calculate summary estimate
Low
Term Infant Outcomes: Trauma 2 41,899
High (definition issues) 2 cohort (Fair Quality)
Inconsistent Indirect Imprecise Cannot calculate summary estimate
Insufficient
Term Infant Outcomes: Breastfeeding Insufficient data to assess *1 case series included 628 women with induced labor, number with augmentation not reported Abbreviations: AP=antepartum; CI=confidence interval; ERCD=elective repeat cesarean delivery; IP=intrapartum; RCD=repeat cesarean delivery; TOL=trial of labor
J-5
Appendix K. Detailed Evaluation of Predictors of Trial of Labor and Vaginal Birth After Cesarean
Introduction A brief description on the predictors of trial of labor (TOL) and vaginal birth after cesarean
(VBAC) is included in the text of the evidence report. Detailed descriptions of the studies and analyses conducted on these topics are included in this appendix.
Predictors of Trial of Labor Three good quality retrospective cohort studies,1-3 five fair quality retrospective cohort
studies4-8 and one fair quality retrospective cross sectional study9 looked for factors known in the prenatal setting that may predict TOL. Predictors have been categorized into three categories as they relate to the likelihood of TOL: 1) nonclinical which includes the site of care and type of insurance 2) demographic which include maternal age, race and economic status and 3) past obstetric factors which include a history of a vaginal birth and the gestational age of the prior cesarean delivery. Unless otherwise noted, all results are presented in odds ratios. If studies reported relative risks (RR), these are noted in the tables.
Nonclinical Factors Among the studies that reported factors related to TOL rates, location of delivery (volume),
hospital level, and access to private insurance were considered nonclinical factors.
Three retrospective studies found that the location of delivery was associated with TOL1, 2 or related to unnecessary RCDs.9 In a secondary analysis of the Agency for Healthcare Research and Quality’s (AHRQ) 2001 Healthcare Cost and Utilization Project (HCUP) National Inpatient Sample database, investigators reported that women had a reduced likelihood of TOL if they were delivered in rural or nonteaching urban hospitals (Table K-1).9 These investigators identified all women who had unnecessary (had no discharge indication, ICD-9 code, for a repeat cesarean delivery [RCD]) RCDs as a way to quantify the number of women who may not have been offered a TOL; the database includes data from 33 states. In this study, a prior cesarean alone was not considered as sufficient justification for a RCD. With this definition, 65 percent of RCDs were considered unnecessary and overall bed size of the hospital was not related to unnecessary RCDs.
In a study of Australian deliveries during 1998 to 2001,1 predictors of TOL were evaluated for 14,350 charts of women eligible for TOL by the American College of Obstetricians and Gynecologists (ACOG) standards. Women had an increased likelihood of TOL if they delivered at a Level 5 or 6 hospital (metro district hospital for high-risk mothers/babies or perinatal center) and a decreased likelihood at a Level 4 or below (metro district for moderate-risk mothers/babies, rural, and private hospitals).1 A study conducted in Nova Scotia, Canada, between 1986 and 1992, similarly found that women in community and regional hospitals were half as likely to have a TOL as women delivering in tertiary care centers.2 Further examination of rural community hospitals suggest that women delivering at rural teaching hospitals with lower volumes of deliveries and women with private insurance had a decreased likelihood of TOL even when adjusting for race, employment and marital status.7 Interestingly, the only study to date that considered the volume of VBAC deliveries found no relationship between annual VBAC volume and rate of TOL (not shown as no odds ratio or RR were provided).5 In this secondary analysis5 of a large, retrospective cohort study,10 55, 51, and 57 percent of women had
K-1
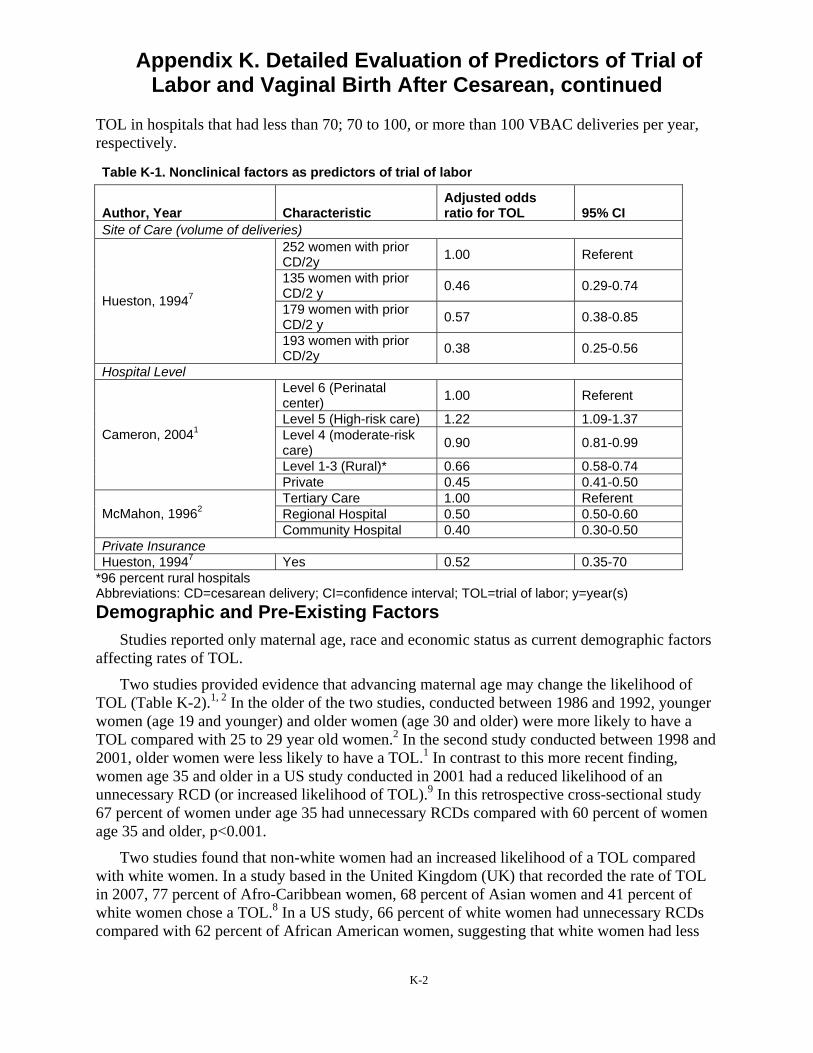
Appendix K. Detailed Evaluation of Predictors of Trial of Labor and Vaginal Birth After Cesarean, continued
TOL in hospitals that had less than 70; 70 to 100, or more than 100 VBAC deliveries per year, respectively.
Table K-1. Nonclinical factors as predictors of trial of labor
Author, Year Characteristic Adjusted odds ratio for TOL 95% CI
Site of Care (volume of deliveries)
Hueston, 19947
252 women with prior CD/2y 1.00 Referent
135 women with prior CD/2 y 0.46 0.29-0.74
179 women with prior CD/2 y 0.57 0.38-0.85
193 women with prior CD/2y 0.38 0.25-0.56
Hospital Level
Cameron, 20041
Level 6 (Perinatal center) 1.00 Referent
Level 5 (High-risk care) 1.22 1.09-1.37 Level 4 (moderate-risk care) 0.90 0.81-0.99
Level 1-3 (Rural)* 0.66 0.58-0.74 Private 0.45 0.41-0.50
McMahon, 19962 Tertiary Care 1.00 Referent Regional Hospital 0.50 0.50-0.60 Community Hospital 0.40 0.30-0.50
Private Insurance Hueston, 19947 Yes 0.52 0.35-70
*96 percent rural hospitals Abbreviations: CD=cesarean delivery; CI=confidence interval; TOL=trial of labor; y=year(s) Demographic and Pre-Existing Factors
Studies reported only maternal age, race and economic status as current demographic factors affecting rates of TOL.
Two studies provided evidence that advancing maternal age may change the likelihood of TOL (Table K-2).1, 2 In the older of the two studies, conducted between 1986 and 1992, younger women (age 19 and younger) and older women (age 30 and older) were more likely to have a TOL compared with 25 to 29 year old women.2 In the second study conducted between 1998 and 2001, older women were less likely to have a TOL.1 In contrast to this more recent finding, women age 35 and older in a US study conducted in 2001 had a reduced likelihood of an unnecessary RCD (or increased likelihood of TOL).9 In this retrospective cross-sectional study 67 percent of women under age 35 had unnecessary RCDs compared with 60 percent of women age 35 and older, p<0.001.
Two studies found that non-white women had an increased likelihood of a TOL compared with white women. In a study based in the United Kingdom (UK) that recorded the rate of TOL in 2007, 77 percent of Afro-Caribbean women, 68 percent of Asian women and 41 percent of white women chose a TOL.8 In a US study, 66 percent of white women had unnecessary RCDs compared with 62 percent of African American women, suggesting that white women had less
K-2

Appendix K. Detailed Evaluation of Predictors of Trial of Labor and Vaginal Birth After Cesarean, continued
opportunity for a TOL (p<0.001).9 Race in this study was an independent predictor of TOL even when type of insurance was included in a regressive model.
One retrospective study of women in Hong Kong conducted between 2002 and 2006 reported social economic factors influenced the decision. When the family monthly income was $3,850 or less US dollars, the woman was less likely to choose a TOL (adjusted odds ratio 0.64; 95% CI: 0.43 to 0.97).3
Table K-2. Demographic factors as predictors of trial of labor
Author, Year Study Design Characteristic
Adjusted odds ratio for TOL 95% CI
Maternal Age
Cameron, 20041
Retrospective Cohort
<30 y 1.00 Referent 30-39 y 0.86 0.80-0.92 40 y and older 0.40 0.33-0.48
McMahon, 19962
Retrospective Cohort
<19 y 1.40 1.00-2.10 20-24 y 1.00 0.80-1.10 25-29 y 1.00 Referent 30-34 y 1.10 1.00-1.20 >35 y 1.20 1.00-1.40
Race Selo-Ojeme, 20088
Retrospective Cohort White 1.00 Referent Non-white (Afro- Caribbean, Asian) 3.5 1.90-6.10
Abbreviations: CI=confidence interval; TOL=trial of labor; y=year(s) Past obstetric factors
The number of previous vaginal deliveries and gestational age (GA) at prior caesarean delivery are the past-obstetric factors that have been assessed for their influence on TOL rates
Careful attention is given to prior obstetric history in estimating likelihood of VBAC, which, in turn may influence the initial decision to have a TOL. Three retrospective cohort studies,1-3
described above, and a secondary analysis6 of a large retrospective study10 examined whether obstetric factors such as number of prior vaginal deliveries or GA at the prior cesarean predicted TOL (Table K-3). The likelihood of TOL increased for women with prior vaginal deliveries1-3
while it decreased for women who had a prior cesarean before 34 weeks GA.6
Table K-3. Past obstetric factors as predictors of trial of labor
Author, Year Study Design Characteristic
Adjusted odds ratio or relative risk for VBAC
95% CI
Number of previous vaginal deliveries
Cameron, 20041
Retrospective Cohort
1 Prior VD 1.51 1.35-1.68 2 Prior VDs 2.35 1.92-2.86 > 3 Prior VDs 2.94 2.23-3.88
McMahon, 19962
Retrospective Cohort 1 Prior VD 3.20 Not reported 2 Prior VDs 4.00 Not reported
Pang, 2009 Retrospective Cohort History of VD 6.67 2.70-16.67
K-3
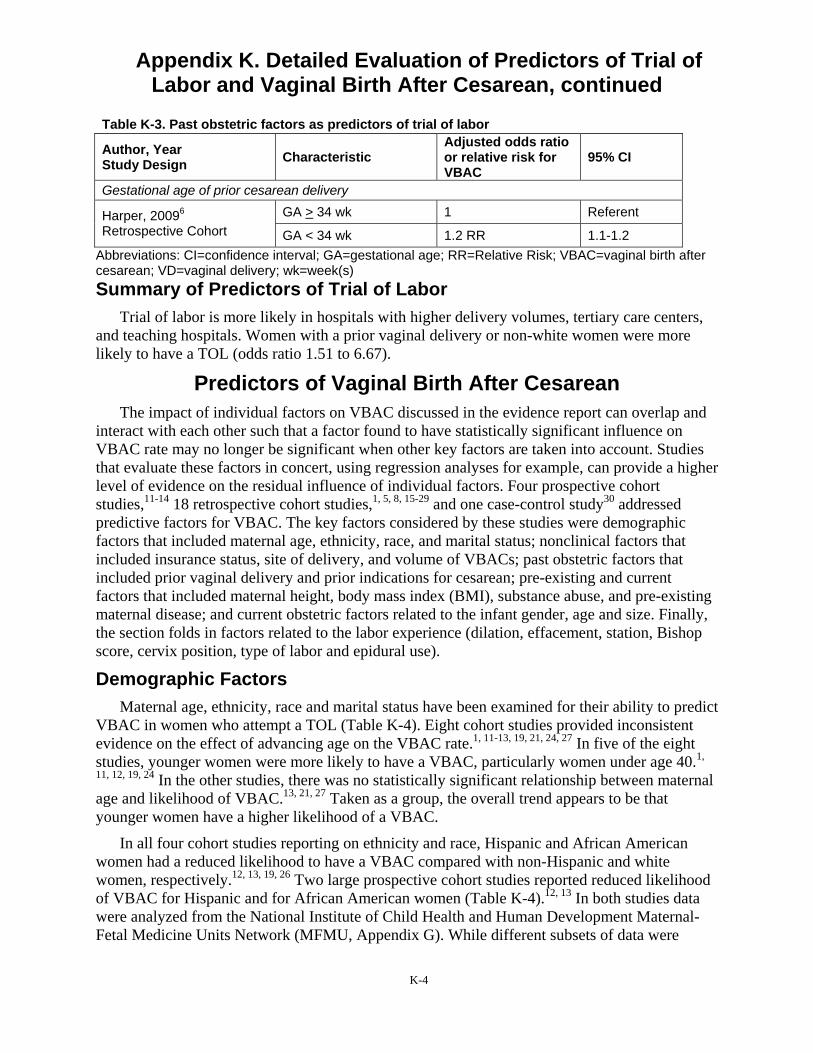
Appendix K. Detailed Evaluation of Predictors of Trial of Labor and Vaginal Birth After Cesarean, continued
Table K-3. Past obstetric factors as predictors of trial of labor
Author, Year Study Design Characteristic
Adjusted odds ratio or relative risk for VBAC
95% CI
Gestational age of prior cesarean delivery
Harper, 20096
Retrospective Cohort GA > 34 wk 1 Referent
GA < 34 wk 1.2 RR 1.1-1.2 Abbreviations: CI=confidence interval; GA=gestational age; RR=Relative Risk; VBAC=vaginal birth after cesarean; VD=vaginal delivery; wk=week(s) Summary of Predictors of Trial of Labor
Trial of labor is more likely in hospitals with higher delivery volumes, tertiary care centers, and teaching hospitals. Women with a prior vaginal delivery or non-white women were more likely to have a TOL (odds ratio 1.51 to 6.67).
Predictors of Vaginal Birth After Cesarean The impact of individual factors on VBAC discussed in the evidence report can overlap and
interact with each other such that a factor found to have statistically significant influence on VBAC rate may no longer be significant when other key factors are taken into account. Studies that evaluate these factors in concert, using regression analyses for example, can provide a higher level of evidence on the residual influence of individual factors. Four prospective cohort studies,11-14 18 retrospective cohort studies,1, 5, 8, 15-29 and one case-control study30 addressed predictive factors for VBAC. The key factors considered by these studies were demographic factors that included maternal age, ethnicity, race, and marital status; nonclinical factors that included insurance status, site of delivery, and volume of VBACs; past obstetric factors that included prior vaginal delivery and prior indications for cesarean; pre-existing and current factors that included maternal height, body mass index (BMI), substance abuse, and pre-existing maternal disease; and current obstetric factors related to the infant gender, age and size. Finally, the section folds in factors related to the labor experience (dilation, effacement, station, Bishop score, cervix position, type of labor and epidural use).
Demographic Factors Maternal age, ethnicity, race and marital status have been examined for their ability to predict
VBAC in women who attempt a TOL (Table K-4). Eight cohort studies provided inconsistent evidence on the effect of advancing age on the VBAC rate.1, 11-13, 19, 21, 24, 27 In five of the eight studies, younger women were more likely to have a VBAC, particularly women under age 40.1,
11, 12, 19, 24 In the other studies, there was no statistically significant relationship between maternal age and likelihood of VBAC.13, 21, 27 Taken as a group, the overall trend appears to be that younger women have a higher likelihood of a VBAC.
In all four cohort studies reporting on ethnicity and race, Hispanic and African American women had a reduced likelihood to have a VBAC compared with non-Hispanic and white women, respectively.12, 13, 19, 26 Two large prospective cohort studies reported reduced likelihood of VBAC for Hispanic and for African American women (Table K-4).12, 13 In both studies data were analyzed from the National Institute of Child Health and Human Development Maternal-Fetal Medicine Units Network (MFMU, Appendix G). While different subsets of data were
K-4
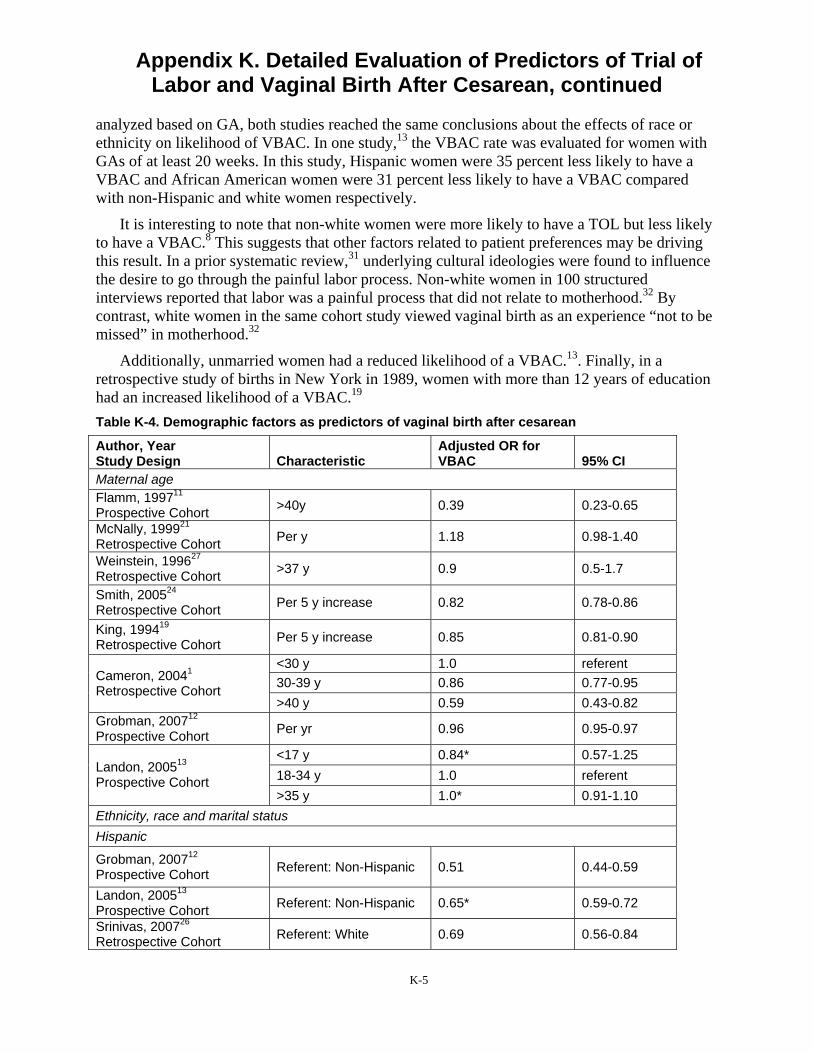
Appendix K. Detailed Evaluation of Predictors of Trial of Labor and Vaginal Birth After Cesarean, continued
analyzed based on GA, both studies reached the same conclusions about the effects of race or ethnicity on likelihood of VBAC. In one study,13 the VBAC rate was evaluated for women with GAs of at least 20 weeks. In this study, Hispanic women were 35 percent less likely to have a VBAC and African American women were 31 percent less likely to have a VBAC compared with non-Hispanic and white women respectively.
It is interesting to note that non-white women were more likely to have a TOL but less likely to have a VBAC.8 This suggests that other factors related to patient preferences may be driving this result. In a prior systematic review,31 underlying cultural ideologies were found to influence the desire to go through the painful labor process. Non-white women in 100 structured interviews reported that labor was a painful process that did not relate to motherhood.32 By contrast, white women in the same cohort study viewed vaginal birth as an experience “not to be missed” in motherhood.32
Additionally, unmarried women had a reduced likelihood of a VBAC.13. Finally, in a retrospective study of births in New York in 1989, women with more than 12 years of education had an increased likelihood of a VBAC.19
Table K-4. Demographic factors as predictors of vaginal birth after cesarean
Author, Year Study Design Characteristic
Adjusted OR for VBAC 95% CI
Maternal age Flamm, 199711
Prospective Cohort >40y 0.39 0.23-0.65
McNally, 199921
Retrospective Cohort Per y 1.18 0.98-1.40
Weinstein, 199627
Retrospective Cohort >37 y 0.9 0.5-1.7
Smith, 200524
Retrospective Cohort Per 5 y increase 0.82 0.78-0.86
King, 199419
Retrospective Cohort Per 5 y increase 0.85 0.81-0.90
Cameron, 20041
Retrospective Cohort
<30 y 1.0 referent 30-39 y 0.86 0.77-0.95 >40 y 0.59 0.43-0.82
Grobman, 200712
Prospective Cohort Per yr 0.96 0.95-0.97
Landon, 200513
Prospective Cohort
<17 y 0.84* 0.57-1.25 18-34 y 1.0 referent >35 y 1.0* 0.91-1.10
Ethnicity, race and marital status Hispanic
Grobman, 200712
Prospective Cohort Referent: Non-Hispanic 0.51 0.44-0.59
Landon, 200513
Prospective Cohort Referent: Non-Hispanic 0.65* 0.59-0.72
Srinivas, 200726
Retrospective Cohort Referent: White 0.69 0.56-0.84
K-5

Appendix K. Detailed Evaluation of Predictors of Trial of Labor and Vaginal Birth After Cesarean, continued
Table K-4. Demographic factors as predictors of vaginal birth after cesarean
Author, Year Study Design Characteristic
Adjusted OR for VBAC 95% CI
King, 199419
Retrospective Cohort Referent: White 0.61 0.51-0.73
African American
Grobman, 200712
Prospective Cohort Referent: White 0.51 0.44-0.59
Landon, 200513
Prospective Cohort Referent: White 0.69* 0.63-0.75
Srinivas, 200726
Retrospective Cohort Referent: White 0.58 0.52-0.67
King, 199419
Retrospective Cohort Referent: White 0.80 0.70-0.93
Afro-Caribbean Selo-Ojeme, 20088
Retrospective Cohort Referent: White 3.22 1.5-7.14
Asian Srinivas, 200726
Retrospective Cohort Referent: White 0.80 0.61-1.05
Other Landon, 200513
Prospective Cohort Referent: White 0.71* 0.60-0.84
Unmarried Landon, 200513
Prospective Cohort Referent: Married 0.88 0.82-0.95
Education
King, 199419
Retrospective Cohort
<12 y 1.0 Referent 12 y 1.15 0.99-1.34 13-15 y 1.36 1.16-1.60 16 y 1.59 1.32-1.93 17 y 2.00 1.64-2.45
*Only provided univariate odds ratio Abbreviations: CI=confidence interval; OR=odds ratio; VBAC=vaginal birth after cesarean; y=year(s) Nonclinical Factors
Nonclinical factors such as insurance and site of delivery play an important role in deciding what kind of birthing options are pursued. Women with non-private insurance or who were uninsured had a decreased likelihood for VBAC (Table K-5).13 However, women in Health Maintenance Organizations (HMO) had an increased likelihood of VBAC.19 The level of the hospital at which the birth takes place is also a major factor in the likelihood of VBAC. Women at rural and private hospitals that provide obstetric care for lower risk deliveries had a decreased likelihood of VBAC.1 This finding is consistent with another finding by the same investigators1
that women at rural and private hospitals were less likely to attempt a TOL. Private hospitals in this study had an average VBAC rate of 57 percent compared with a VBAC rate of 66 percent for level 6 hospitals.1 Finally, in a secondary analysis5 of a retrospective cohort study,10 the annual VBAC volume at the hospital did not change the likelihood of VBAC.
K-6
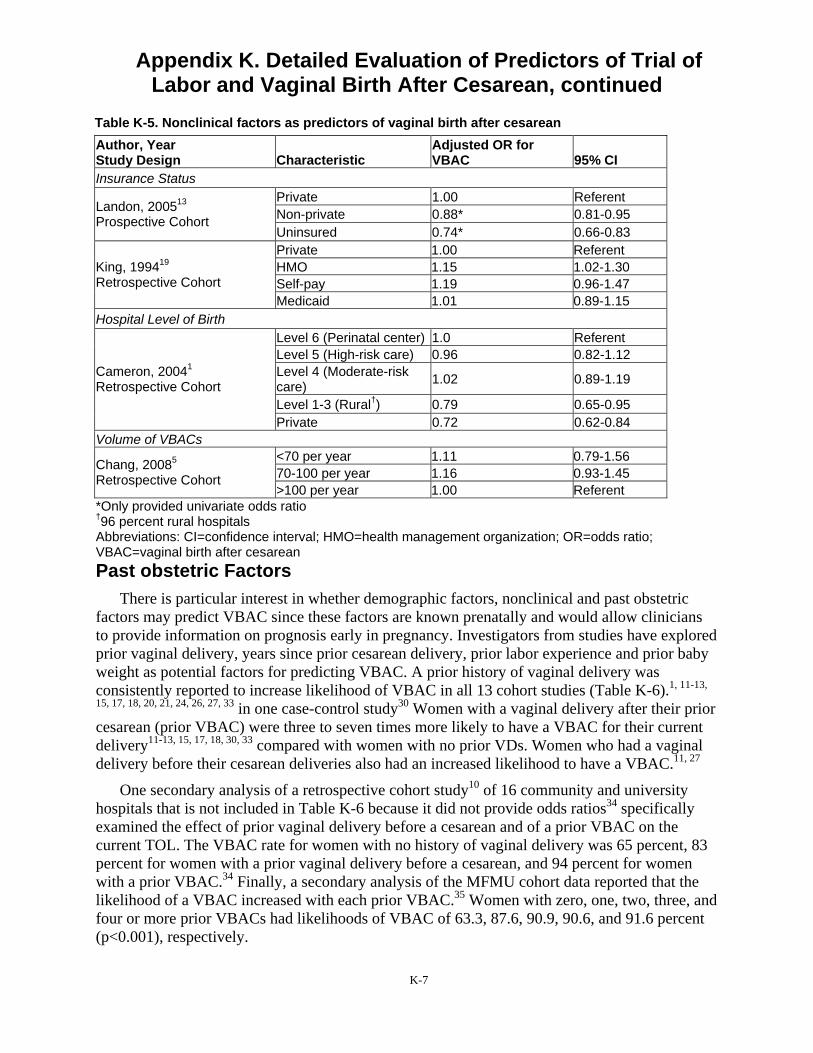
Appendix K. Detailed Evaluation of Predictors of Trial of Labor and Vaginal Birth After Cesarean, continued
Table K-5. Nonclinical factors as predictors of vaginal birth after cesarean Author, Year Study Design Characteristic
Adjusted OR for VBAC 95% CI
Insurance Status
Landon, 200513
Prospective Cohort
Private 1.00 Referent Non-private 0.88* 0.81-0.95 Uninsured 0.74* 0.66-0.83
King, 199419
Retrospective Cohort
Private 1.00 Referent HMO 1.15 1.02-1.30 Self-pay 1.19 0.96-1.47 Medicaid 1.01 0.89-1.15
Hospital Level of Birth
Cameron, 20041
Retrospective Cohort
Level 6 (Perinatal center) 1.0 Referent Level 5 (High-risk care) 0.96 0.82-1.12 Level 4 (Moderate-risk care) 1.02 0.89-1.19
Level 1-3 (Rural†) 0.79 0.65-0.95 Private 0.72 0.62-0.84
Volume of VBACs
Chang, 20085
Retrospective Cohort
<70 per year 1.11 0.79-1.56 70-100 per year 1.16 0.93-1.45 >100 per year 1.00 Referent
*Only provided univariate odds ratio †96 percent rural hospitals Abbreviations: CI=confidence interval; HMO=health management organization; OR=odds ratio; VBAC=vaginal birth after cesarean Past obstetric Factors
There is particular interest in whether demographic factors, nonclinical and past obstetric factors may predict VBAC since these factors are known prenatally and would allow clinicians to provide information on prognosis early in pregnancy. Investigators from studies have explored prior vaginal delivery, years since prior cesarean delivery, prior labor experience and prior baby weight as potential factors for predicting VBAC. A prior history of vaginal delivery was consistently reported to increase likelihood of VBAC in all 13 cohort studies (Table K-6).1, 11-13,
15, 17, 18, 20, 21, 24, 26, 27, 33 in one case-control study30 Women with a vaginal delivery after their prior cesarean (prior VBAC) were three to seven times more likely to have a VBAC for their current delivery11-13, 15, 17, 18, 30, 33 compared with women with no prior VDs. Women who had a vaginal delivery before their cesarean deliveries also had an increased likelihood to have a VBAC.11, 27
One secondary analysis of a retrospective cohort study10 of 16 community and university hospitals that is not included in Table K-6 because it did not provide odds ratios34 specifically examined the effect of prior vaginal delivery before a cesarean and of a prior VBAC on the current TOL. The VBAC rate for women with no history of vaginal delivery was 65 percent, 83 percent for women with a prior vaginal delivery before a cesarean, and 94 percent for women with a prior VBAC.34 Finally, a secondary analysis of the MFMU cohort data reported that the likelihood of a VBAC increased with each prior VBAC.35 Women with zero, one, two, three, and four or more prior VBACs had likelihoods of VBAC of 63.3, 87.6, 90.9, 90.6, and 91.6 percent (p<0.001), respectively.
K-7
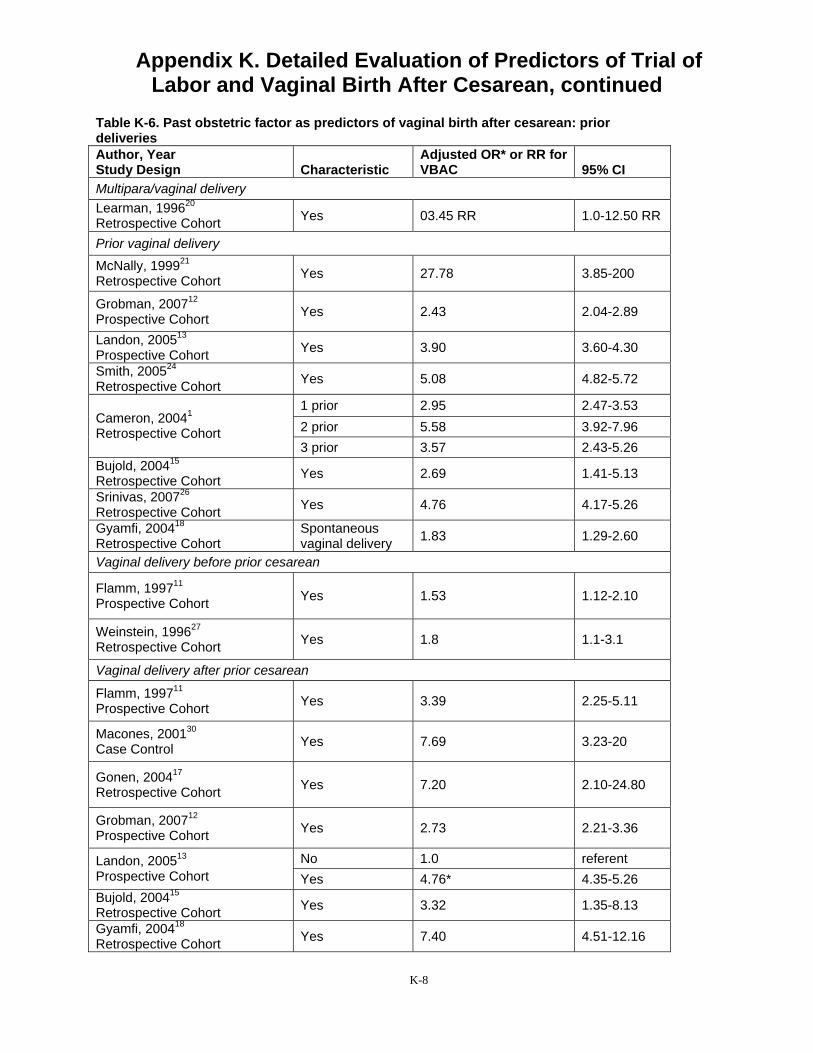
Appendix K. Detailed Evaluation of Predictors of Trial of Labor and Vaginal Birth After Cesarean, continued
Table K-6. Past obstetric factor as predictors of vaginal birth after cesarean: prior deliveries Author, Year Study Design Characteristic
Adjusted OR* or RR for VBAC 95% CI
Multipara/vaginal delivery Learman, 199620
Retrospective Cohort Yes 03.45 RR 1.0-12.50 RR
Prior vaginal delivery
McNally, 199921
Retrospective Cohort Yes 27.78 3.85-200
Grobman, 200712
Prospective Cohort Yes 2.43 2.04-2.89
Landon, 200513
Prospective Cohort Yes 3.90 3.60-4.30
Smith, 200524
Retrospective Cohort Yes 5.08 4.82-5.72
Cameron, 20041
Retrospective Cohort
1 prior 2.95 2.47-3.53 2 prior 5.58 3.92-7.96 3 prior 3.57 2.43-5.26
Bujold, 200415
Retrospective Cohort Yes 2.69 1.41-5.13
Srinivas, 200726
Retrospective Cohort Yes 4.76 4.17-5.26
Gyamfi, 200418
Retrospective Cohort Spontaneous vaginal delivery 1.83 1.29-2.60
Vaginal delivery before prior cesarean
Flamm, 199711
Prospective Cohort Yes 1.53 1.12-2.10
Weinstein, 199627
Retrospective Cohort Yes 1.8 1.1-3.1
Vaginal delivery after prior cesarean
Flamm, 199711
Prospective Cohort Yes 3.39 2.25-5.11
Macones, 200130
Case Control Yes 7.69 3.23-20
Gonen, 200417
Retrospective Cohort Yes 7.20 2.10-24.80
Grobman, 200712
Prospective Cohort Yes 2.73 2.21-3.36
Landon, 200513
Prospective Cohort No 1.0 referent Yes 4.76* 4.35-5.26
Bujold, 200415
Retrospective Cohort Yes 3.32 1.35-8.13
Gyamfi, 200418
Retrospective Cohort Yes 7.40 4.51-12.16
K-8
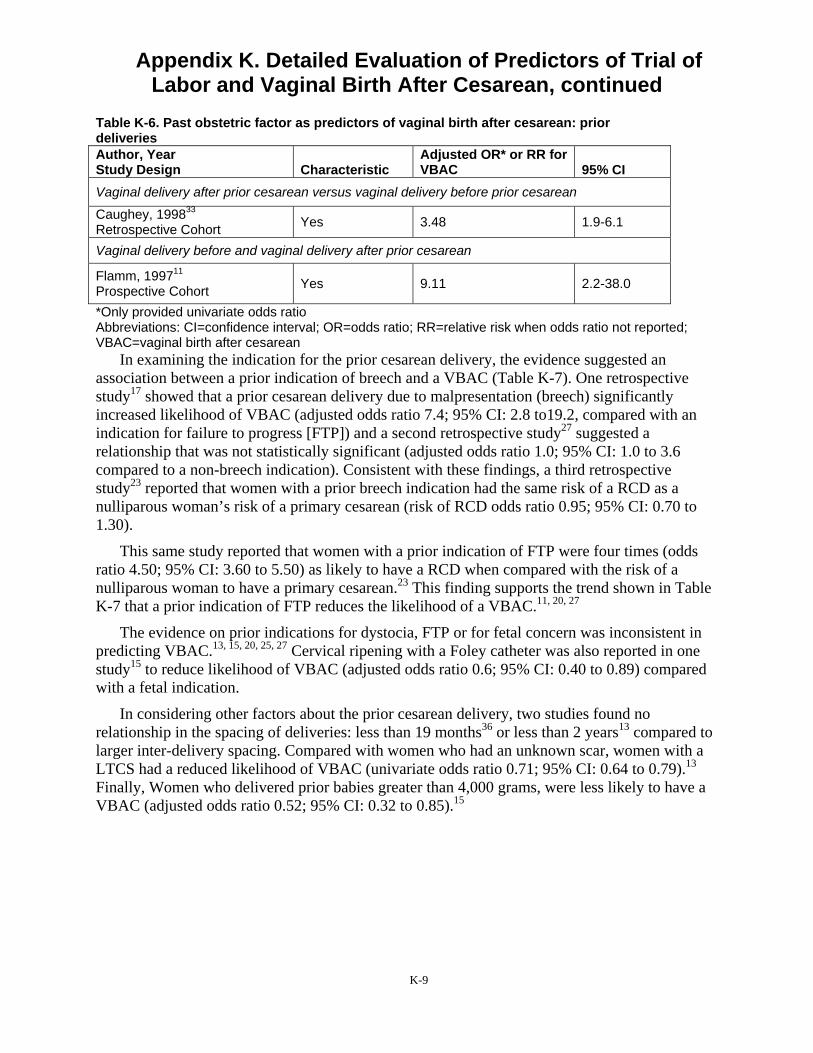
Appendix K. Detailed Evaluation of Predictors of Trial of Labor and Vaginal Birth After Cesarean, continued
Table K-6. Past obstetric factor as predictors of vaginal birth after cesarean: prior deliveries Author, Year Study Design Characteristic
Adjusted OR* or RR for VBAC 95% CI
Vaginal delivery after prior cesarean versus vaginal delivery before prior cesarean
Caughey, 199833
Retrospective Cohort Yes 3.48 1.9-6.1
Vaginal delivery before and vaginal delivery after prior cesarean
Flamm, 199711
Prospective Cohort Yes 9.11 2.2-38.0
*Only provided univariate odds ratio Abbreviations: CI=confidence interval; OR=odds ratio; RR=relative risk when odds ratio not reported; VBAC=vaginal birth after cesarean
In examining the indication for the prior cesarean delivery, the evidence suggested an association between a prior indication of breech and a VBAC (Table K-7). One retrospective study17 showed that a prior cesarean delivery due to malpresentation (breech) significantly increased likelihood of VBAC (adjusted odds ratio 7.4; 95% CI: 2.8 to19.2, compared with an indication for failure to progress [FTP]) and a second retrospective study27 suggested a relationship that was not statistically significant (adjusted odds ratio 1.0; 95% CI: 1.0 to 3.6 compared to a non-breech indication). Consistent with these findings, a third retrospective study23 reported that women with a prior breech indication had the same risk of a RCD as a nulliparous woman’s risk of a primary cesarean (risk of RCD odds ratio 0.95; 95% CI: 0.70 to 1.30).
This same study reported that women with a prior indication of FTP were four times (odds ratio 4.50; 95% CI: 3.60 to 5.50) as likely to have a RCD when compared with the risk of a nulliparous woman to have a primary cesarean.23 This finding supports the trend shown in Table K-7 that a prior indication of FTP reduces the likelihood of a VBAC.11, 20, 27
The evidence on prior indications for dystocia, FTP or for fetal concern was inconsistent in predicting VBAC.13, 15, 20, 25, 27 Cervical ripening with a Foley catheter was also reported in one study15 to reduce likelihood of VBAC (adjusted odds ratio 0.6; 95% CI: 0.40 to 0.89) compared with a fetal indication.
In considering other factors about the prior cesarean delivery, two studies found no relationship in the spacing of deliveries: less than 19 months36 or less than 2 years13 compared to larger inter-delivery spacing. Compared with women who had an unknown scar, women with a LTCS had a reduced likelihood of VBAC (univariate odds ratio 0.71; 95% CI: 0.64 to 0.79).13
Finally, Women who delivered prior babies greater than 4,000 grams, were less likely to have a VBAC (adjusted odds ratio 0.52; 95% CI: 0.32 to 0.85).15
K-9
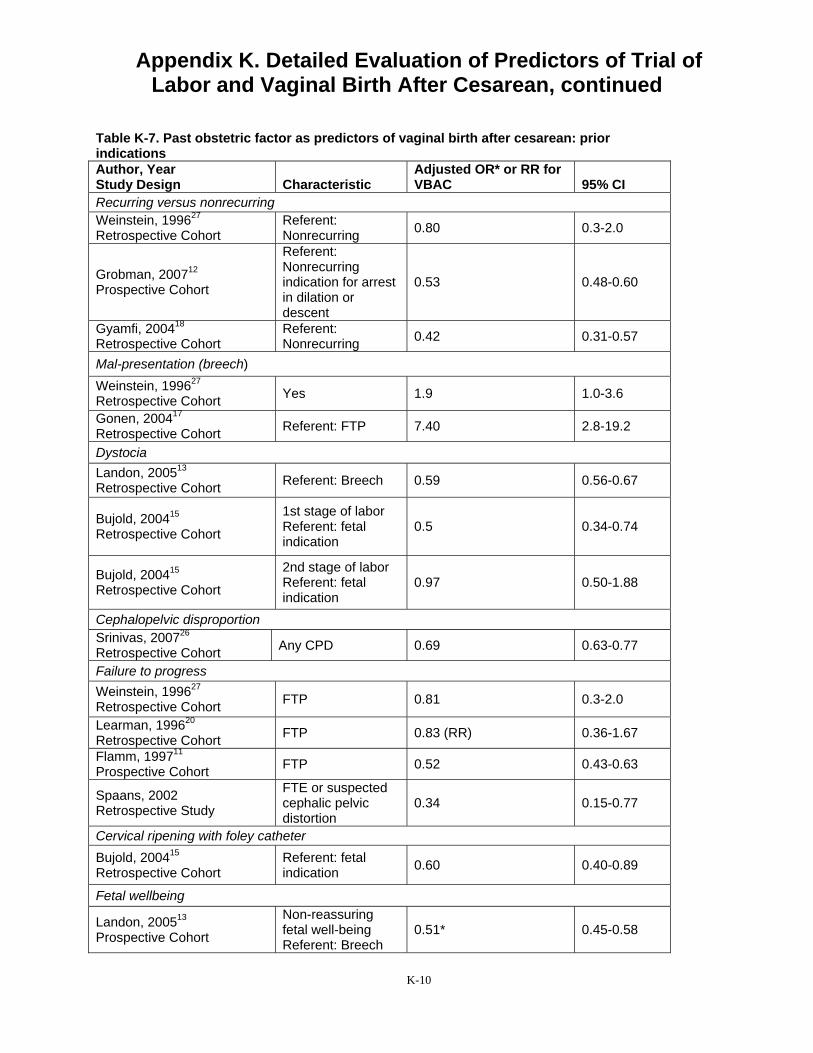
Appendix K. Detailed Evaluation of Predictors of Trial of Labor and Vaginal Birth After Cesarean, continued
Table K-7. Past obstetric factor as predictors of vaginal birth after cesarean: prior indications Author, Year Study Design Characteristic
Adjusted OR* or RR for VBAC 95% CI
Recurring versus nonrecurring Weinstein, 199627
Retrospective Cohort Referent: Nonrecurring 0.80 0.3-2.0
Grobman, 200712
Prospective Cohort
Referent: Nonrecurring indication for arrest in dilation or descent
0.53 0.48-0.60
Gyamfi, 200418
Retrospective Cohort Referent: Nonrecurring 0.42 0.31-0.57
Mal-presentation (breech) Weinstein, 199627
Retrospective Cohort Yes 1.9 1.0-3.6
Gonen, 200417
Retrospective Cohort Referent: FTP 7.40 2.8-19.2
Dystocia Landon, 200513
Retrospective Cohort Referent: Breech 0.59 0.56-0.67
Bujold, 200415
Retrospective Cohort
1st stage of labor Referent: fetal indication
0.5 0.34-0.74
Bujold, 200415
Retrospective Cohort
2nd stage of labor Referent: fetal indication
0.97 0.50-1.88
Cephalopelvic disproportion Srinivas, 200726
Retrospective Cohort Any CPD 0.69 0.63-0.77
Failure to progress Weinstein, 199627
Retrospective Cohort FTP 0.81 0.3-2.0
Learman, 199620
Retrospective Cohort FTP 0.83 (RR) 0.36-1.67
Flamm, 199711
Prospective Cohort FTP 0.52 0.43-0.63
Spaans, 2002 Retrospective Study
FTE or suspected cephalic pelvic distortion
0.34 0.15-0.77
Cervical ripening with foley catheter Bujold, 200415
Retrospective Cohort Referent: fetal indication 0.60 0.40-0.89
Fetal wellbeing
Landon, 200513
Prospective Cohort
Non-reassuring fetal well-being Referent: Breech
0.51* 0.45-0.58
K-10
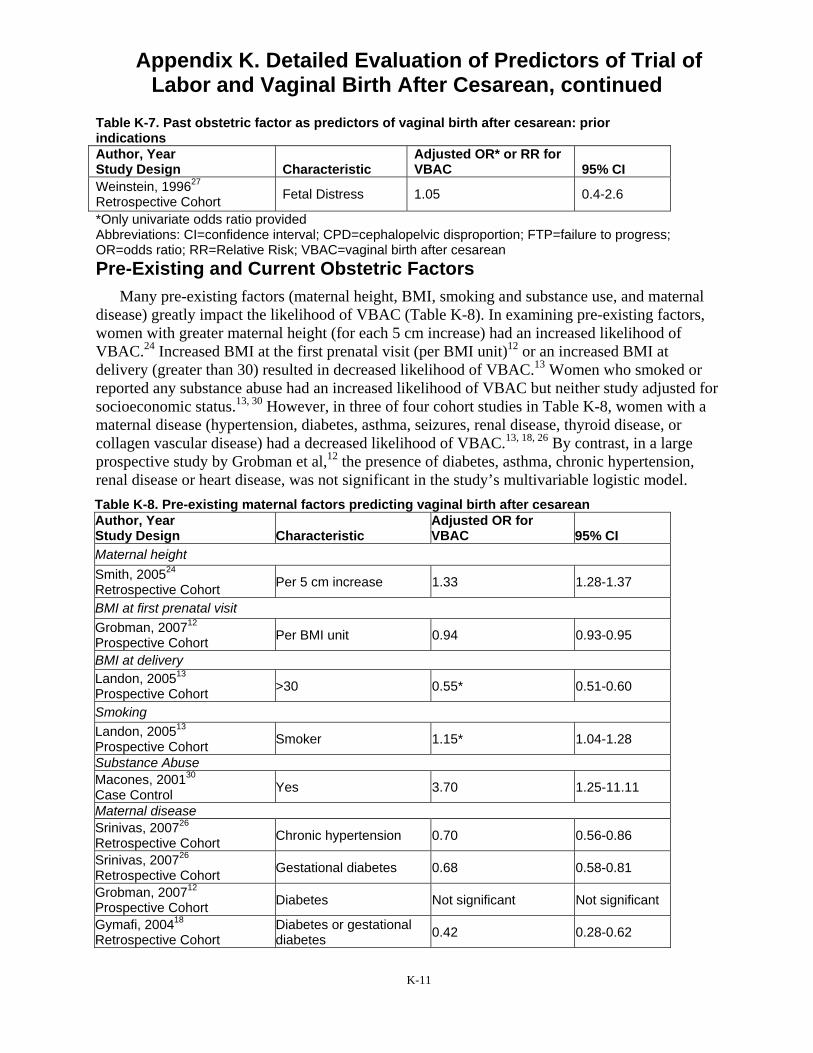
Appendix K. Detailed Evaluation of Predictors of Trial of Labor and Vaginal Birth After Cesarean, continued
Table K-7. Past obstetric factor as predictors of vaginal birth after cesarean: prior indications Author, Year Study Design Characteristic
Adjusted OR* or RR for VBAC 95% CI
Weinstein, 199627
Retrospective Cohort Fetal Distress 1.05 0.4-2.6
*Only univariate odds ratio provided Abbreviations: CI=confidence interval; CPD=cephalopelvic disproportion; FTP=failure to progress; OR=odds ratio; RR=Relative Risk; VBAC=vaginal birth after cesarean Pre-Existing and Current Obstetric Factors
Many pre-existing factors (maternal height, BMI, smoking and substance use, and maternal disease) greatly impact the likelihood of VBAC (Table K-8). In examining pre-existing factors, women with greater maternal height (for each 5 cm increase) had an increased likelihood of VBAC.24 Increased BMI at the first prenatal visit (per BMI unit)12 or an increased BMI at delivery (greater than 30) resulted in decreased likelihood of VBAC.13 Women who smoked or reported any substance abuse had an increased likelihood of VBAC but neither study adjusted for socioeconomic status.13, 30 However, in three of four cohort studies in Table K-8, women with a maternal disease (hypertension, diabetes, asthma, seizures, renal disease, thyroid disease, or collagen vascular disease) had a decreased likelihood of VBAC.13, 18, 26 By contrast, in a large prospective study by Grobman et al,12 the presence of diabetes, asthma, chronic hypertension, renal disease or heart disease, was not significant in the study’s multivariable logistic model. Table K-8. Pre-existing maternal factors predicting vaginal birth after cesarean Author, Year Study Design Characteristic
Adjusted OR for VBAC 95% CI
Maternal height Smith, 200524
Retrospective Cohort Per 5 cm increase 1.33 1.28-1.37
BMI at first prenatal visit Grobman, 200712
Prospective Cohort Per BMI unit 0.94 0.93-0.95
BMI at delivery Landon, 200513
Prospective Cohort >30 0.55* 0.51-0.60
Smoking Landon, 200513
Prospective Cohort Smoker 1.15* 1.04-1.28
Substance Abuse Macones, 200130
Case Control Yes 3.70 1.25-11.11
Maternal disease Srinivas, 200726
Retrospective Cohort Chronic hypertension 0.70 0.56-0.86
Srinivas, 200726
Retrospective Cohort Gestational diabetes 0.68 0.58-0.81
Grobman, 200712
Prospective Cohort Diabetes Not significant Not significant
Gymafi, 200418
Retrospective Cohort Diabetes or gestational diabetes 0.42 0.28-0.62
K-11
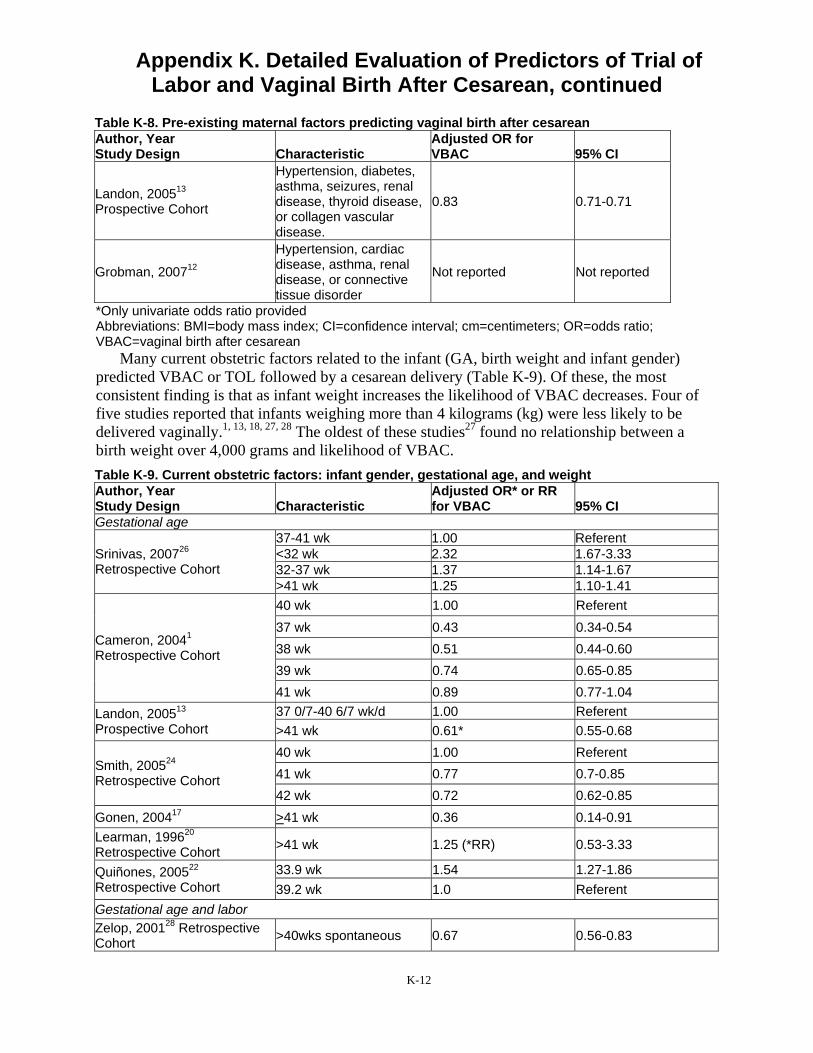
Appendix K. Detailed Evaluation of Predictors of Trial of Labor and Vaginal Birth After Cesarean, continued
Table K-8. Pre-existing maternal factors predicting vaginal birth after cesarean Author, Year Study Design Characteristic
Adjusted OR for VBAC 95% CI
Landon, 200513
Prospective Cohort
Hypertension, diabetes, asthma, seizures, renal disease, thyroid disease, or collagen vascular disease.
0.83 0.71-0.71
Grobman, 200712
Hypertension, cardiac disease, asthma, renal disease, or connective tissue disorder
Not reported Not reported
*Only univariate odds ratio provided Abbreviations: BMI=body mass index; CI=confidence interval; cm=centimeters; OR=odds ratio; VBAC=vaginal birth after cesarean
Many current obstetric factors related to the infant (GA, birth weight and infant gender) predicted VBAC or TOL followed by a cesarean delivery (Table K-9). Of these, the most consistent finding is that as infant weight increases the likelihood of VBAC decreases. Four of five studies reported that infants weighing more than 4 kilograms (kg) were less likely to be delivered vaginally.1, 13, 18, 27, 28 The oldest of these studies27 found no relationship between a birth weight over 4,000 grams and likelihood of VBAC. Table K-9. Current obstetric factors: infant gender, gestational age, and weight Author, Year Study Design Characteristic
Adjusted OR* or RR for VBAC 95% CI
Gestational age
Srinivas, 200726
Retrospective Cohort
37-41 wk 1.00 Referent <32 wk 2.32 1.67-3.33 32-37 wk 1.37 1.14-1.67 >41 wk 1.25 1.10-1.41
Cameron, 20041
Retrospective Cohort
40 wk 1.00 Referent 37 wk 0.43 0.34-0.54 38 wk 0.51 0.44-0.60 39 wk 0.74 0.65-0.85 41 wk 0.89 0.77-1.04
Landon, 200513
Prospective Cohort 37 0/7-40 6/7 wk/d 1.00 Referent >41 wk 0.61* 0.55-0.68
Smith, 200524
Retrospective Cohort
40 wk 1.00 Referent 41 wk 0.77 0.7-0.85 42 wk 0.72 0.62-0.85
Gonen, 200417 >41 wk 0.36 0.14-0.91 Learman, 199620
Retrospective Cohort >41 wk 1.25 (*RR) 0.53-3.33
Quiñones, 200522
Retrospective Cohort 33.9 wk 1.54 1.27-1.86 39.2 wk 1.0 Referent
Gestational age and labor Zelop, 200128 Retrospective Cohort >40wks spontaneous 0.67 0.56-0.83
K-12

Appendix K. Detailed Evaluation of Predictors of Trial of Labor and Vaginal Birth After Cesarean, continued
Table K-9. Current obstetric factors: infant gender, gestational age, and weight Author, Year Study Design Characteristic
Adjusted OR* or RR for VBAC 95% CI
Zelop, 200128 Retrospective Cohort >40wks induced 0.67 0.45-0.91
Birth weight Weinstein, 199627
Retrospective Cohort >4000g 1.05 0.20-5.88
Zelop, 200128
Retrospective Cohort >4000g 0.59 0.45-0.77
Gyamfi, 200418
Retrospective Cohort >4000g 0.49 0.30-0.78
Cameron, 20041
Retrospective Cohort
3000-3499g 1.0 Referent <2500g 0.66 0.45-0.97 2500-2999g 0.93 0.78-1.10 3500-3999g 0.75 0.66-0.85 >4000g 0.54 0.46-0.64
Landon, 200513
Prospective Cohort >4000g 0.50 0.43-0.56
Mean estimated fetal weight Gonen, 200417
Prospective Cohort 3360g + 395 0.9 0.8-0.9
Learman, 199620
Retrospective Cohort >3800g 0.53 (*RR) 0.24-1.11
Sex of Infant Smith, 200524
Retrospective Cohort Female 1.18 1.08-1.28
*Only univariate odds ratio provided Abbreviations: CI=confidence interval; d=day(s); g=gram(s); kg=kilogram(s); OR=odds ratio; RR=relative risk; VBAC=vaginal birth after cesarean; wk= week(s);
Obstetric factors related to the labor itself (dilation, effacement, station, Bishop score, cervix position) consistently predicted VBAC (Table K-10). Three prospective cohort studies,11, 13, 17
one retrospective study20 and one case-control study30 provided consistent evidence that women who were more dilated at admission or at rupture of membranes (ROM) were more likely to deliver vaginally. All three studies that examined effacement reported increased likelihood as effacement reached 75 to 100 percent.11, 17, 21 Similarly, all three studies that examined head position reported that as the baby’s position was vertex, engaged or at a lower station, the likelihood of VBAC increased.14, 19, 20 Both studies that examined Bishop’s score showed that as the score increased the likelihood of VBAC increased two15 to six times.27
Table K-10. Current obstetric factors: cervical dilation, etc Author, Year Study Design Characteristic
Adjusted OR* or RR for VBAC 95% CI
Cervical dilation at admission Flamm, 199711
Prospective Cohort >4cm 2.16 1.66-2.82
Landon, 200513
Prospective Cohort >4cm 2.56* 2.38-2.78
K-13
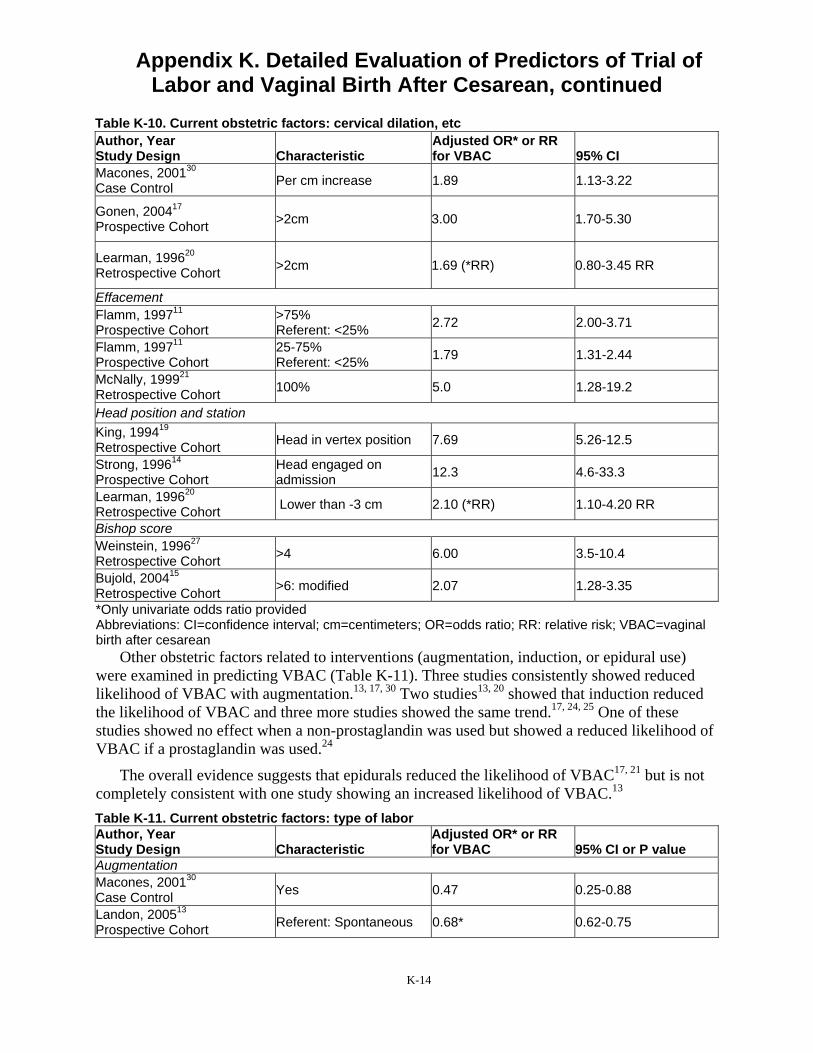
Appendix K. Detailed Evaluation of Predictors of Trial of Labor and Vaginal Birth After Cesarean, continued
Table K-10. Current obstetric factors: cervical dilation, etc Author, Year Study Design Characteristic
Adjusted OR* or RR for VBAC 95% CI
Macones, 200130
Case Control Per cm increase 1.89 1.13-3.22
Gonen, 200417
Prospective Cohort >2cm 3.00 1.70-5.30
Learman, 199620
Retrospective Cohort >2cm 1.69 (*RR) 0.80-3.45 RR
Effacement Flamm, 199711
Prospective Cohort >75% Referent: <25% 2.72 2.00-3.71
Flamm, 199711
Prospective Cohort 25-75% Referent: <25% 1.79 1.31-2.44
McNally, 199921
Retrospective Cohort 100% 5.0 1.28-19.2
Head position and station King, 199419
Retrospective Cohort Head in vertex position 7.69 5.26-12.5
Strong, 199614
Prospective Cohort Head engaged on admission 12.3 4.6-33.3
Learman, 199620
Retrospective Cohort Lower than -3 cm 2.10 (*RR) 1.10-4.20 RR
Bishop score Weinstein, 199627
Retrospective Cohort >4 6.00 3.5-10.4
Bujold, 200415
Retrospective Cohort >6: modified 2.07 1.28-3.35
*Only univariate odds ratio provided Abbreviations: CI=confidence interval; cm=centimeters; OR=odds ratio; RR: relative risk; VBAC=vaginal birth after cesarean
Other obstetric factors related to interventions (augmentation, induction, or epidural use) were examined in predicting VBAC (Table K-11). Three studies consistently showed reduced likelihood of VBAC with augmentation.13, 17, 30 Two studies13, 20 showed that induction reduced the likelihood of VBAC and three more studies showed the same trend.17, 24, 25 One of these studies showed no effect when a non-prostaglandin was used but showed a reduced likelihood of VBAC if a prostaglandin was used.24
The overall evidence suggests that epidurals reduced the likelihood of VBAC17, 21 but is not completely consistent with one study showing an increased likelihood of VBAC.13
Table K-11. Current obstetric factors: type of labor Author, Year Study Design Characteristic
Adjusted OR* or RR for VBAC 95% CI or P value
Augmentation Macones, 200130
Case Control Yes 0.47 0.25-0.88
Landon, 200513
Prospective Cohort Referent: Spontaneous 0.68* 0.62-0.75
K-14

Appendix K. Detailed Evaluation of Predictors of Trial of Labor and Vaginal Birth After Cesarean, continued
Table K-11. Current obstetric factors: type of labor Author, Year Study Design Characteristic
Adjusted OR* or RR for VBAC 95% CI or P value
Gonen, 200417
Prospective Cohort Augmentation with oxytocin 0.29 0.16-0.53
Spaans, 200225
Retrospective Cohort Yes 0.83 0.30-2.50
Induction
Gonen, 200417
Prospective Cohort
On admit Referent: in labor and ROM
0.6 0.3-1.5
Gonen, 200417
Prospective Cohort During labor 0.5 0.23-1.11
Landon, 200513
Prospective Cohort Referent: Spontaneous 0.5* 0.45-0.55
Learman, 199620
Retrospective Cohort Yes 0.34 (*RR) 0.19-0.67 RR
Spaans, 200225
Retrospective Cohort Yes 0.67 0.16-3.33
Smith, 200524
Retrospective Cohort IOL: Non-prostaglandin Referent: Spontaneous 1.00 0.87-1.14
Smith, 200524
Retrospective Cohort IOL: With prostaglandin Referent: Spontaneous 0.70 0.63-0.79
Epidural use McNally, 199921
Retrospective Cohort Yes 0.26 0.06-1.12
Landon, 200513
Prospective cohort Yes 2.70* 2.44-3.03
Gonen, 200417
Prospective Cohort Yes 0.17 0.09-0.35
*Only univariate odds ratio provided Abbreviations: CI=confidence interval; IOL=induction of labor; OR=odds ratio; ROM=rupture of membranes; RR=relative risk; VBAC=vaginal birth after cesarean Summary of Predictors of Vaginal Birth After Cesarean
With the exception of three studies,11, 12, 24 these prognostic studies of VBAC could be described as exploratory.37 According to Simon and Altman, studies that report association and identify patients at risk but that have not yet had results confirmed in followup studies with pre-stated hypotheses, do not yet provide sufficient evidence to change clinical practice.37 The three studies11, 12, 24 that provided this cross-validation evidence also proposed screening tools for VBAC and are discussed in detail in the section on Screening Tools for VBAC and in Appendix N.
Summary of Predictors Hispanic and African American women were more likely to have a TOL but less likely to
have a VBAC compared with non-Hispanic and white women, respectively. Women at rural and private hospitals had a decreased likelihood of TOL and a decreased likelihood of VBAC. A
K-15

Appendix K. Detailed Evaluation of Predictors of Trial of Labor and Vaginal Birth After Cesarean, continued
prior history of vaginal delivery was consistently reported to increase likelihood of VBAC. Women delivering infants over 4 kg have a reduced likelihood of VBAC. Greater progress of labor--measured as greater dilation, lower station and higher Bishop score--predicts a higher likelihood of VBAC. The effect of epidural use on the likelihood of VBAC is uncertain.
K-16
Appendix K. Detailed Evaluation of Predictors of Trial of Labor and Vaginal Birth After Cesarean, continued
References 1. Cameron CA, Roberts CL, Peat B.
Predictors of labor and vaginal birth after cesarean section. Int J Gynaecol Obstet. 2004;85(3):267-269.
2. McMahon MJ, Luther ER, Bowes WA, Jr., Olshan AF. Comparison of a trial of labor with an elective second cesarean section. N Engl J Med. 1996;335(10):689-695.
3. Pang MW, Law LW, Leung TY, Lai PY, La TK. Sociodemographic factors and pregnancy events associated with women who declined vaginal birth after cesarean section. Eur J Obstet Gynecol Reprod Biol. 2009;143(1):24-28.
4. Bujold E. Uterine rupture during a trial of labor after a one- versus two-layer closure of low transverse cesarean. Am J Obstet Gynecol. 2001;184(suppl)(S18).
5. Chang JJ, Stamilio DM, Macones GA. Effect of hospital volume on maternal outcomes in women with prior cesarean delivery undergoing trial of labor. Am J Epidemiol. 2008;167(6):711-718.
6. Harper LM, Cahill AG, Stamilio DM, Odibo AO, Peipert JF, Macones GA. Effect of gestational age at the prior cesarean delivery on maternal morbidity in subsequent VBAC attempt. Am J Obstet Gynecol. 2009;200(3):276.e271-276.
7. Hueston WJ, Rudy M. Factors predicting elective repeat cesarean delivery. Obstet Gynecol. 1994;83(5 Pt 1):741-744.
8. Selo-Ojeme D, Abulhassan N, Mandal R, Tirlapur S, Selo-Ojeme U. Preferred and actual delivery
mode after a cesarean in London, UK. Int J Gynaecol Obstet. 2008;102(2):156-159.
9. Kabir AA, Pridjian G, Steinmann WC, Herrera EA, Khan MM. Racial differences in cesareans: an analysis of U.S. 2001 National Inpatient Sample Data. Obstet Gynecol. 2005;105(4):710-718.
10. Macones GA, Peipert J, Nelson DB, et al. Maternal complications with vaginal birth after cesarean delivery: a multicenter study. Am J Obstet Gynecol. 2005;193(5):1656-1662.
11. Flamm BL, Geiger AM. Vaginal birth after cesarean delivery: an admission scoring system. Obstet Gynecol. 1997;90(6):907-910.
12. Grobman WA, Lai Y, Landon MB, et al. Development of a nomogram for prediction of vaginal birth after cesarean delivery. Obstet Gynecol. 2007;109(4):806-812.
13. Landon MB, Leindecker S, Spong CY, et al. The MFMU Cesarean Registry: factors affecting the success of trial of labor after previous cesarean delivery. Am J Obstet Gynecol. 2005;193(3 Pt 2):1016-1023.
14. Strong JM, McQuillan K. Factors affecting mode of delivery in labour following a single previous birth by cesarean. Journal of Obs & Gyn. 1996;16(5).
15. Bujold E, Blackwell SC, Hendler I, Berman S, Sorokin Y, Gauthier RJ. Modified Bishop's score and induction of labor in patients with a previous cesarean delivery. Am J
K-17
Appendix K. Detailed Evaluation of Predictors of Trial of Labor and Vaginal Birth After Cesarean, continued
Obstet Gynecol. 2004;191(5):1644-1648.
16. Caughey AB, Shipp TD, Repke JT, Zelop CM, Cohen A, Lieberman E. Rate of uterine rupture during a trial of labor in women with one or two prior cesarean deliveries. Am J Obstet Gynecol. 1999;181(4):872-876.
17. Gonen R, Tamir A, Degani S, Ohel G. Variables associated with successful vaginal birth after one cesarean section: a proposed vaginal birth after cesarean section score. Am J Perinatol. 2004;21(8):447-453.
18. Gyamfi C, Juhasz G, Gyamfi P, Stone JL. Increased success of trial of labor after previous vaginal birth after cesarean. Obstet Gynecol. 2004;104(4):715-719.
19. King DE, Lahiri K. Socioeconomic factors and the odds of vaginal birth after cesarean delivery. JAMA. 1994;272(7):524-529.
20. Learman LA, Evertson LR, Shiboski S. Predictors of repeat cesarean delivery after trial of labor: do any exist? J Am Coll Surg. 1996;182(3):257-262.
21. McNally OM, Turner MJ. Induction of labour after 1 previous Caesarean section. Aust N Z J Obstet Gynaecol. 1999;39(4):425-429.
22. Quinones JN, Stamilio DM, Pare E, Peipert JF, Stevens E, Macones GA. The effect of prematurity on vaginal birth after cesarean delivery: success and maternal morbidity. Obstet Gynecol. 2005;105(3):519-524.
23. Shipp TD, Zelop CM, Repke JT, Cohen A, Caughey AB, Lieberman E. Labor after previous cesarean:
influence of prior indication and parity. Obstet Gynecol. 2000;95(6 Pt 1):913-916.
24. Smith GCS, White IR, Pell JP, Dobbie R. Predicting cesarean section and uterine rupture among women attempting vaginal birth after prior cesarean section. PLoS Med. 2005;2(9):e252.
25. Spaans WA, Sluijs MB, van Roosmalen J, Bleker OP. Risk factors at caesarean section and failure of subsequent trial of labour. Eur J Obstet Gynecol Reprod Biol. 2002;100(2):163-166.
26. Srinivas SK, Stamilio DM, Stevens EJ, Odibo AO, Peipert JF, Macones GA. Predicting failure of a vaginal birth attempt after cesarean delivery. Obstet Gynecol. 2007;109(4):800-805.
27. Weinstein D, Benshushan A, Tanos V, Zilberstein R, Rojansky N. Predictive score for vaginal birth after cesarean section. Am J Obstet Gynecol. 1996;174(1 Pt 1):192-198.
28. Zelop CM, Shipp TD, Cohen A, Repke JT, Lieberman E. Trial of labor after 40 weeks' gestation in women with prior cesarean. Obstet Gynecol. 2001;97(3):391-393.
29. Zelop CM, Shipp TD, Repke JT, Cohen A, Lieberman E. Outcomes of trial of labor following previous cesarean delivery among women with fetuses weighing >4000 g. Am J Obstet Gynecol. 2001;185(4):903-905.
30. Macones GA, Hausman N, Edelstein R, Stamilio DM, Marder SJ. Predicting outcomes of trials of labor in women attempting vaginal birth
K-18
Appendix K. Detailed Evaluation of Predictors of Trial of Labor and Vaginal Birth After Cesarean, continued
after cesarean delivery: a comparison of multivariate methods with neural networks. Am J Obstet Gynecol. 2001;184(3):409-413.
31. Eden KB, Hashima JN, Osterweil P, Nygren P, Guise J-M. Childbirth preferences after cesarean birth: a review of the evidence. Birth. 2004;31(1):49-60.
32. McClain CS. The making of a medical tradition: vaginal birth after cesarean. Soc Sci Med. 1990;31(2):203-210.
33. Caughey AB, Shipp TD, Repke JT, Zelop C, Cohen A, Lieherman E. Trial of labor after cesarean delivery: the effect of previous vaginal delivery. Am J Obstet Gynecol. 1998;179(4):938-941.
34. Elkousy MA, Sammel M, Stevens E, Peipert JF, Macones G. The effect of
birth weight on vaginal birth after cesarean delivery success rates. Am J Obstet Gynecol. 2003;188(3):824-830.
35. Mercer BM, Gilbert S, Landon MB, et al. Labor outcomes with increasing number of prior vaginal births after cesarean delivery. Obstet Gynecol. 2008;111(2 Pt 1):285-291.
36. Huang WH, Nakashima DK, Rumney PJ, Keegan KA, Jr., Chan K. Interdelivery interval and the success of vaginal birth after cesarean delivery. Obstet Gynecol. 2002;99(1):41-44.
37. Simon R, Altman D. Statistical aspects of prognostic factor studies in oncology. Br J Cancer. 1994;69:979-985.
K-19

Appendix L. Detailed Evaluation of Vaginal Birth After Cesarean Rates
Introduction A brief description on the vaginal birth after cesarean (VBAC) rate is included in the text of
the evidence report. Detailed descriptions of the studies and analyses conducted on this topic are included in this appendix.
Vaginal Birth After Cesarean Sixty-seven studies, 14 fair quality prospective cohort studies1-14 and 53 retrospective cohort
studies15-67 provided an overall summary estimate for VBAC of 74 percent (95 percent CI: 72 to 75 percent). The heterogeneity of this meta-analysis of 67 observational studies that included 368,304 women was high, I2 greater than 98 percent. To examine this heterogeneity, these studies were stratified and analyzed by study design (prospective versus retrospective; true cohort that included trial of labor (TOL) and elective repeat cesarean delivery (ERCD) versus studies of TOL only), country (United States [U.S.] versus non-U.S.), gestational age ([GA] term only versus all GAs) and by years when the data were collected (completed before 1996, during 1996, and started after 1996). None of these factors were found to result in statistically significant differences analysis of study design yielded a statistically significant association (p<0.05). The summary estimate for VBAC for 14 prospective studies was 73 percent (95 percent CI: 71 to 74 percent) compared with 77 percent (95 percent CI: 75 to 79 percent) for the 53 retrospective studies. The VBAC rate did not differ between studies that included both TOL and ERCD groups and those that focused exclusively on TOL (73 percent; 95 percent CI: 71 to 75 percent versus 74 percent; 95 percent CI 71 to 77 percent).Similarly when studies were stratified by country (U.S. versus Non-U.S.) and by GA at enrollment (term versus non-term studies), no clear associations emerged (Figures L-1 and L-2). The summary estimates for rates of VBAC were similar: for the 43 studies conducted in the U.S., 74 percent (95 percent CI: 72 to 76 percent) versus 73 percent (95 percent CI: 71 to 74 percent) for the 24 studies conducted outside the U.S.. In examining the GA for enrolled patients, the summary estimates for rates of VBAC were again similar: for the 18 studies of term deliveries, 73 percent (95 percent CI: 71 to 75 percent) versus 74 percent (95 percent CI: 72 to 76 percent) for the 49 studies that included preterm and term deliveries.
L-1
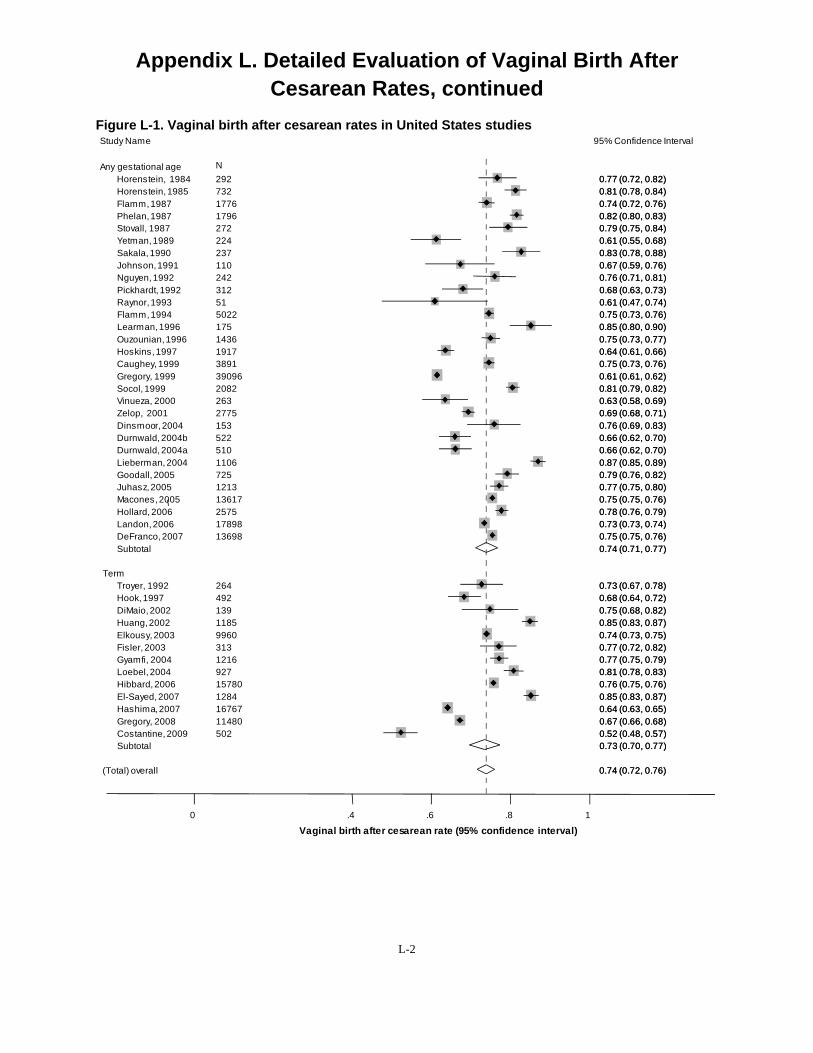
00..77 (77 (00..72,72, 0.0.82)82) 00..81 (81 (00..78,78, 0.0.84)84) 00..74 (74 (00..72,72, 0.0.76)76) 00..82 (82 (00..80,80, 0.0.83)83) 00..79 (79 (00..75,75, 0.0.84)84) 00..61 (61 (00..55,55, 0.0.68)68) 00..83 (83 (00..78,78, 0.0.88)88) 00..67 (67 (00..59,59, 0.0.76)76) 00..76 (76 (00..71,71, 0.0.81)81) 00..68 (68 (00..63,63, 0.0.73)73) 00..61 (61 (00..47,47, 0.0.74)74) 00..75 (75 (00..73,73, 0.0.76)76) 00..85 (85 (00..80,80, 0.0.90)90) 00..75 (75 (00..73,73, 0.0.77)77) 00..64 (64 (00..61,61, 0.0.66)66) 00..75 (75 (00..73,73, 0.0.76)76) 00..61 (61 (00..61,61, 0.0.62)62) 00..81 (81 (00..79,79, 0.0.82)82) 00..63 (63 (00..58,58, 0.0.69)69) 00..69 (69 (00..68,68, 0.0.71)71) 00..76 (76 (00..69,69, 0.0.83)83) 00..66 (66 (00..62,62, 0.0.70)70) 00..66 (66 (00..62,62, 0.0.70)70) 00..87 (87 (00..85,85, 0.0.89)89) 00..79 (79 (00..76,76, 0.0.82)82) 00..77 (77 (00..75,75, 0.0.80)80) 00..75 (75 (00..75,75, 0.0.76)76) 00..78 (78 (00..76,76, 0.0.79)79) 00..73 (73 (00..73,73, 0.0.74)74) 00..75 (75 (00..75,75, 0.0.76)76) 00..74 (74 (00..71,71, 0.0.77)77)
00..73 (73 (00..67,67, 0.0.78)78) 00..68 (68 (00..64,64, 0.0.72)72) 00..75 (75 (00..68,68, 0.0.82)82) 00..85 (85 (00..83,83, 0.0.87)87) 00..74 (74 (00..73,73, 0.0.75)75) 00..77 (77 (00..72,72, 0.0.82)82) 00..77 (77 (00..75,75, 0.0.79)79) 00..81 (81 (00..78,78, 0.0.83)83) 00..76 (76 (00..75,75, 0.0.76)76) 00..85 (85 (00..83,83, 0.0.87)87) 00..64 (64 (00..63,63, 0.0.65)65) 00..67 (67 (00..66,66, 0.0.68)68) 00..52 (52 (00..48,48, 0.0.57)57) 00..73 (73 (00..70,70, 0.0.77)77)
00..74 (74 (00..72,72, 0.0.76)76)
Appendix L. Detailed Evaluation of Vaginal Birth After Cesarean Rates, continued
Figure L-1. Vaginal birth after cesarean rates in United States studies Study Name 95% Confidence Interval
Any gestational age N
Horenstein, 1984 292 Horenstein, 1985 732 Flamm,1987 1776 Phelan,1987 1796 Stovall, 1987 272 Yetman, 1989 224 Sakala, 1990 237 Johnson,1991 110 Nguyen, 1992 242 Pickhardt, 1992 312 Raynor,1993 51 Flamm,1994 5022 Learman,1996 175 Ouzounian,1996 1436 Hoskins,1997 1917 Caughey, 1999 3891 Gregory, 1999 39096 Socol, 1999 2082 Vinueza, 2000 263 Zelop, 2001 2775 Dinsmoor, 2004 153 Durnwald, 2004b 522 Durnwald, 2004a 510 Lieberman, 2004 1106 Goodall, 2005 725 Juhasz,2005 1213 Macones,2005 13617 Hollard, 2006 2575 Landon, 2006 17898 DeFranco, 2007 13698 Subtotal
Term Troyer, 1992 264 Hook, 1997 492 DiMaio, 2002 139 Huang,2002 1185 Elkousy, 2003 9960 Fisler, 2003 313 Gyamfi, 2004 1216 Loebel, 2004 927 Hibbard, 2006 15780 El-Sayed, 2007 1284 Hashima,2007 16767 Gregory, 2008 11480 Costantine, 2009 502 Subtotal
(Total) overall
0 .4 .6 .8 1
Vaginal birth after cesarean rate (95% confidence interval)
L-2
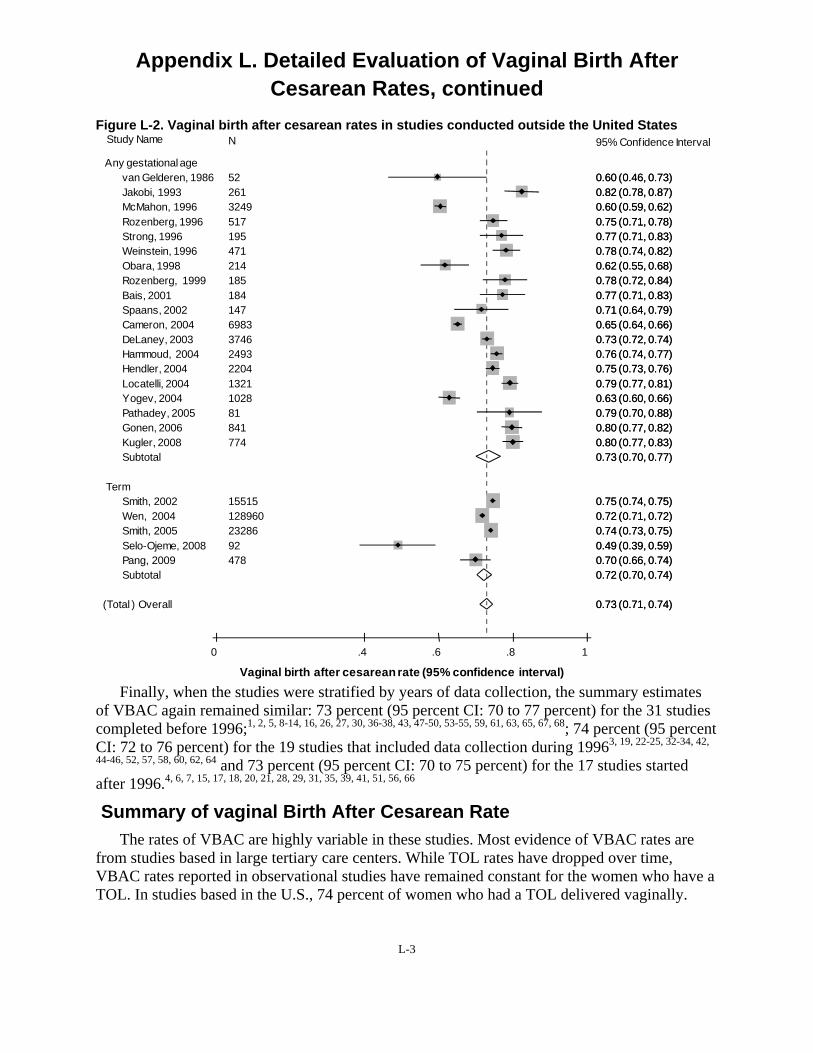
0.0.60 (60 (00..46,46, 0.0.73)73) 0.0.82 (82 (00..78,78, 0.0.87)87) 0.0.60 (60 (00..59,59, 0.0.62)62) 0.0.75 (75 (00..71,71, 0.0.78)78) 0.0.77 (77 (00..71,71, 0.0.83)83) 0.0.78 (78 (00..74,74, 0.0.82)82) 0.0.62 (62 (00..55,55, 0.0.68)68) 0.0.78 (78 (00..72,72, 0.0.84)84) 0.0.77 (77 (00..71,71, 0.0.83)83) 0.0.71 (71 (00..64,64, 0.0.79)79) 0.0.65 (65 (00..64,64, 0.0.66)66) 0.0.73 (73 (00..72,72, 0.0.74)74) 0.0.76 (76 (00..74,74, 0.0.77)77) 0.0.75 (75 (00..73,73, 0.0.76)76) 0.0.79 (79 (00..77,77, 0.0.81)81) 0.0.63 (63 (00..60,60, 0.0.66)66) 0.0.79 (79 (00..70,70, 0.0.88)88) 0.0.80 (80 (00..77,77, 0.0.82)82) 0.0.80 (80 (00..77,77, 0.0.83)83) 0.0.73 (73 (00..70,70, 0.0.77)77)
0.0.75 (75 (00..74,74, 0.0.75)75) 0.0.72 (72 (00..71,71, 0.0.72)72) 0.0.74 (74 (00..73,73, 0.0.75)75) 0.0.49 (49 (00..39,39, 0.0.59)59) 0.0.70 (70 (00..66,66, 0.0.74)74) 0.0.72 (72 (00..70,70, 0.0.74)74)
0.0.73 (73 (00..71,71, 0.0.74)74)
Appendix L. Detailed Evaluation of Vaginal Birth After Cesarean Rates, continued
Figure L-2. Vaginal birth after cesarean rates in studies conducted outside the United States Study Name N 95% Confidence Interval
Any gestational age van Gelderen, 1986 52 Jakobi, 1993 McMahon, 1996 Rozenberg, 1996 Strong, 1996 Weinstein, 1996 Obara, 1998 Rozenberg, 1999 Bais, 2001 Spaans, 2002 Cameron, 2004 DeLaney, 2003 Hammoud, 2004 Hendler, 2004 Locatelli, 2004 Yogev, 2004 Pathadey, 2005 Gonen, 2006 Kugler, 2008 Subtotal
Term Smith, 2002 Wen, 2004 Smith, 2005 Selo-Ojeme, 2008 Pang, 2009 Subtotal
(Total ) Overall
261 3249 517 195 471 214 185 184 147 6983 3746 2493 2204 1321 1028 81 841 774
15515 128960 23286 92 478
0 .4 .6 .8 1
Vaginal birth after cesarean rate (95% confidence interval)
Finally, when the studies were stratified by years of data collection, the summary estimates of VBAC again remained similar: 73 percent (95 percent CI: 70 to 77 percent) for the 31 studies completed before 1996;1, 2, 5, 8-14, 16, 26, 27, 30, 36-38, 43, 47-50, 53-55, 59, 61, 63, 65, 67, 68; 74 percent (95 percent CI: 72 to 76 percent) for the 19 studies that included data collection during 19963, 19, 22-25, 32-34, 42,
44-46, 52, 57, 58, 60, 62, 64 and 73 percent (95 percent CI: 70 to 75 percent) for the 17 studies started after 1996.4, 6, 7, 15, 17, 18, 20, 21, 28, 29, 31, 35, 39, 41, 51, 56, 66
Summary of vaginal Birth After Cesarean Rate The rates of VBAC are highly variable in these studies. Most evidence of VBAC rates are
from studies based in large tertiary care centers. While TOL rates have dropped over time, VBAC rates reported in observational studies have remained constant for the women who have a TOL. In studies based in the U.S., 74 percent of women who had a TOL delivered vaginally.
L-3

Appendix L. Detailed Evaluation of Vaginal Birth After Cesarean Rates, continued
References 1. Bais JM, van der Borden DM, Pel M,
et al. Vaginal birth after caesarean section in a population with a low overall caesarean section rate. Eur J Obstet Gynecol Reprod Biol. 2001;96(2):158-162.
2. Flamm BL, Goings JR, Liu Y, Wolde-Tsadik G. Elective repeat cesarean delivery versus trial of labor: a prospective multicenter study. Obstet Gynecol. 1994;83(6):927-932.
3. Hendler I, Bujold E. Effect of prior vaginal delivery or prior vaginal birth after cesarean delivery on obstetric outcomes in women undergoing trial of labor. Obstet Gynecol. 2004;104(2):273-277.
4. Hibbard JU, Gilbert S, Landon MB, et al. Trial of labor or repeat cesarean delivery in women with morbid obesity and previous cesarean delivery. Obstet Gynecol. 2006;108(1):125-133.
5. Hook B, Kiwi R, Amini SB, Fanaroff A, Hack M. Neonatal morbidity after elective repeat cesarean section and trial of labor. Pediatrics. 1997;100(3 Pt 1):348-353.
6. Jakobi P, Weissman A, Peretz BA, Hocherman I. Evaluation of prognostic factors for vaginal delivery after cesarean section. J Reprod Med. 1993;38(9):729-733.
7. Landon MB, Spong CY, Thom E, et al. Risk of uterine rupture with a trial of labor in women with multiple and single prior cesarean delivery. Obstet Gynecol. 2006;108(1):12-20.
8. Lieberman E, Ernst EK, Rooks JP, Stapleton S, Flamm B. Results of the national study of vaginal birth after cesarean in birth centers. Obstet Gynecol. 2004;104(5 Pt 1):933-942.
9. Phelan JP, Clark SL, Diaz F, Paul RH. Vaginal birth after cesarean. Am J Obstet Gynecol. 1987;157(6):1510-1515.
10. Rozenberg P, Goffinet F, Philippe HJ, Nisand I. Thickness of the lower uterine segment: its influence in the management of patients with previous cesarean sections. Eur J Obstet Gynecol Reprod Biol. 1999;87(1):39-45.
11. Rozenberg P, Goffinet F, Phillippe HJ, Nisand I. Ultrasonographic measurement of lower uterine segment to assess risk of defects of scarred uterus. Lancet. 1996;347(8997):281-284.
12. Stovall TG, Shaver DC, Solomon SK, Anderson GD. Trial of labor in previous cesarean section patients, excluding classical cesarean sections. Obstet Gynecol. 1987;70(5):713-717.
13. Strong JM, McQuillan K. Factors affecting mode of delivery in labour following a single previous birth by cesarean. Journal of Obs & Gyn. 1996;16(5).
14. van Gelderen CJ, England MJ, Naylor GA, Katzeff TC. Labour in patients with a caesarean section scar. The place of oxytocin augmentation. Samj, S. 1986;70(9):529-532.
15. Cameron CA, Roberts CL, Peat B. Predictors of labor and vaginal birth
L-4

Appendix L. Detailed Evaluation of Vaginal Birth After Cesarean Rates, continued
after cesarean section. Int J Gynaecol Obstet. 2004;85(3):267-269.
16. Caughey AB, Shipp TD, Repke JT, Zelop CM, Cohen A, Lieberman E. Rate of uterine rupture during a trial of labor in women with one or two prior cesarean deliveries. Am J Obstet Gynecol. 1999;181(4):872-876.
17. Costantine MM, Fox K, Byers BD, et al. Validation of the prediction model for success of vaginal birth after cesarean delivery. Obstet Gynecol. 2009;114(5):1029-1033.
18. DeFranco EA, Rampersad R, Atkins KL, et al. Do vaginal birth after cesarean outcomes differ based on hospital setting? Am J Obstet Gynecol. 2007;197(4):400.e401-406.
19. Delaney T, Young DC. Spontaneous versus induced labor after a previous cesarean delivery. Obstet Gynecol. 2003;102(1):39-44.
20. DiMaio H, Edwards RK, Euliano TY, Treloar RW, Cruz AC. Vaginal birth after cesarean delivery: an historic cohort cost analysis. Am J Obstet Gynecol. 2002;186(5):890-892.
21. Dinsmoor MJ, Brock EL. Predicting failed trial of labor after primary cesarean delivery. Obstet Gynecol. 2004;103(2):282-286.
22. Durnwald C, Mercer B. Vaginal birth after Cesarean delivery: predicting success, risks of failure. J Matern Fetal Neonatal Med. 2004;15(6):388-393.
23. Durnwald CP, Ehrenberg HM, Mercer BM. The impact of maternal obesity and weight gain on vaginal
birth after cesarean section success. Am J Obstet Gynecol. 2004;191(3):954-957.
24. Elkousy MA, Sammel M, Stevens E, Peipert JF, Macones G. The effect of birth weight on vaginal birth after cesarean delivery success rates. Am J Obstet Gynecol. 2003;188(3):824-830.
25. El-Sayed YY, Watkins MM, Fix M, Druzin ML, Pullen KM, Caughey AB. Perinatal outcomes after successful and failed trials of labor after cesarean delivery. Am J Obstet Gynecol. 2007;196(6):583.e581-585; discussion 583.e585.
26. Fisler RE, Cohen A, Ringer SA, Lieberman E. Neonatal outcome after trial of labor compared with elective repeat cesarean section. Birth. 2003;30(2):83-88.
27. Flamm BL, Goings JR, Fuelberth NJ, Fischermann E, Jones C, Hersh E. Oxytocin during labor after previous cesarean section: results of a multicenter study. Obstet Gynecol. 1987;70(5):709-712.
28. Gonen R, Nisenblat V, Barak S, Tamir A, Ohel G. Results of a well-defined protocol for a trial of labor after prior cesarean delivery. Obstet Gynecol. 2006;107(2 Pt 1):240-245.
29. Goodall PT, Ahn JT, Chapa JB, Hibbard JU. Obesity as a risk factor for failed trial of labor in patients with previous cesarean delivery. Am J Obstet Gynecol. 2005;192(5):1423-1426.
30. Gregory KD, Korst LM, Cane P, Platt LD, Kahn K. Vaginal birth after cesarean and uterine rupture rates in
L-5
Appendix L. Detailed Evaluation of Vaginal Birth After Cesarean Rates, continued
California. Obstet Gynecol. 1999;94(6):985-989.
31. Gregory KD, Korst LM, Fridman M, et al. Vaginal birth after cesarean: clinical risk factors associated with adverse outcome. Am J Obstet Gynecol. 2008;198(4):452.e451-410; discussion 452.e410-452.
32. Gyamfi C, Juhasz G, Gyamfi P, Stone JL. Increased success of trial of labor after previous vaginal birth after cesarean. Obstet Gynecol. 2004;104(4):715-719.
33. Hammoud A, Hendler I, Gauthier RJ, Berman S, Sansregret A, Bujold E. The effect of gestational age on trial of labor after Cesarean section. J Matern Fetal Neonatal Med. 2004;15(3):202-206.
34. Hashima JN, Guise J-M. Vaginal birth after cesarean: a prenatal scoring tool. Am J Obstet Gynecol. 2007;196(5):e22-23.
35. Hollard AL, Wing DA, Chung JH, et al. Ethnic disparity in the success of vaginal birth after cesarean delivery. J Matern Fetal Neonatal Med. 2006;19(8):483-487.
36. Horenstein JM, Eglinton GS, Tahilramaney MP, Boucher M, Phelan JP. Oxytocin use during a trial of labor in patients with previous cesarean section. J Reprod Med. 1984;29(1):26-30.
37. Horenstein JM, Phelan JP. Previous cesarean section: the risks and benefits of oxytocin usage in a trial of labor. Am J Obstet Gynecol. 1985;151(5):564-569.
38. Hoskins IA, Gomez JL. Correlation between maximum cervical
dilatation at cesarean delivery and subsequent vaginal birth after cesarean delivery. Obstet Gynecol. 1997;89(4):591-593.
39. Huang WH, Nakashima DK, Rumney PJ, Keegan KA, Jr., Chan K. Interdelivery interval and the success of vaginal birth after cesarean delivery. Obstet Gynecol. 2002;99(1):41-44.
40. Johnson C, Oriol N, Flood K. Trial of labor: a study of 110 patients. J Clin Anesth. 1991;3(3):216-218; discussion 214-215.
41. Juhasz G, Gyamfi C, Gyamfi P, Tocce K, Stone JL. Effect of body mass index and excessive weight gain on success of vaginal birth after cesarean delivery. Obstet Gynecol. 2005;106(4):741-746.
42. Kugler E, Shoham-Vardi I, Burstien E, Mazor M, Hershkovitz R. The safety of a trial of labor after cesarean section in a grandmultiparous population. Arch Gynecol Obstet. 2008;277(4):339-344.
43. Learman LA, Evertson LR, Shiboski S. Predictors of repeat cesarean delivery after trial of labor: do any exist? J Am Coll Surg. 1996;182(3):257-262.
44. Locatelli A, Regalia AL, Ghidini A, Ciriello E, Biffi A, Pezzullo JC. Risks of induction of labour in women with a uterine scar from previous low transverse caesarean section. BJOG. 2004;111(12):1394-1399.
45. Loebel G, Zelop CM, Egan JFX, Wax J. Maternal and neonatal
L-6
Appendix L. Detailed Evaluation of Vaginal Birth After Cesarean Rates, continued
morbidity after elective repeat Cesarean delivery versus a trial of labor after previous Cesarean delivery in a community teaching hospital. J Matern Fetal Neonatal Med. 2004;15(4):243-246.
46. Macones GA, Peipert J, Nelson DB, et al. Maternal complications with vaginal birth after cesarean delivery: a multicenter study. Am J Obstet Gynecol. 2005;193(5):1656-1662.
47. McMahon MJ, Luther ER, Bowes WA, Jr., Olshan AF. Comparison of a trial of labor with an elective second cesarean section. N Engl J Med. 1996;335(10):689-695.
48. Nguyen TV, Dinh TV, Suresh MS, Kinch RA, Anderson GD. Vaginal birth after cesarean section at the University of Texas. J Reprod Med. 1992;37(10):880-882.
49. Obara H, Minakami H, Koike T, Takamizawa S, Matsubara S, Sato I. Vaginal birth after cesarean delivery: results in 310 pregnancies. J Obstet Gynaecol Res. 1998;24(2):129-134.
50. Ouzounian JG, Miller DA, Paul RH. Amnioinfusion in women with previous cesarean births: a preliminary report. Am J Obstet Gynecol. 1996;174(2):783-786.
51. Pang MW, Law LW, Leung TY, Lai PY, La TK. Sociodemographic factors and pregnancy events associated with women who declined vaginal birth after cesarean section. Eur J Obstet Gynecol Reprod Biol. 2009;143(1):24-28.
52. Pathadey SD, Van Woerden HC, Jenkinson SD. Induction of labour after a previous caesarean section: a
retrospective study in a district general hospital. J Obstet Gynaecol. 2005;25(7):662-665.
53. Pickhardt MG, Martin JN, Jr., Meydrech EF, et al. Vaginal birth after cesarean delivery: are there useful and valid predictors of success or failure? Am J Obstet Gynecol. 1992;166(6 Pt 1):1811-1815; discussion 1815-1819.
54. Raynor BD. The experience with vaginal birth after cesarean delivery in a small rural community practice. Am J Obstet Gynecol. 1993;168(1 Pt 1):60-62.
55. Sakala EP, Kaye S, Murray RD, Munson LJ. Oxytocin use after previous cesarean: why a higher rate of failed labor trial? Obstet Gynecol. 1990;75(3 Pt 1):356-359.
56. Selo-Ojeme D, Abulhassan N, Mandal R, Tirlapur S, Selo-Ojeme U. Preferred and actual delivery mode after a cesarean in London, UK. Int J Gynaecol Obstet. 2008;102(2):156-159.
57. Smith GCS, Pell JP, Cameron AD, Dobbie R. Risk of perinatal death associated with labor after previous cesarean delivery in uncomplicated term pregnancies. JAMA. 2002;287(20):2684-2690.
58. Smith GCS, White IR, Pell JP, Dobbie R. Predicting cesarean section and uterine rupture among women attempting vaginal birth after prior cesarean section. PLoS Med. 2005;2(9):e252.
59. Socol ML, Peaceman AM. Vaginal birth after cesarean: an appraisal of
L-7

Appendix L. Detailed Evaluation of Vaginal Birth After Cesarean Rates, continued
fetal risk. Obstet Gynecol. 1999;93(5 Pt 1):674-679.
60. Spaans WA, Sluijs MB, van Roosmalen J, Bleker OP. Risk factors at caesarean section and failure of subsequent trial of labour. Eur J Obstet Gynecol Reprod Biol. 2002;100(2):163-166.
61. Troyer LR, Parisi VM. Obstetric parameters affecting success in a trial of labor: designation of a scoring system. Am J Obstet Gynecol. 1992;167(4 Pt 1):1099-1104.
62. Vinueza CA, Chauhan SP, Barker L, Hendrix NW, Scardo JA. Predicting the success of a trial of labor with a simple scoring system. J Reprod Med. 2000;45(4):332-336.
63. Weinstein D, Benshushan A, Tanos V, Zilberstein R, Rojansky N. Predictive score for vaginal birth after cesarean section. Am J Obstet Gynecol. 1996;174(1 Pt 1):192-198.
64. Wen SW, Rusen ID, Walker M, et al. Comparison of maternal mortality and morbidity between trial of labor
and elective cesarean section among women with previous cesarean delivery. Am J Obstet Gynecol. 2004;191(4):1263-1269.
65. Yetman TJ, Nolan TE. Vaginal birth after cesarean section: a reappraisal of risk. Am J Obstet Gynecol. 1989;161(5):1119-1123.
66. Yogev Y, Ben-Haroush A, Lahav E, Horowitz E, Hod M, Kaplan B. Induction of labor with prostaglandin E2 in women with previous cesarean section and unfavorable cervix. Eur J Obstet Gynecol Reprod Biol. 2004;116(2):173-176.
67. Zelop CM, Shipp TD, Cohen A, Repke JT, Lieberman E. Trial of labor after 40 weeks' gestation in women with prior cesarean. Obstet Gynecol. 2001;97(3):391-393.
68. Johnson KC, Gaskin IM. Vaginal delivery after caesarean section. Safety of single-layer suturing in caesarean sections must be proved. BMJ. 2001;323(7324):1307-1308.
L-8
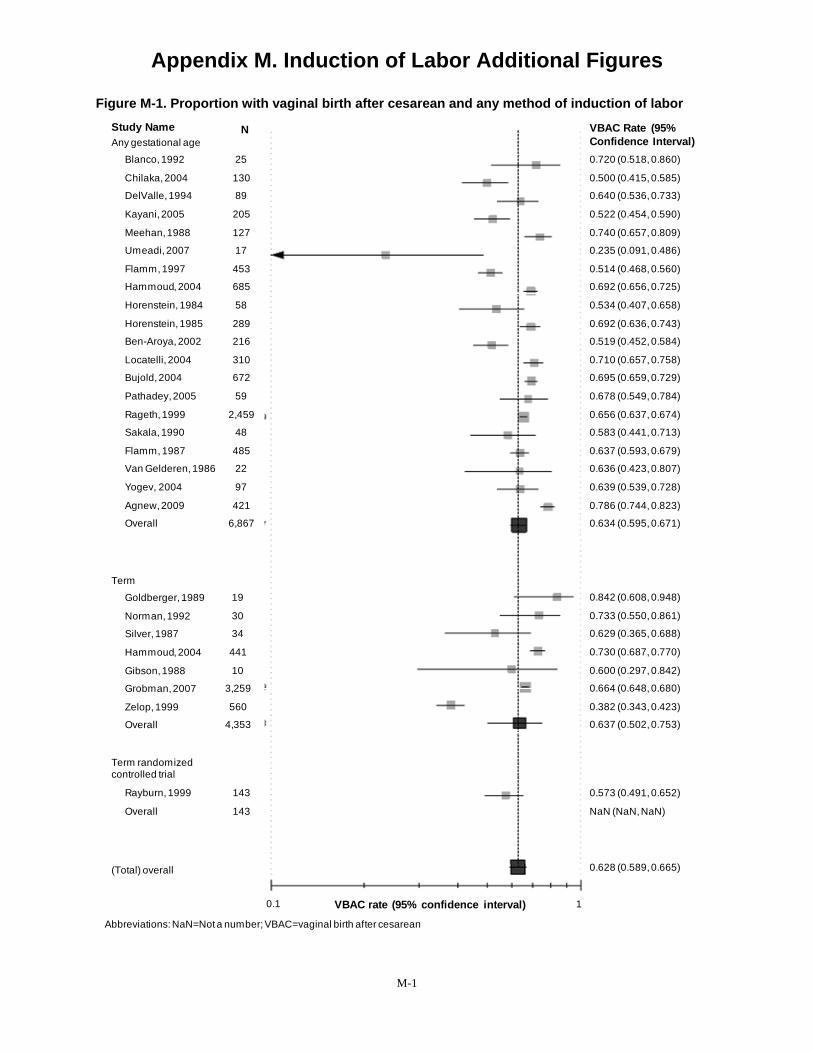
percent Augmented with oxytocin
Appendix M. Induction of Labor Additional Figures
Figure M-1. Proportion with vaginal birth after cesarean and any method of induction of labor Study Name Any gestational age
Blanco, 1992
Chilaka, 2004
DelValle, 1994
Kayani, 2005
Meehan, 1988
Umeadi, 2007
Flamm, 1997
Hammoud, 2004
Horenstein, 1984
Horenstein, 1985
Ben-Aroya, 2002
Locatelli, 2004
Bujold, 2004
Pathadey, 2005
Rageth, 1999
Sakala, 1990
Flamm, 1987
Van Gelderen, 1986
Yogev, 2004
Agnew, 2009
Overall
Term
Goldberger, 1989
Norman, 1992
Silver, 1987
Hammoud, 2004
Gibson, 1988
Grobman, 2007
Zelop, 1999
Overall
Term randomized controlled trial
Rayburn, 1999
Overall
(Total) overall
N
25
130
89
205
127
17
453
685
58
289
216
310
672
59
2,459
48
485
22
97
421
6,867
19
30
34
441
10
3,259
560
4,353
143
143
0.1 VBAC rate (95% confidence interval)
VBAC Rate (95% Confidence Interval) 0.720 (0.518, 0.860)
0.500 (0.415, 0.585)
0.640 (0.536, 0.733)
0.522 (0.454, 0.590)
0.740 (0.657, 0.809)
0.235 (0.091, 0.486)
0.514 (0.468, 0.560)
0.692 (0.656, 0.725)
0.534 (0.407, 0.658)
0.692 (0.636, 0.743)
0.519 (0.452, 0.584)
0.710 (0.657, 0.758)
0.695 (0.659, 0.729)
0.678 (0.549, 0.784)
0.656 (0.637, 0.674)
0.583 (0.441, 0.713)
0.637 (0.593, 0.679)
0.636 (0.423, 0.807)
0.639 (0.539, 0.728)
0.786 (0.744, 0.823)
0.634 (0.595, 0.671)
0.842 (0.608, 0.948)
0.733 (0.550, 0.861)
0.629 (0.365, 0.688)
0.730 (0.687, 0.770)
0.600 (0.297, 0.842)
0.664 (0.648, 0.680)
0.382 (0.343, 0.423)
0.637 (0.502, 0.753)
0.573 (0.491, 0.652)
NaN (NaN, NaN)
0.628 (0.589, 0.665)
1
Abbreviations: NaN=Not a number; VBAC=vaginal birth after cesarean
M-1
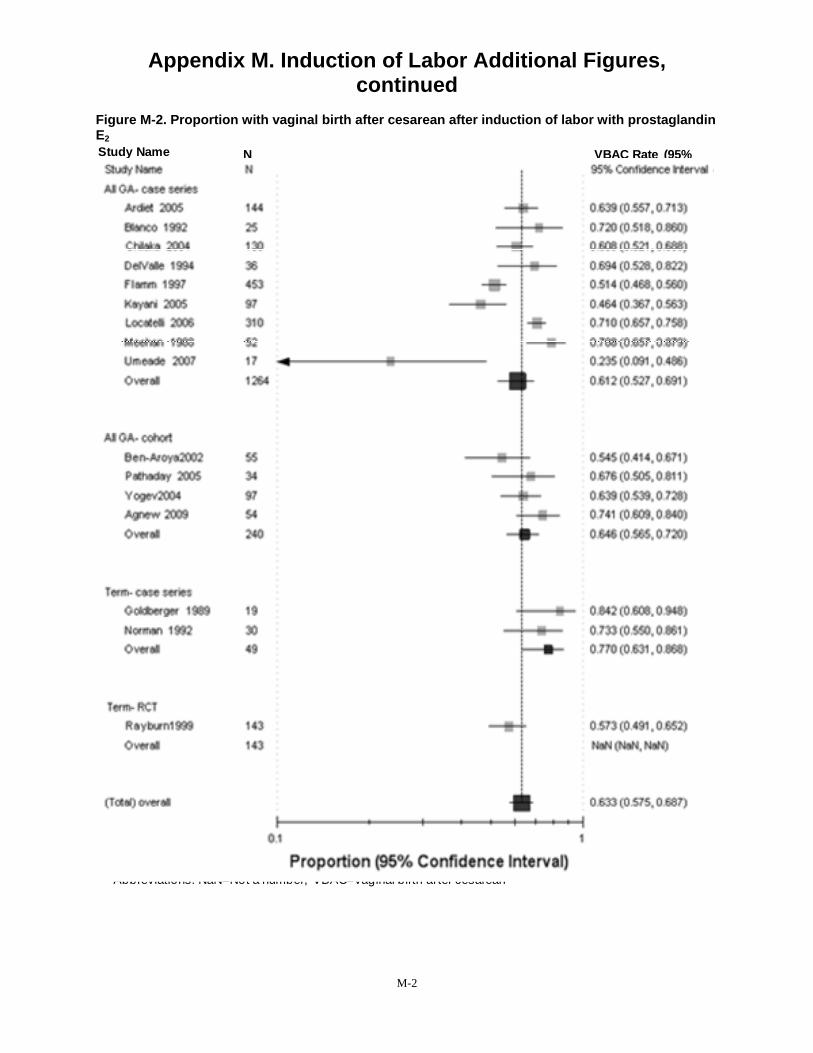
Appendix M. Induction of Labor Additional Figures, continued
Figure M-2. Proportion with vaginal birth after cesarean after induction of labor with prostaglandin E2
Any gestational age: cohort
Study Name Any gestational age: case series
Any gestational age: randomized controlled trial
Term: case series
(Total) overall
N VBAC Rate (95% Confidence Interval)
Ardiet, 2005
Blanco, 1992
Chilaka, 2004
DelValle, 1994
Flamm, 1997
Kayani, 2005
Locatelli, 2006
Meehan, 1988
Umeadi, 2007
Overall
144
25
130
36
453
97
310
52
17
1,264
55
34
97
54
240
Ben-Aroya, 2002
Pathaday, 2005
Yogev, 2004
Agnew, 2009
Overall
0.639 (0.557, 0.713)
0.720 (0.518, 0.860)
0.608 (0.521, 0.688)
0.694 (0.528, 0.688)
0.514 (0.468, 0.560)
0.464 (0.367, 0.563)
0.710 (0.657, 0.758)
0.788 (0.657, 0.879)
0.235 (0.091, 0.486)
0.612 (0.527, 0.691)
0.545 (0.414, 0.671)
0.676 (0.505, 0.811)
0.639 (0.539, 0.728)
0.741 (0.609, 0.840)
0.646 (0.565, 0.720)
19
30
49
Goldberger, 1989
Norman, 1992
Overall
0.842 (0.608, 0.948)
0.733 (0.550, 0.861)
0.770 (0.631, 0.868)
143
143
Rayburn, 1999
Overall
0.573 (0.491, 0.687)
NaN (NaN, NaN)
0.633 (0.575, 0.687)
0 1 VBAC rate (95% confidence interval)
Abbreviations: NaN=Not a number; VBAC=vaginal birth af ter cesarean
M-2
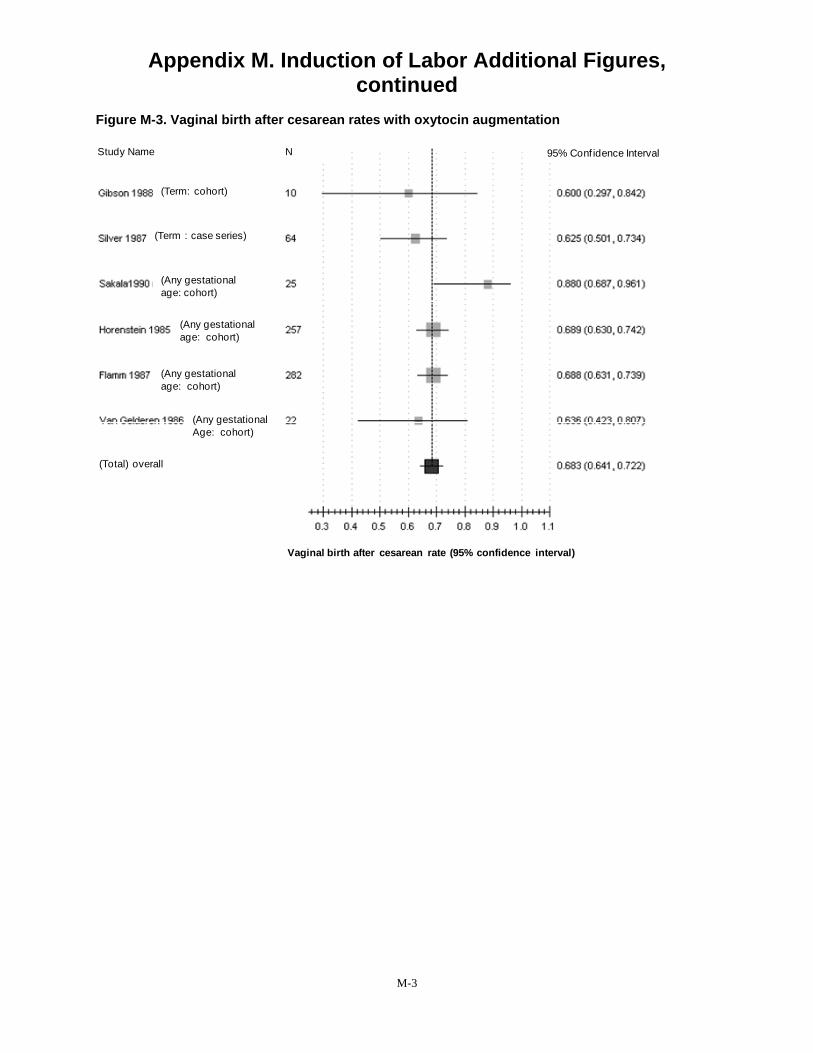
Appendix M. Induction of Labor Additional Figures, continued
Figure M-3. Vaginal birth after cesarean rates with oxytocin augmentation
Study Name N 95% Conf idence Interval
(Term: cohort)
(Term : case series)
(Any gestational age: cohort)
(Any gestational age: cohort)
(Any gestational age: cohort)
(Any gestational Age: cohort)
(Total) overall
Vaginal birth after cesarean rate (95% confidence interval)
M-3
Appendix N. Detailed Evaluation of Screening Tools for Predicting Vaginal Birth After Cesarean
Introduction A brief description on the screening tools for predicting vaginal birth after cesarean (VBAC)
is included in the text of the evidence report. Detailed description of the studies and analyses conducted on this topic is included in this appendix.
Screening Tools for Predicting Vaginal Birth After Cesarean The purpose of a screening tool is to help providers and patients to better identify who will
have a VBAC (and who is more likely to have a repeat cesarean delivery [RCD]). Two prospective cohort studies,1, 2 ten retrospective cohort studies3-12 and two case-control studies13, 14
that presented screening tools were identified. All included studies were either good or fair quality (Table N-1). These studies combined individual factors to predict the likelihood of VBAC (or cesarean delivery) when certain thresholds were reached. Predictive variables (historic, intrapartum or perinatal) of delivery route were first identified by univariate analyses. Significant variables (p<0.05) were included in multiple logistic regression models and/or scored models.
In the strongest studies, the resulting models or scoring systems were then evaluated with a separate validation data set.15 Three of the scored models presented at the top of Table N-1 had one or more external validation studies (shaded) that tested the models with independent cohort data sets. The scored model by Flamm et al1 was externally validated by one retrospective cohort study.5 The scored model by Grobman et al2 was externally evaluated with a retrospective study.4
The Troyer model was externally validated by two retrospective studies.5, 11 In all validation studies, the scored model’s performance was similar to the originally reported performance. In a retrospective cohort study that evaluated three scored models using the same data set,1, 10, 16, Dinsmoor et al reported that all three models were accurate at predicting which women would have a VBAC but were not accurate at predicting who would have a RCD after a TOL. Using the three models, 50 percent of women with unfavorable risk factors (in these three models) had vaginal deliveries suggesting that other factors may be needed to identify women at risk for cesarean. A previous decision analysis of VBAC17 suggested that a scored model would be most useful clinically if it achieved a sensitivity and specificity over 85 percent5 which none of these tools achieved.
In four studies, a cross-validation approach was taken.1, 2, 7, 9 The data in these studies were randomly divided to create a score development group and a validation group. In a multi-center prospective cohort study by Flamm,1 48 percent of women were assigned VBAC estimates either below 60 percent or greater than 80 percent suggesting that almost half of the women gained new information after the screening. After being screened by the tool that included maternal age, prior vaginal delivery history, prior cesarean delivery indication, cervical effacement and dilation, 18 percent of women in the validation group had a less than 60 percent likelihood of VBAC which might discourage some of these women from attempting a TOL. Thirty percent of the women in the validation group had an estimated 87% likelihood of VBAC, which might prove to encourage more of these women to attempt a TOL.
N-1

Appendix N. Detailed Evaluation of Screening Tools for Predicting Vaginal Birth After Cesarean, continued
Table N-1. Screening tools for predicting vaginal birth after cesarean Design Years TOL/ Predictors included
Author/Year Population Eligible Score development (point values if provided) Performance Flamm, Prospective 5003/ Half of the population for score Age <40 years: 2 pts, prior vaginal In validation set Score % with 199718 cohort 5022 development and the other for delivery (prior to CD: 1pt, VBAC: 2 VD
1990-1992 score validating. Logistic pts, both: 4 pts), prior cesarean 0 to 2 49.1 Prior LTCS All GA
modeling of significant variables at the univariate level. Scores based on beta coefficients.
indication (other than FTP: 1 pt), cervical effacement (25-75%: 1 pt, >75%: 2 pt), cervical dilation (>4cm at admission: 1pt) to predict
3 59.9 4 66.7 5 77.0 6 88.6 7 92.6 VBAC. 8 to 10 94.9
Dinsmoor, Retrospective 153/153 Applied Flamm scored model Age <40 years: 2 pts, prior vaginal Score % with VD 20045 Cohort
1998 (validation study) delivery (prior to CD: 1pt, VBAC: 2
pts, both: 4 pts), prior cesarean >7 100 < 4 56
Prior CD indication (other than FTP: 1 pt), All GA cervical effacement (25-75%: 1 pt,
>75%: 2 pt), cervical dilation (>4cm at admission: 1pt) to predict VBAC.
Grobman, Prospective 11,856/ Half of the population randomly Maternal age, pre-pregnancy BMI, In validation set, AUROC 75.0% 200719 cohort 11,856 selected for score development prior VD, prior VBAC, recurring
1999-2002 and the other for score indication for CD to predict VBAC. 1 LTCS validating. Logistic modeling of Term significant variables at the
univariate level. Scores based on beta coefficients.
Costantine, Retrospective 502/502 Applied Grobman 2007 scored Maternal age, pre-preg BMI, prior Correctly predicted 78% of 20094 2002-2007
Prior CD GA > 36 wks
model (validation study) VD, prior VBAC, recurring indication for CD to predict VBAC.
women who had a VBAC and 60% of women who did not. AUROC 78%
Troyer, Retro cohort 264/567 Univariate analysis identified Previous dysfunctional labor, no Score % with VD 199210 1990-1991 variables significantly associated prior vaginal delivery, non- 0 91.5 Term Prior LTCS
GA > 36 wks Vertex
with trial of labor outcome. One-point per variable.
reassuring FHT at admission, induction (1 pt each) to predict VBAC.
1 73.9 2 66.7 3-4 46.1
N-2

Appendix N. Detailed Evaluation of Screening Tools for Predicting Vaginal Birth After Cesarean, continued
Table N-1. Screening tools for predicting vaginal birth after cesarean Design Years TOL/ Predictors included
Author/Year Population Eligible Score development (point values if provided) Performance Dinsmoor, Retrospective 153/153 Applied Troyer scored model Previous dysfunctional labor, no Score % with VD20045 Cohort (validation study) prior vaginal delivery, non- 0 97
1998 reassuring FHT at admission, 3 56 Prior CD induction (1 pt each) to predict All GA VBAC.
Vinueza, Retro cohort 236/236 Applied Troyer screening tool Previous dysfunctional labor, no Score % with VD 200011 1992-1997
Prior LTCS All GA
(validation study). prior vaginal delivery, non- reassuring FHT at admission, induction (1 pt each) to predict VBAC.
0 98 1 69 2 40 3-4 33
Weinstein, Retro cohort 471/572 Logistic regression analysis to Bishop score (>4: 4 pts), vaginal Score % with VD 199612 1981-1990 obtain weighted scores based on delivery before cesarean: 2 pts), > 4 58 Israel 1 prior CD
All GA odds ratios. prior cesarean indication (multiple
grades ranging in values of 3-6 pts) to predict VBAC.
> 6 67 > 8 78 > 10 85 > 12 88 For > 10 points, Sens:85.6% / Spec:67.7% Accuracy: 80%
Jakobi, 19938 Retro cohort 261/261 Univariate analysis coupled with Prior breech, prior VBAC, station, PV for VBAC: 94.5% Israel Years NR multivariate analysis and admission without ROM, dilation at PV for CD: 33.3%
1 prior CD discriminant analysis. admission, prior failure to Accuracy: 68% No oxytocin prorgress to predict VBAC. All GA
Gonen, Retro cohort 339/475 Univariate analysis coupled with Indication of first CD (0-3 pts), Score % with VD 20046 Isreal 2000
1 LTCS All GA
logistic regression analysis. previous VBAC (3 pts), diliation > 2 cm (2 pts), gestation (< 41 wks, 2 pts) to predict VBAC.
0-2 42 3-6 81 7-10 98 PV for score > 2 for VBAC: 88.2%; PV for CD: 58.1% Accuracy: 84.3%
N-3
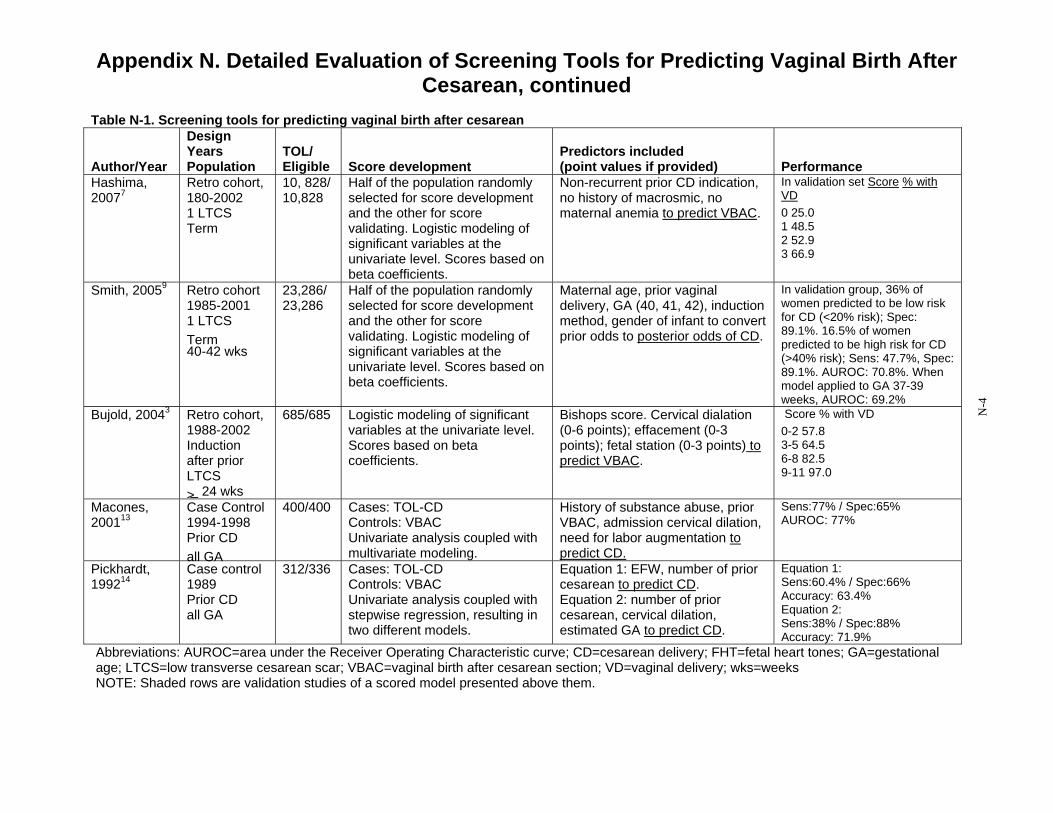
Appendix N. Detailed Evaluation of Screening Tools for Predicting Vaginal Birth After Cesarean, continued
Table N-1. Screening tools for predicting vaginal birth after cesarean Design Years TOL/ Predictors included
Author/Year Population Eligible Score development (point values if provided) Performance Hashima, Retro cohort, 10, 828/ Half of the population randomly Non-recurrent prior CD indication, In validation set Score % with 20077 180-2002 10,828 selected for score development no history of macrosmic, no VD
1 LTCS and the other for score maternal anemia to predict VBAC. 0 25.0 Term validating. Logistic modeling of
significant variables at the univariate level. Scores based on
1 48.5 2 52.9 3 66.9
beta coefficients. Smith, 20059 Retro cohort
1985-2001 1 LTCS Term 40-42 wks
23,286/ 23,286
Half of the population randomly selected for score development and the other for score validating. Logistic modeling of significant variables at the univariate level. Scores based on beta coefficients.
Maternal age, prior vaginal delivery, GA (40, 41, 42), induction method, gender of infant to convert prior odds to posterior odds of CD.
In validation group, 36% of women predicted to be low risk for CD (<20% risk); Spec: 89.1%. 16.5% of women predicted to be high risk for CD (>40% risk); Sens: 47.7%, Spec: 89.1%. AUROC: 70.8%. When model applied to GA 37-39 weeks, AUROC: 69.2%
Bujold, 20043 Retro cohort, 1988-2002 Induction after prior LTCS > 24 wks
685/685 Logistic modeling of significant variables at the univariate level. Scores based on beta coefficients.
Bishops score. Cervical dialation (0-6 points); effacement (0-3 points); fetal station (0-3 points) to predict VBAC.
Score % with VD 0-2 57.8 3-5 64.5 6-8 82.5 9-11 97.0
Macones, Case Control 400/400 Cases: TOL-CD History of substance abuse, prior Sens:77% / Spec:65% 200113 1994-1998
Prior CD all GA
Controls: VBAC Univariate analysis coupled with multivariate modeling.
VBAC, admission cervical dilation, need for labor augmentation to predict CD.
AUROC: 77%
Pickhardt, Case control 312/336 Cases: TOL-CD Equation 1: EFW, number of prior Equation 1: 199214 1989 Controls: VBAC cesarean to predict CD. Sens:60.4% / Spec:66%
Prior CD Univariate analysis coupled with Equation 2: number of prior Accuracy: 63.4% all GA stepwise regression, resulting in
two different models. cesarean, cervical dilation, estimated GA to predict CD.
Equation 2: Sens:38% / Spec:88% Accuracy: 71.9%
Abbreviations: AUROC=area under the Receiver Operating Characteristic curve; CD=cesarean delivery; FHT=fetal heart tones; GA=gestational age; LTCS=low transverse cesarean scar; VBAC=vaginal birth after cesarean section; VD=vaginal delivery; wks=weeks NOTE: Shaded rows are validation studies of a scored model presented above them.
N-4
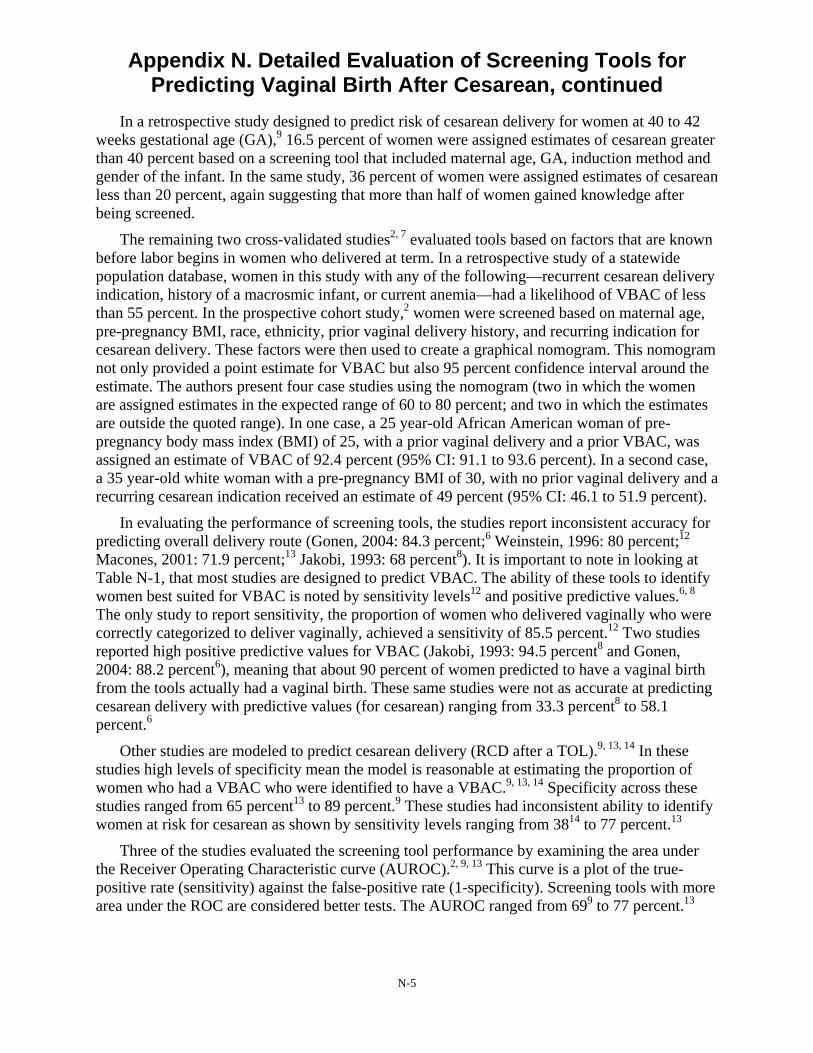
Appendix N. Detailed Evaluation of Screening Tools for Predicting Vaginal Birth After Cesarean, continued
In a retrospective study designed to predict risk of cesarean delivery for women at 40 to 42 weeks gestational age (GA),9 16.5 percent of women were assigned estimates of cesarean greater than 40 percent based on a screening tool that included maternal age, GA, induction method and gender of the infant. In the same study, 36 percent of women were assigned estimates of cesarean less than 20 percent, again suggesting that more than half of women gained knowledge after being screened.
The remaining two cross-validated studies2, 7 evaluated tools based on factors that are known before labor begins in women who delivered at term. In a retrospective study of a statewide population database, women in this study with any of the following—recurrent cesarean delivery indication, history of a macrosmic infant, or current anemia—had a likelihood of VBAC of less than 55 percent. In the prospective cohort study,2 women were screened based on maternal age, pre-pregnancy BMI, race, ethnicity, prior vaginal delivery history, and recurring indication for cesarean delivery. These factors were then used to create a graphical nomogram. This nomogram not only provided a point estimate for VBAC but also 95 percent confidence interval around the estimate. The authors present four case studies using the nomogram (two in which the women are assigned estimates in the expected range of 60 to 80 percent; and two in which the estimates are outside the quoted range). In one case, a 25 year-old African American woman of pre-pregnancy body mass index (BMI) of 25, with a prior vaginal delivery and a prior VBAC, was assigned an estimate of VBAC of 92.4 percent (95% CI: 91.1 to 93.6 percent). In a second case, a 35 year-old white woman with a pre-pregnancy BMI of 30, with no prior vaginal delivery and a recurring cesarean indication received an estimate of 49 percent (95% CI: 46.1 to 51.9 percent).
In evaluating the performance of screening tools, the studies report inconsistent accuracy for predicting overall delivery route (Gonen, 2004: 84.3 percent;6 Weinstein, 1996: 80 percent;12
Macones, 2001: 71.9 percent;13 Jakobi, 1993: 68 percent8). It is important to note in looking at Table N-1, that most studies are designed to predict VBAC. The ability of these tools to identify women best suited for VBAC is noted by sensitivity levels12 and positive predictive values.6, 8
The only study to report sensitivity, the proportion of women who delivered vaginally who were correctly categorized to deliver vaginally, achieved a sensitivity of 85.5 percent.12 Two studies reported high positive predictive values for VBAC (Jakobi, 1993: 94.5 percent8 and Gonen, 2004: 88.2 percent6), meaning that about 90 percent of women predicted to have a vaginal birth from the tools actually had a vaginal birth. These same studies were not as accurate at predicting cesarean delivery with predictive values (for cesarean) ranging from 33.3 percent8 to 58.1 percent.6
Other studies are modeled to predict cesarean delivery (RCD after a TOL).9, 13, 14 In these studies high levels of specificity mean the model is reasonable at estimating the proportion of women who had a VBAC who were identified to have a VBAC.9, 13, 14 Specificity across these studies ranged from 65 percent13 to 89 percent.9 These studies had inconsistent ability to identify women at risk for cesarean as shown by sensitivity levels ranging from 3814 to 77 percent.13
Three of the studies evaluated the screening tool performance by examining the area under the Receiver Operating Characteristic curve (AUROC).2, 9, 13 This curve is a plot of the true-positive rate (sensitivity) against the false-positive rate (1-specificity). Screening tools with more area under the ROC are considered better tests. The AUROC ranged from 699 to 77 percent.13
N-5

Appendix N. Detailed Evaluation of Screening Tools for Predicting Vaginal Birth After Cesarean, continued
Summary of Screening Tools to Predict Vaginal Birth After Cesarean Since the last VBAC report,20 five new scored models have been created and evaluated to
identify women for VBAC (or for RCD).2, 3, 6, 7, 9 Two of the studies created scored tools that can be used the prenatal setting.2, 7 All scored models provide reasonable ability to identify women who are good candidates for VBAC but none have discriminating ability to consistently identify women who are at risk for cesarean.
N-6
Appendix N. Detailed Evaluation of Screening Tools for Predicting Vaginal Birth After Cesarean, continued
References 1. Flamm BL, Geiger AM. Vaginal birth after
cesarean delivery: an admission scoring system. Obstetrics & Gynecology. 1997;90(6):907-910.
2. Grobman WA, Lai Y, Landon MB, et al. Development of a nomogram for prediction of vaginal birth after cesarean delivery. Obstetrics & Gynecology. 2007;109(4):806-812.
3. Bujold E, Blackwell SC, Hendler I, Berman S, Sorokin Y, Gauthier RJ. Modified Bishop's score and induction of labor in patients with a previous cesarean delivery. American Journal of Obstetrics & Gynecology. 2004;191(5):1644-1648.
4. Costantine MM, Fox K, Byers BD, et al. Validation of the prediction model for success of vaginal birth after cesarean delivery. Obstetrics and Gynecology. 2009;114(5):1029-1033.
5. Dinsmoor MJ, Brock EL. Predicting failed trial of labor after primary cesarean delivery. Obstetrics & Gynecology. 2004;103(2):282-286.
6. Gonen R, Tamir A, Degani S, Ohel G. Variables associated with successful vaginal birth after one cesarean section: a proposed vaginal birth after cesarean section score. American Journal of Perinatology. 2004;21(8):447-453.
7. Hashima JN, Guise J-M. Vaginal birth after cesarean: a prenatal scoring tool. American Journal of Obstetrics & Gynecology. 2007;196(5):e22-23.
8. Jakobi P, Weissman A, Peretz BA, Hocherman I. Evaluation of prognostic factors for vaginal delivery after cesarean section. Journal of Reproductive Medicine. 1993;38(9):729-733.
9. Smith GCS, White IR, Pell JP, Dobbie R. Predicting cesarean section and uterine rupture among women attempting vaginal birth after prior cesarean section. PLoS Medicine / Public Library of Science. 2005;2(9):e252.
10. Troyer LR, Parisi VM. Obstetric parameters affecting success in a trial of labor:
designation of a scoring system. American Journal of Obstetrics & Gynecology. 1992;167(4 Pt 1):1099-1104.
11. Vinueza CA, Chauhan SP, Barker L, Hendrix NW, Scardo JA. Predicting the success of a trial of labor with a simple scoring system. Journal of Reproductive Medicine. 2000;45(4):332-336.
12. Weinstein D, Benshushan A, Tanos V, Zilberstein R, Rojansky N. Predictive score for vaginal birth after cesarean section. American Journal of Obstetrics & Gynecology. 1996;174(1 Pt 1):192-198.
13. Macones GA, Hausman N, Edelstein R, Stamilio DM, Marder SJ. Predicting outcomes of trials of labor in women attempting vaginal birth after cesarean delivery: a comparison of multivariate methods with neural networks. American Journal of Obstetrics & Gynecology. 2001;184(3):409-413.
14. Pickhardt MG, Martin JN, Jr., Meydrech EF, et al. Vaginal birth after cesarean delivery: are there useful and valid predictors of success or failure? American Journal of Obstetrics & Gynecology. 1992;166(6 Pt 1):1811-1815; discussion 1815-1819.
15. Altman D. Prognosis and prognostic research: validating prognostic model. BMJ. 2009;338:1430-1435.
16. Alamia VJ, Meyer BA, Selioutski O, Vohra N. Can a VBAC scoring system predict uterine rupture in patients attempting a trial of labor? Paper presented at: ACOG 47th Annual Clinical Meeting; May 19, 1999.
17. Macones GA. The utility of clinical tests of eligibility for a trial of labour following a caesarean section: a decision analysis. British Journal of Obstetrics & Gynaecology. 1999;106(7):642-646.
18. Flamm BL. Once a cesarean, always a controversy. Obstetrics & Gynecology. 1997;90(2):312-315.
19. Grobman WA, Gilbert S, Landon MB, et al. Outcomes of induction of labor after one prior cesarean. Obstetrics & Gynecology. 2007;109(2 Pt 1):262-269.
N-7

Appendix N. Detailed Evaluation of Screening Tools for Predicting Vaginal Birth After Cesarean, continued
20. Guise JM, McDonagh MS, Hashima J, et al. Vaginal birth after cesarean (VBAC). Evidence Report: Technology Assessment. 2003(71):1-8.
N-8
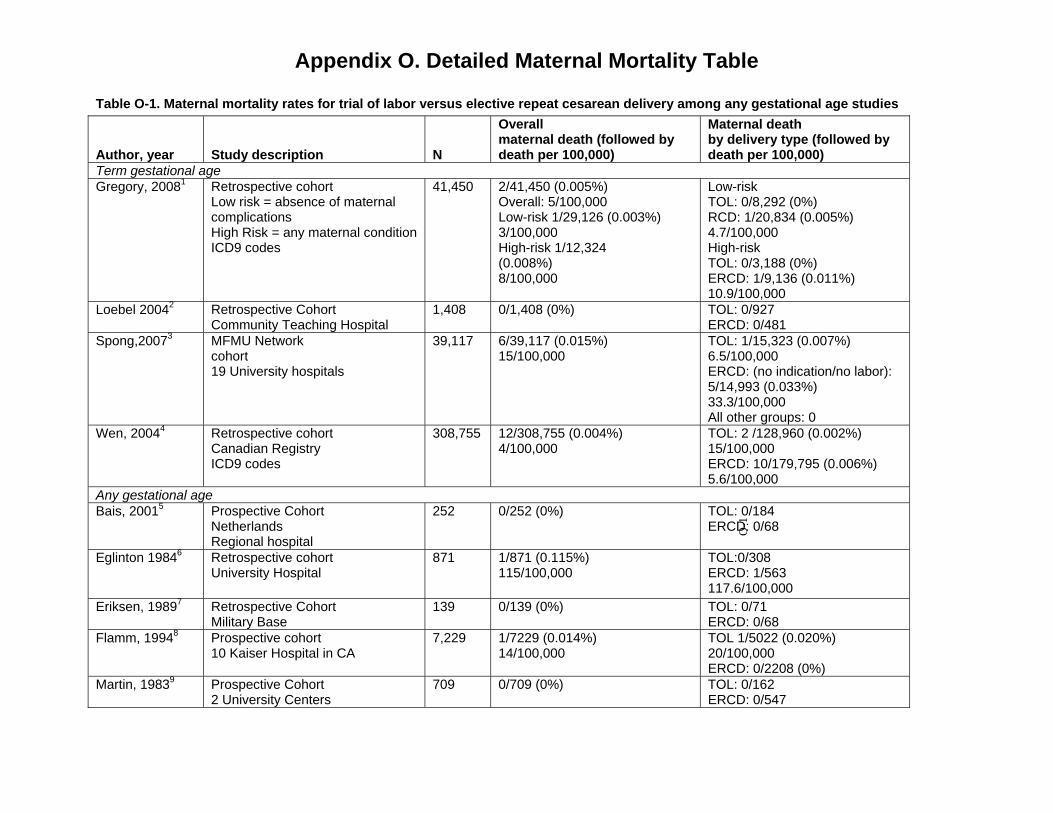
Appendix O. Detailed Maternal Mortality Table
Table O-1. Maternal mortality rates for trial of labor versus elective repeat cesarean delivery among any gestational age studies
Author, year Study description N
Overall maternal death (followed by death per 100,000)
Maternal death by delivery type (followed by death per 100,000)
Term gestational age Gregory, 20081 Retrospective cohort
Low risk = absence of maternal complications High Risk = any maternal condition ICD9 codes
41,450 2/41,450 (0.005%) Overall: 5/100,000 Low-risk 1/29,126 (0.003%) 3/100,000 High-risk 1/12,324 (0.008%) 8/100,000
Low-risk TOL: 0/8,292 (0%) RCD: 1/20,834 (0.005%) 4.7/100,000 High-risk TOL: 0/3,188 (0%) ERCD: 1/9,136 (0.011%) 10.9/100,000
Loebel 20042 Retrospective Cohort Community Teaching Hospital
1,408 0/1,408 (0%) TOL: 0/927 ERCD: 0/481
Spong,20073 MFMU Network cohort 19 University hospitals
39,117 6/39,117 (0.015%) 15/100,000
TOL: 1/15,323 (0.007%) 6.5/100,000 ERCD: (no indication/no labor): 5/14,993 (0.033%) 33.3/100,000 All other groups: 0
Wen, 20044 Retrospective cohort Canadian Registry ICD9 codes
308,755 12/308,755 (0.004%) 4/100,000
TOL: 2 /128,960 (0.002%) 15/100,000 ERCD: 10/179,795 (0.006%) 5.6/100,000
Any gestational age Bais, 20015 Prospective Cohort
Netherlands Regional hospital
252 0/252 (0%)
O-1
TOL: 0/184 ERCD: 0/68
Eglinton 19846 Retrospective cohort University Hospital
871 1/871 (0.115%) 115/100,000
TOL:0/308 ERCD: 1/563 117.6/100,000
Eriksen, 19897 Retrospective Cohort Military Base
139 0/139 (0%) TOL: 0/71 ERCD: 0/68
Flamm, 19948 Prospective cohort 10 Kaiser Hospital in CA
7,229 1/7229 (0.014%) 14/100,000
TOL 1/5022 (0.020%) 20/100,000 ERCD: 0/2208 (0%)
Martin, 19839 Prospective Cohort 2 University Centers
709 0/709 (0%) TOL: 0/162 ERCD: 0/547
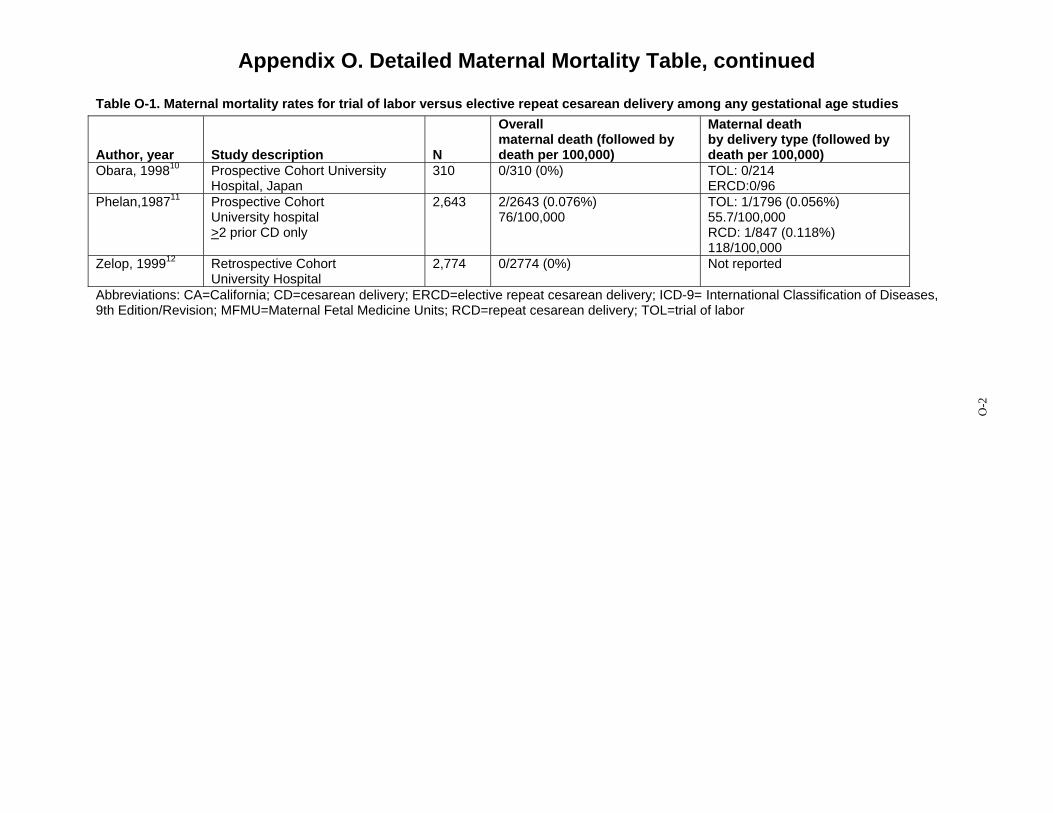
Appendix O. Detailed Maternal Mortality Table, continued
Table O-1. Maternal mortality rates for trial of labor versus elective repeat cesarean delivery among any gestational age studies
Author, year Study description N
Overall maternal death (followed by death per 100,000)
Maternal death by delivery type (followed by death per 100,000)
Obara, 199810 Prospective Cohort University Hospital, Japan
310 0/310 (0%) TOL: 0/214 ERCD:0/96
Phelan,198711 Prospective Cohort University hospital >2 prior CD only
2,643 2/2643 (0.076%) 76/100,000
TOL: 1/1796 (0.056%) 55.7/100,000 RCD: 1/847 (0.118%) 118/100,000
Zelop, 199912 Retrospective Cohort University Hospital
2,774 0/2774 (0%) Not reported
Abbreviations: CA=California; CD=cesarean delivery; ERCD=elective repeat cesarean delivery; ICD-9= International Classification of Diseases, 9th Edition/Revision; MFMU=Maternal Fetal Medicine Units; RCD=repeat cesarean delivery; TOL=trial of labor
O-2
Appendix O. Detailed Maternal Mortality Table
References 1. Gregory KD, Korst LM, Fridman M,
et al. Vaginal birth after cesarean: clinical risk factors associated with adverse outcome. Am J Obstet Gynecol. 2008;198(4):452.e451-410; discussion 452.e410-452.
2. Loebel G, Zelop CM, Egan JFX, Wax J. Maternal and neonatal morbidity after elective repeat Cesarean delivery versus a trial of labor after previous Cesarean delivery in a community teaching hospital. J Matern Fetal Neonatal Med. 2004;15(4):243-246.
3. Spong CY, Landon MB, Gilbert S, et al. Risk of uterine rupture and adverse perinatal outcome at term after cesarean delivery. Obstet Gynecol. 2007;110(4):801-807.
4. Wen SW, Rusen ID, Walker M, et al. Comparison of maternal mortality and morbidity between trial of labor and elective cesarean section among women with previous cesarean delivery. Am J Obstet Gynecol. 2004;191(4):1263-1269.
5. Bais JM, van der Borden DM, Pel M, et al. Vaginal birth after caesarean section in a population with a low overall caesarean section rate. Eur J Obstet Gynecol Reprod Biol. 2001;96(2):158-162.
6. Eglinton GS, Phelan JP, Yeh S, Diaz FP, Wallace TM, Paul RH. Outcome of a trial of labor after prior cesarean delivery. J Reprod Med. 1984;29(1):3-8.
7. Eriksen NL, Buttino L, Jr. Vaginal birth after cesarean: a comparison of maternal and neonatal morbidity to elective repeat cesarean section. Am J Perinatol. 1989;6(4):375-379.
8. Flamm BL, Goings JR, Liu Y, Wolde-Tsadik G. Elective repeat cesarean delivery versus trial of labor: a prospective multicenter study. Obstet Gynecol. 1994;83(6):927-932.
9. Martin JN, Jr., Harris BA, Jr., Huddleston JF, et al. Vaginal delivery following previous cesarean birth. Am J Obstet Gynecol. 1983;146(3):255-263.
10. Obara H, Minakami H, Koike T, Takamizawa S, Matsubara S, Sato I. Vaginal birth after cesarean delivery: results in 310 pregnancies. J Obstet Gynaecol Res. 1998;24(2):129-134.
11. Phelan JP, Clark SL, Diaz F, Paul RH. Vaginal birth after cesarean. Am J Obstet Gynecol. 1987;157(6):1510-1515.
12. Zelop CM, Shipp TD, Repke JT, Cohen A, Caughey AB, Lieberman E. Uterine rupture during induced or augmented labor in gravid women with one prior cesarean delivery. Am J Obstet Gynecol. 1999;181(4):882-886.
O-3
O-3

Appendix P. Predictive Tools of Uterine Rupture Table
Table P-2. Predictive tools of uterine rupture
Author, year, country
Study years/ Population
# UR/ population Score development
Predictors included
(point values if provided) Factors , OR, and score Score and UR
Shipp, Retrospective 40/4,383 Score development only Maternal age (<30, Factor OR (95%CI) Score Score% w/ Score% 20081 Cohort TOLs 30-39; >40) Age>40 5.8 (1.6-20.3) 2 UR (n) US 1984-1996
TOL among prior cesarean (4% among women with >1 CD)
interdelivery interval >18 months having > 1 prior cesarean number of prior VDs
Age 30-39 2.6 (1.1-6.0) 1 >2 prior CD 5.3 (2.1-12.9) 2 Interdelivery 2.4 (1.0-5.6) interval 1 Prior VD 0.3 (0.1-0.9) -1
-1 8.9% 0.26% (1) 0 36.8% 0.25 (4) 1 43.2% 1.11% (21) 2 8.4% 2.43% (9) 3 2.5% 3.70% (4) 4 0.2% 14.29% (1)
Overall UR rate: 0.91%
Macones Secondary 134 cases At least 17 factors "No individual Factor OR (95%CI) Beta Antepartum model , 20062 Analysis of UR (670 examined and analyzed factors are Coefficient AUC 0.67 USA Nested Case-
Control (nested in retrospective cohort) identified by ICD9 code 1996-2000
controls)/25 ,000 TOLs
Cases: UR TOL Controls: no UR TOL
using Chi square, unpaired t-tests and the Mann-Whitney U test. Those significant at p<0.1 were included in two regression models using backwards stepwise elimination: antepartum and early intrapartum factors Final model selected by ROC characteristics
sufficient" Mat Age 1.11 (1.05-1.17) 0.05 GA at deliv 1.12 (0.97-1.20) 0.11 Ethnicity .84 (.74-1.0) -0.43 Prior VD .40 (.20-.80) -0.83 Cerv dil >3cm .66 (.41-1.11) -0.39 IOL 1.94 (1.32-2.81) 0.59
Intrapartum + Antepartum model AUC 0.70
optimal cut point yield sensititvity of 75% and FP rate of 40%
Overall UR rate: 0.98%
P-1
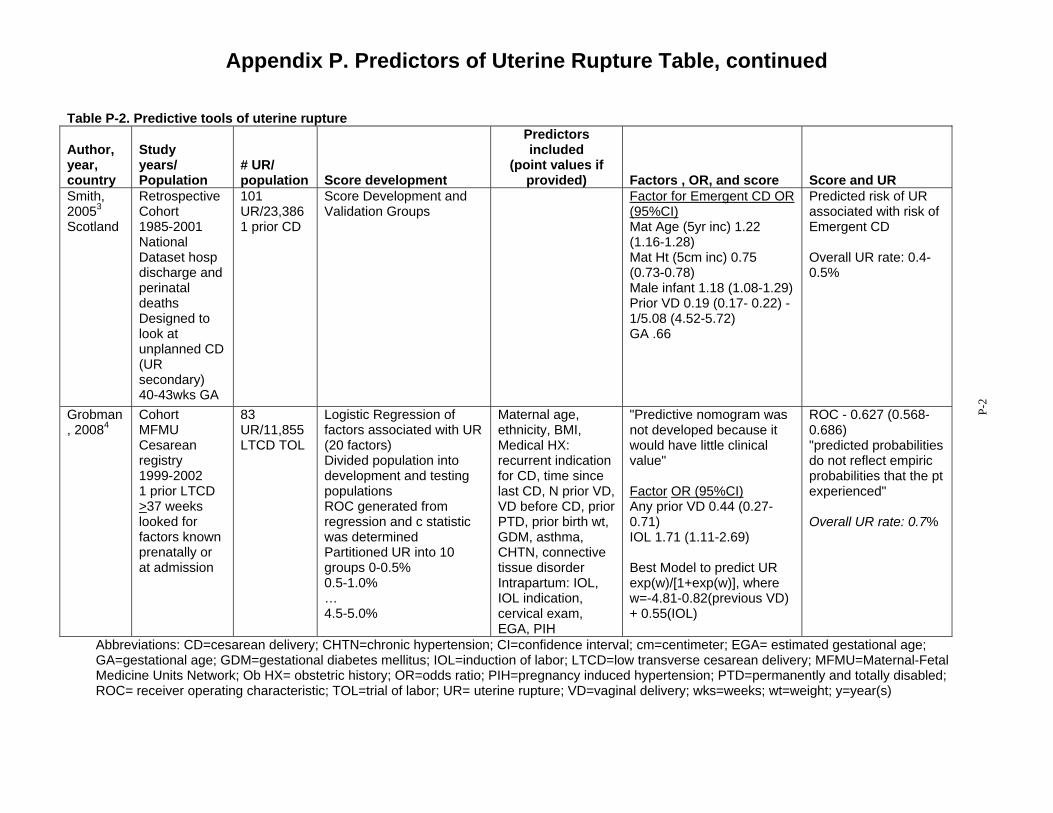
Appendix P. Predictors of Uterine Rupture Table, continued
Table P-2. Predictive tools of uterine rupture
Author, year, country
Study years/ Population
# UR/ population Score development
Predictors included
(point values if provided) Factors , OR, and score Score and UR
Smith, Retrospective 101 Score Development and Factor for Emergent CD OR Predicted risk of UR 20053 Cohort UR/23,386 Validation Groups (95%CI) associated with risk of Scotland 1985-2001
National Dataset hosp discharge and perinatal deaths Designed to look at unplanned CD (UR secondary) 40-43wks GA
1 prior CD Mat Age (5yr inc) 1.22 (1.16-1.28) Mat Ht (5cm inc) 0.75 (0.73-0.78) Male infant 1.18 (1.08-1.29) Prior VD 0.19 (0.17- 0.22) - 1/5.08 (4.52-5.72) GA .66
Emergent CD
Overall UR rate: 0.4-0.5%
Grobman Cohort 83 Logistic Regression of Maternal age, "Predictive nomogram was ROC - 0.627 (0.568-, 20084 MFMU
Cesarean registry 1999-2002 1 prior LTCD >37 weeks looked for factors known prenatally or at admission
UR/11,855 LTCD TOL
factors associated with UR (20 factors) Divided population into development and testing populations ROC generated from regression and c statistic was determined Partitioned UR into 10 groups 0-0.5% 0.5-1.0% … 4.5-5.0%
ethnicity, BMI, Medical HX: recurrent indication for CD, time since last CD, N prior VD, VD before CD, prior PTD, prior birth wt, GDM, asthma, CHTN, connective tissue disorder Intrapartum: IOL, IOL indication, cervical exam, EGA, PIH
not developed because it would have little clinical value"
Factor OR (95%CI) Any prior VD 0.44 (0.27-0.71) IOL 1.71 (1.11-2.69)
Best Model to predict UR exp(w)/[1+exp(w)], where w=-4.81-0.82(previous VD) + 0.55(IOL)
0.686) "predicted probabilities do not reflect empiric probabilities that the pt experienced"
Overall UR rate: 0.7%
Abbreviations: CD=cesarean delivery; CHTN=chronic hypertension; CI=confidence interval; cm=centimeter; EGA= estimated gestational age; GA=gestational age; GDM=gestational diabetes mellitus; IOL=induction of labor; LTCD=low transverse cesarean delivery; MFMU=Maternal-Fetal Medicine Units Network; Ob HX= obstetric history; OR=odds ratio; PIH=pregnancy induced hypertension; PTD=permanently and totally disabled; ROC= receiver operating characteristic; TOL=trial of labor; UR= uterine rupture; VD=vaginal delivery; wks=weeks; wt=weight; y=year(s)
P-2
Appendix P. Predictors of Uterine Rupture Table, continued
References 1. Shipp TD, Zelop C, Lieberman E.
Assessment of the rate of uterine rupture at the first prenatal visit: a preliminary evaluation. J Matern Fetal Neonatal Med. 2008;21(2):129-133.
2. Macones GA, Cahill AG, Stamilio DM, Odibo A, Peipert J, Stevens EJ. Can uterine rupture in patients attempting vaginal birth after cesarean delivery be predicted?[see comment]. Am J Obstet Gynecol. 2006;195(4):1148-1152.
3. Smith GCS, White IR, Pell JP, Dobbie R. Predicting cesarean section and uterine rupture among women attempting vaginal birth after prior cesarean section.[see comment]. PLoS Med. 2005;2(9):e252.
4. Grobman WA, Lai Y, Landon MB, et al. Prediction of uterine rupture associated with attempted vaginal birth after cesarean delivery. Am J Obstet Gynecol. 2008;199(1):30.e31-35.
P-3
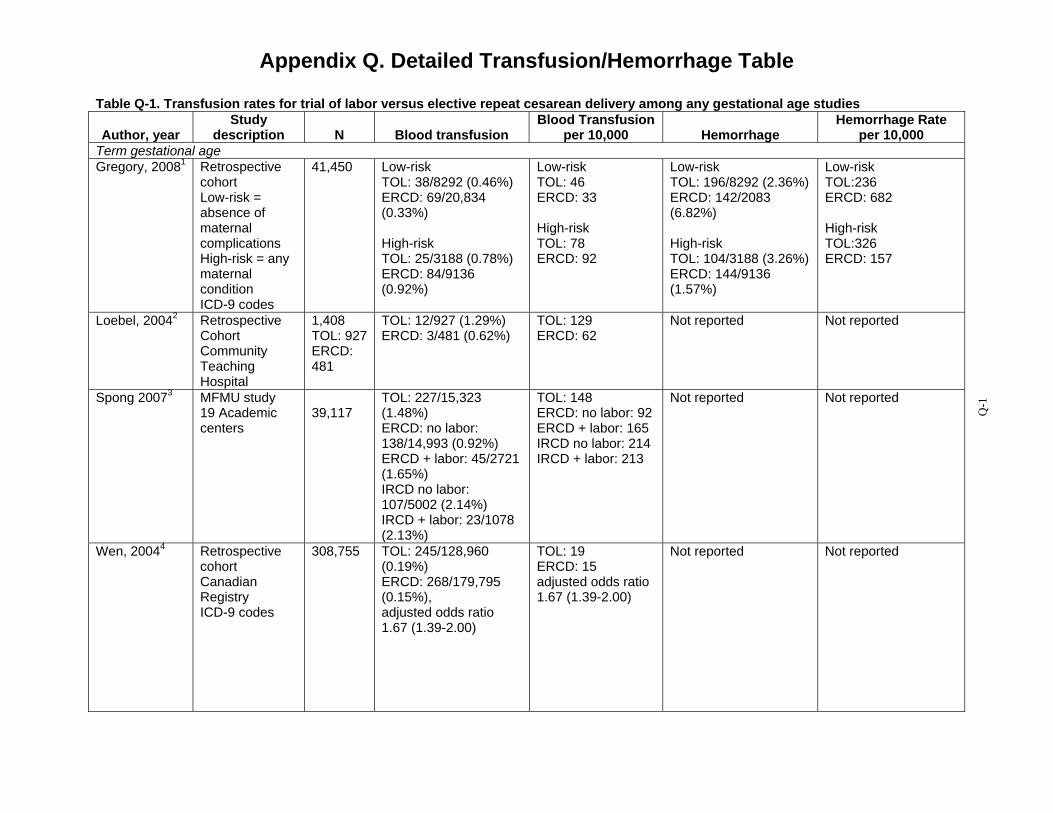
Appendix Q. Detailed Transfusion/Hemorrhage Table
Table Q-1. Transfusion rates for trial of labor versus elective repeat cesarean delivery among any gestational age studies
Author, year Study
description N Blood transfusion Blood Transfusion
per 10,000 Hemorrhage Hemorrhage Rate
per 10,000 Term gestational age Gregory, 20081 Retrospective
cohort Low-risk = absence of maternal complications High-risk = any maternal condition ICD-9 codes
41,450 Low-risk TOL: 38/8292 (0.46%) ERCD: 69/20,834 (0.33%)
High-risk TOL: 25/3188 (0.78%) ERCD: 84/9136 (0.92%)
Low-risk TOL: 46 ERCD: 33
High-risk TOL: 78 ERCD: 92
Low-risk TOL: 196/8292 (2.36%) ERCD: 142/2083 (6.82%)
High-risk TOL: 104/3188 (3.26%) ERCD: 144/9136 (1.57%)
Low-risk TOL:236 ERCD: 682
High-risk TOL:326 ERCD: 157
Loebel, 20042 Retrospective Cohort Community Teaching Hospital
1,408 TOL: 927 ERCD: 481
TOL: 12/927 (1.29%) ERCD: 3/481 (0.62%)
TOL: 129 ERCD: 62
Not reported Not reported
Spong 20073 MFMU study TOL: 227/15,323 TOL: 148 Not reported Not reported 19 Academic 39,117 (1.48%) ERCD: no labor: 92 centers ERCD: no labor: ERCD + labor: 165
138/14,993 (0.92%) IRCD no labor: 214 ERCD + labor: 45/2721 (1.65%) IRCD no labor: 107/5002 (2.14%) IRCD + labor: 23/1078 (2.13%)
IRCD + labor: 213
Wen, 20044 Retrospective cohort Canadian Registry ICD-9 codes
308,755 TOL: 245/128,960 (0.19%) ERCD: 268/179,795 (0.15%), adjusted odds ratio 1.67 (1.39-2.00)
TOL: 19 ERCD: 15 adjusted odds ratio 1.67 (1.39-2.00)
Not reported Not reported
Q-1
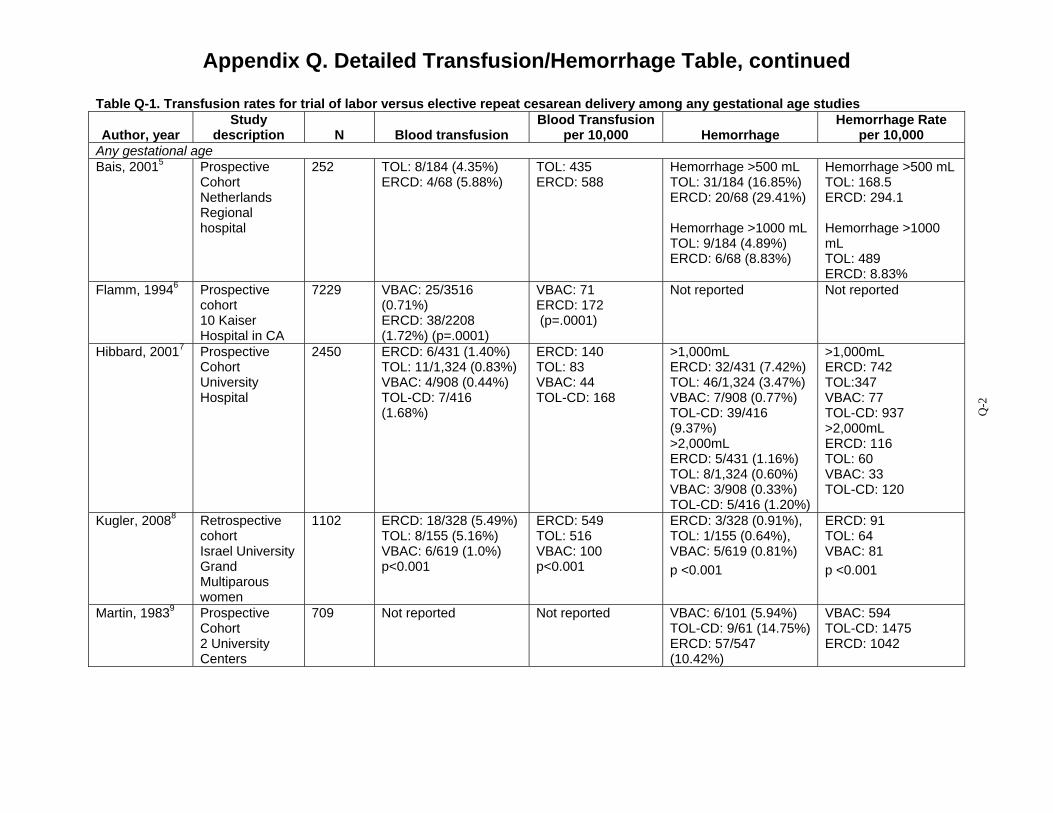
Appendix Q. Detailed Transfusion/Hemorrhage Table, continued
Table Q-1. Transfusion rates for trial of labor versus elective repeat cesarean delivery among any gestational age studies
Author, year Study
description N Blood transfusion Blood Transfusion
per 10,000 Hemorrhage Hemorrhage Rate
per 10,000 Any gestational age Bais, 20015 Prospective
Cohort Netherlands Regional hospital
252 TOL: 8/184 (4.35%) ERCD: 4/68 (5.88%)
TOL: 435 ERCD: 588
Hemorrhage >500 mL TOL: 31/184 (16.85%) ERCD: 20/68 (29.41%)
Hemorrhage >1000 mL TOL: 9/184 (4.89%) ERCD: 6/68 (8.83%)
Hemorrhage >500 mL TOL: 168.5 ERCD: 294.1
Hemorrhage >1000 mL TOL: 489 ERCD: 8.83%
Flamm, 19946 Prospective cohort 10 Kaiser Hospital in CA
7229 VBAC: 25/3516 (0.71%) ERCD: 38/2208 (1.72%) (p=.0001)
VBAC: 71 ERCD: 172 (p=.0001)
Not reported Not reported
Hibbard, 20017 Prospective Cohort University Hospital
2450 ERCD: 6/431 (1.40%) TOL: 11/1,324 (0.83%) VBAC: 4/908 (0.44%) TOL-CD: 7/416 (1.68%)
ERCD: 140 TOL: 83 VBAC: 44 TOL-CD: 168
>1,000mL ERCD: 32/431 (7.42%) TOL: 46/1,324 (3.47%) VBAC: 7/908 (0.77%) TOL-CD: 39/416 (9.37%) >2,000mL ERCD: 5/431 (1.16%) TOL: 8/1,324 (0.60%) VBAC: 3/908 (0.33%) TOL-CD: 5/416 (1.20%)
>1,000mL ERCD: 742 TOL:347 VBAC: 77 TOL-CD: 937 >2,000mL ERCD: 116 TOL: 60 VBAC: 33 TOL-CD: 120
Kugler, 20088 Retrospective cohort Israel University Grand Multiparous women
1102 ERCD: 18/328 (5.49%) TOL: 8/155 (5.16%) VBAC: 6/619 (1.0%) p<0.001
ERCD: 549 TOL: 516 VBAC: 100 p<0.001
ERCD: 3/328 (0.91%), TOL: 1/155 (0.64%), VBAC: 5/619 (0.81%) p <0.001
ERCD: 91 TOL: 64 VBAC: 81 p <0.001
Martin, 19839 Prospective Cohort 2 University Centers
709 Not reported Not reported VBAC: 6/101 (5.94%) TOL-CD: 9/61 (14.75%) ERCD: 57/547 (10.42%)
VBAC: 594 TOL-CD: 1475 ERCD: 1042
Q-2
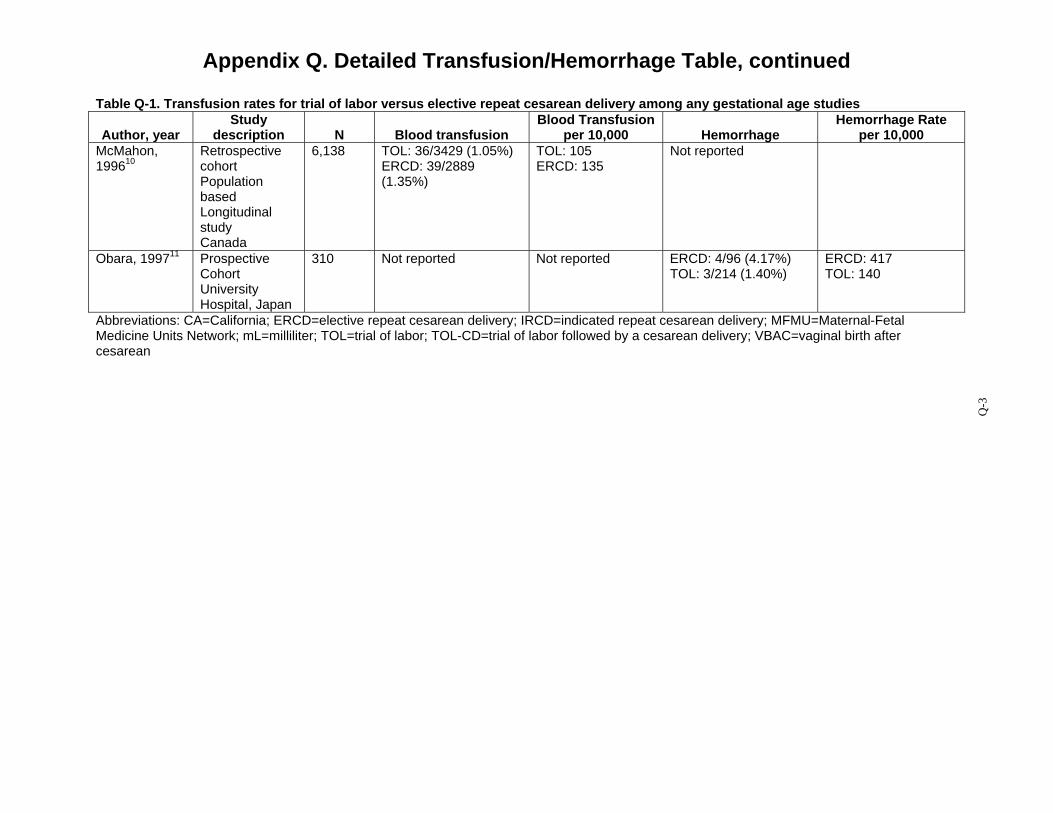
Appendix Q. Detailed Transfusion/Hemorrhage Table, continued
Table Q-1. Transfusion rates for trial of labor versus elective repeat cesarean delivery among any gestational age studies
Author, year Study
description N Blood transfusion Blood Transfusion
per 10,000 Hemorrhage Hemorrhage Rate
per 10,000 McMahon, 199610
Retrospective cohort Population based Longitudinal study Canada
6,138 TOL: 36/3429 (1.05%) ERCD: 39/2889 (1.35%)
TOL: 105 ERCD: 135
Not reported
Obara, 199711 Prospective Cohort University Hospital, Japan
310 Not reported Not reported ERCD: 4/96 (4.17%) TOL: 3/214 (1.40%)
ERCD: 417 TOL: 140
Abbreviations: CA=California; ERCD=elective repeat cesarean delivery; IRCD=indicated repeat cesarean delivery; MFMU=Maternal-Fetal Medicine Units Network; mL=milliliter; TOL=trial of labor; TOL-CD=trial of labor followed by a cesarean delivery; VBAC=vaginal birth after cesarean
Q-3
Appendix Q. Detailed Transfusion/Hemorrhage Table, continued
References 1. Gregory KD, Korst LM, Fridman M,
et al. Vaginal birth after cesarean: clinical risk factors associated with adverse outcome. Am J Obstet Gynecol. 2008;198(4):452.e451-410; discussion 452.e410-452.
2. Loebel G, Zelop CM, Egan JFX, Wax J. Maternal and neonatal morbidity after elective repeat Cesarean delivery versus a trial of labor after previous Cesarean delivery in a community teaching hospital. J Matern Fetal Neonatal Med. 2004;15(4):243-246.
3. Spong CY, Landon MB, Gilbert S, et al. Risk of uterine rupture and adverse perinatal outcome at term after cesarean delivery. Obstet Gynecol. 2007;110(4):801-807.
4. Wen SW, Rusen ID, Walker M, et al. Comparison of maternal mortality and morbidity between trial of labor and elective cesarean section among women with previous cesarean delivery. Am J Obstet Gynecol. 2004;191(4):1263-1269.
5. Bais JM, van der Borden DM, Pel M, et al. Vaginal birth after caesarean section in a population with a low overall caesarean section rate. Eur J Obstet Gynecol Reprod Biol. 2001;96(2):158-162.
6. Flamm BL, Goings JR, Liu Y, Wolde-Tsadik G. Elective repeat cesarean delivery versus trial of labor: a prospective multicenter study. Obstet Gynecol. 1994;83(6):927-932.
7. Hibbard JU, Ismail MA, Wang Y, Te C, Karrison T. Failed vaginal birth after a cesarean section: how risky is it? I. Maternal morbidity. Am J Obstet Gynecol. 2001;184(7):1365-1371; discussion 1371-1363.
8. Kugler E, Shoham-Vardi I, Burstien E, Mazor M, Hershkovitz R. The safety of a trial of labor after cesarean section in a grandmultiparous population. Arch Gynecol Obstet. 2008;277(4):339-344.
9. Martin JN, Jr., Harris BA, Jr., Huddleston JF, et al. Vaginal delivery following previous cesarean birth. Am J Obstet Gynecol. 1983;146(3):255-263.
10. McMahon MJ, Luther ER, Bowes WA, Jr., Olshan AF. Comparison of a trial of labor with an elective second cesarean section.[see comment]. N Engl J Med. 1996;335(10):689-695.
11. Obara H, Minakami H, Koike T, Takamizawa S, Matsubara S, Sato I. Vaginal birth after cesarean delivery: results in 310 pregnancies. J Obstet Gynaecol Res. 1998;24(2):129-134.
Q-4
Q-4

Appendix R. Detailed Infection Table
Table R-1. Infection rates for trial of labor versus elective repeat cesarean delivery Endometritis or
Author, year Study
description N Fever Fever per
10,000
Endometritis Chorio-
amnionitis
Chorio-amnionitis per
10,000 Wound/Other
Wound/ Other per
10,000 Term gestational age Eriksen, 19891
Retrospective cohort military base
139 TOL: 4/71 (5.6%) ERCD: 7/68 (10.2%) (p:NS)
TOL: 560 ERCD: 1020 (p:NS)
TOL: 2/71 (2.8%) ERCD: 1/68 (1.5%) (p:NS)
TOL: 280 ERCD: 150
Not reported
Hook, 19972 Prospective cohort level 1, 2, & 3 hospital included
989 Maternal fever TOL: 38/492 (8%) ERCD: 0/497 (0%) (p=<0.0002)
Maternal fever TOL: 80 ERCD: 0 (p=<0.0002)
Not reported Not reported Not reported Not reported
Loebel,20043 Retrospective cohort community teaching hospital
1,408 Not reported Not reported Not reported Not reported “Infection” ERCD: 11/481 (1.9%) VBAC 14/749 (2.3%) TOL-CD 9/178 (5.1%) (p:NS)
Infection” ERCD: 190 VBAC 230 TOL-CD 510 (p:NS)
Spong, 20074 MFMU network cohort 19 university hospitals
39,117 Not reported Not reported TOL: 442/15,323 (2.9%) ERCD no labor: 260/14,993(1.7 %) ERCD + labor: 101/2721 (3.7%) IRCD no labor 137/5002 (2.7%) IRCD + labor: 54/1078 (5.0%)
TOL: 290 ERCD no labor: 170 ERCD + labor: 370 IRCD no labor 270 IRCD + labor: 500
Not reported Not reported
R-1

Appendix R. Detailed Infection Table, continued
Table R-1. Infection rates for trial of labor versus elective repeat cesarean delivery Endometritis or
Author, year Study
description N Fever Fever per
10,000
Endometritis Chorio-
amnionitis
Chorio-amnionitis per
10,000 Wound/Other
Wound/ Other per
10,000 Wen, 20045 Retrospective
cohort Canadian registry ICD-9 codes
308,75 5
Not reported Not reported Not reported Not reported “Postpartum Infection” TOL: 487/128,960 (0.38%) ERCD: 837/179,795 (0.47%); Adjusted odds ratio: 0.86 (0.77-0.97)
“Postpartu m Infection” TOL: 380 ERCD: 470 Adjusted odds ratio: 0.86 (0.77-0.97)
All gestational ages Bais, 20016 Prospective
cohort Netherlands regional hospital
252 TOL: 16/184 (9%) ERCD: 7/68 (10%)
TOL: 900 ERCD: 1000
Not reported Not reported Not reported Not reported
Cahill, 20067 Retrospective cohort 16 university & community hospitals
6,619 TOL: 329/5041 (6.52%) ERCD: 294/1578(18.63 %)
TOL: 652 ERCD: 1863
Not reported Not reported Not reported Not reported
R-2
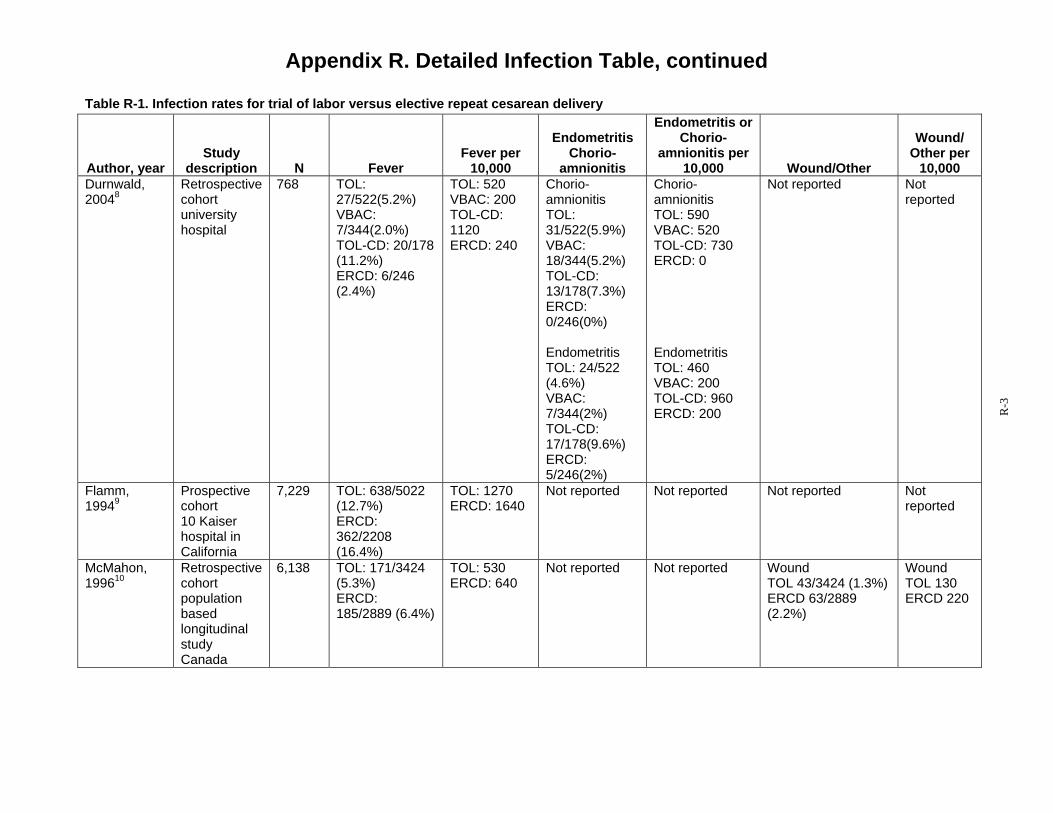
Appendix R. Detailed Infection Table, continued
Table R-1. Infection rates for trial of labor versus elective repeat cesarean delivery Endometritis or
Author, year Study
description N Fever Fever per
10,000
Endometritis Chorio-
amnionitis
Chorio-amnionitis per
10,000 Wound/Other
Wound/ Other per
10,000 Durnwald, Retrospective 768 TOL: TOL: 520 Chorio- Chorio- Not reported Not 20048 cohort
university hospital
27/522(5.2%) VBAC: 7/344(2.0%) TOL-CD: 20/178 (11.2%) ERCD: 6/246 (2.4%)
VBAC: 200 TOL-CD: 1120 ERCD: 240
amnionitis TOL: 31/522(5.9%) VBAC: 18/344(5.2%) TOL-CD: 13/178(7.3%) ERCD: 0/246(0%)
amnionitis TOL: 590 VBAC: 520 TOL-CD: 730 ERCD: 0
reported
Endometritis TOL: 24/522 (4.6%) VBAC: 7/344(2%) TOL-CD: 17/178(9.6%) ERCD: 5/246(2%)
Endometritis TOL: 460 VBAC: 200 TOL-CD: 960 ERCD: 200
Flamm, Prospective 7,229 TOL: 638/5022 TOL: 1270 Not reported Not reported Not reported Not 19949 cohort
10 Kaiser hospital in California
(12.7%) ERCD: 362/2208 (16.4%)
ERCD: 1640 reported
McMahon, Retrospective 6,138 TOL: 171/3424 TOL: 530 Not reported Not reported Wound Wound 199610 cohort
population (5.3%) ERCD:
ERCD: 640 TOL 43/3424 (1.3%) ERCD 63/2889
TOL 130 ERCD 220
based 185/2889 (6.4%) (2.2%) longitudinal study Canada
R-3

Appendix R. Detailed Infection Table, continued
Table R-1. Infection rates for trial of labor versus elective repeat cesarean delivery Endometritis or
Author, year Study
description N Fever Fever per
10,000
Endometritis Chorio-
amnionitis
Chorio-amnionitis per
10,000 Wound/Other
Wound/ Other per
10,000 Phelan, 198711
Prospective Cohort University hospital >2 prior CD only
2,643 Planned TOL 159/ 1,796 (8.9%)* VBAC: 53/1465 (3.6%) TOL-CD: 106/331 (32%) No Planned TOL 163/847 (19.2%) VBAC: 4/69 (5.8%) ERCD: 56/314 (18%) IRCD: 103/464 (22%)
Planned TOL 890* VBAC: 360 TOL-CD: 320 No Planned TOL 1920 VBAC: 580 ERCD: 1800 IRCD: 2200
Not reported Not reported Not reported Not reported
Kugler, 200812
Retrospective cohort Israel University grand multiparous women
1,102 IRCD† 10/328 (3%), TOL: 9/619(1.5%), VBAC: 1/155(0.6%)
IRCD† 300 TOL: 150 VBAC: 60
Amnionitis IRCDa
4/328(1.2%) TOL: 5/619 (0.8%), VBAC: 14/155 (9.0%)
Amnionitis IRCDa 120 TOL: 80 VBAC: 900
Not reported Not reported
Eglinton, 198413
Retrospective cohort university hospital
871 VBAC: 6/240(2.5%) TOL-CD: 27/136 (19.8%) ERCD: 176/495 (35.5%)
VBAC: 250 TOL-CD: 1980 ERCD: 3550
Not reported Not reported Not reported Not reported
Chauhan, 200114
69 Not reported Not reported TOL: 9/30 (30%) ERCD: 7/39 (18%)
TOL: 300 ERCD: 1800
Wound TOL: 8/30(27%) ERCD: 3/39(8%)
Wound TOL: 2700 ERCD: 800
R-4
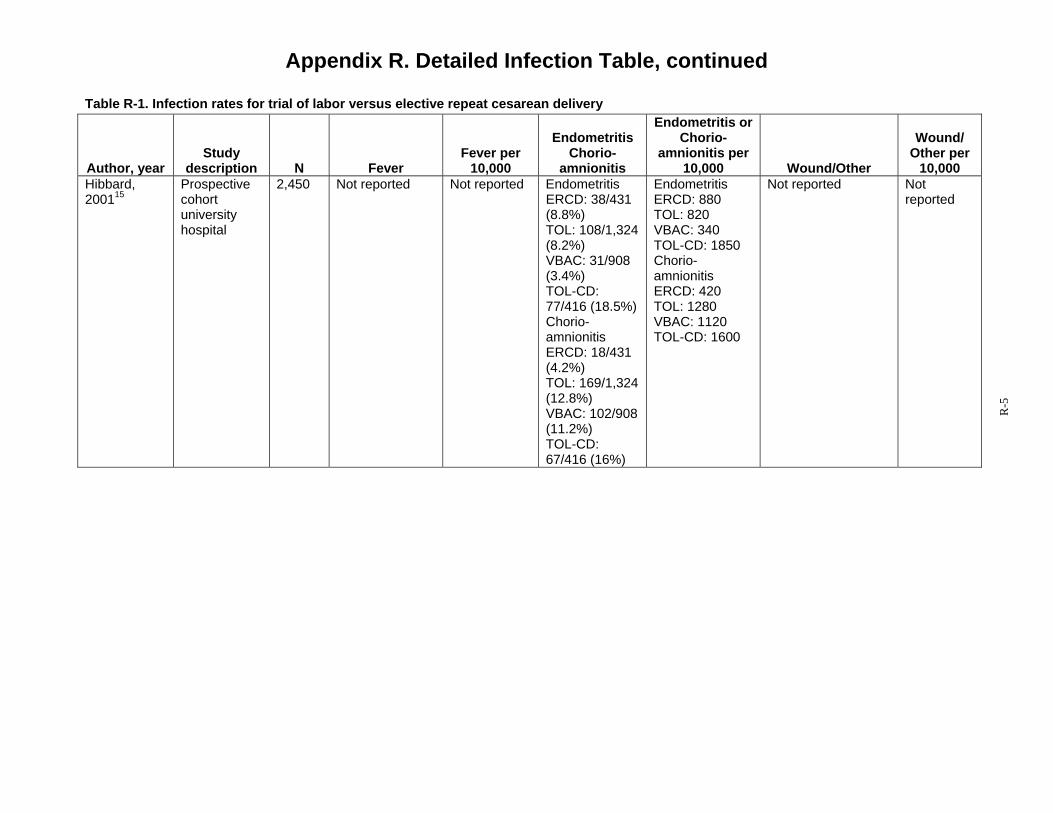
Appendix R. Detailed Infection Table, continued
Table R-1. Infection rates for trial of labor versus elective repeat cesarean delivery Endometritis or
Author, year Study
description N Fever Fever per
10,000
Endometritis Chorio-
amnionitis
Chorio-amnionitis per
10,000 Wound/Other
Wound/ Other per
10,000 Hibbard, Prospective 2,450 Not reported Not reported Endometritis Endometritis Not reported Not 200115 cohort
university ERCD: 38/431 (8.8%)
ERCD: 880 TOL: 820
reported
hospital TOL: 108/1,324 VBAC: 340 (8.2%) TOL-CD: 1850 VBAC: 31/908 Chorio-(3.4%) TOL-CD:
amnionitis ERCD: 420
77/416 (18.5%) TOL: 1280 Chorio- VBAC: 1120 amnionitis TOL-CD: 1600 ERCD: 18/431 (4.2%) TOL: 169/1,324 (12.8%) VBAC: 102/908 (11.2%) TOL-CD: 67/416 (16%)
R-5
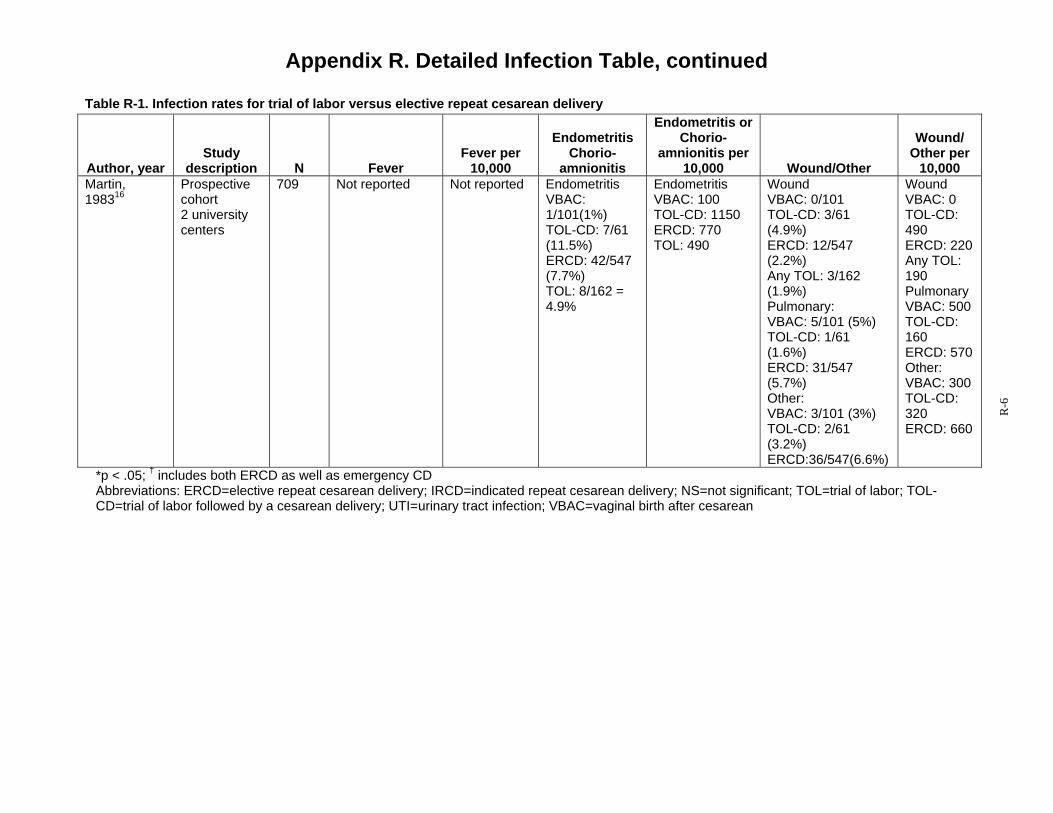
Appendix R. Detailed Infection Table, continued
Table R-1. Infection rates for trial of labor versus elective repeat cesarean delivery Endometritis or
Author, year Study
description N Fever Fever per
10,000
Endometritis Chorio-
amnionitis
Chorio-amnionitis per
10,000 Wound/Other
Wound/ Other per
10,000 Martin, Prospective 709 Not reported Not reported Endometritis Endometritis Wound Wound 198316 cohort VBAC: VBAC: 100 VBAC: 0/101 VBAC: 0
2 university 1/101(1%) TOL-CD: 1150 TOL-CD: 3/61 TOL-CD: centers TOL-CD: 7/61 ERCD: 770 (4.9%) 490
(11.5%) TOL: 490 ERCD: 12/547 ERCD: 220 ERCD: 42/547 (2.2%) Any TOL: (7.7%) Any TOL: 3/162 190 TOL: 8/162 = (1.9%) Pulmonary 4.9% Pulmonary: VBAC: 500
VBAC: 5/101 (5%) TOL-CD: TOL-CD: 1/61 160 (1.6%) ERCD: 570 ERCD: 31/547 Other: (5.7%) VBAC: 300 Other: TOL-CD: VBAC: 3/101 (3%) 320 TOL-CD: 2/61 ERCD: 660 (3.2%) ERCD:36/547(6.6%)
*p < .05; † includes both ERCD as well as emergency CD Abbreviations: ERCD=elective repeat cesarean delivery; IRCD=indicated repeat cesarean delivery; NS=not significant; TOL=trial of labor; TOL-CD=trial of labor followed by a cesarean delivery; UTI=urinary tract infection; VBAC=vaginal birth after cesarean
R-6
Appendix R. Detailed Infection Table, continued
References 1. Eriksen NL, Buttino L, Jr. Vaginal
birth after cesarean: a comparison of maternal and neonatal morbidity to elective repeat cesarean section. Am J Perinatol. 1989;6(4):375-379.
2. Hook B, Kiwi R, Amini SB, Fanaroff A, Hack M. Neonatal morbidity after elective repeat cesarean section and trial of labor. Pediatrics. 1997;100(3 Pt 1):348-353.
3. Loebel G, Zelop CM, Egan JFX, Wax J. Maternal and neonatal morbidity after elective repeat Cesarean delivery versus a trial of labor after previous Cesarean delivery in a community teaching hospital. J Matern Fetal Neonatal Med. 2004;15(4):243-246.
4. Spong CY, Landon MB, Gilbert S, et al. Risk of uterine rupture and adverse perinatal outcome at term after cesarean delivery. Obstet Gynecol. 2007;110(4):801-807.
5. Wen SW, Rusen ID, Walker M, et al. Comparison of maternal mortality and morbidity between trial of labor and elective cesarean section among women with previous cesarean delivery. Am J Obstet Gynecol. 2004;191(4):1263-1269.
6. Bais JM, van der Borden DM, Pel M, et al. Vaginal birth after caesarean section in a population with a low overall caesarean section rate. Eur J Obstet Gynecol Reprod Biol. 2001;96(2):158-162.
7. Cahill AG, Stamilio DM, Odibo AO, et al. Is vaginal birth after cesarean (VBAC) or elective repeat cesarean safer in women with a prior vaginal
delivery? Am J Obstet Gynecol. 2006;195(4):1143-1147.
8. Durnwald C, Mercer B. Vaginal birth after Cesarean delivery: predicting success, risks of failure. J Matern Fetal Neonatal Med. 2004;15(6):388-393.
9. Flamm BL, Goings JR, Liu Y, Wolde-Tsadik G. Elective repeat cesarean delivery versus trial of labor: a prospective multicenter study. Obstet Gynecol. 1994;83(6):927-932.
10. McMahon MJ, Luther ER, Bowes WA, Jr., Olshan AF. Comparison of a trial of labor with an elective second cesarean section.[see comment]. N Engl J Med. 1996;335(10):689-695.
11. Phelan JP, Clark SL, Diaz F, Paul RH. Vaginal birth after cesarean. Am J Obstet Gynecol. 1987;157(6):1510-1515.
12. Kugler E, Shoham-Vardi I, Burstien E, Mazor M, Hershkovitz R. The safety of a trial of labor after cesarean section in a grandmultiparous population. Arch Gynecol Obstet. 2008;277(4):339-344.
13. Eglinton GS, Phelan JP, Yeh S, Diaz FP, Wallace TM, Paul RH. Outcome of a trial of labor after prior cesarean delivery. J Reprod Med. 1984;29(1):3-8.
14. Chauhan SP, Magann EF, Carroll CS, Barrilleaux PS, Scardo JA, Martin JN, Jr. Mode of delivery for the morbidly obese with prior cesarean delivery: vaginal versus repeat cesarean section. Am J Obstet Gynecol. 2001;185(2):349-354.
R-7
Appendix R. Detailed Infection Table, continued
15. Hibbard JU, Ismail MA, Wang Y, Te C, Karrison T. Failed vaginal birth after a cesarean section: how risky is it? I. Maternal morbidity. Am J Obstet Gynecol. 2001;184(7):1365-1371; discussion 1371-1363.
16. Martin JN, Jr., Harris BA, Jr., Huddleston JF, et al. Vaginal delivery following previous cesarean birth. Am J Obstet Gynecol. 1983;146(3):255-263.
R-8

Appendix S. Detailed Hospital Stay Table
Table S-1. Length of stay: all studies from the United States
Author, year Study description N Length of stay (days)
Term gestational age Gregory, 20081 Retrospective
cohort -Low risk: absence of maternal complications -High Risk: any maternal condition ICD-9 codes
41,450 Low-risk-TOL: 2.25 High-risk TOL: 2.86
Low-risk ERCD: 3.02 High-risk ERCD: 3.26
Loebel, 20042 Retrospective cohort community teaching hospital
1,408 TOL: 2.02 ERCD: 3.14
Hook, 19973 Prospective cohort level 1, 2, & 3 hospitals included
989 TOL only: 3.6(+1) VBAC: 3.1; (+2) TOL-CD: 4.8; (+2)*
ERCD: 4.5(+1)†
Any gestational age Eglinton, 19844 Retrospective
cohort university hospital
871 VBAC 2.4(1.0) TOL-CD 5(1.4)
ERCD-VD :2.3 (0.7) ERCD no labor:4.9 (1.6) ERCD labor:4.9 (1.5)
Eriksen, 19895 Retrospective cohort military base
139 TOL: 3.1 + 1.6 ERCD: 5.4 days + 2.0‡
Flamm, 19946 Prospective cohort 10 Kaiser hospitals in California
7,229 TOL: 57.2 hours + 31.1 ERCD: 84.9 hours +26.3§
Hibbard, 20017 Prospective cohort university hospital
2,450 TOL: 3.26 ± 2.61 VBAC: 2.34 ± 1.85 TOL-CD: 5.31 ± 2.88
ERCD: 5.04 ± 3.09
Phelan, 19878 Prospective cohort university hospital >2 prior CD only
2,643 VBAC: 2.2 TOL-CD: 4.2
ERCD: 4.2
* p <0.01† p =0.002‡ p=0.001 § p<0.001 Abbreviations: CD=cesarean delivery; ERCD=elective repeat cesarean delivery; TOL=trial of labor; TOL-CD=trial of labor followed by a cesarean delivery; VBAC=vaginal birth after a cesarean
S-1

Appendix S. Detailed Hospital Stay Table, continued
References 1. Gregory KD, Korst LM, Fridman M,
et al. Vaginal birth after cesarean: clinical risk factors associated with adverse outcome. Am J Obstet Gynecol. 2008;198(4):452.e451-410; discussion 452.e410-452.
2. Loebel G, Zelop CM, Egan JFX, Wax J. Maternal and neonatal morbidity after elective repeat Cesarean delivery versus a trial of labor after previous Cesarean delivery in a community teaching hospital. J Matern Fetal Neonatal Med. 2004;15(4):243-246.
3. Hook B, Kiwi R, Amini SB, Fanaroff A, Hack M. Neonatal morbidity after elective repeat cesarean section and trial of labor. Pediatrics. 1997;100(3 Pt 1):348-353.
4. Eglinton GS, Phelan JP, Yeh S, Diaz FP, Wallace TM, Paul RH. Outcome of a trial of labor after prior cesarean delivery. J Reprod Med. 1984;29(1):3-8.
5. Eriksen NL, Buttino L, Jr. Vaginal birth after cesarean: a comparison of maternal and neonatal morbidity to elective repeat cesarean section. Am J Perinatol. 1989;6(4):375-379.
6. Flamm BL, Goings JR, Liu Y, Wolde-Tsadik G. Elective repeat cesarean delivery versus trial of labor: a prospective multicenter study. Obstet Gynecol. 1994;83(6):927-932.
7. Hibbard JU, Ismail MA, Wang Y, Te C, Karrison T. Failed vaginal birth after a cesarean section: how risky is it? I. Maternal morbidity. Am J Obstet Gynecol. 2001;184(7):1365-1371; discussion 1371-1363.
8. Phelan JP, Clark SL, Diaz F, Paul RH. Vaginal birth after cesarean. Am J Obstet Gynecol. 1987;157(6):1510-1515.
S-2