vaibhav bajpai - lessons learned from using the …...lessons learned from using the ripe atlas...
TRANSCRIPT
Lessons Learned from using the RIPE Atlas Platform forMeasurement Research
Vaibhav Bajpai Steffie Jacob EravuchiraJacobs University Bremen Jacobs University Bremen
[email protected] [email protected]
Jürgen SchönwälderJacobs University Bremen
This article is an editorial note submitted to CCR. It has NOT been peer reviewed.The authors take full responsibility for this article’s technical content. Comments can be posted through CCR Online.
ABSTRACTWe reflect upon our experience in using the RIPE Atlasplatform for measurement-based research. We show how inaddition to credits, control checks using rate limits are inplace to ensure that the platform does not get overloadedwith measurements. We show how the Autonomous Sys-tem (AS)-based distribution of RIPE Atlas probes is heavilyskewed which limits possibilities of measurements sourcedfrom a specific origin-AS. We discuss the significance ofprobe calibration and how we leverage it to identify loadissues in older hardware versions (38.6% overall as of Sep2014) of probes. We show how performance measurementplatforms (such as RIPE Atlas, SamKnows, BISmark andDasu) can benefit from each other by demonstrating twoexample use-cases. We also open discussion on how RIPEAtlas deployment can be made more useful by relaying moreprobe metadata information back to the scientific commu-nity and by strategically deploying probes to reduce the in-herent sampling bias embedded in probe-based measurementplatforms.
Categories and Subject DescriptorsC.2.3 [Computer-Communication Networks]: NetworkOperations—Network monitoring
General TermsMeasurement, Performance
KeywordsAccess Networks, RIPE Atlas
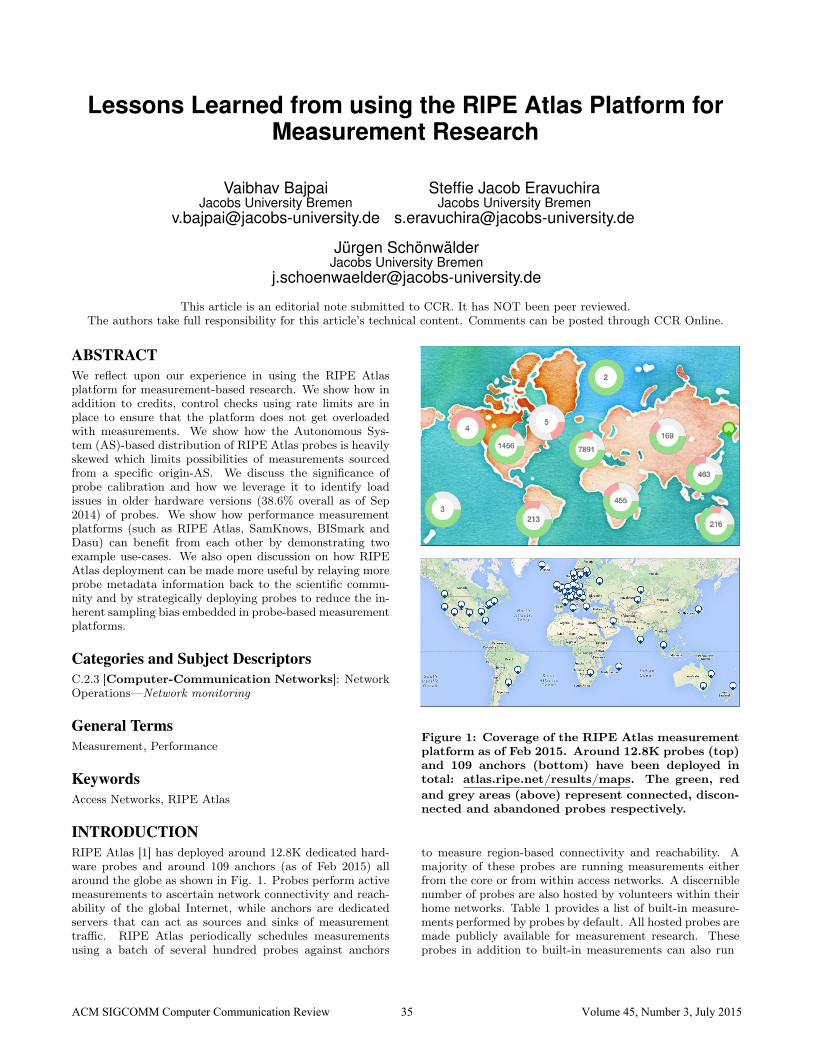
INTRODUCTIONRIPE Atlas [1] has deployed around 12.8K dedicated hard-ware probes and around 109 anchors (as of Feb 2015) allaround the globe as shown in Fig. 1. Probes perform activemeasurements to ascertain network connectivity and reach-ability of the global Internet, while anchors are dedicatedservers that can act as sources and sinks of measurementtraffic. RIPE Atlas periodically schedules measurementsusing a batch of several hundred probes against anchors
Figure 1: Coverage of the RIPE Atlas measurementplatform as of Feb 2015. Around 12.8K probes (top)and 109 anchors (bottom) have been deployed intotal: atlas.ripe.net/results/maps. The green, redand grey areas (above) represent connected, discon-nected and abandoned probes respectively.
to measure region-based connectivity and reachability. Amajority of these probes are running measurements eitherfrom the core or from within access networks. A discerniblenumber of probes are also hosted by volunteers within theirhome networks. Table 1 provides a list of built-in measure-ments performed by probes by default. All hosted probes aremade publicly available for measurement research. Theseprobes in addition to built-in measurements can also run
ACM SIGCOMM Computer Communication Review 35 Volume 45, Number 3, July 2015

MEASUREMENT TARGET
ping, ping6 first hop, second hop,ns.ripe.net, *.root-servers.net,*.atlas.ripe.net
traceroute,traceroute6
*.root-servers.net,*.atlas.ripe.net, labs.ripe.net
dns, dns6 *.root-servers.net: TCP(SOA), UDP (SOA, version.bind,hostname.bind, id.server,version.server)
sslcert,sslcert6
www.ripe.net, atlas.ripe.net
http, http6 www.ripe.net/favicon.ico,ip-echo.ripe.net
Table 1: A list of built-in measurements performedby probes by default as of Feb 2015. (*) in the targetfields indicate multiple servers within the domain.
User Defined Measurement (UDM)s. A UDM allows anyuser registered (around 19K as of Feb 2015) on RIPE Atlasto provision measurements supported by the platform (seeTable 1) on probes with tailor-made measurement param-eters. A registered user spends credits by provisioning aUDM on probes. Credits can be gathered by either hostinga probe (for no purchase cost) or an anchor (for a purchasecost). RIPE Atlas also released (on Feb 2013) a public APIthat allows one to programmatically provision UDMs. Usingthese public APIs and credits gathered by hosting probes formultiple years, we were able to provision UDMs on a largesample of probes. We share our experiences and lessonslearned from using the RIPE Atlas platform for measure-ment research.
#1: RATE LIMITSRIPE Atlas uses credits as a virtual currency to regulateUDM usage within the platform. Millions of credits canbe accumulated by hosting probes for multiple years. Given
MEASUREMENT CREDITS/RESULT ↓
traceroute, traceroute6 30
dns, dns6 (TCP) 20
dns, dns6 (UDP) 10
sslcert, sslcert6 10
ping, ping6 3
Table 2: Credit cost consumption ofbuilt-in measurements as of Feb 2015:atlas.ripe.net/docs/credits. These are creditsconsumed by measurements using default param-eters. These costs can increase (or decrease) ifdefault measurement parameters are tweaked.
the credit consumption of individual built-in measurement isfairly low (see Table 2), it provides an impression that givenample credits, large number of measurements can be provi-sioned on the platform. However, the platform also imposesfour daily rate limit thresholds on each user account: a) Nomore than 100 simultaneous measurements, b) No more than500 probes/measurement, c) No more than 1M credits maybe used each day and d) No more than 10 ongoing and 10one-off measurements of the same type against same targetat any time. These rate limits, although documented1, maynot be well-known to the research community. These limitsmay coerse one to design experiments that span multipledays. As such a request to lift these limits can be made byproposing and gathering support for the measurement studyon the atlas mailing list.
#2: HEAVY-TAILED PROBE DISTRIBUTIONThe geographical distribution of the probes (see Fig. 1)provides a decent high-level overview of the coverage of theplatform. Although the network coverage map2 providesa facility to filter probes by AS Number (ASN), the over-all distribution of probes across ASes and density of probes
1atlas.ripe.net/docs/udm2atlas.ripe.net/results/maps/network-coverage
0 50 100 150 200 250 300 350
1 10 100 1000 10000
#
ASN ranks (log scale)
Connected Probes (7.6K)
0 0.2 0.4 0.6 0.8 1
0 1000 2000 3000 4000
CDF
ASN ranks
Connected Probes (7.6K)
Figure 2: Distribution of a subset of connected andnon-anchored probes (7672) sorted by AS rank asof Feb 2015. ASes are ranked by number of probes.44.59% (3421) of connected probes fall within ASranks <= 101. Rest of ASes contain < 10 probes.The dataset is available at: goo.gl/kmIydP
ACM SIGCOMM Computer Communication Review 36 Volume 45, Number 3, July 2015
within each AS is not well known. Measurements sourcedfrom a specific AS require high probe density to mantaina representative sample, while measurements destined to-wards a specific AS require diversity of network origins. Assuch, we performed an experiment to better understand theAS-based distribution of these probes.
Clustering probes by ASNWe use the RIPE Atlas probe API3 to capture a list of con-nected probes in order to later cluster them by their originAS. The API, however, does not reveal the ASN for allprobes. For instance, some probes (2037, 15.9% of all reg-istered probes as of Feb 2015) did not expose either theirpublic IP or their origin-AS. We grabbed the probe IDs ofthese probes and provisioned a one-off (measurement thatruns only once) traceroute measurement. The measure-ment was scheduled only on a few probes (43 out of 2037)while the rest were deemed disconnected by the scheduler.We identified the origin AS of these probes, and pruned therest of the disconnected probes out of the list. We also usedthe mapping in Fig. 4 (described later in the paper) to ruleout anchors (109 as of Feb 2015). Going forward, we usethe term probe to refer to the connected and non-anchoredsubset (7672) of all RIPE Atlas probes (12790).
Ranking ASNs by number of probesWe ranked ASNs by sorting them by the number of deployedprobes. Table 3 provides a list of top 10 ASes containing thehighest number of probes. For instance, Comcast (AS7922)has 313 (out of 7672) probes which contributes to 4% ofall probes. The cumulative probes within top 10 AS rankscontribute to 18% of all probes as of Feb 2015. Fig. 2shows the long-tail probe distribution sorted by AS ranks.A corresponding CDF of this long-tail, shows how probesdeployed within AS ranks > 101 have less than even 10
3atlas.ripe.net/api/v1/probe
AS RANK AS (ASN) #(PROBES) ↓
01 COMCAST (AS7922) 313
02 PROXAD (AS12322) 242
03 LGI-UPC (AS6830) 233
04 DTAG (AS3320) 190
05 ORANGE (AS3215) 124
06 ZIGGO (AS9143) 83
07 XS4ALL (AS3265) 82
08 BT (AS2856) 76
09 UUNET (AS701) 74
10 VIRGINMEDIA (AS5089) 73
Table 3: Distribution of a subset of connected andnon-anchored probes (7672) sorted by AS rank asof Feb 2015. ASes are ranked by number of con-nected probes. The entire dataset is available at:goo.gl/kmIydP
2010 2011 2012 2013 2014Jan Jul Jan Jul Jan Jul Jan Jul Jan Jul Jan101
102
103
104
# (P
robe
s)
Connected Probes
ISP/NSPCONTENT PROVIDERSEDUCATIONAL/RESEARCHNON-PROFITSENTERPRISE
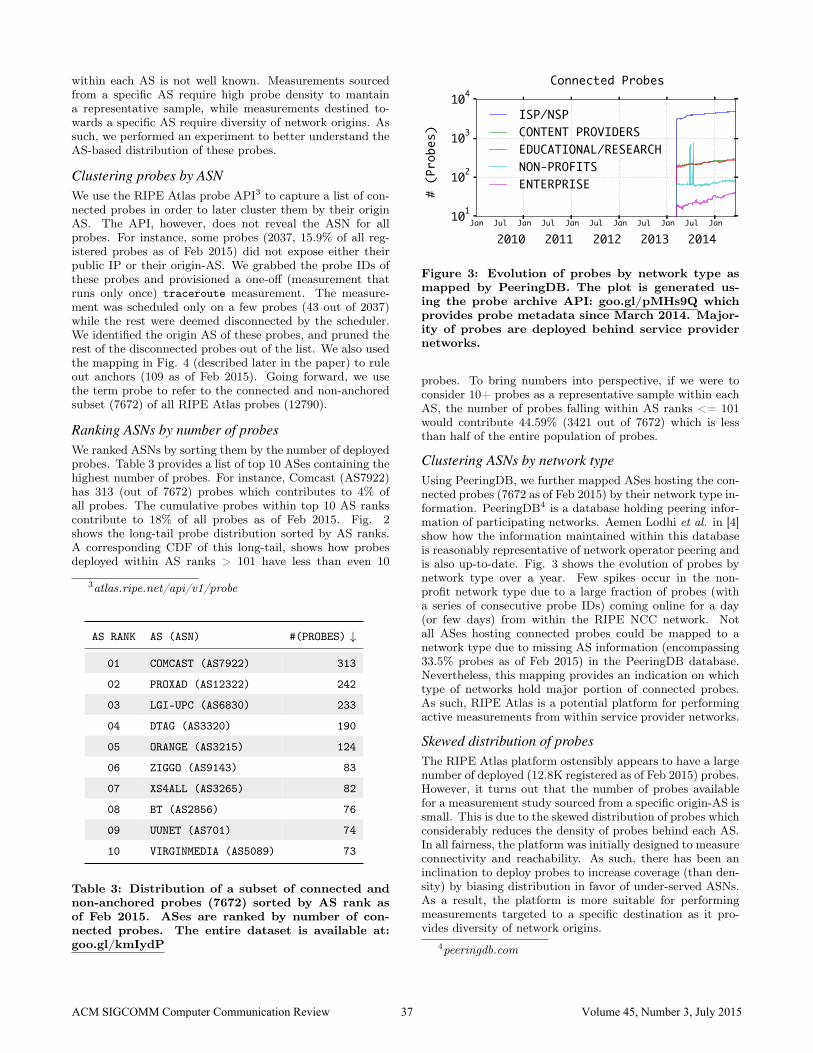
Figure 3: Evolution of probes by network type asmapped by PeeringDB. The plot is generated us-ing the probe archive API: goo.gl/pMHs9Q whichprovides probe metadata since March 2014. Major-ity of probes are deployed behind service providernetworks.
probes. To bring numbers into perspective, if we were toconsider 10+ probes as a representative sample within eachAS, the number of probes falling within AS ranks <= 101would contribute 44.59% (3421 out of 7672) which is lessthan half of the entire population of probes.
Clustering ASNs by network typeUsing PeeringDB, we further mapped ASes hosting the con-nected probes (7672 as of Feb 2015) by their network type in-formation. PeeringDB4 is a database holding peering infor-mation of participating networks. Aemen Lodhi et al. in [4]show how the information maintained within this databaseis reasonably representative of network operator peering andis also up-to-date. Fig. 3 shows the evolution of probes bynetwork type over a year. Few spikes occur in the non-profit network type due to a large fraction of probes (witha series of consecutive probe IDs) coming online for a day(or few days) from within the RIPE NCC network. Notall ASes hosting connected probes could be mapped to anetwork type due to missing AS information (encompassing33.5% probes as of Feb 2015) in the PeeringDB database.Nevertheless, this mapping provides an indication on whichtype of networks hold major portion of connected probes.As such, RIPE Atlas is a potential platform for performingactive measurements from within service provider networks.
Skewed distribution of probesThe RIPE Atlas platform ostensibly appears to have a largenumber of deployed (12.8K registered as of Feb 2015) probes.However, it turns out that the number of probes availablefor a measurement study sourced from a specific origin-AS issmall. This is due to the skewed distribution of probes whichconsiderably reduces the density of probes behind each AS.In all fairness, the platform was initially designed to measureconnectivity and reachability. As such, there has been aninclination to deploy probes to increase coverage (than den-sity) by biasing distribution in favor of under-served ASNs.As a result, the platform is more suitable for performingmeasurements targeted to a specific destination as it pro-vides diversity of network origins.
4peeringdb.com
ACM SIGCOMM Computer Communication Review 37 Volume 45, Number 3, July 2015
probev1 probev2 probev3 anchorv2
PROBE ID HARDWARE VERSION HARDWARE RAM WEBPAGE
[1, 1521] probev1 Lantronix XPort Pro 8 MB probev1.ripe.net
(2000, 5000) probev2 Lantronix XPort Pro 16 MB probev2.ripe.net
(10000, +∞) probev3 TP-Link TL-MR3020 32 MB probev3.ripe.net
(6000, 6018) anchorv1 Dell PowerEdge - -
[6018, 7000) anchorv2 Soekris Net6501-70 - anchorv2.ripe.net
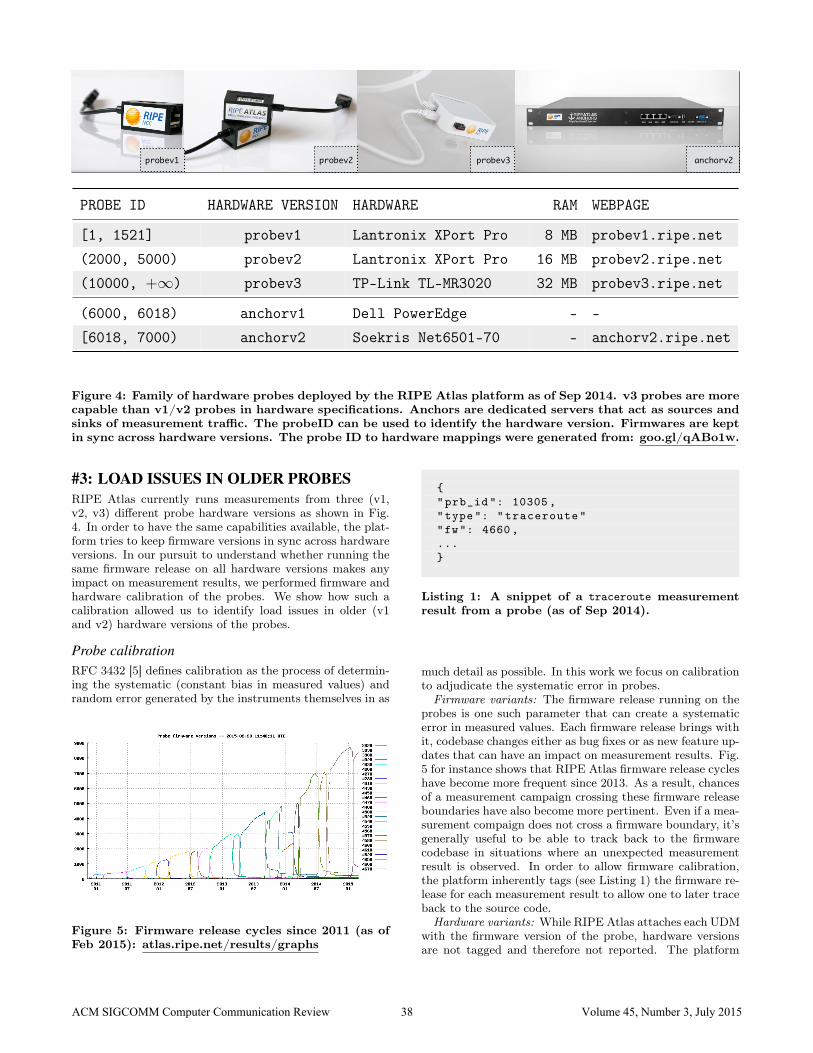
Figure 4: Family of hardware probes deployed by the RIPE Atlas platform as of Sep 2014. v3 probes are morecapable than v1/v2 probes in hardware specifications. Anchors are dedicated servers that act as sources andsinks of measurement traffic. The probeID can be used to identify the hardware version. Firmwares are keptin sync across hardware versions. The probe ID to hardware mappings were generated from: goo.gl/qABo1w.
#3: LOAD ISSUES IN OLDER PROBESRIPE Atlas currently runs measurements from three (v1,v2, v3) different probe hardware versions as shown in Fig.4. In order to have the same capabilities available, the plat-form tries to keep firmware versions in sync across hardwareversions. In our pursuit to understand whether running thesame firmware release on all hardware versions makes anyimpact on measurement results, we performed firmware andhardware calibration of the probes. We show how such acalibration allowed us to identify load issues in older (v1and v2) hardware versions of the probes.
Probe calibrationRFC 3432 [5] defines calibration as the process of determin-ing the systematic (constant bias in measured values) andrandom error generated by the instruments themselves in as
Figure 5: Firmware release cycles since 2011 (as ofFeb 2015): atlas.ripe.net/results/graphs
{"prb_id ": 10305 ,"type": "traceroute""fw": 4660,...}
Listing 1: A snippet of a traceroute measurementresult from a probe (as of Sep 2014).
much detail as possible. In this work we focus on calibrationto adjudicate the systematic error in probes.
Firmware variants: The firmware release running on theprobes is one such parameter that can create a systematicerror in measured values. Each firmware release brings withit, codebase changes either as bug fixes or as new feature up-dates that can have an impact on measurement results. Fig.5 for instance shows that RIPE Atlas firmware release cycleshave become more frequent since 2013. As a result, chancesof a measurement campaign crossing these firmware releaseboundaries have also become more pertinent. Even if a mea-surement compaign does not cross a firmware boundary, it’sgenerally useful to be able to track back to the firmwarecodebase in situations where an unexpected measurementresult is observed. In order to allow firmware calibration,the platform inherently tags (see Listing 1) the firmware re-lease for each measurement result to allow one to later traceback to the source code.
Hardware variants: While RIPE Atlas attaches each UDMwith the firmware version of the probe, hardware versionsare not tagged and therefore not reported. The platform
ACM SIGCOMM Computer Communication Review 38 Volume 45, Number 3, July 2015
runs measurements from three probe (v1, v2 and v3) hard-ware versions. v1 and v2 probes are made of a custom hard-ware built around a Lantronix XPort Pro module, whilev3 probes are off-the-shelf TP-Link wireless routers flashedwith OpenWrt5. As a result, v3 probes are more capable(in terms of hardware specifications) than older v1 and v2probes. In addition, measurements can also be provisionedon anchors (dedicated servers), further adding to the hard-ware variability. Therefore, we asked on the atlas mailinglist and identified how the probe ID itself can reveal hard-ware versions of the probes. Fig. 4 describes the mappingof a probe ID to its hardware version.
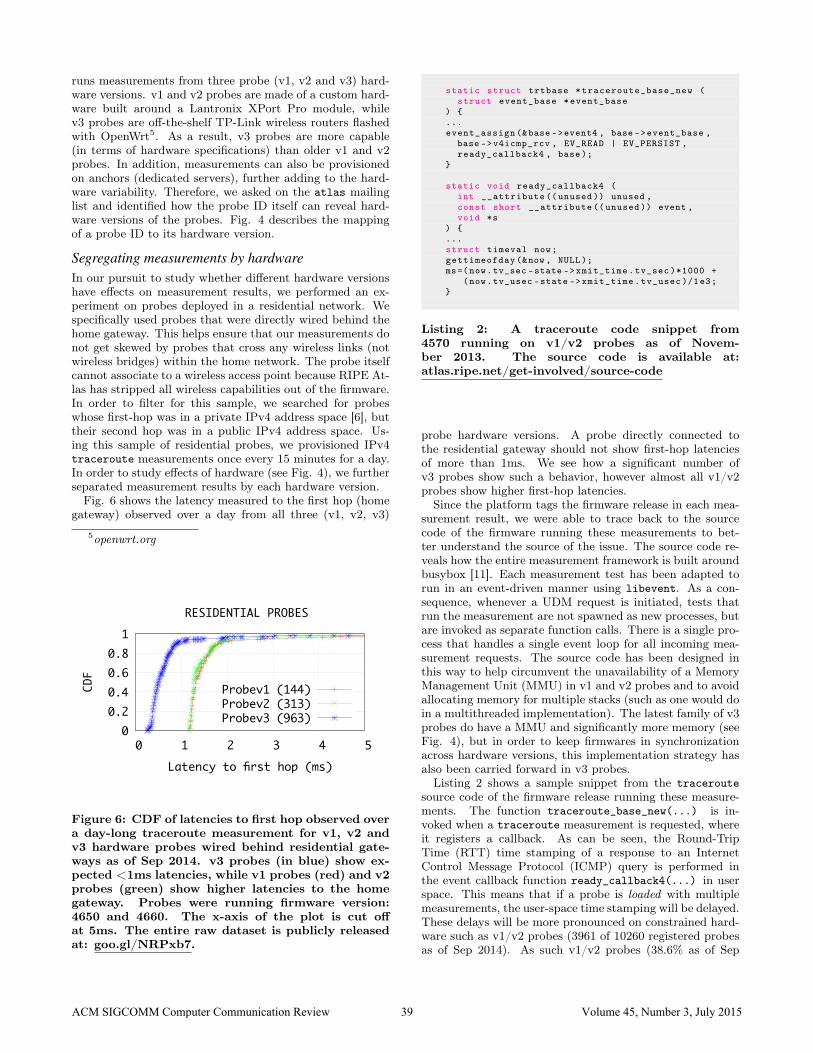
Segregating measurements by hardwareIn our pursuit to study whether different hardware versionshave effects on measurement results, we performed an ex-periment on probes deployed in a residential network. Wespecifically used probes that were directly wired behind thehome gateway. This helps ensure that our measurements donot get skewed by probes that cross any wireless links (notwireless bridges) within the home network. The probe itselfcannot associate to a wireless access point because RIPE At-las has stripped all wireless capabilities out of the firmware.In order to filter for this sample, we searched for probeswhose first-hop was in a private IPv4 address space [6], buttheir second hop was in a public IPv4 address space. Us-ing this sample of residential probes, we provisioned IPv4traceroute measurements once every 15 minutes for a day.In order to study effects of hardware (see Fig. 4), we furtherseparated measurement results by each hardware version.Fig. 6 shows the latency measured to the first hop (home
gateway) observed over a day from all three (v1, v2, v3)
5openwrt.org
0 0.2 0.4 0.6 0.8 1
0 1 2 3 4 5
CDF
Latency to first hop (ms)
RESIDENTIAL PROBES
Probev1 (144)Probev2 (313)Probev3 (963)
Figure 6: CDF of latencies to first hop observed overa day-long traceroute measurement for v1, v2 andv3 hardware probes wired behind residential gate-ways as of Sep 2014. v3 probes (in blue) show ex-pected <1ms latencies, while v1 probes (red) and v2probes (green) show higher latencies to the homegateway. Probes were running firmware version:4650 and 4660. The x-axis of the plot is cut offat 5ms. The entire raw dataset is publicly releasedat: goo.gl/NRPxb7.
static struct trtbase *traceroute_base_new (struct event_base *event_base
) {...event_assign (&base ->event4 , base ->event_base ,
base ->v4icmp_rcv , EV_READ | EV_PERSIST ,ready_callback4 , base);
}
static void ready_callback4 (int __attribute (( unused )) unused ,const short __attribute (( unused )) event ,void *s
) {...struct timeval now;gettimeofday (&now , NULL);ms=(now.tv_sec -state ->xmit_time.tv_sec )*1000 +
(now.tv_usec -state ->xmit_time.tv_usec )/1e3;}
Listing 2: A traceroute code snippet from4570 running on v1/v2 probes as of Novem-ber 2013. The source code is available at:atlas.ripe.net/get-involved/source-code
probe hardware versions. A probe directly connected tothe residential gateway should not show first-hop latenciesof more than 1ms. We see how a significant number ofv3 probes show such a behavior, however almost all v1/v2probes show higher first-hop latencies.Since the platform tags the firmware release in each mea-
surement result, we were able to trace back to the sourcecode of the firmware running these measurements to bet-ter understand the source of the issue. The source code re-veals how the entire measurement framework is built aroundbusybox [11]. Each measurement test has been adapted torun in an event-driven manner using libevent. As a con-sequence, whenever a UDM request is initiated, tests thatrun the measurement are not spawned as new processes, butare invoked as separate function calls. There is a single pro-cess that handles a single event loop for all incoming mea-surement requests. The source code has been designed inthis way to help circumvent the unavailability of a MemoryManagement Unit (MMU) in v1 and v2 probes and to avoidallocating memory for multiple stacks (such as one would doin a multithreaded implementation). The latest family of v3probes do have a MMU and significantly more memory (seeFig. 4), but in order to keep firmwares in synchronizationacross hardware versions, this implementation strategy hasalso been carried forward in v3 probes.Listing 2 shows a sample snippet from the traceroute
source code of the firmware release running these measure-ments. The function traceroute_base_new(...) is in-voked when a traceroute measurement is requested, whereit registers a callback. As can be seen, the Round-TripTime (RTT) time stamping of a response to an InternetControl Message Protocol (ICMP) query is performed inthe event callback function ready_callback4(...) in userspace. This means that if a probe is loaded with multiplemeasurements, the user-space time stamping will be delayed.These delays will be more pronounced on constrained hard-ware such as v1/v2 probes (3961 of 10260 registered probesas of Sep 2014). As such v1/v2 probes (38.6% as of Sep
ACM SIGCOMM Computer Communication Review 39 Volume 45, Number 3, July 2015
2010 2011 2012 2013 2014Jan Jul Jan Jul Jan Jul Jan Jul Jan Jul Jan101
102
103
104#
(Pro
bes)
Connected Probes
v1v2v3anchorv1anchorv2
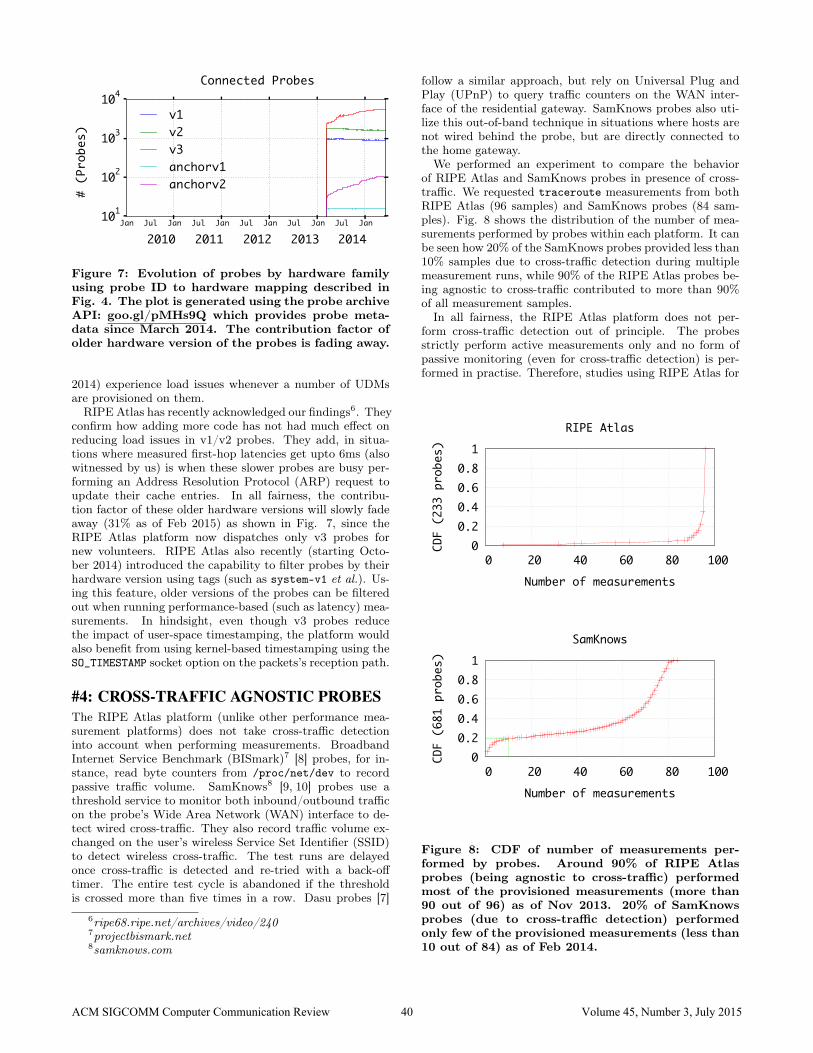
Figure 7: Evolution of probes by hardware familyusing probe ID to hardware mapping described inFig. 4. The plot is generated using the probe archiveAPI: goo.gl/pMHs9Q which provides probe meta-data since March 2014. The contribution factor ofolder hardware version of the probes is fading away.
2014) experience load issues whenever a number of UDMsare provisioned on them.RIPE Atlas has recently acknowledged our findings6. They
confirm how adding more code has not had much effect onreducing load issues in v1/v2 probes. They add, in situa-tions where measured first-hop latencies get upto 6ms (alsowitnessed by us) is when these slower probes are busy per-forming an Address Resolution Protocol (ARP) request toupdate their cache entries. In all fairness, the contribu-tion factor of these older hardware versions will slowly fadeaway (31% as of Feb 2015) as shown in Fig. 7, since theRIPE Atlas platform now dispatches only v3 probes fornew volunteers. RIPE Atlas also recently (starting Octo-ber 2014) introduced the capability to filter probes by theirhardware version using tags (such as system-v1 et al.). Us-ing this feature, older versions of the probes can be filteredout when running performance-based (such as latency) mea-surements. In hindsight, even though v3 probes reducethe impact of user-space timestamping, the platform wouldalso benefit from using kernel-based timestamping using theSO_TIMESTAMP socket option on the packets’s reception path.
#4: CROSS-TRAFFIC AGNOSTIC PROBESThe RIPE Atlas platform (unlike other performance mea-surement platforms) does not take cross-traffic detectioninto account when performing measurements. BroadbandInternet Service Benchmark (BISmark)7 [8] probes, for in-stance, read byte counters from /proc/net/dev to recordpassive traffic volume. SamKnows8 [9, 10] probes use athreshold service to monitor both inbound/outbound trafficon the probe’s Wide Area Network (WAN) interface to de-tect wired cross-traffic. They also record traffic volume ex-changed on the user’s wireless Service Set Identifier (SSID)to detect wireless cross-traffic. The test runs are delayedonce cross-traffic is detected and re-tried with a back-offtimer. The entire test cycle is abandoned if the thresholdis crossed more than five times in a row. Dasu probes [7]
6ripe68.ripe.net/archives/video/2407projectbismark.net8samknows.com
follow a similar approach, but rely on Universal Plug andPlay (UPnP) to query traffic counters on the WAN inter-face of the residential gateway. SamKnows probes also uti-lize this out-of-band technique in situations where hosts arenot wired behind the probe, but are directly connected tothe home gateway.We performed an experiment to compare the behavior
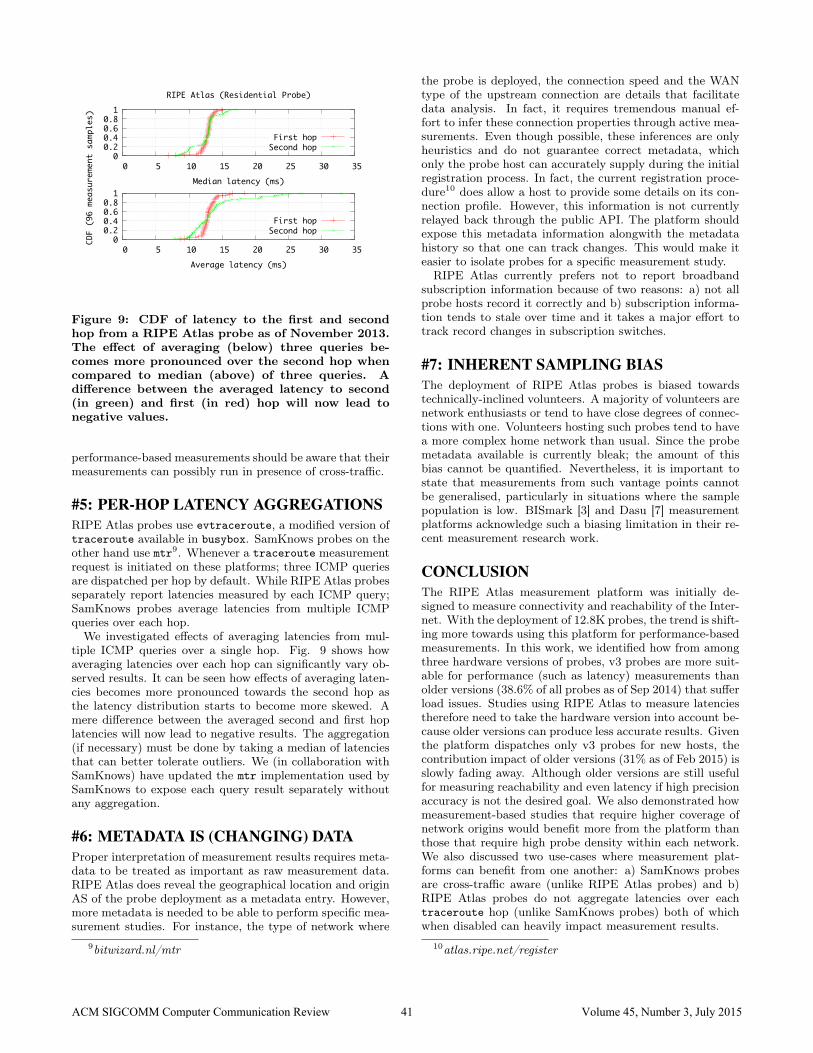
of RIPE Atlas and SamKnows probes in presence of cross-traffic. We requested traceroute measurements from bothRIPE Atlas (96 samples) and SamKnows probes (84 sam-ples). Fig. 8 shows the distribution of the number of mea-surements performed by probes within each platform. It canbe seen how 20% of the SamKnows probes provided less than10% samples due to cross-traffic detection during multiplemeasurement runs, while 90% of the RIPE Atlas probes be-ing agnostic to cross-traffic contributed to more than 90%of all measurement samples.In all fairness, the RIPE Atlas platform does not per-
form cross-traffic detection out of principle. The probesstrictly perform active measurements only and no form ofpassive monitoring (even for cross-traffic detection) is per-formed in practise. Therefore, studies using RIPE Atlas for
0 0.2 0.4 0.6 0.8 1
0 20 40 60 80 100
CDF (233 probes)
Number of measurements
RIPE Atlas
0 0.2 0.4 0.6 0.8 1
0 20 40 60 80 100
CDF (681 probes)
Number of measurements
SamKnows
Figure 8: CDF of number of measurements per-formed by probes. Around 90% of RIPE Atlasprobes (being agnostic to cross-traffic) performedmost of the provisioned measurements (more than90 out of 96) as of Nov 2013. 20% of SamKnowsprobes (due to cross-traffic detection) performedonly few of the provisioned measurements (less than10 out of 84) as of Feb 2014.
ACM SIGCOMM Computer Communication Review 40 Volume 45, Number 3, July 2015
0 0.2 0.4 0.6 0.8 1
0 5 10 15 20 25 30 35
CDF (96 measurement samples)
Median latency (ms)
RIPE Atlas (Residential Probe)
First hopSecond hop
0 0.2 0.4 0.6 0.8 1
0 5 10 15 20 25 30 35
Average latency (ms)
First hopSecond hop
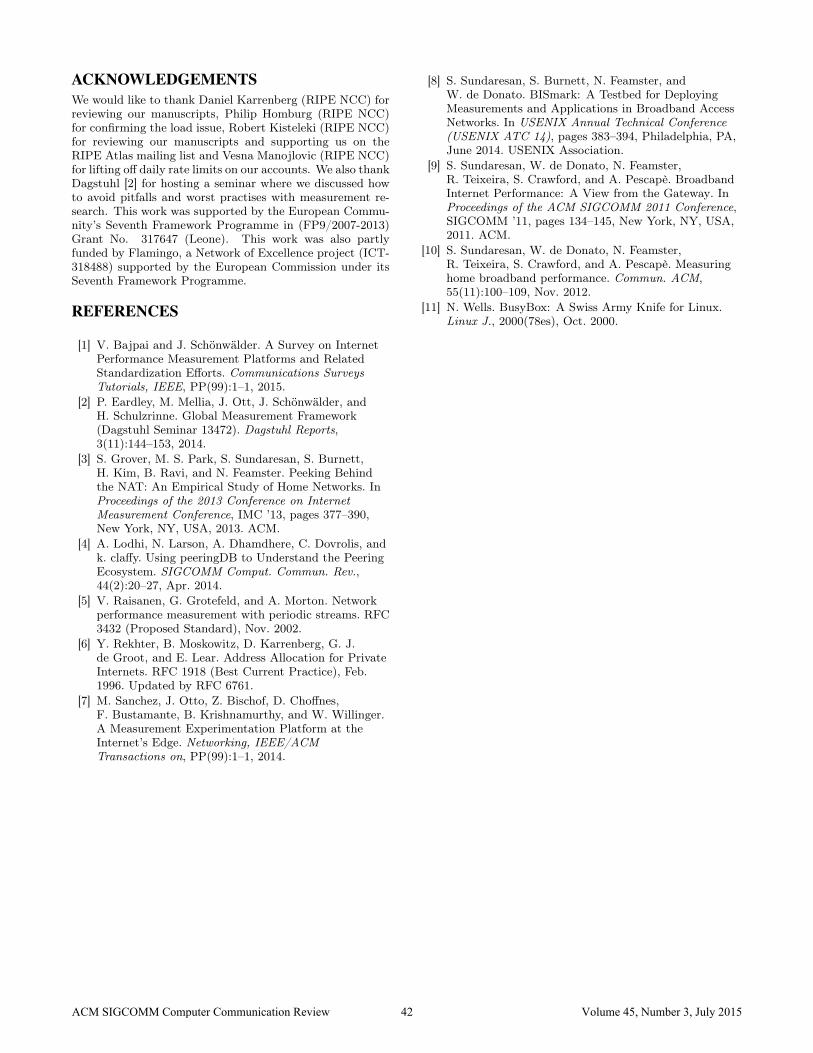
Figure 9: CDF of latency to the first and secondhop from a RIPE Atlas probe as of November 2013.The effect of averaging (below) three queries be-comes more pronounced over the second hop whencompared to median (above) of three queries. Adifference between the averaged latency to second(in green) and first (in red) hop will now lead tonegative values.
performance-based measurements should be aware that theirmeasurements can possibly run in presence of cross-traffic.
#5: PER-HOP LATENCY AGGREGATIONSRIPE Atlas probes use evtraceroute, a modified version oftraceroute available in busybox. SamKnows probes on theother hand use mtr9. Whenever a traceroute measurementrequest is initiated on these platforms; three ICMP queriesare dispatched per hop by default. While RIPE Atlas probesseparately report latencies measured by each ICMP query;SamKnows probes average latencies from multiple ICMPqueries over each hop.We investigated effects of averaging latencies from mul-
tiple ICMP queries over a single hop. Fig. 9 shows howaveraging latencies over each hop can significantly vary ob-served results. It can be seen how effects of averaging laten-cies becomes more pronounced towards the second hop asthe latency distribution starts to become more skewed. Amere difference between the averaged second and first hoplatencies will now lead to negative results. The aggregation(if necessary) must be done by taking a median of latenciesthat can better tolerate outliers. We (in collaboration withSamKnows) have updated the mtr implementation used bySamKnows to expose each query result separately withoutany aggregation.
#6: METADATA IS (CHANGING) DATAProper interpretation of measurement results requires meta-data to be treated as important as raw measurement data.RIPE Atlas does reveal the geographical location and originAS of the probe deployment as a metadata entry. However,more metadata is needed to be able to perform specific mea-surement studies. For instance, the type of network where
9bitwizard.nl/mtr
the probe is deployed, the connection speed and the WANtype of the upstream connection are details that facilitatedata analysis. In fact, it requires tremendous manual ef-fort to infer these connection properties through active mea-surements. Even though possible, these inferences are onlyheuristics and do not guarantee correct metadata, whichonly the probe host can accurately supply during the initialregistration process. In fact, the current registration proce-dure10 does allow a host to provide some details on its con-nection profile. However, this information is not currentlyrelayed back through the public API. The platform shouldexpose this metadata information alongwith the metadatahistory so that one can track changes. This would make iteasier to isolate probes for a specific measurement study.RIPE Atlas currently prefers not to report broadband
subscription information because of two reasons: a) not allprobe hosts record it correctly and b) subscription informa-tion tends to stale over time and it takes a major effort totrack record changes in subscription switches.
#7: INHERENT SAMPLING BIASThe deployment of RIPE Atlas probes is biased towardstechnically-inclined volunteers. A majority of volunteers arenetwork enthusiasts or tend to have close degrees of connec-tions with one. Volunteers hosting such probes tend to havea more complex home network than usual. Since the probemetadata available is currently bleak; the amount of thisbias cannot be quantified. Nevertheless, it is important tostate that measurements from such vantage points cannotbe generalised, particularly in situations where the samplepopulation is low. BISmark [3] and Dasu [7] measurementplatforms acknowledge such a biasing limitation in their re-cent measurement research work.
CONCLUSIONThe RIPE Atlas measurement platform was initially de-signed to measure connectivity and reachability of the Inter-net. With the deployment of 12.8K probes, the trend is shift-ing more towards using this platform for performance-basedmeasurements. In this work, we identified how from amongthree hardware versions of probes, v3 probes are more suit-able for performance (such as latency) measurements thanolder versions (38.6% of all probes as of Sep 2014) that sufferload issues. Studies using RIPE Atlas to measure latenciestherefore need to take the hardware version into account be-cause older versions can produce less accurate results. Giventhe platform dispatches only v3 probes for new hosts, thecontribution impact of older versions (31% as of Feb 2015) isslowly fading away. Although older versions are still usefulfor measuring reachability and even latency if high precisionaccuracy is not the desired goal. We also demonstrated howmeasurement-based studies that require higher coverage ofnetwork origins would benefit more from the platform thanthose that require high probe density within each network.We also discussed two use-cases where measurement plat-forms can benefit from one another: a) SamKnows probesare cross-traffic aware (unlike RIPE Atlas probes) and b)RIPE Atlas probes do not aggregate latencies over eachtraceroute hop (unlike SamKnows probes) both of whichwhen disabled can heavily impact measurement results.
10atlas.ripe.net/register
ACM SIGCOMM Computer Communication Review 41 Volume 45, Number 3, July 2015
ACKNOWLEDGEMENTSWe would like to thank Daniel Karrenberg (RIPE NCC) forreviewing our manuscripts, Philip Homburg (RIPE NCC)for confirming the load issue, Robert Kisteleki (RIPE NCC)for reviewing our manuscripts and supporting us on theRIPE Atlas mailing list and Vesna Manojlovic (RIPE NCC)for lifting off daily rate limits on our accounts. We also thankDagstuhl [2] for hosting a seminar where we discussed howto avoid pitfalls and worst practises with measurement re-search. This work was supported by the European Commu-nity’s Seventh Framework Programme in (FP9/2007-2013)Grant No. 317647 (Leone). This work was also partlyfunded by Flamingo, a Network of Excellence project (ICT-318488) supported by the European Commission under itsSeventh Framework Programme.
REFERENCES
[1] V. Bajpai and J. Schönwälder. A Survey on InternetPerformance Measurement Platforms and RelatedStandardization Efforts. Communications SurveysTutorials, IEEE, PP(99):1–1, 2015.
[2] P. Eardley, M. Mellia, J. Ott, J. Schönwälder, andH. Schulzrinne. Global Measurement Framework(Dagstuhl Seminar 13472). Dagstuhl Reports,3(11):144–153, 2014.
[3] S. Grover, M. S. Park, S. Sundaresan, S. Burnett,H. Kim, B. Ravi, and N. Feamster. Peeking Behindthe NAT: An Empirical Study of Home Networks. InProceedings of the 2013 Conference on InternetMeasurement Conference, IMC ’13, pages 377–390,New York, NY, USA, 2013. ACM.
[4] A. Lodhi, N. Larson, A. Dhamdhere, C. Dovrolis, andk. claffy. Using peeringDB to Understand the PeeringEcosystem. SIGCOMM Comput. Commun. Rev.,44(2):20–27, Apr. 2014.
[5] V. Raisanen, G. Grotefeld, and A. Morton. Networkperformance measurement with periodic streams. RFC3432 (Proposed Standard), Nov. 2002.
[6] Y. Rekhter, B. Moskowitz, D. Karrenberg, G. J.de Groot, and E. Lear. Address Allocation for PrivateInternets. RFC 1918 (Best Current Practice), Feb.1996. Updated by RFC 6761.
[7] M. Sanchez, J. Otto, Z. Bischof, D. Choffnes,F. Bustamante, B. Krishnamurthy, and W. Willinger.A Measurement Experimentation Platform at theInternet’s Edge. Networking, IEEE/ACMTransactions on, PP(99):1–1, 2014.
[8] S. Sundaresan, S. Burnett, N. Feamster, andW. de Donato. BISmark: A Testbed for DeployingMeasurements and Applications in Broadband AccessNetworks. In USENIX Annual Technical Conference(USENIX ATC 14), pages 383–394, Philadelphia, PA,June 2014. USENIX Association.
[9] S. Sundaresan, W. de Donato, N. Feamster,R. Teixeira, S. Crawford, and A. Pescapè. BroadbandInternet Performance: A View from the Gateway. InProceedings of the ACM SIGCOMM 2011 Conference,SIGCOMM ’11, pages 134–145, New York, NY, USA,2011. ACM.
[10] S. Sundaresan, W. de Donato, N. Feamster,R. Teixeira, S. Crawford, and A. Pescapè. Measuringhome broadband performance. Commun. ACM,55(11):100–109, Nov. 2012.
[11] N. Wells. BusyBox: A Swiss Army Knife for Linux.Linux J., 2000(78es), Oct. 2000.
ACM SIGCOMM Computer Communication Review 42 Volume 45, Number 3, July 2015