vaishak belle - arxiv
TRANSCRIPT

Principles and Practice of Explainable Machine Learning*
Vaishak BelleUniversity of Edinburgh & Alan Turing Institute
Ioannis PapantonisUniversity of Edinburgh
Abstract
Artificial intelligence (AI) provides many opportunities to improve private and public life. Discovering patternsand structures in large troves of data in an automated manner is a core component of data science, and currentlydrives applications in diverse areas such as computational biology, law and finance. However, such a highly positiveimpact is coupled with significant challenges: how do we understand the decisions suggested by these systems in orderthat we can trust them? In this report, we focus specifically on data-driven methods – machine learning (ML) andpattern recognition models in particular – so as to survey and distill the results and observations from the literature.
The purpose of this report can be especially appreciated by noting that ML models are increasingly deployed in awide range of businesses. However, with the increasing prevalence and complexity of methods, business stakeholdersin the very least have a growing number of concerns about the drawbacks of models, data-specific biases, and so on.Analogously, data science practitioners are often not aware about approaches emerging from the academic literature,or may struggle to appreciate the differences between different methods, so end up using industry standards such asSHAP. Here, we have undertaken a survey to help industry practitioners (but also data scientists more broadly)understand the field of explainable machine learning better and apply the right tools. Our latter sections build anarrative around a putative data scientist, and discuss how she might go about explaining her models by asking theright questions.
From an organization viewpoint, after motivating the area broadly, we discuss the main developments, includingthe principles that allow us to study transparent models vs opaque models, as well as model-specific or model-agnosticpost-hoc explainability approaches. We also briefly reflect on deep learning models, and conclude with a discussionabout future research directions.
1 IntroductionArtificial intelligence (AI) provides many opportunities to improve private and public life. Discovering patterns andstructures in large troves of data in an automated manner is a core component of data science, and currently drivesapplications in diverse areas such as computational biology, law and finance. However, such a highly positive impact iscoupled with significant challenges: how do we understand the decisions suggested by these systems in order that wecan trust them? Indeed, when one focuses on data-driven methods – machine learning and pattern recognition modelsin particular – the inner workings of the model can be hard to understand. In the very least, explainability can facilitatethe understanding of various aspects of a model, leading to insights that can be utilized by various stakeholders, suchas (cf. Figure 1):
• Data scientists can be benefited when debugging a model or when looking for ways to improve performance.
• Business owners caring about the fit of a model with business strategy and purpose.
• Model Risk analysts challenging the model, in order to check for robustness and approving for deployment.
*Vaishak Belle was supported by a Royal Society University Research Fellowship. The authors acknowledge the support received by Universityof Edinburgh’s Bayes Centre and NatWest Group. We are especially grateful to Peter Gostev from the Data Strategy & Innovation team as well asa wide range of teams throughout Data & Analytics function at NatWest Group who provided insights on industry use cases, key issues faced byfinancial institutions as well as on the applicability of machine learning techniques in practice.
1
arX
iv:2
009.
1169
8v1
[cs
.LG
] 1
8 Se
p 20
20
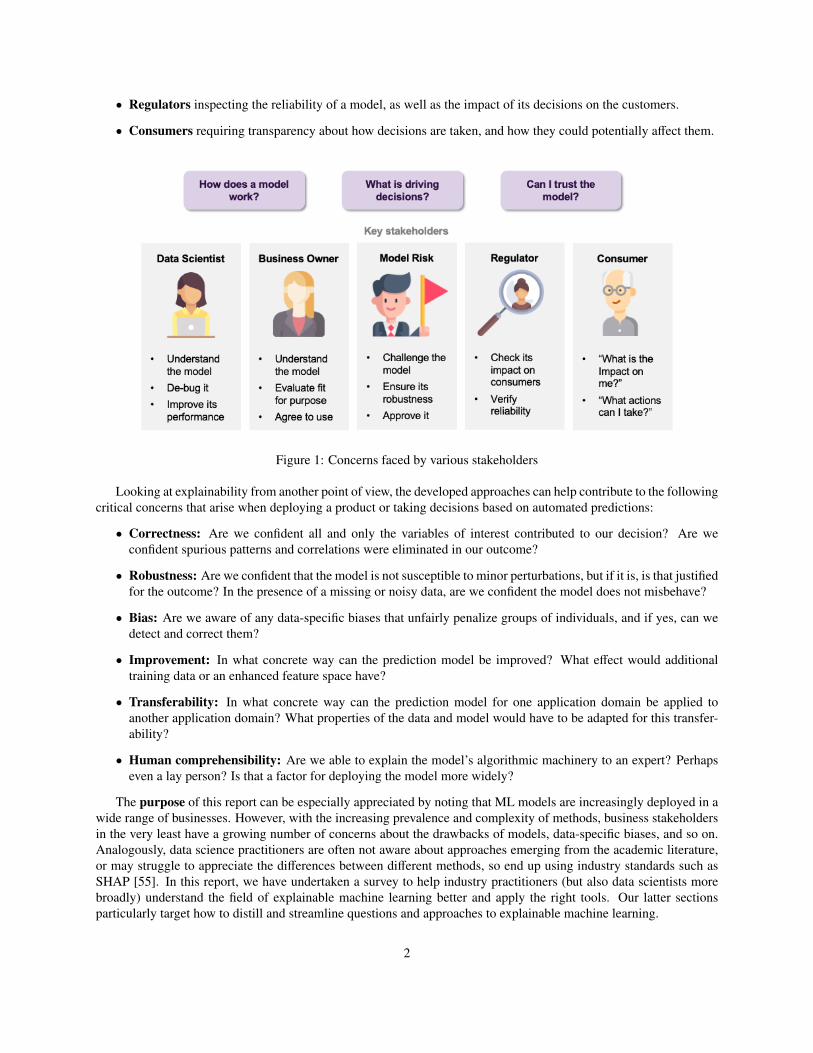
• Regulators inspecting the reliability of a model, as well as the impact of its decisions on the customers.
• Consumers requiring transparency about how decisions are taken, and how they could potentially affect them.
Figure 1: Concerns faced by various stakeholders
Looking at explainability from another point of view, the developed approaches can help contribute to the followingcritical concerns that arise when deploying a product or taking decisions based on automated predictions:
• Correctness: Are we confident all and only the variables of interest contributed to our decision? Are weconfident spurious patterns and correlations were eliminated in our outcome?
• Robustness: Are we confident that the model is not susceptible to minor perturbations, but if it is, is that justifiedfor the outcome? In the presence of a missing or noisy data, are we confident the model does not misbehave?
• Bias: Are we aware of any data-specific biases that unfairly penalize groups of individuals, and if yes, can wedetect and correct them?
• Improvement: In what concrete way can the prediction model be improved? What effect would additionaltraining data or an enhanced feature space have?
• Transferability: In what concrete way can the prediction model for one application domain be applied toanother application domain? What properties of the data and model would have to be adapted for this transfer-ability?
• Human comprehensibility: Are we able to explain the model’s algorithmic machinery to an expert? Perhapseven a lay person? Is that a factor for deploying the model more widely?
The purpose of this report can be especially appreciated by noting that ML models are increasingly deployed in awide range of businesses. However, with the increasing prevalence and complexity of methods, business stakeholdersin the very least have a growing number of concerns about the drawbacks of models, data-specific biases, and so on.Analogously, data science practitioners are often not aware about approaches emerging from the academic literature,or may struggle to appreciate the differences between different methods, so end up using industry standards such asSHAP [55]. In this report, we have undertaken a survey to help industry practitioners (but also data scientists morebroadly) understand the field of explainable machine learning better and apply the right tools. Our latter sectionsparticularly target how to distill and streamline questions and approaches to explainable machine learning.
2

2 Development & ContributionsSuch concerns have motivated intense activity within the community, leading to a number of involved but closelyrelated observations. Drawing on numerous insightful surveys and perspectives (including [54, 3, 88, 60, 25]) anda large number of available approaches, the goal of this survey is to help shed some light into the various kind ofinsights that can be gained, when using them. We distill concepts and strategies with the overall aim of helpingindustry practitioners (but also data scientists more broadly) disentangle the different notions of explanations, as wellas their intended scope of application, leading to a better understanding of the field. To this end, we first provide generalperspectives on explainable machine learning that covers: notions of transparency, criteria for evaluating explainability,as well as the type of explanations one can expect in general. We then turn to some frameworks for summarizing thedevelopments explainable machine learning. A taxonomic framework provides an overview of explainable ML, andthe other two frameworks study certain aspects of the taxonomy. A detailed discussion on transparent vs opaquemodels, and model specific vs model agnostic approaches post-hoc explainability approaches follows, all of whichare referred to in the taxonomic framework. Limitations and strengths of these models and approaches are discussedsubsequently. We then turn to brief observations on explainability with respect to deep learning models. Finally, wedistill these results further by building a narrative around a putative data scientist, and discuss how she might go aboutexplaining her models. We conclude with some directions for future research, including the need for causality-relatedproperties in machine learning models.
3 ScopeIn the interest of space, we will focus on data-driven methods – machine learning and pattern recognition models inparticular – with the primarily goal of classification or prediction by relying on statistical association. Consequently,these engender a certain class of statistical techniques for simplifying or otherwise interpreting the model at hand.
Despite this scoping, the literature is vast.1 Indeed, we note that underlying concerns about human comprehen-sibility and generating explanations for decisions is a general issue in cognitive science, social science and humanpsychology [59]. There are also various “meta”-views on explainability, such as maintaining an explicit model of theuser [13, 49]. Likewise, causality is expected to play a major role in explanations [59], but many models arising inthe causality literature require careful experiment design and/or knowledge from an expert [65]. They are, however,an interesting and worthwhile direction for future research, and left for concluding thoughts. Our work here primarilyfocuses on “mainstream” ML models, and the corresponding statistical explanations (however limiting they may be ina larger context) that one can extract from these models. On that note, we are not concerned with “generating" expla-nations, which might involve, say, a natural language understanding component, but rather extracting an interpretationof the model’s behavior and decision boundary. This undoubtedly limits the literature in terms of what we study andanalyze, but it also allows us to be more comprehensive in that scope. For simplicity, we will nonetheless abbreviatethis scoping of explainable machine learning as XAI in the report, but reiterate that the AI community takes a broaderview that goes beyond (statistical) classification tasks [13, 49].
While we do survey and distill approaches to provide a high-level perspective, we expect the reader to have somefamiliarity with classification and prediction methods. Finally, in terms of terminology, we will mostly use the term“model" to mean the underlying machine learning technique such as random forests or logistic regression or convolu-tional neural networks, and use the term “approach" and “method” to mean an algorithmic pipeline that is undertakento explicitly simplify, interpret or otherwise obtain explanations from a model. If we deviate from this terminology,the context will make clear whether the entity is a machine learning or an explainability one.
4 Perspectives on ExplainabilityBefore delving into actual approaches for explainability, it is worthwhile to reflect on what are the dimensions forhuman comprehensibility. We will start with notions of transparency, in the sense of humans understanding the inner
1A search on Google Scholar for “explainable machine learning" returns about one thousand results; varying search to disjunctively includeterms such as “interpretable”, “artificial intelligence”, and “explanations”, returns an even more extensive set of research papers, naturally.
3

workings of the model. We then turn to evaluation criteria for models. We finally discuss the types of explanationsthat one might desire from models. It should be noted that there is considerable overlap between these notions, and inmany cases, a rigorous definition or formalization is lacking and generally hard to agree on.
4.1 TransparencyTransparency stands for a human-level understanding of the inner workings of the model [54]. We may consider threedimensions:
• Simulatability is the first level of transparency and it refers to a model’s ability to be simulated by a human.Naturally, only models that are simple and compact fall into this category. Having said that, it is worth notingthat simplicity alone is not enough, since, for example, a very large amount of simple rules would prohibita human to calculate the model’s decision simply by thought. On the other hand, simple cases of otherwisecomplex models, such as a neural network with no hidden layers, could potentially fall into this category.
• Decomposability is the second level of transparency and it denotes the ability to break down a model into parts(input, parameters and computations) and then explain these parts. Unfortunately, not all models satisfy thisproperty.
• Algorithmic Transparency is the third level and it expresses the ability to understand the procedure the modelgoes through in order to generate its output. For example, a model that classifies instances based on somesimilarity measure (such as K-nearest neighbors) satisfies this property, since the procedure is clear; find thedatapoint that is the most similar to the one under consideration and assign to the former the same class as thelatter. On the other hand, complex models, such as neural networks, construct an elusive loss function, whilethe solution to the training objective has to be approximated, too. Generally speaking, the only requirement fora model to fall into this category is for the user to be able to inspect it through a mathematical analysis.
Broadly, of course, we may think of machine models as either being transparent or opaque/black-box, although theabove makes clear this distinction is not binary. In practice, despite the nuances, it is convention to see decision trees,linear regression, among others as simpler, transparent models, and random forests, deep learning, among others asopaque models, partly because current applications rarely use a single perceptron neural network.
4.2 Evaluation CriteriaAlthough initially considered for rule extraction methods [20], we might consider the following dimensions to evalu-ating models in terms of explainability:
• Comprehensibility: The extent to which extracted representations are humanly comprehensible, and thustouching on the dimensions of transparency considered earlier.
• Fidelity: The extent to which extracted representations accurately capture the opaque models from which theywere extracted.
• Accuracy: The ability of extracted representations to accurately predict unseen examples.
• Scalability: The ability of the method to scale to opaque models with large input spaces and large numbers ofweighted connections.
• Generality: The extent to which the method requires special training regimes or restrictions on opaque models.
We reiterate that such concepts are hard to quantify rigorously, but can nonetheless serve as guiding intuition forfuture developments in the area.
4
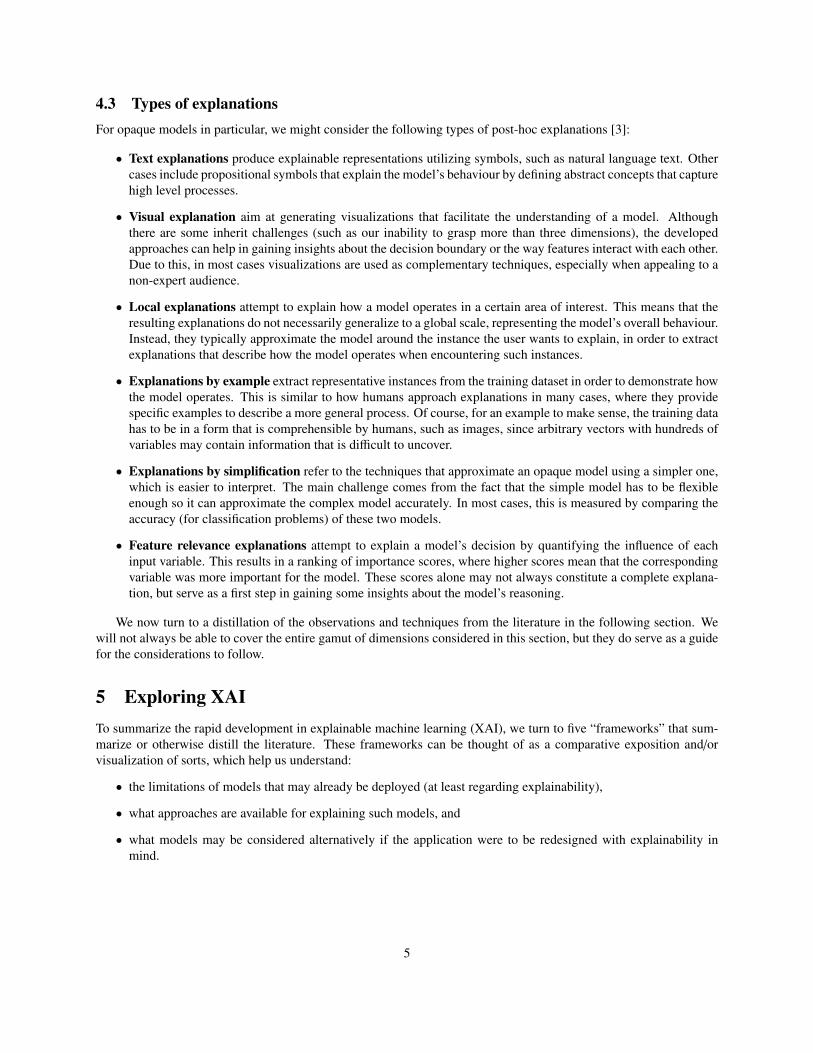
4.3 Types of explanationsFor opaque models in particular, we might consider the following types of post-hoc explanations [3]:
• Text explanations produce explainable representations utilizing symbols, such as natural language text. Othercases include propositional symbols that explain the model’s behaviour by defining abstract concepts that capturehigh level processes.
• Visual explanation aim at generating visualizations that facilitate the understanding of a model. Althoughthere are some inherit challenges (such as our inability to grasp more than three dimensions), the developedapproaches can help in gaining insights about the decision boundary or the way features interact with each other.Due to this, in most cases visualizations are used as complementary techniques, especially when appealing to anon-expert audience.
• Local explanations attempt to explain how a model operates in a certain area of interest. This means that theresulting explanations do not necessarily generalize to a global scale, representing the model’s overall behaviour.Instead, they typically approximate the model around the instance the user wants to explain, in order to extractexplanations that describe how the model operates when encountering such instances.
• Explanations by example extract representative instances from the training dataset in order to demonstrate howthe model operates. This is similar to how humans approach explanations in many cases, where they providespecific examples to describe a more general process. Of course, for an example to make sense, the training datahas to be in a form that is comprehensible by humans, such as images, since arbitrary vectors with hundreds ofvariables may contain information that is difficult to uncover.
• Explanations by simplification refer to the techniques that approximate an opaque model using a simpler one,which is easier to interpret. The main challenge comes from the fact that the simple model has to be flexibleenough so it can approximate the complex model accurately. In most cases, this is measured by comparing theaccuracy (for classification problems) of these two models.
• Feature relevance explanations attempt to explain a model’s decision by quantifying the influence of eachinput variable. This results in a ranking of importance scores, where higher scores mean that the correspondingvariable was more important for the model. These scores alone may not always constitute a complete explana-tion, but serve as a first step in gaining some insights about the model’s reasoning.
We now turn to a distillation of the observations and techniques from the literature in the following section. Wewill not always be able to cover the entire gamut of dimensions considered in this section, but they do serve as a guidefor the considerations to follow.
5 Exploring XAITo summarize the rapid development in explainable machine learning (XAI), we turn to five “frameworks” that sum-marize or otherwise distill the literature. These frameworks can be thought of as a comparative exposition and/orvisualization of sorts, which help us understand:
• the limitations of models that may already be deployed (at least regarding explainability),
• what approaches are available for explaining such models, and
• what models may be considered alternatively if the application were to be redesigned with explainability inmind.
5

Information Classification − Internal
22
Map of Explainability Approaches
Transparent
Models
Opaque
Models
Explainability
Approaches
Logistic / Linear
regression
Decision Trees
K-Nearest
Neighbours
Rule-based
learners
Generative
Additive Models
Bayesian Models
Random Forest
Support Vector
Machines
Multi-layer Neural
Network
Post-Hoc
Explainability
Model-Agnostic
Model-Specific
Explanation by
Simplification
Feature relevance
explanation
Local explanations
Visual
explanations
Explanation by
Simplification
Feature relevance
explanation
Rule-based
learner
Decision tree
Influence
functions
Sensitivity
Game theory
inspired
Interaction based
Rule-based
learner
Counterfactuals
Sensitivity
Dependency plots
Decision trees /
prototypes
Feature
importance
ICE
Distillation
Model types
Explainability
Categories
Explainability
Principles
SHAP
Popular Techniques
(examples)
Anchors
Linear
approximation LIME
InTrees
PDP
Rule-based
learner
Counterfactual
instances
Figure 2: A taxonomic view on XAI
As should be expected, there will be overlap between these frameworks.2 The first two frameworks are inspiredby the discussions in [3], adapted and modified slightly for our purposes. The third and fourth framework are basedon an analysis on the current strengths and limitations of popular realizations of XAI techniques. The fifth is a “cheatsheet” strategy and pipeline we recommend based on the development of numerous libraries for the analysis andinterpretation of machine learning models (see, for example, [60]).
5.1 Taxonomy FrameworkIn Figure 2, we arrange models in terms of the kinds of explainability that are enabled, to be seen as a taxonomy.The subsequent frameworks will be based on this taxonomy, and can be seen as elaborations on the distinction be-tween transparent and opaque ML models (Transparency framework), followed by a description of the capabilities ofexplainability approaches (XAI Capability framework).
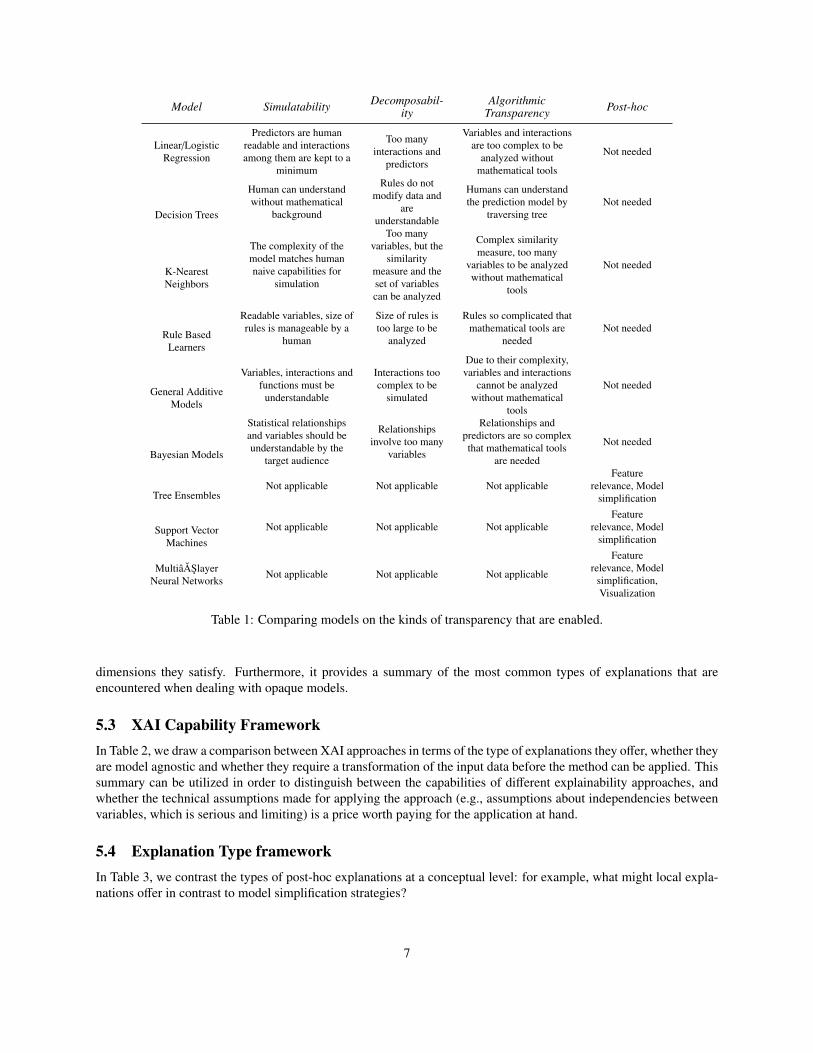
5.2 Transparency FrameworkIn Table 1, we draw a comparison between models in terms of the kinds of transparency that are enabled. Thistable demonstrates the correspondence between the design of various transparent ML models and the transparency
2We note that without experimental comparisons and a proper deliberation on the application domain, these frameworks purely provide anintuitive picture of model capabilities. We also note that in what follows, we make the assumption that the data is already segmented and cleaned,but it should be clear that often data pre-processing is a major step before machine learning methods can be applied. Dealing with data that has notbeen treated can affect both the applicability and the usefulness of explainability methods.
6
Model Simulatability Decomposabil-ity
AlgorithmicTransparency Post-hoc
Linear/LogisticRegression
Predictors are humanreadable and interactionsamong them are kept to a
minimum
Too manyinteractions and
predictors
Variables and interactionsare too complex to be
analyzed withoutmathematical tools
Not needed
Decision Trees
Human can understandwithout mathematical
background
Rules do notmodify data and
areunderstandable
Humans can understandthe prediction model by
traversing treeNot needed
K-NearestNeighbors
The complexity of themodel matches humannaive capabilities for
simulation
Too manyvariables, but the
similaritymeasure and theset of variablescan be analyzed
Complex similaritymeasure, too many
variables to be analyzedwithout mathematical
tools
Not needed
Rule BasedLearners
Readable variables, size ofrules is manageable by a
human
Size of rules istoo large to be
analyzed
Rules so complicated thatmathematical tools are
neededNot needed
General AdditiveModels
Variables, interactions andfunctions must be
understandable
Interactions toocomplex to be
simulated
Due to their complexity,variables and interactions
cannot be analyzedwithout mathematical
tools
Not needed
Bayesian Models
Statistical relationshipsand variables should beunderstandable by the
target audience
Relationshipsinvolve too many
variables
Relationships andpredictors are so complexthat mathematical tools
are needed
Not needed
Tree EnsemblesNot applicable Not applicable Not applicable
Featurerelevance, Model
simplification
Support VectorMachines
Not applicable Not applicable Not applicableFeature
relevance, Modelsimplification
MultiâASlayerNeural Networks
Not applicable Not applicable Not applicable
Featurerelevance, Model
simplification,Visualization
Table 1: Comparing models on the kinds of transparency that are enabled.
dimensions they satisfy. Furthermore, it provides a summary of the most common types of explanations that areencountered when dealing with opaque models.
5.3 XAI Capability FrameworkIn Table 2, we draw a comparison between XAI approaches in terms of the type of explanations they offer, whether theyare model agnostic and whether they require a transformation of the input data before the method can be applied. Thissummary can be utilized in order to distinguish between the capabilities of different explainability approaches, andwhether the technical assumptions made for applying the approach (e.g., assumptions about independencies betweenvariables, which is serious and limiting) is a price worth paying for the application at hand.
5.4 Explanation Type frameworkIn Table 3, we contrast the types of post-hoc explanations at a conceptual level: for example, what might local expla-nations offer in contrast to model simplification strategies?
7

5.5 Data Scientist Strategy FrameworkIn the penultimate section, we motivate a narrative for a putative data scientist, Jane, and discuss how she might goabout explaining her models by asking the right questions. We recommend a simple strategy and outline samplequestions that motivate certain types of explanations.
In the following sections, we will expand on transparent models, followed by opaque models and then to explain-ability approaches, all of which are mentioned in the frameworks above.
6 Transparent ModelsIn this section we are going to introduce a set of models that are inherently considered to be transparent. By this, wemean that their intrinsic architecture satisfies at least one of the three transparency dimensions that we discussed in aprevious section.
• Linear\Logistic Regression refers to a class of models used for predicting continuous\categorical targets, re-spectively, under the assumption that this target is a linear combination of the predictor variables. That specificmodelling choice allows us to view the model as a transparent method. Nonetheless, a decisive factor of how aexplainable a model is, has to do with the ability of the user to explain it, even when talking about inherentlytransparent models. In that regard, although these models satisfy the transparency criteria, they may also benefitfrom post-hoc explainability approaches (such as visualization), especially when non-expert audience needs toget a better understanding of the models’ intrinsic reasoning. The model, nonetheless, has been largely appliedwithin Social Sciences for many decades.
As a general remark, we should note that in order for the models to maintain their transparency features, theirsize must be limited, and the variables used must be understandable by their users.
• Decision Trees form a class of models that generally fall into the transparent ML models category. They containa set of conditional control statements, arranged in a hierarchical manner, where intermediate nodes representdecisions and leaf nodes can be either class labels (for classification problems) or continuous quantities (forregression problems). Supposing a decision tree has only a small amount of features and that its length is notprohibitively long to be memorized by a human, then it clearly falls into the class of simulatable models. Inturn, if the model’s length does not allow simulating it, but the features are still understandable by a human user,then the model is no longer simulatable, but it becomes decomposable. Finally, if on top of that the model alsoutilizes complex feature relationships, then it falls into the category of algorithmically transparent models.
Decision trees are usually utilized in cases where understandability is essential for the application at hand, soin these scenarios not overly complex trees are preferred. We should also note that apart from AI and relatedfields, a significant amount of decision trees’ applications come from other fields, such as medicine. However,a major limitation of these models stems from their tendency to overfit the data, leading to poor generalizationperformance, hindering their application in cases where high predictive accuracy is desired. In such cases,ensembles of trees could offer much better generalization, but these models cannot be considered transparentanymore 3.
• K-Nearest Neighbours (KNN) is also a method that falls within transparent models, which deals with classi-fication problems in a simple and straightforward way: it predicts the class of a new data point by inspectingthe classes of its K nearest neighbours (where the neighbourhood relation is induced by a measure of distancebetween data points). The majority class is then assigned to the instance at hand.
Under the right conditions, a KNN model is capable of satisfying any level of transparency. It should be noted,however, that this depends heavily on the distance function that is employed, as well as the model’s size and thefeatures’ complexity, as in all the previous cases.
3Although an ensemble of a small number of decision trees could still fall under the category of transparent models, those employed in real-worldapplications typically consist of a large number of trees so can be seen to lose transparency properties.
8

• Rule-based learning is build on the intuitive basis of producing rules in order to describe how a model generatesits outputs. The complexity of the resulting rules ranges from simple “if-else” expressions to fuzzy rules, orpropositional rules encoding complex relationships between variables. As humans also utilize rules in everydaylife, these systems are usually easy to understand, meaning they fall into the category of transparent models.Having said that, the exact level of transparency depends on some designing aspects, such as the the coverage(amount) and the specificity (length) of the generated rules.
Both of these factors are at odds with the transparency of the resulting model. For example, it is reasonableto expect that a system with a very large amount of rules is infeasible to be simulated by a human. The sameapplies to rules containing a prohibiting number of antecedents or consequents. Including cumbersome featuresin the rules, on top of that, could further impede their interpretability, rendering system just algorithmicallytransparent.
• Generalized Additive Models (GAMs) are a class of linear models where the outcome is a linear combinationof some functions of the input features. The goal of these models is to infer the form of these unknown functions,which may belong to a parametric family, such as polynomials, or they could be defined non-parametrically.This allows for a large degree of flexibility, since at some applications they may take the form of a simplefunction, or be handcrafted to represent background knowledge, while in others they may be specified by justsome properties, such as being smooth.
These models certainly satisfy the requirements for being algorithmic transparent, at least. Furthermore, inapplications where the dimensionality of the problem is small and the functions are relatively simple, they couldalso be considered simulatable. However, we should note that while utilizing non-parametric functional formsmay enhance the models fit, it comes with a trade-off regarding its interpretability. It is also worth noting that,as with linear regression, visualization tools are often employed to communicate the results of the analysis (suchas partial dependence plots [29]).
• Bayesian networks refer to the designing approach where the probabilistic relationships between variables areexplicitly represented using a directed graph, usually an acyclic one. Due to this clear characterization of theconnection among the variables, as well as graphical criteria that examine probabilistic relationships by onlyinspecting the graphs topology [30], they have been used extensively in a wide range of applications [2, 43].
Following the above, it is clear that they fall into the class of transparent model. They can potentially fulfilthe necessary prerequisites to be members of all three transparency levels, however including overly complexfeatures or complicating graph topologies can result into them satisfying just algorithmic transparency. Researchinto model abstractions may be relevant to address this issue [41, 8].
Owing to their probabilistic semantics, which allows conditioning and interventions, researchers have lookedinto ways to augment directed and undirected graphical models [7] further to provide explanations, although,of course, they are already inherently transparent in the sense described above. Relevant works include [80],where the authors propose a way to construct explanatory arguments from Bayesian models, as well as [52],where explanations are produced in order to assess the trustworthiness of a model. Furthermore, ways to drawrepresentative examples from data have been considered, such as in [44].
A general remark, even when utilizing the models discussed above, is about the trade-off between complexity andtransparency. Transparency, as a property, is not sufficient to guarantee that a model will be readily explainable. Aswe saw in the above paragraphs, as certain aspects of a model become more complex, it is not apparent how it operatesinternally, anymore. In these cases, XAI approaches could be used in order to explain the model’s decisions, whileutilizing an opaque model could also be considered.
7 Opaque ModelsWhile the models we discussed in the previous section come with appealing transparency features, it is not alwaysthat they are among the better performing ones, at least as determined by predictive accuracy on standard (say) vision
9

datasets. In this section we will touch on the class of opaque models, a set of ML models which, at the expense ofexplainability, achieve higher accuracy utilizing complex decision boundaries.
• Random Forests (RF) were initially proposed as a way to improve the accuracy of single decision trees, whichin many cases suffer from overfitting, and consequently, poor generalization. Random forests address this issueby combining multiple trees together, in an attempt to reduce the variance of the resulting model, leading tobetter generalization [34]. In order to achieve this, each individual tree is trained on a different part of thetraining dataset, capturing different characteristics of the data distribution, to obtain an aggregated prediction.This procedure results in very expressive and accurate models, but it comes at the expense of interpretability,since the whole forest is far more challenging to explain, compared to single trees, forcing the user to applypost-hoc explainability techniques in order to gain an understanding of the decision machinery.
• Support Vector Machines (SVMs) form a class of models rooted deeply in geometrical approaches. Initiallyintroduced for linear classification [86], they were later extended to the non-linear case [10], while a relaxationof the original problem [17] made it suitable for real-life applications. Intuitively, in a binary classificationsetting, SVMs find the data separating hyperplane with the maxim margin, meaning the distance between itand the nearest data point of each class is as large as possible. Apart from classification purposes, SVMs canbe applied in regression [26], or even clustering problems [9]. While SVMs have been successfully used in awide array of applications, their high dimensionality as well as potential data transformations and geometricmotivation, make them very complex and opaque models.
• Multi-layer Neural Networks (NNs) are a class of models that have been used extensively in a number ofapplications, ranging from bioinformatics [15] to recommendation systems [85], due to their state-of-the-artperformance. On the other hand, their complex topology hinders their interpretability, since it is not clearhow the variables interact with each other or what kind of high level features the network might has pickedup. Furthermore, even the theoretical/mathematical understanding of their properties has not been sufficientlydeveloped, rendering them virtual black-box models.
From a technical point of view, NNs are comprised of successive layers of nodes connecting the input features tothe target variable. Each node in an intermediate layer collects and aggregates the outputs of the preceding layerand then produces an output on its own, by passing the aggregated value through a function (called activationfunction).4 In turn, these values are passed on to the next layer and this process is continued until the outputlayer is reached.
An immediate observation is that as the number of layers increases, the harder it becomes to interpret the model.In contrast, an overly simple NN could even fall into the class of simulatable models. But such a simple modelis of very little practical interest these days.
8 Explainability ApproachesIn this section, we are going to review the literature and provide an overview of the various methods that have beenproposed in order to produce post-hoc explanations from opaque models. The rest of the section is divided into thetechniques that are especially designed for Random Forests and then we turn to ones that are model agnostic. We focuson Random Forests owing to their popularity and to illustrate an emerging literature on model-specific explainabilitywhich often leverages technical properties of the ML model to provide a more sophisticated or otherwise customizedexplainability approach.
8.1 Random Forest Explainability ApproachesAs discussed above, Random Forests are among the best performing ML algorithms, used in a wide variety of domains.However, their performance comes at the cost of explainability, so bespoke post-hoc approaches have been developed
4It is worth noting that there are a number of options when it comes to specifying the activation function, which along with the number of theintermediate layers determine the quality of the resulting model.
10

in order to facilitate the understanding of this class of models. For tree ensembles, in general, most of the techniquesfound in the literature fall into either the explanation by simplification or feature relevance explanation categories. Inthe sequel, we will review some of the most popular approaches.
8.1.1 Simplifying and Extracting Rules
• An attempt to simplify RFs can be found in [33], where the authors propose a way to approximate them witha mixture of simpler models. The only requirement for the user is to specify the number of rules that the newmixture of models should contain, thereby providing a degree of freedom regarding how many rules are requiredto distil the model’s intrinsic reasoning. Then, the resulting mixture approximates the original model utilizingonly the amount of rules that the user specified.
• Other approaches, similar in spirit, can be found in [84, 90], where the objective is to approximate the RF usinga single decision tree. In [84], the authors utilize a heuristic, based on information gain, in order to constructa tree that is compact enough to retain interpretability. On the other hand, the approach in [90] was based onstudying the asymptotic behaviour of the Gini index, in order to train a stable and accurate decision tree.
• Another approach to simplify RFs is discussed in [24]. The main contribution of this work is proposing amethodology for extracting the more representative rules a RF has acquired. This approach remedies the factthat RFs consist of thousands of rules: by selecting only the most prominent ones, the amount is reduceddrastically. In this case, too, the resulting rules approximate the original model, but the difference is that nowrules are not learnt by a new model, but are extracted from the RF directly. Furthermore, the obtained rules caneasily be combined in order to create a new rule based classifier.
• The idea above, has been explored from other perspectives as well. In [56], a different method for extractingrules from a RF is proposed. In this case, a hill climbing methodology is utilized in order to construct a set ofrules that approximates the original RF. This, again, leads to a significantly smaller set of rules, facilitating themodel’s comprehensibility.
• A line of research that has also been explored for producing explanations when using RFs is by providing theuser with representative examples. The authors in [78] examine ways to inspect the training dataset in orderto sample a number of data points that are representative members of their corresponding class. This methodcomes with some theoretical guarantees about the quality of the examples, while it is also adaptive, in the sensethat the user specifies the number of total examples, and then the algorithm decides how many examples tosample from each class.
8.1.2 Feature Relevance
• Along with simplification procedures, feature relevance techniques are commonly used for tree ensembles. Oneof the first approaches can be found in Breiman [11]. His method is based on permuting the values of a featurewithin the dataset, and then utilizing various metrics to assess the difference in quality between the original andthe newly acquired model.
• The authors of [64] develop an approach for assessing the importance of individual features, by computing howmuch the model’s accuracy drops, after excluding a feature. Furthermore, employing this method it is possibleto extract a prototypical vector of feature contributions, so we can get an idea of how important each featureis, with respect to the instances belonging in a given class. It is worth noting that extensions of this methodin service of communicating explainability have been proposed as well, such as in [89], where, in addition toslightly modifying the way a feature’s importance is computed, graphical tools for visualizing the results aredeveloped.
• A different approach on measuring a feature’s importance can be found in [81]. The aim of this work is to exam-ine ways to produce “counterfactual” data points, in the following sense: assuming a data point was classifiedas negative (positive), how can we generate a new data point, as similar as possible to the original one, that the
11

XAI method Swap-ping Explanation
Modelagnos-
tic
Categori-cal/Continuous
features
Inter-medi-
atetrans-forma-
tion
Indepen-dent
features
Shapleyvalues
Exam-ples
KernelSHAP[55] No Feature relevance Yes Both Yes Yes Yes No
TreeSHAP [55] Yes Feature relevance No Both Yes No Yes No
LIME [67] Yes Simplification Yes Both Yes No Notnecessarily No
Anchors [68] Yes Simplification Yes Both No No No No
QII [23] Yes Feature relevance Yes Both Yes No Notnecessarily No
CNF rules [76] Yes Simplification Yes Categorical No No No NoInfluence
function [46] Yes Feature relevance Yes Both No No No Yes
ASTRID [36] Yes Feature relevance Yes Both No No No NoDistilation [79] Yes Simplification Yes Both No No No NoCounterfactual
[87] Yes Local Yes Both No No No Yes
InTrees [24] Yes Simplification No Both No No No NoPrototypes [78] Yes Simplification No Both No No No Yes
Feature tweaking[81] Yes Feature relevance No Both No No No Yes
Table 2: Comparing XAI methods
model would classify as positive (negative)? The similarity metric is given by the user, so it can be applicationspecific, incorporating expert knowledge. A by-product of this procedure is that by examining the extent towhich a feature was modified, we get an estimate of its importance, as well as the new counterfactual data point.
• In a somewhat different, yet relevant, approach the authors in [66] develop a series of metrics assessing theimportance of the model’s features. Apart from standard importance scores, they also discuss how to answermore complex questions, such as what is the effect on the model’s accuracy, when using only a subset of theoriginal features, or which subsets of features interact together.
• Other ways to identify a set of important features can be found in the literature, as well. The authors in [5]propose a way to determine a threshold for identifying important features. All features exceeding this thresholdare deemed important, while those that do not are discarded as unnecessary. Following this approach, apartfrom having a vector with each feature’s importance, a way to identify the irrelevant ones is also provided. Inaddition, graphical tools to communicate the results to a non-expert audience are discussed.
8.2 Model-agnostic Explainability ApproachesModel-agnostic techniques are designed having the purpose of being generally applicable, in mind. They have to beflexible enough, so they do not depend on the intrinsic architecture of a model, thus operating solely on the basis ofrelating the input of a model to its outputs. Arguably, the most prominent explanation types in this class are modelsimplification, feature relevance, as well as visualizations.
8.2.1 Explanation by simplification
Arguably the most popular is the technique of Local Interpretable Model-Agnostic Explanations (LIME) [67]. LIMEapproximates an opaque model locally, in the surrounding area of the prediction we are interested in explaining,building either a linear model or a decision tree around the predictions of an opaque model, using the resulting modelas a surrogate in order to explain the more complex one. Furthermore, this approach requires a transformation of the
12
input data to an “interpretable representation”, so the resulting features are understandable to humans, regardless ofthe actual features used by the model (this is termed as “intermediate transformation”, in Table 2).
A similar technique, called anchors, can be found in [68]. Here the objective is again to approximate a modellocally, but this time not by using a linear model. Instead, easy to understand “if-then” rules that anchor the model’sdecision are employed. The rules aim at capturing the essential features, omitting the rest, so it results in more sparseexplanations.
G-REX [47] is an approach first introduced in genetic programming, in order to extract rules from data, but laterworks have expanding its score, rendering capable of addressing explainability [40, 39].
Another approach is introduced in [76], where the authors explore a way to learn rules in either ConjunctiveNormal Form (CNF) or Disjunctive Normal Form (DNF). Supposing that all variables are binary, then the algorithmbuilds a classification model that attempts to explain the complex model’s decisions utilizing only such propositionalrules. Such approaches have the extra benefit of resulting in a set of symbolic rules that are explainable by default, aswell as can be utilized as a predictive model, themselves.
Another perspective in simplification is introduced in [48]. In this work, the objective is to approximate an opaquemodel using a decision tree, but the novelty of the approach lies on partitioning the training dataset in similar instances,first. Following this procedure, each time a new data point is inspected, the tree responsible for explaining similarinstances will be utilized, resulting in better local performance. Additional techniques to construct rules explaining amodel’s decisions can be found in [82, 83].
In similar spirit, the authors of [6] formulate model simplification as a model extraction process by approximatinga complex model using a transparent one. The proposed approach utilizes the predictions of a black-box model tobuild a (greedy) decision tree, in order to inspect this surrogate model to gain some insights about the original one.Simplification is approached from a different perspective in [79], where an approach to distill and audit black boxmodels is presented. This is a two-part process, comprising of a distillation approach, as well as a statistical test. So,overall, the approach provides a way to inspect whether a set of variables is enough to recreate the original model, orif extra information is required in order to achieve the same accuracy.
There has been considerable recent development in the so-called counterfactual explanations [87]. Here, the ob-jective is to create instances as close as possible to the instance we wish to explain, but such that the model classifiesthe new instance in a different category. By inspecting this new data point and comparing it to the original one we cangain insights on what the model considers as minimal changes to the original data point, so as to change its decision.A simple example is the case of an applicant who was denied his loan application, and the explanation might say thathad he had a permanent contract with his current employer, the loan would be approved.
8.2.2 Feature relevance
One of the most popular contributions here, and in XAI in general, is that of SHAP (SHapley Additive exPlanations)[55]. The objective in this case is to build a linear model around the instance to be explained, and then interpret thecoefficients as the feature’s importance. This idea is similar to LIME, in fact LIME and SHAP are closely related, butSHAP comes with a set of nice theoretical properties. Its mathematical basis is rooted in coalitional Game Theory,specifically on Shapley values [72]. Roughly, the Shapley value of a feature is its average expected marginal contri-bution to the model’s decision, after all possible combinations have been considered. However, the dimensionality ofmany complex real-world applications renders the calculation of these values infeasible, so the authors in [55] simplifythe problem by making various assumptions, such as independency among the variables. Arguably, this is a strongassumption that can affect the quality of the resulting Shapley values. Other issues exist as well, for example while inits formulation all possible orderings of the variables are considered, in practice this is infeasible, so the ordering ofthe variable affects the computation of the Shapley values. (In Table 2, for example, we use the term “swapping” torefer to whether a method is influenced by the features’ ordering.)
Similar in spirit, in [75], the authors propose to measure a feature’s importance using its Shapley value, but theobjective function, as well as the optimization approach, is not the same as in SHAP. A different strategy is consideredin [23], where a broad variety of measures are presented to tackle the quantification of the degree of influence ofinputs on the outputs. The proposed QII (Quantitative Input Influence) measures account for correlated inputs, whichquantifies the influence by estimating the change in performance when using the original data set versus when usingone where the feature of interest is replaced by a random quantity.
13

Another approach that is based on random feature permutations can be found in [35]. In this work, a methodologyfor randomizing the values of a feature, or a group of features, is introduced, based on the difference between themodel’s behaviour when making predictions for the original dataset and when it does the same for the randomizedversion. This process facilitates the identification of important variables or variable interactions the model has pickedup.
Additional ways to assess the importance of a feature can also be found, such as the one in [1]. The authorsintroduce a methodology for computing feature importance, by transforming each feature in a dataset, so the resultis a new dataset where the influence of a certain feature has been removed, meaning that the rest of the attributes areorthogonal to it. By using several modified datasets, the authors develop a measure for calculating a score, based onthe difference in the model’s performance across the various datasets.
Different from the above threads, in [18], the authors extend existing SA (Sensitivity Analysis) approaches inorder to design a Global SA method. The proposed methodology is also paired with visualization tools to facilitatecommunicating the results. Likewise, the work in [36] presents a method (ASTRID) that aims at identifying whichattributes are utilized by a classifier in prediction time. They approach this problem by looking for the largest subsetof the original features so that if the model is trained on this subset, omitting the rest of the features, the resultingmodel would perform as well as the original one. In [46], the authors use influence functions to trace a modelâAZsprediction back to the training data, by only requiring an oracle version of the model with access to gradients andHessian-vector products. Finally, another way to measure a data point’s influence on the model’s decision comes fromdeletion diagnostics [16]. The difference this time is that this approach is concerned with measuring how omitting adata point from the training dataset influences the quality of the resulting model, making it useful for various tasks,such as model debugging.
8.2.3 Visual explanations
Some popular approaches to visualizations can be found in [18], where an array of various plots are presented. Ad-ditional techniques are discussed in [19], where some new SA approaches are introduced. Finally, [31, 28] presentsICE (Individual Conditional Expectation) and PD (Partial Dependence) plots, respectively. The former, operates oninstance level, depicting the model’s decision boundary as a function of a single feature, with the rest of them stayingfixed. The latter, again plots the model’s decision boundary as a function of a single feature, but this time the remain-ing features are averaged out, so this shows the average effect. There is an interesting relationship between these twoplots, as averaging the ICE plots of each instance of a dataset, yields the corresponding PD plot.
Along with the three frameworks, the above exposition covers the main observations and properties of XAI trends.
9 Brief Overview of Deep Learning ModelsIn this section we provide a brief summary of XAI approaches that have been developed for deep learning (DL)models, specifically multi-layer neural networks (NNs). NNs are highly expressive computational models, achievingstate-of-the-art performance in a wide range of applications. Unfortunately, their architecture and learning regimecorresponds to a complex computational pipeline, so they do not satisfy any level of transparency, at least when we gobeyond simple models, such as single layer perceptron as mentioned previously, although, of course such models donot fall within “deep” learning. This has led to the development of NN-specific XAI methods, utilizing their specifictopology. The majority of these methods fall into the category of either model simplification or feature relevance.
In model simplification, rule extraction is one of the most prominent approaches. Rule extraction techniques thatoperate on a neuron-level rather than the whole model are called decompositional. [63] propose a method for producingif-else rules from NNs, where model training and rule generation happen at the same time. CRED [71] is a differentapproach that utilizes decision trees in order to represent the extracted rules. KT [53] is a related algorithm producingif-else rules, in a layer by layer manner. DeepRED [91] is one of the most popular such techniques, extending CRED.The proposed algorithm has additional decision trees as well as intermediate rules for every hidden layer. It can beseen as a divide and conquer method aiming at describing each layer by the previous one, aggregating all the resultsin order to explain the whole network.
14

On the other hand, when the internal structure of a NN is not taken into account, the corresponding methods arecalled pedagogical. That is, approaches that treat the whole network as a black-box function and do not inspect it at aneuron-level in order to explain it. TREPAN [21] is such an approach, utilizing decision trees as well as a query andsample approach. Saad and Wunsch [70] have proposed an algorithm called HYPINV, based on a network inversiontechnique. This algorithm is capable of producing rules having the form of the conjunction and disjunction of hyper-planes. Augusta and Kathirvalavakumar [4] have introduced the RxREN algorithm, employing reverse engineeringtechniques in order to analyse the output and trace back the components that cause the final result.
Combining the above approaches leads to eclectic rule extraction techniques. RX [38] is such a method, basedon clustering the hidden units of a NN and extracting logical rules connecting the input to the resulting clusters. Ananalogous eclectic approach can be found in [42], where the goal is to generate rules from a NN, using so-calledartificial immune system (AIS) [22] algorithms.
Apart from rule extraction techniques, other approaches have been proposed in order to interpret the decisions ofNNs. In [14], the authors introduce Interpretable Mimic Learning, which builds on model distillation ideas, in order toapproximate the original NN with a simpler, interpretable model. The idea of transferring knowledge from a complexmodel (the teacher) to a simpler one (the student) been explored in other works, for example [37, 12, 58].
An intuitive observation about NNs is that as the number of layers grows larger, developing model simplificationalgorithms gets progressively more difficult. Due to this, feature relevance techniques have gained popularity in recentyears. In [45], the authors propose ways to estimate neuron-wise signals in NNs. Utilizing these estimators theypresent an approach to superposition neuron-wise explanations in order to produce more comprehensive explanations.
In [61] a way to decompose the prediction of a NN is presented. To this end, a neuron’s activation is decomposedand then its score is backpropagated to the input layer, resulting in a vector containing each feature’s importance.
DeepLIFT [73] is another way to assign importance scores when using NNs. The idea behind this method is tocompare a neuron’s activation to a reference one and then use their difference to compute the importance of a feature.
Another popular approach can be found in [77], where the authors present Integrated Gradients. In this work, themain idea is to examine the model’s behaviour when moving along a line connecting the instance to be explained witha baseline instance (serving the purpose of a “neutral” instance). Furthermore, this method comes with some nicetheoretical properties, such as completeness and symmetry preservation, that provide assurances about the generatedexplanations.
10 Views and SuggestionsXAI is a broad and relatively new branch of ML, which, in turn, means that there is still some ambiguity regarding thegoals of the resulting approaches. The approaches presented in this survey are indicative of the range of the variousexplainability angles that are considered within the field. For example, feature relevance approaches provide insightsby measuring and quantitatively ranking the importance of a feature, model simplification approaches construct rela-tively simple models as proxies for the opaque ones, while visual explanations inspect a model’s inner understandingof a problem through graphical tools. At this point we should note that choosing the right technique for the applicationat hand depends exactly at the kind of insights the user would like to gain, or perhaps the kind of explanations he/sheis more comfortable interpreting.
In applications were explainability is of utmost importance, it is worth considering using a transparent model. Thedownside of this, is that these models often compromise performance for the sake of explainability, so it is possiblethat the resulting accuracy hinders their employment in crucial real-world applications.
In cases where maintaining high accuracy is a driving factor, too, employing an opaque model and pairing it withsome XAI techniques, instead of using a transparent one, is probably the most reasonable choice. Subsequently,identifying the right technique for explaining the resulting model is the next step in the quest to understand its internalmechanisms. Each of them comes with its own strong points, as well as limitations. More specifically:
• Local explanations approximate the model in a narrow area, around a specific instance of interest. They offer in-formation about how the model operates when encountering inputs that are similar to the one why are interestedin explaining. This information can attain various forms, such as importance scores or rules. Of course, thismeans that the resulting explanations do not necessarily reflect the model’s mechanism on a global scale. Other
15

limitations arise when considering the inherent difficulty to define what a local area means in a high dimensionalspace. This could also lead to cases where slightly perturbing a feature’s value results in significantly differentexplanations.
• Representative examples allows the user to inspect how the model perceives the elements belonging in a certaincategory. In a sense, they serve as prototype data points. In other related approaches, it is possible to trace themodel’s decision back to the training dataset and uncover the instance that influenced the model’s decision themost. Deletion diagnostics also fall into this category, quantifying how the decision boundary changes whensome training datapoints are left out. The downside of utilizing examples is that they require human inspectionin order to identify the parts of the example that distinguish it from the other categories.
• Feature relevance explanations aim at computing the influence of a feature in the model’s outcome. This couldbe seen as an indirect way to produce explanations, since they only indicate a feature’s individual contribution,without providing information about feature interactions. Naturally, in cases where there are strong correlationsamong features, it is possible that the resulting scores are counterintuitive. On the other hand, some of theseapproaches, such as SHAP, come with some nice theoretical properties (although in practice they might beviolated [50, 57]).
• Model simplification comes with the immediate advantage and flexibility of allowing to approximate an opaquemodel using a simpler one. This offers a wide range of representations that can be utilized, from simple “if-then” rules to fitting surrogate models. This way explanations can be adjusted to best fit a particular audience. Ofcourse, there are limitations as well, with perhaps the most notable one being the quality of the approximation.Furthermore, usually, it is not possible to quantitatively assess it, so empirical demonstrations are needed todemonstrate the goodness of the approximation.
• Visualizations provide for a way to utilize graphical tools in order to inspect some aspects of a model, such asits decision boundary. In most cases they are relatively easy to understand for both technical and non technicalaudiences. However, when resorting to visualizations, many of the proposed approaches make assumptionsabout the data (such as independence) that might not hold for the particular application, perhaps distorting theresults.
Overall, we summarize some of the salient properties to consider in Table 3.Taking a close look at the various kinds of explanations discussed above, makes clear that each of them addresses a
different aspect of explainability. This means that there is no approach suitable for each and every scenario. This is intune with how humans perceive explainability as well, since we know that there is not a single question whose answerwould be able to communicate all the information needed to explain any situation. Most of the times, one would haveto ask multiple questions, each one dealing with a different aspect of the situation in order to obtain a satisfactoryexplanation.
The same approach should be utilized when inspecting the reasoning of ML models. Relying on only one techniquewill only give us a partial picture of the whole story, possibly missing out important information. Hence, combiningmultiple approaches together provides for a more cautious way to explain a model.
At this point we would like to note that there is no established way of combining techniques (in a pipeline fashion),so there is room for experimenting and adjusting them, according to the application at hand. Having said that, we thinkthat a reasonable base case could look like this:
• If explainability is essential for the application, first try transparent models.
• If it doesn’t perform well, and particularly if the complexity of the model is escalating and you lose the explain-ability benefit, use an opaque one.
• Employ an feature relevance method to get the an instance-specific estimate of each feature’s influence.
• A model simplification approach could be used to inspect whether the important features, will turn out to beimportant on a global scale, too.
16

Explanation Advantages Disadvantages
Localexplanations
Explains the model’s behaviour in a local area ofinterest. Operates on instance-level explanations.
Explanations do not generalize on a global scale.Small perturbations might result in very differentexplanations. Not easy to define locality. Some
approaches face stability issues.
Examples
Representative examples provide insights about themodel’s internal reasoning. Some of the algorithmsuncover the most influential training data points that
led the model to its predictions.
Examples require human inspection. They do notexplicitly state what parts of the example influence
the model.
Feature relevance
They operate on an instance level, calculating theimportance of each feature in the model’s decision.A number of the proposed approaches come with
appealing theoretical guarantees.
They are sensitive in cases where the features arehighly correlated. In many cases the exact solutions
are approximated, leading to undesirable side effects,such as the ordering affecting the outcome.
SimplificationSimple surrogate models explain the opaque ones.Resulting explanations, such as rules, are easy to
understand.
Surrogate models may not approximate the originalmodels well. Surrogate models come with their own
limitations.
VisualizationsEasier to communicate to non technical audience.
Most of the approaches are intuitive and not hard toimplement.
There is an upper bound on how many features wecan consider at once. Humans need to inspect theresulting plots in order to produce explanations.
Table 3: Advantages and disadvantages of the various kinds of explanations.
• A local explanation approach could shed light into how small perturbations affect the model’s outcome, sopairing that with the importance scores could facilitate the understanding of a feature’s significance.
• A visualization technique to plot the decision boundary as a function of a subset of the the important features,so we can get a sense of how the model’s predictions change.
11 Jane, the Data ScientistIn this section we will discuss a concrete example of how a data scientist could apply the insights gained so far, in areal-life scenario. To this end, we would like to introduce Jane, a data scientist whose work is on building ML modelsfor loan approvals. As a result, she wold like to consider things like the likelihood of default given some parametersin a credit decision model.
Jane’s current project is to employ a model to assess whether a loan should be approved, that maximizes per-formance while also maintaining explainability (cf. Figure 3).5 This leads to the challenge of achieving an optimaltrade-off between these two things. Broadly, we can think of two possible choices for Jane (cf. Figure 4):
• She can go for transparent models (cf. Figure 5 for popular choices), resulting in a clear interpretation of thedecision boundary, allowing for immediately interpreting how a decision is made. For example, if using logisticregression, the notion of defaulting can seen as a weighted sum of features, so a feature’s coefficient will tellyou this feature’s impact on defaulting.
• Otherwise, she can go for an opaque model (cf. Figure 6 for popular choices), which usually achieve betterperformance and generalizability than their transparent counterparts. Of course, the downside is that in this caseis it will not be easy to interpret the model’s decisions.
Jane decides to give various transparent models a try, but the resulting accuracy was not satisfactory, so she resortsto opaque models (cf. Figure 7). She again tries various candidates and she finds out that Random Forests achieve the
5Note that this informal view encourages a notional plot of explainability versus accuracy, as is common in informal discussions on the challengeof XAI [32, 88]. However, this informal view has been criticized [69] as being misleading. Since we are concerned primarily with mainstream MLmodels and the interpretability that emerges when applying statistical analysis to such models, we will continue using this notional idea for the sakeof simplicity.
17
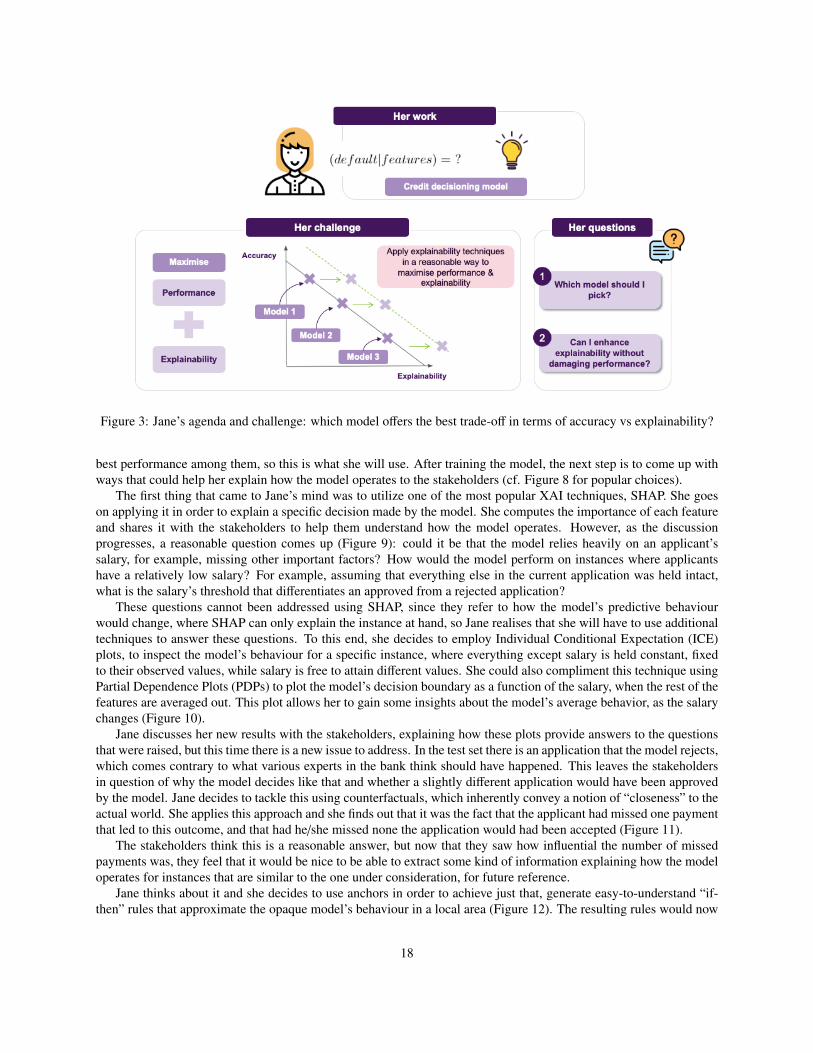
Figure 3: Jane’s agenda and challenge: which model offers the best trade-off in terms of accuracy vs explainability?
best performance among them, so this is what she will use. After training the model, the next step is to come up withways that could help her explain how the model operates to the stakeholders (cf. Figure 8 for popular choices).
The first thing that came to Jane’s mind was to utilize one of the most popular XAI techniques, SHAP. She goeson applying it in order to explain a specific decision made by the model. She computes the importance of each featureand shares it with the stakeholders to help them understand how the model operates. However, as the discussionprogresses, a reasonable question comes up (Figure 9): could it be that the model relies heavily on an applicant’ssalary, for example, missing other important factors? How would the model perform on instances where applicantshave a relatively low salary? For example, assuming that everything else in the current application was held intact,what is the salary’s threshold that differentiates an approved from a rejected application?
These questions cannot been addressed using SHAP, since they refer to how the model’s predictive behaviourwould change, where SHAP can only explain the instance at hand, so Jane realises that she will have to use additionaltechniques to answer these questions. To this end, she decides to employ Individual Conditional Expectation (ICE)plots, to inspect the model’s behaviour for a specific instance, where everything except salary is held constant, fixedto their observed values, while salary is free to attain different values. She could also compliment this technique usingPartial Dependence Plots (PDPs) to plot the model’s decision boundary as a function of the salary, when the rest of thefeatures are averaged out. This plot allows her to gain some insights about the model’s average behavior, as the salarychanges (Figure 10).
Jane discusses her new results with the stakeholders, explaining how these plots provide answers to the questionsthat were raised, but this time there is a new issue to address. In the test set there is an application that the model rejects,which comes contrary to what various experts in the bank think should have happened. This leaves the stakeholdersin question of why the model decides like that and whether a slightly different application would have been approvedby the model. Jane decides to tackle this using counterfactuals, which inherently convey a notion of “closeness” to theactual world. She applies this approach and she finds out that it was the fact that the applicant had missed one paymentthat led to this outcome, and that had he/she missed none the application would had been accepted (Figure 11).
The stakeholders think this is a reasonable answer, but now that they saw how influential the number of missedpayments was, they feel that it would be nice to be able to extract some kind of information explaining how the modeloperates for instances that are similar to the one under consideration, for future reference.
Jane thinks about it and she decides to use anchors in order to achieve just that, generate easy-to-understand “if-then” rules that approximate the opaque model’s behaviour in a local area (Figure 12). The resulting rules would now
18

Figure 4: Jane’s choices: should she go for a transparent model or an opaque one?
look something like “if salary is greater than 20k £ and there are no missed payment, then the loan is approved."Following these findings, the stakeholders are happy with both the model’s performance and the degree of ex-
plainability. However, upon further inspection, they find out that there are some data points in the training datasetthat are too noisy, probably not corresponding to actual data, but rather to instances that were included in the datesetby accident. They turn to Jane, in order to get some insights about how deleting these data points from the trainingdataset would affect the models behaviour. Fortunately, deletion diagnostics show that omitting these instances wouldnot affect the models performance, while they were able to identify some points that could significantly alter the deci-sion boundary, too (Figure 13). All of these helped the stakeholder understand which training data points were moreinfluential for the model.
Finally, as an extra layer of protection, the stakeholders ask Jane if it is possible to have a set of rules describing themodel’s behaviour on a global scale, so they can inspect it to find out whether the model has picked up any undesiredfunctioning. At this point, Jane thinks that they should utilize the Random Forest’s structure, which is an ensembleof Decision Trees. This means, that they already consist of a large number of rules, so it makes sense to go for anapproach that is able to extract the more robust ones, such as inTrees (Figure 14).
The above example showcases how different XAI approaches can be applied to a model to answer various types ofquestions. Furthermore, the last point highlights an interesting distinction, as SHAP, anchors and counterfactuals thatare model agnostic, while inTrees are model-specific, utilizing the model’s architecture to produce explanations. Thereare some points to note here (cf. Figure 15): model agnostic techniques apply to any model, and so if benchmarkinga whole range of models, inspecting their features, model agnostic methods offer consistency in interpretation. On theother hand, since these approaches have to be very flexible, a significant amount of assumptions and approximationsmay be made, possibly resulting in poor estimates or undesired side-effects, such as susceptibility to adversarial attacks[74]. Model-specific could also facilitate developing more efficient algorithms or custom flavoured explanations, basedon the model’s characteristics.
Another factor to take into consideration has to do with the libraries, since model-agnostic approaches are usuallywidely used and compatible with various popular libraries, whereas model-specific ones are emerging and fewer, withpossibly only academic libraries being available. Overall, attempting to use a larger set of XAI methods allows fordeeper inquiry (cf. Figure 16).
These insights are summarized in terms of a “cheat sheet”. Figure 17 discuss a sample pipeline in terms of
19
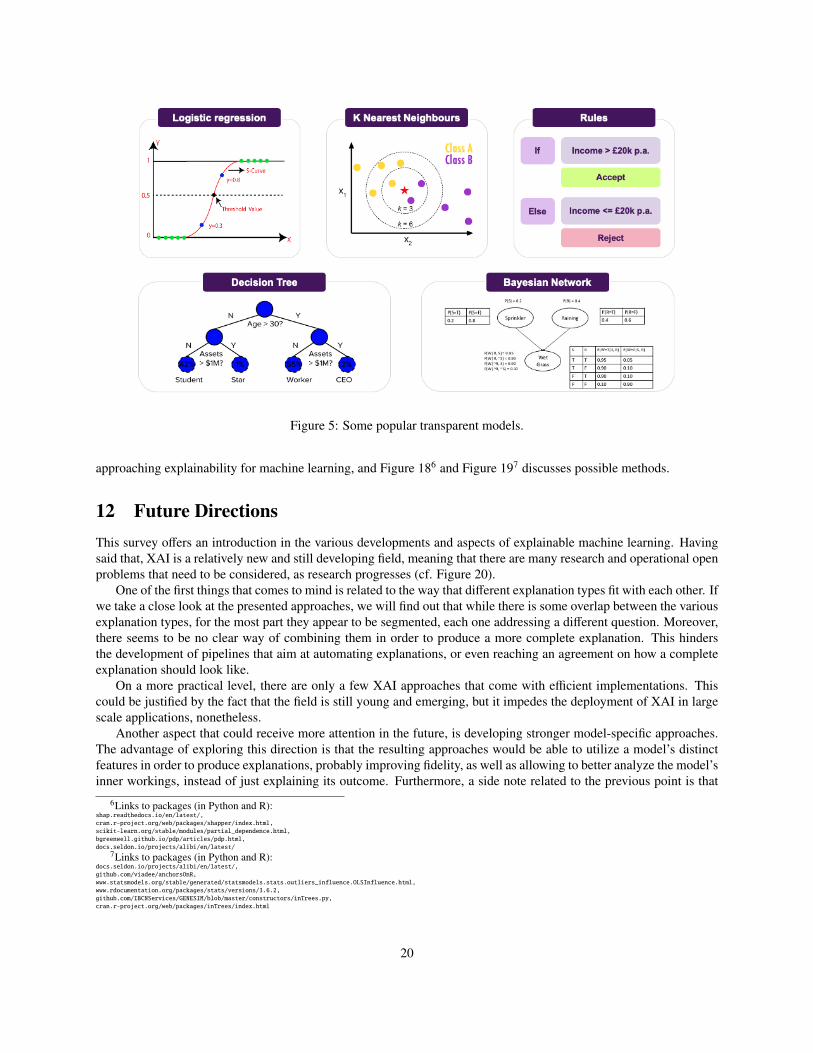
Figure 5: Some popular transparent models.
approaching explainability for machine learning, and Figure 186 and Figure 197 discusses possible methods.
12 Future DirectionsThis survey offers an introduction in the various developments and aspects of explainable machine learning. Havingsaid that, XAI is a relatively new and still developing field, meaning that there are many research and operational openproblems that need to be considered, as research progresses (cf. Figure 20).
One of the first things that comes to mind is related to the way that different explanation types fit with each other. Ifwe take a close look at the presented approaches, we will find out that while there is some overlap between the variousexplanation types, for the most part they appear to be segmented, each one addressing a different question. Moreover,there seems to be no clear way of combining them in order to produce a more complete explanation. This hindersthe development of pipelines that aim at automating explanations, or even reaching an agreement on how a completeexplanation should look like.
On a more practical level, there are only a few XAI approaches that come with efficient implementations. Thiscould be justified by the fact that the field is still young and emerging, but it impedes the deployment of XAI in largescale applications, nonetheless.
Another aspect that could receive more attention in the future, is developing stronger model-specific approaches.The advantage of exploring this direction is that the resulting approaches would be able to utilize a model’s distinctfeatures in order to produce explanations, probably improving fidelity, as well as allowing to better analyze the model’sinner workings, instead of just explaining its outcome. Furthermore, a side note related to the previous point is that
6Links to packages (in Python and R):shap.readthedocs.io/en/latest/,cran.r-project.org/web/packages/shapper/index.html,scikit-learn.org/stable/modules/partial_dependence.html,bgreenwell.github.io/pdp/articles/pdp.html,docs.seldon.io/projects/alibi/en/latest/
7Links to packages (in Python and R):docs.seldon.io/projects/alibi/en/latest/,github.com/viadee/anchorsOnR,www.statsmodels.org/stable/generated/statsmodels.stats.outliers_influence.OLSInfluence.html,www.rdocumentation.org/packages/stats/versions/3.6.2,github.com/IBCNServices/GENESIM/blob/master/constructors/inTrees.py,cran.r-project.org/web/packages/inTrees/index.html
20

Figure 6: Some popular opaque models.
this would probably facilitate coming up with efficient algorithmic implementations, since the new algorithms wouldnot rely on costly approximations.
This last point leads to a broader issue that needs to be resolved, which is building trust towards the explanationsthemselves. As we mentioned before, recent research has showcased how a number of popular, widely used, XAIapproaches are vulnerable to adversarial attacks [74]. Information like that raises questions about whether the outcomeof a XAI technique should be trusted or it has been manipulated. In addition, other related issues about the fitness ofsome of the proposed techniques to address general explainability can be found in the literature [50].
Another line of research that has recently gained traction is about designing hybrid models, combining the ex-pressiveness of opaque models with the clear semantics of transparent models, as in [62], where linear regression iscombined with neural networks, for example. This direction could not only help bridge the gap between opaque andtransparent models, but could also aid the development of state-of-the-art performing explainable models.
Finally, as XAI matures, notions of causal analysis should be incorporated to new approaches [59, 65]. This isalready a major driver in fundamental problems in other areas, such as fairness and bias in machine learning [27, 51],so we should expect it to play an integral part in the future of the XAI literature.
21

Figure 7: As transparent models become increasingly complex they may lose their explainability features. The primarygoal is to maintain a balance between explainability and accuracy. In cases where this is not possible, opaque modelspaired with post hoc XAI approaches provide an alternative solution.
Figure 8: Popular choices for post-hoc explanations.
22

Figure 9: Jane decides to use SHAP, but cannot resolve all of the stakeholder’s questions. Its also worth noting thatalthough SHAP is an important method for explaining opaque models, users should be aware of its limitations, oftenarising from either the optimization objective or the underlying approximation.
Figure 10: Visualizations can facilitate understanding the model’s reasoning, both on an instance and a global level.Most of these approaches make a set of assumptions, so choosing the appropriate one depends on the application.
23

Figure 11: Counterfactuals produce a hypothetical instance, representing a minimal set of changes of the original one,so the model classifies it in a different category.
Figure 12: Local explanations as rules. High precision means that the rule is robust and that similar instances willget the same outcome. High coverage means that large number of the points satisfy the rule’s premises, so the rule“generalizes" better.
24

Figure 13: The quality of a ML model is vastly affected by the quality of the data it is trained on. Finding influentialpoints that can, for example, alter the decision boundary or encourage the model to take a certain decision, contributesin having a more complete picture of the model’s reasoning.
Figure 14: Extracting rules from a random forest. Frequency of a rule is defined as the proportion of data instancessatisfying the rule condition. The frequency measures the popularity of the rule. Error of a rule is defined as thenumber of incorrectly classified instances determined by the rule. So she is able to say that for 80% of the customerswith 100% accuracy (ie. 0% error), when income >20k and there are 0 missed payments, the application is approved.
25
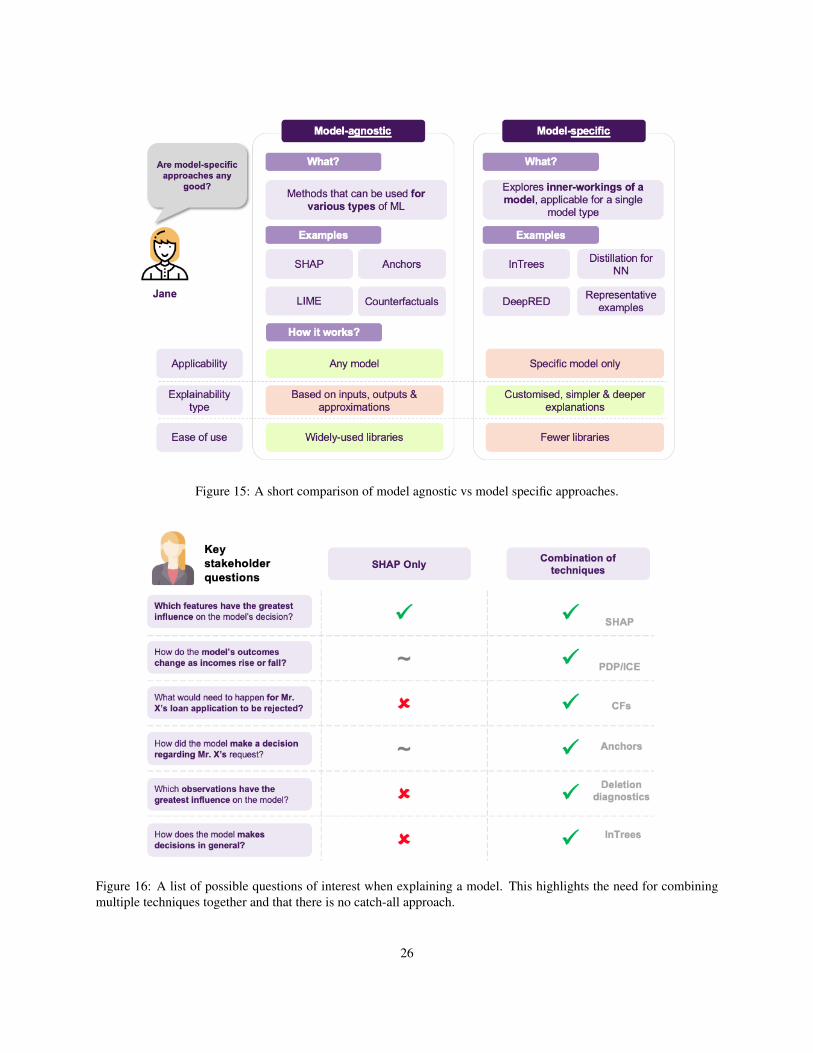
Figure 15: A short comparison of model agnostic vs model specific approaches.
Figure 16: A list of possible questions of interest when explaining a model. This highlights the need for combiningmultiple techniques together and that there is no catch-all approach.
26
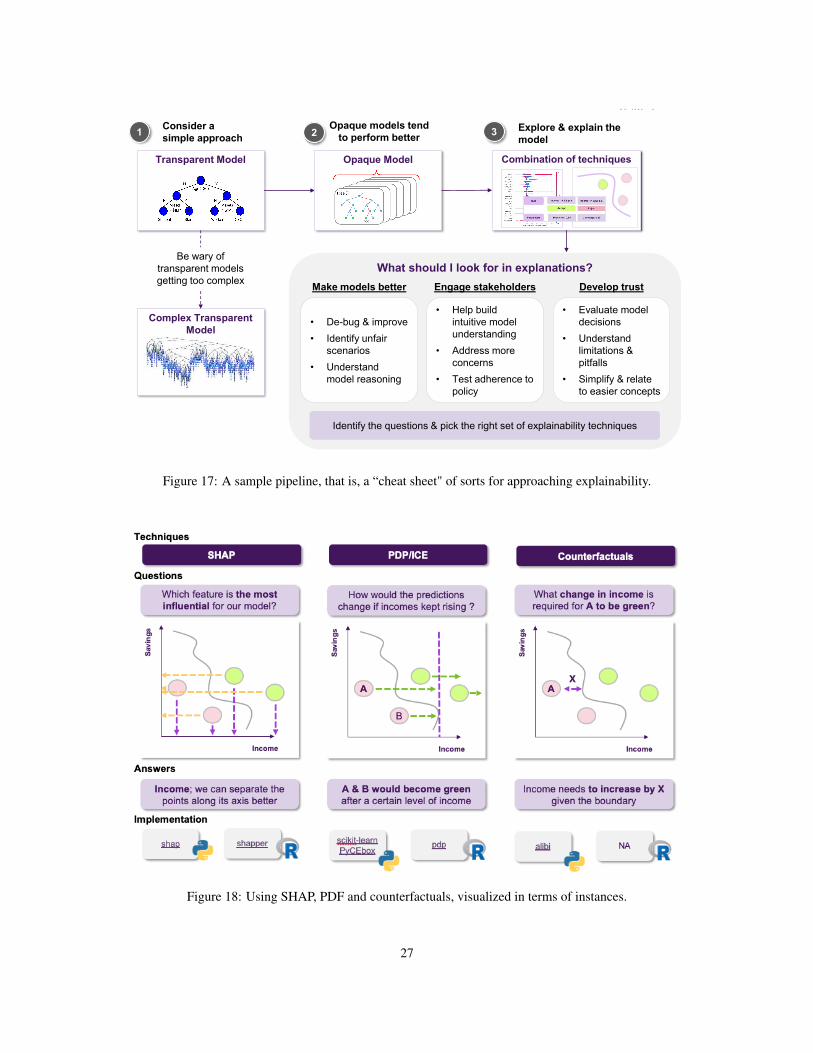
Information Classification − Internal
Complex Transparent
Model
19
XAI Cheat Sheet – General Approach
Transparent Model
1
Be wary of
transparent models
getting too complex
Opaque Model
Consider a
simple approach
Opaque models tend
to perform better 2
Combination of techniques
Explore & explain the
model3
What should I look for in explanations?
Make models better Engage stakeholders Develop trust
• De-bug & improve
• Identify unfair
scenarios
• Understand
model reasoning
• Help build
intuitive model
understanding
• Address more
concerns
• Test adherence to
policy
• Evaluate model
decisions
• Understand
limitations &
pitfalls
• Simplify & relate
to easier concepts
Identify the questions & pick the right set of explainability techniques
Powered by TCPDF (www.tcpdf.org)
Figure 17: A sample pipeline, that is, a “cheat sheet" of sorts for approaching explainability.
Figure 18: Using SHAP, PDF and counterfactuals, visualized in terms of instances.
27
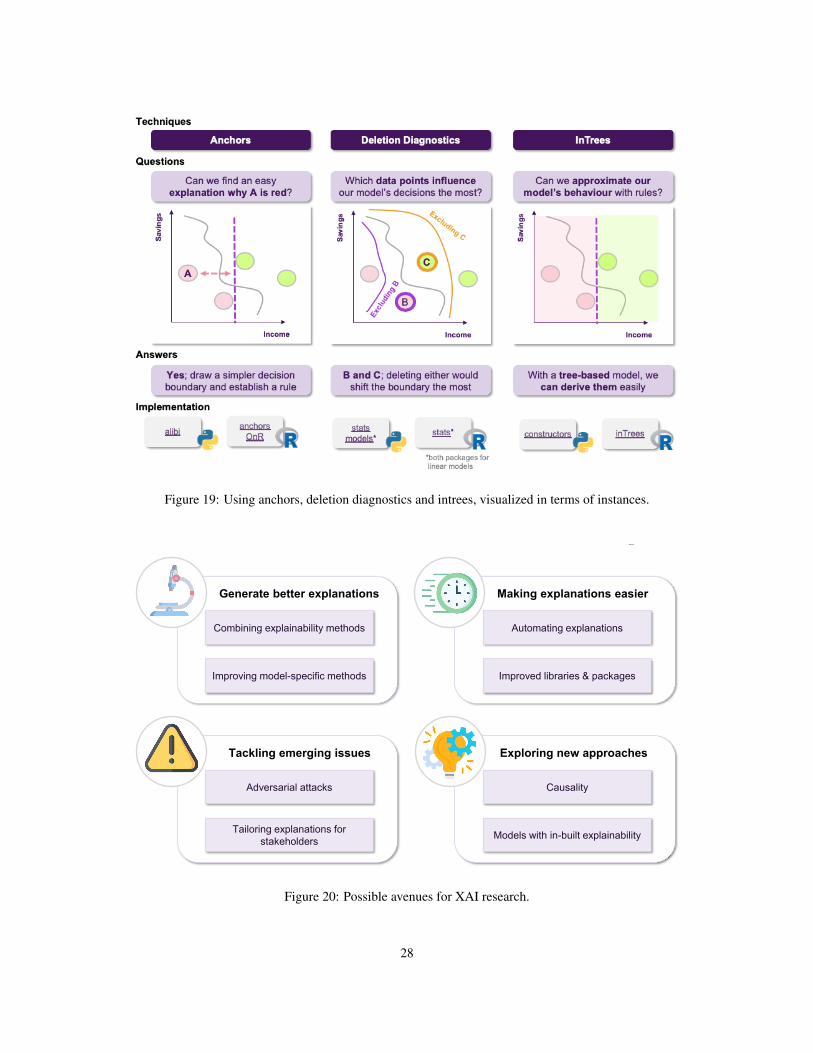
Figure 19: Using anchors, deletion diagnostics and intrees, visualized in terms of instances.
Information Classification − Internal 24
A number of open research problems are being
actively tackled
Tackling emerging issues
Adversarial attacks
Tailoring explanations for
stakeholders
Causality
Models with in-built explainability
Exploring new approaches
Generate better explanations
Combining explainability methods
Improving model-specific methods
Making explanations easier
Automating explanations
Improved libraries & packages
Powered by TCPDF (www.tcpdf.org)
Figure 20: Possible avenues for XAI research.
28

References[1] J. Adebayo and L. Kagal. Iterative orthogonal feature projection for diagnosing bias in black-box models, 2016.
[2] R. Agrahari, A. Foroushani, T. R. Docking, L. Chang, G. Duns, M. Hudoba, A. Karsan, and H. Zare. Applicationsof bayesian network models in predicting types of hematological malignancies. Scientific Reports, 2018.
[3] A. B. Arrieta, N. Díaz-Rodríguez, J. Del Ser, A. Bennetot, S. Tabik, A. Barbado, S. García, S. Gil-López,D. Molina, R. Benjamins, et al. Explainable artificial intelligence (xai): Concepts, taxonomies, opportunities andchallenges toward responsible ai. arXiv preprint arXiv:1910.10045, 2019.
[4] M. G. Augasta and T. Kathirvalavakumar. Reverse engineering the neural networks for rule extraction in classi-fication problems. Neural Processing Letters, 2012.
[5] L. Auret and C. Aldrich. Interpretation of nonlinear relationships between process variables by use of randomforests. Minerals Engineering, 35:27–42, 08 2012.
[6] O. Bastani, C. Kim, and H. Bastani. Interpretability via model extraction. ArXiv, abs/1706.09773, 2017.
[7] L. E. Baum and T. Petrie. Statistical inference for probabilistic functions of finite state markov chains. Ann.Math. Statist., 37(6):1554–1563, 12 1966.
[8] V. Belle. Abstracting probabilistic models: A logical perspective. 12 2019. Ninth International Workshop onStatistical Relational AI, StarAI 2020 ; Conference date: 07-02-2020 Through 07-02-2020.
[9] A. Ben-Hur, D. Horn, H. Siegelmann, and V. N. Vapnik. Support vector clustering. Journal of Machine LearningResearch, 2001.
[10] B. E. Boser, I. M. Guyon, and V. N. Vapnik. A training algorithm for optimal margin classifiers. Proceedings ofthe fifth annual workshop on Computational learning theory – COLT ’92., 1992.
[11] L. Breiman, J. H. Friedman, R. A. Olshen, and C. J. Stone. Classification and Regression Trees. Wadsworth andBrooks, Monterey, CA, 1984.
[12] C. Bucila, R. Caruana, and A. Niculescu-Mizil. Model compression. In KDD ’06, 2006.
[13] T. Chakraborti, S. Sreedharan, S. Grover, and S. Kambhampati. Plan explanations as model reconciliation. In2019 14th ACM/IEEE International Conference on Human-Robot Interaction (HRI), pages 258–266. IEEE, 2019.
[14] Z. Che, S. Purushotham, R. Khemani, and Y. Liu. Interpretable deep models for icu outcome prediction. AMIAAnnual Symposium Proceedings, 2016:371–380, 02 2017.
[15] D. Chicco, P. Sadowski, and P. Baldi. Deep autoencoder neural networks for gene ontology annotation pre-dictions. In Proceedings of the 5th ACM Conference on Bioinformatics, Computational Biology, and HealthInformatics, BCB ’14, pages 533–540, New York, NY, USA, 2014. Association for Computing Machinery.
[16] R. D. Cook. Detection of influential observation in linear regression. Technometrics, 19(1):15–18, 1977.
[17] V. N. Cortes, Corinna; Vapnik. Support-vector networks. Machine Learning, 1995.
[18] P. Cortez and M. J. Embrechts. Opening black box data mining models using sensitivity analysis. In 2011 IEEESymposium on Computational Intelligence and Data Mining (CIDM), pages 341–348, April 2011.
[19] P. Cortez and M. J. Embrechts. Using sensitivity analysis and visualization techniques to open black box datamining models. Information Sciences, 225:1 – 17, 2013.
[20] M. Craven and J. Shavlik. Rule extraction: Where do we go from here. University of Wisconsin MachineLearning Research Group working Paper, 99, 1999.
29

[21] M. W. Craven and J. W. Shavlik. Using sampling and queries to extract rules from trained neural networks. InW. W. Cohen and H. Hirsh, editors, Machine Learning Proceedings 1994, pages 37 – 45. Morgan Kaufmann,San Francisco (CA), 1994.
[22] D. Dasgupta, editor. Artificial Immune Systems and Their Applications. Springer Berlin Heidelberg, 1999.
[23] A. Datta, S. Sen, and Y. Zick. Algorithmic transparency via quantitative input influence: Theory and experimentswith learning systems. In 2016 IEEE Symposium on Security and Privacy (SP), pages 598–617, May 2016.
[24] H. Deng. Interpreting tree ensembles with intrees. arXiv:1408.5456, 08 2014.
[25] F. Doshi-Velez and B. Kim. Towards a rigorous science of interpretable machine learning. arXiv preprintarXiv:1702.08608, 2017.
[26] H. Drucker, C. C. Burges, L. Kaufman, A. J. Smola, and V. N. Vapnik. Support vector regression machines.Advances in Neural Information Processing Systems, 1996.
[27] C. Dwork, M. Hardt, T. Pitassi, O. Reingold, and R. Zemel. Fairness through awareness. In Proceedings of the3rd Innovations in Theoretical Computer Science Conference, ITCS ’12, pages 214–226, New York, NY, USA,2012. Association for Computing Machinery.
[28] J. H. Friedman. Greedy function approximation: A gradient boosting machine. Ann. Statist., 29(5):1189–1232,10 2001.
[29] J. H. Friedman and J. J. Meulman. Multiple additive regression trees with application in epidemiology. Statisticsin Medicine, 22(9):1365–1381, 2003.
[30] D. Geiger, T. Verma, and J. Pearl. Identifying independence in bayesian networks. Networks, 1990.
[31] A. Goldstein, A. Kapelner, J. Bleich, and E. Pitkin. Peeking inside the black box: Visualizing statistical learningwith plots of individual conditional expectation, 2013.
[32] D. Gunning. Explainable artificial intelligence (xai). Defense Advanced Research Projects Agency (DARPA), ndWeb, 2:2, 2017.
[33] S. Hara and K. Hayashi. Making tree ensembles interpretable. 06 2016.
[34] T. Hastie, R. Tibshirani, and J. Friedman. The Elements of Statistical Learning, pages 587–588. Springer, 2008.
[35] A. Henelius, K. Puolamaki, H. Bostrom, L. Asker, and P. Papapetrou. A peek into the black box: exploringclassifiers by randomization. Data Mining and Knowledge Discovery, 28(5-6):1503–1529, 9 2014.
[36] A. Henelius, K. Puolamäki, and A. Ukkonen. Interpreting classifiers through attribute interactions in datasets,2017.
[37] G. Hinton, O. Vinyals, and J. Dean. Distilling the knowledge in a neural network. In NIPS Deep Learning andRepresentation Learning Workshop, 2015.
[38] E. R. Hruschka and N. F. Ebecken. Extracting rules from multilayer perceptrons in classification problems: Aclustering-based approach. Neurocomputing, 70(1):384 – 397, 2006. Neural Networks.
[39] U. Johansson, R. König, and L. Niklasson. The truth is in there - rule extraction from opaque models usinggenetic programming. 01 2004.
[40] U. Johansson, L. Niklasson, and R. König. Accuracy vs. comprehensibility in data mining models. 2004.
[41] H. S. John. Probabilistic program abstractions. 2017.
30

[42] H. Kahramanli and N. Allahverdi. Rule extraction from trained adaptive neural networks using artificial immunesystems. Expert Systems with Applications, 36(2, Part 1):1513 – 1522, 2009.
[43] R. S. Kenett. Applications of bayesian networks. SSRN, 2012.
[44] B. Kim, C. Rudin, and J. Shah. The bayesian case model: A generative approach for case-based reasoning andprototype classification. In Proceedings of the 27th International Conference on Neural Information ProcessingSystems - Volume 2, NIPS’14, pages 1952–1960, Cambridge, MA, USA, 2014. MIT Press.
[45] P.-J. Kindermans, K. T. Schütt, M. Alber, K.-R. Müller, D. Erhan, B. Kim, and S. Dähne. Learning how toexplain neural networks: Patternnet and patternattribution. In ICLR, 2017.
[46] P. W. Koh and P. Liang. Understanding black-box predictions via influence functions. In Proceedings of the 34thInternational Conference on Machine Learning - Volume 70, ICML’17, pages 1885–1894. JMLR.org, 2017.
[47] R. Konig, U. Johansson, and L. Niklasson. G-rex: A versatile framework for evolutionary data mining. In 2008IEEE International Conference on Data Mining Workshops, pages 971–974, Dec 2008.
[48] S. Krishnan and E. Wu. Palm: Machine learning explanations for iterative debugging. In Proceedings of the2nd Workshop on Human-In-the-Loop Data Analytics, HILDA’17, New York, NY, USA, 2017. Association forComputing Machinery.
[49] A. Kulkarni, Y. Zha, T. Chakraborti, S. G. Vadlamudi, Y. Zhang, and S. Kambhampati. Explicable planningas minimizing distance from expected behavior. In Proceedings of the 18th International Conference on Au-tonomous Agents and MultiAgent Systems, pages 2075–2077. International Foundation for Autonomous Agentsand Multiagent Systems, 2019.
[50] I. E. Kumar, S. Venkatasubramanian, C. Scheidegger, and S. Friedler. Problems with shapley-value-based expla-nations as feature importance measures, 2020.
[51] M. J. Kusner, J. Loftus, C. Russell, and R. Silva. Counterfactual fairness. In I. Guyon, U. V. Luxburg, S. Bengio,H. Wallach, R. Fergus, S. Vishwanathan, and R. Garnett, editors, Advances in Neural Information ProcessingSystems 30, pages 4066–4076. Curran Associates, Inc., 2017.
[52] E. Kyrimi, S. Mossadegh, N. Tai, and W. Marsh. An incremental explanation of inference in bayesian net-works for increasing model trustworthiness and supporting clinical decision making. In Artificial Intelligence InMedicine, 2020.
[53] LiMin Fu. Rule generation from neural networks. IEEE Transactions on Systems, Man, and Cybernetics,24(8):1114–1124, Aug 1994.
[54] Z. C. Lipton. The mythos of model interpretability. arXiv preprint arXiv:1606.03490, 2016.
[55] S. M. Lundberg and S.-I. Lee. A unified approach to interpreting model predictions. In Proceedings of the 31stInternational Conference on Neural Information Processing Systems, NIPS’17, pages 4768–4777, Red Hook,NY, USA, 2017. Curran Associates Inc.
[56] M. Mashayekhi and R. Gras. Rule extraction from random forest: the rf+hc methods. In D. Barbosa and E. Mil-ios, editors, Advances in Artificial Intelligence, pages 223–237, Cham, 2015. Springer International Publishing.
[57] L. Merrick and A. Taly. The explanation game: Explaining machine learning models with cooperative gametheory, 2019.
[58] P. Micaelli and A. J. Storkey. Zero-shot knowledge transfer via adversarial belief matching. In H. Wallach,H. Larochelle, A. Beygelzimer, F. d'Alché-Buc, E. Fox, and R. Garnett, editors, Advances in Neural InformationProcessing Systems 32, pages 9547–9557. Curran Associates, Inc., 2019.
31
[59] T. Miller. Explanation in artificial intelligence: Insights from the social sciences. Artificial Intelligence, 267:1–38, 2019.
[60] C. Molnar. Interpretable Machine Learning. Lulu. com, 2020.
[61] G. Montavon, S. Lapuschkin, A. Binder, W. Samek, and K.-R. Müller. Explaining nonlinear classification deci-sions with deep taylor decomposition. Pattern Recognition, 65:211 – 222, 2017.
[62] L. Munkhdalai, T. Munkhdalai, and K. H. Ryu. A locally adaptive interpretable regression, 2020.
[63] L. Özbakundefinedr, A. Baykasoundefinedlu, and S. Kulluk. A soft computing-based approach for integratedtraining and rule extraction from artificial neural networks: Difaconn-miner. Appl. Soft Comput., 10(1):304–317,Jan. 2010.
[64] A. Palczewska, J. Palczewski, R. M. Robinson, and D. Neagu. Interpreting random forest classification modelsusing a feature contribution method. ArXiv, abs/1312.1121, 2013.
[65] J. Pearl. Theoretical impediments to machine learning with seven sparks from the causal revolution. arXivpreprint arXiv:1801.04016, 2018.
[66] D. Petkovic, R. Altman, M. Wong, and A. Vigil. Improving the explainability of random forest classifier - usercentered approach. Pacific Symposium on Biocomputing, 2018.
[67] M. T. Ribeiro, S. Singh, and C. Guestrin. “why should i trust you?”: Explaining the predictions of any classifier.In Proceedings of the 22nd ACM SIGKDD International Conference on Knowledge Discovery and Data Mining,KDD ’16, pages 1135–1144, New York, NY, USA, 2016. Association for Computing Machinery.
[68] M. T. Ribeiro, S. Singh, and C. Guestrin. Anchors: High-precision model-agnostic explanations, 2018.
[69] C. Rudin. Stop explaining black box machine learning models for high stakes decisions and use interpretablemodels instead. Nature Machine Intelligence, 1(5):206–215, 2019.
[70] E. W. Saad and D. C. Wunsch. Neural network explanation using inversion. Neural Networks, 20(1):78 – 93,2007.
[71] M. Sato and H. Tsukimoto. Rule extraction from neural networks via decision tree induction. IJCNN’01.International Joint Conference on Neural Networks. Proceedings (Cat. No.01CH37222), 3:1870–1875 vol.3,2001.
[72] L. S. Shapley. A VALUE FOR N-PERSON GAMES. Defense Technical Information Center, 1952.
[73] A. Shrikumar, P. Greenside, and A. Kundaje. Learning important features through propagating activation dif-ferences. In D. Precup and Y. W. Teh, editors, Proceedings of the 34th International Conference on MachineLearning, volume 70 of Proceedings of Machine Learning Research, pages 3145–3153, International ConventionCentre, Sydney, Australia, 06–11 Aug 2017. PMLR.
[74] D. Slack, S. Hilgard, E. Jia, S. Singh, and H. Lakkaraju. Fooling lime and shap: Adversarial attacks on post hocexplanation methods. In AAAI/ACM Conference on Artificial Intelligence, Ethics, and Society (AIES), 2020.
[75] E. Strumbelj and I. Kononenko. An efficient explanation of individual classifications using game theory. J. Mach.Learn. Res., 11:1–18, Mar. 2010.
[76] G. Su, D. Wei, R. Kush, and D. Malioutov. Interpretable two-level boolean rule learning for classification. 062016.
[77] M. Sundararajan, A. Taly, and Q. Yan. Axiomatic attribution for deep networks. In Proceedings of the 34thInternational Conference on Machine Learning - Volume 70, ICML’17, pages 3319–3328. JMLR.org, 2017.
32

[78] H. F. Tan, G. Hooker, and M. T. Wells. Tree space prototypes: Another look at making tree ensembles inter-pretable. ArXiv, abs/1611.07115, 2016.
[79] S. Tan, R. Caruana, G. Hooker, and Y. Lou. Distill-and-compare: Auditing black-box models using transparentmodel distillation. In AIES ’18, 2017.
[80] S. T. Timmer, J.-J. C. Meyer, H. Prakken, S. Renooij, and B. Verheij. A two-phase method for extractingexplanatory arguments from bayesian networks. In International Journal of Approximate Reasoning, 2016.
[81] G. Tolomei, F. Silvestri, A. Haines, and M. Lalmas. Interpretable predictions of tree-based ensembles via action-able feature tweaking. 06 2017.
[82] R. Turner. A model explanation system. In 2016 IEEE 26th International Workshop on Machine Learning forSignal Processing (MLSP), pages 1–6, 2016.
[83] R. Turner. A model explanation system: Latest updates and extensions, 2016.
[84] A. Van Assche and H. Blockeel. Seeing the forest through the trees: Learning a comprehensible model froman ensemble. In J. N. Kok, J. Koronacki, R. L. d. Mantaras, S. Matwin, D. Mladenic, and A. Skowron, editors,Machine Learning: ECML 2007, pages 418–429, Berlin, Heidelberg, 2007. Springer Berlin Heidelberg.
[85] A. van den Oord, S. Dieleman, and B. Schrauwen. Deep content-based music recommendation. In C. J. C.Burges, L. Bottou, M. Welling, Z. Ghahramani, and K. Q. Weinberger, editors, Advances in Neural InformationProcessing Systems 26, pages 2643–2651. Curran Associates, Inc., 2013.
[86] V. N. Vapnik and A. Y. Lerner. Pattern recognition using generalized portraits. Automation and Remote Control,1963.
[87] S. Wachter, B. Mittelstadt, and C. Russell. Counterfactual explanations without opening the black box: Auto-mated decisions and the gdpr. Harvard journal of law & technology, 31:841–887, 04 2018.
[88] D. S. Weld and G. Bansal. The challenge of crafting intelligible intelligence. Communications of the ACM,62(6):70–79, 2019.
[89] S. Welling, H. Refsgaard, P. Brockhoff, and L. Clemmensen. Forest floor visualizations of random forests.arXiv:1605.09196, 05 2016.
[90] Y. Zhou and G. Hooker. Interpreting models via single tree approximation. arXiv: Methodology, 2016.
[91] J. R. Zilke, E. L. Mencía, and F. Janssen. DeepRED – rule extraction from deep neural networks. In DiscoveryScience, pages 457–473. Springer International Publishing, 2016.
33