val ocean research and development activity nstl s- …
TRANSCRIPT

F A0-A098 902 NA VAL OCEAN RESEARCH AND DEVELOPMENT ACTIVITY NSTL S--ETC F/ S 0
DATA REPOR T FOR OCEANOGRAPHIC/GEOPHYSICAL SURVEYS IN THE NORTHA ETCU
MAR RI 4 A GREEN. S D TROWELL
UNCLASSIFIlED NORDATN-8IN

11111 12
* 11111.2 1. 4n- i- _ ~III
IIII1 Ill IIIIIlt 8
MICROCOPY RESOLUTION TEST CHART
NATIONAL BUREAU OF STANDARDS 1963-A

iU~~M :SStu Wt24low1U
IC / -' ,... ,,.,, .... .... ; ....... " .... I......... ..... J.i......., ..7 " ....... -------- ....... 4 r~i'
0 142 / /
+ I, " °P'"° _I- .f" '? '. IL.CTE,
~13 -'138 "W1439
4II00 /
L2" A
0 IM4BO AIMQ
Xr I)W SM0
4 9 ................. ,.....,.....,.....,.....i.... ., . ...,.....,. ....,............ W
tI I.A. Mwll
€ Sao Floor Division
Ocean~~N~uO Scenean onoy ao"
-- "" I,514 006
I .I I *i ........ . .. .. . .. "-tpn''"p
1-W .... ..... .5 ... .+,g-Fu"-,

vL
" ABSTRACT
This note presents the results of a geophysical/oceano-graphic survey of Area 2 selected from Green and Fleischer(1980). The surveyed area has an average depth of 5300 m and islocated on the eastern flank of the Hokkaido Rise. Averageunconsolidated sediment thickness is 0.45 seconds of two-waytravel time (approximately 400 m). These sediments are probablysiliceous clays interspersed with volcanic ash layers and their
• . calculated acoustic interval velocity is 1.770-1.860 km/sec.
The smoothest bottom and most homogeneous geology appear inthe northeastern section of the survey area. This section, anarea about 25 km x 25 kin, has smooth acoustic basement which ispresent at the northern base of a seamount located at 46.60N,159.80 E. Residual magnetic lineations are also present in thisarea and may represent Cretaceous quiet zone seafloor spreadinganomalies.
In the western part of the survey area the bottom andacoustic basement are rougher than in the eastern part. The localgeology is less homogeneous because seamounts are present.Residual magnetic anomalies are generally associated withseamounts and no correlatable lineations are apparent.
Accession For
NTIS GRA&IDTIC TAB UUnannounced 0Justification
By. ---Disriton /.ty'; --AvailabtlitY ]Codes
i~vall
!!

ACKNOWLEDGEENTS
The authors wish to thank the NAVOCEANO personnelaboard the USNS SILAS BENT who were largely responsiblefor the success of the survey of Area 2. R. Merrifield,T. Lennon, J. Rukowitz, and B. Hill were particularlycooperative and helpful.
iii
-A-

CONTENTS
Page
List of Illustrations iii
I. Introduction 1
II. Temperature and Sound Speed of the Water Column 1
III. Geology I
A. Physiography 5B. Sediments 5C. Sediment Velocities 5D. Acoustic Basement 9E. Residual Magnetic Anomalies 9
IV. Conclusions 12
V. References 12
ILLUSTRATIONS
Page
Figure 1. Northwest Pacific index for site 2 2
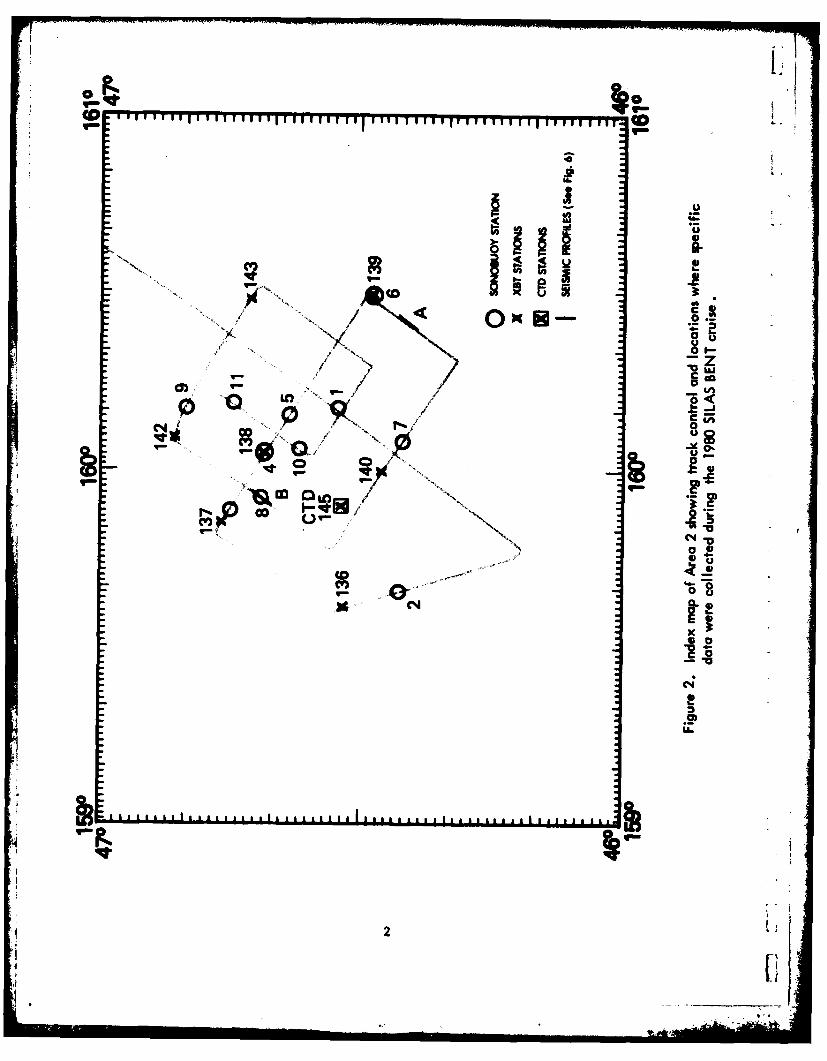
Figure 2. Index map of Area 2 for track control, XBT's, CTD's, sonobuoystations, and profiles shown in Figure 6 3
Figure 3. CTD record 4
Figure 4. Bathymetry and bottom roughness map 6
Figure 5. Sediment isopach map 7
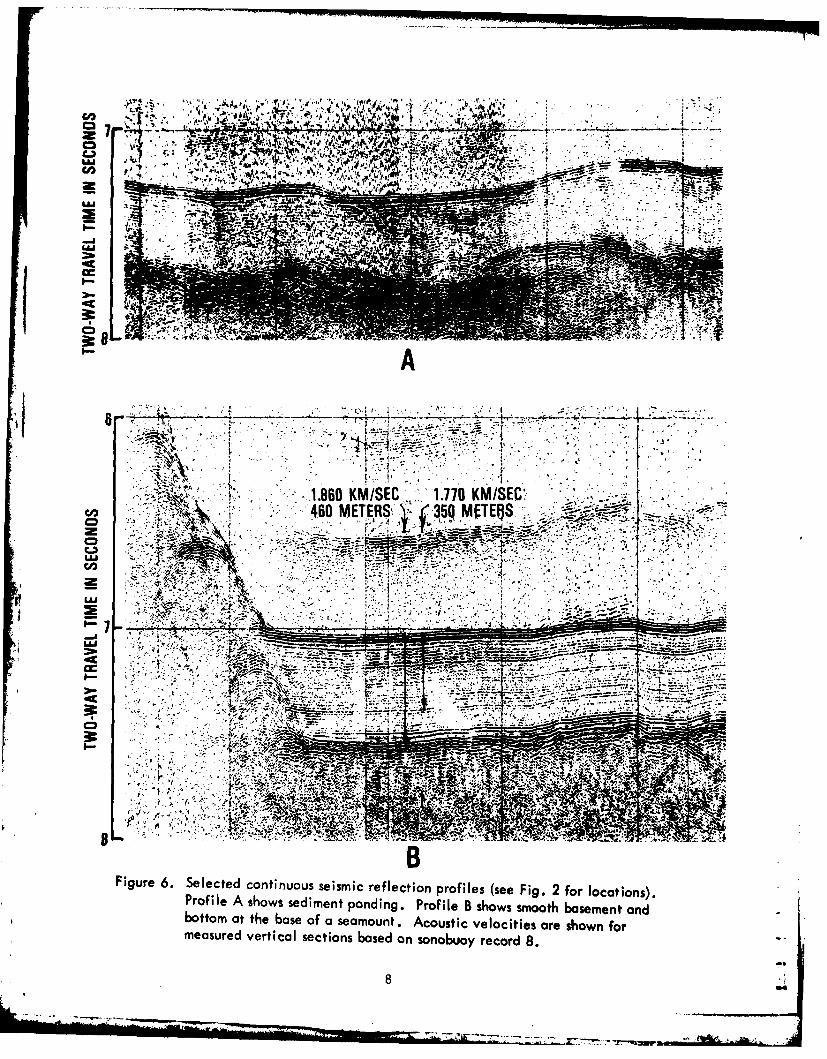
Figure 6. Selected continuous seismic reflection profiles and sedimentvelocity for acoustic horizons 8
L Figure 7. Depth to acoustic basement and basement roughness 10
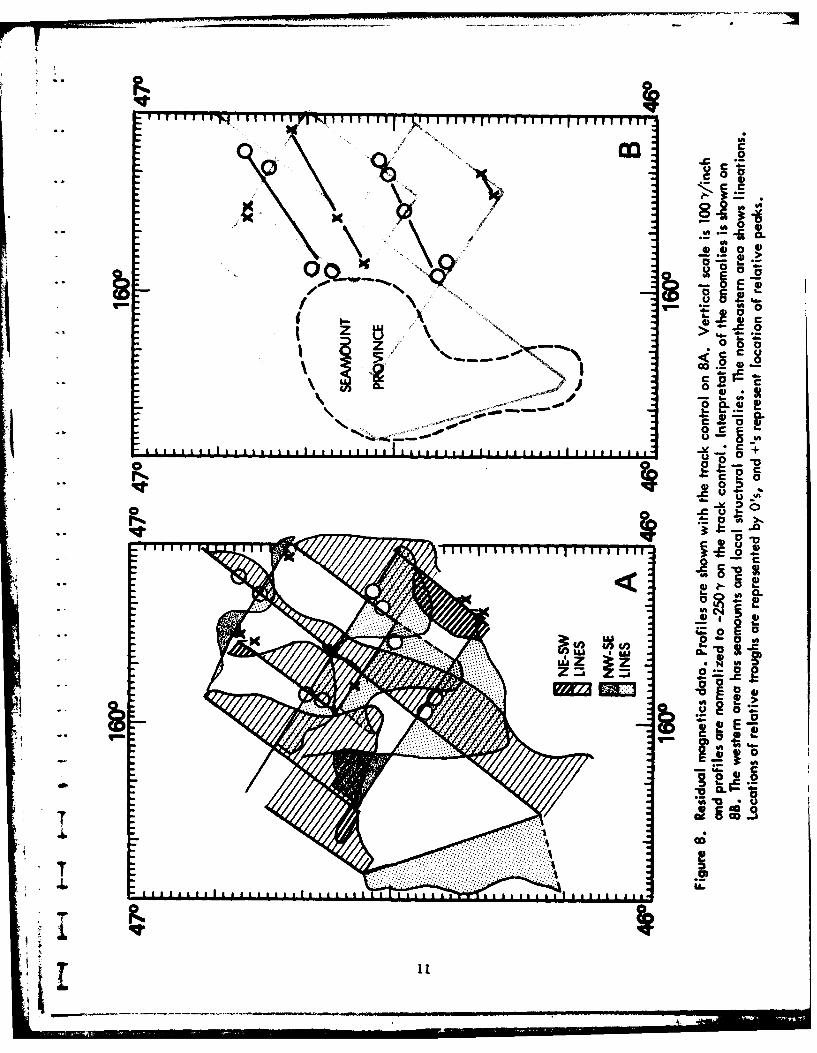
Figure 8. Residual magnetic profiles 11
ii __.__ _ _

I. INTRODUCTION
This note presents the results of a survey of Area 2, which was selected fromGreen and Fleischer (1980, Fig. 1)? The survey was conducted by NORDA and NAVOCEANOduring 2-3 August 1980 aboard the USNS SILAS BENT. Data collected consist of eight
Lexpendable bathythermograph (XBT) records, one conductivity/temperature/depth (CTD)record, 11 sonobuoy wide-angle reflection records, and approximately 250 km track
-- coverage for each of 3.5 kHz echograms, 12 kHz echograms, continuous seismic reflec-tion profiles and total field magnetics. The sonobuoy data and continuous seismic08 reflection profiles were collected using two 30 kilojoule sparker sources; themagnetics were collected using a proton precession magnetometer. Track lines werelaid out to detect assumed structural trends and to best explore the area within thetwo days allotted.
The data are compiled in oceanographic and geological sections. The ocean-- ographic section treats temperature and sound speed in the water column. The
geological section presents the local geology of Area 2 and includes geophysical* -. maps at a scale of P.S. 4.
II. TEMPERATURE AND SOUND SPEED IN THE WATER COLUMN
Temperature and sound speed models are based upon XBT and CTD recordscollected during the survey (Figs. 2 and 3). These models represent summerconditions at Area 2. Values for the upper 200 m of the water column should varyseasonally while values for water deeper than 200 m should be relatively constant.
XBT records (Fig. 2) show that a surface mixed layer, a vertical section with-- homogeneous temperature, is either very shallow or nonexistent. Water temperature
is 11-14 0C at the surface and drops below 10oC within the upper 20 m. The XBT-. records also show that the temperature decreases to a local minimum of about 10C
at a depth of 90-150 m, the axis of the sound channel.
The conductivity/temperature/depth (CTD) record shows that the temperature atthe axis is 0.820C at a depth of 117 m (Fig. 3). The record also shows that the
"" temperature increases gradually to 3.50C at a depth of 290 m and then graduallydecreases to 1.480C at 3217 m, the deepest point of the CTD cast. By extrapolat-ing the curve down to the seafloor, the temperature of bottom water should be
.- approximately 1.1 0 C.
The instantaneous sound velocity profile shows a shallow mixed layer with thesound velocity increasing slightly from 1491.68 m/sec at the surface to 1491.77 m/sec at a depth of 12 m (Fig. 3). It then decreases rapidly to a minimum of1452.38 m/sec at 115 m, the axis of the sound channel. Below that depth the soundvelocity increases to 1509.18 m/sec at 3217 m. Extrapolating downward to 5200 m, atypical water depth in the area, the instantaneous sound velocity of bottom watershould be approximately 1540 m/sec.
The average sound velocity in the water column decreases gradually to a1 minimum of 1461.95 m/sec at 174 m and increases from there to 1484.85 m/sec atiat
*b 3217 m. Extrapolating the curve downward, the average sound velocity in the watercolumn reaches approximately 1500 m/sec at an average depth of 5200 m.
III. GEOLOGY
This section presents a compilation and analysis of the geophysical data
j collected on the 1980 SILAS BENT Cruise. The compilation is occasionallyi 1
~~I*'II5Ii~I IIIIIIIuu If~ litei * u; usI I I I Il,,ul I
r--
UJ
C-4-
N / 4
QK H-
/ll
.....

K _f
I" _
ui 0
___~~~ -\Ic-a---
00

x AVISAGS SOUND VROOMYM/uc)1420 140 1470 It% law4 TO 2 00 1510 1 52 0 I m 12
Sol0 1460 1470 1480 )4tip 50 1 510 520o 1 50 I= 4 ISO 0
?I21AD SIM VP.31k=
3 .002.0 33P 33J U 3440 350 36.M 3610 37.40 300
1400
IW
2004
1200
'1 32000
Figure220 3. Th odciiytmertr/e CD roie h rfl a
344

supplemented by data from the environmental report for the Northwest Pacific (Greenand Fleischer, 1980) which the reader should consult for an in-depth analysis ofNorthwest Pacific geology.
A. PHYSIOGRAPHY
Area 2 is located in an abyssal hills province on the eastern flank of theHokkaido Rise (Fig. 1). Figure 4 illustrates the physiography of Area 2 by showingbathymetry with bottom roughness superimposed. The northeastern region of Figure 4shows a smooth bottom which slopes gently to the southeast at an average gradient ofabout 1/350. Traversing this region is a northeast/southwest-oriented trough whichhas relief of 50 m. The western area has seamounts and more variable bottomroughness. Roughness is greatest at seamounts. The maximum measured slope is 1:3and maximum relief is 1400 m for a seamount located at 46.60 N, 159.80 E.
B. SEDIMENTS
Sediment cores were not collected during the 1980 SILAS BENT Cruise;however, two sediment cores were collected by Lamont-Doherty Geological Observatoryat locations near Area 2: R/V VEMA 20-123 at 46015'N, 157 055'E and R/V VEHA20-122 at 46034'N, 1610411E (unpublished LDGO core descriptions). Sediments inthese cores represent the upper 13-15 m of the sediment column and contain
- . diatomaceous lutites occasionally interspersed with sandy volcanic ash layers. Rareoccurrences include plant material and ice-rafted pebbles. The sedimentation regimerepresented by these core descriptions has been relatively constant since theMiocene (Green and Fleischer, 1980). Because most unconsolidated sediments at Area2 are post-Oligocene, these sediments should not differ greatly from the LDGO
-,. sediment descriptions.
* Physical properties of sediments at Area 2 are best inferred by theanalysis of sediments from DSDP site 193, 400 km southwest of Area 2. Theseanalyses are described in Green and Fleischer (1980).
S.
For this technical note, sediment thickness and structure are evaluated onthe basis of continuous seismic reflection profiles. Figure 5 shows the thicknessof the acoustic transparent layer which is assumed to be unconsolidated sediment.Sediment thickness is greatest toward the northwest (0.5 sec) and thins toward thesoutheast (0.35 sec). The areas with thicker sediment are nearer the Kuril Islands,a source of volcanic detritus. Western areas of Figure 5 show rough bottom, highrelief and variable sediment thickness. For example, the seamount of 46.60N,159.8 0E has thin sediment on its slopes and a 0.1 sec cap.
Sediments generally drape over acoustic basement; however, local excep-tions appear to be caused by faulting, sediment ponding and slumping. Tensionalfaulting which trends northeast-southwest appears to displace acoustic basement andsediments throughout the area; however, the frequency and age of this faulting isambiguous on seismic reflection profiles. Also, evidence of sediment ponding existsin the southwestern region where the northwest/southeast-trending trough might act
as a sediment channel (Fig. 6A). Slumping of sediments occurs on seamount slopes.
C. SEDIMENT VELOCITIES
Eleven sonobuoys were launched in the area of study for the purpose ofcomputing interval velocities (Fig. 2). Most of the sonobuoy data is unusable
* ~ because the sea bottom and/or acoustic basement are too rough for reliable sonobuoyi Ldata. Sonobuoy station 8 is located within the smoothest part of Area 2, where
5

(a C0. . . . . . . .
n -
......... . . . . . . . ....
........... . . . . . . . . . . . .~ .. . .. .-. .......................
. . . . .. .. .... ....... ..IN , . .. ....
.4a

1 lul I
IM- U-
[00in,
0CL4)
ii4 0
IL
Li k, ,2
7 91. W p- i
CM X! ~r A~
LAA
- -.-- ~ -- 7-
V..:.
LI-,
.1.860 KM/SEC., 1.710 KM/SECCAI460 METER§ -145 MFTEIQS .- - -
C2,
_ _ . . ..... ~ *
.
. . ..
'-7 ~ .** .
£ JJ . ~ - - --~<
Figure 6. Selected continuous seismic reflection profiles (see Fig. 2 for locations).Profile A shows sediment ponding. Profile B shows smooth basement andbottom at the base of a seamount. Acoustic velocities are shown formeasured vertical sections based on sonobuoy record 8.

conditions were deemed suitable for reliable interval velocity determinations(Fig. 6B).
Interval velocities were computed according to the LePichon method(LePichon et al., 1968) adapted for use on NORDA's computer facilities. Assumptionswere: (1) flat-lying layers, (2) a mixed-layer velocity of 1490 m/sec and (3) anaverage water column velocity of 1500 m/sec.
Two solutions were computed for sonobuoy station number 8 (Fig. 6B). Avelocity of 1.860 km/sec (+0.055 km/sec) for a 460 m layer was found for theinterval from the seabed to the deepest horizontal reflector, possibly the top ofwhat is referred to as 2A (Houtz and Ewing, 1976). A velocity of 1.770 km/sec(+0.125 km/sec) for a 350 m layer was found for an interval from the seabed to areflector somewhat shallower than layer 2A.
Each of the solutions is comparable to other solutions made in theNorthwest Pacific (Houtz et al., 1970). These solutions are also comparable toassumed sediment velocities for the Pacific Basin of 1.74 km/sec (Houtz and Ludwig,1979).
D. ACOUSTIC BASEMENT
" Figure 7 shows depth to acoustic basement with basement roughness super-imposed. Although acoustic basement is generally rougher than bottom roughness, thesmoothest and roughest areas for both generally coincide. Smoothest acousticbasement is around the base of the seamount located at 46.60N, 159.8 0E (Fig.6B). This basement probably consists of secondary volcanic material derived fromthe adjacent seamount. Isostatic subsidence of the basement is apparent at the baseof the seamount (Fig. 6B). Intermediate roughness areas are most widespread and aregenerally associated with tensional faulting which trends northeast-southwest.Acoustic basement for these areas might be composed of true oceanic basement whichoriginally formed at a spreading ridge, secondary volcanics, or consolidatedsediments such as chert lying on top of true basement. If chert is present, itshould not exceed 40 m thickness because the underlying crust probably formedoutside the high silica-producing zone (Green and Fleischer, 1980). The roughestacoustic basement is generally associated with slopes of seamounts and is probablyoceanic basalt.
E. RESIDUAL MAGNETIC ANOMALIES
Figure 8A shows profiles of residual magnetic anomalies plotted on thetrack control, and Figure 8B presents an interpretation of the anomalies. Visualinspection of the profiles indicates that lineations of magnetic anomalies trendN60 0E for northeastern areas of the survey, that no apparent lineations exist inwestern areas, and that a 100+ anomaly is associated with the seamount at 46.60N,159.8 0E.
The lineations in the northeast have the same trend as the Mesozoic
Japanese lineations mapped to the south (Hilde, 1976). Area 2 lineations mightrepresent Cretaceous quiet zone (CQZ) seafloor spreading anomalies because Area 2anomalies are oriented correctly and have small amplitudes; however, standard
T anomaly configurations for CQZ anomalies are unknown so the existing anomaliescannot be identified or dated. The lineations could also represent structuralfeatures such as parallel faults (D. Handschumacher, pers. comm.), but the anomaliesdo not appear to coincide with observable structure.
Iimi .........

1 ~ I life
E-M -
...... ....
.............. 0.. . C0 Oo o to -
...~~~ ...... 0......- -.. .-.. .......... ~~~~~~ .... .....o
. . . . . . . .
C
0
*V 0x Yb
00
40 0
0 =0.C . %
YbOC,
04
Yb
IA-
9 'I;1"a
T a Boo

Anomalies in the western area are probably caused by local structuralfeatures. The basement and bottom are generally rough, and no lineations ofanomalies are apparent for this area. Seamounts are associated with the largestanomalies.
IV. CONCLUSIONS
Data from the two-day SILAS BENT Cruise greatly added to our knowledge of thelocal geology of Area 2. The area, approximately 40 km by 60 km, has relativelysmooth bottom and basement for broad expanses and apparently homogeneous geology.No evidence was found for significant bottom currents, recently active faulting, orhigh energy sedimentation regimes. The northeastern section of the survey measuring25 km by 25 km appears to have the smoothest bottom and most homogeneous geology.The presence of magnetic lineations in this area implies that seamounts are absentbecause seamounts normally have distinctive anomaly patterns.
The data in this note generally agrees with that of Green and Fleischer(1980). Area 2 was selected as a survey area because two continuous seismicreflection profiles indicated that the bottom and acoustic basement were smooth andthat seamounts were absent. The data coverage for Area 2, as with most NorthwestPacific locations, was rarely better than 50 km spacing. The 1980 survey consistsof 10 km spacing which should be sufficient for detecting major seamounts. Probablyno major physiographic features have been overlooked by the survey. The majordisagreement between the 1980 survey and the Green and Fleischer compilations is thepresence of a 1400 m seamount in the western section of the survey area. Thesmoothest bottom and acoustic basement generally coincide with the base of thisseamount, an occurrence which might prove useful in detecting seamounts in otherNorthwest Pacific locations.
Data concerning magnetic anomalies and sediment velocities fill data voids ofthe Green and Fleischer report. The magnetic lineations mapped in the northwesternsection of Area 2 might be the first documented lineations for the Cretaceous quietzone of the Northwest Pacific.
On the other hand, the survey data are insufficient for various analyses. Nosediments were collected and we must rely upon previously collected sedimentdescriptions and physical properties data. The magnetics and seismic reflectiondata were not collected with close enough spacing to map small scale faulting,physiographic trends and magnetic lineations. Knowledge of the acoustic velocitystructure of sediments and crust are poor. For more detailed velocity informationon the sediments and underlying layers, it will be necessary to use energy sourceswith greater penetration capacity than can be achieved with 30 KJ sparkers. Also,more precise velocity information could be achieved using ocean bottom seismometersor a deep-towed geophysical array.
V. REFERENCES
Green, J. A. and P. Fleischer (1980). Environmental Report of the NorthwestPacific Ocean for the Marine Seismic System (MSS). NORDA Report 31.
Hilde, T. W. C., N. Isezaki and J. M. Wageman (1976). Mesozoic SeafloorSpreading in the North Pacific. IN: Geophysical Monograph 19, AGU, p. 205-226.
Houtz, R. and J. Ewing (1976). Upper Crustal Structure as a Function of PlateAge. J. Geophys. Res., 81, p. 2490-2498.
12 I.1l

Houtz, R., J. Ewing and P. Buhl (1970). Seismic Data from Sonobuoy StationsT in the Northern and Equatorial Pacific. J. Geophys. Res., 75, p. 5093-5111.
A
Houtz, R. and W. Ludwig (1979). Distribution of Reverberant Subbottom Layersin the Southwest Pacific Basin. J. Geophys. Res., 84, no. B7, p. 3497-3504.
LePichon, X. J. Ewing and R. Houtz, (1968). Deep-Sea Sediment VelocityDetermination Made While Reflection Profiling. J. Geophys, Res., 73, p 2597-2614.
i1
I .
1.
i
I
.11
UNCLASSIFIEDSECURITY CLASSIFICATION OF THIS PAGE (Wtem Dae Rnteri_
REPORT DOCUMENTATION PAGE 33703 COMPLETNMG FORM.I, IQROT '. IMER |CCCONO. fCIPIENT S CATALOG NUM5ER
NORDA Technical Note 81 V 9t)I -. TITLE aSbt,,le) .. TYPE OF REPORT a PERIOD COVERED
Data Report for Oceanographic/Geophysica Finalr4 Surveys in the Northwest Pacific (46-47,,j 159-16lPf): USNS Silas Bent, 2-3 August 198
- . CON RAar0MNT NUM1161()
10 J: A./Green IU Y
SD./Trowell A______________
" rRMING ORGANIZATION NAE"...... PR-1 AM ELEMENT. PROJECT. TASKARA WORKUmUI~rIERS
Naval Ocean Research & Development ActivityOcean Science & Technology Laboratory, Code 360 "NSTL Station, Mississippi 39529 K.
15 o
lie. DE~~~CLASSIFIEDINOWNR~N
SCMEDLE
1 1. DISTRI OUTION STATEMENT (of t.is Report)
A .
: ' , Unlimited
17. DISTRIEUTION STATEMENT (of the eract ent iroin CNo rk 0 11..) I . SECURIeTY C A S . t e
I. SUPPLEMENTARY NOTES
IS. *KEY WORDS (Continue an reverse aide It necesem and Identifp, by WeSk Umet)
Geophysical/Oceanographic SurveyHokkaido RiseUnconsolidated sediment
Acoustic basementMagnetic lineations-
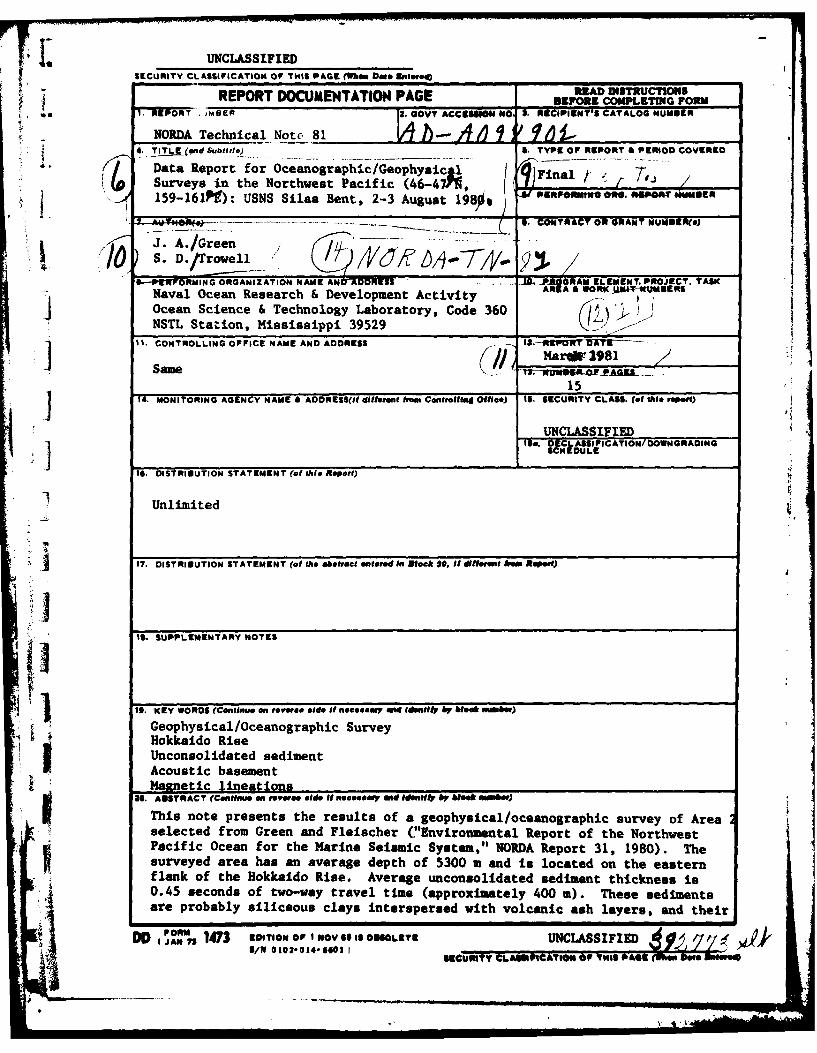
20. ABSTRACT (Cenime an reveree sde If necessryd mudIffyi by NOe** sonb*)This note presents the results of a geophysical/oceanographic survey of Area 2selected from Green and Fleischer ("Environmental Report of the NorthwestPacific Ocean for the Marine Seismic System," NORDA Report 31, 1980). Thesurveyed area has an average depth of 5300 m and is located on the easternflank of the Hokkaido Rise. Average unconsolidated sediment thickness is0.45 seconds of two-way travel time (approximately 400 m). These sedimentsare probably siliceous clays interspersed with volcanic ash layers, and their
DD 0 1473 EDTION O, I Nov60 IS OBILTE UNCLASSIFIED ,9_. y ,AS/ 010 -014-o6601 I ECuYCIM i ,CA'P e OF Tins P AS (MIen DeTe.OP
-L-'.U4ITy CLASSIFICATION OF THIS PAGE(Whe, De* Eudeteod
calculated acoustic interval velocity is 1.770-1.860 km/sec. IThe smoothest bottom and most homogeneous geology appear in the northeasternsection of the survey area. This section, an area about 25 km x 25 kin, hassmooth acoustic basement which is present at the northern base of a seamountlocated at 46.60N, 159.80E. Residual magnetic lineations are also presentin this area and may represent Cretaceous quiet zone seafloor spreadinganomalies.
In the western part of the survey area the bottom and acoustic basement arerougher than in the eastern part. The local geology is less homogeneousbecause seamounts are present. Residual magnetic anomalies are generallyassociated with seamounts and no correlatable lineations are apparent.
-;M""IFIISZIAIT CASIFCAIO O T41 P~aWh Dft80100

DAT
JLME