valencia single family homes a two year report 2012 to present
TRANSCRIPT

04/07/2014Clarus MarketMetrics®Information not guaranteed. © 2014 - 2015 Terradatum and its suppliers and licensors (www.terradatum.com/about/licensors.td).
Connor and Paris MacIVORRE/MAX's Paris911 Team
Market Dynamics
1 of 21

Mar-14475,000
Mar-12409,199
%+16%
Change65,801
Mar-12 vs. Mar-14: The median sold price is up 16%Median Sold Price by Month
RE/MAX's Paris911 Team
Mar-12 vs. Mar-14
Connor and Paris MacIVOR
Clarus MarketMetrics® 1 of 2 04/07/2014Information not guaranteed. © 2014 - 2015 Terradatum and its suppliers and licensors (www.terradatum.com/about/licensors.td).
AllBathrooms:MLS: AllAllSq Ft:
91354, 91355Residential: (Single Family Residence)Period: All All
Property Types:ZIP Codes:
AllConstruction Type:Price: Lot Size:Bedrooms:2 years (monthly)CRMLS
2 of 21
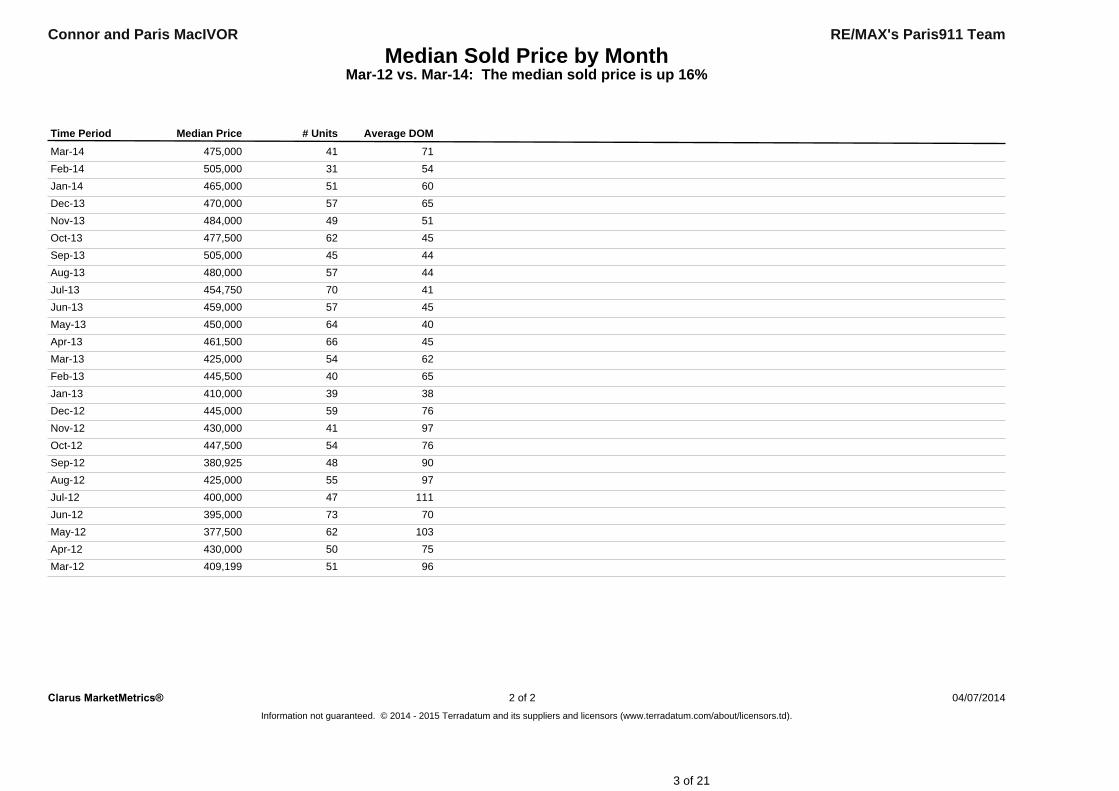
Median Sold Price by MonthMar-12 vs. Mar-14: The median sold price is up 16%
RE/MAX's Paris911 TeamConnor and Paris MacIVOR
Time Period Median Price # Units Average DOMMar-14 475,000 41 71Feb-14 505,000 31 54Jan-14 465,000 51 60Dec-13 470,000 57 65Nov-13 484,000 49 51Oct-13 477,500 62 45Sep-13 505,000 45 44Aug-13 480,000 57 44Jul-13 454,750 70 41Jun-13 459,000 57 45May-13 450,000 64 40Apr-13 461,500 66 45Mar-13 425,000 54 62Feb-13 445,500 40 65Jan-13 410,000 39 38Dec-12 445,000 59 76Nov-12 430,000 41 97Oct-12 447,500 54 76Sep-12 380,925 48 90Aug-12 425,000 55 97Jul-12 400,000 47 111Jun-12 395,000 73 70May-12 377,500 62 103Apr-12 430,000 50 75Mar-12 409,199 51 96
Clarus MarketMetrics® 2 of 2 04/07/2014Information not guaranteed. © 2014 - 2015 Terradatum and its suppliers and licensors (www.terradatum.com/about/licensors.td).
3 of 21

Mar-12 vs. Mar-14: The median price of for sale properties is up 36% and the median price of sold properties is up 16%
RE/MAX's Paris911 Team
Mar-12 vs. Mar-14
410,000 +36%
Connor and Paris MacIVOR
559,500Mar-14
Median For Sale vs. Median Sold
ChangeMar-12 %149,500
Mar-12 Mar-14 %409,199 +16%
Mar-12 vs. Mar-14
475,000Change65,801
Clarus MarketMetrics® 1 of 2 04/07/2014Information not guaranteed. © 2014 - 2015 Terradatum and its suppliers and licensors (www.terradatum.com/about/licensors.td).
AllBathrooms:MLS: AllAllSq Ft:
91354, 91355Residential: (Single Family Residence)Period: All All
Property Types:ZIP Codes:
AllConstruction Type:Price: Lot Size:Bedrooms:2 years (monthly)CRMLS
4 of 21

Median For Sale vs. Median SoldMar-12 vs. Mar-14: The median price of for sale properties is up 36% and the median price of sold properties is up 16%
RE/MAX's Paris911 TeamConnor and Paris MacIVOR
Time Period For SaleMedian SoldMedianFor Sale # Properties # PropertiesSold Price
Difference
Mar-14 165 41559,500 475,000 -84,500Feb-14 158 31549,948 505,000 -44,947Jan-14 160 51548,500 465,000 -83,500Dec-13 155 57529,000 470,000 -59,000Nov-13 185 49529,000 484,000 -45,000Oct-13 194 62512,500 477,500 -35,000Sep-13 212 45512,500 505,000 -7,500Aug-13 194 57519,450 480,000 -39,450Jul-13 181 70499,999 454,750 -45,249Jun-13 167 57479,900 459,000 -20,900May-13 145 64464,900 450,000 -14,900Apr-13 141 66469,900 461,500 -8,400Mar-13 137 54459,999 425,000 -34,999Feb-13 138 40459,450 445,500 -13,950Jan-13 115 39441,000 410,000 -31,000Dec-12 111 59420,000 445,000 25,000Nov-12 123 41429,000 430,000 1,000Oct-12 138 54425,000 447,500 22,500Sep-12 137 48465,000 380,925 -84,075Aug-12 167 55449,000 425,000 -24,000Jul-12 178 47436,250 400,000 -36,250Jun-12 196 73439,750 395,000 -44,750May-12 230 62437,250 377,500 -59,750Apr-12 244 50419,000 430,000 11,000Mar-12 248 51410,000 409,199 -801
Clarus MarketMetrics®Information not guaranteed. © 2014 - 2015 Terradatum and its suppliers and licensors (www.terradatum.com/about/licensors.td).
2 of 2 04/07/2014
5 of 21

Mar-1441
Mar-1251
%-20%
Change-10
Mar-12 vs. Mar-14: The number of Sold properties is down 20%Sold Properties by Month
RE/MAX's Paris911 Team
Mar-12 vs. Mar-14
Connor and Paris MacIVOR
Clarus MarketMetrics® 1 of 2 04/07/2014Information not guaranteed. © 2014 - 2015 Terradatum and its suppliers and licensors (www.terradatum.com/about/licensors.td).
AllBathrooms:MLS: AllAllSq Ft:
91354, 91355Residential: (Single Family Residence)Period: All All
Property Types:ZIP Codes:
AllConstruction Type:Price: Lot Size:Bedrooms:2 years (monthly)CRMLS
6 of 21
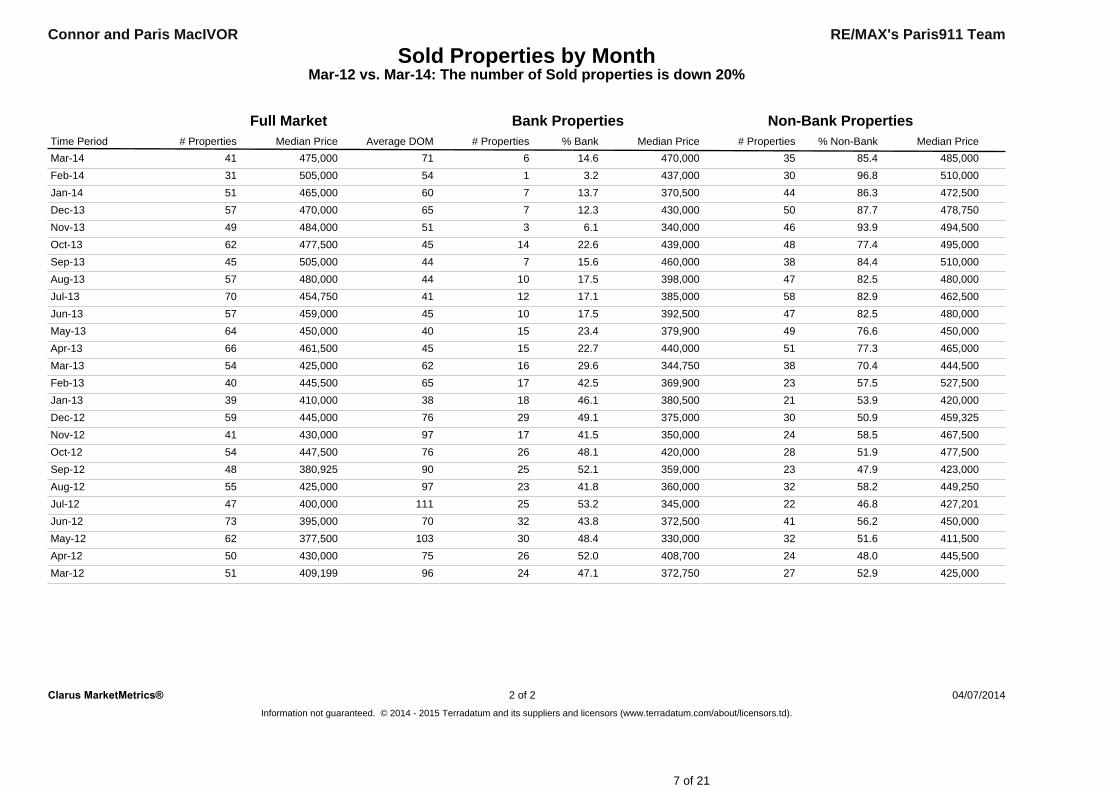
Sold Properties by MonthMar-12 vs. Mar-14: The number of Sold properties is down 20%
RE/MAX's Paris911 TeamConnor and Paris MacIVOR
Time Period
Full Market# Properties Median Price Average DOM
Bank Properties# Properties % Bank Median Price
Non-Bank Properties# Properties % Non-Bank Median Price
Mar-14 475,00041 71 6 14.6 470,000 35 85.4 485,000Feb-14 505,00031 54 1 3.2 437,000 30 96.8 510,000Jan-14 465,00051 60 7 13.7 370,500 44 86.3 472,500Dec-13 470,00057 65 7 12.3 430,000 50 87.7 478,750Nov-13 484,00049 51 3 6.1 340,000 46 93.9 494,500Oct-13 477,50062 45 14 22.6 439,000 48 77.4 495,000Sep-13 505,00045 44 7 15.6 460,000 38 84.4 510,000Aug-13 480,00057 44 10 17.5 398,000 47 82.5 480,000Jul-13 454,75070 41 12 17.1 385,000 58 82.9 462,500Jun-13 459,00057 45 10 17.5 392,500 47 82.5 480,000May-13 450,00064 40 15 23.4 379,900 49 76.6 450,000Apr-13 461,50066 45 15 22.7 440,000 51 77.3 465,000Mar-13 425,00054 62 16 29.6 344,750 38 70.4 444,500Feb-13 445,50040 65 17 42.5 369,900 23 57.5 527,500Jan-13 410,00039 38 18 46.1 380,500 21 53.9 420,000Dec-12 445,00059 76 29 49.1 375,000 30 50.9 459,325Nov-12 430,00041 97 17 41.5 350,000 24 58.5 467,500Oct-12 447,50054 76 26 48.1 420,000 28 51.9 477,500Sep-12 380,92548 90 25 52.1 359,000 23 47.9 423,000Aug-12 425,00055 97 23 41.8 360,000 32 58.2 449,250Jul-12 400,00047 111 25 53.2 345,000 22 46.8 427,201Jun-12 395,00073 70 32 43.8 372,500 41 56.2 450,000May-12 377,50062 103 30 48.4 330,000 32 51.6 411,500Apr-12 430,00050 75 26 52.0 408,700 24 48.0 445,500Mar-12 409,19951 96 24 47.1 372,750 27 52.9 425,000
Clarus MarketMetrics® 2 of 2 04/07/2014Information not guaranteed. © 2014 - 2015 Terradatum and its suppliers and licensors (www.terradatum.com/about/licensors.td).
7 of 21

Mar-1459
Mar-1263
%-6%
Change-4
Mar-12 vs. Mar-14: The number of Under Contract properties is down 6%Under Contract Properties by Month
RE/MAX's Paris911 Team
Mar-12 vs. Mar-14
Connor and Paris MacIVOR
Clarus MarketMetrics® 1 of 2 04/07/2014Information not guaranteed. © 2014 - 2015 Terradatum and its suppliers and licensors (www.terradatum.com/about/licensors.td).
AllBathrooms:MLS: AllAllSq Ft:
91354, 91355Residential: (Single Family Residence)Period: All All
Property Types:ZIP Codes:
AllConstruction Type:Price: Lot Size:Bedrooms:2 years (monthly)CRMLS
8 of 21

Under Contract Properties by MonthMar-12 vs. Mar-14: The number of Under Contract properties is down 6%
RE/MAX's Paris911 TeamConnor and Paris MacIVOR
Time Period
Full Market# Properties Median Price Average DOM
Bank Properties# Properties % Bank Median Price
Non-Bank Properties# Properties % Non-Bank Median Price
Mar-14 519,90059 40 519,90086.451530,00013.68Feb-14 509,95055 50 522,50083.646470,00016.49Jan-14 499,95049 64 499,95087.843524,95012.26Dec-13 462,50038 55 481,95089.534394,45010.54Nov-13 484,90045 65 483,70093.342540,0006.73Oct-13 477,35058 55 490,00089.752377,00010.36Sep-13 489,00056 58 499,99980.445449,00019.611Aug-13 524,90049 45 524,90085.742475,00014.37Jul-13 474,95054 50 475,00087.047409,90013.07Jun-13 465,60057 38 474,50086.049425,00014.08May-13 449,90057 31 449,99989.551424,90010.56Apr-13 469,00061 28 475,00083.651447,00016.410Mar-13 439,47564 37 449,45075.048362,50025.016Feb-13 449,00057 62 459,90075.443349,95024.614Jan-13 425,00037 63 526,95064.924370,00035.113Dec-12 419,90037 54 454,45064.924350,00035.113Nov-12 430,00042 64 435,00061.926387,50038.116Oct-12 429,45048 73 475,00052.125384,90047.923Sep-12 475,00044 60 489,00052.323435,00047.721Aug-12 404,99963 85 432,00050.832380,00049.231Jul-12 404,95057 97 435,00054.431362,50045.626Jun-12 419,00047 88 456,99551.124385,00048.923May-12 409,95074 87 449,00060.845350,00039.229Apr-12 389,40062 77 448,00043.527379,00056.535Mar-12 399,00063 111 459,95044.428350,00055.635
Clarus MarketMetrics® 2 of 2 04/07/2014Information not guaranteed. © 2014 - 2015 Terradatum and its suppliers and licensors (www.terradatum.com/about/licensors.td).
9 of 21

Mar-1482
Mar-1262
%+32%
Change20
Mar-12 vs. Mar-14: The number of New properties is up 32%New Properties by Month
RE/MAX's Paris911 Team
Mar-12 vs. Mar-14
Connor and Paris MacIVOR
Clarus MarketMetrics® 1 of 2 04/07/2014Information not guaranteed. © 2014 - 2015 Terradatum and its suppliers and licensors (www.terradatum.com/about/licensors.td).
AllBathrooms:MLS: AllAllSq Ft:
91354, 91355Residential: (Single Family Residence)Period: All All
Property Types:ZIP Codes:
AllConstruction Type:Price: Lot Size:Bedrooms:2 years (monthly)CRMLS
10 of 21
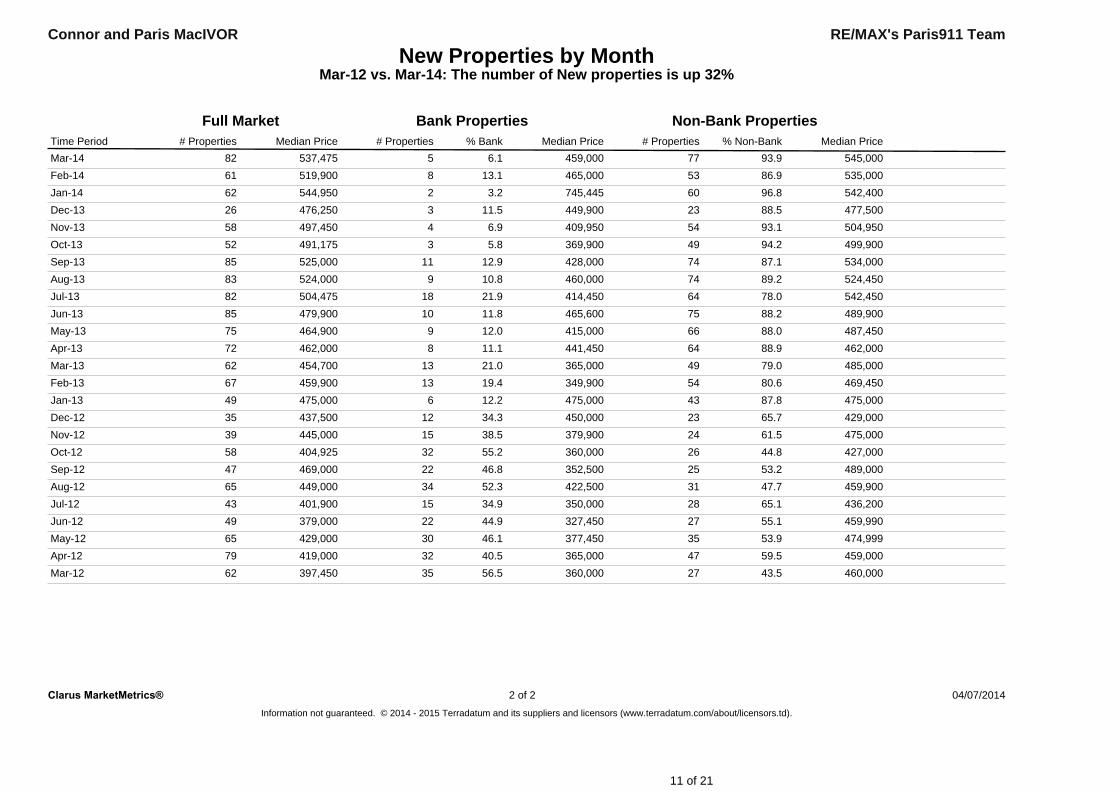
New Properties by MonthMar-12 vs. Mar-14: The number of New properties is up 32%
RE/MAX's Paris911 TeamConnor and Paris MacIVOR
Time Period # Properties
Full MarketMedian Price
Bank Properties# Properties % Bank Median Price
Non-Bank Properties# Properties % Non-Bank Median Price
Mar-14 537,47582 5 6.1 459,000 77 93.9 545,000Feb-14 519,90061 8 13.1 465,000 53 86.9 535,000Jan-14 544,95062 2 3.2 745,445 60 96.8 542,400Dec-13 476,25026 3 11.5 449,900 23 88.5 477,500Nov-13 497,45058 4 6.9 409,950 54 93.1 504,950Oct-13 491,17552 3 5.8 369,900 49 94.2 499,900Sep-13 525,00085 11 12.9 428,000 74 87.1 534,000Aug-13 524,00083 9 10.8 460,000 74 89.2 524,450Jul-13 504,47582 18 21.9 414,450 64 78.0 542,450Jun-13 479,90085 10 11.8 465,600 75 88.2 489,900May-13 464,90075 9 12.0 415,000 66 88.0 487,450Apr-13 462,00072 8 11.1 441,450 64 88.9 462,000Mar-13 454,70062 13 21.0 365,000 49 79.0 485,000Feb-13 459,90067 13 19.4 349,900 54 80.6 469,450Jan-13 475,00049 6 12.2 475,000 43 87.8 475,000Dec-12 437,50035 12 34.3 450,000 23 65.7 429,000Nov-12 445,00039 15 38.5 379,900 24 61.5 475,000Oct-12 404,92558 32 55.2 360,000 26 44.8 427,000Sep-12 469,00047 22 46.8 352,500 25 53.2 489,000Aug-12 449,00065 34 52.3 422,500 31 47.7 459,900Jul-12 401,90043 15 34.9 350,000 28 65.1 436,200Jun-12 379,00049 22 44.9 327,450 27 55.1 459,990May-12 429,00065 30 46.1 377,450 35 53.9 474,999Apr-12 419,00079 32 40.5 365,000 47 59.5 459,000Mar-12 397,45062 35 56.5 360,000 27 43.5 460,000
Clarus MarketMetrics® 2 of 2 04/07/2014Information not guaranteed. © 2014 - 2015 Terradatum and its suppliers and licensors (www.terradatum.com/about/licensors.td).
11 of 21

Mar-14165
Mar-12248
%-33%
Change-83
Mar-12 vs. Mar-14: The number of For Sale properties is down 33%For Sale Properties by Month
RE/MAX's Paris911 Team
Mar-12 vs. Mar-14
Connor and Paris MacIVOR
Clarus MarketMetrics® 1 of 2 04/07/2014Information not guaranteed. © 2014 - 2015 Terradatum and its suppliers and licensors (www.terradatum.com/about/licensors.td).
AllBathrooms:MLS: AllAllSq Ft:
91354, 91355Residential: (Single Family Residence)Period: All All
Property Types:ZIP Codes:
AllConstruction Type:Price: Lot Size:Bedrooms:2 years (monthly)CRMLS
12 of 21

For Sale Properties by MonthMar-12 vs. Mar-14: The number of For Sale properties is down 33%
RE/MAX's Paris911 TeamConnor and Paris MacIVOR
# PropertiesTime Period
Full Market# Properties Median Price Average DOM
Bank Properties Non-Bank Properties% Bank Median Price # Properties % Non-Bank Median Price
Mar-14 559,500165 49 12 7.3 475,115 153 92.7 569,000Feb-14 549,948158 67 22 13.9 463,500 136 86.1 562,475Jan-14 548,500160 75 20 12.5 458,450 140 87.5 554,700Dec-13 529,000155 83 24 15.5 426,450 131 84.5 539,000Nov-13 529,000185 70 27 14.6 424,900 158 85.4 539,000Oct-13 512,500194 63 30 15.5 425,500 164 84.5 529,000Sep-13 512,500212 56 40 18.9 439,450 172 81.1 539,900Aug-13 519,450194 55 39 20.1 450,000 155 79.9 530,000Jul-13 499,999181 54 40 22.1 419,900 141 77.9 525,000Jun-13 479,900167 53 33 19.8 409,900 134 80.2 499,950May-13 464,900145 53 30 20.7 404,900 115 79.3 495,000Apr-13 469,900141 53 32 22.7 412,450 109 77.3 485,000Mar-13 459,999137 58 42 30.7 379,450 95 69.3 489,900Feb-13 459,450138 61 44 31.9 379,450 94 68.1 469,450Jan-13 441,000115 76 49 42.6 379,000 66 57.4 487,500Dec-12 420,000111 86 59 53.1 370,000 52 46.9 477,000Nov-12 429,000123 79 63 51.2 369,900 60 48.8 486,450Oct-12 425,000138 78 74 53.6 369,950 64 46.4 476,500Sep-12 465,000137 87 72 52.5 384,950 65 47.5 499,000Aug-12 449,000167 102 85 50.9 389,000 82 49.1 479,900Jul-12 436,250178 111 85 47.8 384,900 93 52.2 479,900Jun-12 439,750196 110 102 52.0 380,000 94 48.0 487,450May-12 437,250230 98 117 50.9 385,000 113 49.1 478,000Apr-12 419,000244 93 132 54.1 379,900 112 45.9 472,000Mar-12 410,000248 101 144 58.1 379,300 104 41.9 483,475
Clarus MarketMetrics® 2 of 2 04/07/2014Information not guaranteed. © 2014 - 2015 Terradatum and its suppliers and licensors (www.terradatum.com/about/licensors.td).
13 of 21

Mar-1417
Mar-1220
%-15%
Change-3
Mar-12 vs. Mar-14: The number of Expired properties is down 15%Expired Properties by Month
RE/MAX's Paris911 Team
Mar-12 vs. Mar-14
Connor and Paris MacIVOR
Clarus MarketMetrics® 1 of 2 04/07/2014Information not guaranteed. © 2014 - 2015 Terradatum and its suppliers and licensors (www.terradatum.com/about/licensors.td).
AllBathrooms:MLS: AllAllSq Ft:
91354, 91355Residential: (Single Family Residence)Period: All All
Property Types:ZIP Codes:
AllConstruction Type:Price: Lot Size:Bedrooms:2 years (monthly)CRMLS
14 of 21

Expired Properties by MonthMar-12 vs. Mar-14: The number of Expired properties is down 15%
RE/MAX's Paris911 TeamConnor and Paris MacIVOR
Time Period Median Price# Properties Average DOM
Full Market# Properties % Bank Median Price Median Price# Properties
Bank Properties% Non-Bank
Non-Bank Properties
Mar-14 650,00017 84 0 17 100.0 650,000Feb-14 484,45020 64 6 30.0 392,500 14 70.0 532,000Jan-14 614,00014 64 0 14 100.0 614,000Dec-13 619,00019 67 2 10.5 417,500 17 89.5 619,000Nov-13 515,00011 91 3 27.3 350,000 8 72.7 557,450Oct-13 489,9009 34 1 11.1 615,000 8 88.9 486,450Sep-13 527,45014 60 2 14.3 404,900 12 85.7 557,450Aug-13 525,00018 42 3 16.7 533,500 15 83.3 520,000Jul-13 607,00016 54 3 18.8 350,000 13 81.2 619,990Jun-13 470,88811 23 3 27.3 325,000 8 72.7 554,500May-13 477,0006 65 1 16.7 435,000 5 83.3 495,000Apr-13 687,50010 88 1 10.0 295,000 9 90.0 750,000Mar-13 409,9004 164 2 50.0 500,000 2 50.0 409,900Feb-13 482,0006 84 1 16.7 239,900 5 83.3 499,000Jan-13 440,0007 101 5 71.4 340,500 2 28.6 619,950Dec-12 454,5008 165 3 37.5 379,500 5 62.5 459,000Nov-12 700,0005 141 0 5 100.0 700,000Oct-12 469,6006 125 3 50.0 389,000 3 50.0 469,999Sep-12 419,00013 129 9 69.2 415,000 4 30.8 524,000Aug-12 467,95014 141 4 28.6 412,500 10 71.4 599,450Jul-12 499,00019 84 8 42.1 450,000 11 57.9 579,990Jun-12 349,50014 143 9 64.3 339,000 5 35.7 495,000May-12 379,9009 51 8 88.9 364,900 1 11.1 570,000Apr-12 400,00017 78 10 58.8 317,500 7 41.2 600,000Mar-12 487,00020 109 9 45.0 395,000 11 55.0 539,000
Clarus MarketMetrics® 2 of 2 04/07/2014Information not guaranteed. © 2014 - 2015 Terradatum and its suppliers and licensors (www.terradatum.com/about/licensors.td).
15 of 21

Mar-12 vs. Mar-14: The number of for sale properties is down 33% and the number of sold properties is down 20%
RE/MAX's Paris911 Team
Mar-12 vs. Mar-14
248 -33%
Connor and Paris MacIVOR
165Mar-14
Supply & Demand by Month
ChangeMar-12 %-83
Mar-12 Mar-14 %51 -20%
Mar-12 vs. Mar-14
41Change
-10
Clarus MarketMetrics® 1 of 2 04/07/2014Information not guaranteed. © 2014 - 2015 Terradatum and its suppliers and licensors (www.terradatum.com/about/licensors.td).
AllBathrooms:MLS: AllAllSq Ft:
91354, 91355Residential: (Single Family Residence)Period: All All
Property Types:ZIP Codes:
AllConstruction Type:Price: Lot Size:Bedrooms:2 years (monthly)CRMLS
16 of 21
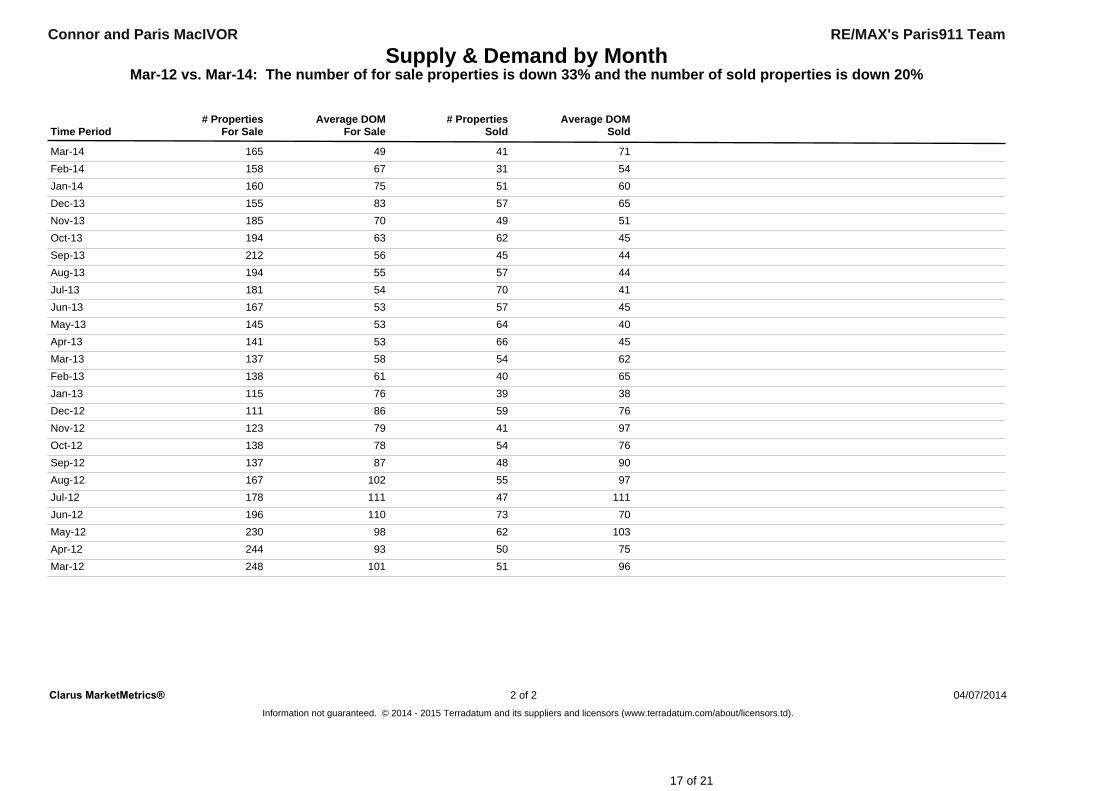
Supply & Demand by MonthMar-12 vs. Mar-14: The number of for sale properties is down 33% and the number of sold properties is down 20%
Connor and Paris MacIVOR RE/MAX's Paris911 Team
Time Period For SaleFor Sale SoldSold# Properties Average DOM Average DOM# Properties
Mar-14 49 71165 41Feb-14 67 54158 31Jan-14 75 60160 51Dec-13 83 65155 57Nov-13 70 51185 49Oct-13 63 45194 62Sep-13 56 44212 45Aug-13 55 44194 57Jul-13 54 41181 70Jun-13 53 45167 57May-13 53 40145 64Apr-13 53 45141 66Mar-13 58 62137 54Feb-13 61 65138 40Jan-13 76 38115 39Dec-12 86 76111 59Nov-12 79 97123 41Oct-12 78 76138 54Sep-12 87 90137 48Aug-12 102 97167 55Jul-12 111 111178 47Jun-12 110 70196 73May-12 98 103230 62Apr-12 93 75244 50Mar-12 101 96248 51
Clarus MarketMetrics® 2 of 2 04/07/2014Information not guaranteed. © 2014 - 2015 Terradatum and its suppliers and licensors (www.terradatum.com/about/licensors.td).
17 of 21

Mar-1440
Mar-12111
%-64%
Change-71
Mar-12 vs. Mar-14: The average days on market is down 64%The Average Days on Market by Month
RE/MAX's Paris911 Team
Mar-12 vs. Mar-14
Connor and Paris MacIVOR
Clarus MarketMetrics® 1 of 2 04/07/2014Information not guaranteed. © 2014 - 2015 Terradatum and its suppliers and licensors (www.terradatum.com/about/licensors.td).
AllBathrooms:MLS: AllAllSq Ft:
91354, 91355Residential: (Single Family Residence)Period: All All
Property Types:ZIP Codes:
AllConstruction Type:Price: Lot Size:Bedrooms:2 years (monthly)CRMLS
18 of 21

The Average Days on Market by MonthMar-12 vs. Mar-14: The average days on market is down 64%
RE/MAX's Paris911 TeamConnor and Paris MacIVOR
Time Period # UC UnitsAverage DOMMar-14 5940Feb-14 5550Jan-14 4964Dec-13 3855Nov-13 4565Oct-13 5855Sep-13 5658Aug-13 4945Jul-13 5450Jun-13 5738May-13 5731Apr-13 6128Mar-13 6437Feb-13 5762Jan-13 3763Dec-12 3754Nov-12 4264Oct-12 4873Sep-12 4460Aug-12 6385Jul-12 5797Jun-12 4788May-12 7487Apr-12 6277Mar-12 63111
Clarus MarketMetrics® 2 of 2 04/07/2014Information not guaranteed. © 2014 - 2015 Terradatum and its suppliers and licensors (www.terradatum.com/about/licensors.td).
19 of 21
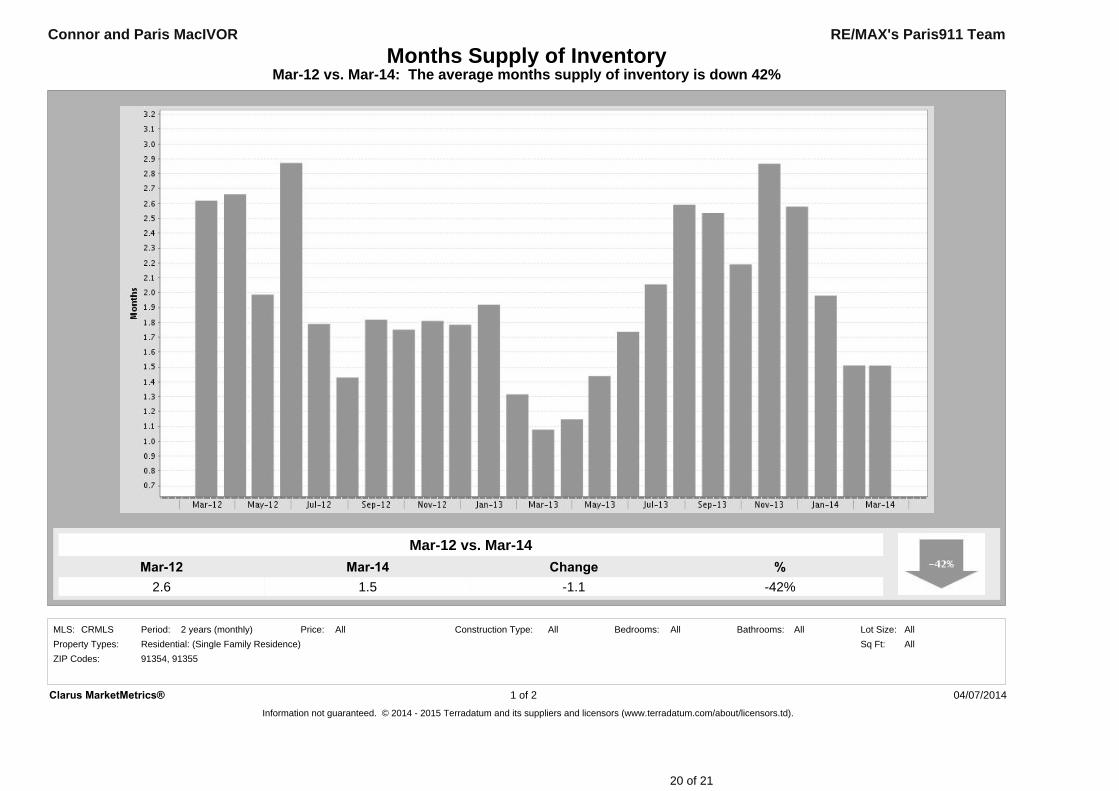
Mar-12 vs. Mar-14: The average months supply of inventory is down 42%
RE/MAX's Paris911 Team
Mar-12 vs. Mar-14
2.6 -42%
Connor and Paris MacIVOR
1.5Mar-14
Months Supply of Inventory
ChangeMar-12 %-1.1
Clarus MarketMetrics® 1 of 2 04/07/2014Information not guaranteed. © 2014 - 2015 Terradatum and its suppliers and licensors (www.terradatum.com/about/licensors.td).
AllBathrooms:MLS: AllAllSq Ft:
91354, 91355Residential: (Single Family Residence)Period: All All
Property Types:ZIP Codes:
AllConstruction Type:Price: Lot Size:Bedrooms:2 years (monthly)CRMLS
20 of 21

Months Supply of InventoryMar-12 vs. Mar-14: The average months supply of inventory is down 42%
Connor and Paris MacIVOR RE/MAX's Paris911 Team
Time Period During MonthLast Day of Month DOMMSI# Units For Sale # UC Units UC Average
Mar-14 59 4089 1.5Feb-14 55 5083 1.5Jan-14 49 6497 2.0Dec-13 38 5598 2.6Nov-13 45 65129 2.9Oct-13 58 55127 2.2Sep-13 56 58142 2.5Aug-13 49 45127 2.6Jul-13 54 50111 2.1Jun-13 57 3899 1.7May-13 57 3182 1.4Apr-13 61 2870 1.1Mar-13 64 3769 1.1Feb-13 57 6275 1.3Jan-13 37 6371 1.9Dec-12 37 5466 1.8Nov-12 42 6476 1.8Oct-12 48 7384 1.8Sep-12 44 6080 1.8Aug-12 63 8590 1.4Jul-12 57 97102 1.8Jun-12 47 88135 2.9May-12 74 87147 2.0Apr-12 62 77165 2.7Mar-12 63 111165 2.6
Clarus MarketMetrics® 2 of 2 04/07/2014Information not guaranteed. © 2014 - 2015 Terradatum and its suppliers and licensors (www.terradatum.com/about/licensors.td).
21 of 21