validated two-dimensional modeling of short carbon arcs
TRANSCRIPT

Phys. Plasmas 27, 083511 (2020); https://doi.org/10.1063/5.0011044 27, 083511
© 2020 Author(s).
Validated two-dimensional modeling of shortcarbon arcs: Anode and cathode spotsCite as: Phys. Plasmas 27, 083511 (2020); https://doi.org/10.1063/5.0011044Submitted: 17 April 2020 . Accepted: 05 July 2020 . Published Online: 04 August 2020
J. Chen , A. Khrabry , I. D. Kaganovich , A. Khodak , V. Vekselman , and H.-P. Li
ARTICLES YOU MAY BE INTERESTED IN
Investigation on anode plume in high-current vacuum arc by experiments and simulationsPhysics of Plasmas 27, 083506 (2020); https://doi.org/10.1063/5.0011440
Simultaneous generation of several waves in a rare gas low-voltage beam dischargePhysics of Plasmas 27, 083504 (2020); https://doi.org/10.1063/5.0011584
Langmuir probe, optical, and mass characterization of a DC CO2–H2 plasma
Physics of Plasmas 27, 083501 (2020); https://doi.org/10.1063/5.0010266
Validated two-dimensional modeling of shortcarbon arcs: Anode and cathode spots
Cite as: Phys. Plasmas 27, 083511 (2020); doi: 10.1063/5.0011044Submitted: 17 April 2020 . Accepted: 5 July 2020 .Published Online: 4 August 2020
J. Chen,1,2,a) A. Khrabry,1,b) I. D. Kaganovich,1 A. Khodak,1 V. Vekselman,1 and H.-P. Li2,a)
AFFILIATIONS1Princeton Plasma Physics Laboratory, Princeton, New Jersey 08542, USA2Department of Engineering Physics, Tsinghua University, Beijing 100084, People’s Republic of China
a)Authors to whom correspondence should be addressed: [email protected] and [email protected])Present address: Lawrence Livermore National Laboratory, Livermore, CA 94550, USA.
ABSTRACT
In order to study the properties of short carbon arcs, a self-consistent model was implemented into a CFD code ANSYS-CFX. The modeltreats the transport of heat and electric current in the plasma and electrodes in a coupled manner and accounts for gas convection in thechamber. Multiple surface processes at the electrodes are modeled, including the formation of space-charge limited sheaths, ablation anddeposition of carbon, and emission and absorption of radiation and electrons. The simulations show that the arc is constricted near the cath-ode and anode front surfaces, leading to the formation of electrode spots. The cathode spot is a well-known phenomenon, and mechanismsof its formation were reported elsewhere. However, the anode spot formation mechanism discovered in this work was not previouslyreported. We conclude that the spot formation is not related to plasma instability, as commonly believed in the case of constricted dischargecolumns, but rather occurs due to the highly nonlinear nature of heat balance in the anode. We additionally demonstrate this property witha reduced anode heat transfer model. We also show that the spot size increases with the arc current. This anode spot behavior was also con-firmed in our experiments. Due to the anode spot formation, a large gradient of carbon gas density occurs near the anode, which drives aportion of the ablated carbon back to the anode at its periphery. This can consequently reduce the total ablation rate. Simulation results alsoshow that the arc can reach the local chemical equilibrium state in the column region, while the local thermal equilibrium state is not typi-cally achieved for experimental conditions. It shows that it is important to account for different electron and gas temperatures in the model-ing of short carbon arcs.
Published under license by AIP Publishing. https://doi.org/10.1063/5.0011044
I. INTRODUCTION
Over the past few decades, the production of carbon nanoparticleshas attracted a lot of attention, and many approaches, such as chemicalvapor deposition,1 plasma-enhanced chemical vapor deposition,2 laservaporization,3 and arc discharge,4–7 are utilized for synthesis. Amongthese methods, an atmospheric pressure arc discharge is the simplestand cheapest method that meets the requirements of industrial-scaleproduction.8 In carbon arc discharges, a hot highly ablating anode isusually used as a source of material for the growth of nanoparticles.The typical surface temperature of the anode tip can reach �4000K.At such a temperature, carbon ablation, strong thermionic electronemission, and high radiation are all significant. The system of equationsdescribing the entire arc is highly nonlinear and governed by the cou-pling of particles and heat transport in both plasma and electrodes.
One of the interesting features of the carbon arc is the forma-tion of the electrode spots, which have already been observed in
many carbon arc experiments.7,9 Studies regarding the spots inglow and arc discharges have been conducted by many groupsincluding both numerical simulations10–13 and experiments.14,15
Such spots may significantly affect material processing in electricarcs. Reference 14 claimed that arc constriction and formation ofanode spots occur due to overheating instability. In Ref. 15, it wasobserved that anode spots disappear with an increase in the elec-trode electrical conductivity. Recent numerical studies regardingelectrode spots are reviewed in Refs. 16 and 17. It is concluded thatself-organization and bifurcation theories can be applied to explainthe spots. It was also proposed that this phenomenon could berelated to the plasma instability, e.g., the thermal instability.11,12
However, to our knowledge, formation of anode spots in carbonarcs has not been analyzed until now. Both the underlying mecha-nisms and the effects of the electrode spots on the synthesis ofnanoparticles are still unclear. Understanding the formation of the
Phys. Plasmas 27, 083511 (2020); doi: 10.1063/5.0011044 27, 083511-1
Published under license by AIP Publishing
Physics of Plasmas ARTICLE scitation.org/journal/php
spots and their effect on the heat transfer, ablation, deposition, andtransport of carbon was the motivation for the present study.
To correctly model the two-dimensional arc profiles, we devel-oped a self-consistent arc model. So far, many numerical models havebeen established to simulate arc discharges.18–31 Some of them aredeveloped to describe only specific regions,18–20,23 and some are forthe entire arc.21,22,24–31 Reviews of the plasma-electrode interaction inarc discharges and argon arc modeling can be found in Refs. 32 and33. To simplify the modeling, assumptions of local equilibriums, e.g.,local thermal equilibrium (LTE) and local chemical equilibrium(LCE), are often made. If LTE is assumed, there is no need to solve theelectron energy equation, but regarding the electron temperature, it isthe same as that of heavy particles; the LCE approximation allows usto use the Saha equation instead of multi-species transport equationsto obtain species number densities. These assumptions provide greatconvenience by reducing the computational difficulties. However,these models do not take into account non-equilibrium effects andintroduce artificial features in plasma profiles, especially in the near-electrode regions.26,27 For typical carbon arc discharges, the arc lengthis very short (usually several millimeters), and the size of non-equilibrium regions becomes comparable to the arc column length.Hence, non-equilibrium effects are important. For example, as shownin Ref. 27, the ion current and plasma density near the electrodeswould be drastically lower if non-equilibrium effects near the cathodeare neglected.
Therefore, in this paper, to study the characteristics of short car-bon arc discharges, we developed a self-consistent arc model withoutany equilibrium assumptions. The entire arc is modeled including thecathode, anode, arc column, and gas flow in a large chamber regionsurrounding the arc. The sheath is not resolved but taken into accountas boundary conditions. Ablation/deposition, radiation, and electronemission are all taken into consideration.
This paper is organized as follows: Section II describes the detailsof the self-consistent arc model. Section III describes the spot forma-tion in short arc discharges. Section IV provides a summary.Appendixes A–E give additional details of the model.
II. SELF-CONSISTENT ARC MODEL
In this section, the system of equations self-consistently describingthe arc is thoroughly introduced. Here, we only focus on the arc andnot on nanoparticle synthesis (see, e.g., Ref. 4), which is left for latermodeling. Therefore, only the carbon and helium atoms, electrons, andsingly charged carbon ions are considered. Helium is assumed to benot ionized due to the large ionization potential. Also, for the fast con-vergence of the simulations, we only perform the steady-state modelingand leave time-dependent modeling for future work.
A. Governing equations
1. Continuity and momentum equations for carbonand helium atoms
The steady-state continuity and momentum conservation equa-tions for the carbon-helium gas mixture (i.e., the Navier–Stokes equa-tions) can be expressed in the following form:
r � q~vð Þ ¼ 0; (1)
r � q~v~vð Þ ¼ �rpþr � sþ q~g ; (2)
where q ¼P
s nsms is the mixture density, where ns and ms are thenumber density and mass of species s, s represents all the speciesincluding electrons, carbon ions and atoms, and helium atoms,~v is theflow velocity, p is the pressure, s is the viscosity stress tensor, and~g isthe gravity acceleration. The viscosity of the C–He mixture dependson the temperature, the mixing ratio, and background pressure.However, for the temperature range of our interest (<10 000K), theviscosity depends weakly on the pressure and mixing ratios,34 andtherefore, it is replaced by the viscosity of the pure helium at 1 atm(still accounting for the temperature dependence).
The equation of state is
p ¼ nC þ nHe þ nið ÞkT þ nekTe; (3)
where Te is the electron temperature and T is the temperature of heavyspecies (note that all heavy particles have the same temperature).
2. Transport equations for the mixture species
The carbon gas transport equation is
r � qcC~vð Þ ¼ r DC;Her qcCð Þ� ��mCSi; (4)
where cc is the mass fraction of carbon atoms in the mixture, DC,He isthe diffusion coefficient for carbon in helium, mc is mass of carbonatoms, and Si is the net ionization rate of carbon atoms. DC,He was cal-culated using Eq. (5),27 with the momentum transfer cross sectionsrC,He¼ 3� 10�19 m2 taken from Ref. 35,
DC;He ¼3p32
ffiffiffiffiffiffiffiffiffiffiffiffiffiffi8kT
pmC;He
s1
nC þ nHeð ÞrC;He; mC;He ¼
mCmHe
mC þmHe: (5)
The net ionization rate can be written as
Si ¼ kinenC � krn3e ; (6)
where ki and kr are the stepwise ionization and recombination ratecoefficients for carbon atoms taken from Ref. 36.
Note that here the quasi-neutrality condition is used for theentire arc,
ne ¼ ni;
and the space-charge sheaths near the electrodes are treated as bound-ary conditions, described in Sec. II B.
The excitation energy and direct ionization energy for heliumatoms are 19.8 eV and 24.6 eV,28 respectively, which are considerablyhigher than the ionization energy for carbon atoms (11.26 eV); there-fore, helium excited atoms and ions can be omitted from consider-ation. For the same reason, multi-charged carbon ions are alsoomitted, and the transport equation for carbon ion Cþ reads
r �~j ie¼ Si; (7)
where~j i is the ion current. Electron and ion currents are given by
~je ¼ rkerTe þ r
keTer ln ne þ r~E � ene~v;
~j i ¼ �liknirT � likTrni þ eliniE þ eni~v;
r ¼ enele ¼nee2
me �e;a þ �e;ið Þ; li ¼
emi �i;a þ �i;eð Þ
;
(8)
Physics of Plasmas ARTICLE scitation.org/journal/php
Phys. Plasmas 27, 083511 (2020); doi: 10.1063/5.0011044 27, 083511-2
Published under license by AIP Publishing
where r is the electrical conductivity,~je,~j i, and~E are the electron cur-rent density, the ion current density, and the electric field, and le andli are the mobilities of electrons and ions. Note that~v is the flow veloc-ity of the carbon-helium mixture but not the individual species veloc-ity. �k,j is the effective collision frequency of k species with j species,
�k;j ¼43
ffiffiffiffiffiffiffiffiffiffiffi8kTkj
pmkj
sCkjrkjnj; Tkj ¼
mkTj þmjTk
mk þmj; mkj ¼
mkmj
mk þmj;
(9)
where Tkj,mkj, and rkj are the binary temperatures, binary masses, andmomentum transfer cross sections. Ckj are the coefficients derivedfrom kinetic theory.27 The Coulomb collisions between electrons andions are described by the following cross section:
rei ¼e4 lnK
32pe20 kTeð Þ2; (10)
where e0 is the vacuum permittivity, k is the Boltzmann constant, Te isthe electron temperature, and lnK is the Coulomb logarithm. In thiswork, Eq. (7) was implemented into ANSYS-CFX in the ambipolarform (see Appendix A for details).
The electric field can be calculated from Eq. (8) for the electroncurrent,
~E ¼ �rV ¼ � kerTe �
keTer ln ne þ
~jer; (11)
where the last term can be neglected for most of the conditions in theshort arc, where the terms with gradients are dominant (see detailedanalysis in Ref. 27).
Omitting the radiative loss from plasma (see Appendix B), elec-tron and ion energy balance equations are
r � 2:5kTe
~jee
� �¼ r � kerTeð Þ � SiEion � Qe-h þ~je �~E; (12)
r � qh~vð Þ ¼ r � khrTð Þ þ r � ~v � sð Þ þ Qe-h þ~j i �~E; (13)
where ke and kh are the thermal conductivities for electrons and heavyparticles. ke is obtained from Ref. 37, and kh is obtained from Ref. 34.Eion is the direct ionization energy of carbon atoms. h is thetotal enthalpy computed as h ¼
Ðcp;mixðTÞdT þ 1
2 v2, and cp;mix
¼ cp;He � ð1� cCÞ þ cp;C � cC. The specific heat for helium, cp,He, isconstant (5240 J/kg/K), and for carbon (including carbon atoms andions), cp,C is taken from Ref. 39. Qe-h represents the heat exchangebetween electrons and heavy particles due to elastic collisions, follow-ing the form28
Q e-h ¼ neXs
32k Te � Tð Þ 2me
ms�e;s: (14)
3. Conservation of electric current used to determinethe profile of electric potential
The current conservation equation is
r �~j ¼ 0: (15)
Here,~j ¼~je þ~j i is the total current density. Substituting Eq. (11)into Eq. (15) and neglecting the divergence of ion current density,11,20
we obtain an elliptic equation for the electric potential,
r � rrVð Þ ¼ r � rkerTe
� �þr � r
keTer ln ne
� �: (16)
This equation is supplemented with the current conservationequation in electrodes,
r �~j ¼ r � rgraphiterV� �
¼ 0:
In addition, the heat conduction equation with Joule heating is solvedinside the cathode and anode. The thermal conductivity, kgraphite, andthe electrical conductivity of graphite, rgraphite, are taken as functionsof temperature according to Ref. 40.
All the above equations are implemented into a computationalframework ANSYS-CFX. ANSYS-CFX is a robust ComputationalFluid Dynamics (CFD) code designed for 3D simulations in complexgeometry using unstructured grids and multiple processors. The codeincorporates models for various physical phenomena, including theheat and mass transfer, radiation transfer, and buoyancy effects. Thecode is extendable and enables the implementation of custom-basedprocesses by introducing additional variables and transport equationswith the custom-based boundary conditions. This feature of the codewas utilized for the implementation of the self-consistent arc modeland for the gas/plasma and solid (electrode) domains.
B. Computational domain and boundary conditions
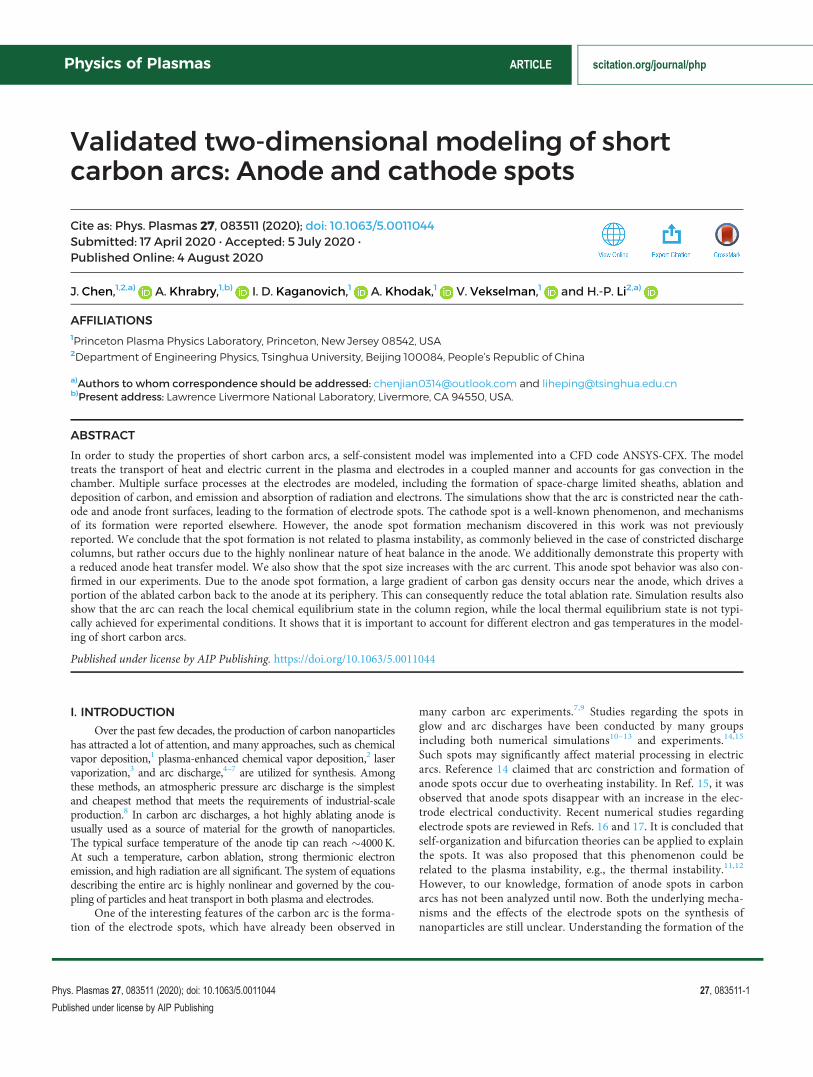
In this paper, an axisymmetric computational domain is adopted,and we set the origin at the center of the cathode tip surface (seeFig. 1). The arc model is designed to describe the experiments reportedin Refs. 4 and 41. The entire arc setup, including the graphite cathode,graphite anode, and surrounding chamber filled with the backgroundgas, is included in the model. The cathode and anode are located alongthe axis of the chamber. The chamber radius and height are 78mmand 240mm, respectively. The length of the anode rod is 126mm. Thelength of the cathode rod was different for different inter-electrode gapwidths, e.g., 111mm for a gap width d¼ 3mm. Radii of the cathodeand the anode are 4.75mm and 3.2mm, respectively. A small outlet isplaced at the bottom of the chamber wall in order to maintain thebackground pressure, similar to the experiments. The width of the out-let is 5mm. In the simulations, the inter-electrode gap width is fixed.A constant gap width was also maintained in actual experiments byautomatically adjusting the positions of the electrodes as the anodematerial was evaporated by the arc and the deposit grew on thecathode.
Boundary conditions for all the equations are listed in Table I.The no-slip assumption, i.e., zero gas velocity, is adopted for all solidwalls, and the outlet is defined as the open boundary where free flowin and out is allowed with a constant pressure of 68 kPa. Boundaryconditions strongly affect plasma and gas properties: the current den-sity and heat flux are affected by the sheath boundary conditions andthe carbon density by carbon ablation of and deposition on electrodes.
In Table I,~n, ~C, and ~CC represent the unit vector normal to thesurface, the total flux of the carbon/helium gas mixture, and the car-bon gas flux, respectively. To account for the ablation and depositionprocesses, a new relation for the boundary mass fluxes, Cabl/depos, isused to enable the automatic selection between the ablation anddeposition,
Physics of Plasmas ARTICLE scitation.org/journal/php
Phys. Plasmas 27, 083511 (2020); doi: 10.1063/5.0011044 27, 083511-3
Published under license by AIP Publishing

Cabl=depos ¼ psat;C Tð Þ � pC� � ffiffiffiffiffiffiffiffiffiffiffi
MC
2pkT
r: (17)
Here, pC ¼ nCkT is the partial pressure of carbon gas at the electrodesurface, and psat,C (T) is the saturated pressure at the electrode surfaceas a function of gas temperature, T, which can be determined from theClapeyron–Clausius relation,
psat;C Tð Þ ¼ 1 atm½ � � exp � qCMC
kB
1T� 1Tsat;1atm
� � ; (18)
where Tsat,1atm¼ 3900K is the saturated temperature of carbon vaporat 1 atm. qC¼ 5.93� 107 J/kg is the latent heat for atomic carbon.42
Note that Eq. (17) includes the effect of carbon gas pressure, whichwas missed in the previous modelling.29 Combining Eq. (17) as theboundary condition, the carbon gas transport with the electrode abla-tion and deposition can be accurately solved using Eq. (4).
In our model, the sheath width is assumed to be very small (typi-cally of the order of micrometer) and is not resolved. Instead, thesheath is described with the effective boundary conditions for theequations for potential and energy balance. The adopted sheath modelhas been already benchmarked in Ref. 27.
The current balance equation at the electrode surfaces reads
~j ¼~j i þ~je ¼~j i þ~jemissione þ~j plasma
e ; (19)
where~j,~jemissione , and~j
plasmae are the total current density, emission cur-
rent density, and plasma bulk electron current density at the boundary,respectively. In the case of positive sheath voltage (the wall potential ispositive relative to the plasma potential), the boundary ion current iswritten as
~n �~j i ¼ �14eni
ffiffiffiffiffiffiffiffiffiffi8kTpMC
sexp � eVsheath
kT
� �: (20)
For the negative sheath voltage, the ion current is determined by theBohm criterion,
~n �~j i ¼ �eni
ffiffiffiffiffiffiffiffiffiffiffiffiffiffiffiffiffiffiffiffik Te þ Tð Þ
MC
s: (21)
Equations (20) and (21) give the boundary conditions at the cathodeand anode surfaces for the ion transport equation (see Table I). At thechamber wall and outlet far from the arc bulk, the ion density is negli-gible and assumed to be equal to zero.
The electron current from the plasma to the wall is given by
~n �~j plasmae ¼ 1
4ene
ffiffiffiffiffiffiffiffiffiffi8kTe
pme
sexp
emin Vsheath; 0ð ÞkTe
� �: (22)
Note that the electron emission is very important and affects thesheath voltage drop.27,43,44 Due to the high surface temperature, thethermionic emission current from the wall to the plasma should beincluded and is given by
~n �~j emissione ¼ �jR exp
�emax Vsheath; 0ð ÞkTelectrode
� �; (23)
where jR is the Richardson emission current,
jR ¼ ART2electrode exp � e Vw þ ESchottð Þ
kTelectrode
� �; (24)
FIG. 1. Schematic of the simulation setup(left: showing the boundary conditions atthe electrodes and right: full simulationdomain).
Physics of Plasmas ARTICLE scitation.org/journal/php
Phys. Plasmas 27, 083511 (2020); doi: 10.1063/5.0011044 27, 083511-4
Published under license by AIP Publishing
where AR is the Richardson constant, Vw is the work function of theelectrode material (for graphite, Vw¼ 4.6 V), and ESchott¼ 0.1 V is theSchottky correction voltage.18
The electron heat flux at the boundary is
qe ¼ �2:5kTelectrode
e�min Vsheath; 0ð Þ
� �~n �~j emission
e
� 2:5kTe
e�min Vsheath; 0ð Þ
� �~n �~j plasma
e þ 2:5kTe
~je; (25)
and the boundary heat flux for the carbon-helium mixture coupled toan electrode is
qh ¼2:5kTelectrode
eþ Vw þmax Vsheath; 0ð Þ
� �~n �~j emission
e
þ 2:5kTe
eþ eVw þmax Vsheath; 0ð Þ
� �~n �~j plasma
e
�~n �~j plasmai Eion � Vw �max Vsheath; 0ð Þð Þ
�qC;vaporCabl=depos � erSBT4 þ eqRad;inc; (26)
where qC,vapor is the latent heat for vaporization, e is the emissivity, rSB
is the Stephen–Boltzmann coefficient, and qRad,inc is the incident radia-tion. The emissivity of the two electrodes is set as 0.8, which is a typicalquantity for graphite;5 and plasma and gas are assumed to be transpar-ent media, i.e., radiation and absorption from it were neglected. This isalso confirmed in our experimental measurements. The Monte-Carlomethod is adopted for calculating the incident radiation. The model isalready implemented in ANSYS; it treats all emissive walls as photonsources and tracks photons generated by these sources until they areabsorbed. Each time the surface experiences an intersection with aphoton, the incident radiation of interest gets updated (see the ANSYSCFX-Solver Modeling Guide38 for more details).
It should be emphasized that the present sheath model enablesone to find a self-consistent solution that takes into account the sheathvoltage drops, boundary current, and heat flux without any priorassumption and allows for a solution of a highly nonlinear system ofequations describing an arc. Non-uniform grids were employed forbetter resolving the non-equilibrium transport near the electrodes.The convergency check of grid resolution was also performed and isdescribed in Appendix C.
III. RESULTSA. Validation against experimental data
For validating the CFX code, two series of simulations with theexperimental conditions of Ref. 41 were performed. In the experi-ments, the background pressure is 67 kPa. The plasma density andelectron temperature were measured using the combination of opticalemission spectroscopy, spectrally resolved fast frame imaging, and pla-nar laser induced fluorescence. Ablation and deposition rates weremeasured by electrodes weighting after arc run of 60 s.41 Note that noa priori equilibrium assumption was taken in the measurements. Inthe low ablation regime, the measured electron temperature in the arccore for the case with d¼ 3.0mm and I¼ 50 A is 0.86 0.1 eV inagreement with the simulated value of 0.83 eV for the same arc param-eters. Simulation results also show that the arc characteristics dependon heat flux through the graphite electrodes. However, the thermalconductivity of graphite used in the electrodes can vary significantly.TA
BLE
I.Boundaryconditions.
Equ
ations
Con
tinu
ity
andmom
entum
aCarbongas
transporta
Poisson
equation
Ion
transport
Electron
energy
b
Heavy
particle
andelectrod
eenergy
b
Catho
desurface
~ n�~ C¼
Cabl=depo
s~ n�~ C
C¼
Cabl=depo
sVeletrode¼
VplasmaþVsheath
~ n�rrVelectrod
e¼~ n�~ j
c
Equ
ation(20)/
(21)
d~ n�k
erTe¼
q eTelectrod
e¼
T~ n�k
hrT�~ n�k
graphiterTelectrod
e¼
q h
Ano
desurface
~ n�~ C¼
Cabl=depo
s~ n�~ C
C¼
Cabl=depo
sVeletrode¼
VplasmaþVsheath
~ n�rrVelectrod
e¼~ n�~ j
7c
Eqs.(20)/
(21)
d~ n�k
erTe¼
q eTelectrod
e¼
T~ n�k
hrT�~ n�k
graphiterTelectrod
e¼
q h
Chamber
surface
~ n�~ C¼
Cabl=depo
s~ n�~ C
C¼
Cabl=depo
s~ n�rrV¼
0~ n�~ j
i¼
0Te¼350K
T¼350K
Outlet
p¼68
kPa
c C¼0
~ n�rrV¼
0~ n�~ j
i¼
0Te¼350K
T¼350K
Catho
deou
tertip
……
V¼0
……
T¼350K
Ano
deou
tertip
……
V¼Voute
……
T¼350K
a Tangentialvelocityiszero
(non
-slip
cond
ition).
bq e
andq h
aregivenby
Eqs.(25)and(26).
c Sheathvoltage
drop
,Vsheath,iscalculated
accordingto
thelocalcurrent
balanceattheplasma-solid
interface[Eq.(19)].Seedetails
inRef.27.
dFo
rVsheath>
0(and
Vsheath<
0),ion
fluxesaredeterm
ined
from
Eqs.(20)and(21).
e Voutiscalculated
inthesolver
iterations
bysatisfying
thattheactualtotalcurrent
equalsthegivenarccurrent.
Physics of Plasmas ARTICLE scitation.org/journal/php
Phys. Plasmas 27, 083511 (2020); doi: 10.1063/5.0011044 27, 083511-5
Published under license by AIP Publishing
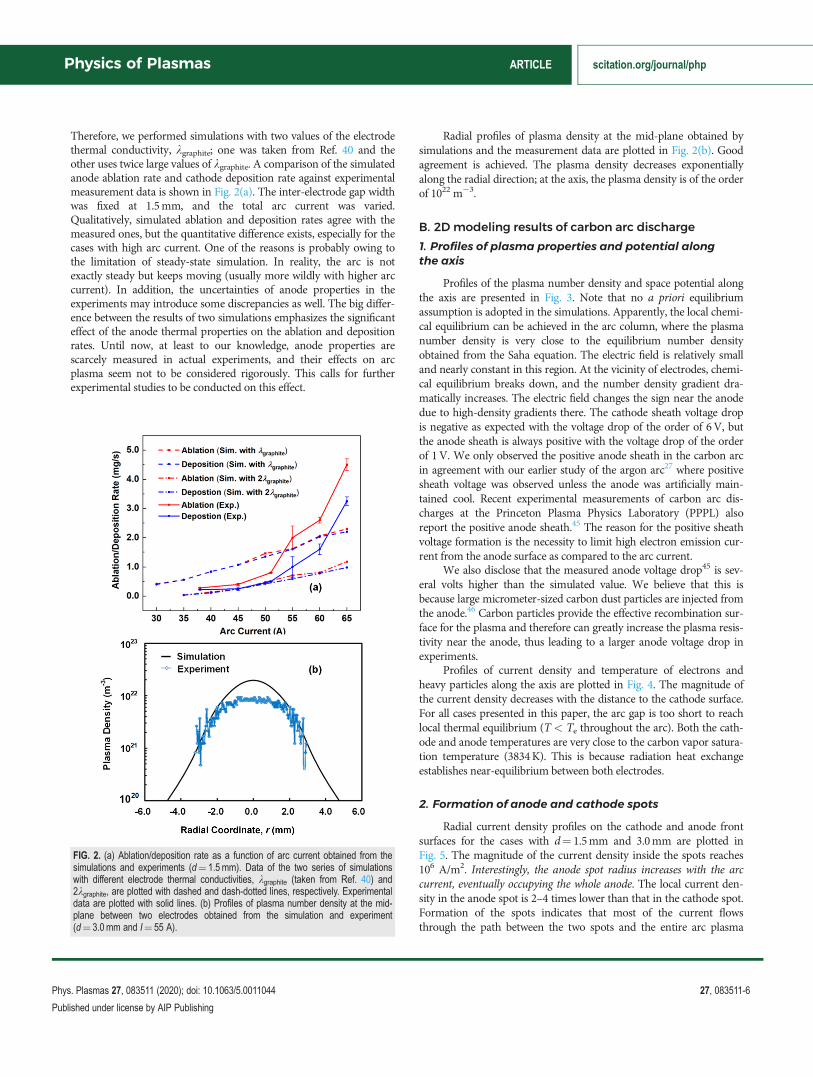
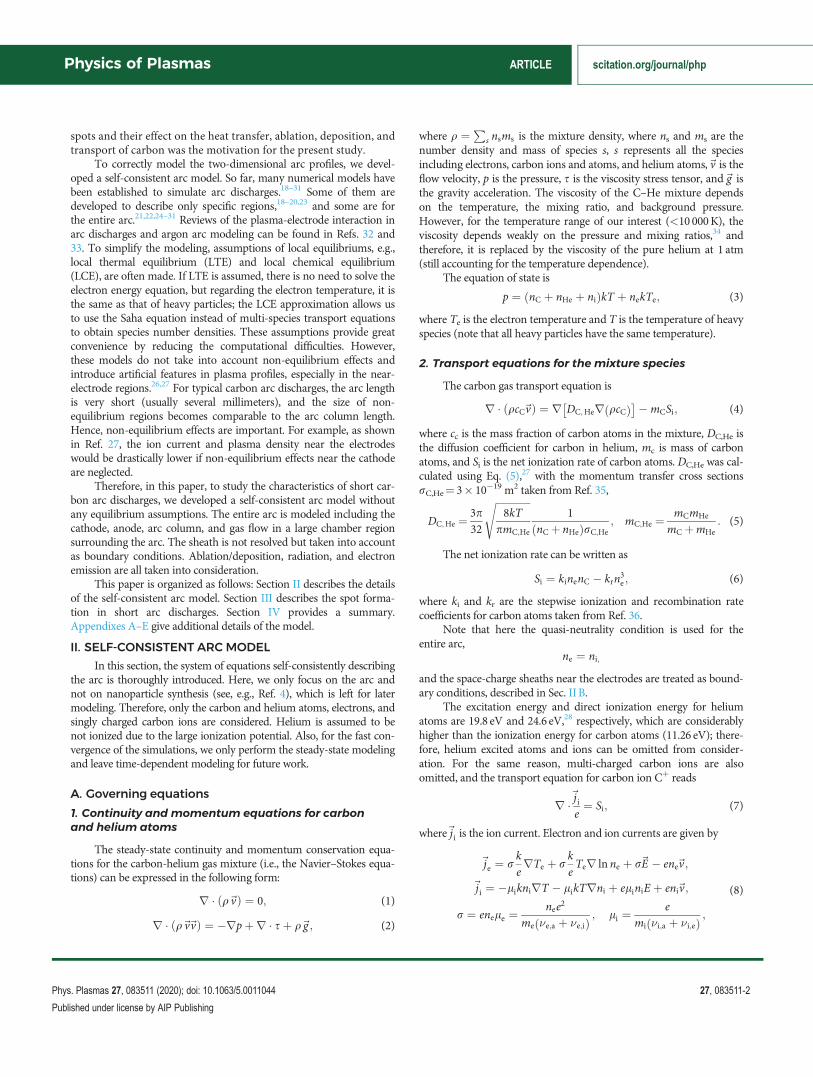
Therefore, we performed simulations with two values of the electrodethermal conductivity, kgraphite; one was taken from Ref. 40 and theother uses twice large values of kgraphite. A comparison of the simulatedanode ablation rate and cathode deposition rate against experimentalmeasurement data is shown in Fig. 2(a). The inter-electrode gap widthwas fixed at 1.5mm, and the total arc current was varied.Qualitatively, simulated ablation and deposition rates agree with themeasured ones, but the quantitative difference exists, especially for thecases with high arc current. One of the reasons is probably owing tothe limitation of steady-state simulation. In reality, the arc is notexactly steady but keeps moving (usually more wildly with higher arccurrent). In addition, the uncertainties of anode properties in theexperiments may introduce some discrepancies as well. The big differ-ence between the results of two simulations emphasizes the significanteffect of the anode thermal properties on the ablation and depositionrates. Until now, at least to our knowledge, anode properties arescarcely measured in actual experiments, and their effects on arcplasma seem not to be considered rigorously. This calls for furtherexperimental studies to be conducted on this effect.
Radial profiles of plasma density at the mid-plane obtained bysimulations and the measurement data are plotted in Fig. 2(b). Goodagreement is achieved. The plasma density decreases exponentiallyalong the radial direction; at the axis, the plasma density is of the orderof 1022 m�3.
B. 2D modeling results of carbon arc discharge
1. Profiles of plasma properties and potential alongthe axis
Profiles of the plasma number density and space potential alongthe axis are presented in Fig. 3. Note that no a priori equilibriumassumption is adopted in the simulations. Apparently, the local chemi-cal equilibrium can be achieved in the arc column, where the plasmanumber density is very close to the equilibrium number densityobtained from the Saha equation. The electric field is relatively smalland nearly constant in this region. At the vicinity of electrodes, chemi-cal equilibrium breaks down, and the number density gradient dra-matically increases. The electric field changes the sign near the anodedue to high-density gradients there. The cathode sheath voltage dropis negative as expected with the voltage drop of the order of 6V, butthe anode sheath is always positive with the voltage drop of the orderof 1V. We only observed the positive anode sheath in the carbon arcin agreement with our earlier study of the argon arc27 where positivesheath voltage was observed unless the anode was artificially main-tained cool. Recent experimental measurements of carbon arc dis-charges at the Princeton Plasma Physics Laboratory (PPPL) alsoreport the positive anode sheath.45 The reason for the positive sheathvoltage formation is the necessity to limit high electron emission cur-rent from the anode surface as compared to the arc current.
We also disclose that the measured anode voltage drop45 is sev-eral volts higher than the simulated value. We believe that this isbecause large micrometer-sized carbon dust particles are injected fromthe anode.46 Carbon particles provide the effective recombination sur-face for the plasma and therefore can greatly increase the plasma resis-tivity near the anode, thus leading to a larger anode voltage drop inexperiments.
Profiles of current density and temperature of electrons andheavy particles along the axis are plotted in Fig. 4. The magnitude ofthe current density decreases with the distance to the cathode surface.For all cases presented in this paper, the arc gap is too short to reachlocal thermal equilibrium (T < Te throughout the arc). Both the cath-ode and anode temperatures are very close to the carbon vapor satura-tion temperature (3834K). This is because radiation heat exchangeestablishes near-equilibrium between both electrodes.
2. Formation of anode and cathode spots
Radial current density profiles on the cathode and anode frontsurfaces for the cases with d¼ 1.5mm and 3.0mm are plotted inFig. 5. The magnitude of the current density inside the spots reaches106 A/m2. Interestingly, the anode spot radius increases with the arccurrent, eventually occupying the whole anode. The local current den-sity in the anode spot is 2–4 times lower than that in the cathode spot.Formation of the spots indicates that most of the current flowsthrough the path between the two spots and the entire arc plasma
FIG. 2. (a) Ablation/deposition rate as a function of arc current obtained from thesimulations and experiments (d¼ 1.5 mm). Data of the two series of simulationswith different electrode thermal conductivities, kgraphite (taken from Ref. 40) and2kgraphite, are plotted with dashed and dash-dotted lines, respectively. Experimentaldata are plotted with solid lines. (b) Profiles of plasma number density at the mid-plane between two electrodes obtained from the simulation and experiment(d¼ 3.0 mm and I¼ 55 A).
Physics of Plasmas ARTICLE scitation.org/journal/php
Phys. Plasmas 27, 083511 (2020); doi: 10.1063/5.0011044 27, 083511-6
Published under license by AIP Publishing
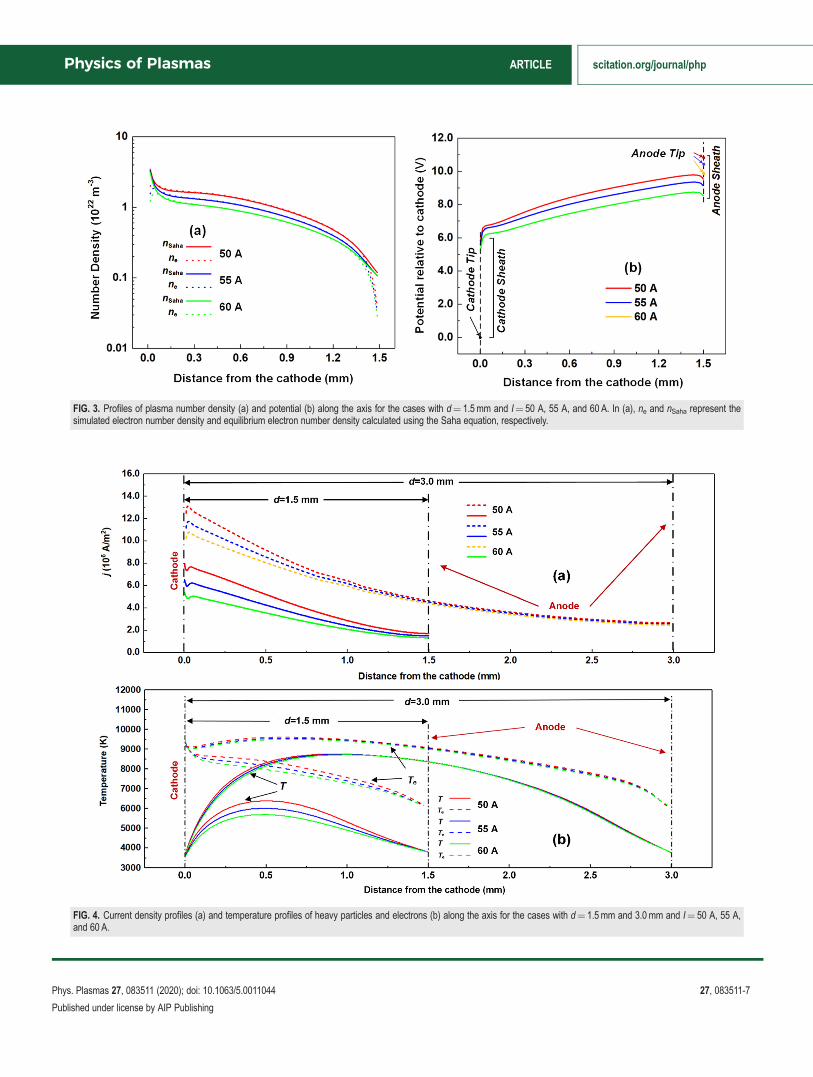
FIG. 3. Profiles of plasma number density (a) and potential (b) along the axis for the cases with d¼ 1.5 mm and I¼ 50 A, 55 A, and 60 A. In (a), ne and nSaha represent thesimulated electron number density and equilibrium electron number density calculated using the Saha equation, respectively.
FIG. 4. Current density profiles (a) and temperature profiles of heavy particles and electrons (b) along the axis for the cases with d¼ 1.5 mm and 3.0 mm and I¼ 50 A, 55 A,and 60 A.
Physics of Plasmas ARTICLE scitation.org/journal/php
Phys. Plasmas 27, 083511 (2020); doi: 10.1063/5.0011044 27, 083511-7
Published under license by AIP Publishing

becomes constricted. Contours of other plasma parameters and cur-rent streamlines are given in Appendix D.
Temperature profiles on the anode and cathode tips for the caseswith d¼ 1.5mm and 3.0mm are shown in Fig. 6. Both the anode andcathode surface temperatures exhibit the flat-top profiles, forming thetemperature spot. Current and temperature profiles are strongly corre-lated due to the strong dependence of the local current density on thelocal temperature due to ablation and emission processes. The temper-ature inside the anode spot is close to the carbon vapor saturation tem-perature (Tsat,68 kPa¼ 3834K), whereas the temperature in the cathodespots is a bit lower.
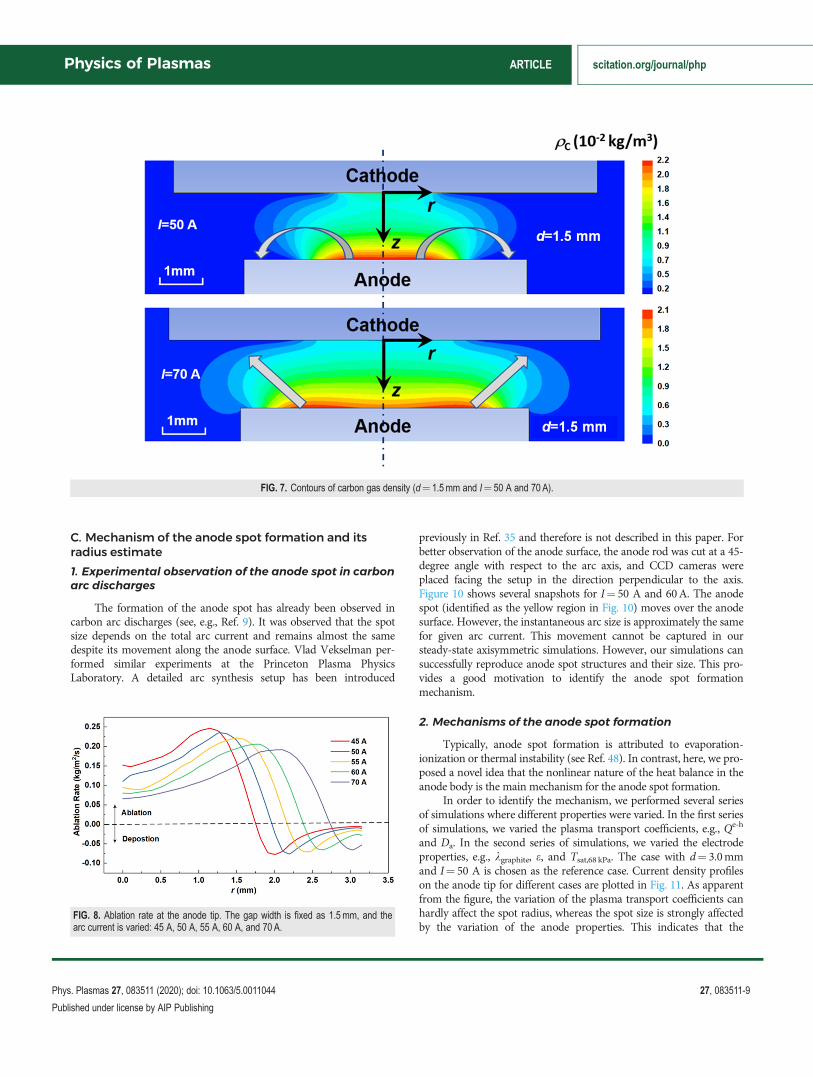
3. Effects of the spot formation on carbon gas transportand anode ablation
It is commonly believed that the ablated carbon gas from theanode surface can move both to the cathode and out of the gapbetween the two electrodes. However, it is found that an anoma-lous carbon gas transport process is established due to the exis-tence of the anode spot, and therefore, a fraction of ablated carbondeposits back to the anode. Contours of carbon gas density for thecases with d¼ 1.5mm and profiles of the ablation rate on theanode surface are illustrated in Figs. 7 and 8. As already shown inFig. 6, the surface temperature in the anode spot is very close to thetemperature of carbon evaporation. Because of high carbon abla-tion, at the vicinity of the anode spot, nearly all helium is
substituted by the ablating carbon. As shown in Fig. 7, the carbongas density is very high in the spot, whereas it dramaticallydecreases in the periphery due to the decrease in the surface tem-perature. The large carbon gas density gradient is, consequently,created and drives the carbon particles ablating from the anodespot toward the periphery and back to the anode surface where itdeposits due to lower temperature at the periphery (see Fig. 8). Afraction of carbon that returns to the anode at its peripherydecreases with the total arc current. For example, for arc current,I¼ 45 A, 35% of the ablating carbon deposits on the periphery ofthe anode, whereas for I¼ 70 A, only 14% deposits back.Returning of the ablated carbon reduces the total ablation rate andcan reduce production of the nanoparticles. Note that in a real arc,the spot moves along the surface from the center to the periphery,and this leads to averaging of the ablation rate over the anodesurface.
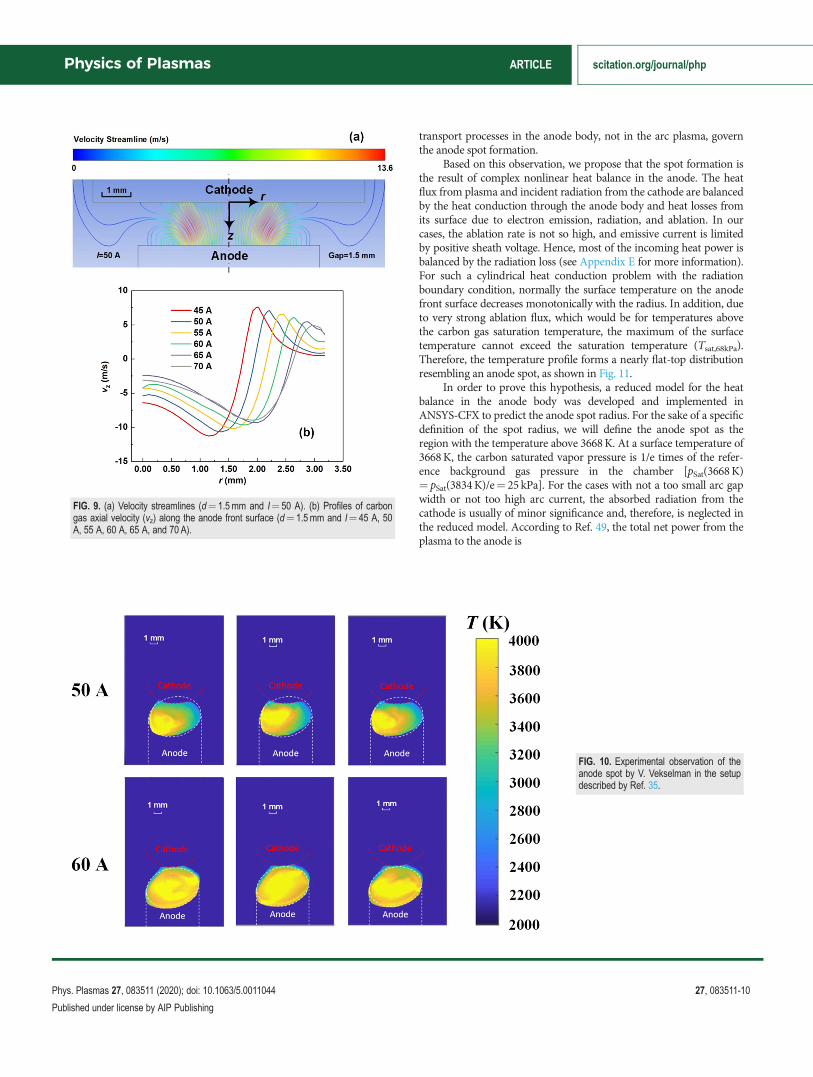
The flow pattern is shown in Fig. 9. For I¼ 60 A, the simulationshows that carbon evaporation produces a maximum velocity of 9.5m/s, which is ten times lower than the value (�95 m/s) obtained inRef. 29. The difference in the flow velocity is due to the difference inthe ablation rate relation used in two models. In Ref. 29, the partialpressure of carbon gas was not taken into account for calculating theablation flux [compare Eq. (7) in Ref. 29 and Eq. (17) in Sec. II]. Theflow pattern also evidences the anomalous transport of ablated carbongas to the anode periphery. More details of the effects that the carbongas transport has on the electrode ablation and deposition can befound in our separated analytical paper (Ref. 47).
FIG. 5. Current density profiles along the anode (a) and cathode (b) surfaces as afunction of radius. Cases shown are for d¼ 1.5 mm (1) and d¼ 3.0 mm (2) andcurrent I¼ 45 A, 50 A, 55 A, 60 A, and 70 A.
FIG. 6. Temperature profiles along the anode (a) and cathode (b) surfaces as afunction of radius for two gap widths: d¼ 1.5 mm (1) and d¼ 3.0 mm (2) and 5 val-ues of current I¼ 45 A, 50 A, 55 A, 60 A, and 70 A.
Physics of Plasmas ARTICLE scitation.org/journal/php
Phys. Plasmas 27, 083511 (2020); doi: 10.1063/5.0011044 27, 083511-8
Published under license by AIP Publishing
C. Mechanism of the anode spot formation and itsradius estimate
1. Experimental observation of the anode spot in carbonarc discharges
The formation of the anode spot has already been observed incarbon arc discharges (see, e.g., Ref. 9). It was observed that the spotsize depends on the total arc current and remains almost the samedespite its movement along the anode surface. Vlad Vekselman per-formed similar experiments at the Princeton Plasma PhysicsLaboratory. A detailed arc synthesis setup has been introduced
previously in Ref. 35 and therefore is not described in this paper. Forbetter observation of the anode surface, the anode rod was cut at a 45-degree angle with respect to the arc axis, and CCD cameras wereplaced facing the setup in the direction perpendicular to the axis.Figure 10 shows several snapshots for I¼ 50 A and 60A. The anodespot (identified as the yellow region in Fig. 10) moves over the anodesurface. However, the instantaneous arc size is approximately the samefor given arc current. This movement cannot be captured in oursteady-state axisymmetric simulations. However, our simulations cansuccessfully reproduce anode spot structures and their size. This pro-vides a good motivation to identify the anode spot formationmechanism.
2. Mechanisms of the anode spot formation
Typically, anode spot formation is attributed to evaporation-ionization or thermal instability (see Ref. 48). In contrast, here, we pro-posed a novel idea that the nonlinear nature of the heat balance in theanode body is the main mechanism for the anode spot formation.
In order to identify the mechanism, we performed several seriesof simulations where different properties were varied. In the first seriesof simulations, we varied the plasma transport coefficients, e.g., Qe-h
and Da. In the second series of simulations, we varied the electrodeproperties, e.g., kgraphite, e, and Tsat,68 kPa. The case with d¼ 3.0mmand I¼ 50 A is chosen as the reference case. Current density profileson the anode tip for different cases are plotted in Fig. 11. As apparentfrom the figure, the variation of the plasma transport coefficients canhardly affect the spot radius, whereas the spot size is strongly affectedby the variation of the anode properties. This indicates that the
FIG. 7. Contours of carbon gas density (d¼ 1.5 mm and I¼ 50 A and 70 A).
FIG. 8. Ablation rate at the anode tip. The gap width is fixed as 1.5 mm, and thearc current is varied: 45 A, 50 A, 55 A, 60 A, and 70 A.
Physics of Plasmas ARTICLE scitation.org/journal/php
Phys. Plasmas 27, 083511 (2020); doi: 10.1063/5.0011044 27, 083511-9
Published under license by AIP Publishing
transport processes in the anode body, not in the arc plasma, governthe anode spot formation.
Based on this observation, we propose that the spot formation isthe result of complex nonlinear heat balance in the anode. The heatflux from plasma and incident radiation from the cathode are balancedby the heat conduction through the anode body and heat losses fromits surface due to electron emission, radiation, and ablation. In ourcases, the ablation rate is not so high, and emissive current is limitedby positive sheath voltage. Hence, most of the incoming heat power isbalanced by the radiation loss (see Appendix E for more information).For such a cylindrical heat conduction problem with the radiationboundary condition, normally the surface temperature on the anodefront surface decreases monotonically with the radius. In addition, dueto very strong ablation flux, which would be for temperatures abovethe carbon gas saturation temperature, the maximum of the surfacetemperature cannot exceed the saturation temperature (Tsat,68kPa).Therefore, the temperature profile forms a nearly flat-top distributionresembling an anode spot, as shown in Fig. 11.
In order to prove this hypothesis, a reduced model for the heatbalance in the anode body was developed and implemented inANSYS-CFX to predict the anode spot radius. For the sake of a specificdefinition of the spot radius, we will define the anode spot as theregion with the temperature above 3668K. At a surface temperature of3668K, the carbon saturated vapor pressure is 1/e times of the refer-ence background gas pressure in the chamber [pSat(3668K)¼ pSat(3834K)/e¼ 25 kPa]. For the cases with not a too small arc gapwidth or not too high arc current, the absorbed radiation from thecathode is usually of minor significance and, therefore, is neglected inthe reduced model. According to Ref. 49, the total net power from theplasma to the anode is
FIG. 9. (a) Velocity streamlines (d¼ 1.5 mm and I¼ 50 A). (b) Profiles of carbongas axial velocity (vz) along the anode front surface (d¼ 1.5 mm and I¼ 45 A, 50A, 55 A, 60 A, 65 A, and 70 A).
FIG. 10. Experimental observation of theanode spot by V. Vekselman in the setupdescribed by Ref. 35.
Physics of Plasmas ARTICLE scitation.org/journal/php
Phys. Plasmas 27, 083511 (2020); doi: 10.1063/5.0011044 27, 083511-10
Published under license by AIP Publishing

Qanode ¼2:5kTe;anode
eþ Vw þmax Vsheath; 0ð Þ
I; (27)
where Te,anode and Vsheath are typically of the order of 6000K and 1Vas obtained in our simulations, respectively, and the work function ofgraphite, Vw, is 4.6V. Therefore, the total heat flux to the anode is
Qanode � I � 6:9 V½ �: (28)
Radiation loss through the anode surface can be obtained makinguse of ANSYS-CFX simulations of the heat conduction process in thecylindrical anode body. The schematic of the simulation setup isshown in Fig. 12. Anode Joule heating is proved to have little effect onthe temperature profile in the anode and thus can be omitted.49 Thetemperature in the anode spot is fixed at the assumed value (3668K;see Fig. 6). In order to maintain a fixed temperature in the spot, localboundary heat flux is automatically determined within the anode spotand is set to zero outside, i.e.,
qin; anode tip ¼qa; r < r00; r > r0;
�(29)
where r0 is the radius of the anode spot (an input parameter for thesimulation). The incoming heat flux is balanced by radiation loss,qRad¼ erSBT
4, from all the anode surfaces. Note that qa here is notdetermined by Qanode in Eq. (27).
Figure 13 maps the total radiation loss vs spot radius. Red dashedlines show the total incoming power (Qanode) and the correspondingarc current [Eq. (28)]. The spot radius can be determined by matchingthe incoming power with the total radiation loss (the intersection ofred lines and black curve).
Experimental data in Fig. 10 are also processed to obtain themeasured spot radius. We can define the measured spot radius as
r0; Exp ¼ffiffiffiffiffiffiSSpotp
q, where Sspot represents the total size of regions where
FIG. 11. Current density distributions over the anode tip altering the plasma transport (a) and anode properties (b). d¼ 3.0 mm and I¼ 50 A.
FIG. 12. Schematic of the reduced simulation setup.
FIG. 13. Radiation loss vs spot radius obtained from the reduced simulations (blacksolid line). Red dashed lines represent the total heat flux to the anode calculatedusing Eq. (28).
Physics of Plasmas ARTICLE scitation.org/journal/php
Phys. Plasmas 27, 083511 (2020); doi: 10.1063/5.0011044 27, 083511-11
Published under license by AIP Publishing
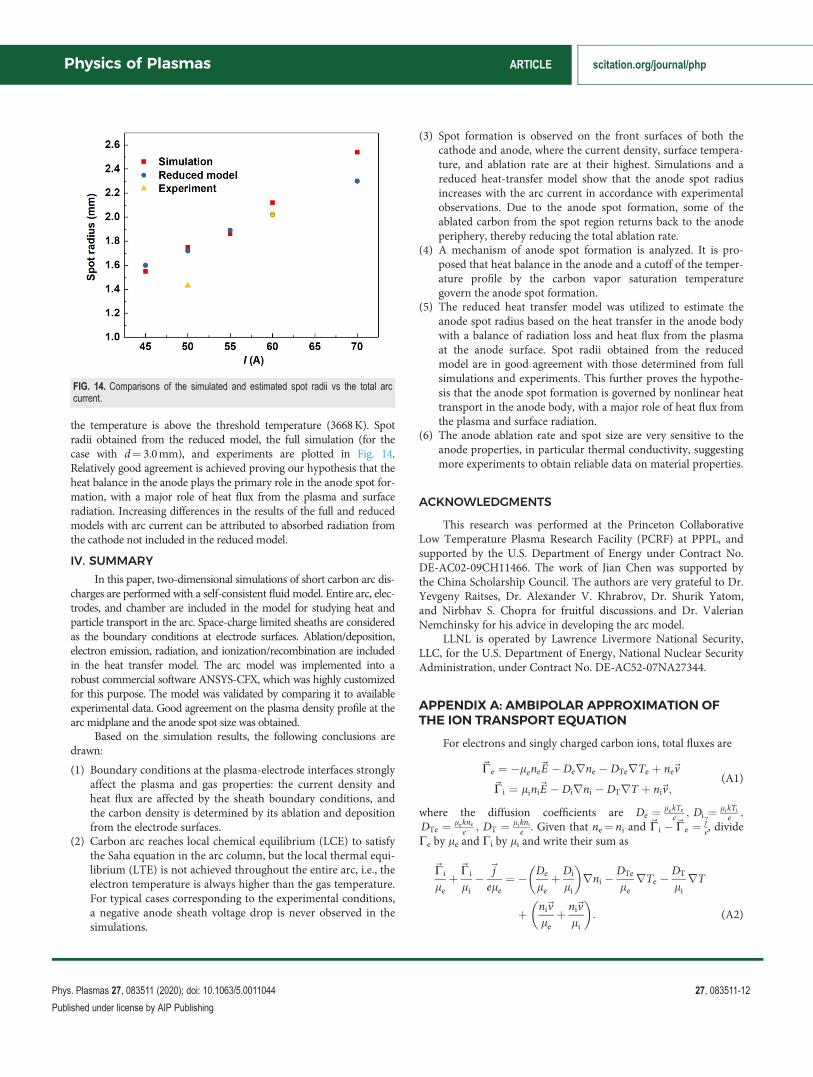
the temperature is above the threshold temperature (3668K). Spotradii obtained from the reduced model, the full simulation (for thecase with d¼ 3.0mm), and experiments are plotted in Fig. 14.Relatively good agreement is achieved proving our hypothesis that theheat balance in the anode plays the primary role in the anode spot for-mation, with a major role of heat flux from the plasma and surfaceradiation. Increasing differences in the results of the full and reducedmodels with arc current can be attributed to absorbed radiation fromthe cathode not included in the reduced model.
IV. SUMMARY
In this paper, two-dimensional simulations of short carbon arc dis-charges are performed with a self-consistent fluid model. Entire arc, elec-trodes, and chamber are included in the model for studying heat andparticle transport in the arc. Space-charge limited sheaths are consideredas the boundary conditions at electrode surfaces. Ablation/deposition,electron emission, radiation, and ionization/recombination are includedin the heat transfer model. The arc model was implemented into arobust commercial software ANSYS-CFX, which was highly customizedfor this purpose. The model was validated by comparing it to availableexperimental data. Good agreement on the plasma density profile at thearc midplane and the anode spot size was obtained.
Based on the simulation results, the following conclusions aredrawn:
(1) Boundary conditions at the plasma-electrode interfaces stronglyaffect the plasma and gas properties: the current density andheat flux are affected by the sheath boundary conditions, andthe carbon density is determined by its ablation and depositionfrom the electrode surfaces.
(2) Carbon arc reaches local chemical equilibrium (LCE) to satisfythe Saha equation in the arc column, but the local thermal equi-librium (LTE) is not achieved throughout the entire arc, i.e., theelectron temperature is always higher than the gas temperature.For typical cases corresponding to the experimental conditions,a negative anode sheath voltage drop is never observed in thesimulations.
(3) Spot formation is observed on the front surfaces of both thecathode and anode, where the current density, surface tempera-ture, and ablation rate are at their highest. Simulations and areduced heat-transfer model show that the anode spot radiusincreases with the arc current in accordance with experimentalobservations. Due to the anode spot formation, some of theablated carbon from the spot region returns back to the anodeperiphery, thereby reducing the total ablation rate.
(4) A mechanism of anode spot formation is analyzed. It is pro-posed that heat balance in the anode and a cutoff of the temper-ature profile by the carbon vapor saturation temperaturegovern the anode spot formation.
(5) The reduced heat transfer model was utilized to estimate theanode spot radius based on the heat transfer in the anode bodywith a balance of radiation loss and heat flux from the plasmaat the anode surface. Spot radii obtained from the reducedmodel are in good agreement with those determined from fullsimulations and experiments. This further proves the hypothe-sis that the anode spot formation is governed by nonlinear heattransport in the anode body, with a major role of heat flux fromthe plasma and surface radiation.
(6) The anode ablation rate and spot size are very sensitive to theanode properties, in particular thermal conductivity, suggestingmore experiments to obtain reliable data on material properties.
ACKNOWLEDGMENTS
This research was performed at the Princeton CollaborativeLow Temperature Plasma Research Facility (PCRF) at PPPL, andsupported by the U.S. Department of Energy under Contract No.DE-AC02-09CH11466. The work of Jian Chen was supported bythe China Scholarship Council. The authors are very grateful to Dr.Yevgeny Raitses, Dr. Alexander V. Khrabrov, Dr. Shurik Yatom,and Nirbhav S. Chopra for fruitful discussions and Dr. ValerianNemchinsky for his advice in developing the arc model.
LLNL is operated by Lawrence Livermore National Security,LLC, for the U.S. Department of Energy, National Nuclear SecurityAdministration, under Contract No. DE-AC52-07NA27344.
APPENDIX A: AMBIPOLAR APPROXIMATION OFTHE ION TRANSPORT EQUATION
For electrons and singly charged carbon ions, total fluxes are
~Ce ¼ �lene~E � Derne � DTerTe þ ne~v
~Ci ¼ lini~E � Dirni � DTrT þ ni~v;(A1)
where the diffusion coefficients are De ¼ lekTe
e ; Di ¼ likTi
e ;DTe ¼ lekne
e ; DT ¼ liknie . Given that ne¼ ni and ~C i �~Ce ¼
~je, divide
Ce by le and Ci by li and write their sum as
~Ci
leþ~Ci
li�~jele¼ � De
leþ Di
li
� �rni �
DTe
lerTe �
DT
lirT
þ ni~vleþ ni~v
li
� �: (A2)
FIG. 14. Comparisons of the simulated and estimated spot radii vs the total arccurrent.
Physics of Plasmas ARTICLE scitation.org/journal/php
Phys. Plasmas 27, 083511 (2020); doi: 10.1063/5.0011044 27, 083511-12
Published under license by AIP Publishing

Provided that r �~j ¼ 0 and neglecting the spatial variation of allthe transport coefficients, Eq. (A2) can be transformed to
leþli
lelir�~Ci¼�r�
leDiþliDe
lelirni
� �þleþli
lelir� ni~vð Þ
�r� DTe
lerTeþ
DT
lirT
� �: (A3)
The continuity equation for ions is r �~C i ¼ Si; hence,
r � ni~vð Þ ¼ r � leDi þ liDe
le þ lirni
� �þ Si
þr � liDTe
le þ lirTe þ
leDT
le þ lirT
� �: (A4)
Here, the third term (thermal diffusion term) at the right hand ofEq. (A4) is small compared to the first term [rTe
Teand rTT �
rnini; see
Figs. 3(a) and 4(b)] and can be neglected. Neglecting this termyields
r � ni~vð Þ ¼ r � Darnið Þ þ Si: (A5)
Note that solving ion diffusion in the form (A5) implies a modifica-tion of boundary conditions for ion flux. Ambipolar flux ~Ca
¼ �Darni is not physically equal to the actual ion flux, but~Ci ¼ lini~E � Dirni � DTrT þ ni~v . According to Eq. (A2) andneglecting the minor terms, the boundary condition on the ion fluxshould be given as
Darni ¼ �~j ieþ li
le þ li
~je: (A6)
APPENDIX B: INSIGNIFICANCE OF THE NETRADIATIVE LOSS FROM THE BULK PLASMA
This appendix shows the reasons why the radiative loss from arcplasma is omitted in our modeling. On one hand, experiment measure-ments showed that the radiation from arc plasma is much smaller com-pared to the radiation from the two electrodes.41 One the other hand,the simple estimation using the net emission approximation50 alsoproves that this term is insignificant. It is noted that although the netemission approximation is not accurate for the strong non-equilibriumcases, the net emission coefficient, eN, can be used as the first estimationof the net radiative loss from plasma.50 As shown in Fig. 5 of Ref. 51,the calculated eN of carbon plasma with a mean plasma radius of 2mmat atmospheric pressure varies from 2� 107 W/m3/sr to 108 W/m3/srin a temperature range (5000K to 10000K) that covers the typicalmaximum electron and heavy particle temperatures in carbon arcs.Therefore, the volumetric net radiative loss term, qr,N¼ 4peN, variesfrom 2.5� 108 W/m3 to 1.3� 109 W/m3.
Profiles of the energy source terms in the electron energytransport equation [Eq. (12)] along the axis for arcs withd¼ 1.5mm and I¼ 50 A are plotted in Fig. 15. As seen, the heatexchange and Joule heating are dominant in the bulk plasma, whichare of the order of magnitude of 1010 W/m3. qr,N is typically severalten times less than the heat exchange term, which means that theradiative loss in the bulk plasma for typical carbon arcs is not signif-icant for the energy transport of both electron and heavy particles.
Thus, radiative loss from the bulk plasma can be omitted in oursimulations. Note that the radiative loss from the bulk plasma isalso neglected in recent modeling studies of carbon arcs.28,29
APPENDIX C: SUFFICIENCY OF THECOMPUTATIONAL GRID RESOLUTION CHECK
In arc discharges, the gradients near the solid-fluid interfaceare much larger than those in the plasma. Some of them, such asthe charge density gradient, play an important role in conducting
FIG. 15. Profiles of the energy source terms in the electron energy transport equa-tion [Eq. (12)] along the axis for arcs with d¼ 1.5 mm and I¼ 50 A.
FIG. 16. Computational grid used for the cases with d¼ 1.5 mm.
Physics of Plasmas ARTICLE scitation.org/journal/php
Phys. Plasmas 27, 083511 (2020); doi: 10.1063/5.0011044 27, 083511-13
Published under license by AIP Publishing

the current.18 Thus, computational meshes were refined at thevicinity of the fluid–solid interface to guarantee a sufficient resolu-tion (see Fig. 16).
For the arc modeling in this paper, 36 252 grid elements forarcs with d¼ 1.5mm and 36 732 grid elements for d¼ 3.0mm wereused. The check of the grid resolution sufficiency is performed for atypical case with d¼ 1.5mm and I¼ 60A by doubling the elementnumber in both radial and axial dimensions. Profiles of heavy parti-cle and electron temperatures along the axis with the refined mesh(145 008 elements) and the present mesh (36 252 elements) are plot-ted in Figs. 17(a) and 17(b), respectively. Maximum deviationsbetween the two cases are 8% for the heavy particle temperatureand 3% for the electron temperature, showing a weak solutiondependence on the grid resolution.
APPENDIX D: CONTOURS OF PARAMETERSAND CURRENT STREAMLINES
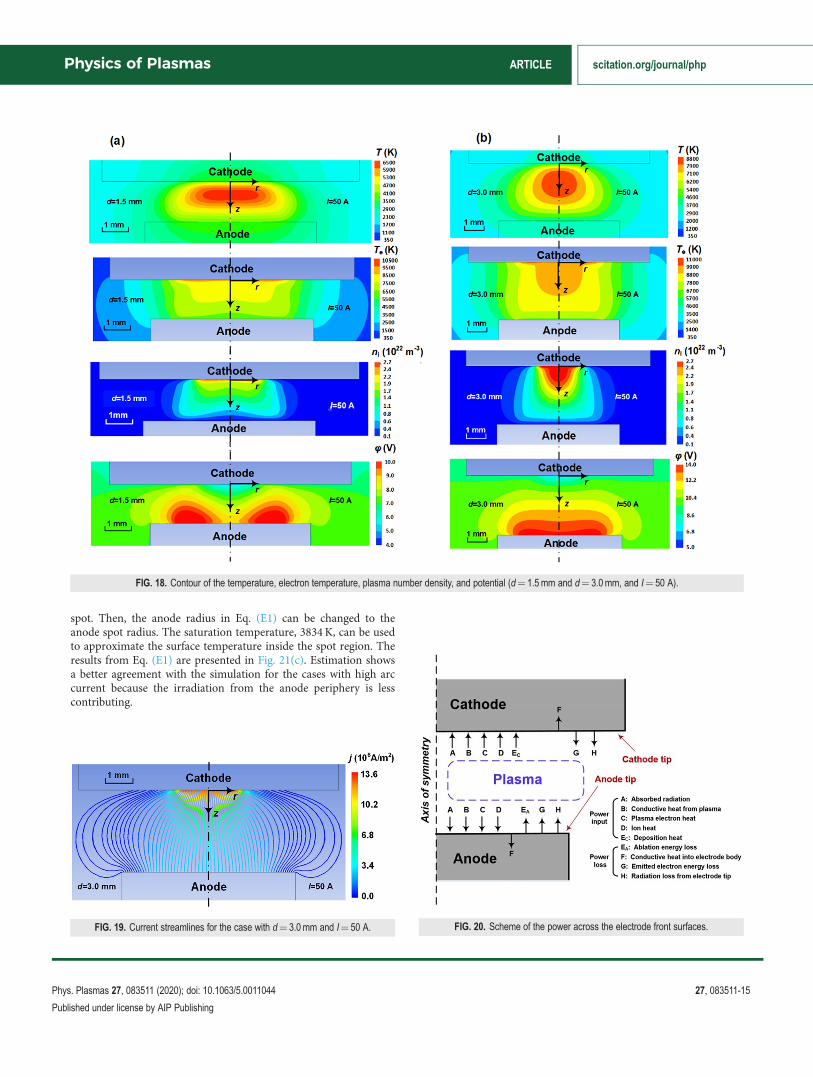
Contours of T, Te, ne, and u for the cases with I¼ 50 A,d¼ 1.5mm, and 3.0mm are presented in Fig. 18. The heavy particletemperature is high near the cathode, forming the arc core.
Gradients of T, Te, ne, and u show a strong correlation with the cur-rent density. The entire arc is constricted by the two spots and doesnot reach the LTE state. The plasma density is on the order of1022 m�3. For the cases with d¼ 1.5mm, the highest potential islocated not at the axis but a bit away because the maximum currentdensity is there.
Current streamlines for the case with d¼ 3.0mm and I¼ 50 Aare plotted in Fig. 19. It is seen that the current density near thespots is very high. Most of the current flows from the anode spot tothe cathode spot, and therefore, the arc is constricted.
APPENDIX E: ANALYSIS OF HEAT FLUXCOMPONENTS ON THE ANODE AND CATHODETIPS
In this appendix, the power balance on the anode and cathodetips is analyzed. As presented in Fig. 20, we categorized the powertransferred from the environment to the electrodes as the powerinput (including absorbed radiation, conductive heat from theplasma, plasma electron heat, ion heat, and carbon deposition heat)and the power from the electrodes to the environment as a powerloss (including ablation energy loss, conductive heat into the elec-trode body, emitted electron energy loss, and radiation loss fromthe electrode tip). Note that the conductive heat into the electrodebody is categorized as power loss because it finally dissipatesthrough the radiation from the electrode surfaces.
Here, components of total heat flux across the tips for thecases with d¼ 1.5mm and different arc currents are illustrated inFig. 21. At the anode tip, the surface temperature is sustainedmainly by the heat from plasma. Ion heat is small because theanode sheath voltage drop is positive. Absorbed radiation and con-ductive heat from plasma are several times less than the plasmaelectron heat flux introduced by electrons absorbed by the surface.As for the power loss, radiation loss from the anode tip and con-ductive heat into the anode body dominate. Since the conductiveheat flux into the anode body eventually dissipates by the radiationfrom the side surfaces, the power input is mostly converted intothe radiation loss from the whole anode surface. At the cathodetip, ion heat, conductive heat from the plasma, and absorbed radi-ation constitute comparable contributions. Reference 52 providedan analytical expression to estimate the absorbed heat across thecathode tip,
PA ¼ Face2rSBT4;
Fac ¼12
X �
ffiffiffiffiffiffiffiffiffiffiffiffiffiffiffiffiffiffiffiffiffiffiffiffiffiX2 � 4
r2cr2a
!vuut0B@
1CA ; (E1)
where Fac is the view factor, rSB¼ 5.67� 10�8 W/m2/K4 is theStephan–Boltzmann constant, the radii of the cathode and anodeare rc and ra, respectively, and X ¼ 1þ d2
r2aþ r2c
r2a. Note that uniform
anode surface temperature is assumed when using Eq. (E1), whichdoes not correspond to the flat-top temperature distribution overthe anode tip. However, some corrections can be made regarding arelatively constant temperature inside the spot. For a rough estima-tion of the cathode absorbed radiation, we can account for themajor contribution that comes from the irradiation of the anode
FIG. 17. Comparison of the heavy particle temperature (a) and electron tempera-ture (b) along the axis (r¼ 0). The results are obtained with the original (red) andrefined (blue) meshes, respectively. The refined mesh used a double element num-ber than the original mesh in both radial and axial dimensions.
Physics of Plasmas ARTICLE scitation.org/journal/php
Phys. Plasmas 27, 083511 (2020); doi: 10.1063/5.0011044 27, 083511-14
Published under license by AIP Publishing
spot. Then, the anode radius in Eq. (E1) can be changed to theanode spot radius. The saturation temperature, 3834K, can be usedto approximate the surface temperature inside the spot region. Theresults from Eq. (E1) are presented in Fig. 21(c). Estimation showsa better agreement with the simulation for the cases with high arccurrent because the irradiation from the anode periphery is lesscontributing.
FIG. 19. Current streamlines for the case with d¼ 3.0 mm and I¼ 50 A. FIG. 20. Scheme of the power across the electrode front surfaces.
FIG. 18. Contour of the temperature, electron temperature, plasma number density, and potential (d¼ 1.5 mm and d¼ 3.0 mm, and I¼ 50 A).
Physics of Plasmas ARTICLE scitation.org/journal/php
Phys. Plasmas 27, 083511 (2020); doi: 10.1063/5.0011044 27, 083511-15
Published under license by AIP Publishing

DATA AVAILABILITY
The data that support the findings of this study are availablefrom the corresponding author upon reasonable request.
REFERENCES1A. M. Cassell, J. A. Raymakers, J. Kong, and H. Dai, J. Phys. Chem. B 103, 6484(1999).
2D. Park, Y. H. Kim, and J. K. Lee, Carbon 41, 1025 (2003).3A. A. Puretzky, D. B. Geohegan, X. Fan, and S. J. Pennycook, Appl. Phys. A 70,153 (2000).
4S. Yatom, A. Khrabry, J. Mitrani, A. Khodak, I. Kaganovich, V. Vekselman, B.Stratton, and Y. Raitses, MRS Commun. 8, 842 (2018).
5S. Yatom, J. Bak, A. Khrabryi, and Y. Raitses, Carbon 117, 154 (2017).6L. Han, P. Krstic, I. Kaganovich, and R. Car, Carbon 116, 174 (2017).7S. Gershman and Y. Raitses, J. Phys. D: Appl. Phys. 49, 345201 (2016).8D. Zhang, K. Ye, Y. Yao, F. Liang, T. Qu, W. Ma, B. Yang, Y. Dai, and T.Watanabe, Carbon 142, 278 (2019).
9F. Liang, M. Tanaka, S. Choi, and T. Watanabe, J. Phys.: Conf. Ser. 518,012027 (2014).
10R. Sh. Islamov and E. N. Gulamov, IEEE Trans. Plasma Sci. 26, 7 (1998).11G. Yang and J. Heberiein, Plasma Sources Sci. Technol. 16, 765 (2007).12J. P. Trelles, Plasma Sources Sci. Technol. 23, 054002 (2014).
13M. S. Bieniek, P. G. Almeida, and M. S. Benilov, Plasma Sources Sci. Technol.27, 05LT03 (2018).
14F. G. Baksht, G. A. Dyuzhev, N. K. Mitrofanov, and S. M. Shkol’nik, Tech.Phys. 42, 35 (1997).
15T. Verreycken, P. Bruggeman, and C. Leys, J. Appl. Phys. 105, 083312 (2009).16J. P. Trelles, J. Phys. D: Appl. Phys. 49, 393002 (2016).17M. S. Benilov, Plasma Sources Sci. Technol. 23, 054019 (2014).18M. S. Benilov and A. Marotta, J. Phys. D: Appl. Phys. 28, 1869 (1995).19N. A. Almeida, M. S. Benilov, U. Hechtfischer, and G. V. Naidis, J. Phys. D:Appl. Phys. 42, 045210 (2009).
20I. L. Semenov, I. V. Krivtsun, and U. Reisgen, J. Phys. D: Appl. Phys. 49,105204 (2016).
21M. Baeva, R. Kozakov, S. Gorchakov, and D. Uhrlandt, Plasma Sources Sci.Technol. 21, 055027 (2012).
22A. B. Murphy, M. Tanaka, S. Tashiro, T. Sato, and J. J. Lowke, J. Phys. D: Appl.Phys. 42, 115205 (2009).
23T. Amakawa, J. Jenista, J. Heberlein, and E. Pfender, J. Phys. D: Appl. Phys. 31,2826 (1998).
24J. F. Bilodeau, J. Pousse, and A. Gleizes, Plasma Chem. Plasma Process. 18, 285(1998).
25K. C. Hsu, K. Etemadi, and E. Pfender, J. Appl. Phys. 54, 1293 (1983).26H. Guo, X. Zhang, J. Chen, H. Li, and K. Ostrikov, Sci. Rep. 8, 4783 (2018).27A. Khrabry, I. D. Kaganovich, V. Nemchinsky, and A. Khodak, Phys. Plasmas25, 013521 (2018).
FIG. 21. Power input and loss through the anode tip [(a) and (b)] and the cathode tip [(c) and (d)]. Estimation of the absorbed radiation [dashed line in (c)] is derived based onEq. (E1).52
Physics of Plasmas ARTICLE scitation.org/journal/php
Phys. Plasmas 27, 083511 (2020); doi: 10.1063/5.0011044 27, 083511-16
Published under license by AIP Publishing

28A. R. Mansour and K. Hara, J. Phys. D: Appl. Phys. 52, 105204 (2019).29M. Kundrapu and M. Keidar, Phys. Plasmas 19, 073510 (2012).30J. Haidar, J. Phys. D: Appl. Phys. 32, 263 (1999).31M. Baeva, M. S. Benilov, N. A. Almeida, and D. Uhrlandt, J. Phys. D: Appl.Phys. 49, 245205 (2016).
32M. S. Benilov, J. Phys. D: Appl. Phys. 53, 013002 (2020).33M. Baeva, Plasma Chem. Plasma Process. 37, 341 (2017).34W. Wang, M. Rong, A. B. Murphy, Y. Wu, J. W. Spencer, J. D. Yan, and M. T.C. Fang, J. Phys. D: Appl. Phys. 44, 355207 (2011).
35V. Vekselman, A. Khrabry, I. Kaganovich, B. Stratton, R. S. Selinsky, and Y.Raitses, Plasma Sources Sci. Technol. 27, 025008 (2018).
36J. Annaloro, V. Morel, A. Bultel, and P. Omaly, Phys. Plasmas 19, 073515(2012).
37N. A. Almerida, M. S. Benilov, and G. V. Naidis, J. Phys. D: Appl. Phys. 41,245201 (2008).
38Ansys Inc., Ansys CFX-Modelling Guide (USA, 2011), Chap. 10, seewww.ansys.com.
39J. Pousse, B. Chervy, J. Bilodeau, and A. Gleizes, Plasma Chem. PlasmaProcess. 16, 605 (1996).
40R. W. Powell and F. H. Schofield, Proc. Phys. Soc. 51, 153 (1939).
41V. Vekselman, M. Feurer, T. Huang, B. Stratton, and Y. Raitses, Plasma SourcesSci. Technol. 26, 065019 (2017).
42R. J. Thorn and G. H. Winslow, J. Chem. Phys. 26, 186 (1957).43M. D. Campanell and M. V. Umansky, Plasma Sources Sci. Technol. 26,124002 (2017).
44M. D. Campanell, A. V. Khrabrov, and I. D. Kaganovich, Phys. Rev. Lett. 108,235001 (2012).
45N. S. Chopra and Y. Raitses, in Proceeding of 61st Annual Meeting of the APSDivision of Plasma Physics, Fort Lauderdale, 21–25 October 2019.
46V. Vekselman, Y. Raitses, and M. N. Shneider, Phys. Rev. E 99, 063205 (2019).47A. Khrabry, I. D. Kaganovich, A. Khodak, V. Vekselman, and T. Huang,“Model of a transition from low to high ablation regime in a carbon arc,”J. Appl. Phys. (submitted).
48S. M. Shkol’nik, Plasma Sources Sci. Technol. 20, 013001 (2011).49A. Khrabry, I. D. Kaganovich, V. Nemchinsky, and A. Khodak, Phys. Plasmas25, 013522 (2018).
50J. J. Lowke, J. Quant. Spectrosc. Radiat. Transfer 14, 111 (1974).51R. Hannachi, S. Ben Nasr, Y. Cressault, P. Teulet, and L. B�eji, J. Phys. D: Appl.Phys. 52, 095203 (2019).
52J. Ng and Y. Raitses, J. Appl. Phys 117, 063303 (2015).
Physics of Plasmas ARTICLE scitation.org/journal/php
Phys. Plasmas 27, 083511 (2020); doi: 10.1063/5.0011044 27, 083511-17
Published under license by AIP Publishing