validating a standardized approach to the taylor
TRANSCRIPT

Running head: TAP VALIDATION 1
Validating a Standardized Approach to the Taylor Aggression Paradigm
in press at Social Psychological and Personality Science
David S. Chester*, Emily N. Lasko
Department of Psychology, Virginia Commonwealth University, USA
Main Text Word Count: 4,893
*Correspondence should be addressed to:
David S. Chester
302 Thurston House
Virginia Commonwealth University
Richmond, VA, 23284, USA
1-804-828-7624

TAP VALIDATION 2
Abstract
The Taylor Aggression Paradigm (TAP) is a frequently-used laboratory measure
of aggression. However, the flexibility inherent in its implementation and analysis can
undermine its validity. To test whether the TAP is a valid aggression measure
irrespective of this flexibility, we conducted two preregistered studies (Study 1 N = 177,
Study 2 N = 167) of a standardized version of the TAP. Across both studies, TAP scores
showed agreement with other laboratory aggression measures, were magnified by an
experimental provocation manipulation, and were associated with traits typically linked
to aggressive behavior. Mixed evidence was found for the external and discriminant
validity of the task. Individual responses largely loaded onto a single component,
suggesting that the aggregate scoring approach accurately represents the underlying
data structure. These results provide preliminary support for the internal validity of this
TAP approach and highlight the utility of preregistration in psychometric research.
Keywords: aggression, Taylor Aggression Paradigm, preregistration, validation,
Competitive Reaction-Time Task

TAP VALIDATION 3
Introduction
The study of aggressive behavior has historically been a challenging endeavor,
entailing substantial ethical, logistical, and theoretical hurdles. The Taylor Aggression
Paradigm (TAP; Taylor, 1967) arose from these early attempts at operationalization.
Now past its 50th year, the task has made great contributions to psychological science
but has also received substantive criticism. In the present research, we employed
preregistration to validate a single variant of the TAP in the absence of methodological
and quantitative flexibility.
The Taylor Aggression Paradigm: A Brief History and Overview
As stated by Taylor, “In order to investigate aggression in the laboratory it is
necessary to have an effective method for inciting aggression and for objectively
measuring the aggressive responses that follow” (pp. 297, Epstein & Taylor, 1967;
Taylor 1967). To extend laboratory aggression measurement beyond hypotheticals,
self-reports, and projective tests, Taylor simulated a provocative social experience in
the lab and objectively measured aggressive responses. In the original TAP,
participants selected the intensity or duration of an electric shock to administer to an
opponent, who ostensibly did the same for them (Epstein & Taylor, 1967; Shortell,
Epstein, & Taylor, 1970; Taylor, 1967). Participants then repeatedly competed against
their opponent to flip a switch faster in response to a cue. If they lost the competition,
participants received a shock of their opponent’s choosing. Participants could see the
level of the shock that their opponent selected for them, which allowed the
experimenters to manipulate the level of provocation experienced by participants.

TAP VALIDATION 4
Today, the TAP is most-frequently implemented as a computer program that can
administer noise blasts through headphones instead of shocks delivered through
electrodes (Bond & Lader, 1986; Bushman, 1995). In this new approach, participants
can set the duration and volume of these noise blasts and these settings serve as the
laboratory operationalization of aggression. The TAP often includes multiple trials in
order to provide a more reliable estimate of aggressive behavior. This task has gone on
to serve as a mainstay aggression measure, even being modified for use in the MRI
brain scanning environment to allow for the investigation of the neural basis of
aggression (e.g., Chester & DeWall, 2016). The original TAP publication (Taylor, 1967)
has been used widely with 731 scholarly papers citing this paper from 1967-2017
(citation estimates from Google Scholar). However, such popularity has not been
reached without criticism.
Challenges and Critiques
Laboratory measures of aggression, such as the TAP, have been categorically
criticized for lacking many things (e.g., construct validity, ecological validity,
experimental realism; Ferguson, Smith, Miller-Stratton, Fritz, & Heinrich, 2008; Tedeschi
& Quigley, 1996, 2000). Rebuttals to these critiques abound, highlighting the TAP’s
convergent, external, and discriminant validity (Anderson & Bushman, 1997; Giancola &
Parrott, 2008; Giancola & Zeichner, 1995). More recently, the TAP has been criticized
for a lack of standardization between and within laboratories (Elson, Mohseni, Breuer,
Scharkow, & Quandt, 2014). For instance, some studies only analyze volume or
duration settings (not both) or the first or second trial (not all trials) of the task. The

TAP VALIDATION 5
number of trials in the task can also vary widely. Such flexibility can be a strength,
allowing researchers to tailor the task to a given study or hypothesis.
However, this methodological and quantitative flexibility can also be problematic
if researchers test their hypotheses using multiple scoring and analytic strategies and
then present the result that best fits their hypothesis as coming from a singular, pre-
planned test (Simmons, Nelson, & Simonsohn, 2011). Such ‘researcher degrees-of-
freedom’ capitalize on chance and increase the likelihood of type 1 errors. Fortunately,
preregistration provides a simple solution to ensure that flexible measures are not
abused. Researchers publicly specify their hypotheses, methods, and planned analyses
before data analysis begins, preventing any flexible and exploratory analyses from
being reported as singular and confirmatory (Wagenmakers, Wetzels, Borsboom, van
der Maas, & Kievit, 2012). This preregistration technique can then be applied to validate
the TAP, independent of such flexibility.
Validation Approaches to the TAP
There are many ways to demonstrate that the TAP is a valid and useful
laboratory aggression measure. First, TAP scores should correspond to other measures
of physically aggressive behavior and tendencies (e.g., laboratory aggression tasks,
self-report aggression questionnaires), suggesting convergent validity of the task
(Giancola & Zeichner, 1995). Second, the TAP should be responsive to situational
factors known to magnify aggressive behavior (e.g., provocation; Giancola & Parrott,
2008), and correspond to personality traits that are reliably-linked to aggression (e.g.,
antagonism: Vize et al., in press), suggesting construct validity of the task. Third,
variables that are distinct from physically harming others (e.g., verbally harming others,

TAP VALIDATION 6
harming the self) should not correspond to TAP scores, thus demonstrating the task’s
discriminant validity (Bernstein, Richardson, & Hammock, 1987). Fourth, as an index of
the task’s potential external validity, TAP scores should correspond to real-world acts of
physical aggression (Anderson & Bushman, 1997). If a preregistered version of the TAP
is shown to exhibit these five qualities, then this task can be considered a valid
aggression measurement, beyond concerns regarding the task’s flexibility. To
demonstrate the TAP’s validity outside the context of methodological and quantitative
flexibility, we conducted two preregistered studies. In both studies, a 25-trial version of
the TAP was administered alongside variables that would provide support for the forms
of validity detailed above.
Study 1
The preregistration plan for this study is available online
(https://osf.io/x7rjb/register/565fb3678c5e4a66b5582f67), as are corresponding data,
analysis code, and materials (https://osf.io/a2wft/files/).
Methods
Participants
A power-analysis using G*Power 3.1 for an effect size of r = .25, d = .47 (an
estimate based on mean TAP score correlations with trait physical aggression from
Webster et al., 2014), an alpha level of .05, and 90% power returned a planned sample
size of 160. In an attempt to recruit at least 160 participants who did not meet
exclusionary criteria, we recruited 211 undergraduate students from an introductory
psychology subject pool, ceasing recruitment at the end of the academic year in which
the study took place. Of these 211 participants, 25 were missing data necessary for our

TAP VALIDATION 7
confirmatory analyses and 9 others expressed ‘total disbelief’ of our deception on our
post-debriefing questionnaire. Final participants were therefore 177 undergraduates
(68.4% female, 31.6% male; Age: M = 20.01, SD = 4.83, range: 18-55). Participants’
racial composition was 45.8% White, 19.8% African-American, 18.1% Asian-American,
and 16.4% Other. The sample was 13.0% Hispanic and 87.0% Non-Hispanic.
Participants were compensated with course credit.
Measures
Taylor Aggression Paradigm. The version of the TAP used in both studies took
the form of the computerized Competitive Reaction Time Measure of Aggression,
version 2.9.9.9 for PC (Bushman & Baumeister, 1998). For each of the 25 trials of the
task, participants began by setting the volume (60-105 decibels, in 5 decibel
increments) and duration (0 – 5 seconds, in 0.5 second increments) of the noise blasts.
Noise blast volumes were calibrated with a decibel reader to assure fidelity to the
displayed decibel level. Participants could also set the volume or duration to 0 to
prevent any noise blast from being administered. After participants entered their noise
blast settings, they competed against their opponent (i.e., a same-sex VCU
undergraduate) to press click a mouse button faster in response to a cue. If participants
lost a given trial (which they did approximately 50% of the time), they were blasted with
noise at the volume and duration that their opponent ostensibly determined ahead of
time. Wins and losses were randomized across trials (yet this random order was held
constant across participants). Participants’ opponents began the task by selecting the
highest noise settings. To ensure the task’s realism, participants lost every trial that they

TAP VALIDATION 8
did not respond to within two seconds. Further, trials would not advance if participants
simply clicked the mouse repeatedly on the colored square.
Voodoo Doll Aggression Task. The VDT takes advantage of the innate human
tendency to imbue certain objects with symbolic properties (Rozin, Millman, & Nemeroff,
1986), asking participants to harm a representation of a real person (DeWall et al.,
2013). In this task, participants were instructed to view a computer image of a plush
human doll as a symbolic representation of their actual essay evaluator. Participants
viewed what the doll would look like with an array of sharp pins stuck in it. Then,
participants typed the number of virtual, sharp pins that they wished to stick into the doll
(from 0 to 51 pins).
Brief Aggression Questionnaire. The 12-item BAQ is a subset of items from
the 29-item Buss-Perry Aggression Questionnaire (Webster et al., 2014). The BAQ
possesses a four factor structure with 3-item subscales measuring each construct:
anger, hostility, physical aggression, and verbal aggression. Participants completed the
full, 29-item Buss-Perry Aggression Questionnaire, and therefore the BAQ.
Aggressive Motives Scale. The 6-item AMS is a retrospective, self-report
measure of whether participants’ aggressive behavior on the TAP reflected instrumental
or vengeful-harm motives (Anderson & Murphy, 2003). This scale allowed us to
disentangle whether participants acted aggressively on the TAP out of a simply
competitive or truly aggressive motivation.
Non-Suicidal Self-Injury Assessment Tool. The 6-item NSSIAT measures
state-level desires to engage in self-harm (Chester, Whitt, Davis, & DeWall, 2017).

TAP VALIDATION 9
History of Physical Fights Scale. This open-ended measure simply asked
participants how many physical fights they had been in, in the past 5 years and the past
year. This measure allowed for the assessment of real-world acts of aggressive
behavior.
Provocation Manipulation Check. The 7-item PMC (Denson, von Hippel,
Kemp, & Teo, 2010) measured the extent to which the essay feedback provocation
manipulation made participants feel provoked and insulted.
Procedure
Participants arrived individually to the laboratory, where they read and signed an
informed consent form. Afterwards, participants were screened for sensitive hearing,
due to the study’s use of noise blasts. In order to experimentally-induce interpersonal
provocation, this study used a validated essay evaluation paradigm in which participants
received harsh or positive feedback on an essay (Bushman & Baumeister, 1998;
Chester & DeWall, 2017). The essay evaluation contained either negative (8/35 points,
“One of the WORST essays I’ve EVER read!”) or positive (33/35 points, “Great essay!”)
feedback, as determined by random assignment.
Laboratory aggression tasks. The experimenter then directed participants to
the computer to complete the TAP, describing it as a measure of reaction time. The
experimenter explained the task to the participant, gave them a sample of a moderately
loud noise blast, and then left to check on the fictitious partner’s internet connection to
the participant. The experimenter returned quickly and instructed the participant to begin
the task. After completing the TAP, the experimenter returned to the participant with a
plate of crackers and a bottle of hot sauce to conduct the Hot Sauce Aggression Task

TAP VALIDATION 10
(Lieberman, Solomon, Greenberg, & McGregor, 1999). Participants were informed that
they would now complete a measure of pain regulation, in which they would eat spicy
hot sauce. After the participant added their desired level of hot sauce, the experimenter
returned and placed a second plate of crackers in front of the participant and asked
them if they would help by applying hot sauce to these crackers, which their essay
evaluation partner would have to eat. After a 60-second absence, the experimenter took
both plates and weighed them away from the participant. Participants then completed
the VDT and questionnaires.
Suspicion probe and debriefing. Participants completed a funneling suspicion
interview, were debriefed, and retrospectively reported their level of suspicion during the
study on a questionnaire.
Results
Deviations from Preregistration Plan
We were unable to achieve the 50% gender equity that we outlined in our
preregistration plan and we did not enact the outlier exclusion rule, as this proved to be
far too conservative and would have led to the exclusion of a substantial portion of our
sample. We excluded participants who expressed total disbelief in our deception
procedures, which was not outlined in our preregistration. Confidence intervals were
calculated conventionally, rather than via nonparametric bootstrapping.
Descriptive Statistics
We scored the TAP by calculating the mean of all 50 individual measurements of
the task (2 settings per trial x 25 trials; Table 1). The voodoo doll pin count and number
of physical fights were zero-inflated and positively-skewed (Table 1), which required

TAP VALIDATION 11
statistical modeling that specified a Poisson distribution (as recommended by DeWall et
al., 2013). Internal consistency was adequate for all self-report measures, except the
Verbal subscale of the BAQ. Zero-order correlations between key study variables are
summarized in Supplemental Table 1.
Table 1. Descriptive statistics for Study 1 confirmatory variables: Aggressive Motives
Scale (AMS), Brief Aggression Questionnaire (BAQ), History of Physical Fights Scale
(HPFS) - past five years and past one year, Hot Sauce Aggression Task (HSAT), Non-
Suicidal Self-Injury Assessment Tool (NSSIAT), Provocation Manipulation Check
(PMC), Taylor Aggression Paradigm (TAP), Voodoo Doll Task (VDT).
M SD Range % 0 α Skew Kurtosis
AMS - Instrument 2.60 1.62 1-7 - 0.95 0.12
AMS - Revenge 2.28 1.40 1-6.25 - .83 0.95 -0.12
BAQ - Physical 2.86 1.45 1-7 - .70 0.58 -0.59
BAQ - Verbal 3.66 1.24 1-6.67 - .59 0.23 -0.45
HPFS - Past Five 0.71 1.29 0-7 66.70 - 2.24 5.46
HPFS - Past Year 0.17 0.53 0-4 88.10 - 3.93 18.98
HSAT 3.82 3.90 0-20 10.70 - 1.67 2.90
NSSIAT 1.21 0.86 1-7.67 - .97 5.47 32.77
PMC 2.47 1.93 1-7 - .96 1.24 0.25
TAP 5.10 1.99 0-10 1.70 .98 -0.36 0.48
VDT 7.41 12.04 0-51 36.20 - 2.17 4.37
Confirmatory Tests

TAP VALIDATION 12
Group comparisons. Participants who were assigned to the negative feedback
condition (N = 87) reported greater levels of provocation due to their essay feedback
than participants that received positive feedback (N = 90), t(175) = 9.75, p < .001, d =
1.47 [1.20, 1.80], and had higher TAP scores, t(175) = 3.56, p < .001, d = 0.54 [0.24,
0.83; Figure 1]. Males (coded as 1) did not have higher TAP scores than females
(coded as 0), t(175) = -0.93, p = .356, d = -0.14 [-0.44, 0.16]. Supplemental Table 2
summarizes gender comparisons in TAP scores within each provocation condition and
on self-reported aggression variables.
Figure 1. Violin plots depicting the distributions of TAP scores by essay feedback
condition, from Study 1.

TAP VALIDATION 13
Convergent validity. TAP scores were positively associated with the amount of
hot sauce participants gave to their partner, r(175) = .18 [.03, .32], p = .016 (Figure 2),
and with the number of voodoo doll pins (Figure 2, Table 2). TAP scores were
unassociated with trait physical aggression, r(175) = .11 [-.04, .25], p = .139, and
positively associated with revengeful aggression motivations, r(175) = .41 [.28, .56], p <
.001.
Figure 2. Scatterplots depicting Study 1’s positive associations between mean TAP
scores and voodoo doll pin counts and hot sauce weights, in grams, directed towards
participants’ essay evaluators (with and without logarithmic transformation).

TAP VALIDATION 14
Table 2. Correlations between TAP scores and VDT pin counts from Study 1’s
generalized linear modeling specifying both Poisson (confirmatory) and negative
binomial (exploratory) distributions.
Poisson Regression Negative Binomial
B [95% CI] Χ2 p B [95% CI] Χ2 p
0.30 [0.27, 0.33] 409.32 < .001 0.38 [0.28, 0.48] 55.46 < .001
External & discriminant validity. Offering mixed evidence of the TAP’s external
validity, TAP scores were unassociated with the number of physical fights participants
had been in over the past 5 years, yet were positively associated with those over the
past year (Table 3). TAP scores were unassociated with trait verbal aggression, r(175) =
.10 [-.05, .24], p = .204, yet unexpectedly were positively associated with current self-
harm tendencies, r(175) = .16 [.01, .30], p = .032.
Table 3. Correlations between TAP scores and past physical fight frequencies from
Study 1’s generalized linear modeling specifying both Poisson (confirmatory) and
negative binomial (exploratory) distributions.
Internal consistency. The 50 individual measurements of the TAP (25 trials x 2
responses per trial) exhibited excellent internal consistency (Table 1). A principal
components analysis (PCA), with direct oblimin rotation (which allows the extracted
components to correlate with one another), was conducted on all 50 TAP settings. The
Predictor Poisson Regression Negative Binomial
B [95% CI] Χ2 p B [95% CI] Χ2 p
Past 5 Years -0.00 [-0.09, 0.08] 0.01 .934 -0.00 [-0.12, 0.11] 0.00 .951
Past Year 0.23 [0.04, 0.42] 5.66 .017 0.23 [0.02, 0.44] 4.56 .033

TAP VALIDATION 15
data exhibited a single-component structure, as evidenced by a large initial component,
which explained almost half of the variance in TAP responses (Figure 3; Supplemental
Table 3).
Figure 3. Scree plot of eigenvalues depicting a single component solution for all 50 TAP
responses from Study 1.
Exploratory Analyses
Specificity of hot sauce measure to aggression. To assess whether TAP
scores were associated with greater hot sauce allocations overall, we correlated TAP
scores with participants hot sauce allocations to themselves. Participants’ TAP scores
were associated with greater hot sauce allocations towards themselves, r(175) = .31
[.17, .44], p < .001.

TAP VALIDATION 16
Transformation of aggression variables. Applying logarithmic transformations
(after adding 1 to all values to allow for the transformation of 0 values) reduced the
skewness and kurtosis of both the voodoo doll pin count and hot sauce weights (Table
4). Transformed voodoo doll pin counts remained significantly associated with TAP
scores, r(175) = .38 [.25, .50], p < .001, whereas transformed hot sauce weights did not,
r(175) = .12 [-.03, .26], p = .112.
Table 4. Study 1 distribution statistics for the hot sauce weights and voodoo doll pins
counts after logarithmic transformation. Parenthesized values represent distribution
statistics prior to transformation. Normality was assessed via the Shapiro-Wilk Normality
Test, df = 177, statistical significance indicates non-normality.*p < .001
Skew Kurtosis Non-Normality
Hot Sauce Weights 0.13(1.67) -0.65 (2.90) 0.96*(0.82*)
Voodoo Doll Pins 0.55(2.17) -1.04(4.37) 0.86*(0.66*)
Study 2
Study 2 was conducted in order to counterbalance the order of the aggression
measures and to include additional construct validity measures. The preregistration plan
for this study is available online
(https://osf.io/ca237/register/565fb3678c5e4a66b5582f67), as are corresponding data,
analysis code, and materials (https://osf.io/a2wft/files/).
Methods
Participants
In an attempt to recruit at least 160 participants who did not meet exclusionary
criteria, we recruited 193 undergraduates from an introductory psychology subject pool,

TAP VALIDATION 17
ceasing recruitment at the end of the academic semester in which the study took place.
Of these 193 participants, 25 were missing data necessary for our confirmatory
analyses1 and 4 others expressed ‘total disbelief’ on our post-debriefing questionnaire
(3 were also missing data). Final participants were therefore 167 undergraduates
(67.1% female, 32.9% male; Age: M = 19.16, SD = 2.38, range: 18-40). Participants’
racial composition was 44.3% White, 19.8% African-American/Black, 19.2% Asian-
American, 15.6% Other, 0.6% Native American, and 0.6% declined to respond. The
sample was 12.9% Hispanic and 87.1% Non-Hispanic. Participants were compensated
with course credit.
Measures
Five Factor Narcissism Inventory. The 60-item FFNI was developed to
decomposes narcissistic traits into 15 subfacets that form the broader narcissism
dimensions (Glover, Miller, Lynam, Crego, & Widiger, 2012; Miller et al., 2016). Critical
to this study was the antagonism facet, which is constructed by aggregating the
arrogance, distrust, entitlement, exploitativeness, lack of empathy, manipulativeness,
reactive anger, and thrill-seeking facets.
NEO - Five Factor Inventory. The 60-item NEO-FFI quantifies individuals’ levels
of agreeableness, conscientiousness, extraversion, neuroticism, and openness to
experience (12 items per factor; Costa & MacCrae, 1992).
Self-Report Psychopathy Scale - III. The 64-item SRP quantifies individuals’
psychopathic traits (Paulhus, Neumann, & Hare, 2009).
1Excepting missing data from the Self-Report Psychopathy Scale, Five Factor Narcissism Inventory, and Short Dark Triad 3 questionnaire, due to an excessive amount of missing data.

TAP VALIDATION 18
Short Dark Triad 3. The 27-item SD3 is a brief measure of the “dark triad” (i.e.,
Machiavellianism, narcissism, and psychopathy; Jones & Paulhus, 2014).
Procedure
The informed consent and provocation manipulation procedures were identical to
Study 1. Based on a pre-randomized list that experimenters viewed, participants
completed four aggression tasks in six different counterbalancing orders (determined
randomly) and each participant was randomly assigned to one of these task orders
(Table 5).
Table 5. Counterbalancing orders for the aggression tasks: Buss-Perry Aggression
Questionnaire (BPAQ), Hot Sauce Aggression Task (HSAT), Taylor Aggression
Paradigm (TAP), Voodoo Doll Task (VDT).
Order I II III IV V VI
First HSAT HSAT BPAQ TAP TAP VDT
Second BPAQ BPAQ VDT VDT BPAQ BPAQ
Third VDT TAP TAP HSAT VDT TAP
Fourth TAP VDT HSAT BPAQ HSAT HSAT
Participants then completed a battery of personality questionnaires and identical
debriefing and suspicion probe procedures to Study 1.
Results
Deviations from Preregistration Plan
The deviations from the preregistration plan that occurred in Study 1 were
likewise present in Study 2 due to identical considerations.
Descriptive Statistics

TAP VALIDATION 19
Descriptive statistics and internal consistency estimates are provided in Table 6.
Considerable amounts of data were missing from the personality questionnaires
because of time constraints (Table 6). The Aggression Motives Scale was incorrectly
administered and the Crime and Analogous Behavior scale had 132 missing datapoints,
so both of these measures were excluded from analysis. Zero-order correlations
between all study variables are included in Supplemental Table 4.
Table 6. Descriptive statistics for Study 2 confirmatory variables: Buss-Perry Aggression
Questionnaire (BPAQ), History of Physical Fights Scale (HPFS) - past five years and
ever, Hot Sauce Aggression Task (HSAT), Non-Suicidal Self-Injury Assessment Tool
(NSSIAT), Provocation Manipulation Check (PMC), Taylor Aggression Paradigm (TAP),
Voodoo Doll Task (VDT).
M SD Range % 0 α Skew Kurtosis N Missing
BPAQ - Physical 2.57 0.96 1.00-5.22 - .79 0.52 -0.43 0
BPAQ - Verbal 3.56 1.15 1.00-6.60 - .78 0.19 -0.54 0
FFNI - Antagonism 2.24 0.67 1.09-3.94 - .94 -0.48 -0.10 94
HPFS - Ever 2.93 10.36 0.00-100 47.9 - 7.12 57.49 0
HPFS - Past Five 1.14 4.11 0.00-40 68.9 - 7.30 60.79 0
HSAT 3.73 3.59 0.00-20 7.2 - 1.96 4.60 0
NEO - Agreeable 3.63 0.45 2.50-4.75 - .69 0.00 -0.26 0
NSSIAT 1.07 0.29 1.00-3.17 - .91 5.05 28.33 0
PMC 3.00 1.46 1.00-6.67 - .88 0.42 -0.71 9
SD3 - Mach 2.78 0.76 1.00-4.89 - .83 0.23 0.24 85

TAP VALIDATION 20
SRP 2.14 0.43 1.31-3.47 - .90 0.46 0.17 62
TAP 4.85 2.19 0-10 1.2 .98 0.07 0.02 0
VDT 4.44 9.27 0-51 45.5 - 3.43 12.86 0
Confirmatory Tests
Group comparisons. Participants who were assigned to the negative feedback
condition (N = 84) reported greater levels of provocation due to their essay feedback
than participants in the positive feedback condition (N = 83), t(156) = 6.80, p < .001, d =
1.09 [0.79, 1.43], and had higher TAP scores, t(165) = 2.10, p = .037, d = 0.33 [0.02,
0.63; Figure 4]. Again, males (coded as 1) did not have higher TAP scores than females
(coded as 0), t(165) = -0.09, p = .931, d = -0.01 [-0.32, 0.29]. Supplemental Table 5
summarizes gender comparisons in TAP scores within each provocation condition and
on self-reported aggression variables.
Figure 4. Violin plots depicting the distributions of TAP scores by essay feedback
condition, from Study 2.

TAP VALIDATION 21
Convergent validity. TAP scores were positively associated with the amount of
hot sauce participants gave to their partner in the taste test, r(165) = .29 [.15, .42], p <
.001 (Figure 5), and with the number of pins stuck in the voodoo doll that represented
their partner (Figure 5, Table 7).
Figure 5. Scatterplots depicting Study 2’s positive associations between mean TAP
scores and voodoo doll pin counts and hot sauce weights, in grams, directed towards
participants’ essay evaluators (with and without logarithmic transformation).

TAP VALIDATION 22
Table 7. Correlations between TAP scores and VDT pin counts from Study 2’s
generalized linear modeling specifying both Poisson (confirmatory) and negative
binomial (exploratory) distributions modeling.
Poisson Regression Negative Binomial
B [95% CI] Χ2 p B [95% CI] Χ2 p
0.25 [0.22, 0.29] 232.13 < .001 0.27 [0.19, 0.36] 39.49 < .001
Personality traits. As in Study 1, TAP scores were unassociated with trait
physical aggression, r(165) = .15 [-.00, .30], p = .055. Further, TAP scores were
negatively associated with trait agreeableness, r(165) = -.19 [-.33, -.04], p = .015,

TAP VALIDATION 23
positively associated with the antagonistic facet of trait narcissism, r(71) = .40 [.19, .58],
p < .001, and unassociated with Machiavellianism, r(80) = .16 [-.06, .36], p = .143, or
psychopathy, r(103) = .08 [-.11, .27], p = .393.
External and discriminant validity. TAP scores were unassociated with the
number of physical fights participants had been in over the past 5 years, yet TAP scores
were positively associated with fights that participants had ever been in (Table 8). TAP
scores were unassociated with trait verbal aggression, r(165) = .12 [-.03, .27], p = .134,
and current self-harm tendencies2, r(165) = .03 [-.12, .18], p = .691.
Table 8. Correlations between TAP scores and past physical fight frequencies from
Study 2’s generalized linear modeling specifying both Poisson (confirmatory) and
negative binomial (exploratory) distributions.
Internal consistency. The 50 individual measurements of the TAP (25 trials x 2
responses per trial) exhibited excellent internal consistency (Table 6) and a PCA
exhibited a single-component structure, as in Study 1 (Figure 6, Supplemental Table 6).
Figure 6. Scree plot of eigenvalues depicting a single component solution for all 50 TAP
responses from Study 2.
2 NSSIAT responses in Study 2 were provided along a 1-5 response scale, instead of the 1-9 response scale used in Study 1.
Predictor Poisson Regression Negative Binomial
B [95% CI] Χ2 p B [95% CI] Χ2 p
Past 5 Years 0.03 [-0.04, 0.09] 0.74 .391 0.19 [-0.06, 0.10] 0.23 .628
Ever 0.05 [0.01, 0.09] 6.82 .009 0.40 [-0.03, 0.12] 1.38 .240

TAP VALIDATION 24
Exploratory Analyses
Specificity of hot sauce measure to aggression. Unlike Study 1, participants’
TAP scores were unassociated with greater hot sauce allocations towards themselves,
r(165) = .14 [-.01, .29], p = .075.
Transformation of aggression variables. Applying logarithmic transformations
reduced the skewness and kurtosis of both the voodoo doll pin count and hot sauce
weights (Table 9). Transformed voodoo doll pin counts remained significantly
associated with TAP scores, r(165) = .32 [.18, .45], p < .001, as did transformed hot
sauce weights, r(165) = .26 [.11, .40], p = .001.

TAP VALIDATION 25
Table 9. Study 2 distribution statistics for the hot sauce weights and voodoo doll pins
counts after logarithmic transformation. Parenthesized values represent distribution
statistics prior to transformation. Normality was assessed via the Shapiro-Wilk Normality
Test, df = 167.*p < .001
Skew Kurtosis Non-Normality
Hot Sauce Weights 0.12(1.96) -0.25(-0.84) 0.97*(0.80*)
Voodoo Doll Pins 0.98(3.43) -0.18(12.86) 0.82*(0.52*)
Order Effects
A one-way ANOVA revealed that TAP scores were unaffected by the order of
aggression tasks, F(5, 160) = 1.30, p = .267.
Internal Meta-Analysis
An internal, fixed-effects meta-analysis across both studies’ zero-order
correlations between TAP scores and each key variable measured in both studies was
performed, weighted by sample size (Goh, Hall, & Rosenthal, 2016). Each correlation
coefficient was Fisherian Z-transformed for analysis and then converted back into the
original correlation coefficient for presentation’s sake (Table 10).
Table 10. Internal meta-analysis on both studies’ key variables: Buss-Perry Aggression
Questionnaire (BPAQ), Hot Sauce Aggression Task (HSAT), Non-Suicidal Self-Injury
Assessment Tool (NSSIAT), Voodoo Doll Task (VDT). Correlations were weighted by
sample size, Z tests represent significance tests of each meta-analytic effect, and the Χ2
tests represent tests for heterogeneity between studies.
r [95% CI] Z (p) Χ2 (p)

TAP VALIDATION 26
BPAQ - Physical .13 [.03, .23] 2.41 (.016) 0.14 (.708)
BPAQ - Verbal .11 [.01, .21] 2.04 (.041) 0.03 (.862)
HSAT (Untransformed) .24 [.14, .34] 4.34 (< .001) 1.15 (.284)
HSAT (LogTransformed) .19 [.09, .29] 3.50 (< .001) 1.79 (.181)
Male -.04 [-.15, .07] -0.75 (.453) 0.31 (.578)
NSSIAT .10 [-.01, .20] 1.78 (.075) 1.46 (.227)
Provocation .22 [.12, .32] 3.91 (< .001) 0.93 (.335)
VDT (Untransformed) .32 [.22, .41] 5.67 (< .001) 0.51 (.475)
VDT (LogTransformed) .37 [.28, .46] 6.50 (< .001) 0.40 (.527)
Integrative Data Analyses
We also performed integrative data analyses by combining both study’s datasets,
standardizing each predictor within-study, and using multilevel modeling in SAS v.9.4,
modeling the following sources of variance: participant (level 1), study (level 2; Curran &
Hussong, 2009). We tested linear effects of each predictor on TAP scores, as well
separate, exploratory models that included a squared version of the predictor to
examine potential quadratic effects. These analyses largely replicated the results of the
internal meta-analyses and revealed mixed incremental support for quadratic effects
(Table 11).
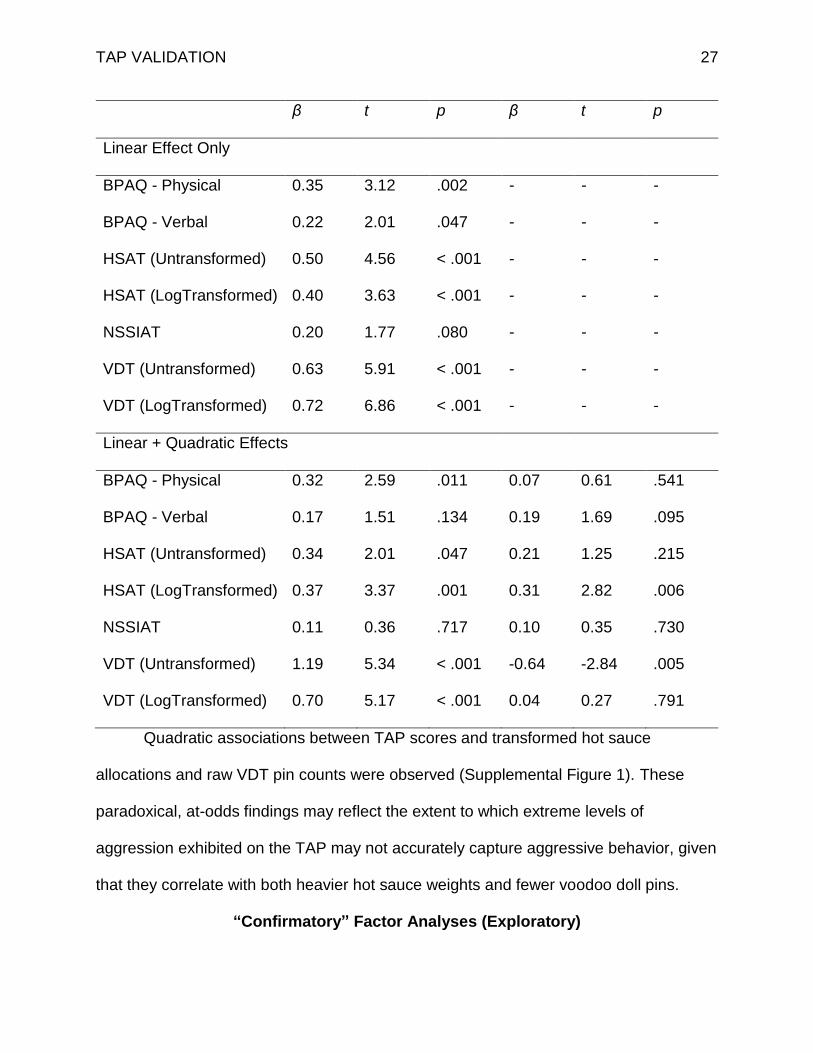
Table 11. Integrative data analysis on both studies’ key variables: Buss-Perry
Aggression Questionnaire (BPAQ), Hot Sauce Aggression Task (HSAT), Non-Suicidal
Self-Injury Assessment Tool (NSSIAT), Voodoo Doll Task (VDT).
Linear Quadratic
TAP VALIDATION 27
β t p β t p
Linear Effect Only
BPAQ - Physical 0.35 3.12 .002 - - -
BPAQ - Verbal 0.22 2.01 .047 - - -
HSAT (Untransformed) 0.50 4.56 < .001 - - -
HSAT (LogTransformed) 0.40 3.63 < .001 - - -
NSSIAT 0.20 1.77 .080 - - -
VDT (Untransformed) 0.63 5.91 < .001 - - -
VDT (LogTransformed) 0.72 6.86 < .001 - - -
Linear + Quadratic Effects
BPAQ - Physical 0.32 2.59 .011 0.07 0.61 .541
BPAQ - Verbal 0.17 1.51 .134 0.19 1.69 .095
HSAT (Untransformed) 0.34 2.01 .047 0.21 1.25 .215
HSAT (LogTransformed) 0.37 3.37 .001 0.31 2.82 .006
NSSIAT 0.11 0.36 .717 0.10 0.35 .730
VDT (Untransformed) 1.19 5.34 < .001 -0.64 -2.84 .005
VDT (LogTransformed) 0.70 5.17 < .001 0.04 0.27 .791
Quadratic associations between TAP scores and transformed hot sauce
allocations and raw VDT pin counts were observed (Supplemental Figure 1). These
paradoxical, at-odds findings may reflect the extent to which extreme levels of
aggression exhibited on the TAP may not accurately capture aggressive behavior, given
that they correlate with both heavier hot sauce weights and fewer voodoo doll pins.
“Confirmatory” Factor Analyses (Exploratory)

TAP VALIDATION 28
Confirmatory factor analyses (CFA) were fit with maximum likelihood estimation
in AMOS v.24.0.0 to identify the underlying data structure and relationships among the
aggression variables in this study. Variance estimates for each latent factor were fixed
to 1.
Measurement Models
TAP data from both studies were combined to assess the fit of several
measurement CFAs: a one-factor approach in which all 50 TAP measurements load
onto a single latent ‘aggression’ construct, a two-factor approach in which the volume
and duration settings from the first trial loaded onto a separate ‘trial 1’ latent factor and
the remaining trials loaded onto a second ’24 trials’ factor, a three-factor model that also
modeled trial 2 settings as their own latent construct, and a final two-factor approach in
which all volume settings load onto a ‘volume’ latent construct and all duration settings
load onto a ‘duration’ latent construct (error terms were allowed to covary within each
trial). Insufficient model fit was observed for all models (Table 12), though the final
model exhibited the best fit (volume and duration factors were highly-correlated, r = .93).
Across all models, each TAP variable’s loading onto each given latent construction was
positive and statistically-significant.
Table 12. Model fit statistics for various models of TAP data from both studies. CFI =
Comparative Fit Index. RMSEA = Root Mean Square Error of Approximation, TLI =
Tucker-Lewis Index. Values in brackets represent 90% confidence interval. ***p < .001
Χ2 CFI RMSEA TLI Χ2 Comparison
One-Factor 4,052.09*** .79 .09 .77 n/a

TAP VALIDATION 29
[.08, .09]
Trial 1 as Separate Factor 4,052.09*** .79 .09
[.08, .09]
.77 0
Trials 1 and 2 as Separate Factors 4,016.98*** .79 .09
[.08, .09]
.77 35.11***
Volume/Duration as Separate Factors 3,569.82*** .83 .08
[.08, .08]
.81 482.27***
Taxonomic Approach to Aggression Measurement
To understand the underlying nomological network underlying the aggression
measures employed across both studies (TAP scores, log-transformed HSAT weights,
log-transformed VDT pin counts, Physical and Verbal subscales of the BPAQ), we
conducted two CFAs. CFAs identified that a general aggression factor did not exhibit
adequate fit to the data (Figure 7, Table 13). However, a two-factor model that
separately modeled self-report and behavioral measures exhibited better, though still
inadequate model fit, Χ2(1) = 37.69, p < .001.
Table 13. Model fit statistics for one- and two-factor models of aggression data from
both studies. CFI = Comparative Fit Index. RMSEA = Root Mean Square Error of
Approximation, TLI = Tucker-Lewis Index. Values in brackets represent 90% confidence
intervals.
Χ2(df), p CFI GFI RMSEA TLI
One-Factor 47.56(5), < .001 .67 .95 .16 [.12, .20] .34
Two-Factor 9.87(4), .043 .96 .99 .07 [.01, .12] .89

TAP VALIDATION 30
Figure 7. Confirmatory factor analyses that estimate one-factor (left panel) and two-
factor (right panel) models of all five aggression measures used in both studies. Values
above paths represent standardized coefficients and values attached to variables
represent residual, unstandardized variances. Dashed paths are non-significant. *p <
.05, **p < .01, ***p < .001.
Discussion
The TAP has facilitated substantial developments in our understanding of
aggression. However, the ability to implement and analyze the TAP in a nearly unlimited
array of ways is both a strength and a weakness. The TAP’s flexibility can enable
researcher degrees-of-freedom, whether conscious or incidental, to undermine the
validity of the task and introduce false positives into the literature (Elson et al., 2014).
Using a preregistered version of the TAP and a single scoring approach (i.e., averaging
TAP VALIDATION 31
across all measurements), we removed the flexibility of the task and tested its
subsequent validity in two studies.
Construct and convergent validity. We observed substantial evidence for the
construct validity of the aggregate approach to the 25-trial TAP. TAP scores were higher
for experimentally provoked participants, as compared to their non-provoked
counterparts. Further, the TAP demonstrated convergent validity with the two other
laboratory aggression measures: the Hot Sauce Aggression Task (Lieberman et al.,
1999) and the Voodoo Doll Aggression Task (DeWall et al., 2013), even after
counterbalancing them. This convergence of a triad of laboratory aggression measures
suggests that aggression can indeed be operationalized in many ways that tap, that
likely tap into a single, underlying construct. In Study 1, though not Study 2, TAP scores
were also associated with greater hot sauce allocations from participants to themselves,
which may suggest that this task is not purely capturing aggressive behavior. Extending
into self-reports, trait physical aggressiveness was also associated with greater TAP
scores, suggesting that this task can tap into broader domains of aggressive
tendencies.
In Study 2, TAP scores were associated with less agreeableness and greater
narcissistic antagonism. These correlations fit with a broader literature demonstrating
that antagonistic, disagreeable traits lie at the heart of aggressive behavior (Vize et al.,
in press). Null effects were observed for psychopathy and Machiavellianism, against
predictions, potentially due to the missing data from Study 2. Additionally, our use of a
strong provocation manipulation, coupled with the provocation embedded into the TAP
itself, likely constrained the influence of individual difference factors on aggression

TAP VALIDATION 32
(Saleem, Barlett, Anderson, & Hawkins, 2017). Attempts at identifying the trait
correlates of the TAP would likely benefit from the removal of any situational
provocation inductions.
Motivation. TAP scores corresponded to the appropriate motivation, the desire
to inflict retributive harm, and not with competitive or instrumental motives to simply win
the competition. These findings suggest that TAP scores do not reflect strategic
concerns, but instead reflect the motivation to harm one’s opponent. Moreover, these
results support the validity of the TAP as an effective measure of state-level, immediate
aggressive tendencies.
Gender. Males and females did not exhibit differences in their TAP scores. The
disproportionate level of females in the sample may have contributed to this null effect.
More likely, this lack of a gender difference reflects the complicated nature of gender in
aggressive behavior (Archer, 2000).
External validity. On both studies, TAP scores failed to predict frequency of
physical fights over the past 5 years, yet was able to do so in shorter (past year) and
longer (ever) timeframes. Our sample consisted of undergraduates, who cannot be
characterized as a population prone to extreme violence, which may have influenced
these results. Their lack of aggressive tendencies likely influenced our results in ways
(e.g., restriction-of-range of TAP scores) that can only be estimated by future work with
other populations (e.g., violent offenders).
Discriminant validity. Mixed evidence was also observed for the TAP’s
discriminant validity. In the meta-analysis, TAP scores were modestly associated with
trait verbal aggressiveness and marginally associated with state-level self-harm

TAP VALIDATION 33
tendencies. However, given the frequent association between physical aggression and
both of these constructs (e.g., Muehlenkamp & Gutierrez, 2007; Webster et al., 2014),
these associations perhaps should have been expected.
Internal consistency. Principal components analyses and internal consistency
estimates suggested that the 50 datapoints of the TAP do, in fact, load onto a central
latent construct. As such, our scoring approach of averaging across all 50 datapoints
likely accurately reflects the underlying data structure. More research is needed to test
whether different trials of the TAP represent quantitatively or qualitatively different
measures.
Conclusions
Flexible psychological measures are a boon to the field. However, this flexibility
must be tempered with preregistration of the task’s implementation, scoring, and
analysis, lest this flexibility undermine sound science. Using two preregistered studies,
we provided initial evidence that our approach to the TAP is internally-valid. However,
more work is needed to explore the TAP’s external and discriminant validity. Assuming
that evidence for these other forms of validity are found and that our findings are
replicated by future work, the TAP should have a long and healthy life in the aggression
researcher’s toolkit.

TAP VALIDATION 34
References
Anderson, C. A., & Bushman, B. J. (1997). External validity of “trivial” experiments: The
case of laboratory aggression. Review of General Psychology, 1(1), 19–41.
Anderson, C. A., & Murphy, C. R. (2003). Violent video games and aggressive behavior
in young women. Aggressive Behavior, 29(5), 423–429.
Bernstein, S., Richardson, D., & Hammock, G. (1987). Convergent and discriminant
validity of the Taylor and Buss measures of physical aggression. Aggressive
Behavior, 13(1), 15–24.
Bond, A., & Lader, M. (1986). A method to elicit aggressive feelings and behaviour via
provocation. Biological Psychology, 22(1), 69–79.
Bushman, B. J. (1995). Moderating role of trait aggressiveness in the effects of violent
media on aggression. Journal of Personality and Social Psychology, 69(5), 950–
960.
Bushman, B. J., & Baumeister, R. F. (1998). Threatened egotism, narcissism, self-
esteem, and direct and displaced aggression: Does self-love or self-hate lead to
violence? Journal of Personality and Social Psychology, 75(1), 219–229.
Chester, D. S. & DeWall, C. N. (2016). The pleasure of revenge: Retaliatory aggression
arises from a neural imbalance toward reward. Social Cognitive and Affective
Neuroscience, 11(7), 1173-1182.
Chester, D. S. & DeWall, C. N. (2017). Combating the sting of rejection with the
pleasure of revenge: A new look at how emotion shapes aggression. Journal of
Personality and Social Psychology, 112(3), 413-430.

TAP VALIDATION 35
Chester, D. S., Whitt, Z. T., Davis, T. S., & DeWall, C. N. (2017). The Voodoo Doll Self-
Injury Task: A new measure of sub-clinical self-harm tendencies. Journal of
Social and Clinical Psychology, 36(7), 554-578.
Costa, P. T., & MacCrae, R. R. (1992). Revised NEO personality inventory (NEO PI-R)
and NEO five-factor inventory (NEO-FFI): Professional manual. Psychological
Assessment Resources, Incorporated.
Curran, P. J., & Hussong, A. M. (2009). Integrative data analysis: the simultaneous
analysis of multiple data sets. Psychological Methods, 14(2), 81-100.
Denson, T. F., von Hippel, W., Kemp, R. I., & Teo, L. S. (2010). Glucose consumption
decreases impulsive aggression in response to provocation in aggressive
individuals. Journal of Experimental Social Psychology, 46(6), 1023–1028.
Elson, M., Mohseni, M. R., Breuer, J., Scharkow, M., & Quandt, T. (2014). Press CRTT
to measure aggressive behavior: The unstandardized use of the competitive
reaction time task in aggression research. Psychological Assessment, 26(2),
419.
Epstein, S., & Taylor, S. P. (1967). Instigation to aggression as a function of degree of
defeat and perceived aggressive intent of the opponent1. Journal of Personality,
35(2), 265–289.
Ferguson, C. J., Smith, S., Miller-Stratton, H., Fritz, S., & Heinrich, E. (2008).
Aggression in the laboratory: Problems with the validity of the modified Taylor
Competitive Reaction Time Test as a measure of aggression in media violence
studies. Journal of Aggression, Maltreatment & Trauma, 17(1), 118–132.

TAP VALIDATION 36
Giancola, P. R., & Parrott, D. J. (2008). Further evidence for the validity of the Taylor
Aggression Paradigm. Aggressive Behavior, 34(2), 214–229.
Giancola, P. R., & Zeichner, A. (1995). Construct validity of a competitive reaction-time
aggression paradigm. Aggressive Behavior, 21(3), 199–204.
Glover, N., Miller, J. D., Lynam, D. R., Crego, C., & Widiger, T. A. (2012). The five-factor
narcissism inventory: A five-factor measure of narcissistic personality
traits. Journal of personality assessment, 94(5), 500-512.
Goh, J. X., Hall, J. A., & Rosenthal, R. (2016). Mini meta‐analysis of your own studies:
Some arguments on why and a primer on how. Social and Personality
Psychology Compass, 10(10), 535-549.
Jones, D. N., & Paulhus, D. L. (2014). Introducing the short dark triad (SD3) a brief
measure of dark personality traits. Assessment, 21(1), 28-41.
Lieberman, J. D., Solomon, S., Greenberg, J., & McGregor, H. A. (1999). A hot new way
to measure aggression: Hot sauce allocation. Aggressive Behavior, 25(5), 331–
348.
Miller, J. D., & Lynam, D. R. (2006). Reactive and proactive aggression: Similarities and
differences. Personality and Individual Differences, 41(8), 1469–1480.
Miller, J. D., Lynam, D. R., McCain, J. L., Few, L. R., Crego, C., Widiger, T. A., &
Campbell, W. K. (2016). Thinking structurally: A test of the factor structure of the
Five-Factor Narcissism Inventory. Journal of Personality Disorders, 30, 1-18.
Muehlenkamp, J. J., & Gutierrez, P. M. (2007). Risk for suicide attempts among
adolescents who engage in non-suicidal self-injury. Archives of Suicide
Research, 11(1), 69–82.

TAP VALIDATION 37
Paulhus, D. L., Neumann, C. S., & Hare, R. D. (2009). Manual for the self-report
psychopathy scale. Toronto: Multi-health systems.
Rozin, P., Millman, L., & Nemeroff, C. (1986). Operation of the laws of sympathetic
magic in disgust and other domains. Journal of Personality and Social
Psychology, 50(4), 703–712.
Saleem, M., Barlett, C. P., Anderson, C. A., & Hawkins, I. (2017). Helping and hurting
others: person and situation effects on aggressive and prosocial behavior as
assessed by the Tangram task. Aggressive Behavior, 43(2), 133-146.
Shortell, J., Epstein, S., & Taylor, S. P. (1970). Instigation to aggression as a function of
degree of defeat and the capacity for massive retaliation. Journal of
Personality, 38(3), 313-328.
Simmons, J. P., Nelson, L. D., & Simonsohn, U. (2011). False-positive psychology:
Undisclosed flexibility in data collection and analysis allows presenting anything
as significant. Psychological Science, 22(11), 1359–1366.
Taylor, S. P. (1967). Aggressive behavior and physiological arousal as a function of
provocation and the tendency to inhibit aggression. Journal of Personality, 35(2),
297–310.
Tedeschi, J. T., & Quigley, B. M. (1996). Limitations of laboratory paradigms for
studying aggression. Aggression and Violent Behavior, 1(2), 163–177.
Tedeschi, J. T., & Quigley, B. M. (2000). A further comment on the construct validity of
laboratory aggression paradigms: A response to Giancola and Chermack.
Aggression and Violent Behavior, 5(2), 127–136.

TAP VALIDATION 38
Vize, C. E., Collison, K. L., Crowe, M. L., Campbell, W. K., Miller, J. D., & Lynam, D. R.
(in press). Using dominance analysis to decompose narcissism and its relation to
aggression and externalizing outcomes. Assessment.
Wagenmakers, E.-J., Wetzels, R., Borsboom, D., van der Maas, H. L. J., & Kievit, R. A.
(2012). An agenda for purely confirmatory research. Perspectives on
Psychological Science, 7(6), 632–638.
Webster, G. D., DeWall, C. N., Pond, R. S., Deckman, T., Jonason, P. K., Le, B. M., …
Bator, R. J. (2014). The brief aggression questionnaire: Psychometric and
behavioral evidence for an efficient measure of trait aggression. Aggressive
Behavior, 40(2), 120–139.

TAP VALIDATION 39
Supplemental Figure 1. Quadratic associations between mean TAP scores and (A) log-
transformed hot sauce weights and (B) un-transformed voodoo doll pin counts, from
both studies. The middle line represents the quadratic regression line and the lines on
either side demarcate the boundaries of the 95% confidence interval around this
regression line.

TAP VALIDATION 40
Supplemental Table 1: https://osf.io/a2wft/files/

Running head: TAP VALIDATION 41
Supplemental Table 2. Gender differences in self-reported aggression variables from
Study 1, as well as gender differences in TAP scores presented separately by
provocation condition (Male = 1, Female = 0). BPAQ = Buss-Perry Aggression
Questionnaire, HPFS = History of Physical Fights Scale, TAP = Taylor Aggression
Paradigm.
Variable t df p d [95% CI]
BPAQ - Physical Aggression 4.45 175 < .001 0.67 [0.36, 0.95]
BPAQ - Verbal Aggression 1.80 175 .073 0.27 [-0.02, 0.58]
HPFS - Past Five Years 5.58 175 < .001 0.84 [0.56, 1.15]
HPFS - Past Year 4.35 175 < .001 0.66 [0.36, 0.96]
TAP (Provoked) 0.44 85 .659 0.10 [-0.34, 0.53]
TAP (Unprovoked) -1.53 88 .131 -0.33 [-0.75, 0.10]

TAP VALIDATION 42
Supplemental Table 3. Component loadings from the PCA on TAP settings from Study
1.
Components
I II III IV V VI VII VIII
Eigenvalue 22.81 3.18 2.32 1.50 1.32 1.30 1.07 1.03
% Variance Explained
45.62 6.37 4.63 3.00 2.63 2.59 2.14 2.06
Trial 1 - Volume .66 -.14 -.30 .39 -.21 .06 -.06 .15 Trial 2 - Volume .65 -.48 -.25 .14 .01 .01 -.01 -.06 Trial 3 - Volume .69 -.39 -.24 .10 -.03 .13 .01 .01 Trial 4 - Volume .70 -.23 -.14 -.11 .17 .19 .22 .07 Trial 5 - Volume .71 -.20 -.26 .12 -.13 .13 .04 -.22 Trial 6 - Volume .76 -.10 -.16 .20 -.03 .01 .09 -.01 Trial 7 - Volume .75 .08 -.17 .08 -.01 .16 .15 -.05 Trial 8 - Volume .75 .13 -.04 .05 -.26 .21 .19 .09 Trial 9 - Volume .68 .24 -.14 .01 .05 .25 .16 -.03 Trial 10 - Volume .64 .35 -.02 -.06 .08 .44 -.01 .12 Trial 11 - Volume .66 .36 -.14 .03 -.27 .04 -.01 -.26 Trial 12 - Volume .70 .29 -.04 .13 -.28 .11 -.16 -.24 Trial 13 - Volume .69 .38 -.09 .04 -.13 -.02 -.07 .14 Trial 14 - Volume .69 .12 .00 .01 -.02 .07 -.43 .01 Trial 15 - Volume .63 .15 -.08 -.24 .09 .21 -.35 .12 Trial 16 - Volume .72 -.16 .16 -.11 .21 .06 -.22 -.26 Trial 17 - Volume .64 -.44 .07 .03 .01 .22 -.27 -.05 Trial 18 - Volume .68 -.19 .24 -.01 .07 .12 -.06 .11 Trial 19 - Volume .70 -.29 .26 -.09 -.07 .00 .07 -.08 Trial 20 - Volume .66 -.22 .21 -.30 -.15 .31 .10 .05 Trial 21 - Volume .75 -.08 .07 -.14 -.39 -.12 .02 -.03 Trial 22 - Volume .71 -.18 .20 .21 -.21 -.01 -.13 .15 Trial 23 - Volume .73 .12 .23 .19 -.09 -.08 -.10 .19 Trial 24 - Volume .68 .14 .30 .29 .14 .14 .11 .13 Trial 25 - Volume .58 .33 .35 .11 .12 .11 .01 .01 Trial 1 - Duration .62 -.01 -.39 .32 -.02 -.10 -.05 .22 Trial 2 - Duration .64 -.45 -.33 .10 .13 -.12 -.04 -.12 Trial 3 - Duration .69 -.28 -.34 -.01 .17 -.17 .00 .06 Trial 4 - Duration .69 -.27 -.14 -.10 .26 -.04 .21 .06 Trial 5 - Duration .73 -.13 -.13 .07 .17 -.05 .09 -.23 Trial 6 - Duration .75 .04 -.15 -.01 .18 -.07 .01 -.01 Trial 7 - Duration .63 .20 -.28 -.27 .14 -.11 .21 .06 Trial 8 - Duration .73 .10 -.10 -.17 -.10 -.07 .06 .16 Trial 9 - Duration .61 .28 -.19 -.10 -.03 -.25 .22 -.14 Trial 10 - Duration .57 .42 -.16 -.21 .13 .11 .02 .26 Trial 11 - Duration .67 .42 -.06 -.06 .01 -.15 .07 -.16

TAP VALIDATION 43
Trial 12 - Duration .70 .36 -.21 -.16 -.04 -.15 -.11 -.17 Trial 13 - Duration .67 .32 .05 -.03 .07 -.10 -.03 .05 Trial 14 - Duration .65 .25 -.02 .05 .17 -.28 -.23 .09 Trial 15 - Duration .71 .19 -.03 -.19 .13 -.21 -.17 -.04 Trial 16 - Duration .71 -.14 .17 -.23 .25 .07 -.06 .03 Trial 17 - Duration .66 -.25 .19 .01 .17 -.17 -.19 -.02 Trial 18 - Duration .66 -.18 .28 -.11 .17 -.11 .07 .03 Trial 19 - Duration .64 -.29 .23 -.14 -.26 -.13 .05 -.03 Trial 20 - Duration .60 -.23 .22 -.39 -.23 .06 .13 .02 Trial 21 - Duration .75 -.11 .15 -.21 -.24 -.21 .01 -.09 Trial 22 - Duration .66 -.08 .22 .02 -.11 -.27 .05 .30 Trial 23 - Duration .62 .03 .36 .23 -.03 -.30 .13 .08 Trial 24 - Duration .57 .16 .38 .35 .22 .00 .25 -.02 Trial 25 - Duration .56 .21 .41 .23 .14 .09 .06 -.43
Supplemental Table 4: https://osf.io/a2wft/files/

TAP VALIDATION 44
Supplemental Table 5. Gender differences in self-reported aggression variables from
Study 2, as well as gender differences in TAP scores presented separately by
provocation condition (Male = 1, Female = 0). BPAQ = Buss-Perry Aggression
Questionnaire, HPFS = History of Physical Fights Scale, TAP = Taylor Aggression
Paradigm.

TAP VALIDATION 45
Variable t df p d [95% CI]
BPAQ - Physical Aggression 2.02 165 .046 0.31 [0.01, 0.60]
BPAQ - Verbal Aggression 0.91 165 .364 0.14 [-0.16, 0.45]
HPFS - Past Five Years 1.45 165 .149 0.23 [-0.08, 0.53]
HPFS - Past Year 2.82 165 .010 0.44 [0.10, 0.72]
TAP (Provoked) -1.01 82 .315 -0.22 [-0.67, 0.22]
TAP (Unprovoked) 0.87 81 .386 0.19 [-0.25, 0.64]
Supplemental Table 6. Component loadings from the PCA on TAP settings from Study 2.
Components
I II III IV V VI VII VIII
Eigenvalue 25.10 2.59 2.17 1.87 1.46 1.36 1.17 1.12
% Variance Explained
50.19 5.18 4.33 3.74 2.92 2.71 2.33 2.24
Trial 1 - Volume .58 -.31 -.02 .04 -.45 .31 -.13 -.15 Trial 2 - Volume .65 -.51 -.08 .19 .02 .03 -.03 .00

TAP VALIDATION 46
Trial 3 - Volume .73 -.37 -.01 .18 .06 .07 -.12 .09 Trial 4 - Volume .76 -.39 .07 .04 .07 -.10 -.10 .13 Trial 5 - Volume .71 -.35 .10 .06 .10 -.17 -.15 .23 Trial 6 - Volume .77 -.24 .22 .01 -.02 -.25 -.03 -.18 Trial 7 - Volume .77 -.04 .19 -.04 -.15 -.38 .01 -.12 Trial 8 - Volume .79 -.07 .10 -.02 -.14 -.35 .00 -.20 Trial 9 - Volume .77 .10 .11 -.02 -.27 -.04 -.22 -.04 Trial 10 - Volume .77 .08 .16 -.02 -.26 .11 .02 -.03 Trial 11 - Volume .72 .14 .20 .14 -.34 .01 .17 .03 Trial 12 - Volume .77 .13 .25 .06 -.28 -.03 -.03 -.01 Trial 13 - Volume .69 .10 .31 .18 -.17 .11 -.27 .23 Trial 14 - Volume .72 .02 .07 .23 -.16 .17 -.21 .27 Trial 15 - Volume .73 -.02 .06 .11 .10 .04 .07 .15 Trial 16 - Volume .74 -.05 -.24 -.17 -.10 -.18 .17 .21 Trial 17 - Volume .75 .00 -.31 -.08 -.20 -.20 .14 .20 Trial 18 - Volume .76 -.02 -.22 -.18 -.24 -.14 .19 .10 Trial 19 - Volume .76 -.04 -.30 -.19 -.02 .05 .00 -.02 Trial 20 - Volume .73 -.02 -.42 -.12 -.05 -.01 -.09 .08 Trial 21 - Volume .77 .17 -.29 -.10 -.04 -.15 -.18 -.07 Trial 22 - Volume .77 .22 -.19 .15 -.02 -.05 -.25 -.09 Trial 23 - Volume .70 .23 -.16 .24 .02 -.13 -.14 .07 Trial 24 - Volume .68 .24 -.19 .44 -.07 -.14 .17 .00 Trial 25 - Volume .69 .22 .02 .43 .01 .07 .25 -.07 Trial 1 - Duration .58 -.30 .04 -.08 -.27 .46 -.03 -.26 Trial 2 - Duration .67 -.46 .00 .15 .15 .13 .14 -.11 Trial 3 - Duration .72 -.32 .00 .12 .25 .18 .00 -.01 Trial 4 - Duration .72 -.40 .08 .01 .27 -.04 -.09 -.07 Trial 5 - Duration .70 -.24 .23 .08 .31 -.04 .03 .06 Trial 6 - Duration .76 -.14 .23 -.07 .07 -.11 .06 -.30 Trial 7 - Duration .72 .02 .20 -.08 .11 -.28 .11 -.24 Trial 8 - Duration .70 .15 .31 -.08 .32 -.15 .02 .08 Trial 9 - Duration .63 .26 .29 -.37 .03 .08 -.22 .00 Trial 10 - Duration .69 .24 .14 -.17 .03 .25 .09 -.13 Trial 11 - Duration .69 .14 .20 -.45 .08 .14 .03 -.03 Trial 12 - Duration .65 .26 .36 -.18 -.01 -.10 .12 .06 Trial 13 - Duration .65 .22 .29 -.10 .05 .13 .05 .29 Trial 14 - Duration .66 .22 .17 -.07 .13 .19 .09 .29 Trial 15 - Duration .68 -.01 .08 -.19 .12 .27 .23 .04

TAP VALIDATION 47
Trial 16 - Duration .70 -.07 -.17 -.12 .04 .02 .25 .26 Trial 17 - Duration .68 -.13 -.30 -.09 -.03 .02 .27 .10 Trial 18 - Duration .70 -.05 -.32 -.24 .10 .19 .11 -.10 Trial 19 - Duration .75 -.07 -.22 -.22 -.03 .00 .02 -.08 Trial 20 - Duration .67 .03 -.30 -.12 .16 .00 -.31 .00 Trial 21 - Duration .66 .29 -.29 -.10 .30 .05 -.31 -.06 Trial 22 - Duration .73 .30 -.17 -.13 .07 .05 .06 -.30 Trial 23 - Duration .72 .34 -.12 .14 .15 .04 -.18 -.06 Trial 24 - Duration .61 .31 -.13 .48 .09 .11 .07 -.09 Trial 25 - Duration .64 .26 .01 .38 .18 .12 .20 -.18