validating the accuracy of gis-based accessibility
TRANSCRIPT
Validating the Accuracy of GIS-Based Accessibility Analysis in
Determining Public Primary Health Care Demand in Metropolitan
Areas
Hunadi Mokgalaka1, Gerbrand Mans
2, Julian Smit
3 and David McKelly
4
1Geomatics Division, University of Cape Town, Cape Town, South Africa,
[email protected] 2Built Environment, Council for Scientific and Industrial Research, Stellenbosch, South Africa,
[email protected] 3Geomatics Division, University of Cape Town, Cape Town, South Africa, [email protected] 4Built Environment, Council for Scientific and Industrial Research, Stellenbosch, South Africa,
This paper has been through a process of double-blind peer review
Abstract
Geographical access is an important aspect of the health care planning process. GIS-based
accessibility analysis is a logical method which can be applied to test the degree to which equitable
access to services and facilities is obtained. The GIS analysis is, however, based on the assumption
of rational choice, i.e. a person will always go to the closest facility. Inputs to the analysis are
supply (facility capacity) and demand (population) estimates. In South Africa primary health care
(PHC) is a dual system made up of private and public health care facilities. Private PHC is
expensive and only affordable to affluent citizens or people with medical insurance, and does not
form a part of this study. Two challenges regarding GIS-based accessibility analysis for public
PHC services within a South African context that emerge are: (a) how accurate is a rational
choice-based model compared to people’s actual decisions; and, (b) what method is best in
determining demand in the absence of accurate databases indicating public versus private health
care usage? GIS demand profiling tools were applied to determine three distinct demand scenarios
based on a combination of three variables: (a) household income category; (b) age; and, (c)
average visits. A GIS-based form of catchment area modelling was used to determine catchment
areas for each facility, allocating demand to the closest facility and limiting access based on facility
capacity and access via a road network. Results indicate that there is no significant difference in
the spatial extent of the catchment areas of the facilities across the three scenarios but that there is
a significant demand increase per scenario: scenario 1 (6 711 292) < scenario 2 (6 828 738) <
scenario 3 (7 120 648). An electronic tuberculosis (TB) patient register and facility headcounts
based on actual visits were compared to the results of the catchment area modelling. The
comparison results show that almost 45% of the patients did not use their nearest facility as a first
point of contact. The headcounts showed that the method used for scenario 3 is ideal for
determining primary health care demand. GIS is not the complete solution to understanding all the
issues of access to public health care services but is a useful tool to support planning by spatially
identifying where interventions are needed most, especially in the absence of accurate and geo-
referenced patient registers.

2
1. Introduction
The provision of basic health care services is important as it contributes to the improvement of
people‟s lives and leads to conditions that favour economic development and the general
functioning of areas. This implies that an improvement in the health status (mental, physical and
social) of the population will in turn enable people to contribute towards economic production. Seen
from this perspective, the provision of and access to basic health care services can be viewed as a
prerequisite for social advancement and economic progress (Amer, 2007) as the well-being of
people is, to a certain extent, dependent upon access to health care services at facilities such as
clinics, community health centres (CHC) and hospitals.
Health care service provision is rather more complicated than any other type of service provision
because the health care needs of people vary across space and time. In the perfect world, health care
service delivery systems would be able to cater for all the health care needs of the entire population.
However, realistically speaking, this has proved unattainable to date as there are continuous
processes that underlie the concentration of people in certain areas rather than others. The provision
of adequate health care services, particularly in metropolitan areas, is becoming more difficult
because of three developments: (1) the rapid growth of cities and their population; (2) urbanisation
of poverty; and, (3) slow economic growth (Amer, 2007). The combined effect of these three
developments has resulted in a situation where the carrying capacity of current service delivery
systems decline with the increase in service demand. These continuous processes have led to
increased population densities in urban areas and, therefore, stress the need for service delivery
systems to constantly anticipate continuous change and in turn adapt to it.
Given the spatial perspective of this study, access to basic health care services constitutes an
important research focus as the spatial distributions of these services are geographically varied. This
variation arises from the fact that health care services are not equally accessible by and available to
all individuals. People are not spread evenly across the earth‟s surface and their choice of service or
facility may not always be motivated by proximity alone. Hence, McLafferty (2003) states that
populations differ along many dimensions (such as age, gender, culture and economic status) that
affect their need for services, as well as their ability to travel to obtain the types of services they are
willing and able to utilise. It follows that there is a complex relationship between the spatial
separation and distribution of population and services, how they are connected geographically, and
the multidimensional character of the demand for health care which is made up of various
biological, socio-economic and cultural elements. These factors account for the difference in
demand and the use of health care services. And because of this there will always be a degree of
geographical variation between the provision and use of services (Amer, 2007). The degree to
which this geographical variation is acceptable or indicates inequity can be assessed or measured in

3
a GIS environment.
1.1 Health care access planning
It is recognised that there is a need for more robust planning to achieve a more equitable
distribution of services in response to the growing demand for health care. However, it is also
recognised that in the last few years, South African metropolitan areas have seen increased
population densities thus putting more pressure on already overburdened service delivery systems.
While it is important for the sectors responsible for the provision of health care services to locate
facilities in such a way as to serve the majority of the population, it is also important to note that
metropolitan areas are dynamic and continue to develop and expand with time. The challenge for
health care planners is thus to adequately plan to provide health care services to the greatest number
of people while using currently deficient resources.
The spatial planning of health care services concerns the identification of suitable locations for a
given number of facilities in a defined territory, in such a way that the health care needs of spatially
dispersed populations are served in an optimal way (Amer, 2007). However, the current population
growth, the spatial realities of South African metropolitan areas and the changing dynamics of the
health care needs of people will impact on the need for health care services and where they should
be located. It is, therefore, essential that planning for health care services incorporates future growth
and changes in activity trends occurring in these areas. Hence, the location and operation of these
health care services need to be carefully planned for improved access by current and future users.
From a planning perspective, measuring the accessibility of health care services in a geographic
area is one of the useful approaches in the planning process. Accessibility analysis is a relational
evaluation of services relative to potential users‟ demand measured within a specified distance
range and using a detailed road network and is therefore not a simple service-to-population ratio. A
key advantage of measuring accessibility is that the measurements take into account service
sufficiency with respect to its location. The evidence for regional disparities as highlighted by
Joseph and Phillips (1984) emphasize the importance of measuring the various facets of
performance in a health care service delivery system. The performance of primary health care
service systems have traditionally been assessed in terms of facility numbers with little attention
being given to the usage of these facilities. Geographical accessibility analysis to health care
facilities is one of the important facets in the health care planning process. From this perspective,
performance is then assessed in terms of the geographical accessibility levels of the services for
potential users. GIS-based accessibility analysis is a logical method which can be applied to
measure the degree to which geographical access is obtained. It has recently been used to
approximate the degree of health care need and / or forecast health care demand in a number of
studies (e.g. McGrail, 2012; Al-Taiar et al., 2010, Apparicio & Séguin, 2006, Bagheri et al., 2005 &

4
Lin et al., 2005).
1.2 Shortcomings of GIS-based accessibility analysis
Two geographical perspectives are important when it comes to health service planning: access
(potential accessibility) and utilisation (revealed accessibility). While specific measures of potential
accessibility are easier to put into operation and interpret than revealed accessibility, for the
purposes of monitoring individual aspects of health care delivery systems it is important to realise
that availability and potential accessibility does not guarantee the utilisation of services (Joseph &
Phillips, 1984). And so, potential accessibility measures may fail to include the demand of
individual preference. In other words, utilisation should also be seen as an indicator of accessibility.
GIS-based accessibility methods that enable the incorporation of various data inputs are used to
measure geographical access to health care services. In developed countries the presence of patient
registers, digital road maps, well-established public transport, information on the residence and
employment data of the population, and on the resources available in each facility are combined to
create indicators of the accessibility of health care services (Al-Taiar et al., 2010). However, Al-
Taiar et al. (2010) point out that such data inputs hardly exist in many developing countries like
South Africa (even in hard copy form). Thus, the application of incorporating the abovementioned
data in accessibility measures in developing countries is constrained by the lack of data sets inputs.
The Scott et al. (2002) study that focused on creating a health information system for cancer
patients in KwaZulu-Natal drew attention to the limitations of conducting such analysis in a South
African context due to the lack of data sources. Overall the limitations, as also identified by
McLafferty (2003), include: (1) privacy and confidentiality restrictions limiting access to data about
health status and health outcomes especially for individuals or for small areas; (2) data on health
care utilisation and treatments are often proprietary, controlled by health insurers and provider
organisations; and, (3) in the case of public data, there are problems with compatibility and sharing
of information among agencies. Although the District Health Information System (DHIS), with its
ability to link to a GIS component, is available to cater for health information needs in South
Africa, most of the data are facility-based, i.e. all data outputs are aggregated to a facility level,
reducing its value for detailed accessibility analysis. Literature has highlighted the practicality of
using population-based cancer and TB registers as good potential patient register proxy data sets as
they include the patients‟ residential addresses. It is, however, it was observed in this study‟s initial
stages of data pre-processing that the register database has missing and incomplete residential
addresses for most records. This was also discovered in the Scott et al. (2002) study which used a
cancer register. This reflects dispersed and uncoordinated data collection process and geographical
variations in registration efficiencies (Scott et al., 2002).
This deficiency in data sets has resulted in some accessibility analyses undertaken based on a
5
number of assumptions in measurement, obscuring differences between individuals or groups. Such
assumptions include presuming similar needs among clients by, for example, measuring
accessibility based on the assumption of rational choice. The behaviour underlying rational choice
is that people will minimise travel distances to access health care services, i.e. people will always
go to their closest facility when seeking the service it provides. However, allocation to a facility
(potential accessibility) does not guarantee the utilisation (revealed accessibility) of services. Such
measures might, therefore, give a distorted picture of the situation because people sometimes travel
beyond their closest facility to seek the services they need. In such cases the measures may fail to
provide adequate insight into accessibility issues (Green et al., 2007). Intuitively, there could be a
significant gap between potential and revealed accessibility (Lin et al., 2005). Documented
empirical studies that have focused on the actual utilisation or revealed accessibility are usually
much more limited (Lin et al., 2005). The actual level of discrepancy between potential and
revealed (utilisation) accessibility has not been studied extensively; therefore, it is difficult to accept
or discredit a GIS-based accessibility analysis approach. Unless there are improvements in the
availability and quality of input data in developing countries, the full potential of acceptable and
robust spatial analysis methods in support of health care planning will remain untapped (Mokgalaka
et al, 2013). This then raises the question of to what level or extent is GIS-based accessibility
analysis applicable in planning for health care services, especially in South African metropolitan
areas.
2. Methodology
2.1 Study Area
The study area is the City of Johannesburg, a highly urbanised area which covers 1 664 km2 of
land. It is centrally located in the Gauteng province and divided into seven administration or
planning regions: A-G (see Figure 1). The core administration, falling under the Office of the City
Manager, incorporates these seven administration regions and sets the strategic direction for the city
with respect to service delivery within these regions (Richards et al., 2006). Access to health care
services is a problem in the high density areas (see Figure 1) of the southern suburbs and on the
northern periphery because these areas are host to extremes of poverty, high density informal
settlements and informal trade (Ahmad et al., 2010). The city, according to the Census 2011, has a
total population of 4 434 827 people made up primarily of a young population aged between 30 and
39 years. The total population translates roughly into 1.3 million households (2011 City of
Johannesburg Integrated Development Plan). The choice of study area was influenced by, amongst
others: (1) the availability of data; (2) existing knowledge of the area; and, (3) apparent contrast
within the study area in terms of density, socio-economic factors and the provision of primary
health care facilities.

6
Figure 1: Contextual information for the City of Johannesburg
a. 2011 Population b. Density zones c. Average income

7
2.2 Data Collection
In order to undertake a GIS-based accessibility analysis a number of data sets are required. These
data sets are derived from a variety of sources and are thus mostly secondary data. The data, where
applicable, was collected for the 2011 calendar year to coincide with the national population census.
In terms of preparatory work, a very considerable and time consuming part involved the cleaning
and geocoding of the data.
2.2.1 Generic data
Population data: The Statistics South Africa (StatsSA) 2011 census population data global
total for the study area was extracted and grouped by specific age and income breakdown and
serves as the potential demand data. The necessary population and demand profiling was
established using three variables. The detailed process is explained in section 2.2.2 below.
Once the demand profiling was done, the data was disaggregated to the analysis units (see
detailed section below) using dasymetric mapping principles. This process involves a
disaggregation procedure which allows aggregate data to be assigned to different
demarcations seamlessly based on the Spot Building Count points data set from Eskom
(Mans, 2012). This process also eliminates the error of assigning people to non-residential
areas. Since there was no residential address database of all the patients who visit these
facilities, an Electronic Tuberculosis Register (ETR.Net data) is considered as a proxy or
representation to serve as revealed demand data. This is considered a good representative
sample of actual visits because this patient register holds data from the initial visit (first
contact visit before knowing health status) that people made before a diagnosis of TB
occurred. The database with only the residential address variable of the patients was obtained
from the Gauteng Provincial Department of Health (GPDH). The database has 23 294
records. In a GIS environment, the addresses of the records are geocoded using a python
script which calls to the Google Geocoding Application Development Platform and then
returns a coordinate set. This routine is repeated for all the records, and a total of 22 237
records were geocoded. In addition to this, a database of the headcounts of the actual visits to
the facilities of the study area, recorded per facility, was obtained from the GPDH. This data
serves as the actual usage rates for each facility.
Road network: The 2010 version routable vector layer of the provincial and major roads,
including the in-depth street centre lines of the study area was obtained from AfriGIS (Pty)
Ltd. The road network is sufficiently complete and highly accurate as it covers the broad
transport routes of the study area. A road network is used for the reason that it takes into
consideration the natural and the built environment of the study area and can therefore
accurately simulate the way in which people would travel to facilities rather than using
straight-line distance. The prepared road network is used to create an origin-destination (OD)
matrix or table. For this study the unit for the distance measure is kilometres. Distance is

8
used rather than time because time would make interpreting the results difficult due to the
multitude of transport modes that can potentially be used by the population.
Facility data: This study focuses on public primary health care services and thus only
facilities that would act as a first point of contact were selected for analysis. These are
facilities offering level one services of the primary health care package and thus exclude
those facilities offering trauma and casualty services. The 2011 facility data set was obtained
from the GPHD and the suitability of the facilities was based on the following criteria: (1)
administered by the public sector; (2) has a fixed geographical location; and, (3) has
accessible attribute data about professional nurse clinical work days, operating days and
hours of the facilities. A total of 116 facilities were included in the analysis. Using the
capacity calculation formula, as developed by the Council of Scientific and Industrial
Research (CSIR), each facility was separately specified a capacity, i.e. translated into the
potential to accommodate visits (visits to a professional nurse in a facility). This excludes
any other services at a facility a person may use on the same day, for example X-rays, doctor
consultations, and obtaining medicines from the pharmacy (Green et al., 2012). Determining
capacity for each facility is crucial for such studies as information on, for example, staff
capacity impacts on how the facility serves the population demand. The capacity calculation
formula was adopted from Green et al. (2012) and adapted to:
pw / d = n [1]
and
n x s x ps x d = capacity [2]
where:
pw = professional nurse working days
n = number of nurses at a facility per shift
s = hours of operation of a facility
ps = number of patients a nurse can attend to in one shift
d = number of days per annum that the facility operates
Analysis units and reporting zones: To produce the analysis results on a more detailed level
the spatial layer of the study area was tessellated into equally sized hexagons of 20ha. The
tessellation is dimensioned in such a way that it subdivides the study area into smaller
uniform geographic units. With this level of spatial disaggregation the spatial resolution
remains sufficiently detailed to identify problems areas in the study area more accurately
than working with, for instance, sub-places or wards. Since the catchment area analysis
model links the centroid of the analysis units to the road network and from there to the
facilities being analysed, hexagons give a better distance estimate as the radius is the same

9
for all points on the perimeter. This distance calculation is the access distance estimate
applied to the entire population within a particular polygon and in the case of irregular
polygons the distance measure from the centroid will lead to a higher degree of error in the
estimated travel distance being generalised to a specific polygon (Mokgalaka et al., 2013).
While circles have a uniform radius, they do not nest tightly together but have gaps between
them. On the other hand, squares do nest within each other but the radius is unequal.
Hexagons are therefore a good compromise as they nest and mitigate the error in distance
measure from the sides to the centroid (Mokgalaka et al., 2013). The hexagons are then
spatially classified by the administration regions in which they are situated. The
administration regions are used for reporting purposes only and also to assist the planners of
the study area with a common platform from which to start discussions regarding identifying
priority areas.
Access standards: The 5km National Department of Health Standard for primary health care
(see 2011 & 2000 National Department of Health) was applied in this study. The 5km travel
standard is positively applied because it was specifically tailored based on the socio-
economic status of the study area in question by the Council of Scientific and Industrial
Research (CSIR) together with the GPDH for an accessibility study in 2013 (Green et al.,
2012). This 5km acceptable travel distance standard equates to a normal walking time of a
maximum of one hour.
2.2.2 Population data manipulation
The population demand for public primary health care is considered to be all the people who
do not have medical aid insurance, i.e. the uninsured population. Three methods to calculate
the uninsured population were derived based on a combination of three variables from the
population data: (a) household income category; (b) age; and, (c) average facility visits. The
three methods are labelled scenarios for (ease of) reference in this study and the following
discussion specifies how they were determined. Following income group studies by Van
Wyk and Van Aardt (2008), the StatsSA 2001 census income groups (R0-R9 600, R9 601-
R38 400, R38 401-R153 600, R153 601-R614 400, R614 400+) were adjusted with the
change in consumer price index (CPI) between 2001 and 2011. The groups therefore changed
to R0-R17 200, R17 201-R68 500, R68 501-R273 800, R273 801-R1 095 200 and
R1 095 200+. The adjusted income groups were then amended to coincide with the 2011
Census income groupings of R0-R19 200, R19 201-R76 800, R76 801-R307 200, R307 201-
R1 228 800 and R1 229 801+. The first two groups were consolidated into the low income,
the second group became middle income and the last two groups became high income.
Studies that were done to profile public primary health care include the 2011 general
household survey which was conducted by StatsSA in which the proportions of people per
income category who are uninsured and insured were established. A similar accessibility
10
study done by the CSIR in 2007 for eThekwini Municipality used the formula in scenario 2
(see below) to profile demand. This was adapted by the CSIR to develop a formula for
scenario 3 for a study done in the City of Johannesburg and eThekwini Municipality in 2013.
Both these scenarios were based on input from the Department of Health in each of the cities
(see also Green et al., 2012; Green & Mans, 2008).
• Scenario 1 (7 124 518 visits per annum): the status of uninsured is proportionally allocated
to the population in each income category using the uninsured population global total for the
study area as the control variable.
• Scenario 2 (7 149 055 visits per annum): all persons in the low income group and 50% of
persons in the middle income group are assigned the status of uninsured.
• Scenario 3 (7 416 886 visits per annum): using the income categories, persons from the
highest income category are first assigned the status of “insured” (insured population
estimates as published by the Council for Medical Schemes for 2011), and then people from
the next highest income category and so on until the total insured population has been
assigned. Once the total number of insured population is reached, the remainder of the
population is assigned the status as uninsured.
With regards to the average facility visits used; the count of four annual visits for > five years
and two annual visits for < five years which emanated from the 2011 study conducted by the Health
Systems Trust (2011, HST) was used. The uninsured population for each scenario (determined as
explained above) was multiplied by the annual average visits per age groupings to give the total
potential health visits for each scenario. The value used was visits because the unit representing the
demand attached to the origin locations should be the same unit representing capacities of the
destination locations (health facilities).
2.3 Analysis
The GIS support tool used in this study for measuring accessibility is the catchment area analysis
model. In brief, catchment area analysis determines the current situation of access with regards to
capacity and location from all the origin locations or areas to the nearest destination (facility).
Catchment area analysis is done using a GIS-based form of catchment allocation modelling which
allocates the demand from each origin area (household) to the closest facility (destination) using a
road network. In a catchment area analysis environment, capacity constraints and spatial
competition are considered in addition to the distance limit. Each origin (the hexagons described in
subsection 2.2.1) represents a value which indicates its demands (the number of potential visits
from each hexagon), and each destination location has a value which indicates the maximum
capacity (maximum amount of visits it can serve) of a facility. These demand and capacity values
are annual, thus for the 2011 calendar year in this case. The „visits‟ from the origin locations are
allocated to the nearest destination location, unless the capacity of that nearest destination has been

11
reached. In such a case the „visit‟ is then allocated to the next closest destination, and so on. Unlike
proximity counts, every „visit‟ in catchment area analysis is allocated only once given that the
distance from the „visit‟s origin‟ is not more than the set maximum standard of 5km travel distance.
This subsequently demarcates catchment areas around each facility and provides an insight into
how well the spatial distributions of facilities and their capacities fit the potential demand (visits).
The results are used to determine fine distinctions between areas that are well served or poorly
served by the current supply (capacity) of public primary health care facilities. This process is
carried out separately for each of the demand scenarios.
The catchment area analysis results from each of the three demand scenarios are compared with
actual usage rates, in the form of headcounts per facility recorded by the city, using the Pearson
Correlation Coefficient. The Pearson function syntax is used in order to reflect the extent of a linear
relationship between two data sets; in this study being the modelled allocated visits in terms of
demand and the actual visits in terms of headcounts or usage rates. The formula for the Pearson
function correlation coefficient, r, is:
[3]
where x and y are the sample means AVERAGE(array1) and AVERAGE(array2) (King et al.,
2011). This is done fundamentally to examine whether the total visits allocated or modelled per
facility in the catchment area analysis correlate with the number of visits actually generated by the
city population in the study year. The geocoded addresses from the patient register and the facility
they actually visited are analysed in a GIS environment to give insight into how far people actually
travel to seek health services, and also to determine actual areas of influence for each facility to
inform better planning for investment support and future service delivery.
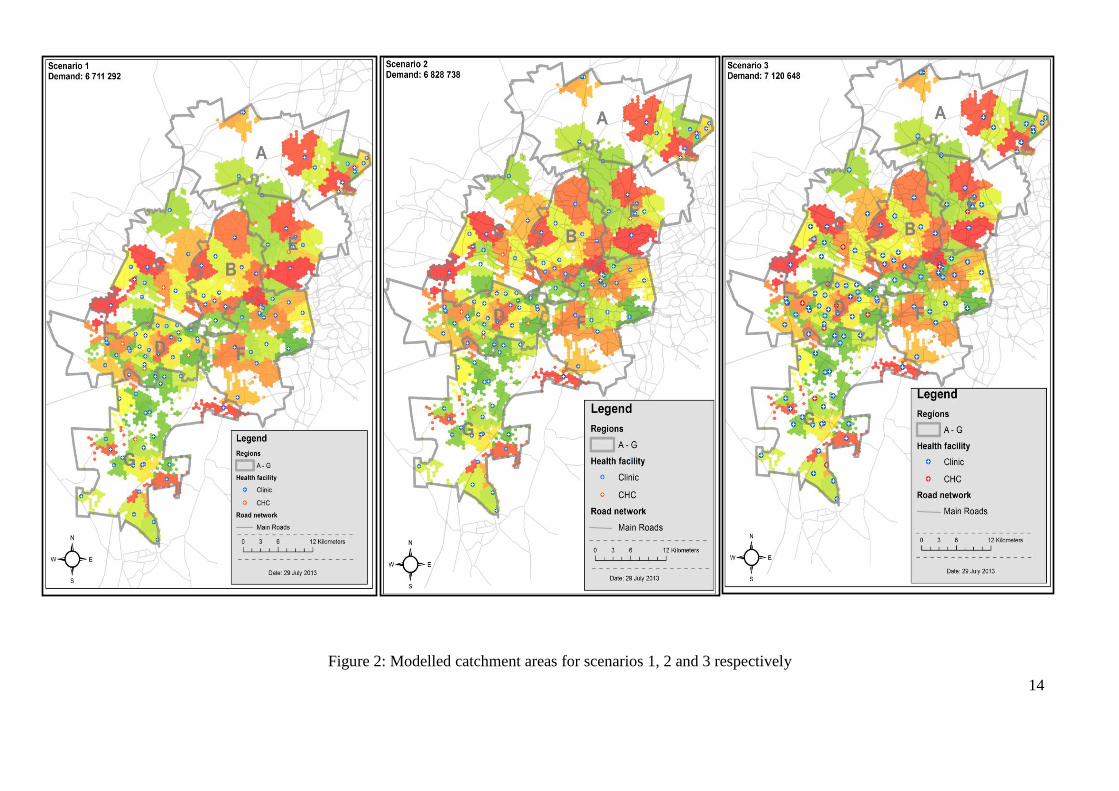
3. Results
The facilities in the city are in general located in line with the growth pattern of the settlement
areas. This is seen where a high density region such as G has more facilities which are in close
proximity to one another than region A and B for example (see Figure 1 and Figure 2). An
unconstrained distance and capacity catchment area analysis study for the City of Johannesburg by
CSIR (Green et al., 2012 reflected that travel distance to access a facility is equitably good as on
average the city population can reach a facility in less than 3.5km. This is particularly good given
that the national travel distance standard for primary health care is 5km, thus proving the realism of
the travel standard for this study area. As set out in section 2.2 above, three sets of demand data
were analysed - these being the three scenarios derived from the combinations of three variables.
The three scenarios were analysed to assess the spatial distribution of the population demand

12
relative to the distributions of facilities in general. The results shown in Figure 2 display the
catchment profiles or areas of the facilities as a result of the distance and capacity constrained
catchment area analysis discussed in section 2.3. Even though there is no significant difference in
the catchment area extent across the three scenarios, it is highlighted on Figure 2 that there is a
significant allocated demand increase per scenario: scenario 1 (6 711 292) < scenario 2 (6 828 738)
< scenario 3 (7 120 648).
Using Rosebank Clinic‟s catchment area as an example, it can, however, be noticed that the
spatial extent of the catchment area indicated by the arrows is different for each scenario. This is
because Rosebank Clinic is located in a high income area. Therefore, because in scenario 3 and 2 a
large number of the high income population were assigned the status of medically insured and thus
eliminated from the analysis, the facility then accommodates more visits from the surrounding
areas. Therefore it appears spatially wider in scenarios 2 and 3 than in scenario 1. The demand in
scenario 1, which has more high income population as proportionally allocated, quickly fills up the
Rosebank Clinic to its maximum capacity before it could even accommodate visits from other
surrounding areas, hence it appears to be covering a geographically small area in this scenario. The
facility, Sol Plaatjies Clinic, in region C appears on Figure 2 as if there is no demand or visits
allocated to it as the immediate surrounding areas are shaded with white. This is, however, not the
case as the areas with the demand or visits allocated to it are shaded with a light green and are
situated on the southern and northern side of the facility. The immediate areas shaded with white
are as a result of dasymetric mapping indicating non-residential area or no population.
The results in Figure 3 indicate the spatial extent versus the demand allocations of facilities in
low and high income areas. The results in Figure 3 should be read with reference to Figure 1b. The
point here is that the size or extent of the catchment is spatial and thus does not equate to demand.
In low income areas (Figure 3a), where facilities are in close proximity to one another, catchment
areas appear spatially smaller as compared to the wider catchment areas in Figure 3b. However, the
facilities in these areas accommodate or serve 70% of the entire city‟s health care demand. This is
because the facilities are located in the high density areas of the city. Just to expand on this point, if
one looks at the total allocated demand for the two facilities in Figure 3b, they are both almost half
the total of the allocated demand of the two facilities in Figure 3a. This explains why facilities in
areas shown in Figure 3b, low density areas, only accommodate or serve 10% of the demand. The
remaining 20% of the demand falls under facilities in the intermediate and sparsely dense areas.
The Pearson correlation coefficient results indicate that the modelled demand for all three
scenarios have a moderate positive correlation with the facility headcounts or visits. In comparison
to one another, scenarios 2 and 3 have a slightly higher moderate positive correlation of 0.35 while
scenario 1 has a moderate positive correlation of 0.34. The proportion of facilities which have a
13
modelled demand equal to or greater than the headcounts or visits are 53%, 54% and 55% for
scenarios 1, 2 and 3 respectively.
After geocoding the residential addresses from the patient register it was found that 44.26%
patients did not use their closest facility. This means that 44.26% of the patients did not reside in the
catchment areas of the facilities they visited and only 1% of the patients resided outside the city
boundary. There is the noticeable trend of a considerable number of patients, from the southern
suburbs, using facilities in the Central Business District (CBD) of the study area. Various reasons
can be attached to these results but it is not possible to identify these from the data set used in this
study. Reasons may relate to a perception of better services, availability of treatment, knowledge of
capacity due to long queues at closer facilities, need for specialised procedures, mobility and the
transport network, and workplaces being located next to a facility. However, it is not within the
scope of this study to confirm this reasoning.
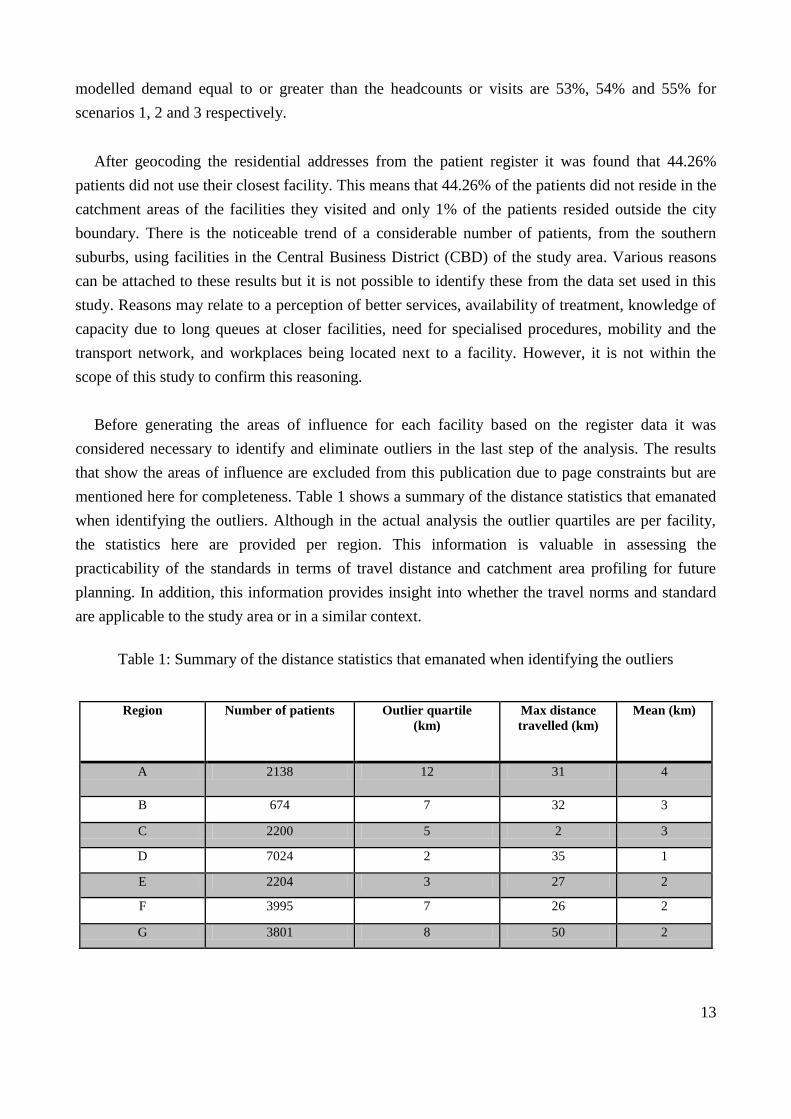
Before generating the areas of influence for each facility based on the register data it was
considered necessary to identify and eliminate outliers in the last step of the analysis. The results
that show the areas of influence are excluded from this publication due to page constraints but are
mentioned here for completeness. Table 1 shows a summary of the distance statistics that emanated
when identifying the outliers. Although in the actual analysis the outlier quartiles are per facility,
the statistics here are provided per region. This information is valuable in assessing the
practicability of the standards in terms of travel distance and catchment area profiling for future
planning. In addition, this information provides insight into whether the travel norms and standard
are applicable to the study area or in a similar context.
Table 1: Summary of the distance statistics that emanated when identifying the outliers
Region Number of patients Outlier quartile
(km)
Max distance
travelled (km)
Mean (km)
A 2138 12 31 4
B 674 7 32 3
C 2200 5 2 3
D 7024 2 35 1
E 2204 3 27 2
F 3995 7 26 2
G 3801 8 50 2
14
Figure 2: Modelled catchment areas for scenarios 1, 2 and 3 respectively

15
A B
Figure 3: Comparativeness of the spatial extent versus demand allocations of facilities in low (A) and high (B) income areas
77 831 allocated demand
70 792 allocated demand
36 135 allocated demand
23 473 allocated demand

16
4. Discussion
GIS-based accessibility analysis is not the complete solution to understanding the problems of
access to public health care services but it is an important way in which to better illuminate how
humans interact with their environment to create or deter health (Ricketts, 2003). GIS-based
accessibility analysis is useful for determining potential access to a service. Establishing the
demand profile for such potential access for public health care facilities is crucial, especially when
taking into account rapid population growth and continuous migration trends. This is relevant to
health planners for decision making in terms of, for example, potential investment in a new facility.
The results of the analyses provide a useful support structure to ensure that services are planned
based on an equitable and fair spatial distribution.
However, the use of GIS-based accessibility or rather a catchment area analysis model is based
on the assumption of rational behaviour, which assumes people will use the closest facility to home.
It is also assumed that people will not use overburdened facilities. These limitations highlight the
need to compare results to actual usage rates at facilities and / or to conduct sample surveys with
regard to people‟s choice of facility and their reasons for not using the closest facility. This implies
that the problem of access lies not only in the locations or number of facilities but also with other
factors (Lin et al., 2005). Even though the patient register was used in this study, the data was not
detailed enough for the required analysis. The patient register data was able to show that 44.26% of
patients did not use their closest facility due to either accessing facilities from their place of
employment or because of the way the transport routes traverse the study area. Where there is
available employment data of the population, a demand proportion from the workplace could be
generated as input into the analysis. To provide a representation that is closer to reality, detailed
utilisation data and comprehensive information about the population‟s demographics is required. It
is no use knowing that one is living in an area with abundant health care facilities if the resources
are inaccessible. And it is also of little consolation providing a service in an area and not having the
data or resources to evaluate its performance. Owing to a lack of data in the health care sector, such
data incorporation is currently not possible.
5. Conclusion
This paper describes the accessibility analysis process and findings with regards to determining
public primary health care demand in a South African metropolitan area using GIS tools. Three
different approaches to calculating public primary health care demand were created and tested using
a catchment area analysis model. The different demand estimates (scenarios) tested did not show
any significant difference in the spatial extent of the catchment areas of facilities. However, the
total demand per scenario increased significantly from scenario 1 through to scenario 3. The total
allocated demand in scenario 3 was strongly in line with the total number of facility visits recorded
in the city and thus had a moderate positive correlation. It is important to regularly test the result
17
outputs from the GIS-based analysis against usage rates or actual data. The findings from this study
can help in terms of supporting the attainment of more equitable access standards and the
development of facility plans that are spatially more in line with residential density patterns and
actual facility usage behaviour.
6. References
Ahmad, P, Chirisa, I, Magwaro-Ndiweni, L, Muchindu, MW, Ndlela, WN, Nkonge, M and Sachs, D 2010.
Urbanising Africa: The city centre revisited – experiences with inner-city revitalization from
Johannesburg (South Africa, Mbabane (Swaziland), Lusaka (Zambia), Harare and Bulawayo
(Zimbabwe), 26/2010, IHS: Institute for Housing and Urban Development Studies, viewed 16 January
2013,
<https://www.google.co.za/url?sa=f&rct=j&url=http://www.ihs.nl/fileadmin/ASSETS/ihs/IHS_Publicatio
n/IHS_Working_Paper/IHS_WP_026_Ahmad_Ayala_Chirisa_Geurts_Magwaro_Muchindu_Ndlela_Nko
nge_Sachs_Urbanising_Africa_the_city_centre_revisite.pdf&q=&esrc=s&ei=3yX5UMjoHsWFhQfHqY
CIDg&usg=AFQjCNGtb86ol3-ioEG87jABLAlLqfEo9g>
Al-Taiar, A, Clark, A, Longenecker, JC and Whitty, CJM 2010. „Physical accessibility and utilization of
health services in Yemen‟, International Journal of Health Geographics, vol. 9, pp. 38.
Amer, S, 2007, Towards spatial justice in urban health services planning - a spatial analytic GIS-based
approach using Dar es Salaam, Tanzania as a case study, International Institute for Geo-Information
Science and Earth, The Netherlands.
Apparicio, P and Séguin, AM 2006. „Measuring the accessibility of services and facilities for residents of
public housing in Montréal‟, Urban Studies, vol. 43, no. 1, pp. 187-211.
Bagheri, N, Benwell, GL and Holt, A 2005. “Measuring spatial accessibility to primary health care”,
Proceedings 17th Annual Colloquium of the Spatial Information Research Centre University of Otago,
Dunedin, New Zealand, November 2005.
Green, C, Morojele, N and de Jong, T 2007. „Strategic accessibility assessment of facility needs to support
quality living environments: identification of facility backlogs to develop intergrated interventions‟,
GSDR, Utrecht: KNAG.
Green, CA, Mans, G, Le Roux, A, Schmitz, P, Mokgalaka, M, McKelly, D, Ngidi, M, Badenhorst, W &
Zietsman, HL 2012, Geographic accessibility study of social facility and government service points for
the Metropolitan Cities of Johannesburg and eThekwini 2011/12. Report No.
CSIR/BE/SPS/ER/2012/0061/B, CSIR, Pretoria.
Green, CA. and Mans, GG 2008, eThekwini accessibility mapping and optimisation of community social
services 2008, CSIR/BE/SPS/ER/2008/0055/B, CSIR, Pretoria.
Joseph, AE & Phillips, DR 1984, Accessibility and utilization: geographical perspectives on health care
delivery, Harper & Row Ltd, London.
King, BM, Rosopa, PJ & Minium, EW 2011, Statistical reasoning in the behavioural Sciences, 6th edition,
John Wiley & Sons Inc, United States of America.
Lin, SJ, Crawford, SY and Warren, JW 2005. „Potential access and revealed access to pain management
medications‟, Social Science and Medicine, vol. 60, pp. 1881-1891.
Mans, G 2012. „Developing a geo-data frame to facilitate data integration (Part 1)‟. PositionIT, April/May
2012 Issue, pp. 40-43.
McGrail, MR 2012. „Spatial accessibility of primary health care utilising the two step floating catchment
area method: an assessment of recent improvements‟, International Journal of Health Geographics, vol.
11, pp. 50.

18
McLafferty, SL 2003. „GIS and health care‟, Annual Review of Public Health, vol. 24, pp. 25-42.
Mokgalaka, H, Mans, G, Smit, J and McKelly, D 2013. “GIS-based accessibility analysis- a mixed method
approach to determine public primary health care demand in South Africa”, Proceedings Global
Geospatial Conference (Combined AfricaGIS and GSDI 14 Conference), Addis Ababa, Ethiopia,
November 2013.
Richards, R, Ismail, Z, Mutsonziwa, K, Kimmie, Z, Wildschutt, A, Delany, A and Moloi, T 2006. A quality
of life survey in low-income areas in the City of Johannesburg, Community Agency for Social Enquiry
(CASE), viewed 25 May 2012,
<http://www.case.org.za/~caseorg/images/docs/quality_of_life.pdf>
Ricketts, TC 2003. „Geographic information systems and public health‟, Annual Review of Public Health,
vol. 24, pp. 1-6.
Scott, D, Curtis, B and Twumasi, FO 2002. „Towards the creation of a health information system for cancer
in KwaZulu-Natal, South Africa‟, Health and Place, vol. 8, pp. 237-249.
Van Wyk, H de J and Van Aardt, CJ 2008. Personal income of South Africans by municipality, 2006,
Research Report 369, Bureau of Market Research, UNISA, Pretoria.
2011. City of Johannesburg: 2011/12 integrated development plan (IDP) – focusing on the basics and
preparing for long term, viewed 14 November 2012,
<http://www.joburg-archive.co.za/2011/pdfs/idp201112.pdf>.
2011. HST Utilisation Rate PHC <5 Years, viewed 14 October 2012,
<http://indicators.hst.org.za/healthstats/226/data>.
2011. HST Utilisation Rate PHC, viewed 13 October 2012,
<http://indicators.hst.org.za/healthstats/116/data>.
2011. National core standards for health establishments in South Africa - National Department of Health,
viewed 25 May 2012,
<http://www.sarrahsouthafrica.org/LinkClick.aspx?fileticket=YnbSHfR8S6Q%3D&tabid=2327>.
2000. The Primary Health Care Package for South Africa – a set of norms and standards. Department of
Health, Pretoria, Viewed 25 May 2012,
< http://www.doh.gov.za/docs/policy/norms/full-norms.html>