validation methodologies for construction engineering and
TRANSCRIPT

Validation Methodologies for
Construction Engineering and
Management Research
by
Jiali Liu
A thesis
presented to the University of Waterloo
in fulfillment of the
thesis requirement for the degree of
Master of Applied Science
in
Civil Engineering
Waterloo, Ontario, Canada, 2013
© Jiali Liu 2013

ii
AUTHOR'S DECLARATION
I hereby declare that I am the sole author of this thesis. This is a true copy of the thesis, including any
required final revisions, as accepted by my examiners.
I understand that my thesis may be made electronically available to the public.

iii
Abstract
Validation of results is an important phase in the organization of a researcher’s work. Libraries and
the internet offer a number of sources for guidance with respect to conducting validation in a variety
of fields. However, construction engineering and management (CEM) is an area for which such
information is unavailable. CEM is an interdisciplinary field, comprised of a variety of subjects:
human resources management, project planning, social sciences, etc. This broad range means that the
choice of appropriate validation methodologies is critical for ensuring a high level of confidence in
research outcomes. In other words, the selection of appropriate validation methodologies represents a
significant challenge for CEM researchers. To assist civil engineering researchers as well as students
undertaking master’s or doctoral CEM studies, this thesis therefore presents a comprehensive review
of validation methodologies in this area. The validation methodologies commonly applied include
experimental studies, observational studies, empirical studies, case studies, surveys, functional
demonstration, and archival data analysis. The author randomly selected 365 papers based on three
main perspectives: industry best practices in construction productivity, factors that affect labour
productivity, and technologies for improving construction productivity. The validation methodologies
that were applied in each category of studies were examined and recorded in analysis tables. Based on
the analysis and discussion of the findings, the author summarized the final results, indicating such
items as the highest percentage of a particular methodology employed in each category and the top
categories in which that methodology was applied. The research also demonstrates a significant
increasing trend in the use of functional demonstration over the past 34 years. As well, a comparison
of the period from 1980 to 2009 with the period from 2010 to the present revealed a decrease in the
number of papers that reported validation methodology that was unclear. These results were validated
through analysis of variation (ANOVA) and least significant difference (LSD) analysis. Furthermore,
the relationship between the degree of validation and the number of citations is explored. The study
showed that the number of citations is positively related to the degree of validations in a specific
category, based on the data acquired from the examination of articles in Constructability and Factors
categories. However, based on the data acquired from the examination of articles in the year 2010, we
failed to conclude that there existed significant difference between clear-validation group and unclear
validation group at the 95 % confidence level.

iv
Acknowledgements
I would like to express my sincerest appreciation and gratitude to my supervisor, Dr. Carl T. Haas, for
his patient guidance, inspiring motivation, and generous and unconditional help and support. Without
his assistance, this thesis could not have been completed.
I would like to thank the readers of my thesis, Dr. Tarek Hegazy and Dr. Giovanni Cascante, for their
insightful comments and suggestions.
I would like to express special thanks to Ms. Barbara Trotter for her patient proofreading help. Her
valuable advice contributed a great deal to this thesis.
I would also like to acknowledge and say how much I valued the helpful advice I received from my
officemate Di Zhang as well as from A. J. Antony Chettupuzha, Shahin Karimidorabati, Hasaan
Nasir, Mohammad Nahangi, Mahdi Safa, Arash Shahi, Samin Shokri, Maryam Shahtaheriand
Yasaman Shahtaheri, etc.
I’m also grateful to the Constructional Industry Institute for providing support and the opportunity to
attend meetings in the United States.
Last but not least, I would especially like to thank my parents for their unconditional love and
support. They have always been there to encourage me.
v
Table of Contents
AUTHOR'S DECLARATION ............................................................................................................... ii
Abstract ................................................................................................................................................. iii
Acknowledgements ............................................................................................................................... iv
Table of Contents ................................................................................................................................... v
List of Figures ....................................................................................................................................... ix
List of Tables .......................................................................................................................................... x
Chapter 1 Introduction ............................................................................................................................ 1
1.1 Background and Motivation ......................................................................................................... 1
1.2 Objectives ..................................................................................................................................... 1
1.3 Scope ............................................................................................................................................ 2
1.4 Research Methodology ................................................................................................................. 3
1.5 Thesis organization ....................................................................................................................... 3
Chapter 2 Background and Literature Review ....................................................................................... 7
2.1 Introduction to Validation ............................................................................................................ 7
2.2 Validation Methodologies for a Variety of Research Fields ........................................................ 8
2.2.1 Biology Methodologies ......................................................................................................... 8
2.2.2 Chemical Engineering Methodologies .................................................................................. 8
2.2.3 Computer Science Methodologies ......................................................................................... 8
2.2.4 Education Methodologies ...................................................................................................... 9
2.2.5 Human Resources Management Methodologies ................................................................... 9
2.2.6 Medical Science Methodologies ............................................................................................ 9
2.2.7 Physics Methodologies ........................................................................................................ 10
2.2.8 Psychology Methodologies ................................................................................................. 10
2.2.9 Summary ............................................................................................................................. 10
2.3 Validation Methodologies in Construction Engineering and Management ............................... 11
2.3.1 Introduction to Validation Methodologies in CEM ............................................................. 11
2.3.2 Literature Review of Methodologies ................................................................................... 12
2.4 Scientific Versus Business Validation ........................................................................................ 20
2.5 Engineering versus Management in Construction ...................................................................... 20
2.5.1 Construction Engineering .................................................................................................... 20

vi
2.5.2 Construction Management .................................................................................................. 20
2.5.3 Comparison of Engineering and Management with Respect to Construction .................... 21
2.6 Productivity in Construction Engineering and Management ..................................................... 22
2.6.1 Practices .............................................................................................................................. 22
2.6.2 Influencing Factors ............................................................................................................. 25
2.6.3 Technology ......................................................................................................................... 29
2.7 Meta-Analysis ............................................................................................................................ 30
2.7.1 Definition of Meta-Analysis ............................................................................................... 30
2.7.2 Meta-Analysis Procedures .................................................................................................. 30
2.7.3 Advantages and Disadvantages ........................................................................................... 31
2.7.4 The Only Known Example of Meta-Analysis in CEM ....................................................... 33
2.8 Search Engines ........................................................................................................................... 33
2.9 Summary .................................................................................................................................... 33
Chapter 3 Methodology of the Research .............................................................................................. 35
3.1 Introduction ................................................................................................................................ 35
3.2 Structural Design of the Analysis Tables ................................................................................... 35
3.2.1 Columns .............................................................................................................................. 35
3.2.2 Categories of Sources.......................................................................................................... 36
3.3 Principles of the Application of the Validation Methodology Classifications ........................... 37
Chapter 4 Characterization of Research Practices ............................................................................... 41
4.1 Introduction ................................................................................................................................ 41
4.2 Analysis Tables .......................................................................................................................... 41
4.2.1 Constructability Analysis Table .......................................................................................... 41
4.2.2 Zero Accident Techniques Analysis Table ......................................................................... 46
4.2.3 Resource Leveling Analysis Table...................................................................................... 51
4.2.4 Alignment Analysis Table .................................................................................................. 54
4.2.5 Knowledge Management Analysis Table ........................................................................... 57
4.2.6 Risk Management Analysis Table ...................................................................................... 62
4.2.7 Contract and Project Delivery Analysis Table .................................................................... 66
4.2.8 Craft Training Analysis Table ............................................................................................. 71
4.2.9 Site Layout Analysis Table ................................................................................................. 74
4.2.10 Short-Term Scheduling Analysis Table ............................................................................ 78
vii
4.2.11 Factors Analysis Table ...................................................................................................... 80
4.2.12 Technologies Analysis Table............................................................................................. 85
Chapter 5 Analysis and Discussion of Results ..................................................................................... 90
5.1 Introduction ................................................................................................................................ 90
5.2 Distribution of Validation Methodologies in Each Source Category ......................................... 90
5.2.1 Summary of Distribution Results ........................................................................................ 90
5.2.2 Analysis and Discussion of Distribution Results ................................................................ 90
5.2.3 Summary ........................................................................................................................... 107
5.3 Distribution of Source Categories for Each Type of Validation Methodology ........................ 108
5.3.1 Summary of Distribution Results ...................................................................................... 108
5.3.2 Analysis and Discussion of Distribution Results .............................................................. 111
5.3.3 Discussion ......................................................................................................................... 117
5.4 Trends in the Use of Validation Methodologies over the Past 33 Years .................................. 119
5.4.1 The Trend Results .............................................................................................................. 119
5.4.2 Validation of the Trend Results ......................................................................................... 120
5.5 The Relationship between the Degree of Validation and the Number of Citations ................. 124
5.5.1 Introduction ....................................................................................................................... 124
5.5.2 The Relationship in a Specific Category ........................................................................... 125
5.5.3 The Relationship in a Specific Year .................................................................................. 129
Chapter 6 Barriers to the Application of Meta-Analysis in CEM ...................................................... 132
6.1 Introduction .............................................................................................................................. 132
6.2 Coding Process ......................................................................................................................... 132
6.3 Data Source .............................................................................................................................. 133
6.4 Summary .................................................................................................................................. 133
Chapter 7 Conclusions and Recommendations for Future Research .................................................. 134
7.1 Introduction .............................................................................................................................. 134
7.2 Findings and Conclusions......................................................................................................... 134
7.2.1 Findings Related to the Distribution of Validation Methodologies in Each Source Category
.................................................................................................................................................... 134
7.2.2 Findings Related to the Distribution of Source Categories in Each Validation Methodology
.................................................................................................................................................... 135

viii
7.2.3 Findings Related to Trends in the Usage of Validation Methodologies over the Past 33
Years .......................................................................................................................................... 135
7.2.4 Findings Related to the Relationship between the Degree of Validation and the Number of
Citations ..................................................................................................................................... 136
7.3 Recommendations for Future Research ................................................................................... 136
References .......................................................................................................................................... 137
Appendix A Source of Examined Articles ......................................................................................... 143
Appendix B Bibliography of Examined Articles ............................................................................... 145
ix
List of Figures
Figure 1-1 Research Methodology ......................................................................................................... 4
Figure 2-1 Meta-Analysis Procedures .................................................................................................. 32
Figure 5-1 Distribution of Validation Methodologies Used in the Constructability Category ............ 93
Figure 5-2 Distribution of Validation Methodologies Used in the Zero Accident Techniques Category
.............................................................................................................................................................. 95
Figure 5-3 Distribution of Validation Methodologies Used in the Resource Leveling Category ........ 96
Figure 5-4 Distribution of Validation Methodologies Used in the Alignment Category ..................... 97
Figure 5-5 Distribution of Validation Methodologies Used in the Knowledge Management Category
.............................................................................................................................................................. 99
Figure 5-6 Distribution of Validation Methodologies Used in the Risk Management Category ....... 100
Figure 5-7 Distribution of Validation Methodologies Used in the Contract and Project Delivery
Category ............................................................................................................................................. 101
Figure 5-8 Distribution of Validation Methodologies Used in the Craft Training Category ............. 103
Figure 5-9 Distribution of Validation Methodologies Used in the Site Layout Category .................. 104
Figure 5-10 Distribution of Validation Methodologies Used in the Short-Term Scheduling Category
............................................................................................................................................................ 105
Figure 5-11 Distribution of Validation Methodologies Used in the Factors Category ...................... 105
Figure 5-12 Distribution of Validation Methodologies Used in the Technologies Category ............. 107
Figure 5-13 Distribution of the Use of Experimental Studies ............................................................ 111
Figure 5-14 Distribution of the Use of Observational Studies ........................................................... 112
Figure 5-15 Distribution of the Use of Empirical Studies .................................................................. 113
Figure 5-16 Distribution of the Use of Case Studies .......................................................................... 114
Figure 5-17 Distribution of the Use of Surveys ................................................................................. 114
Figure 5-18 Distribution of the Use of Functional Demonstration .................................................... 115
Figure 5-19 Distribution of the Use of Archival Data Analysis ......................................................... 116
Figure 5-20 Distribution of Unclear-Validation Papers ..................................................................... 117
Figure 5-21 Number of Citations in the Constructability Category ................................................... 128
Figure 5-22 Number of Citations in the Factors Category ................................................................. 128
x
List of Tables
Table 2-1 Validation Methodologies Used in a Variety of Fields ....................................................... 11
Table 2-2 Summary of CEM Validation Methodologies ..................................................................... 18
Table 3-1 Index of Category Abbreviations ........................................................................................ 37
Table 3-2 Example of the Constructability Analysis Table ................................................................. 39
Table 3-3 Features of Each Validation Methodology .......................................................................... 40
Table 4-1 Code Name Index for the Constructability Category .......................................................... 42
Table 4-2 Analysis Table for the Constructability Category ............................................................... 44
Table 4-3 Code Name Index for the Zero Accident Techniques Category .......................................... 47
Table 4-4 Analysis Table for the Zero Accident Techniques Category ............................................... 49
Table 4-5 Code Name Index for the Resource Leveling Category ...................................................... 51
Table 4-6 Analysis Table for the Resource Leveling Category ........................................................... 53
Table 4-7 Code Name Index for the Alignment Category ................................................................... 54
Table 4-8 Analysis Table for the Alignment Category ........................................................................ 56
Table 4-9 Code Name Index for the Knowledge Management Category ............................................ 58
Table 4-10 Analysis Table for the Knowledge Management Category ............................................... 60
Table 4-11 Code Name Index for the Risk Management Category ..................................................... 62
Table 4-12 Analysis Table for the Risk Management Category .......................................................... 64
Table 4-13 Code Name Index for the Contract and Project Delivery Category .................................. 67
Table 4-14 Analysis Table for the Contract and Project Delivery Category ....................................... 69
Table 4-15 Code Name Index for the Craft Training Category ........................................................... 72
Table 4-16 Analysis Table for the Contract and Craft Training Category........................................... 73
Table 4-17 Code Name Index for the Site Layout Category ............................................................... 74
Table 4-18 Analysis Table for the Site Layout Category .................................................................... 76
Table 4-19 Code Name Index for the Short-Term Scheduling Category ............................................ 78
Table 4-20 Analysis Table for the Short-Term Scheduling Category ................................................. 79
Table 4-21 Code Name Index for the Factors Category ...................................................................... 81
Table 4-22 Analysis Table for the Factors Category ........................................................................... 83
Table 4-23 Code Name Index for the Technologies Category ............................................................ 85
Table 4-24 Analysis Table for the Technologies Category ................................................................. 88
Table 5-1 Summary of Validation Methodology Distribution Results for Each Source Category ...... 92

xi
Table 5-2 Top Validation Methodologies in Each Source Category .................................................. 108
Table 5-3 Source Category Distribution Results for Each Validation Methodology ......................... 110
Table 5-4 Percentages of Validation Methodology Use over Four Time Spans ................................ 119
Table 5-5 Functional Demonstration Data Points in Each Group ...................................................... 121
Table 5-6 Summary of Functional Demonstration Parameters in Each Group .................................. 121
Table 5-7 ANOVA of Functional Demonstration (α = 5 %) .............................................................. 121
Table 5-8 Analysis of the LSD for Functional Demonstration (α = 5 %) .......................................... 122
Table 5-9 Unclear-Validation Data Points in Each Group ................................................................. 123
Table 5-10 Summary of Unclear-Validation Parameters in Each Group ........................................... 123
Table 5-11 ANOVA of Unclear-Validation (α = 5 %) ....................................................................... 123
Table 5-12 Analysis of the LSD of Unclear-Validation (α = 5 %) .................................................... 124
Table 5-13 Number of Citations in the Constructability Category..................................................... 126
Table 5-14 Number of Citations in the Factors Category .................................................................. 127
Table 5-15 Citation Numbers of Each Article in Year 2010 .............................................................. 130
Table 5-16 Summary of the Number of Citations in Each Group ...................................................... 130
Table 5-17 ANOVA of the Number of Citations (α = 5 %) ............................................................... 131


1
Chapter 1
Introduction
1.1 Background and Motivation
In performing a comprehensive study, researchers generally organize their work in three phases:
develop a proposal for the research, conduct the research, and validate the results. All three phases are
critical for the success of the research. For a variety of research fields, libraries and the internet offer
numerous sources of detailed instructions for developing a project and for validating the results.
However, construction is one area for which such information is not available. Although some studies
have examined validation methodologies in general, only a few have discussed in detail the
application of these methodologies to construction engineering and management research.
The importance of validation is universally acknowledged. According to The Advanced Learner's
Dictionary of Current English (1963), the term is defined as the process of rendering an element
legally valid and ratified or of making an entity logical or justifiable. The latter meaning is the one
that applies to academic research. In the work conducted for this thesis, any techniques that include
one of the following features are considered to be validation methodologies:
Presentation of evidence to support observations or conclusions
Demonstration of the accuracy of the research at a specific level
Applying appropriate methodologies for validating results, however, is a challenge to investigators
working in construction engineering and management research, because this area is interdisciplinary,
comprised of a variety of subjects: human resources management, project planning, social sciences,
systems engineering, etc. This broad range means that appropriate validation methodologies must be
selected in order to ensure a high level of confidence in the outcome of the research. Detailed
investigation and analysis of the methodologies authors have used for validating their results are thus
imperative. This thesis therefore presents a comprehensive review of validation methodologies for
construction engineering and management (CEM) research.
1.2 Objectives
This thesis focuses primarily on the investigation of CEM validation methodologies. The particular of
goal of the research is to assist civil engineering researchers as well as students undertaking studies in

2
this area for master’s or doctoral degrees so that they can select appropriate methodologies for
validating their results. The main goal includes the following objectives:
Understand the importance of choosing appropriate validation methodologies.
Clarify the definition of each validation methodology.
Identify the features of each validation methodology.
Describe published articles about CEM research, and develop specific categories for their
classification.
Determine the percentage of each methodology in each category, and explore the principles
underlying the application of each methodology in CEM research.
Explore the trends in academic practice in construction engineering.
Explore the question of whether degree of validation relates to the number of citations and
validate the results.
Attempt to gain insight into why specific validation approaches prevail in key areas of
CEM research.
The achievement of these objectives will not only contribute to the overall goal but will also help
researchers acquire a better understanding of this topic.
1.3 Scope
The papers selected for this research are related to construction engineering and management, with
particular emphasis on the improvement of labour productivity. Labour productivity is defined as the
number of labour hours per unit output in an industry. In 2007, the Construction Industry Institute
(CII) developed a 5-phase program to help industries determine the amount of any improvement and
assigned this program to Research Team 252 (RT 252) (CII: Research Team 252, 2009). RT 252 has
thus been working on this program for about six years, and their efforts have resulted in breakthrough
improvements in construction productivity.
The topics of the papers studied for this thesis were chosen primarily from Best Practices (CII:
Research Team 252, 2011) and The Productivity Handbook (CII: Research Team 252, 2013). To
enhance the accuracy of this research, articles have been randomly selected from a variety of
databases, with publication dates ranging from the early 1980s to the present.
3
1.4 Research Methodology
To achieve the research objectives, the following steps were followed:
Prior to a comprehensive literature review of CEM validation methodologies, conduct a
review of the background and literature related to validation methodologies in general:
those related to a variety of subjects, such as computer science, education, management
science, chemical engineering, and medical science.
Thoroughly review the literature related to CEM validation methodologies.
Clarify the definition of each CEM validation methodology, and explore the features of
individual methodologies so that they can be differentiated.
Develop appropriate tables for collecting the data related to validation methodologies, as
reported in selected publications, and carefully enter the data.
Synthesize the data and literature reviews.
Statistically analyze the data, and validate the results.
Draw conclusions based on the research.
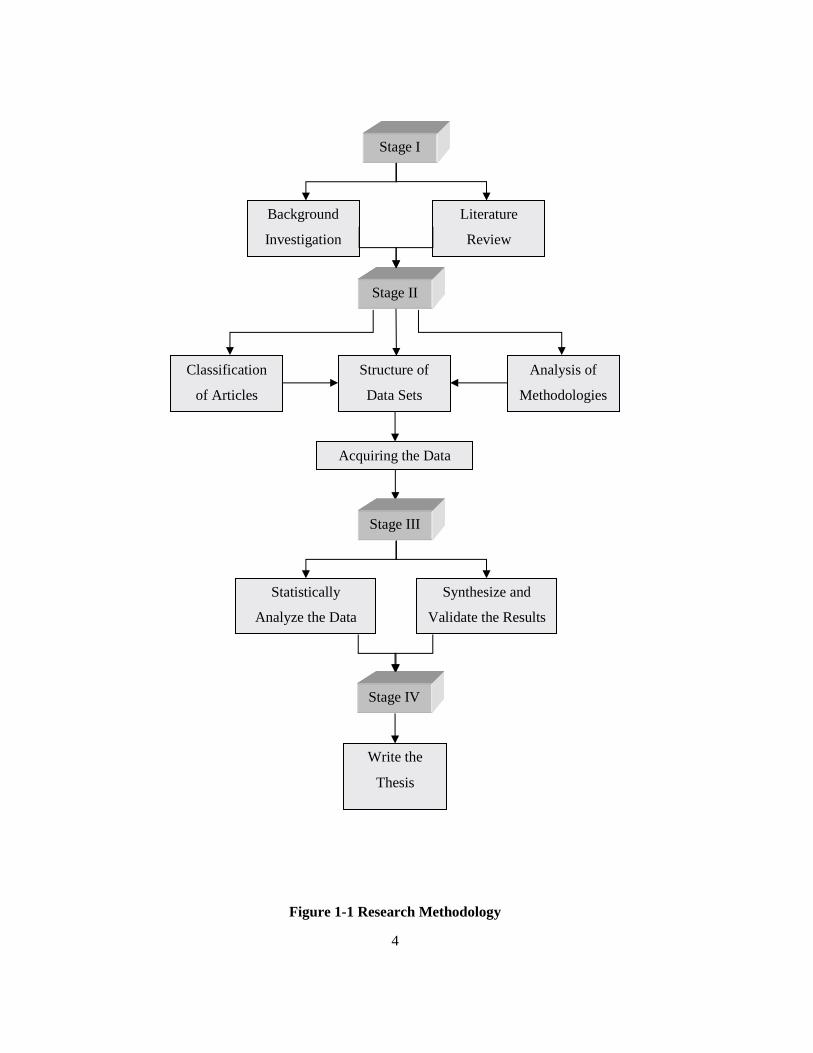
Figure 1-1 illustrates the research methodology, which includes the process of completing the
thesis.
1.5 Thesis organization
Seven chapters address the process and achievements of the research, beginning with this
introductory chapter.
Chapter 2 presents the background about and a literature review of validation methodologies. It
includes 9 sections:
The first three sections examine validation methodologies that are applied to a variety of areas,
with the third section focusing on a comprehensive review of articles about CEM research
methodologies.
The fourth section compares scholarly validation and business case validation.
The fifth section provides a comparison of engineering and management in the area of
construction.
4
Figure 1-1 Research Methodology
Stage I
Background
Investigation
Literature
Review
Stage II
Classification
of Articles
Structure of
Data Sets
Analysis of
Methodologies
Acquiring the Data
Stage III
Synthesize and
Validate the Results
Statistically
Analyze the Data
Stage IV
Write the
Thesis

5
The sixth section outlines a major concern with respect to construction: labour productivity.
Three classes of sources of influence on labour productivity are introduced in this section.
The seventh section presents a relatively new validation methodology, called meta-analysis,
which is not commonly used in the construction area but which has future potential because of
its advantages.
As a useful tip for readers, the second last section describes how to use search engines to find
information about a specific subject efficiently.
The last section summarizes Chapter 2.
Chapter 3 illustrates the process of designing the structure of the analysis tables used in this
research and the principles underlying the classification of the articles. It explains how each article
fits into each corresponding category, what differentiates each methodology, and which features
apply to each methodology. All of the articles presented in this chapter focus on improving
productivity from three main perspectives: industry best practices in construction productivity, factors
that affect labour productivity, and technologies for improving construction productivity. The best
practices category includes 10 subcategories, with the investigation covering an average of 30 papers
for each subcategory, for a total of about 300 papers. The other two categories encompass a total of
about 40 papers each.
Chapter 4 includes all the tables showing the data entered. A detailed example of the method of
classifying papers in each category is also presented as clarification of the application of the
classification principles.
Chapter 5 provides an explanation of the analysis and a discussion of the results. Also included is a
summary of the final results, indicating such items as the highest percentage of a particular
methodology in each category, the top categories that apply to that methodology, the trends in the
usage of validation methodologies over the past 33 years and the relationship between the degree of
validation and the number of citations.
Chapter 6 introduces the barriers to the application of meta-analysis in construction engineering
and management.
Chapter 7 presents comprehensive conclusions and recommendations for further research as well as
an overview of the entire study.

6
There are two appendices included in this thesis. Appendix A presents all the journals and sources
that the examined articles come from. Appendix B presents the detailed bibliography information of
each examined article.

7
Chapter 2
Background and Literature Review
2.1 Introduction to Validation
Validation refers to the process of making an entity legally valid and ratified or making an item
logical or justifiable. Two main considerations associated with the validation process are internal and
external validity (Leedy, 1980). Internal validity indicates the causality among multiple variables that
interact with one another. External validity denotes the induction and generalizability of research
results for the purpose of prediction (Leedy, 1980). CEM studies must be conducted in real-life
settings, which entail numerous uncontrollable and unpredictable variables that affect the results
(Lucko & Rojas, 2010). The consequent complicated interactions among such variables create
challenges with respect to both internal and external validity, because the ability to generalize results
requires that the study sample be representative, a requirement that is difficult to meet. Randomizing
the sample is considered to be one option for overcoming this difficulty.
In addition to these two main types of validity, other components of validation include face validity,
content validity, criterion validity, and construct validity (Lucko & Rojas, 2010). Briefly, face
validity means that non-researchers consider the research results valid (Leedy, 1980). Content validity
is related to the degree that the contents of the study, such as tasks, activities, and events, can
represent actual real occurrences (Lucko & Rojas, 2010). Criterion validity refers to the correlation
between one assessment instrument and another (Babbie, 1973). Construct validity is established
based on a true match between the research measurement tools and the study objectives (Leedy,
1980).
“The objective of validation of an analytical procedure is to demonstrate that it is suitable for its
intended purpose” (EMEA, 2006). In other words, performing the validation means ensuring that,
considering the goal of the research, correct and appropriate action is taken. Validating the results is
therefore one of the most crucial elements of an entire research project.
Completing the validation process and achieving its objectives require researchers to find
appropriate methodologies. Validation methodologies refer to all scientific methods that can prove or
support the research results and ensure their quality. Therefore, any research methodologies that can
be employed to present evidence in support of observations/conclusions or that demonstrate the
accuracy of the results can be applied in order to validate the study results and can thus be considered
8
validation methodologies. The following background and literature review focuses on the topic of
validation/research methodologies. The next section introduces the methodologies used by
researchers in a number of fields.
2.2 Validation Methodologies for a Variety of Research Fields
This section is a general review of most of the common validation methodologies for a variety of
research fields. For each subject area, a number of randomly selected papers were chosen as a means
of investigating the kind of methodologies that researchers in that area have applied to their studies.
Table 2-1 provides a brief summary of the results of the literature review presented in this section.
2.2.1 Biology Methodologies
Based on a review of biology articles, one of the most popular validation methodologies in that field
is an experimental study, also known as biological assay. The purpose of the experimental study is to
investigate the accuracy and specificity of and variations in assay performance. The critical
parameters for experimental studies can be summarized as accuracy, precision, selectivity, sensitivity,
reproducibility, and stability (Bansal & DeStefano, 2007). Other methodologies, such as surveys and
case studies, are also used in biology.
2.2.2 Chemical Engineering Methodologies
A validation methodology frequently employed in chemical engineering is modeling and simulation
through the implementation of appropriate algorithms. Modeling is the process of establishing a
model that represents the construction and operation of systems related to the researcher’s studies
(Maria, 1997). Simulation indicates the operation of a model. Modeling and simulation are generally
well-recognized methods in engineering and provide a useful tool that enables engineers to validate
their research results. This methodology is explained in greater detail in a later section of this chapter.
Another validation option for chemical engineers is empirical study: researchers often establish an
empirical model in order to test the hypothesis. Experimental studies are also used as a validation
methodology in chemical engineering.
2.2.3 Computer Science Methodologies
Due to the nature of computer science, the validation methodologies used in this field are slightly
different from those employed in other areas. Conducting numerous types of testing available is one
of the most popular validation methodologies that computer science researchers apply: unit testing,
9
integration testing, volume testing, usability testing, etc. (Easterbrook, 2001). In addition to testing,
another common method is modeling and simulation, examples of which are numerous: discrete event
modeling, individual-based modeling, molecular modeling, Monte Carlo Simulation, etc.
2.2.4 Education Methodologies
The research methodologies associated with educational studies vary widely. Case studies are often
used to validate results because this subject has a long history, with numerous studies by many
researchers. Statistical analysis is also commonly employed, with researchers mining data; calculating
the characteristics of data sets, such as the mean, median, and standard deviation; establishing a
model; and testing the hypothesis. This kind of statistical analysis process is called empirical study.
Observational study is another methodology quite useful for educational research, which is often
combined with statistical analysis. Meta-analysis is an additional method very popular among
educational researchers. It can be considered a type of statistical analysis but a special one that is
often useful for systematic reviews. A detailed review of the literature related to this method is
included later in this chapter.
2.2.5 Human Resources Management Methodologies
Human resources management refers to the management of the workforce of a specific organization
and involves the hiring, training, assessment, and rewarding of employees. Human resources
management forms a major component of the social sciences since it relates to all areas of society,
such as student associations, industrial corporations, and even government. Researchers usually
validate their results by conducting surveys, which include both questionnaires and interviews. Other
popular options are case studies, meta-analysis, and observational studies.
2.2.6 Medical Science Methodologies
Medical science is a precise science that supports the body of knowledge in medicine. It focuses on
vital aspects of life, such as health, disease, and death (Indrayan, 2008). Two major categories of the
methodologies in this field are quantitative research and qualitative research. Quantitative
methodologies include experimental studies, empirical studies, meta-analysis, case studies, and
statistical surveys. To validate their results, researchers normally combine two or more methodologies
in order to strengthen the evidence that supports their conclusions. Qualitative methodologies include
descriptive surveys and questionnaires, observational studies, and case studies. In addition to these
two categories, Andrew and Halcomb (2009) also recommended that medical science employ mixed
10
methods research, which combines qualitative methods with quantitative methods in a single study
(Andrew & Halcomb, 2009).
2.2.7 Physics Methodologies
The field of physics is characterized by two types of research: fundamental, or basic, research and
applied research (Rajasekar, Philominathan, & Chinnathambi, 2006). Either type can be quantitative,
qualitative, or both. Quantitative research includes experimental studies, modeling and simulation,
and meta-analysis. Qualitative research includes field observational studies, case studies, and
ethnography and narrative reports (Thomas, Nelson, & Silverman, 2011).
2.2.8 Psychology Methodologies
Psychologists employ a variety of validation methodologies. Two main categories are quantitative
and qualitative. Quantitative methodologies include experimental studies, case studies, statistical
surveys, and computational modeling (Wikipedia, Psychology, 2012). Qualitative methodologies
include interviews (descriptive surveys), observational studies in the case of physics, case studies,
archival research, and grounded theory (Creswell, 2009). Grounded theory is a systematic
methodology, which, unlike traditional social science research methodologies, requires researchers to
start with data collection rather than with a hypothesis. Through analysis of the data, researchers
develop theories that become the explanations of the research topics (Glaser, 1967). It should be
mentioned that meta-analysis is also popular with psychology researchers.
2.2.9 Summary
This section has provided a basic review of the validation methodologies used in a number of fields.
Researchers in the natural sciences such as biology and physics apply experimental studies and case
studies in order to validate their results. In social and management sciences, such as education, human
resources management, and psychology, the common methodologies are case studies, observational
studies, and meta-analysis. In applied sciences, which include engineering and healthcare, in areas
such as chemical engineering and medical science, experimental studies and empirical studies are
widely used. In formal sciences such as computer science, the modeling and simulation method is
considered a good choice for validation.

11
The review presented in this section helped the author conduct a further and deeper investigation of
the validation methodologies related to CEM. Table 2-1 summarizes the validation methodologies in
the fields mentioned in this section.
Table 2-1 Validation Methodologies Used in a Variety of Fields
Field Examples of Validation Methodologies
Biology Experimental Studies, Case Studies, Surveys
Chemical Engineering Modeling and Simulation, Empirical Studies, Experimental Studies
Computer Science Program Testing, Modeling and Simulation
Education Empirical Studies, Observational Studies, Meta-Analysis
Human Resources
Management Surveys, Case Studies, Meta-Analysis, Observational Studies
Medical Science Experimental Studies, Empirical Studies, Meta-Analysis, Case
Studies, Surveys, Observational Studies, Mixed Methods Research
Physics
Experimental Studies, Modeling and Simulation, Meta-Analysis, Field
Observational Studies, Case Studies, Ethnography and Narrative
Reports
Psychology
Experimental Studies, Case Studies, Surveys, Computational
Modeling, Observational Studies, Archival Researchers, Ground
Theory, Meta-Analysis
2.3 Validation Methodologies in Construction Engineering and Management
Based on general knowledge about methodologies used in other fields, a more focused investigation
of validation methodologies associated with CEM was conducted, as described in this section.
2.3.1 Introduction to Validation Methodologies in CEM
As with several other areas, validation methodologies used in CEM research can be divided into two
categories: quantitative and qualitative. Quantitative approaches are believed to be scientific methods
in which the initial study of the theory and literature has precise objectives with respect to hypotheses
to be tested (Popper, 1965). Qualitative research, on the other hand, is an exploration of the subject
conducted without prior formulations (Fellows & Liu, 2008). In other words, qualitative research can
be regarded as a precursor to quantitative research. However, the objectivity of qualitative data is
often questioned by people whose background is in the scientific and quantitative tradition, because
the data collected for qualitative research are unstructured (Fellows & Liu, 2008).
12
Quantitative methodologies include experimental studies, modeling and simulation, empirical studies,
surveys, quantitative case studies, and archival data analysis (Taylor & Jaselskis, 2010). Qualitative
methods include observational studies, qualitative case studies, and the Delphi method. Taylor &
Jaselskis (2010) stated that, according to the examination of 1102 manuscripts published from 1993 to
2007 in the Journal of Construction Engineering and Management, experimental research and survey
research were the methodologies most frequently used in CEM. However, the trend of CEM
validation methodologies may vary due to differing classifications of the articles and variations in the
specific definitions of the methodologies.
2.3.2 Literature Review of Methodologies
2.3.2.1 Experimental Studies
An experiment is a carefully designed, methodical procedure employed for the purpose of testing the
validity of a hypothesis. Experimental research is appropriate for “bounded” problems or issues
(Fellows & Liu, 2008). Bounded problems refer to instances in which the variables related to the
subject are known or hypothesised with a specific level of confidence. There are three types of
experimental studies: controlled experiments, natural experiments, and field experiments. Controlled
experiments are often conducted in laboratories, where the results from experimental groups are
compared to those obtained with control groups, so this method is widely used in areas such as
medical science, chemistry, and psychology. Where controlled experiments are difficult to conduct,
such as for problems in epidemiology and economics, natural experiments are considered (DiNardo,
2008). Field experiments are conducted as a means of evaluating the results in the real world rather
than in a laboratory. This type of experiment is appropriate for engineering. In addition to these three
types of experiments, Bernold and Lee (2010) listed a few more, one of which is called a pilot test of
devices and methods. In construction, a pilot test is used to ensure the quality of materials, the
precision of building structures, or the validity of technological innovations (Bernold & Lee, 2010).
Another method, called four-group design, is not easily found in journal articles since the large
samples required in this type of research represent an extra burden for researchers.
While experimental studies may be the most scientific and useful method of supporting a
hypothesis or theory, the problem of “bias” is inherent in every experiment. As well, in CEM,
conducting experimental studies is not easy, and it is rare that a contractor is willing to participate in

13
experiments due to the cost, safety, and scheduling concerns associated with construction projects
(Bernold & Lee, 2010).
2.3.2.2 Observational Studies
Observational studies provide insight about the possible effect on specific subjects or the phenomena
associated with a treatment or an action and why they occur (Leicht, Hunter, Saluja, & Messner,
2010). With the development of computing and audio-visual technology that can capture activities,
such as cameras, microphones, and computer software, observational studies can generate qualitative
information as well as quantitative data. As early as the 1880s, observational studies were used for
examining the working class but not in the area of construction (Denzin & Lincoln, 1944). The use of
observational methods is often identified as either structured observation or unstructured observation
(Yin, Case Study Research: Design and Methods, 1989). Structured observation relies on pre-set
frameworks of action and content so that the activity fits within the variables and scope of the
research question (Leicht, Hunter, Saluja, & Messner, 2010). Unstructured observation represents the
opposite conditions. In contrast with experimental studies, observational studies are conducted based
on the limitation that researchers are unable to assign subjects to a treated group versus a control
group (Wikipedia). Observational studies lack the statistical properties of experimental studies
because the groups in observational studies are not randomly assigned as in experimental methods. In
randomized experiments, the mean of each group is expected to be the same because of the central
limit theorem, while groups in observational studies who receive different treatment may differ
greatly due to their covariates. This feature of observational studies is the key to differentiating
observational studies from experimental studies. As well, with respect to CEM, observational studies
are often conducted with the assistance of tools or advanced techniques such as cameras and videos.
If combined with quantitative data analysis, observational studies can provide a context for a better
understanding of the actual performance and properties of a workforce or of other specific research
subjects. However, the process of generating the data and the methodology itself is time-consuming,
and the personal bias and subjectivity of the researchers have a detrimental effect on the final
outcome (Hammersly & Gromm, 1997). To minimize the disadvantages of observational studies,
researchers must obtain a larger sample size and choose a sample that is representative of the
population (Leicht, Hunter, Saluja, & Messner, 2010).

14
2.3.2.3 Empirical Studies
In CEM, empirical studies have a significant potential for research applications. In empirical studies,
also known as empirical modeling, researchers develop a theory or a set of principles for a system on
the basis of the data collected from experience or through observations (Flood & Issa, 2010).
Modeling systems then develop functions that can map an input vector to an output vector. To form
logical and valid conclusions, the statistical methods commonly used include regression analysis, t-
test, chi square, and ANOVA (Wikipedia, 2013). The output of the empirical model is often the focus
of empirical studies, but Flood and Issa (2010) pointed out that the internal structure of empirical
models also has a potential for exploitation. Empirical studies incorporate six steps: strategizing, data
collection and evaluation, model development, model evaluation and final selection, final validation,
and implementation and review (Flood & Issa, 2010). This set of procedures represents only a brief
summary of the development of this methodology since the discussion of its application is beyond the
scope of this thesis. Readers may refer to works such as Empirical Modeling Methodologies for
Construction (Flood & Issa, 2010) and Empirical Model Building (Thompson, 1989) for further
information about the implementation of empirical research.
Empirical studies can help researchers develop a deeper or more generalized understanding of a
system (Flood & Issa, 2010), and dynamic empirical models also provide researchers with insight into
the time-dependent behaviour of a system. If a problem lacks sufficient theoretical framework but
includes examples of its performance and behaviour, empirical studies can be applied to the problem.
However, with empirical studies, the complexity of the problem is also limited due to the increase in
the quantity of input variables caused by the number of fitting data examples required in order to
develop the model. The implementation of empirical studies is somewhat time-consuming and
expensive (Flood & Issa, 2010).
2.3.2.4 Case Studies
A case study is the intensive analysis of a particular matter over a specific time period . This
methodology assists researchers in exploring a phenomenon in its actual context using a number of
data sources (Yin, 2003). The cases selected are usually representative, with conditions similar to
those used in the statistical sampling so that the cases employed in the research can demonstrate
particular facets of a specific topic (Fellows & Liu, 2008). Yin (2003) categorized three types of case
studies. The first, called an exploratory case study, is used to examine situations in which the
intervention being evaluated has no clear, single set of results. The second type, designated a
15
descriptive case study, describes a research subject and its real-life context. The third, termed a
multiple-case study, helps researchers discover the differences between and within cases. In the
1990s, Stake (1995) offered a different categorization of three types of case studies. He called the first
one intrinsic case study, a useful method for researchers who have a genuine interest in a case in
which the intent is better understood. He pointed out that, because the interest of the researcher is in
the case itself, the purpose of this approach was not to build theories (Stake, 1995). The second type
he named instrumental case studies. This approach is used to complete an activity rather than to
acquire an understanding of a particular phenomenon. This method plays a supportive role by helping
researchers understand more deeply and in further context. The last one is labelled collective case
studies, with a methodology similar to that of the multiple-case studies mentioned by Yin (2003).
The advantage of case studies is that they allow researchers to explore individuals or organizations
using complex interventions, relationships, communities, or programs (Yin, 2003). However, the
level of rigour obtainable with case studies is always controversial.
2.3.2.5 Surveys
Survey methodology is the sampling of individuals from a population for the purpose of description
or to identify predictive patterns of influence or the relationships among variables (Sapsford, 2007).
The first step in conducting a survey is usually to select the samples. The researchers must then
choose the mode of data collection: telephone, mail (post), online surveys, personal in-home surveys,
personal mall- or street-intercept surveys, or a combination (Wikipedia, 2013). After the research data
have been acquired, conclusions are tested based on planned comparisons (Sapsford, 2007). The key
to the successful application of this methodology is the careful selection of the sample members, the
evaluation and testing of the survey questions, the choice of an appropriate mode, the training and
supervising of the interviewers, and the analysis and mitigation of the effects of any errors identified.
The survey methodology has obvious advantages. Compared to other methodologies mentioned in
this thesis, surveys are relatively easy to conduct, and statistical analysis can be applied to the data in
order to determine their validity and statistical significance. Fuzzy construction opinions can also be
converted into hard data. In other words, qualitative data can be translated into quantitative data
(Sapsford, 2007). However, all sample surveys are subject to the following types of errors: coverage,
nonresponse, sampling, and measurement (Groves, 1989). These kinds of errors result from the effect
of the interviewers on the respondents’ answers, the inability of some respondents to answer

16
questions, language errors in the survey design, and the impact of the mode of data collection
(Groves, 1989).
2.3.2.6 Functional Demonstration of Algorithms, Modeling and Simulation
Modeling is the process of establishing a model that represents a specific object, process, or
phenomenon that is to be simulated. Simulation is defined as the process of executing a model (Petty,
2009). Petty (2009) stated that in modeling and simulation, validation is used to determine how
accurately the model represents the object, process, or phenomenon. The validation of the model and
simulation is one of the important aspects of completing a project. Dr. Carl T. Haas and the author
categorized the methodology, “functional demonstration”, in this research. A functional
demonstration is a common methodology that refers to the process or evidence that demonstrates that
an algorithm or model works. For example, the model produces specific results. The researcher then
changes some of the variables and observes the new results, which may happen to match what
actually occurs in that specific situation. After calibration and completing additional tests, the model
is finally completely validated. Functional demonstration thus represents validation with respect to
logic, input, assumptions, and output. In the case of algorithms, functional demonstration shows that
the algorithms works or is correct for a wide range of inputs.
One advantage of modeling and simulation is that the cost is lower than with empirical testing and
trials (Burbank, Kasch, & Ward, 2011). On the other hand, however, a higher level of confidence in
the validation results is always associated with empirical studies than with functional demonstration,
or with functional demonstration over a wide enough set of inputs that the subsequent evaluation of
functionality is essentially empirical.
2.3.2.7 Archival Data Analysis
Archival data analysis is also known as archival research. The goal is to discover and extract from
original archival data the information that will be useful as evidence. Archival data refer to data that
were created previously or that are collected concurrently but independently of the purpose of the
research (Lucko & Mitchell, 2010). Sources of archival data may include private data sets, private
records, and public data sets (Archival Data, 2010). Private data sets refer to data previously collected
by other researchers or agencies for other studies or collected by the researcher himself/herself for a
previous study. Researchers must obtain permission in order to access private data sets. In contrast,
public data sets are collected differently: government agencies collect the data, and academic

17
institutions make them available to the public. The intent of private record collection differs from that
associated with either of the other two types of data. Private records are collected for an individual’s
own sake and include such items as student records, medical records, and credit histories. In CEM,
this methodology is suitable for areas that may include but are not limited to productivity studies,
safety studies, and hazard analysis (Lucko & Mitchell, 2010). The key to the successful application of
this methodology in CEM is valid preparation of the data, which includes validating sample sizes,
unifying the format, and reconstructing missing values (Lucko & Mitchell, 2010).
In CEM, archival data are not always consistent due to the lack of a standard data-collection format
across companies (Mitchell, 1998). This weakness results in archival research being generally more
complicated and time-consuming than library and internet research. Researchers must search through
numerous documents in order to find materials relevant to their topics, and some documents might be
restricted due to confidentiality issues (Lucko & Mitchell, 2010). However, if conducted successfully,
each new archival data study can provide researchers with additional reliable information to support
their findings.
2.3.2.8 Summary
In general, the literature contains numerous examples of validation methodologies. The difficulty lies
in finding reports of validation methodologies in the context of CEM. Appropriate reports must be
able to guide researchers or indicate trends in the utilization of a validation methodology within the
rigour associated with the CEM community. Although the Journal of Construction Engineering and
Management published by the American Society of Civil Engineers produced a special issue about
the dialogue related to the rigorous application of methodologies in CEM, the focus was on research
methodologies generally rather than specifically on validation methodologies. As well, the articles
examined were limited to manuscripts that were published in the Journal of Construction Engineering
and Management, which could result in biased final research results. The above literature review
suggests the necessity of conducting a comprehensive study of the trends in CEM validation
methodologies. As a brief summary, Table 2-2 presents a synthesis of the basic information related to
CEM validation methodologies.

18
Table 2-2 Summary of CEM Validation Methodologies
Category of
Validation
Methodology
Features/Key Words Advantages Disadvantages
Experimental
Studies
Sets of experimental data
Statistical analysis
Grouping
Scientific basis
Legitimacy
Ability to adjust if answers
are inconclusive
Possibility of bias
Relatively high cost
Safety concerns
Observational
Studies
Audio-visual technologies
(e.g., cameras, videos,
microphones)
Preset framework instead of
randomization
Actual performance and
properties
Ease of use and low cost
First-hand information
Lack of statistical
properties
Extensive time
required
Subjectivity of
researchers
Ethical problems
Empirical
Studies
Model development and
evaluation
Statistical analysis
Insight into time-dependent
behaviour
Freedom from theoretical
frameworks
Inability to be applied
to complex problems
Extensive and time
and cost
Case Studies
Intensive analysis of a
particular matter(s)
Demonstration of a
particular facet of a specific
topic
Collection of details
Ease of conducting
Exploratory, constructive,
and confirmatory
Lack of rigorousness
Difficulty of
generalizing from a
single case
Difficult of
determining a definite
cause/effect
Survey
Sampling
Data collection: telephone,
mail (post), online surveys,
etc.
Convenient data collection
Possibility of statistical
analysis
Low cost
Errors resulting from
respondents' inability
to answer questions,
poor language of
designs, etc.

19
Category of
Validation
Methodology
Features/Key Words Advantages Disadvantages
Functional
Demonstration
Validation with respect to
logic, input, assumptions,
and output
Involvement of modeling
and simulation, algorithms,
machines or programs
Low cost
Legitimacy
Archival Data
Analysis
Archival data
Use for productivity studies,
safety studies, hazard
analysis, etc.
Reliability
Data that are already
collected
Inconsistency
Extensive time
required
Restricted access
Table 2-2 Summary of CEM Validation Methodologies (Continued)

20
2.4 Scientific Versus Business Validation
Scholarly validation is usually more rigorous and scientific than business validation. The
methodologies associated with scientific validation require careful design and sound evidence based
on a scientific process such as statistical analysis or hypothesis testing. Scholarly researchers are
unable to draw conclusions until such a rigorous and scientific validation process is complete. In
contrast, journalists and authors of some business and investment books are not required to undertake
scientific or rigorous processes in order to validate their conclusions or main ideas. For example, they
may easily demonstrate the validity of their books or articles by interviewing a few successful
business people and then citing the conversation as proof of specific statements. They are not required
to conduct any testing or analysis of the data in order to determine whether or not the
approaches/statements are truly functional.
2.5 Engineering versus Management in Construction
The construction industry comprises five sectors: residential construction, commercial construction,
heavy civil construction, industrial construction, and environmental construction (Jackson, 2010).
Engineering and management are both key components of these sectors. However, construction
engineering and construction management are completely different in many ways even though they
can also overlap on occasion. This section introduces and compares construction engineering and
construction management.
2.5.1 Construction Engineering
Engineering for construction, also known as construction engineering, involves the application of
scientific and practical knowledge for the designing, planning, and construction of infrastructure such
as highways, bridges, airports, railroads, buildings, dams, and utilities (Wikipedia, 2013).
At the educational level, knowledge about construction engineering is usually taught through a
variety of civil engineering courses, such as engineering mechanics, engineering design, general
science, and mathematics.
2.5.2 Construction Management
Construction management, also known as construction project management (CPM) is defined as “a
professional management practice that is applied to construction projects from project inception to
completion for the purpose of controlling time, cost, scope and quality” (CMAA, 2010). Construction

21
management includes the overall planning, scheduling, coordination, and control from the very
beginning to the end of a project. The knowledge required encompasses an understanding of
construction and building, technology, public safety, customer resources, human resources,
mathematics, etc. (Jackson, 2010).
Three concerns typically associated with CPM are time, cost, and quality. Focusing on these
concerns, construction managers must estimate the time and cost of a project, administer the contract,
manage the job site and construction operations, plan and schedule the project, monitor project
performance, and manage project quality (Jackson, 2010).
2.5.3 Comparison of Engineering and Management with Respect to Construction
In construction, both engineering and management relate to construction topics but the focus,
concerns, and method of dealing with problems varies greatly. Engineers concentrate on the
correctness of specific projects, and their goal is to make predictions with certainty (Cerri, 2008). In
construction, engineers concentrate on work such as the design of a construction site and on plans and
drawings for transportation, oil and gas, construction site supervision, etc. In contrast, construction
managers focus on the planning, scheduling, coordination, and control of a project from inception to
completion. When addressing problems, construction engineers operate in a more straightforward
manner than construction managers, who usually work and think in a “fuzzy” zone where the goal is
the most optimal decision based on consideration of diverse possible circumstances. While
construction engineers look at a problem and try to eliminate all uncertainties from the calculation,
the variables construction managers employ are unpredictable, changeable, and uncertain (Cerri,
2008). The following simplified example illustrates the difference between a pure construction
engineering perspective and a pure construction management viewpoint.
Example: Construct a roadway connecting City A to City B.
In the pure view of an engineering team, the construction of the road is determined as a function of
several parameters. The output variable is the construction of a road that connects City A to City B, a
goal that is quite straightforward. The basic input variables, which are considered parameters that the
engineering team might take into account, are conditions related to landscape, traffic flows, materials
and quality of materials, expected service life, and installation techniques.
In the pure view of a management team, three key issues in the construction of the roadway are
time, cost, and quality. No simple functions are available for use by construction managers. Their
22
goal is to construct the roadway within the shortest time, at the lowest cost, and with the highest
quality. Of course, in reality, achieving all three goals simultaneously is impossible. The construction
management team therefore attempts to develop several scenarios and then chooses one based on
consideration of a variety of factors. The mitigation of the environmental and social impact is an
additional essential factor to be addressed in the management of construction projects.
In the real world, successful construction projects are the result of neither the engineering side nor
the management side alone. Only through a combination of both engineering and management
perspectives can construction issues be effectively resolved.
2.6 Productivity in Construction Engineering and Management
The basic concept of labour productivity is relatively simple and is defined as the ratio of output to
input. A number of the articles examined in order to identify validation methodologies for this
research were directed at labour productivity because it represents a major CEM concern and is
receiving increasing attention in the industry. Labour productivity is influenced primarily by
practices, influencing factors, and technologies. This section provides a brief introduction to these
three factors.
2.6.1 Practices
The practices discussed here were selected according to the Construction Industry Institute’s (CII)
The Best Practices (CII, 2010) and CII Best Practices Productivity Improvement Index (RT 252-c,
2010). Practices that are well known and we generally considered to positively influence productivity
are also included here. This is a representative list instead of an exhaustive list. Brief descriptions of
the ten categories of practices that influence labour productivity are presented in the next subsections.
2.6.1.1 Constructability
CII has defined constructability as “the optimum use of construction knowledge and experience in
planning, design, procurement, and field operations to achieve overall project objectives” (CII, 1986).
The benefits of this practice include but are not limited to improving productivity, reducing the
overall project cost, improving project security and safety, and enhancing project team relationships
(CII, 2010).

23
2.6.1.2 Zero Accident Techniques
Zero accidents, also known as safety, is one of the most important drivers of improved labour
productivity in CEM (CII, 2010). It includes site-specific safety programs along with implementation,
auditing, and incentives for creating a safe environment that results in zero accidents (CII, 2010). The
benefits of this practice include but are not limited to the protection of workers’ health and lives as
well as the reduction of insurance costs.
2.6.1.3 Resource Leveling
Resource leveling is a project management technique for making resource demands as smooth as
possible given the daily availability of the resource. The benefits of this practice include the indirect
reduction of the total cost through avoiding the hiring and firing of people on a short-term basis and
through maintaining the original duration of the project as specified in the early schedule (Koulinas &
Anagnostopoulos, 2012).Since it can also result in average longer term employment on a project, it is
understood by many people as a way of improving productivity as well.
2.6.1.4 Alignment
Alignment refers to “the condition in which appropriate project participants are working within
acceptable tolerances to develop and meet a uniformly defined and understood set of project
objectives” (CII, 2010). The major benefit of this practice is the assurance that project participants on
the same team are working toward a common goal (CII, 2010). This is a known best practice for
improving project cost, schedule and safety performance, but its impact on productivity is not known.
2.6.1.5 Knowledge Management
Knowledge management, which is similar to lessons learned, entails the effective management of the
knowledge obtained from either successful or negative experience in order to improve future
performance (CII, 2010). This practice facilitates the improvement of processes and procedures in a
continual way and affords a strong advantage in a competitive industry (CII, 2010).
2.6.1.6 Risk Management
Risk management is used for measuring the impact of potential risks such as uncertain events or
conditions that have a positive or negative effect on costs and time of the project in construction
industry (Schatteman, Herroelen, Vonder, & Boone, 2006). It is one of the vital factors for success in
construction projects. Effective risk management can protect projects against anticipated disruptions

24
and increase the stability of project schedules. Therefore, it can have a significant impact on
productivity.
2.6.1.7 Contract and Project Delivery
Project delivery means that an agency or owner enters into a legal agreement with one or more
entities or parties in order to apply project management techniques to the organization and design of
financial issues, construction, and operations and to the provision of maintenance services for a
project (Wikipedia, 2011). Common methods of project delivery include Design-Bid-Build, Design-
Build, Build-Operate-Transfer, and Turnkey Project Delivery. Impact of contract method on project
performance has been studies but less on productivity.
2.6.1.8 Craft Training
In light of the fact that the construction industry relies on skilled craft workers, the goal of craft
training is the development of such workers. Sources of craft training include apprenticeships, firm-
sponsored training, community colleges and vocational-technical schools, and military training
(Wang, Goodrum, Haas, & Glover, 2008). It is understood that better trained workers are more
productive, all other things being equal.
2.6.1.9 Site Layout
Appropriate site layout planning, especially dynamic site layout planning, allows the project manager
to improve the organization of the construction site (CII: Research Team 252, 2011). This process is
usually conducted with the use of technology and software applications. An appropriate site layout
unquestionably helps ensure the safety of the working environment and facilitates effective and
efficient operation, and it can improve productivity.
2.6.1.10 Short-Term Scheduling
Short-Term, Scheduling indicates project schedules designed with intervals of one, two, or three
weeks. Short-term scheduling helps contractors to maintain in-time control of the project and ensures
that the project is on the right track with respect to the overall schedule. It is often neglected, yet it
can have a significant impact on productivity.

25
2.6.2 Influencing Factors
This subsection introduces factors that affect labour productivity. Ten major factors have been
selected and are described in the following subsections.
2.6.2.1 Adverse Weather
Adverse weather, such as temperature, humidity, snowfall, or the effects of high elevation, usually
has a negative impact on construction productivity. In Calculating Lost Labour Productivity in
Construction Claims, Schwartzkopf (2004) defined adverse weather as conditions created by natural
forces that are detrimental to the construction of the project. Outside operations, particularly those
that involve earthmoving or materials that are sensitive to temperature and weather (e.g., concrete and
mortar), are especially likely to be affected by adverse weather (Schwartzkopf, 2004).
2.6.2.2 Craft Density
Each factor has an optimal level at which the effect on productivity is positive. When the incidence of
a factor falls above that level, productivity is adversely affected by that factor. A high level of craft
density is called trade stacking, or overcrowding. Trade stacking is always a concern for contractors:
as the construction site grows crowded with numerous tradespeople, the workspace becomes
congested. A simple overlapping of construction sequences does not normally cause labour
productivity losses. Rather, it is the crowding of personnel in one particular work area that contributes
to lost productivity (Schwartzkopf, 2004). In its Modification Impact Evaluation Guide, the U.S.
Army Corps of Engineers (1979) states that crowding can be considered a form of acceleration
because it requires the contractor either to accomplish a fixed amount of work within a shorter time
frame, or to accomplish more work within a fixed time frame. In other words, project acceleration is
one of the main causes of trade stacking. Other causes can include cramped workspaces, stored
materials that impede work, and the performance of work out of sequence (Thomas, Riley, & Sinha,
2006).
2.6.2.3 Overmanning
Overmanning is the term most often applied when the number of men on a crew is above the
optimum for a project, a situation that often causes productivity losses. The optimum number for a
crew is defined as the minimum number of workers required to perform the task within the allocated
time frame (The U.S. Army Corps of Engineers, July 1979). The number for each type of work

26
depends on the technology being used. Increasing the number of craftsmen usually produces a higher
cost unit as well as a greater rate of progress. This effect is in line with the economic theory of
diminishing marginal utility. When additional workers are added beyond the optimum crew, each
new worker increases crew productivity to a lesser extent than a previously added worker. Carried to
the extreme, adding more workers eventually contributes nothing to overall crew productivity (The
U.S. Army Corps of Engineers, July 1979). As well, the contractor’s lack of awareness of the impact
of overmanning may result in finger-pointing on the part of the estimating and execution teams
(Hanna, Chang, Lackney, & Sullivan, 2005). The increased number of workers that result from
overmanning also causes physical conflict, a high density of craftsmen, congestion, and lack of
supervision. Shortages of materials, tools, and equipment might occur, and engineering questions or
requests for clarification might not be provided in time due to the greater demand (Hanna, Chang,
Lackney, & Sullivan, 2005). All the above effects of overmanning further increase labour
productivity losses.
2.6.2.4 Overtime
Overtime is defined as the time worked beyond 40 hours per week. Overtime is frequently employed
in the construction industry for a number of reasons (Schwartzkopf, 2004). First, it can be used to
handle unexpected problems or to finish time-critical work. Second, it becomes necessary in order to
address problems created by delays or project accelerations. It can also be used as an approach for
attracting the required number of workers. Sometimes, it may be employed in order to take advantage
of favourable weather or to maximize the use of equipment in cases when the payment of a premium
for labour is less expensive than the cost of the equipment. It can also be implemented as a means of
making full use of limited workspace. However, overtime can have a series of detrimental effects on
costs, labour productivity, and labour efficiency. In this context, efficiency refers to the relative loss
of productivity compared to a specific baseline (Thomas & Raynar, 1997). The reasons for this
negative impact include the fatigue generated by the extended work hours, disruptions in the work
environment, higher accident rates, poor work quality, the attraction of less qualified workers, and
shortages of resources (Schwartzkopf, 2004).
2.6.2.5 Shift Work
Shift work is defined as hours worked by a separate group of workers whose work on a project begins
after the first same-trade workforce to arrive has retired for the day (Hanna, Chang, Sullivan, &

27
Lackney, 2008). Because only a few studies focus on shift work, the nature of its impact on labour
productivity remains a topic of debate among researchers. Generally, the type of work involved, the
scheduling, and the project type have a significant effect on whether shift work causes productivity
losses (Schwartzkopf, 2004). CII conducted a research project related to this topic in 1988 but failed
to reach a conclusion because the sample size was too small (Construction Industry Institute, 1988). A
study conducted by Hanna, Chang, et al. showed that shift work has the potential to be both beneficial
and detrimental with respect to construction labour productivity (Hanna, Chang, Sullivan, & Lackney,
2008). The authors developed a model for quantifying productivity losses and concluded that the
change in productivity ranges from a gain of 11 % to a loss of 17 %, depending on the amount of shift
work involved. The model was validated with the use of the cross-validation method, and the model
results are quite similar to those determined by Waldron (Waldron, 1968).
2.6.2.6 Change Orders
A change is defined as a modification in the original scope of work, in the contract schedule, or in the
cost of the work. A change order is considered a formal modification that incorporates a change into
the contract (Schwartzkopf, 2004). Changes can arise for a number of reasons, such as a change in
scope caused by user amendments, schedule delays, or an incomplete design. Changes are normal and
expected in construction, with a range that typically varies from 6 % to 10 % being considered
reasonable (Committee on Construction Change Orders, Building Research Board, National Research
Council, 1986). When a change occurs, it has two major effects: a cost impact and a schedule impact
(Schwartzkopf, 2004). However, whether labour productivity is impacted by change orders depends
on a number of variables, including whether a project is mostly civil, mechanical or electrical, the
percentage of the changes, and the estimated manpower compared to the actual peak manpower
(Hanna, Camlic, Peterson, & Nordheim, 2002).
2.6.2.7 Absenteeism
Absenteeism is defined as the failure of craftsmen to appear for work for reasons other than holidays
or vacations. There are two types of absenteeism: voluntary and involuntary (Hanna, Menches,
Sullivan, & Sargent, 2005). Both types have an adverse impact on productivity. Absenteeism can be
caused by several factors, one of which is a long commute (Ommeren & Gutièrrez-i-Puigarnau, 2009).
Ommeren and Gutièrrez-i-Puigarnau (2009) conducted empirical tests and concluded that worker
absenteeism was negatively affected by the length of the commute, with a significance level of 1 %.

28
Other top reasons for absenteeism include illnesses, medical appointments, lack of interest or
responsibility, an unsafe working environment, poor supervision, excessive overtime, and poor
overall management (Hanna, Menches, Sullivan, & Sargent, 2005).
2.6.2.8 Learning Curves
Also known as an experience curve, a learning curve is often described as the amount by which the
labour input, such as the number of man-hours required to perform a repetitive activity, decreases
with the number of repetitions (Schwartzkopf, 2004). Learning curves are applicable primarily with
respect to unit price contacts, for example, for highway projects or other heavy construction work.
Thomas defined a learning curve as a graph of proficiency versus practice (Thomas H. R., 2009).
2.6.2.9 Equipment Availability
Equipment availability is directly related to the amount of waiting or idle time that results in labour
productivity losses as measured by activity analysis work sampling. Although studies of the
relationships between equipment availability and productivity are few, similar research conducted in
manufacturing may apply. Rivas et al. (2011) conducted a case study for which they circulated a set
of questionnaires to both direct workers and mid-level employees at a Chilean construction company.
The survey results showed that the factors that most influenced labour productivity include materials,
tools, design interpretation, equipment, and trucks. The survey indicated that waiting for materials,
tools, design interpretation, equipment, and trucks represented 59 % of the total waiting time and that
because the waiting time was so long, workers lacked the coordination they needed to work together
as a team (Rivas, Borcherding, González, & Alarcón, 2011). These findings are consistent with those
of Alarcón and Calderón (2003) in their study conducted in the U.S. Dai and Goodrum and Dai et al.
(2009) also indicated that construction equipment was the top factor that affects construction labour
productivity.
2.6.2.10 Availability of Materials
Productivity is adversely affected when materials are unavailable for craft workers. Five typical
materials management conditions that may have an adverse impact on productivity include the
organization of storage areas, housekeeping, the planning of materials delivery, the availability of
materials, and the handling and distribution of materials (Thomas, Sanvido, & Sanders, 1989).
Thomas et al. (1989) also indicated that the problem of the unavailability of materials generally has

29
three causes: running out of materials, crew slowdowns in anticipation of shortages in materials, and
rework when materials arrive.
2.6.3 Technology
It is obvious that advanced technology, such as a faster nail gun, more flowable concrete, or
automated materials tracking, can improve productivity based on ease of use. In this subsection, three
classes of advances in technology are introduced: information technology (IT), materials, and tools
and equipment.
2.6.3.1 Information Technology
Despite little evidence, it is reasonable to believe that IT may eventually have a significant net
positive impact on construction projects. Wood & Alvarez (2005) predicted that the field of
construction would be more “intelligent and integrated” in the future because materials, tools,
equipment, and people would gradually become elements of a fully sensed and monitored
environment. Hazardous and labour-intensive manual tasks will become more efficient and less
troublesome through the automation of construction processes. However, one result will also be a
large volume of data that must be processed and shared across multiple systems (Zhai, Goodrum,
Haas, & Caldas, 2009).
2.6.3.2 Advances in Materials
In 2009, the CII Research Team 252 (RT 252) developed innovative materials, including modular
pipe supports, quick pipe-coupling systems, and quick steel-connection systems (CII: Research Team
252, 2009). In 2011, RT 252 analyzed another three significant concrete innovations: self-
consolidating concrete, modular formwork, and Grade 100 steel reinforcement (CII: Research Team
252, 2011). According to the RT 252 (2009) summary report, an exceptional innovation such as quick
pipe-coupling systems can help solve typical project problems related to redoing the piping, which
can account for as much as 13.3 % of the total cost. Such innovations can significantly improve
productivity and make an enormous difference with respect to the success of a project.
2.6.3.3 Advances in Tools and Equipment
Innovations in tools and equipment are proliferating. Examples of popular items in this area include
automated earthmoving equipment and automated crane control and monitoring. RT 252 (2009)
indicated that mechanical innovations can substantially improve productivity. The data in the RT 252

30
summary report (CII: Research Team 252, 2009) demonstrated that “stakeless” earthmoving
improves productivity by 50 %. Other advanced equipment techniques include 2D/3D laser scanning,
GPS, and a visual tracking algorithm for cranes. Tools advances improve productivity by delivering
more power, functional range, and mobility, while reducing weight and vibrations.
2.7 Meta-Analysis
As mentioned in section 2.2, meta-analysis is very popular among researchers in the fields of
education, human resources management, medical science, physics, and psychology. However,
potential CEM applications of meta-analysis remain largely unexplored. In this section, the definition
of meta-analysis, the associated procedures, its advantages and disadvantages and one existing CEM
example are reviewed.
2.7.1 Definition of Meta-Analysis
Any individual topic is often the focus of numerous studies and papers. Researchers usually conduct a
traditional literature review, which is similar to a summary of previous research in the area of
investigation. This kind of traditional literature review can serve only as a background study since it
lacks intensive analysis and scientific proof that indicate the confidence level of the conclusion. In
contrast, meta-analysis requires the careful collection of a wide range of data and their intensive
statistical analysis. Researchers can then obtain a synthesized review. Glass (1976) defined meta-
analysis as “the analysis of analyses,” which refers to the systematic statistical analysis of a number
of individual results from studies conducted in the same area and for the same purpose.
2.7.2 Meta-Analysis Procedures
Meta-analysis involves several procedures. First, researchers must be clear about the research
question, based on which they set the criteria for the selection of studies and then search the relevant
literature manually or by computer, or both. After the studies have been discovered, the next step, and
one of the most important, is a homogeneity test. To illustrate the concept of this type of test, another
term must first be understood: effect size. Effect size refers to the degree to which the null hypothesis
is false (Cohen, 1977). In other words, if the effect size index is 0, the conclusion is that the
difference between the control group and the experimental group (with treatment) is insignificant,
which is undesirable. To synthesize individual studies quantitatively through meta-analysis, each
study selected must provide a sample estimate with an effect size representative of the population
effect size (Wolf, 1986). The goal of the homogeneity test is to determine whether all of the
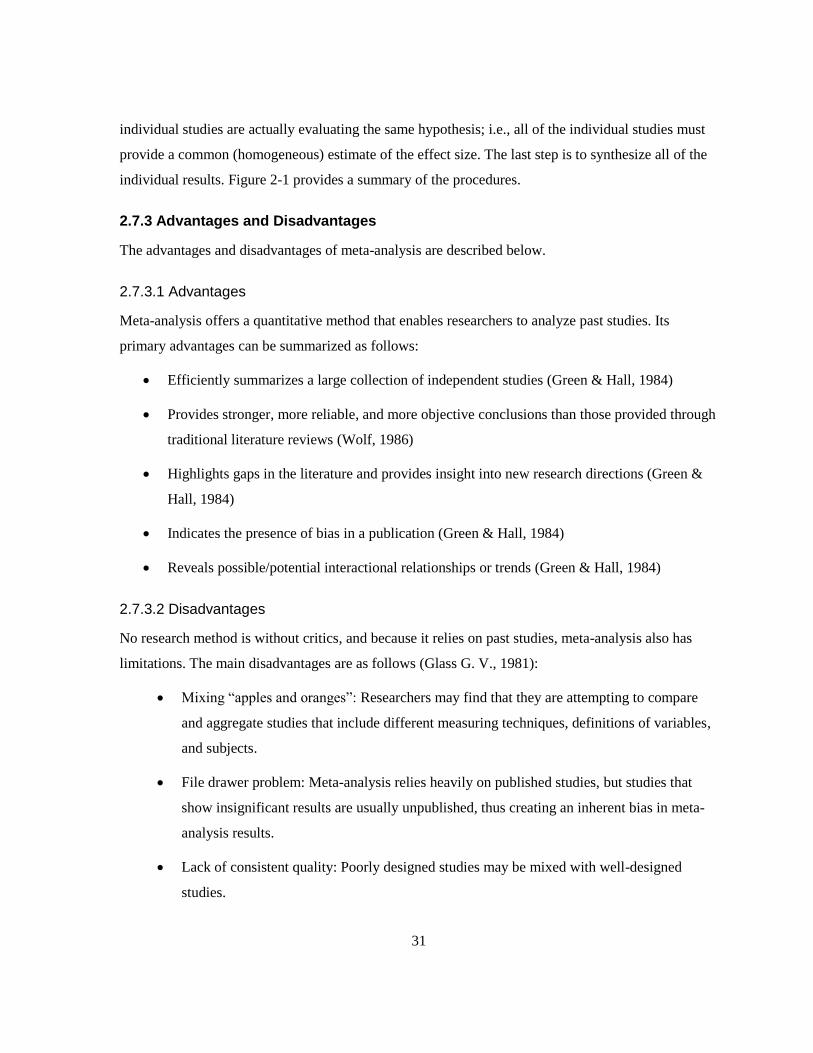
31
individual studies are actually evaluating the same hypothesis; i.e., all of the individual studies must
provide a common (homogeneous) estimate of the effect size. The last step is to synthesize all of the
individual results. Figure 2-1 provides a summary of the procedures.
2.7.3 Advantages and Disadvantages
The advantages and disadvantages of meta-analysis are described below.
2.7.3.1 Advantages
Meta-analysis offers a quantitative method that enables researchers to analyze past studies. Its
primary advantages can be summarized as follows:
Efficiently summarizes a large collection of independent studies (Green & Hall, 1984)
Provides stronger, more reliable, and more objective conclusions than those provided through
traditional literature reviews (Wolf, 1986)
Highlights gaps in the literature and provides insight into new research directions (Green &
Hall, 1984)
Indicates the presence of bias in a publication (Green & Hall, 1984)
Reveals possible/potential interactional relationships or trends (Green & Hall, 1984)
2.7.3.2 Disadvantages
No research method is without critics, and because it relies on past studies, meta-analysis also has
limitations. The main disadvantages are as follows (Glass G. V., 1981):
Mixing “apples and oranges”: Researchers may find that they are attempting to compare
and aggregate studies that include different measuring techniques, definitions of variables,
and subjects.
File drawer problem: Meta-analysis relies heavily on published studies, but studies that
show insignificant results are usually unpublished, thus creating an inherent bias in meta-
analysis results.
Lack of consistent quality: Poorly designed studies may be mixed with well-designed
studies.
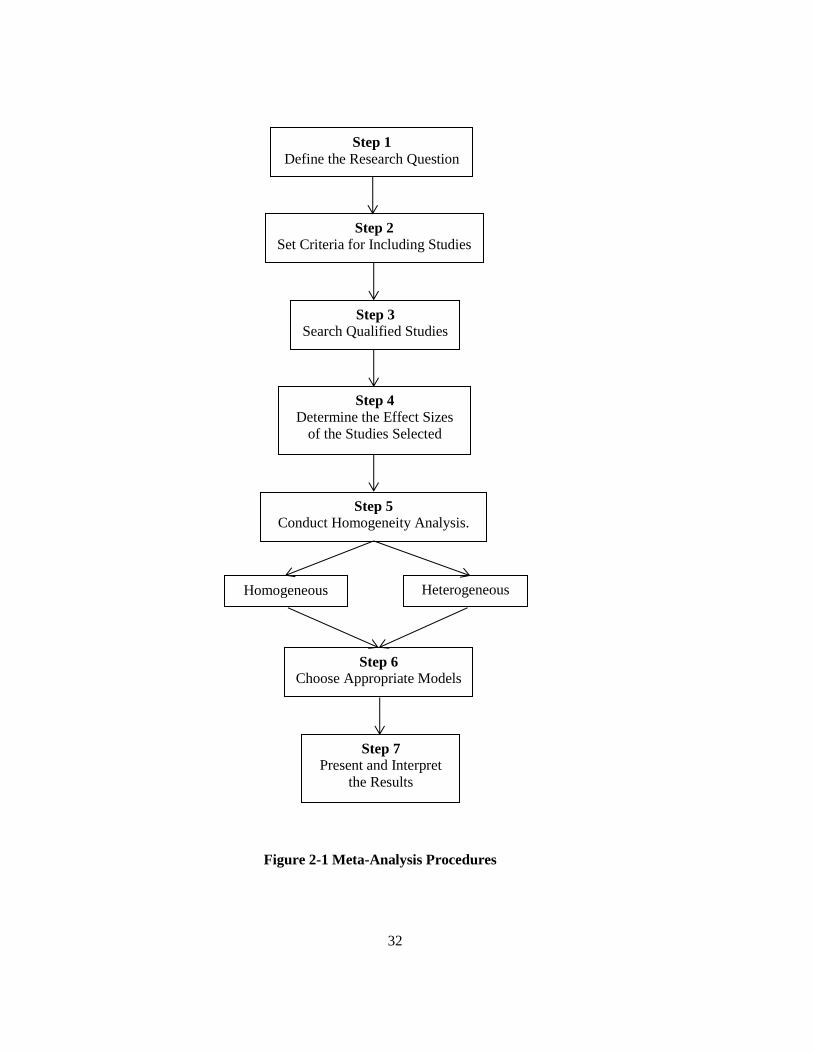
32
Figure 2-1 Meta-Analysis Procedures
Step 1
Define the Research Question
Step 2
Set Criteria for Including Studies
Step 3
Search Qualified Studies
Step 4
Determine the Effect Sizes
of the Studies Selected
Step 5
Conduct Homogeneity Analysis.
Homogeneous Heterogeneous
Step 6
Choose Appropriate Models
Step 7
Present and Interpret
the Results

33
2.7.4 The Only Known Example of Meta-Analysis in CEM
We didn’t find out any articles reporting Meta-Analysis methodology in the selected categories.
Meanwhile, we didn’t conduct meta-analysis for the thesis, because we were not able to find adequate
number of qualified studies in any categories. In later chapters, we’ll explain the reasons in detail.
The only successful example of meta-analysis we have ever seen in CEM was the one conducted
by Horman and Kenley (2005). The researchers provided a synthesis of the findings across all the
studies that focused on topics of wasted time in construction activities by applying the methodology
of meta-analysis. The meta-analytic method adopted consists of search, coding, and statistical
procedures. The information regarding 18 manuscripts with 24 relevant studies was collected and
coded. The conclusion that the proportion of available time used in wasteful activity was 49.6% at a
standard deviation of 11.9% was drawn via statistical analysis of the collected information.
Outside areas of CEM, good examples of meta-analysis can be found in the book Bad Science
(Goldacre, 2010). In the book, the author teaches readers how to evaluate placebo effects, double-
blind studies, and sample size by conducting meta-analysis, so that the audience can recognize bad
science when they see it. These examples can help us better understand Meta-Analysis methodology.
2.8 Search Engines
A major component of the research presented in this thesis was to search for as many qualified papers
as possible in order to obtain a large sample for the analysis of the validation methodologies. One of
the most efficient methods is to use search engines, which are information retrieval systems designed
to help people find information stored on a computer system (Wikipedia, 2013). Databases such as
Scopus and the one maintained by the American Society of Civil Engineers are quite useful for CEM
researchers who wish to search journal papers, conference papers, etc. University library systems are
also helpful for finding related books or articles.
2.9 Summary
This chapter has introduced and reviewed the available information related to validation
methodologies, engineering and management as related to construction, three classes of sources of
influence on labour productivity, and the basics of meta-analysis and search engines. Based on the
entire literature review, it appears that researchers lack quantification with respect to dominant CEM

34
validation methods. Justifying and improving current validation approaches in this field are thus
imperative.
35
Chapter 3
Methodology of the Research
3.1 Introduction
To collect data related to CEM validation methodologies, analysis tables of methodologies were
carefully designed, and the papers to be examined were carefully selected. This chapter describes the
development of the table structure and the method of classifying the articles.
3.2 Structural Design of the Analysis Tables
3.2.1 Columns
Each analysis table was designed to have four main columns: the sequence number of the paper, the
year of publication, the code name of the article, and the methodologies included.
3.2.1.1 The Sequence Number of Papers
Sequencing papers in an appropriate order always results in a clear, logical analysis. The papers
examined for each specific topic are sequenced in reverse chronological order. In other words, the
newest publication is positioned at the top of the analysis table and assigned the number 1. The total
number of papers examined is thus easy to ascertain. The sequence number is also an important
component of the “Code Name” column, as explained in subsection 3.2.1.3. The sequence number
column is headed “#” in the table.
3.2.1.2 Year of Publication
Domain validation methodologies may vary yearly. It was important to collect details about the
publication dates so that variations in the percentage of each methodology during specific periods can
be analyzed. The “Year” column also serves as the basis of the ordering of the sequence numbers of
the papers listed in the # column.
3.2.1.3 Code Name of Each Article
Each article examined was given a unique two-part code name. The first part is the abbreviation of
the category. The index of abbreviations for each category is introduced in subsection 3.2.2. The
second part is the sequence number of the article mentioned above. For example, “CN” is the
abbreviation for “Constructability.” If the paper belongs to the Constructability category and its

36
sequence number is 1, its code name is CN-1. Coding names for articles provides two advantages:
convenience and neatness. First, the codes make it easy and convenient for readers to recognize the
category to which the article belongs. Second, coding saves space in the table. The rather long titles
of some articles would require additional rows, which would render the table unreadable.
3.2.1.4 Validation Methodologies
The validation methodologies column consists of 8 sub-columns: one each for the seven common
types of validation methodologies and a last sub-column designated “Other.” The common types
represented by the first seven headings have been introduced in section 2.3: Experimental Studies,
Observational Studies, Empirical Studies, Case Studies, Surveys, Functional Demonstrations, and
Archival Data Analysis. The Other sub-column is used to indicate any methodologies outside of the
first seven. The information about each methodology matches that presented in Table 2-2. If the
methodology has been applied in the study described in the article examined, a 1 is entered in the
corresponding cell. Otherwise, the corresponding cell is left blank. It’s possible that some articles are
applied more one validation methodology. In this case, we are allowed to enter 1 in multiple
corresponding cells.
3.2.2 Categories of Sources
As mentioned in section 2.6, the papers examined are from three main categories of sources:
practices, factors, and technologies.
The practices category includes 10 sub-categories: constructability, zero accident techniques,
resource leveling, alignment, knowledge management, risk management, contract and project
delivery, craft training, site layout, and short-term scheduling. Introductions to these sources have
been presented in subsection 2.6.1.
The category indicating factors that can adversely affect productivity is for denoting papers related
to factors such as adverse weather, craft density, overmanning, etc. Information about this category
can be found in subsection 2.6.2.
The technologies category includes papers related to information technology, advances in
materials, and advances in tools and equipment. Details about this category are provided in subsection
2.6.3.

37
To facilitate the coding of each article, each category was given a unique abbreviation according to
the index shown in Table 3-1.
Table 3-1 Index of Category Abbreviations
Name of Category Abbreviation
Constructability CN
Zero Accident Technique ZA
Resource Leveling RL
Alignment AL
Knowledge Management KM
Risk Management RM
Contract and Project Delivery CP
Craft Training CT
Site Layout SL
Short-Term Scheduling SS
Factors FC
Technologies TC
To illustrate the structure of the analysis tables, an example related to the analysis table for the
Constructability category is shown as Table 3-2.
3.3 Principles of the Application of the Validation Methodology Classifications
The crucial element of this research was to determine which validation methodology or
methodologies had been applied, as reported in the article. To enable a rigorous analysis, the
following principles served as guidelines:
Be clear about the definition of each methodology.
Understand the features of each methodology.
Examine each article and analyze its structure.
Match the characteristics of the methodology described in the article to the features of a
particular methodology.

38
The first step was to acquire an understanding of validation methodologies, which have been
introduced in section 2.3. Table 3-3 highlights the features of each validation methodology. To
determine the type of validation methodology reported in each article, after the examination of each
paper selected, the characteristics of the validation methodology described in the article were
analyzed and compared with the information listed in Table 3-3. 20% of examined papers were
classified with Dr. Carl T. Haas to confirm that the determination of the types of validation
methodology was not overly subjective.

39
Table 3-2 Example of the Constructability Analysis Table
# Year Code
Name
Validation Methodologies (If applicable, enter 1; otherwise, leave blank.)
Experimental
Studies
Observational
Studies
Empirical
Studies
Case
Studies Surveys
Functional
Demonstrations
Archival
Data
Analysis
Others
1 2012 CN-1
2 2010 CN-2
3 2009 CN-3
… … …
N 1985 CN-N
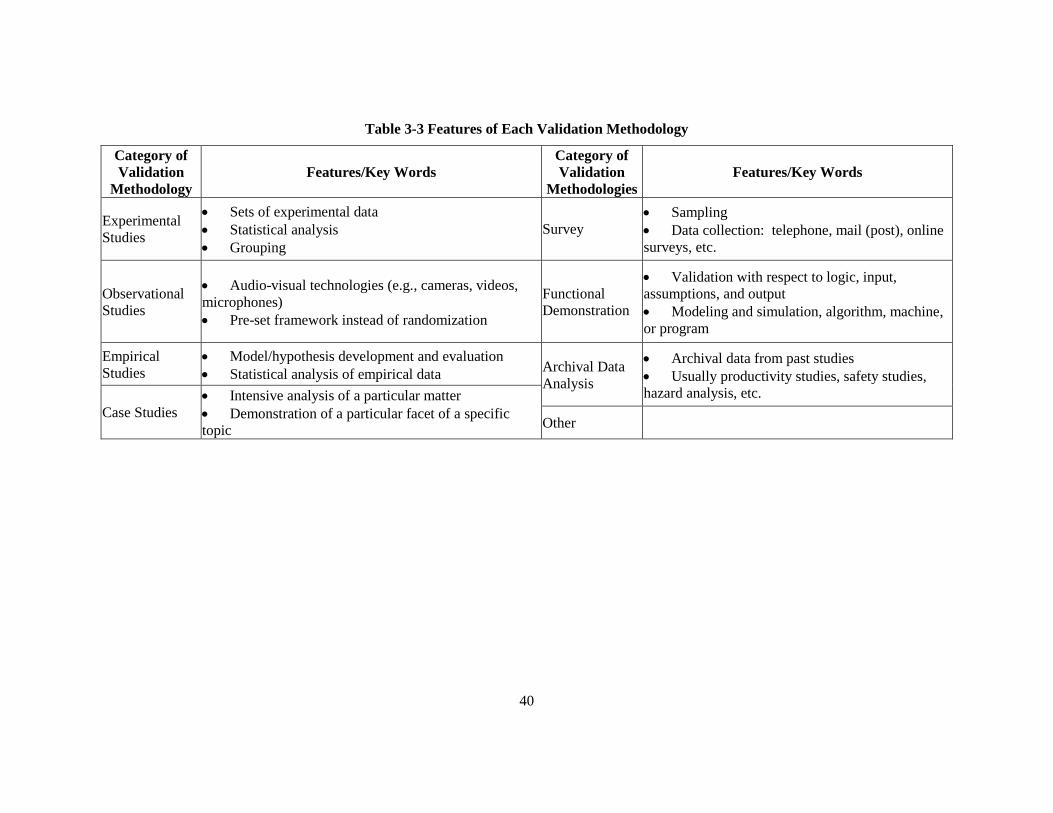
40
Table 3-3 Features of Each Validation Methodology
Category of
Validation
Methodology
Features/Key Words
Category of
Validation
Methodologies
Features/Key Words
Experimental
Studies
Sets of experimental data
Statistical analysis
Grouping
Survey
Sampling
Data collection: telephone, mail (post), online
surveys, etc.
Observational
Studies
Audio-visual technologies (e.g., cameras, videos,
microphones)
Pre-set framework instead of randomization
Functional
Demonstration
Validation with respect to logic, input,
assumptions, and output
Modeling and simulation, algorithm, machine,
or program
Empirical
Studies
Model/hypothesis development and evaluation
Statistical analysis of empirical dataArchival Data
Analysis
Archival data from past studies
Usually productivity studies, safety studies,
hazard analysis, etc.
Case Studies
Intensive analysis of a particular matter
Demonstration of a particular facet of a specific
topicOther

41
Chapter 4
Characterization of Research Practices
4.1 Introduction
This chapter presents analysis tables that contain data collected for each category. For each analysis
table, one or two examples of the analysis process are also provided so that readers will acquire a
better understanding of the classification principles mentioned in section 3.3.
4.2 Analysis Tables
4.2.1 Constructability Analysis Table
4.2.1.1 Introduction
For the Constructability category, 43 papers were examined. The time period associated with the
articles ranges from 1986 to 2012. The topics include such areas as the impact of constructability on
productivity, how to improve constructability, and barriers to constructability.
4.2.1.2 Analysis Process
The first step is to arrange the articles in reverse chronological order and to assign code names. Based
on Table 3-1, the abbreviation for this category is CN, so the code names for this category all begin
with CN. The index of code names for each article in this category is presented in Table 4-1.
Article CN-25 serves as an illustration of the process of analyzing the validation methodologies in
this category. The first requirement is to understand the main idea of the article. The authors
conducted research to discover ways to decrease the duration of construction projects without
increasing the costs. They modeled and analyzed the effects of constructability reviews on the design
phase, the construction phase, and the project duration. The results revealed that managing
constructability reviews can help reduce the duration of highway projects. The second task was to
scan the article to find the validation part of the research. In this paper, the section entitled “Model
Testing and Behaviour” can be considered the description of the validation of the model. The authors
validated the model from three perspectives: 1) structural similarity to the actual system; 2)
reasonable behaviour over a wide range of input values; and 3) behavioural similarity to actual
systems. The test results for all of these aspects were positive, which confirmed the validity of the
model. An examination of Table 3-3, which lists the features of each validation methodology, shows
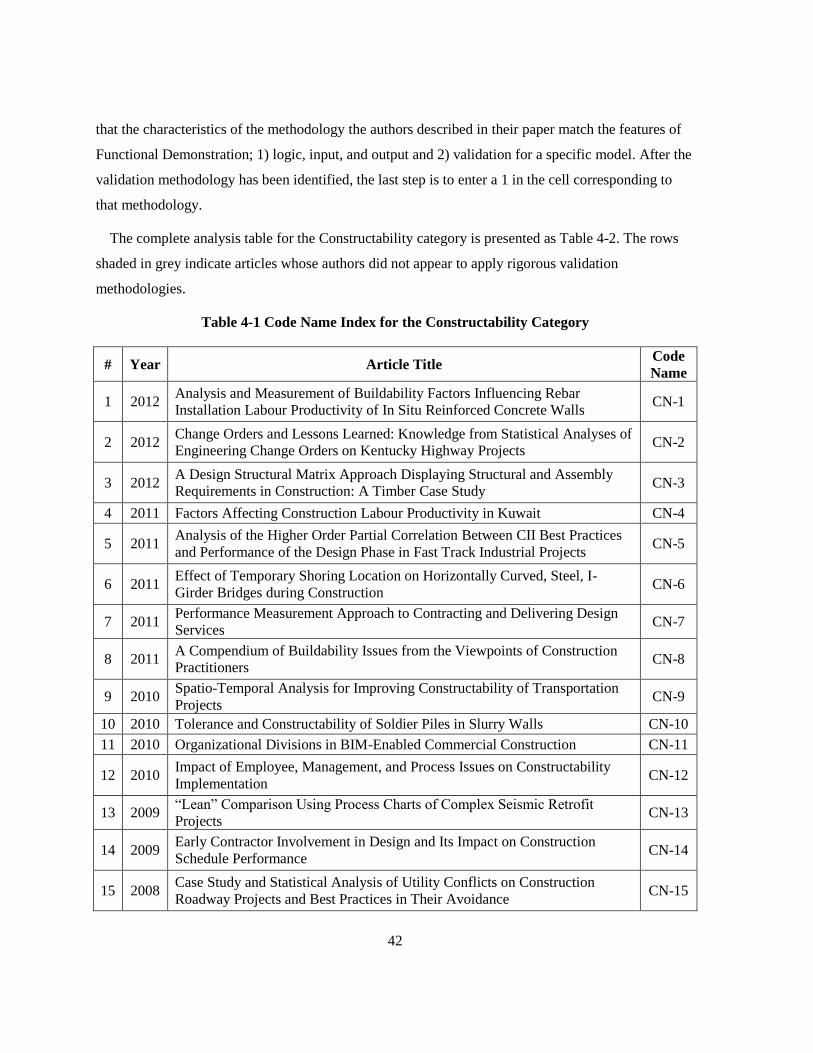
42
that the characteristics of the methodology the authors described in their paper match the features of
Functional Demonstration; 1) logic, input, and output and 2) validation for a specific model. After the
validation methodology has been identified, the last step is to enter a 1 in the cell corresponding to
that methodology.
The complete analysis table for the Constructability category is presented as Table 4-2. The rows
shaded in grey indicate articles whose authors did not appear to apply rigorous validation
methodologies.
Table 4-1 Code Name Index for the Constructability Category
# Year Article Title Code
Name
1 2012 Analysis and Measurement of Buildability Factors Influencing Rebar
Installation Labour Productivity of In Situ Reinforced Concrete Walls CN-1
2 2012 Change Orders and Lessons Learned: Knowledge from Statistical Analyses of
Engineering Change Orders on Kentucky Highway Projects CN-2
3 2012 A Design Structural Matrix Approach Displaying Structural and Assembly
Requirements in Construction: A Timber Case Study CN-3
4 2011 Factors Affecting Construction Labour Productivity in Kuwait CN-4
5 2011 Analysis of the Higher Order Partial Correlation Between CII Best Practices
and Performance of the Design Phase in Fast Track Industrial Projects CN-5
6 2011 Effect of Temporary Shoring Location on Horizontally Curved, Steel, I-
Girder Bridges during Construction CN-6
7 2011 Performance Measurement Approach to Contracting and Delivering Design
Services CN-7
8 2011 A Compendium of Buildability Issues from the Viewpoints of Construction
Practitioners CN-8
9 2010 Spatio-Temporal Analysis for Improving Constructability of Transportation
Projects CN-9
10 2010 Tolerance and Constructability of Soldier Piles in Slurry Walls CN-10
11 2010 Organizational Divisions in BIM-Enabled Commercial Construction CN-11
12 2010 Impact of Employee, Management, and Process Issues on Constructability
Implementation CN-12
13 2009 “Lean” Comparison Using Process Charts of Complex Seismic Retrofit
Projects CN-13
14 2009 Early Contractor Involvement in Design and Its Impact on Construction
Schedule Performance CN-14
15 2008 Case Study and Statistical Analysis of Utility Conflicts on Construction
Roadway Projects and Best Practices in Their Avoidance CN-15

43
# Year Article Title Code
Name
16 2007 Constructability Rankings of Construction Systems Based on the Analytical
Hierarchy Process CN-16
17 2006 Project Designers’ Role in Improving Constructability of Indonesian
Construction Projects CN-17
18 2006 Constructability Practices to Manage Sustainable Building Knowledge CN-18
19 2005 Constructability State of Practice Report CN-19
20 2005 Organizing Constructability Knowledge for Design CN-20
21 2005 Building Better: Technical Support for Construction CN-21
22 2004 Providing Cost and Constructability Feedback to Designers CN-22
23 2004 A Review of Constructability Barriers and Issues in Highway Construction CN-23
24 2004 POST: Product Oriented Scheduling Technique for Constructability Analysis CN-24
25 2004 Managing Constructability Reviews to Reduce Highway Project Durations CN-25
26 2004 Component State Criteria Representation to Incorporate Construction
Program Knowledge for Constructability Analysis CN-26
27 2002 Constructability Analysis in the Design Firm CN-27
28 2001 Benefits of Constructability on Construction Projects CN-28
29 1994 Model for Constructability Approach Selection CN-29
30 1994 Barriers to Constructability Implementation CN-30
31 1994 Constructability Related to TQM, Value Engineering, and Cost/Benefits CN-31
32 1994 Constructability Programs: Method for Assessment and Benchmarking CN-32
33 1993 Project‐Level Model Process for Implementing Constructability CN-33
34 1993 Fossil Power Plant Constructability: Applications of CII Concepts CN-34
35 1993 Documented Constructability Savings for Petrochemical‐Facility Expansion CN-35
36 1993 Comparison of Two Corporate Constructability Programs CN-36
37 1991 Factors Affecting Masonry‐Labour Productivity CN-37
38 1991 Constructability and Constructability Programs: White Paper CN-38
39 1988 Constructability Improvement During Field Operations CN-39
40 1987 Constructability Concepts for Engineering and Procurement CN-40
41 1987 Designing Plans for Constructability CN-41
42 1986 Industrial Project Constructability Improvement CN-42
43 1986 Impacts of Constructability Improvement CN-43
Table 4-1 Code Name Index for the Constructability Category (Continued)
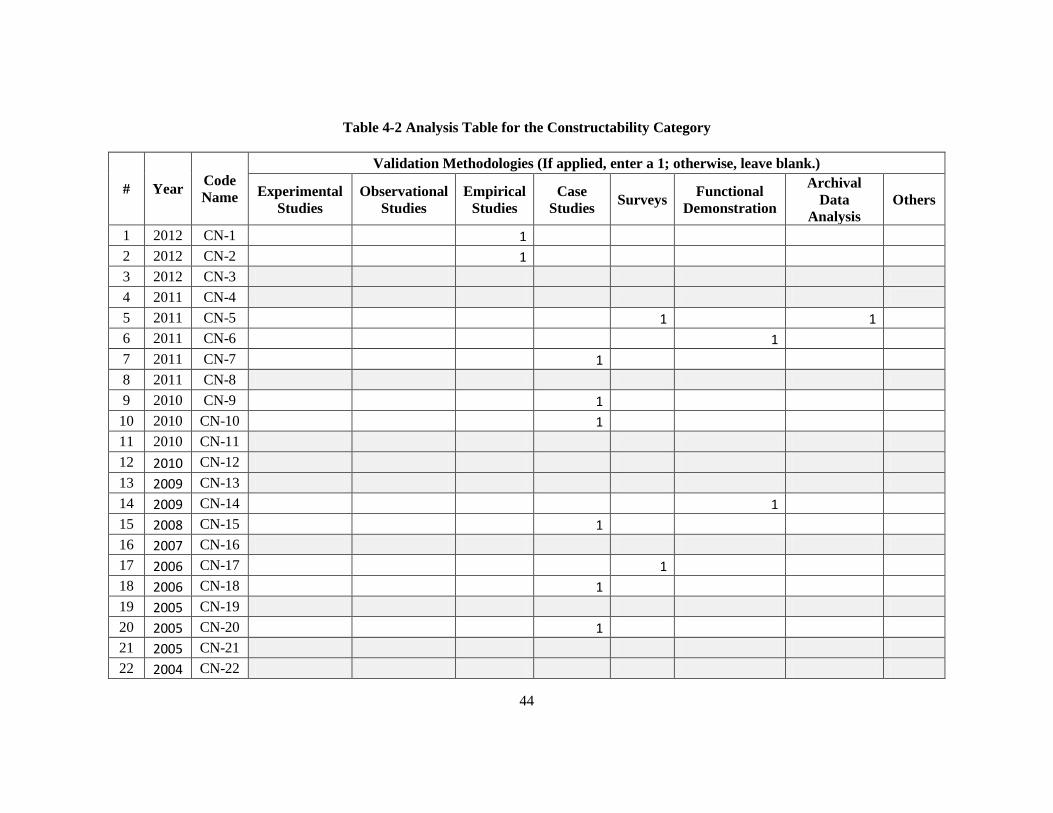
44
Table 4-2 Analysis Table for the Constructability Category
# Year Code
Name
Validation Methodologies (If applied, enter a 1; otherwise, leave blank.)
Experimental
Studies
Observational
Studies
Empirical
Studies
Case
Studies Surveys
Functional
Demonstration
Archival
Data
Analysis
Others
1 2012 CN-1 1
2 2012 CN-2 1
3 2012 CN-3
4 2011 CN-4
5 2011 CN-5 1 1
6 2011 CN-6 1
7 2011 CN-7 1
8 2011 CN-8
9 2010 CN-9 1
10 2010 CN-10 1
11 2010 CN-11
12 2010 CN-12
13 2009 CN-13
14 2009 CN-14 1
15 2008 CN-15 1
16 2007 CN-16
17 2006 CN-17 1
18 2006 CN-18 1
19 2005 CN-19
20 2005 CN-20 1
21 2005 CN-21
22 2004 CN-22

45
Table 4-2 Analysis Table for the Constructability Category (Continued)
# Year Code
Name
Validation Methodologies (If applied, enter a 1; otherwise, leave blank.)
Experimental
Studies
Observational
Studies
Empirical
Studies
Case
Studies Surveys
Functional
Demonstration
Archival
Data
Analysis
Others
23 2004 CN-23
24 2004 CN-24
25 2004 CN-25 1
26 2004 CN-26
27 2002 CN-27 1
28 2001 CN-28
1
29 1994 CN-29
1
30 1994 CN-30 1
31 1994 CN-31
32 1994 CN-32 1
33 1993 CN-33
34 1993 CN-34
35 1993 CN-35 1
36 1993 CN-36
37 1991 CN-37 1
38 1991 CN-38
39 1988 CN-39
40 1987 CN-40
41 1987 CN-41
42 1986 CN-42
43 1986 CN-43

46
4.2.2 Zero Accident Techniques Analysis Table
4.2.2.1 Introduction
For the Zero Accident Techniques category, 37 papers were examined. The time period ranges from
1991 to 2012. This category includes topics such as the cost of construction injuries, safety
management, and the difficulties of implementing safety practices.
4.2.2.2 Analysis Process
Since, according to Table 3-1, the abbreviation for this category is ZA, the code names for this
category all start with ZA. The code name index for this category is presented in Table 4-3.
To illustrate the process of analyzing the validation methodologies for this category, article ZA-29
was chosen as an example. The authors of this article described the adaptation process of a case-based
reasoning (CBR) approach for the identification of construction safety hazards, with the goal of
utilizing past knowledge in the form of previous cases related to the identification and incidence of
hazards in order to improve the efficiency and quality of the identification of new hazards. The
authors also proposed a three-step adaption process for hazard identification. In this paper, the section
called “Case Study” was considered to be the description of the validation of the adaptation
mechanism. The authors utilized real data from the LTA and from the Mine Safety and Health
Administration and then conducted intensive analysis, following which they concluded that the
feasibility of the proposed adaptation techniques had been validated. Based on Table 3-3, the
characteristics of the methodology applied by the authors match those of the Case Study
methodology. The matching features include 1) the intensive analysis of a particular matter and 2) the
demonstration of a particular facet of a specific topic.
The complete analysis table for the Zero Accident Techniques category is presented as Table 4-4.
The rows shaded in grey indicate articles in which the authors didn’t apply rigorous validation
methodologies.
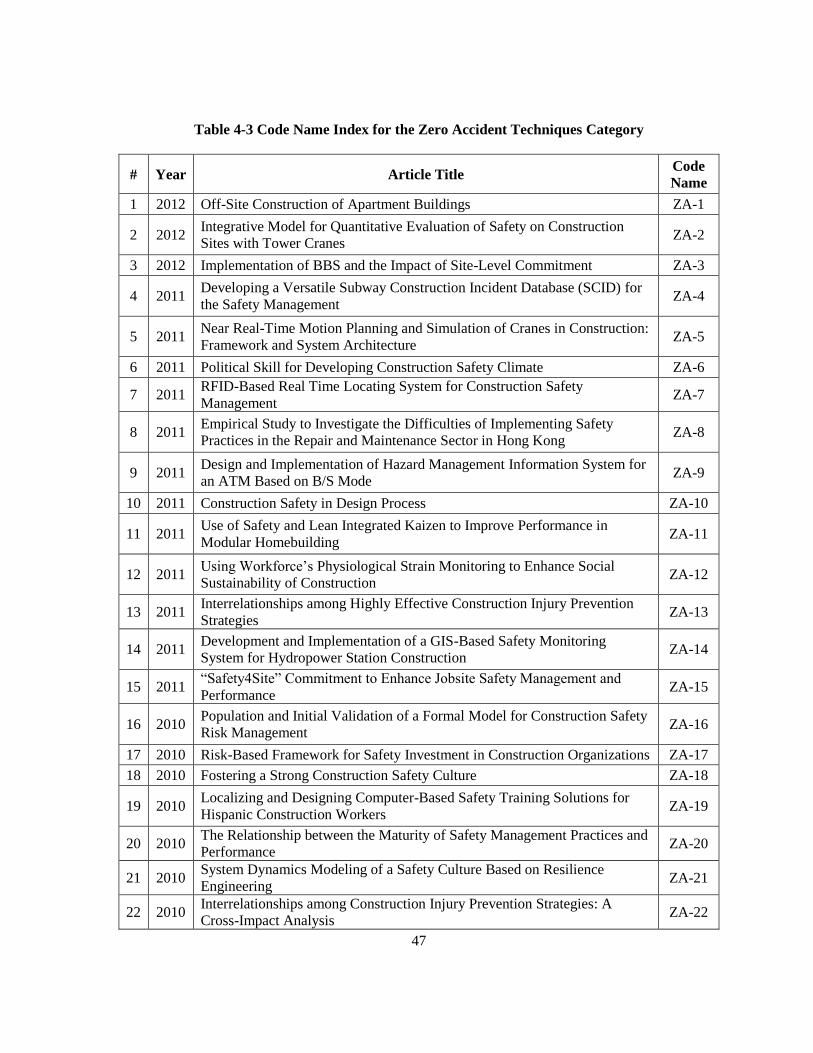
47
Table 4-3 Code Name Index for the Zero Accident Techniques Category
# Year Article Title Code
Name
1 2012 Off-Site Construction of Apartment Buildings ZA-1
2 2012 Integrative Model for Quantitative Evaluation of Safety on Construction
Sites with Tower Cranes ZA-2
3 2012 Implementation of BBS and the Impact of Site-Level Commitment ZA-3
4 2011 Developing a Versatile Subway Construction Incident Database (SCID) for
the Safety Management ZA-4
5 2011 Near Real-Time Motion Planning and Simulation of Cranes in Construction:
Framework and System Architecture ZA-5
6 2011 Political Skill for Developing Construction Safety Climate ZA-6
7 2011 RFID-Based Real Time Locating System for Construction Safety
Management ZA-7
8 2011 Empirical Study to Investigate the Difficulties of Implementing Safety
Practices in the Repair and Maintenance Sector in Hong Kong ZA-8
9 2011 Design and Implementation of Hazard Management Information System for
an ATM Based on B/S Mode ZA-9
10 2011 Construction Safety in Design Process ZA-10
11 2011 Use of Safety and Lean Integrated Kaizen to Improve Performance in
Modular Homebuilding ZA-11
12 2011 Using Workforce’s Physiological Strain Monitoring to Enhance Social
Sustainability of Construction ZA-12
13 2011 Interrelationships among Highly Effective Construction Injury Prevention
Strategies ZA-13
14 2011 Development and Implementation of a GIS-Based Safety Monitoring
System for Hydropower Station Construction ZA-14
15 2011 “Safety4Site” Commitment to Enhance Jobsite Safety Management and
Performance ZA-15
16 2010 Population and Initial Validation of a Formal Model for Construction Safety
Risk Management ZA-16
17 2010 Risk-Based Framework for Safety Investment in Construction Organizations ZA-17
18 2010 Fostering a Strong Construction Safety Culture ZA-18
19 2010 Localizing and Designing Computer-Based Safety Training Solutions for
Hispanic Construction Workers ZA-19
20 2010 The Relationship between the Maturity of Safety Management Practices and
Performance ZA-20
21 2010 System Dynamics Modeling of a Safety Culture Based on Resilience
Engineering ZA-21
22 2010 Interrelationships among Construction Injury Prevention Strategies: A
Cross-Impact Analysis ZA-22
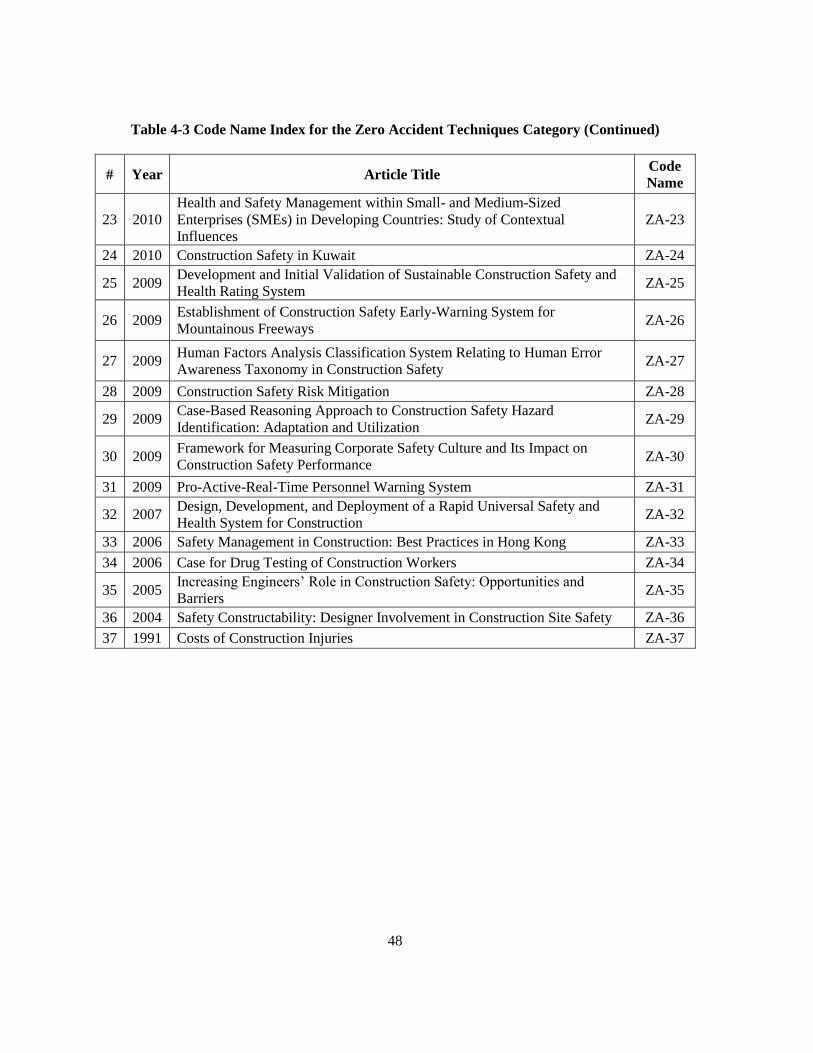
48
Table 4-3 Code Name Index for the Zero Accident Techniques Category (Continued)
# Year Article Title Code
Name
23 2010
Health and Safety Management within Small- and Medium-Sized
Enterprises (SMEs) in Developing Countries: Study of Contextual
Influences
ZA-23
24 2010 Construction Safety in Kuwait ZA-24
25 2009 Development and Initial Validation of Sustainable Construction Safety and
Health Rating System ZA-25
26 2009 Establishment of Construction Safety Early-Warning System for
Mountainous Freeways ZA-26
27 2009 Human Factors Analysis Classification System Relating to Human Error
Awareness Taxonomy in Construction Safety ZA-27
28 2009 Construction Safety Risk Mitigation ZA-28
29 2009 Case-Based Reasoning Approach to Construction Safety Hazard
Identification: Adaptation and Utilization ZA-29
30 2009 Framework for Measuring Corporate Safety Culture and Its Impact on
Construction Safety Performance ZA-30
31 2009 Pro-Active-Real-Time Personnel Warning System ZA-31
32 2007 Design, Development, and Deployment of a Rapid Universal Safety and
Health System for Construction ZA-32
33 2006 Safety Management in Construction: Best Practices in Hong Kong ZA-33
34 2006 Case for Drug Testing of Construction Workers ZA-34
35 2005 Increasing Engineers’ Role in Construction Safety: Opportunities and
Barriers ZA-35
36 2004 Safety Constructability: Designer Involvement in Construction Site Safety ZA-36
37 1991 Costs of Construction Injuries ZA-37

49
Table 4-4 Analysis Table for the Zero Accident Techniques Category
# Year Code
Name
Validation Methodologies (If applied, enter a 1; otherwise, leave blank.)
Experimental
Studies
Observational
Studies
Empirical
Studies
Case
Studies Surveys
Functional
Demonstration
Archival
Data
Analysis
Others
1 2012 ZA-1 1
2 2012 ZA-2 1 1
3 2012 ZA-3
4 2011 ZA-4
5 2011 ZA-5 1
6 2011 ZA-6 1 1
7 2011 ZA-7 1
8 2011 ZA-8
9 2011 ZA-9
10 2011 ZA-10 1
11 2011 ZA-11 1
12 2011 ZA-12 1
13 2011 ZA-13 1
14 2011 ZA-14 1
15 2011 ZA-15
16 2010 ZA-16 1 Delphi
17 2010 ZA-17 1
18 2010 ZA-18
19 2010 ZA-19 1
20 2010 ZA-20 1 1
21 2010 ZA-21
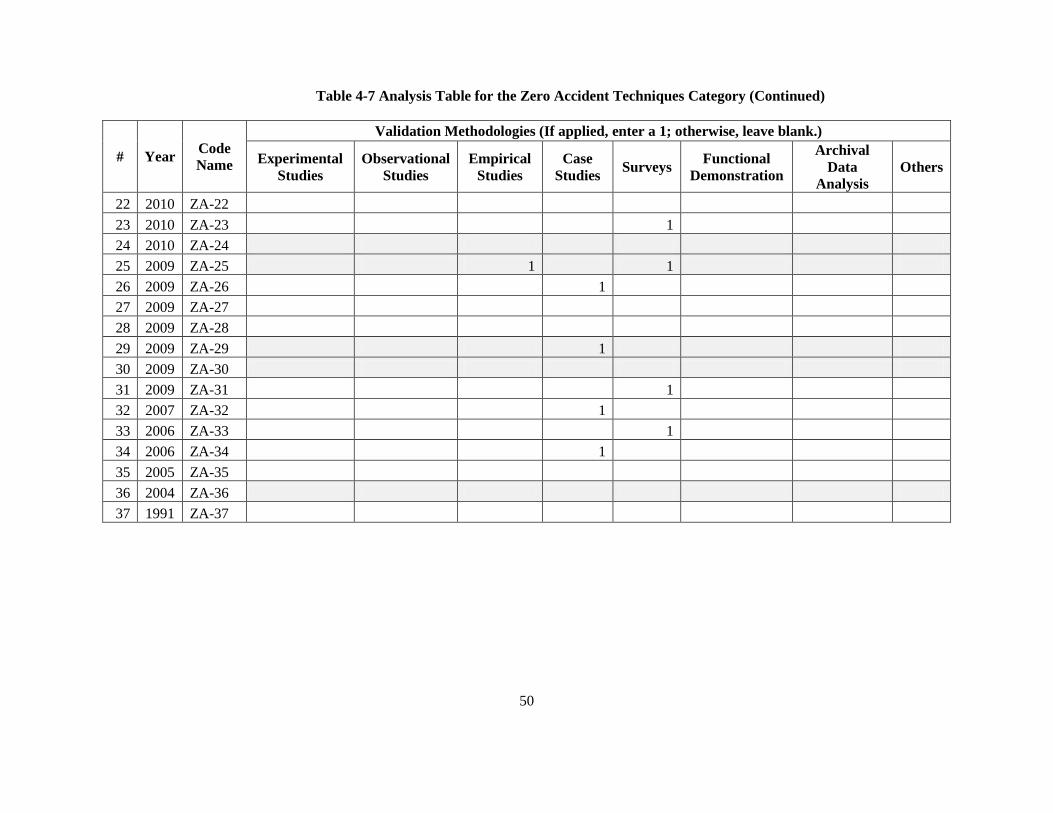
50
# Year Code
Name
Validation Methodologies (If applied, enter a 1; otherwise, leave blank.)
Experimental
Studies
Observational
Studies
Empirical
Studies
Case
Studies Surveys
Functional
Demonstration
Archival
Data
Analysis
Others
22 2010 ZA-22
23 2010 ZA-23 1
24 2010 ZA-24
25 2009 ZA-25 1 1
26 2009 ZA-26 1
27 2009 ZA-27
28 2009 ZA-28
29 2009 ZA-29 1
30 2009 ZA-30
31 2009 ZA-31 1
32 2007 ZA-32 1
33 2006 ZA-33 1
34 2006 ZA-34 1
35 2005 ZA-35
36 2004 ZA-36
37 1991 ZA-37
Table 4-7 Analysis Table for the Zero Accident Techniques Category (Continued)

51
4.2.3 Resource Leveling Analysis Table
4.2.3.1 Introduction
For the Resource Leveling category, 27 papers from 1989 to 2012 were examined. Topics in this
category cover areas such as how to optimize resource leveling, algorithms for resource leveling, and
cost efficiencies regarding resource leveling. Typically, the authors of most papers validated that the
levelling made the cost of projects cheaper and the projects go faster.
4.2.3.2 Analysis Process
From Table 3-1 the abbreviation for this category is RL, so the code names for this category start with
RL. The code name index for this category is presented in Table 4-5.
Article RL-16 is an example that illustrates the process of analyzing the validation methodologies
of this category. The authors presented a permutation-based elitist genetic algorithm. It was described
as an efficient optimal solution algorithm for project networks with 60 activities or more. The
algorithm also overcame the drawbacks associated with exact solution approaches for large-sized
project networks. In this paper, the “Computational Experiments” section presented the validation of
the generic algorithm. The authors ran computational experiments to demonstrate the performance of
the proposed algorithm, including an assessment of the effects of the parameters on its performance
and a comparison of its results with those of the well-known optimum and lower bound solutions. The
authors analyzed the results statistically and proved the accuracy of the algorithms. Based on Table 3-
3, the characteristics of the methodology applied match the features of Experimental Studies: 1) sets
of experiments and 2) statistical analysis.
The complete analysis table for the Resource Leveling Category is presented as Table 4-6. The
rows shaded in grey indicate articles whose authors didn’t apply rigorous validation methodologies.
Table 4-5 Code Name Index for the Resource Leveling Category
# Year Article Title Code
Name
1 2012 Simulation-Based Auction Protocol for Resource Scheduling Problems RL-1
2 2011 Construction Resource Allocation and Leveling Using a Threshold Accepting
Based Hyper-heuristic Algorithm RL-2
3 2011 Heuristic Method for Satisfying Both Deadlines and Resource Constraints RL-3
4 2011 Cost Optimization Model for the Multi-Resource Leveling Problem with
Allowed Activity Splitting RL-4

52
# Year Article Title Code
Name
5 2011 Multi-Objective Optimization of Resource Leveling and Allocation During
Construction Scheduling RL-5
6 2011 Efficient Hybrid Genetic Algorithm for Resource Leveling via Activity
Splitting RL-6
7 2011 Integrating Efficient Resource Optimization and Linear Schedule Analysis
with Singularity Functions RL-7
8 2011
A Fuzzy Enabled Hybrid Genetic Algorithm‐Particle Swarm Optimization
Approach to Solve Time‐Cost‐Resource Optimization Problems in
Construction Project Planning
RL-8
9 2010 Minimum Moment Method for Resource Leveling Using Entropy
Maximization RL-9
10 2010 Scheduling Resource-Constrained Projects with Ant Colony Optimization
Artificial Agents RL-10
11 2010 Comparing Schedule Generation Schemes in Resource-Constrained Project
Scheduling Using Elitist Genetic Algorithm RL-11
12 2010 Optimizing Resource Utilization during the Recovery of Civil Infrastructure
Systems RL-12
13 2009 Optimizing Resource Leveling in Construction Projects RL-13
14 2009 Stochastic Time-Cost-Resource Utilization Optimization Using Non-
Dominated Sorting Genetic Algorithm and Discrete Fuzzy Sets RL-14
15 2009 Simulation Approach to Evaluating Cost Efficiency of Selective Demolition
Practices: Case of Hong Kong’s Kai Tak Airport Demolition RL-15
16 2008 Permutation-Based Elitist Genetic Algorithm for Optimization of Large-Sized
Resource-Constrained Project Scheduling RL-16
17 2008 Critical Path Scheduling under Resource Calendar Constraints RL-17
18 2007 Project Planning for Construction under Uncertainty with Limited Resources RL-18
19 2007 Schedule Analysis under the Effect of Resource Allocation RL-19
20 2006 Non-Unit-Based Planning and Scheduling of Repetitive Construction Projects RL-20
21 2006 Work Continuity Constraints in Project Scheduling RL-21
22 2006 Particle Swarm Optimization for Preemptive Scheduling under Break and
Resource-Constraints RL-22
23 2005 Evaluation of the Resource-Constrained Critical Path Method Algorithms RL-23
24 1991 Time‐Constrained Resource Leveling RL-24
25 1991 Optimal Allocation of Project Management Resources for Achieving Success RL-25
26 1990 Packing Method for Resource Leveling (Pack) RL-26
27 1989 Resource Leveling in Construction by Optimization RL-27
Table 4-5 Code Name Index for the Resource Leveling Category (Continued)

53
Table 4-6 Analysis Table for the Resource Leveling Category
#
Year Code
Name
Validation Methodologies (If applied, enter a 1; otherwise, leave the cell blank.)
Experimental
Studies
Observational
Studies
Empirical
Studies
Case
Studies Surveys
Functional
Demonstration
Archival Data
Analysis Others
1 2012 RL-1 1
2 2011 RL-2 1
3 2011 RL-3 1
4 2011 RL-4 1
5 2011 RL-5 1
6 2011 RL-6
1
7 2011 RL-7 1
8 2011 RL-8 1
9 2010 RL-9 1
10 2010 RL-10 1
11 2010 RL-11
12 2010 RL-12 1
13 2009 RL-13 1
14 2009 RL-14
1
15 2009 RL-15 1
16 2008 RL-16 1
17 2008 RL-17 1
18 2007 RL-18 1
19 2007 RL-19 1
20 2006 RL-20 1
21 2006 RL-21 1
22 2006 RL-22 1
23 2005 RL-23
24 1991 RL-24
25 1991 RL-25 1
26 1990 RL-26
27 1989 RL-27

54
4.2.4 Alignment Analysis Table
4.2.4.1 Introduction
For the Alignment category, 22 papers were examined, with a publication period ranging from 1998
to 2011. This category includes topics such as the development of models for the alignment of
construction project teams, how to implement alignment practices, and the assessment of alignment.
4.2.4.2 Analysis Process
Since AL is the abbreviation for this category, based on Table 3-1, the code names for this category
start with AL. The code name index for this category is presented in Table 4-7.
Article AL-15 can be used as an illustrative example for this category. The authors proposed a
model for partnering, which was derived from reports and theories previously published in the
literature. The goal of the model was to help project managers concentrate on the aspects of team
processes necessary for creating a high degree of cooperation and performance. In this paper, it was
the “Validation of Model of Partnering” section. To validate the model, the authors conducted
archival research. Numerous past studies supported the proposed model, so it was considered to be
validated. Based on Table 3-3, the characteristics of the methodology applied match the typical
features of Archival Data Analysis: utilization of research results from past studies that supported the
validity of the model.
The complete analysis table for the Alignment category is presented as Table 4-8. The rows shaded
in grey indicate articles whose authors didn’t apply rigorous validation methodologies.
Table 4-7 Code Name Index for the Alignment Category
# Year Article Title Code
Name
1 2011 Fuzzy Similarity Consensus Model for Early Alignment of Construction
Project Teams on the Extent of Their Roles and Responsibilities AL-1
2 2011 Project Network Interdependency Alignment: New Approach to Assessing
Project Effectiveness AL-2
3 2011 Goal and Process Alignment during the Implementation of Decision
Support Systems by Project Teams AL-3
4 2011 Analysis of the Higher Order Partial Correlation between CII Best Practices
and Performance of the Design Phase in Fast Track Industrial Projects AL-4
5 2011 Multi Country Perspectives of Relational Contracting and Integrated Project
Teams AL-5

55
# Year Article Title Code
Name
6 2011 Contract Administration Guidelines for Managing Conflicts, Claims, and
Disputes under World Bank Funded Projects AL-6
7 2011 Partnering: What Must Be Done to Avoid Failure AL-7
8 2010 Assessment of Responsibilities of Project Teams for Owner Managing
Contractor Tasks — A Fuzzy Consensus Approach AL-8
9 2010 Personal Construct-Based Factors Affecting Interpersonal Trust in a Project
Design Team AL-9
10 2010 Project Organizations as Social Networks AL-10
11 2009 Enhancing Total Quality Management by Partnering
in Construction AL-11
12 2009 Assessing Scope and Managing Risk in the Highway Project Development
Process AL-12
13 2009 Aligning Pre‐Construction Planning and Project Management in the
Electrical Construction Industry AL-13
14 2009 Predictive Simulation as a Decision Support System to Manage A/E/C
Global Teamwork AL-14
15 2007 Conceptual Model of Partnering and Alliancing AL-15
16 2007 Inter-Organizational Teamwork in the Construction Industry AL-16
17 2004 Strategies for Successful Partnering Relationships AL-17
18 2002 Incentive Mechanisms for Project Success AL-18
19 2002 Construction Partnering Process and Associated Critical Success Factors:
Quantitative Investigation AL-19
20 2000 Team-Building in Construction AL-20
21 1999 Leadership in the Construction Industry AL-21
22 1998 Partnering Continuum AL-22
Table 4-7 Code Name Index for the Alignment Category (Continued)

56
Table 4-8 Analysis Table for the Alignment Category
# Year Code
Name
Validation Methodologies (If applied, enter a 1; otherwise, leave blank.)
Experimental
Studies
Observational
Studies
Empirical
Studies
Case
Studies Surveys
Functional
Demonstration
Archival Data
Analysis Others
1 2011 AL-1
1
2 2011 AL-2
1
3 2011 AL-3
4 2011 AL-4 1
5 2011 AL-5
6 2011 AL-6
7 2011 AL-7
8 2010 AL-8 1
9 2010 AL-9
10 2010 AL-10
11 2009 AL-11 1 1
12 2009 AL-12
1
13 2009 AL-13
14 2009 AL-14 1
15 2007 AL-15 1
16 2007 AL-16 1 1
17 2004 AL-17
18 2002 AL-18 1
19 2002 AL-19 1
20 2000 AL-20
21 1999 AL-21
22 1998 AL-22

57
4.2.5 Knowledge Management Analysis Table
4.2.5.1 Introduction
For the Knowledge Management category, 28 papers were examined. The publication dates ranged
from 2000 to 2012. This category includes topics such as the impact of knowledge management on
construction projects, how to implement and enhance knowledge management, and the development
of models for knowledge management.
4.2.5.2 Analysis Process
All of the code names begin with KM because the abbreviation for this category is listed as KM in
Table 3-1. The code name index for this category is presented in Table 4-9.
The example used as an illustration of the analysis for this category is article KM-4. The authors
postulated that knowledge management has a positive impact on construction projects. They
investigated a sample of capital construction projects in order to validate a model for the assessment
of the interrelationships of the application of IT, the adoption of knowledge management practices,
and the success of a project. They also had the goal of evaluating the mediating role of the adoption
of a knowledge management practice in the relationship between the application of IT and project
performance, and they investigated whether the impact of knowledge management on project success
is affected by the type of project. The part of the paper that described the validation of the research
was the “Results and Analysis” section. To validate the model, the authors applied a structural
equation modeling (SEM) approach. SEM is a statistical technique for testing and estimating causal
relations using a combination of statistical data and qualitative causal assumptions. According to
Table 3-3, the characteristics of this methodology match the features of Empirical Studies: 1) the
development of a model and hypothesis and 2) statistical analysis.
The complete analysis table for the Knowledge Management category is presented as Table 4-10.
The rows shaded in grey indicate papers whose authors didn’t apply rigorous validation
methodologies.

58
Table 4-9 Code Name Index for the Knowledge Management Category
# Year Article Title Code
Name
1 2012 Epistemology of Construction Informatics KM-1
2 2012 Enhancing Knowledge Management for Engineers Using Mind Mapping in
Construction KM-2
3 2012 Developing Project Communities of Practice-Based Knowledge Management
System in Construction KM-3
4 2012 Assessing Impacts of Information Technology on Project Success Through
Knowledge Management Practice KM-4
5 2012 An Integrated Proactive Knowledge Management Model for Enhancing
Engineering Services KM-5
6 2011 Information Management in UK Based Architecture and Engineering
Organisations — Drivers, Constraining Factors and Barriers KM-6
7 2011 Case Study of Knowledge Management Implementation in a Medium‐Sized
Construction Sector Firm KM-7
8 2011 Motivating Knowledge Sharing in Engineering and Construction
Organizations: The Power of Social Motivations KM-8
9 2010 The Embedment of a Knowledge Management Program in an AEC
Organization KM-9
10 2010 Integrated Knowledge Management Model and System for Construction
Projects KM-10
11 2009 Measuring the Impact of Rework on Construction Cost Performance KM-11
12 2009 Identification of Effective Management Practices and Technologies for
Lessons Learned Programs in the Construction Industry KM-12
13 2009 Knowledge Management in Construction Companies in the UK KM-13
14 2009 Collaborative Knowledge Management—A Construction Case Study KM-14
15 2009 Developing a Knowledge Management System for Improved Value
Engineering Practices in the Construction Industry KM-15
16 2008 Knowledge Management Model for Construction Projects KM-16
17 2008 Managing Construction Project Change: A Knowledge Management
Perspective KM-17
18 2007 The Application of Knowledge Management Practices in the Procurement
and Construction of Cleanroom Projects KM-18
19 2007 Knowledge Management to Learning Organization Connection KM-19
20 2007 Developing a Knowledge Map for Construction Scheduling Using a Novel
Approach KM-20
21 2006 Enhancing Knowledge Exchange Through Web Map-Based Knowledge
Management System in Construction: Lessons Learned in Taiwan KM-21
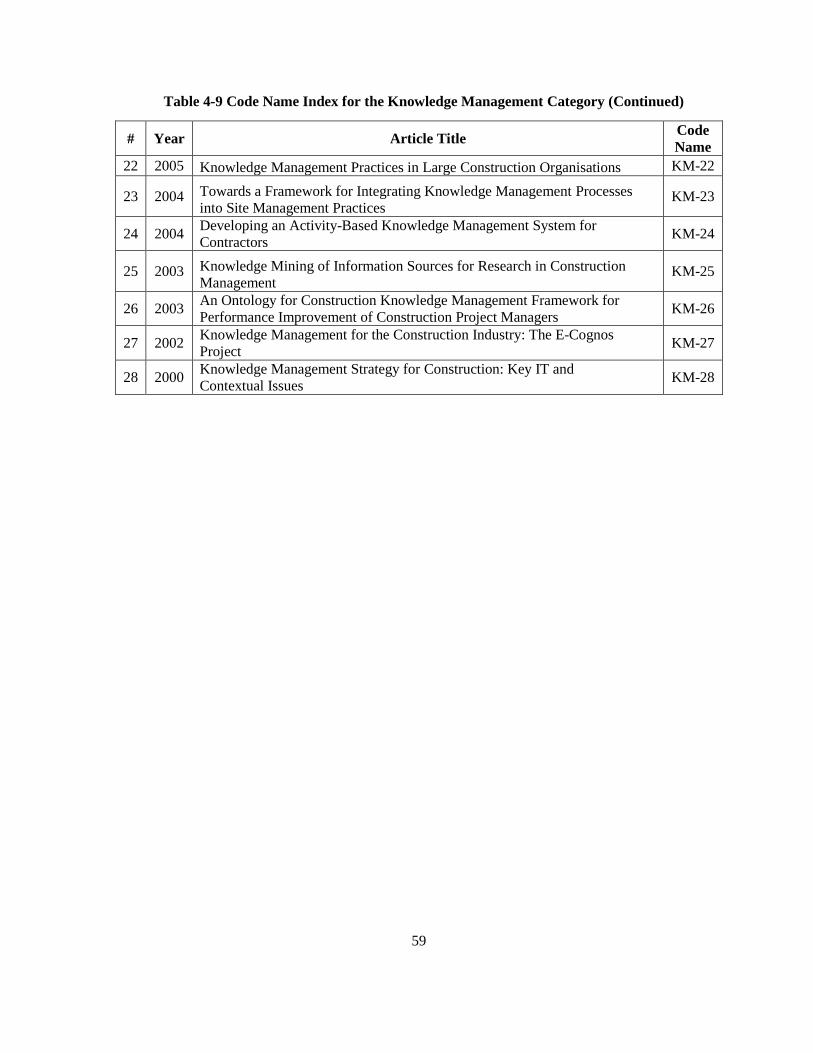
59
# Year Article Title Code
Name
22 2005 Knowledge Management Practices in Large Construction Organisations KM-22
23 2004 Towards a Framework for Integrating Knowledge Management Processes
into Site Management Practices KM-23
24 2004 Developing an Activity-Based Knowledge Management System for
Contractors KM-24
25 2003 Knowledge Mining of Information Sources for Research in Construction
Management KM-25
26 2003 An Ontology for Construction Knowledge Management Framework for
Performance Improvement of Construction Project Managers KM-26
27 2002 Knowledge Management for the Construction Industry: The E-Cognos
Project KM-27
28 2000 Knowledge Management Strategy for Construction: Key IT and
Contextual Issues KM-28
Table 4-9 Code Name Index for the Knowledge Management Category (Continued)
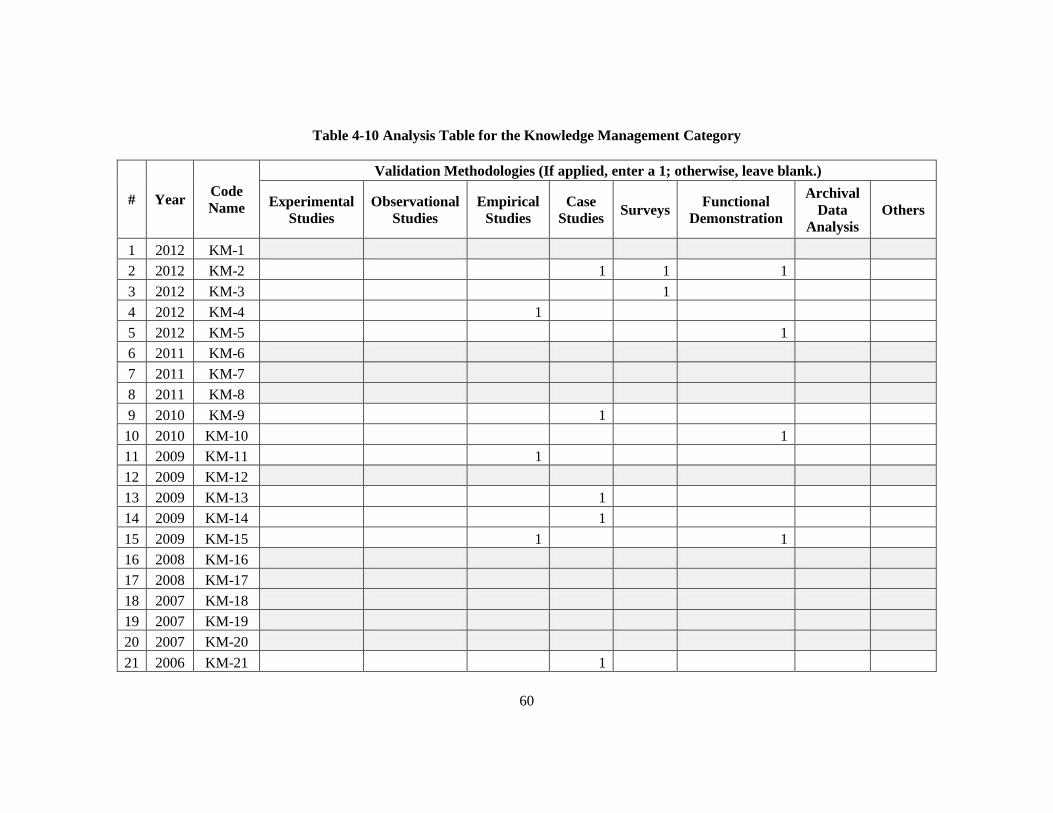
60
Table 4-10 Analysis Table for the Knowledge Management Category
# Year Code
Name
Validation Methodologies (If applied, enter a 1; otherwise, leave blank.)
Experimental
Studies
Observational
Studies
Empirical
Studies
Case
Studies Surveys
Functional
Demonstration
Archival
Data
Analysis
Others
1 2012 KM-1
2 2012 KM-2 1 1 1
3 2012 KM-3
1
4 2012 KM-4 1
5 2012 KM-5
1
6 2011 KM-6
7 2011 KM-7
8 2011 KM-8
9 2010 KM-9 1
10 2010 KM-10
1
11 2009 KM-11 1
12 2009 KM-12
13 2009 KM-13 1
14 2009 KM-14 1
15 2009 KM-15 1
1
16 2008 KM-16
17 2008 KM-17
18 2007 KM-18
19 2007 KM-19
20 2007 KM-20
21 2006 KM-21 1

61
# Year Code
Name
Validation Methodologies (If applied, enter a 1; otherwise, leave blank.)
Experimental
Studies
Observational
Studies
Empirical
Studies
Case
Studies Surveys
Functional
Demonstration
Archival
Data
Analysis
Others
23 2004 KM-23
24 2004 KM-24
1
25 2003 KM-25 1
26 2003 KM-26
27 2002 KM-27
28 2000 KM-28
Table 4-10 Analysis Table for the Knowledge Management Category (Continued)

62
4.2.6 Risk Management Analysis Table
4.2.6.1 Introduction
For the Risk Management category, 29 papers were examined, with publication dates ranging from
2003 to 2011. This category includes topics such as the relationship between risks and costs, how to
implement risk management, and the assessment of construction risks.
4.2.6.2 Analysis Process
Since the abbreviation for this category is RM, based on Table 3-1, the code names for this category
start with RM. The code name index for this category is presented in Table 4-11.
Article RM-4 illustrates the analysis process for this category. The authors attempted to extend
previous studies of risk management and presented an ontology for relating risk-related concepts to
cost overruns. The ontology formed the basis of a multi-agent system that can be used to simulate the
process of negotiation among project participants with respect to a variety of elements related to risks.
It was constructed based on interactions with Turkish contractors who work in international markets
and on an extensive review of the literature relevant to risk-related concepts. The validation of the
model involved an interactive workshop and interviews with industry practitioners. According to the
features listed in Table 3-3, the characteristics of the authors’ methodology match those typical of
Surveys: interviews with 25 industry practitioners from 18 construction companies.
The complete analysis table for the Risk Management category is presented as Table 4-12. The
rows shaded in gray indicate articles whose authors didn’t apply rigorous validation methodologies.
Table 4-11 Code Name Index for the Risk Management Category
# Year Article Title Code
Name
1 2011 Risk Management of Long Term Infrastructure Projects “PPP-BOT Projects” by
Using Uncertainty, Probabilistic and Stochastic Methods and Models RM-1
2 2011 National-Level Infrastructure Risk Evaluation Framework and Best Practices RM-2
3 2011 Probabilistic Performance Risk Evaluation of Infrastructure Projects RM-3
4 2011 Ontology for Relating Risk and Vulnerability to Cost Overrun in International
Projects RM-4
5 2011 Risk Assessment Methodology for a Deep Foundation Pit Construction Project in
Shanghai, China RM-5
6 2011 Identification of Risk Paths in International Construction Projects Using
Structural Equation Modeling RM-6

63
# Year Article Title Code
Name
7 2011 Risk Allocation in the Operational Stage of Private Finance Initiative Projects RM-7
8 2011 Construction Risk Assessment Using Site Influence Factors RM-8
9 2011 Development of a Methodology for Understanding the Potency of Risk
Connectivity RM-9
10 2011 Risk Planning and Management for the Panama Canal Expansion Program RM-10
11 2011 Empirical Study of Risk Assessment and Allocation of Public-Private Partnership
Projects in China RM-11
12 2011 Risk and Price in the Bidding Process of Contractors RM-12
13 2011 Relational Risk Management in Construction Projects: Modeling the Complexity RM-13
14 2011 Risks, Contracts, and Private-Sector Participation in Infrastructure RM-14
15 2011 Bootstrap Technique for Risk Analysis with Interval Numbers in Bridge
Construction Projects RM-15
16 2010 Understanding and Improving Your Risk Management Capability: Assessment
Model for Construction Organizations RM-16
17 2010 Evaluation of Risk Factors Leading to Cost Overrun in Delivery of Highway
Construction Projects RM-17
18 2010 Risk assessment of construction projects RM-18
19 2010 Population and Initial Validation of a Formal Model for Construction Safety Risk
Management RM-19
20 2010 Political, Economic, and Legal Risks Faced in International Projects: Case Study
of Vietnam RM-20
21 2010 Empirical Study of the Risks and Difficulties in Implementing Guaranteed
Maximum Price and Target Cost Contracts in Construction RM-21
22 2009 Managing Construction Projects Using the Advanced Programmatic Risk
Analysis and Management Model RM-22
23 2009 Managing Construction Projects Using the Advanced Programmatic Risk
Analysis and Management Model RM-23
24 2009 Contractors’ Claims Insurance: A Risk Retention Approach RM-24
25 2008 Construction Project Risk Assessment Using Existing Database and Project-
Specific Information RM-25
26 2008 Construction Project Network Evaluation with Correlated Schedule Risk Analysis
Model RM-26
27 2008 Methodology for Integrated Risk Management and Proactive Scheduling of
Construction Projects RM-27
28 2008 Risk and Resilience to Enhance Sustainability with Application to Urban Water
Systems RM-28
29 2003 Evaluating Risk in Construction–Schedule Model (ERIC–S): Construction
Schedule Risk Model RM-29
Table 4-11 Code Name Index for the Risk Management Category (Continued)

64
Table 4-12 Analysis Table for the Risk Management Category
# Year Code
Name
Validation Methodologies (If applied, enter a 1; otherwise, leave blank.)
Experimental
Studies
Observational
Studies
Empirical
Studies
Case
Studies Surveys
Functional
Demonstration
Archival
Data
Analysis
Others
1 2011 RM-1 1
2 2011 RM-2
1
3 2011 RM-3 1
4 2011 RM-4 1
5 2011 RM-5 1
6 2011 RM-6
7 2011 RM-7
8 2011 RM-8
1
9 2011 RM-9 1
10 2011 RM-10 1
11 2011 RM-11
12 2011 RM-12
13 2011 RM-13
14 2011 RM-14
15 2011 RM-15 1
16 2010 RM-16 1 1 1
17 2010 RM-17
18 2010 RM-18 1
19 2010 RM-19
20 2010 RM-20
21 2010 RM-21 1

65
# Year Code
Name
Validation Methodologies (If applied, enter a 1; otherwise, leave blank.)
Experimental
Studies
Observational
Studies
Empirical
Studies
Case
Studies Surveys
Functional
Demonstration
Archival
Data
Analysis
Others
23 2009 RM-23 1
24 2009 RM-24 1
25 2008 RM-25 1
26 2008 RM-26 1
27 2008 RM-27 1
28 2008 RM-28
29 2003 RM-29
Table 4-12 Analysis Table for the Risk Management Category (Continued)
66
4.2.7 Contract and Project Delivery Analysis Table
4.2.7.1 Introduction
For the Contract and Project Delivery category, 40 papers were examined, with publication dates
ranging from 2005 to 2012. This category includes topics such as methods of contract and project
delivery; the relationship between costs and duration, and contract and project delivery; and
comparisons of methods of contract and project delivery.
4.2.7.2 Analysis Process
According to Table 3-1, the abbreviation for this category is CP, so all of the code names in this
category start with CP. The code name index for this category is presented in Table 4-13.
To illustrate the analysis process for this category, article CP-13 was chosen as an example. The
authors adopted the evaluation metrics defined in a few recent studies in order to show the extent to
which project sustainability goals are affected by the relationships among and the influence of project
delivery attributes, such as owner commitment, team integration, and contractual relationships. They
concluded that the attributes that are crucial for the delivery process are strong owner commitment to
sustainability, integration in the delivery process through the early involvement of the contractor, and
the early inclusion of green strategies. In this paper, the “Methods” section was considered to be the
explanation of the validation. To validate the data, three main participants from each case study
selected (research methodology) were invited to complete e-mail and telephone surveys. Based on
Table 3-3, the characteristics of the methodology match the features of Surveys: 1) sampling and 2)
use of e-mail and the telephone for the surveys.
The complete analysis table for the Contract and Project Delivery category is presented as Table 4-
14. The rows shades in grey indicate articles whose authors didn’t apply rigorous validation
methodologies.

67
Table 4-13 Code Name Index for the Contract and Project Delivery Category
# Year Article Title Code
Name
1 2012 Off‐Site Construction of Apartment Buildings: A Case Study CP-1
2 2012 Performance Comparison of Large Design-Build and Design-Bid-Build Highway
Projects CP-2
3 2011 Integrated Project Delivery Method for Trenchless Projects CP-3
4 2011 Alternative Project Delivery Methods for Water and Wastewater Projects: Do
They Save Time and Money? CP-4
5 2011 Integrating Risk Management Within the Project Delivery Process at Caltrans: A
Transportation Project Case Study CP-5
6 2011 A Dream of Ideal Project Delivery System CP-6
7 2011 Global Project Delivery Systems Using BIM CP-7
8 2011 Selection Model for Delivery Methods for Multifamily-Housing Construction
Projects CP-8
9 2011 Project Delivery Metrics for Sustainable High-Performance Buildings CP-9
10 2011 Fuzzy Preference Relations Consensus Approach to Reduce Conflicts on Shared
Responsibilities in the Owner Managing Contractor Delivery System CP-10
11 2011 New Operating System for Project Management: Consequences and
Opportunities CP-11
12 2011 Selection of Project Delivery Method in Transit: Drivers and Objectives CP-12
13 2011 Project Delivery Metrics for Sustainable, High-Performance Buildings CP-13
14 2010 Integrated Project Delivery Case Study: Guidelines for Drafting Partnering
Contract CP-14
15 2010 Integrated Project Delivery: Next-Generation BIM for Structural Engineering CP-15
16 2010 A Critical Analysis of Innovations in Construction Manager-at-Risk Project
Delivery CP-16
17 2010 Exploring the Validity of Qualitative Methods to Analyze Project Delivery of
Sustainable, High Performance Buildings CP-17
18 2010 A Unified Process Approach to Healthcare Project Delivery: Synergies Between
Greening Strategies, Lean Principles and BIM CP-18
19 2010 Governance Challenges of Infrastructure Delivery: The Case for Socio-
Economic Governance Approaches CP-19
20 2010 Guidelines for a Standard Project Partnering Contract CP-20
21 2010 Integration of Container Terminal Design and Construction with Operations to
Reduce the Project Delivery Cost and Shorten the Schedule CP-21
22 2010 Evaluation of Risk Factors Leading to Cost Overrun in Delivery of Highway
Construction Projects CP-22
23 2010 Statistical Analysis on the Cost and Duration of Building Projects CP-23
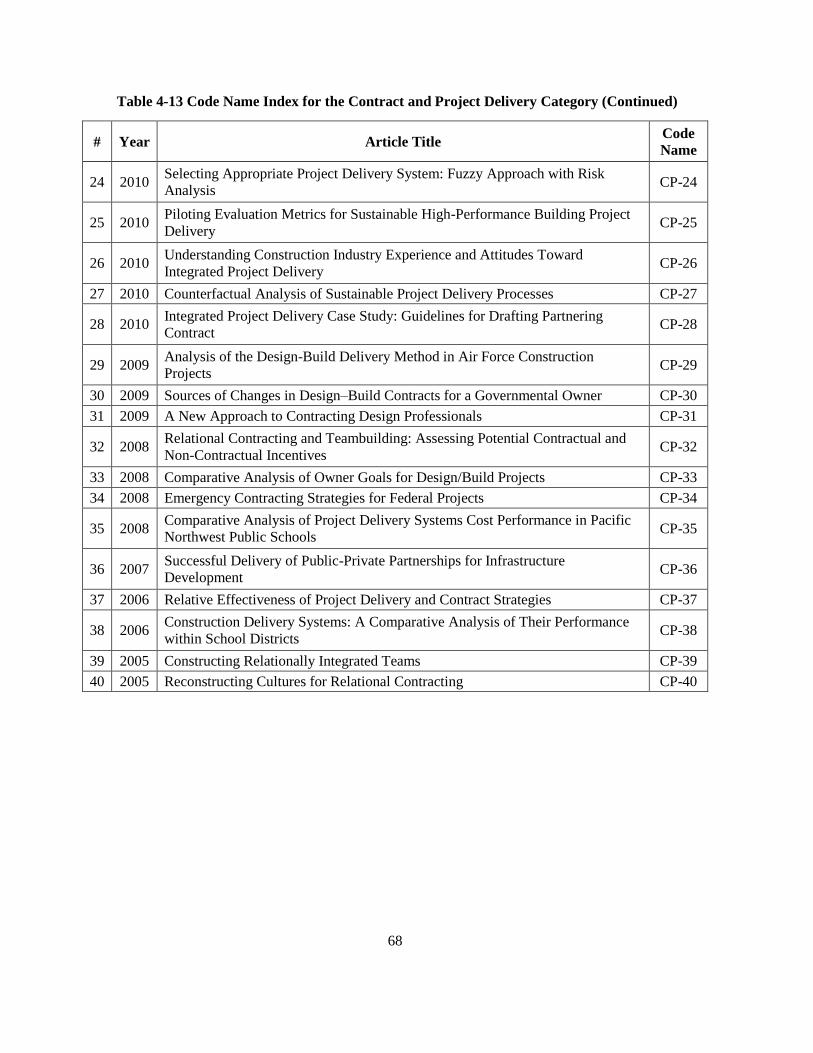
68
# Year Article Title Code
Name
24 2010 Selecting Appropriate Project Delivery System: Fuzzy Approach with Risk
Analysis CP-24
25 2010 Piloting Evaluation Metrics for Sustainable High-Performance Building Project
Delivery CP-25
26 2010 Understanding Construction Industry Experience and Attitudes Toward
Integrated Project Delivery CP-26
27 2010 Counterfactual Analysis of Sustainable Project Delivery Processes CP-27
28 2010 Integrated Project Delivery Case Study: Guidelines for Drafting Partnering
Contract CP-28
29 2009 Analysis of the Design-Build Delivery Method in Air Force Construction
Projects CP-29
30 2009 Sources of Changes in Design–Build Contracts for a Governmental Owner CP-30
31 2009 A New Approach to Contracting Design Professionals CP-31
32 2008 Relational Contracting and Teambuilding: Assessing Potential Contractual and
Non-Contractual Incentives CP-32
33 2008 Comparative Analysis of Owner Goals for Design/Build Projects CP-33
34 2008 Emergency Contracting Strategies for Federal Projects CP-34
35 2008 Comparative Analysis of Project Delivery Systems Cost Performance in Pacific
Northwest Public Schools CP-35
36 2007 Successful Delivery of Public-Private Partnerships for Infrastructure
Development CP-36
37 2006 Relative Effectiveness of Project Delivery and Contract Strategies CP-37
38 2006 Construction Delivery Systems: A Comparative Analysis of Their Performance
within School Districts CP-38
39 2005 Constructing Relationally Integrated Teams CP-39
40 2005 Reconstructing Cultures for Relational Contracting CP-40
Table 4-13 Code Name Index for the Contract and Project Delivery Category (Continued)

69
Table 4-14 Analysis Table for the Contract and Project Delivery Category
# Year Code
Name
Validation Methodologies (If applied, enter a 1; otherwise, leave blank.)
Experimental
Studies
Observational
Studies
Empirical
Studies
Case
Studies Surveys
Functional
Demonstration
Archival
Data
Analysis
Others
1 2012 CP-1 1 1
2 2012 CP-2
3 2011 CP-3
4 2011 CP-4
5 2011 CP-5
6 2011 CP-6
1
7 2011 CP-7
8 2011 CP-8
1
9 2011 CP-9 1
10 2011 CP-10 1
11 2011 CP-11
12 2011 CP-12 1
13 2011 CP-13 1
14 2010 CP-14
15 2010 CP-15
16 2010 CP-16 1
17 2010 CP-17 1 1
18 2010 CP-18
1
19 2010 CP-19
20 2010 CP-20
21 2010 CP-21

70
# Year Code
Name
Validation Methodologies (If applied, enter a 1; otherwise, leave blank.)
Experimental
Studies
Observational
Studies
Empirical
Studies
Case
Studies Surveys
Functional
Demonstration
Archival
Data
Analysis
Others
23 2010 CP-23 1
24 2010 CP-24
1
25 2010 CP-25 1
26 2010 CP-26
27 2010 CP-27 1
28 2010 CP-28
29 2009 CP-29 1
30 2009 CP-30 1
31 2009 CP-31
32 2008 CP-32
33 2008 CP-33 1
34 2008 CP-34
35 2008 CP-35 1
36 2007 CP-36 1
37 2006 CP-37 1
38 2006 CP-38 1 1
39 2005 CP-39 1 1
40 2005 CP-40 1
Table 4-14 Analysis Table for the Contract and Project Delivery Category (Continued)

71
4.2.8 Craft Training Analysis Table
4.2.8.1 Introduction
For the Craft Training category, 17 papers were examined; the publication dates range from 1987 to
2012. Topics in this category include such areas as the impact of craft training on construction
projects, how to implement effective craft training, and the need of for craft training.
4.2.8.2 Analysis Process
Since the abbreviation for this category is CT, based on Table 3-1, the code names for this category
all start with CT. The code name index for this category is presented in Table 4-15.
Article CT-8 was chosen as an example to illustrate the process for this category. The study was
focused on addressing the issues related to training and allocating a construction project workforce.
The authors developed a linear program model, called the Optimal Workforce Investment Model, as a
means of providing an optimization-based framework. This model helps the managers of construction
projects determine the most efficient method of matching the supply of and demand for labour
through training, recruitment, and allocation. In this paper, the section entitled “Evaluation of Five
Case Studies” was considered to be the explanation of the validation of the linear program model. To
validate the model, the input data related to training and hiring costs were collected from the
academic literature and from industry data. Five different cases were analyzed. The final output
reflected the real-world scenarios. Based on Table 3-3, the characteristics of the methodology applied
match the features typical of Case Studies and Functional Demonstration. The matching feature
typical of Case Studies is the intensive analysis of particular matters. The features that match those of
Functional Demonstration include 1) reliance on input and output data and 2) validation for a linear
program model.
The complete analysis table for the Craft Training category is presented as Table 4-16. The rows
shaded in grey indicate articles whose authors didn’t apply rigorous validation methodologies.
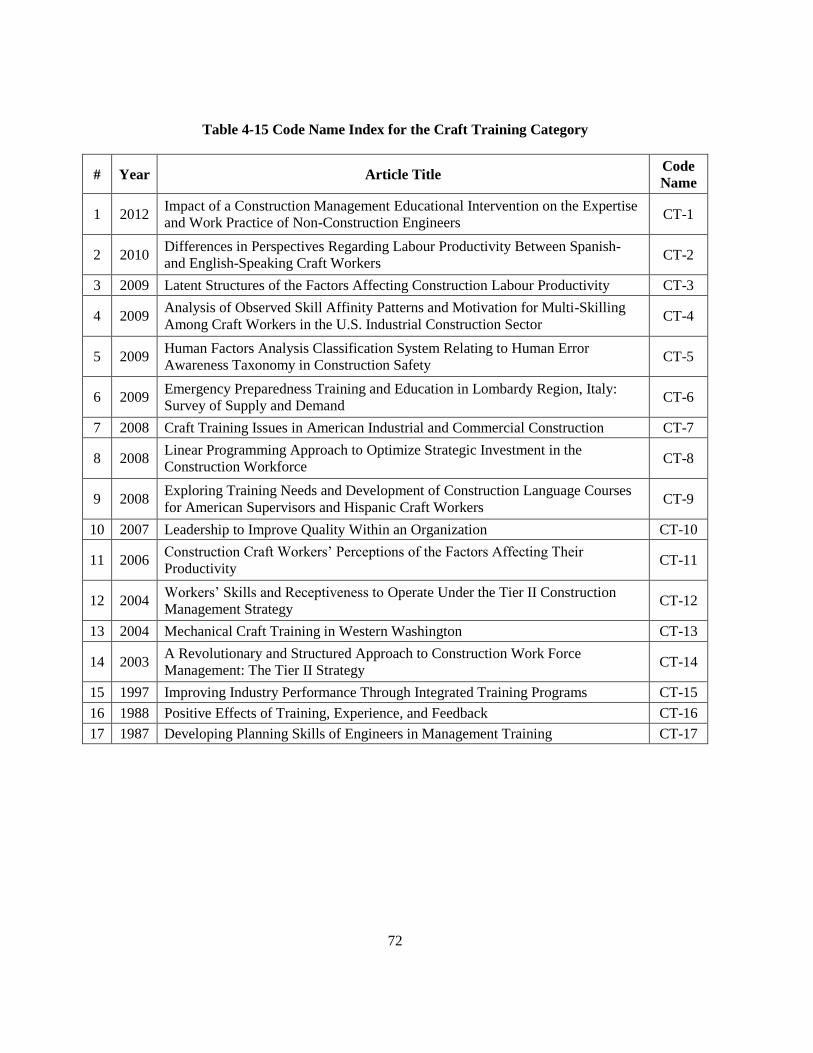
72
Table 4-15 Code Name Index for the Craft Training Category
# Year Article Title Code
Name
1 2012 Impact of a Construction Management Educational Intervention on the Expertise
and Work Practice of Non-Construction Engineers CT-1
2 2010 Differences in Perspectives Regarding Labour Productivity Between Spanish-
and English-Speaking Craft Workers CT-2
3 2009 Latent Structures of the Factors Affecting Construction Labour Productivity CT-3
4 2009 Analysis of Observed Skill Affinity Patterns and Motivation for Multi-Skilling
Among Craft Workers in the U.S. Industrial Construction Sector CT-4
5 2009 Human Factors Analysis Classification System Relating to Human Error
Awareness Taxonomy in Construction Safety CT-5
6 2009 Emergency Preparedness Training and Education in Lombardy Region, Italy:
Survey of Supply and Demand CT-6
7 2008 Craft Training Issues in American Industrial and Commercial Construction CT-7
8 2008 Linear Programming Approach to Optimize Strategic Investment in the
Construction Workforce CT-8
9 2008 Exploring Training Needs and Development of Construction Language Courses
for American Supervisors and Hispanic Craft Workers CT-9
10 2007 Leadership to Improve Quality Within an Organization CT-10
11 2006 Construction Craft Workers’ Perceptions of the Factors Affecting Their
Productivity CT-11
12 2004 Workers’ Skills and Receptiveness to Operate Under the Tier II Construction
Management Strategy CT-12
13 2004 Mechanical Craft Training in Western Washington CT-13
14 2003 A Revolutionary and Structured Approach to Construction Work Force
Management: The Tier II Strategy CT-14
15 1997 Improving Industry Performance Through Integrated Training Programs CT-15
16 1988 Positive Effects of Training, Experience, and Feedback CT-16
17 1987 Developing Planning Skills of Engineers in Management Training CT-17
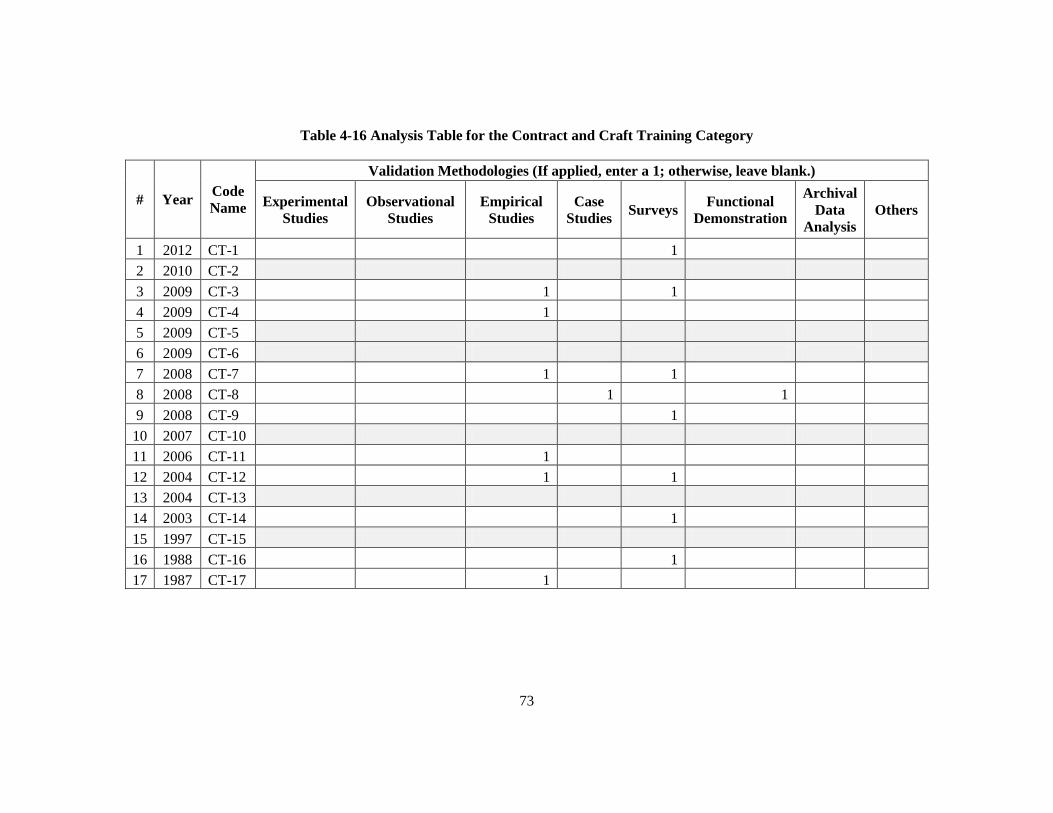
73
Table 4-16 Analysis Table for the Contract and Craft Training Category
# Year Code
Name
Validation Methodologies (If applied, enter a 1; otherwise, leave blank.)
Experimental
Studies
Observational
Studies
Empirical
Studies
Case
Studies Surveys
Functional
Demonstration
Archival
Data
Analysis
Others
1 2012 CT-1 1
2 2010 CT-2
3 2009 CT-3 1 1
4 2009 CT-4 1
5 2009 CT-5
6 2009 CT-6
7 2008 CT-7 1 1
8 2008 CT-8 1 1
9 2008 CT-9 1
10 2007 CT-10
11 2006 CT-11 1
12 2004 CT-12 1 1
13 2004 CT-13
14 2003 CT-14 1
15 1997 CT-15
16 1988 CT-16 1
17 1987 CT-17 1

74
4.2.9 Site Layout Analysis Table
4.2.9.1 Introduction
For the Site Layout category, 37 papers were examined, with publication dates ranging from 1988 to
2012. This category includes topics such as the optimization of site layout planning and models of site
layouts. The authors of most papers validated that efficient site layout planning and models helps save
the project cost and material travelling time.
4.2.9.2 Analysis Process
Since Table 3-1 lists SL as the abbreviation for this category, all of the code names for this category
start with SL. The code name index for this category is presented in Table 4-17.
Article SL-6 illustrates the analysis process for this category. The authors developed an
optimization model for solving the site layout planning problem from the perspectives of safety and
environmental issues. They chose a generic algorithm as the basis of the optimization. To test the
validity of the model, the authors applied it to a real-life construction project in the section of “Case
Study”. They input the parameters of the project and tested the model. The results obtained showed
that satisfactory solutions were produced. Based on Table 3-3, the characteristics of the methodology
match the features of Functional Demonstration:1) reliance on input and output data and 2) validation
for an optimization model.
The complete analysis table for the Site Layout category is presented as Table 4-18. The rows
shaded in grey indicate articles whose authors didn’t apply rigorous validation methodologies.
Table 4-17 Code Name Index for the Site Layout Category
# Year Article Title Code
Name
1 2011 Floor-Level Construction Material Layout Planning Model Considering Actual
Travel Path SL-1
2 2010 Optimizing Material Procurement and Storage on Construction Sites SL-2
3 2010 Optimizing Material Logistics Planning in Construction Projects SL-3
4 2009 Conjoining MMAS to GA to Solve Construction Site Layout Planning Problem SL-4
5 2009 Global Optimization of Dynamic Site Layout Planning in Construction Projects SL-5
6 2008 Optimal Construction Site Layout Considering Safety and Environmental
Aspects SL-6
7 2008 Dynamic Site Layout Planning Using Approximate Dynamic Programming SL-7
8 2008 New Mathematical Optimization Model for Construction Site Layout SL-8

75
# Year Article Title Code
Name
9 2008 Particle Swarm Optimization for Construction Site Unequal-Area Layout SL-9
10 2007 Generic Process Mapping and Simulation Methodology for Integrating Site
Layout and Operations Planning in Construction SL-10
11 2006 Optimizing Airport Construction Site Layouts to Minimize Wildlife Hazards SL-11
12 2005 Computer-Aided Site Layout Planning SL-12
13 2005 Trade-off Between Safety and Cost in Planning Construction Site Layouts SL-13
14 2005 Layout Planning of Construction Sites Considering Multiple Objectives: A Goal-
Programming Approach SL-14
15 2004 An Evolutionary Algorithm for Solving the Geometrically Constrained Site
Layout Problem SL-15
16 2004 Designing a Decision Support System for Military Base Camp Site Selection and
Facility Layout SL-16
17 2003 Four-Dimensional Visualization of Construction Scheduling and Site Utilization SL-17
18 2003 Dynamic Layout of Construction Temporary Facilities Considering Safety SL-18
19 2002 Genetic Algorithms for Construction Site Layout in Project Planning SL-19
20 2002 Site Layout Planning using Nonstructural Fuzzy Decision Support System SL-20
21 2002 Genetic Algorithm for Solving Site Layout Problem with Unequal-Size and
Constrained Facilities SL-21
22 2001 GIS-Based Cost Estimates Integrating with Material Layout Planning SL-22
23 2001 Genetic Algorithm for Optimizing Supply Locations Around Tower Crane SL-23
24 2001 Improvement Algorithm for Limited Space Scheduling SL-24
25 2000 A New 4D Management Approach to Construction Planning and Site Space
Utilization SL-25
26 1999 EvoSite: Evolution-Based Model for Site Layout Planning SL-26
27 1998 Dynamic Layout Planning Using a Hybrid Incremental Solution Method SL-27
28 1998 Site-Level Facilities Layout Using Genetic Algorithms SL-28
29 1997 Space Planning Method for Multistory Building Construction SL-29
30 1996 ArcSite: Enhanced GIS for Construction Site Layout SL-30
31 1995 Construction-Site Layout Using Annealed Neural Network SL-31
32 1994 Construction Site Applications of CAD SL-32
33 1993 Interactive Dynamic Layout Planning SL-33
34 1992 Site‐Layout Modeling: How Can Artificial Intelligence Help? SL-34
35 1992 SightPlan Model for Site Layout SL-35
36 1991 SightPlan Experiments: Alternate Strategies for Site Layout Design SL-36
37 1988 Site Design for Resource Recovery Facilities SL-37
Table 4-17 Code Name Index for the Site Layout Category (Continued)

76
Table 4-18 Analysis Table for the Site Layout Category
# Year Code
Name
Validation Methodologies (If applied, enter a 1; otherwise, leave blank.)
Experimental
Studies
Observational
Studies
Empirical
Studies
Case
Studies Surveys
Functional
Demonstration
Archival
Data
Analysis
Others
1 2011 SL-1 1
2 2010 SL-2 1
3 2010 SL-3 1
4 2009 SL-4 1
5 2009 SL-5 1
6 2008 SL-6 1
7 2008 SL-7 1
8 2008 SL-8 1
9 2008 SL-9 1
10 2007 SL-10 1
11 2006 SL-11 1
12 2005 SL-12 1
13 2005 SL-13 1
14 2005 SL-14 1
15 2004 SL-15 1
16 2004 SL-16
17 2004 SL-17
18 2003 SL-18
19 2003 SL-19 1
20 2002 SL-20 1
21 2002 SL-21 1
22 2002 SL-22 1

77
# Year Code
Name
Validation Methodologies (If applied, enter a 1; otherwise, leave blank.)
Experimental
Studies
Observational
Studies
Empirical
Studies
Case
Studies Surveys
Functional
Demonstration
Archival
Data
Analysis
Others
23 2001 SL-23 1
24 2001 SL-24 1
25 2001 SL-25 1
26 1999 SL-26 1
27 1998 SL-27 1
28 1998 SL-28 1
29 1997 SL-29 1
30 1996 SL-30 1
31 1995 SL-31 1
32 1994 SL-32
33 1993 SL-33 1
34 1992 SL-34
35 1992 SL-35 1
36 1991 SL-36 1
37 1988 SL-37
Table 4-18 Analysis Table for the Site Layout Category (Continued)

78
4.2.10 Short-Term Scheduling Analysis Table
4.2.10.1 Introduction
In the Short-Term Scheduling category, only three papers were examined because not many CEM
papers are related to this topic. However, researchers in the area of water and wastewater
management have published a number of papers related to this topic. The three papers were published
in 1994, 2011, and 2012. The articles were focused on how to conduct short-term scheduling.
4.2.10.2 Analysis Process
Since the abbreviation for this category is SS, as listed in Table 3-1, the code names for this category
all start with SS. The code name index for this category is presented in Table 4-19.
Article SS-1 was chosen as an example to illustrate the analysis for this category. The authors
proposed an approach for optimizing the short-interval scheduling of a project for constructing large-
scale cascaded hydropower systems with multi-vibration zones of high head. The scheduling was
designed to be based on an optimization framework that combined a progressive optimality algorithm
with a vibration zone avoidance strategy. The authors applied this methodology to a real construction
project in order to test its validity. To validate the approach, the framework developed was applied for
several cascaded hydropower systems, and the results demonstrated its validity in the section of “Case
Study”. Based on the list in Table 3-3, the characteristics of the methodology match the features of
Functional Demonstration; 1) reliance on input and output data and 2) validation of an algorithm.
The complete analysis table for the Short-Term Scheduling category is presented as Table 4-20.
The rows shaded in grey represent articles whose authors didn’t apply rigorous validation
methodologies.
Table 4-19 Code Name Index for the Short-Term Scheduling Category
# Year Article Title Code
Name
1 2012 Short-Term Scheduling for Large-Scale Cascaded Hydropower Systems with
Multi-Vibration Zones of High Head SS-1
2 2011 Automated Generation of Construction Plans from Primitive Geometries SS-2
3 1994 Portfolio Approach to Strategic Management of A/E Firms SS-3

79
Table 4-20 Analysis Table for the Short-Term Scheduling Category
# Year Code
Name
Validation Methodologies (If applied, enter a 1; otherwise, leave blank.)
Experimental
Studies
Observational
Studies
Empirical
Studies
Case
Studies Surveys
Functional
Demonstration
Archival
Data
Analysis
Others
1 2012 SS-1 1
2 2011 SS-2 1
3 1994 SS-3
1
80
4.2.11 Factors Analysis Table
4.2.11.1 Introduction
For the Factors category, 40 papers were examined. The publication dates range from 1980 to 2013.
This category includes topics such as how weather can adversely affect productivity, investigations of
the loss of productivity due to accelerations, and how to apply equipment management practices.
Typically, the authors of most papers validated impacts of factors on productivity.
4.2.11.2 Analysis Process
Since Table 3-1 specifies FC as the abbreviation for this category, the code names for this category all
start with FC. The code name index for this category is presented in Table 4-21.
To illustrate the analysis process for this category, article FC-21 can be used as an example. The
authors investigated the impact of overmanning on labour productivity for labour-intensive trades
such as mechanical and sheet metal. They conducted a survey and performed a statistical analysis in
order to determine a quantitative relationship between overmanning and labour productivity. They
validated the results through cross-validation and a demonstration of the application of the proposed
model. In this paper, the sections entitled “Validation” and “Case Study” were considered to be the
descriptions of the validation. To validate the model, the authors applied cross-validation, which is a
method of assessing how statistical analysis results can be generalized for an independent data set. In
the case study, the authors applied the model to a real project and demonstrated its applicability.
Based on the list in Table 3-3, the characteristics of the methodologies match the features of
Empirical Studies and Functional Demonstration. The features that match Empirical Studies include
1) development of a model and hypothesis and 2) statistical analysis (cross-validation). The features
that match Functional Demonstration include 1) reliance on input and output data and 2) validation
for a model.
The complete analysis table of the Factors category is presented as Table 4-22. The rows shaded in
grey represent articles whose authors didn’t apply rigorous validation methodologies.
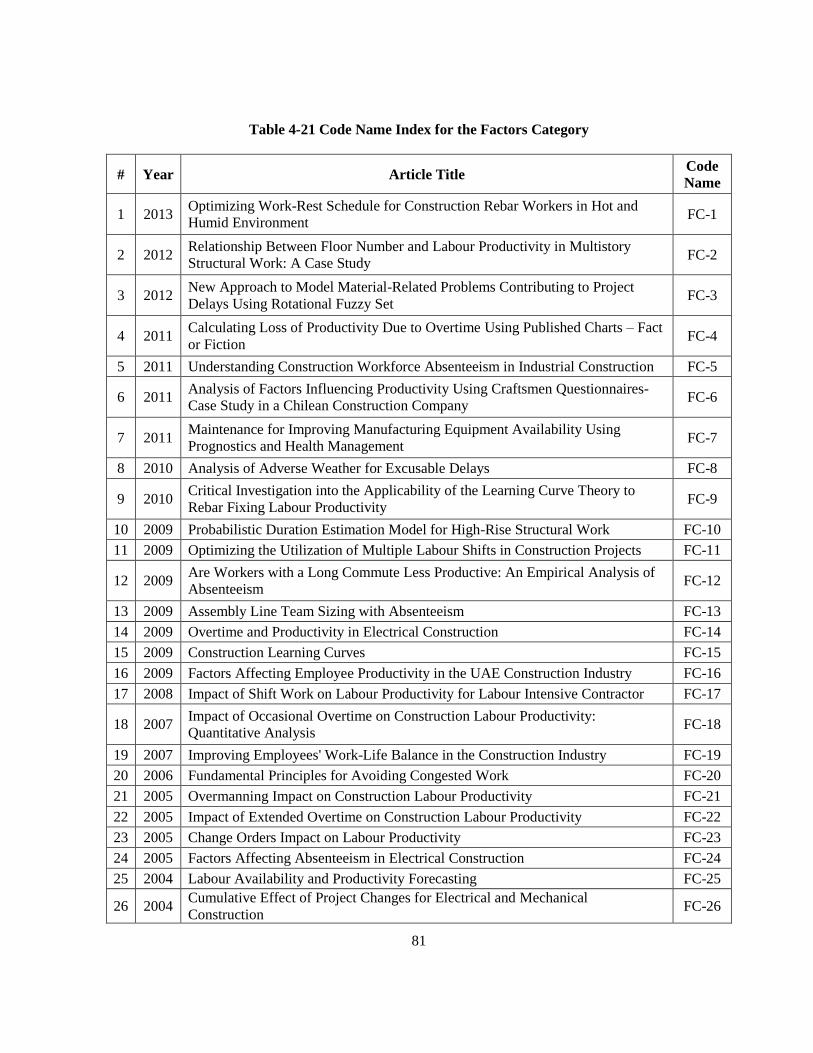
81
Table 4-21 Code Name Index for the Factors Category
# Year Article Title Code
Name
1 2013 Optimizing Work-Rest Schedule for Construction Rebar Workers in Hot and
Humid Environment FC-1
2 2012 Relationship Between Floor Number and Labour Productivity in Multistory
Structural Work: A Case Study FC-2
3 2012 New Approach to Model Material-Related Problems Contributing to Project
Delays Using Rotational Fuzzy Set FC-3
4 2011 Calculating Loss of Productivity Due to Overtime Using Published Charts – Fact
or Fiction FC-4
5 2011 Understanding Construction Workforce Absenteeism in Industrial Construction FC-5
6 2011 Analysis of Factors Influencing Productivity Using Craftsmen Questionnaires-
Case Study in a Chilean Construction Company FC-6
7 2011 Maintenance for Improving Manufacturing Equipment Availability Using
Prognostics and Health Management FC-7
8 2010 Analysis of Adverse Weather for Excusable Delays FC-8
9 2010 Critical Investigation into the Applicability of the Learning Curve Theory to
Rebar Fixing Labour Productivity FC-9
10 2009 Probabilistic Duration Estimation Model for High-Rise Structural Work FC-10
11 2009 Optimizing the Utilization of Multiple Labour Shifts in Construction Projects FC-11
12 2009 Are Workers with a Long Commute Less Productive: An Empirical Analysis of
Absenteeism FC-12
13 2009 Assembly Line Team Sizing with Absenteeism FC-13
14 2009 Overtime and Productivity in Electrical Construction FC-14
15 2009 Construction Learning Curves FC-15
16 2009 Factors Affecting Employee Productivity in the UAE Construction Industry FC-16
17 2008 Impact of Shift Work on Labour Productivity for Labour Intensive Contractor FC-17
18 2007 Impact of Occasional Overtime on Construction Labour Productivity:
Quantitative Analysis FC-18
19 2007 Improving Employees' Work-Life Balance in the Construction Industry FC-19
20 2006 Fundamental Principles for Avoiding Congested Work FC-20
21 2005 Overmanning Impact on Construction Labour Productivity FC-21
22 2005 Impact of Extended Overtime on Construction Labour Productivity FC-22
23 2005 Change Orders Impact on Labour Productivity FC-23
24 2005 Factors Affecting Absenteeism in Electrical Construction FC-24
25 2004 Labour Availability and Productivity Forecasting FC-25
26 2004 Cumulative Effect of Project Changes for Electrical and Mechanical
Construction FC-26
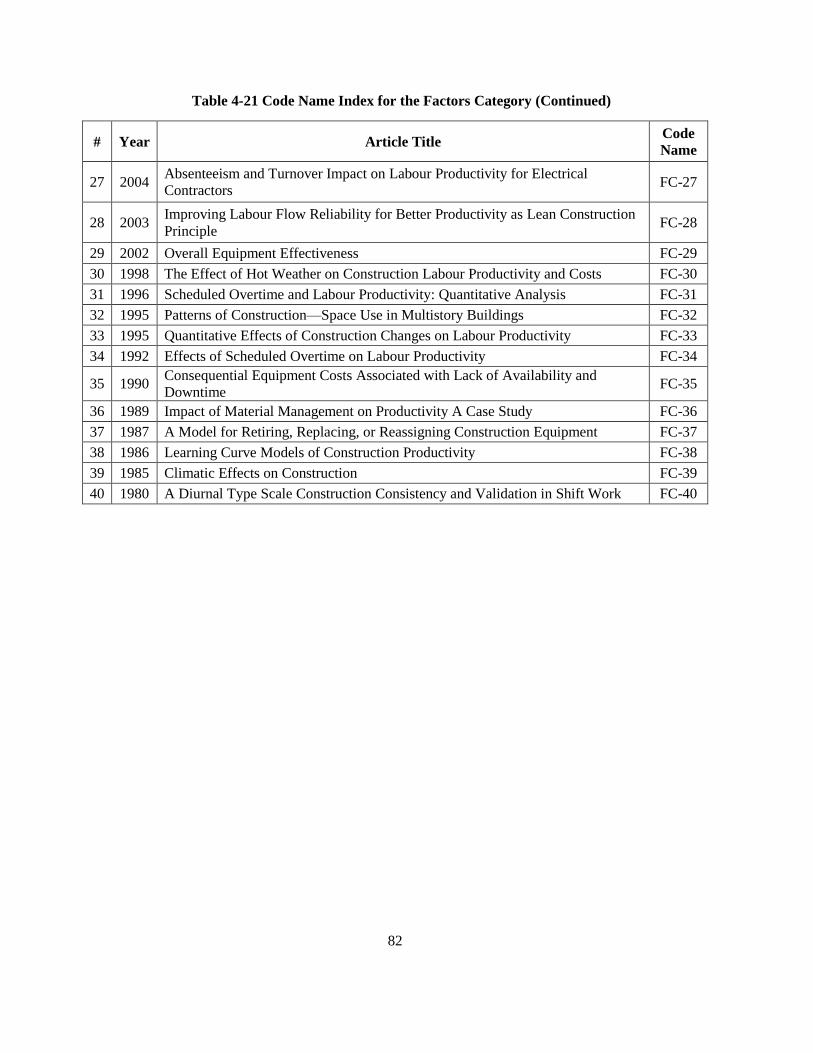
82
# Year Article Title Code
Name
27 2004 Absenteeism and Turnover Impact on Labour Productivity for Electrical
Contractors FC-27
28 2003 Improving Labour Flow Reliability for Better Productivity as Lean Construction
Principle FC-28
29 2002 Overall Equipment Effectiveness FC-29
30 1998 The Effect of Hot Weather on Construction Labour Productivity and Costs FC-30
31 1996 Scheduled Overtime and Labour Productivity: Quantitative Analysis FC-31
32 1995 Patterns of Construction—Space Use in Multistory Buildings FC-32
33 1995 Quantitative Effects of Construction Changes on Labour Productivity FC-33
34 1992 Effects of Scheduled Overtime on Labour Productivity FC-34
35 1990 Consequential Equipment Costs Associated with Lack of Availability and
Downtime FC-35
36 1989 Impact of Material Management on Productivity A Case Study FC-36
37 1987 A Model for Retiring, Replacing, or Reassigning Construction Equipment FC-37
38 1986 Learning Curve Models of Construction Productivity FC-38
39 1985 Climatic Effects on Construction FC-39
40 1980 A Diurnal Type Scale Construction Consistency and Validation in Shift Work FC-40
Table 4-21 Code Name Index for the Factors Category (Continued)

83
Table 4-22 Analysis Table for the Factors Category
# Year Code
Name
Validation Methodologies (If applied, enter a 1; otherwise, leave blank.)
Experimental
Studies
Observational
Studies
Empirical
Studies
Case
Studies Surveys
Functional
Demonstration
Archival
Data
Analysis
Others
1 2013 FC-1 1
2 2012 FC-2
3 2012 FC-3 1
4 2011 FC-4
5 2011 FC-5 1
6 2011 FC-6 1
7 2011 FC-7
8 2010 FC-8
9 2010 FC-9
10 2009 FC-10 1
11 2009 FC-11 1
12 2009 FC-12
13 2009 FC-13
14 2009 FC-14
15 2009 FC-15
16 2009 FC-16 1
17 2008 FC-17 1 1
18 2007 FC-18 1
19 2007 FC-19 1 1
20 2006 FC-20
21 2005 FC-21 1 1
22 2005 FC-22 1

84
# Year Code
Name
Validation Methodologies (If applied, enter a 1; otherwise, leave blank.)
Experimental
Studies
Observational
Studies
Empirical
Studies
Case
Studies Surveys
Functional
Demonstration
Archival
Data
Analysis
Others
24 2005 FC-24
25 2004 FC-25
26 2004 FC-26 1 1
27 2004 FC-27
28 2003 FC-28 1
29 2002 FC-29
30 1998 FC-30
31 1996 FC-31 1
32 1995 FC-32 1
33 1995 FC-33
34 1992 FC-34 1
35 1990 FC-35
36 1989 FC-36 1
37 1987 FC-37
38 1986 FC-38 1
39 1985 FC-39 1
40 1980 FC-40 1 1
Table 4-22 Analysis Table for the Factors Category (Continued)
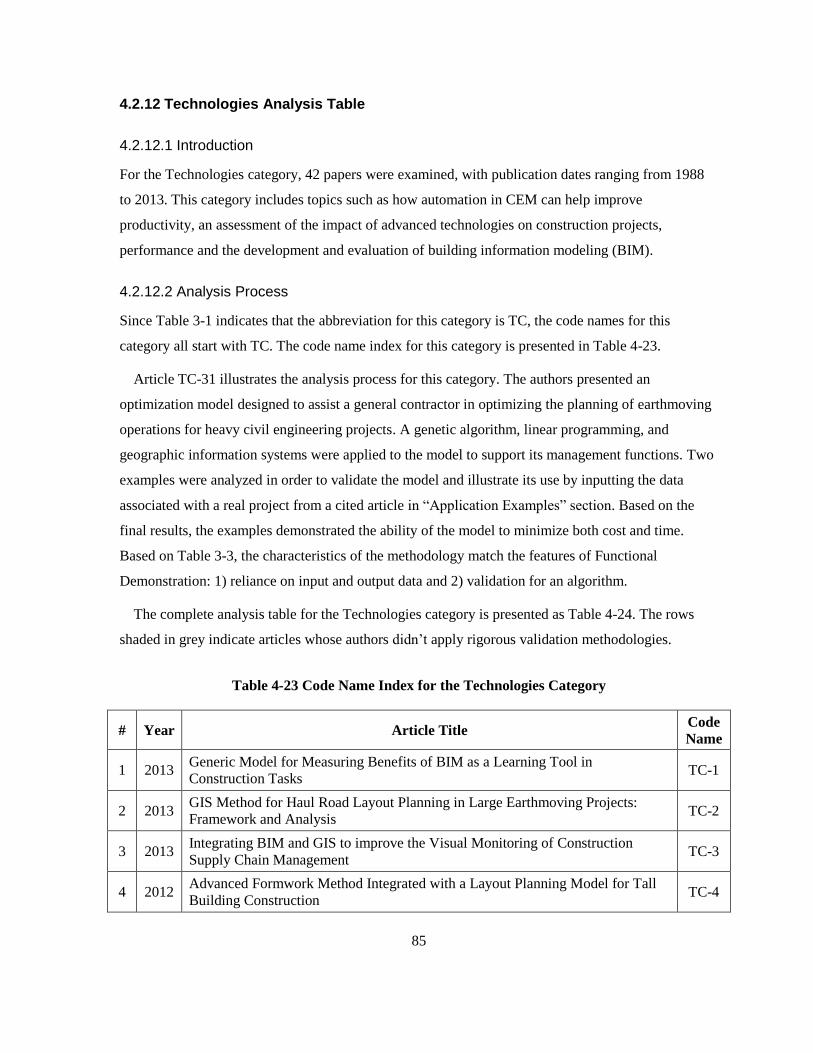
85
4.2.12 Technologies Analysis Table
4.2.12.1 Introduction
For the Technologies category, 42 papers were examined, with publication dates ranging from 1988
to 2013. This category includes topics such as how automation in CEM can help improve
productivity, an assessment of the impact of advanced technologies on construction projects,
performance and the development and evaluation of building information modeling (BIM).
4.2.12.2 Analysis Process
Since Table 3-1 indicates that the abbreviation for this category is TC, the code names for this
category all start with TC. The code name index for this category is presented in Table 4-23.
Article TC-31 illustrates the analysis process for this category. The authors presented an
optimization model designed to assist a general contractor in optimizing the planning of earthmoving
operations for heavy civil engineering projects. A genetic algorithm, linear programming, and
geographic information systems were applied to the model to support its management functions. Two
examples were analyzed in order to validate the model and illustrate its use by inputting the data
associated with a real project from a cited article in “Application Examples” section. Based on the
final results, the examples demonstrated the ability of the model to minimize both cost and time.
Based on Table 3-3, the characteristics of the methodology match the features of Functional
Demonstration: 1) reliance on input and output data and 2) validation for an algorithm.
The complete analysis table for the Technologies category is presented as Table 4-24. The rows
shaded in grey indicate articles whose authors didn’t apply rigorous validation methodologies.
Table 4-23 Code Name Index for the Technologies Category
# Year Article Title Code
Name
1 2013 Generic Model for Measuring Benefits of BIM as a Learning Tool in
Construction Tasks TC-1
2 2013 GIS Method for Haul Road Layout Planning in Large Earthmoving Projects:
Framework and Analysis TC-2
3 2013 Integrating BIM and GIS to improve the Visual Monitoring of Construction
Supply Chain Management TC-3
4 2012 Advanced Formwork Method Integrated with a Layout Planning Model for Tall
Building Construction TC-4

86
# Year Article Title Code
Name
5 2012 Aligning Building Information Model Tools and Construction Management
Methods TC-5
6 2012 Building Information Modeling–Based Analysis to Minimize Waste Rate of
Structural Reinforcement TC-6
7 2012 Construction Workspace Management- The Development and Application of a
Novel nD Planning Approach and Tool TC-7
8 2012 Development of an Optimum Pre-founded Column System for Top-Down
Construction TC-8
9 2012 Estimating Productivity of Earthmoving Operations Using Spatial Technologies1 TC-9
10 2012 Information Lifecycle Management with RFID for Material Control on
Construction Sites TC-10
11 2012 Information Retrieval from Civil Engineering Repositories: Importance of
Context and Granularity TC-11
12 2012 Integrated Building Information Model to Identify Possible Crane Instability
Caused by Strong Winds TC-12
13 2012 Mobile Information System for Sustainable Project Management TC-13
14 2012 Near Real-Time Motion Planning and Simulation of Cranes in Construction:
Framework and System Architecture TC-14
15 2012 Optimization of In Situ Construction of Concrete Decks: Flexure Tests of
Compact Splices of Reinforcement Between Phases TC-15
16 2012 Optimizing the Schedule of Dispatching Earthmoving Trucks Through Genetic
Algorithms and Simulation TC-16
17 2012 Research on the Modification Control Integrated Technology of Construction
Project TC-17
18 2011 A Distributed Multi-Model-Based Management Information System for
Simulation and Decision-Making on Construction Projects TC-18
19 2011 Assessing Impacts of Information Technology on Project Success Through
Knowledge Management Practice TC-19
20 2011 Evolution of the i-Booth© Onsite Information Management Kiosk TC-20
21 2011 Integrated Visualized Time Control System for Repetitive Construction Projects TC-21
22 2011 Integrating Automated Data Acquisition Technologies for Progress Reporting of
Construction Projects TC-22
23 2011
Technical Comparisons of Simulation-Based Productivity Prediction
Methodologies by Means of Estimation Tools Focusing on Conventional
Earthmovings
TC-23
24 2011 Vision-Based Crane Tracking for Understanding Construction Activity TC-24
25 2010 Interoperable Leveraging Building Information Modeling Technology in
Construction Engineering and Management Education TC-25
Table 4-23 Code Name Index for the Technologies Category (Continued)

87
# Year Article Title Code
Name
26 2010 Modularization Technology Development and Application for NPP in Korea TC-26
27 2010 Multi-Agent-Based Simulation System for Construction Operations with
Congested Flows TC-27
28 2009 3D‐GIS Based Earthwork Planning System for Productivity Improvement TC-28
29 2009 Evaluating Industry Perceptions of Building Information Modeling (BIM) Impact
on Construction TC-29
30 2009 Integrating Resource Production and Construction Using BIM TC-30
31 2009 Optimization of Earthmoving Operations in Heavy Civil Engineering Projects TC-31
32 2009 Relationship Between Automation and Integration of Construction Information
Systems and Labour Productivity TC-32
33 2008 Building Industrialization: Robotized Assembly of Modular Products TC-33
34 2008 Case Studies of BIM Adoption for Precast Concrete Design by Mid-sized
Structural Engineering Firms TC-34
35 2008 Construction Process Simulation and Safety Analysis Based on Building
Information Model and 4D Technology TC-35
36 2008 Multi-Objective Simulation-Optimization for Earthmoving Operations TC-36
37 2004 Long-Term Impact of Equipment Technology on Labour Productivity in the U.S.
Construction Industry at the Activity Level TC-37
38 2004 Time Saving Technology Succeeds for Fairfield Underpass TC-38
39 2002 Factors in Productivity and Unit Cost for Advanced Machine Guidance TC-39
40 1998 Automation of Existing Tower Cranes: Economic and Technological Feasibility TC-40
41 1993 Cranium-Device for Improving Crane Productivity and Safety TC-41
42 1988 Partially Automated Grading: Construction Process Innovation TC-42
Table 4-23 Code Name Index for the Technologies Category (Continued)

88
Table 4-24 Analysis Table for the Technologies Category
# Year Code
Name
Validation Methodologies (If applied, enter a 1; otherwise, leave blank.)
Experimental
Studies
Observational
Studies
Empirical
Studies
Case
Studies Surveys
Functional
Demonstration
Archival
Data
Analysis
Others
1 2013 TC-1 1
2 2013 TC-2 1
3 2013 TC-3 1
4 2012 TC-4 1
5 2012 TC-5
6 2012 TC-6 1
7 2012 TC-7 1
8 2012 TC-8 1
9 2012 TC-9 1
10 2012 TC-10 1
11 2012 TC-11 1
12 2012 TC-12 1
13 2012 TC-13
14 2012 TC-14 1
15 2012 TC-15 1
16 2012 TC-16 1
17 2012 TC-17
18 2011 TC-18 1
19 2011 TC-19 1
20 2011 TC-20
21 2011 TC-21 1
22 2011 TC-22

89
# Year Code
Name
Validation Methodologies (If applied, enter a 1; otherwise, leave blank.)
Experimental
Studies
Observational
Studies
Empirical
Studies
Case
Studies Surveys
Functional
Demonstration
Archival
Data
Analysis
Others
24 2011 TC-24 1
25 2010 TC-25
26 2010 TC-26 1
27 2010 TC-27 1
28 2009 TC-28 1
29 2009 TC-29
30 2009 TC-30 1
31 2009 TC-31 1
32 2009 TC-32 1 1
33 2008 TC-33 1
34 2008 TC-34
35 2008 TC-35
36 2008 TC-36 1
37 2004 TC-37 1 1
38 2004 TC-38
39 2002 TC-39
40 1998 TC-40 1
41 1993 TC-41 1
42 1988 TC-42
Table 4-24 Analysis Table for the Technologies Category (Continued)

90
Chapter 5
Analysis and Discussion of Results
5.1 Introduction
The data acquired from the examination of numerous articles related to construction engineering and
management (CEM) research are shown in Tables 4-1 to 4-24. This chapter presents the
comprehensive analysis of the data that was conducted in order to determine trends in the application
of validation methodologies in CEM studies. The analysis and discussion focused on three areas: 1)
the most popular validation methodologies employed in each source category, 2) the source
categories for which each specific validation methodology is most frequently used, 3) changes in the
application of validation methodologies over time and 4) the relationship between the degree of
validation and the number of citations. The methods by which the results of this analysis were
validated are also described.
5.2 Distribution of Validation Methodologies in Each Source Category
5.2.1 Summary of Distribution Results
The distribution of validation methodologies in each source category is shown in Table 5-1. The
percentage of the number of times each validation methodology was reported in a specific source
category was calculated as Equation 5-1.
(5.1)
where indicates the percentage of validation methodology in source category represents
the number of articles reporting validation methodology in source category , and indicates the
total number of articles in category . The detailed analysis and discussion of the results for each
category are presented in the following subsections.
5.2.2 Analysis and Discussion of Distribution Results
This subsection includes a number of figures that display the distribution results for each validation
methodology. The vertical axis indicates the percentage of the occurrence of each validation
methodology relative to the total number of papers in the corresponding source category, and the
horizontal axis identifies each validation methodology. For readability purposes, each methodology is
represented by a letter, as shown in Table 5-1: A = Experimental Studies, B = Observational Studies,

91
C = Empirical Studies, D = Case Studies, E = Surveys, F = Functional Demonstration, G = Archival
Data Analysis and H = Unclear Validation.

92
Table 5-1 Summary of Validation Methodology Distribution Results for Each Source Category
Validation Methodologies
Source
Category
Experimental
Studies (A)
Observational
studies (B)
Empirical
Studies (C)
Case
Studies
(D)
Surveys
(E)
Functional
Demonstration
(F)
Archival Data
Analysis (G)
Unclear
Validation
(H)
Others
CN 2.27 % 0.00 % 9.09 % 15.91 % 9.09 % 9.09 % 2.27 % 52.27 %
ZA 4.88 % 0.00 % 4.88 % 29.27 % 17.07 % 4.88 % 2.44 % 36.59 %
RL 3.70 % 0.00 % 3.70 % 0.00 % 0.00 % 74.07 % 0.00 % 18.52 %
AL 0.00 % 0.00 % 12.50% 8.33 % 16.67 % 12.50 % 4.17 % 45.83 %
KM 0.00 % 0.00 % 10.00 % 23.33 % 6.67 % 13.33 % 0.00 % 46.67 %
RM 0.00 % 0.00 % 3.23 % 0.00 % 6.45 % 54.84 % 0.00 % 35.48 %
CP 0.00 % 0.00 % 18.60 % 6.98 % 20.93 % 13.95 % 0.00 % 39.53 %
CT 0.00 % 0.00 % 28.57 % 4.76 % 33.33 % 4.76 % 0.00 % 28.57 %
SL 0.00 % 0.00 % 0.00 % 0.00 % 0.00 % 81.08 % 0.00 % 18.92 %
SS 0.00 % 0.00 % 0.00 % 0.00 % 33.33 % 66.67 % 0.00 % 0.00 %
FC 2.22 % 0.00 % 24.44 % 6.67 % 8.89 % 15.56 % 2.22 % 40.00 %
TC 6.82 % 2.27 % 11.36 % 0.00 % 4.55 % 45.45 % 2.27 % 27.27 %
Legend:
Name of Category Abbreviation Name of Category Abbreviation
Constructability CN Contract and Project
Delivery CP
Zero Accident Technique ZA Craft Training CT
Resource Leveling RL Site Layout SL
Alignment AL Short-Term Scheduling SS
Knowledge Management KM Factors FC
Risk Management RM Technologies TC

93
5.2.2.1 Category Constructability
43 papers are examined in this category. The percentage of validation methodologies in Category
Constructability is plotted in histogram which is shown in Figure 5-1.
Figure 5-1 Distribution of Validation Methodologies Used in the Constructability Category
The figure clearly shows that more than half of the papers didn’t mention clear validation
methodology. The highest percentage of studies used the Case Studies methodology (D): 15.91 %.
The second highest percentages are Empirical Studies (C), Surveys (E) and Functional Demonstration
(F). Only a few papers applied the Experimental Studies (A), and Archival Data Analysis (G)
methodologies, and none employed Observational Studies (B).
To explore why 52.27% of the papers reported validation methodology that was unclear, the
content and structure of those papers were checked one by one. The goal of some was to illustrate or
review a concept or an idea related to the topic of constructability. The authors of those papers, such
as CN-12, CN-19, CN-21, and CN-23, applied research methodologies such as case studies or
synthesized reviews in order to explain their ideas. Rigorously validating papers that are descriptive is
not easy because quantitative data or similar cases/examples may be lacking. It is also possible that
some authors who don’t employ clear validation methodologies are unaware of the importance of the
2.27% 0.00%
9.09%
15.91%
9.09% 9.09%
2.27%
52.27%
0.00%
10.00%
20.00%
30.00%
40.00%
50.00%
60.00%
A B C D E F G H
Pe
rce
nta
ge o
f To
tal C
ate
gory
Usa
gae
Type of Validation Methodology
A - Experimental Studies B - Observational Studies C - Empirical Studies D - Case Studies E - Surveys F - Functional Demonstration G - Archival Data Analysis H - Unclear Validation

94
validation process. Another possible reason is that some research methodologies are quite scientific,
and the authors may consider that their studies have been applied using a rigorous and scientific
research approach so that the results have already been legitimated. For example, the authors of paper
CN-36 compared two formal constructability programs, including the attributes of the two programs
as well as the costs and benefits at both the corporate and project levels. The data related to
attributes, costs, and benefits were collected from two organizations, and the analysis results, such as
records of the attributes and calculations of ratios, were clearly presented in tables and figures. The
authors concluded that the benefit/cost ratios for both programs show the potential return on
investment of the constructability program. In this situation, when the results are convincing,
researchers do not feel the need to implement a validation process.
The Case Studies methodology shows the highest percentage of usage of all of the validation
methodologies, and with good reason. The most common topics in this category focus on the impact
of constructability and improvements in constructability practices. As listed in Table 3-3, the major
features of case studies include intensive analysis of a particular matter. To demonstrate the impact of
and improvement in constructability practices, researchers conduct intensive analysis of specific
cases, so that the Case Studies methodology is often the most appropriate technique. The uniqueness
of construction projects means that experimental studies are rarely conducted, and the lack of
quantitative data results in the infrequent use of archival data analysis. Observational studies involve
the use of cameras and audio devices, which are unsuitable for this type of study.
5.2.2.2 Zero Accident Techniques Category
The percentages that represent the usage of the validation methodologies reported in the 37 Zero
Accident Techniques papers were plotted as a histogram, as shown in Figure 5-2.
The figure shows that 36.59 % of the papers examined contain no mention of clear validation
methodologies, which is the highest percentage. Of the methodologies employed, the Case Studies
(D) methodology has the highest usage percentage: 29.27 %. The Surveys (E) methodology follows
as the second highest percentage, with the percentages for the Experimental Studies (A), Empirical
Studies (C), Functional Demonstration (F), and Archival Data Analysis (G) methodologies indicating
relatively low usage. None of the papers examined reported the application of the Observational
Studies (B) methodology.

95
The reasons for 36.59 % of the papers having reported validation methodology that was not clear
are similar to those for the Constructability category. Many of the papers in this category are
descriptive with respect to the topic of safety, and again, some authors may not appreciate the
importance of validation. The Case Studies methodology has the highest percentage of usage, and
Surveys has the second highest because, compared to other methods, case studies and surveys
represent more appreciate and easier ways to validate the results of improvements in safety and the
implementation of safety measures, which are the popular topics related to the Zero Accident
Techniques category. As mentioned in subsection 2.3.2.5, appropriately designed surveys can help
researchers convert qualitative data related to zero accident techniques into quantitative data.
However, observational studies involve the use of cameras and audio devices, which have not been
considered suitable for application in this area. An additional methodology not included in the seven
types investigated is the Delphi method, which was employed for validating the results of the study
presented in paper ZA-16.
Figure 5-2 Distribution of Validation Methodologies Used in the Zero Accident Techniques
Category
4.88%
0.00%
4.88%
29.27%
17.07%
4.88%
2.44%
36.59%
0.00%
5.00%
10.00%
15.00%
20.00%
25.00%
30.00%
35.00%
40.00%
A B C D E F G H
Pe
rce
nta
ge o
f To
tal C
ate
gory
Usa
ge
Type of Validation Methodology
A - Experimental Studies B - Observational Studies C - Empirical Studies D - Case Studies E - Surveys F - Functional Demonstration G - Archival Data Analysis H - Unclear Validation
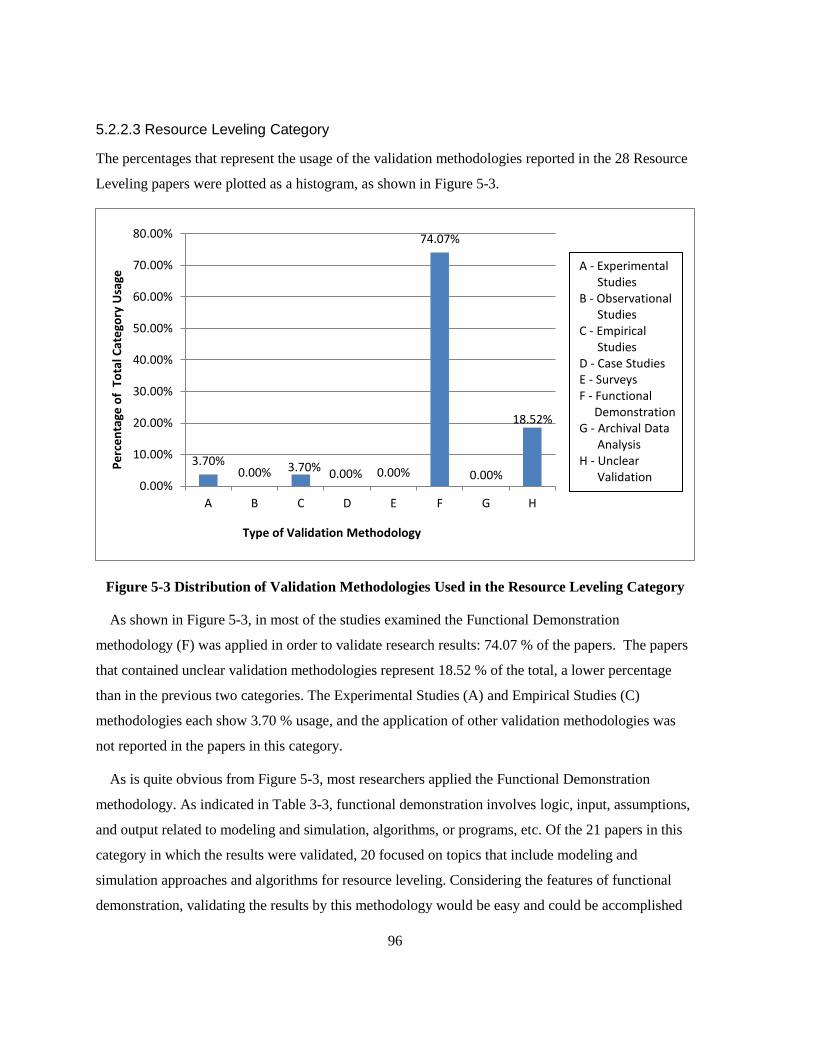
96
5.2.2.3 Resource Leveling Category
The percentages that represent the usage of the validation methodologies reported in the 28 Resource
Leveling papers were plotted as a histogram, as shown in Figure 5-3.
Figure 5-3 Distribution of Validation Methodologies Used in the Resource Leveling Category
As shown in Figure 5-3, in most of the studies examined the Functional Demonstration
methodology (F) was applied in order to validate research results: 74.07 % of the papers. The papers
that contained unclear validation methodologies represent 18.52 % of the total, a lower percentage
than in the previous two categories. The Experimental Studies (A) and Empirical Studies (C)
methodologies each show 3.70 % usage, and the application of other validation methodologies was
not reported in the papers in this category.
As is quite obvious from Figure 5-3, most researchers applied the Functional Demonstration
methodology. As indicated in Table 3-3, functional demonstration involves logic, input, assumptions,
and output related to modeling and simulation, algorithms, or programs, etc. Of the 21 papers in this
category in which the results were validated, 20 focused on topics that include modeling and
simulation approaches and algorithms for resource leveling. Considering the features of functional
demonstration, validating the results by this methodology would be easy and could be accomplished
3.70% 0.00% 3.70%
0.00% 0.00%
74.07%
0.00%
18.52%
0.00%
10.00%
20.00%
30.00%
40.00%
50.00%
60.00%
70.00%
80.00%
A B C D E F G H
Pe
rce
nta
ge o
f T
ota
l Cat
ego
ry U
sage
Type of Validation Methodology
A - Experimental Studies B - Observational Studies C - Empirical Studies D - Case Studies E - Surveys F - Functional Demonstration G - Archival Data Analysis H - Unclear Validation

97
through three steps: first, collect data from specific real projects or obtain data from hypothetical
examples; second, apply the data to the models, algorithms, or systems; and third, compare the results
with the actual ones or evaluate the performance of the models, algorithms, or systems. Only one
paper reported validation through the Experimental Studies methodology: RL-16. The author
conducted computational experiments and obtained sets of data so that statistical analysis could be
applied to the data. However, for the same reasons as in the other categories, 18.52 % of the papers
didn’t employ rigorous validation methodologies.
5.2.2.4 Alignment Category
The percentages that represent the usage of the validation methodologies reported in the 22
Alignment category papers were plotted as a histogram, as shown in Figure 5-4.
Figure 5-4 Distribution of Validation Methodologies Used in the Alignment Category
Figure 5-4 clearly shows that the results from half of the studies in this category were not
rigorously validated. The Surveys methodology (E) was reported in 16.67 % of the papers, which
ranks as the highest percentage compared with the other validation methodologies. The Empirical
Studies (C) and Functional Demonstration (F) methodologies were each used in 12.5 % of the studies;
the Case Studies (D) methodology was used in 8.33 %, and the Archival Data Analysis methodology
0.00% 0.00%
12.50%
8.33%
16.67%
12.50%
4.17%
45.83%
0.00%
5.00%
10.00%
15.00%
20.00%
25.00%
30.00%
35.00%
40.00%
45.00%
50.00%
A B C D E F G H
Pe
rce
nta
ge o
f To
tal C
ate
gory
Usa
ge
Type of Validation Methodology
A - Experimental Studies B - Observational Studies C - Empirical Studies D - Case Studies E - Surveys F - Functional Demonstration G - Archival Data Analysis H - Unclear Validation

98
in 4.17 %, which is relatively low. None of the researchers applied either the Experimental Studies
(A) or the Observational Studies (B) methodology.
Due to the descriptive nature of a number of the papers in this category and the lack of quantitative
data, 45.83 % of the papers employed unclear validation process. Surveys are a good approach for
converting qualitative data into quantitative data, which explains why the Surveys methodology is
associated with the highest usage percentage of all of the methodologies. The studies in which the
Functional Demonstration methodology was applied all focus on models, tools, and simulations.
Because the research data for this category is not easy to collect, only three of 22 papers reported the
collection of data from real projects or the validation of the hypothesis through statistical analysis
although it accounts for the second ranking percentage associated with the Empirical Studies
methodology. Both the Experimental Studies and the Observational Studies methodologies are
unsuitable for this category because of the difficulty of obtaining quantitative data.
5.2.2.5 Knowledge Management Category
The percentages that represent the usage of the validation methodologies reported in the 28
Knowledge Management papers were plotted as a histogram, as shown in Figure 5-5.
As shown in Figure 5-5, half of the papers in this category didn’t report clear validation
methodologies. Of all the validation methodologies mentioned, Case Studies (D) was used most
often: 23.33 %. The second highest percentage, 13.33 %, represents the Functional Demonstration
(F) methodology. The Empirical Studies (C) and Surveys (E) methodologies both show relatively low
usage. None of the studies included the Experimental Studies (A), Observational Studies (B), or
Archival Data Analysis (G) methodologies.
The reasons for 46.67 % of the papers not reporting any validation methodology are similar to the
ones previously mentioned for the other categories. The characteristics of research in the Knowledge
Management category make it suitable for validation through case studies since researchers can
conduct intensive analysis of a particular matter using that methodology. The Functional
Demonstration methodology is appropriate for the validation of models, simulations, and algorithms,
and because a few authors focused on models and systems of knowledge management, in 13.33 % of
the studies, the results were validated using this methodology. Experimental studies, observational
studies, and archival data analysis cannot be easily applied in this category because quantitative data
are difficult to obtain.
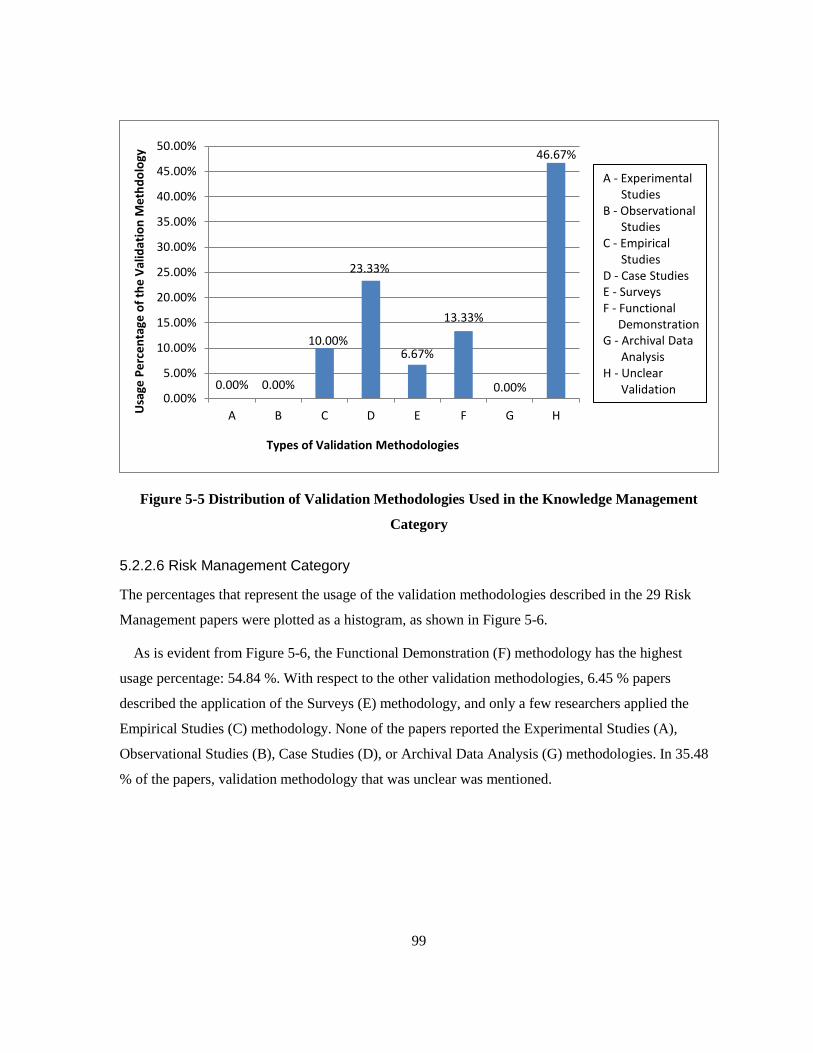
99
Figure 5-5 Distribution of Validation Methodologies Used in the Knowledge Management
Category
5.2.2.6 Risk Management Category
The percentages that represent the usage of the validation methodologies described in the 29 Risk
Management papers were plotted as a histogram, as shown in Figure 5-6.
As is evident from Figure 5-6, the Functional Demonstration (F) methodology has the highest
usage percentage: 54.84 %. With respect to the other validation methodologies, 6.45 % papers
described the application of the Surveys (E) methodology, and only a few researchers applied the
Empirical Studies (C) methodology. None of the papers reported the Experimental Studies (A),
Observational Studies (B), Case Studies (D), or Archival Data Analysis (G) methodologies. In 35.48
% of the papers, validation methodology that was unclear was mentioned.
0.00% 0.00%
10.00%
23.33%
6.67%
13.33%
0.00%
46.67%
0.00%
5.00%
10.00%
15.00%
20.00%
25.00%
30.00%
35.00%
40.00%
45.00%
50.00%
A B C D E F G HUsa
ge P
erc
en
tage
of
the
Val
idat
ion
Me
thd
olo
gy
Types of Validation Methodologies
A - Experimental Studies B - Observational Studies C - Empirical Studies D - Case Studies E - Surveys F - Functional Demonstration G - Archival Data Analysis H - Unclear Validation

100
Figure 5-6 Distribution of Validation Methodologies Used in the Risk Management Category
A number of the papers in this category focus on models, programs, and approaches for assessing
and managing risk, which make functional demonstration a good methodology for validating the
research results. Surveys are also suitable for validating the results produced by systems, and they
were applied along with functional demonstration by the authors of two papers: RM-16, in which the
authors reported interviews with a number of experts who were asked to evaluate the model, and RM-
4, in which interviews with 25 industry practitioners from 18 different construction companies were
described. For the same reasons mentioned previously, unclear validation methodologies were
employed in 35.48 % of the studies.
5.2.2.7 Contract and Project Delivery Category
The percentages that represent the usage of the validation methodologies reported in the 40 Contract
and Project Delivery papers were plotted as a histogram, as shown in Figure 5-7.
0.00% 0.00% 3.23%
0.00%
6.45%
54.84%
0.00%
35.48%
0.00%
10.00%
20.00%
30.00%
40.00%
50.00%
60.00%
A B C D E F G H
Pe
rce
nta
ge o
f To
tal C
ate
gory
Usa
ge
Type of Validation Methodology
A - Experimental Studies B - Observational Studies C - Empirical Studies D - Case Studies E - Surveys F - Functional Demonstration G - Archival Data Analysis H - Unclear Validation

101
Figure 5-7 Distribution of Validation Methodologies Used in the Contract and Project Delivery
Category
As shown in Figure 5-7, in 39.53% of the papers in this category validation methodology that was
unclear was reported. The methodology most frequently used was Surveys (E), at 23.26 %. The
Empirical Studies (C) methodology accounts for the second highest percentage: 18.60 %. The rates
for the Functional Demonstration (F) and Case Studies (D) methodologies are relatively low, and
none of the papers mentioned the Experimental Studies (A), Observational Studies (B), or Archival
Data Analysis (G) methodologies.
The highest percentage represents studies in which unclear validation methodology was applied
because the descriptive nature of a number of the studies in this category makes it difficult to employ
a validation methodology. Since the topics focus on methods of delivering a contract and project, it is
easier to conduct surveys about the delivery methods than to implement functional demonstration,
which requires the input of data and comparisons with the results of real projects. Surveys, on the
other hand, entail only carefully designed questionnaires or interviews, which explains why the
percentage associated with the Surveys methodology is higher than that linked to the Functional
Demonstration methodology. Empirical studies are suitable for research that involves a hypothesis or
a model, and 18.60 % of the papers describe the development of models of or a hypothesis about the
0.00% 0.00%
18.60%
4.65%
23.26%
13.95%
0.00%
39.53%
0.00%
5.00%
10.00%
15.00%
20.00%
25.00%
30.00%
35.00%
40.00%
45.00%
A B C D E F G HUsa
ge P
erc
en
tage
of
the
Val
idat
ion
Me
thd
olo
gy
Types of Validation Methodologies
A - Experimental Studies B - Observational Studies C - Empirical Studies D - Case Studies E - Surveys F - Functional Demonstration G - Archival Data Analysis H - Unclear Validation

102
delivery of a contract and project. Experimental studies, observational studies, and archival data
analysis are difficult to apply in this category because quantitative data are not easy to acquire.
5.2.2.8 Craft Training Category
The percentages that represent the usage of the validation methodologies reported in the 17 Craft
Training papers were plotted as a histogram, as shown in Figure 5-8.
Figure 5-8 reveals that the Surveys (E) methodology has the highest usage percentage: 33.33 %.
The second highest is the Empirical Studies (C) methodology, at28.57 %. The Case Studies (D) and
Functional Demonstration (F) methodologies are associated with a relatively low percentage: 4.76 %
each. No rigorous validation process was reported in 28.57 % of the papers, and none of the studies
applied the Experimental Studies (A), Observational Studies (B), or Archival Data Analysis (G)
methodologies.
The reasons why validation methodology that was unclear was reported in 28.57 % of the papers
are as the same as for the categories previously discussed. Researchers apply surveys to confirm their
results in this category because of the easily achievable twofold requirements of this methodology:
the careful design of the interview or questionnaire and the invitation of the appropriate people to
participate. In the papers that describe the use of the Empirical Studies methodology, for the statistical
validation of their results, the authors obtained access to data from industry sources. Only a few
topics in this category are related to modeling and simulation, which explains why the Functional
Demonstration percentage is relatively low. The difficulty of obtaining quantitative data in this
category makes the use of experimental studies, observational studies, and archival data analysis
challenging.

103
Figure 5-8 Distribution of Validation Methodologies Used in the Craft Training Category
5.2.2.9 Site Layout Category
The percentages that represent the usage of the validation methodologies employed in the 37 Site
Layout papers were plotted as a histogram, as shown in Figure 5-9.
Functional Demonstration (F) is clearly the only validation methodology applied in this category,
and only 18.92 % of the papers didn’t report any rigorous validation methodology, for the reasons
previously mentioned. Most of the papers in this category are about modeling and simulation,
algorithms, and optimization methods, which are topics that typically lend themselves to validation
through functional demonstration.
0.00% 0.00%
28.57%
4.76%
33.33%
4.76%
0.00%
28.57%
0.00%
5.00%
10.00%
15.00%
20.00%
25.00%
30.00%
35.00%
A B C D E F G HUsa
ge P
erc
en
tage
of
the
Val
idat
ion
Me
thd
olo
gy
Types of Validation Methodologies
A - Experimental Studies B - Observational Studies C - Empirical Studies D - Case Studies E - Surveys F - Functional Demonstration G - Archival Data Analysis H - Unclear Validation

104
Figure 5-9 Distribution of Validation Methodologies Used in the Site Layout Category
5.2.2.10 Short-Term Scheduling Category
The percentages that represent the usage of the validation methodologies reported in the three Short-
Term Scheduling papers were plotted as a histogram, as shown in Figure 5-10.
As shown in Figure 5-10, the Functional Demonstration (F) methodology accounts for the highest
usage percentage: 66.67 %. The technique used in 33.33 % of the papers was the Surveys (E)
methodology.
The investigations related to systems and programming were validated through functional
demonstration. However, the sample size of this category is too small for a confident conclusion
because only a very limited number of papers could be found, and further research is therefore
needed.
5.2.2.11 Factors Category
The percentages that represent usage of the validation methodologies reported in the 40 Factors
papers were plotted as a histogram, as shown in Figure 5-11.
0.00% 0.00% 0.00% 0.00% 0.00%
81.08%
0.00%
18.92%
0.00%
10.00%
20.00%
30.00%
40.00%
50.00%
60.00%
70.00%
80.00%
90.00%
A B C D E F G HUsa
ge P
erc
en
tage
of
the
Val
idat
ion
Me
thd
olo
gy
Types of Validation Methodologies
A - Experimental Studies B - Observational Studies C - Empirical Studies D - Case Studies E - Surveys F - Functional Demonstration G - Archival Data Analysis H - Unclear Validation
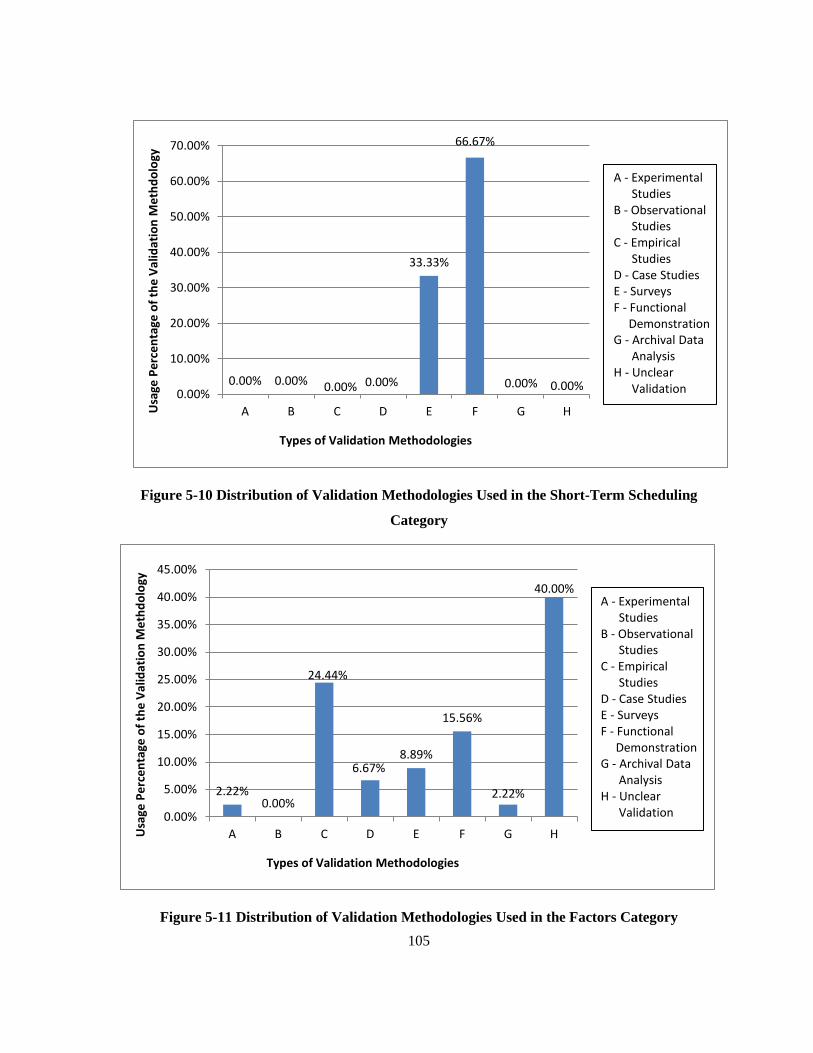
105
Figure 5-10 Distribution of Validation Methodologies Used in the Short-Term Scheduling
Category
Figure 5-11 Distribution of Validation Methodologies Used in the Factors Category
0.00% 0.00% 0.00% 0.00%
33.33%
66.67%
0.00% 0.00% 0.00%
10.00%
20.00%
30.00%
40.00%
50.00%
60.00%
70.00%
A B C D E F G HUsa
ge P
erc
en
tage
of
the
Val
idat
ion
Me
thd
olo
gy
Types of Validation Methodologies
A - Experimental Studies B - Observational Studies C - Empirical Studies D - Case Studies E - Surveys F - Functional Demonstration G - Archival Data Analysis H - Unclear Validation
2.22% 0.00%
24.44%
6.67% 8.89%
15.56%
2.22%
40.00%
0.00%
5.00%
10.00%
15.00%
20.00%
25.00%
30.00%
35.00%
40.00%
45.00%
A B C D E F G HUsa
ge P
erc
en
tage
of
the
Val
idat
ion
Me
thd
olo
gy
Types of Validation Methodologies
A - Experimental Studies B - Observational Studies C - Empirical Studies D - Case Studies E - Surveys F - Functional Demonstration G - Archival Data Analysis H - Unclear Validation

106
As shown in Figure 5-11, 40.00 % of the papers in this category didn’t describe a clear validation
methodology. Of the validation methodologies employed, Empirical Studies (C) accounts for 24.44 %
of the usage, and Functional Demonstration accounts for 15.56 % of the usage, which are relatively
higher rates than those associated with the other validation methodologies. The Case Studies (D) and
Surveys (E) methodologies represent 6.67 % and 8.89 % of the usage, respectively, and the
Experimental Studies (A) and Archival Data Analysis (G) methodologies each constitute 2.22 %. The
only type of validation methodology not encountered in this category is Observational Studies (B).
The absence of any mention of a validation methodology in 40.00 % of the papers can be attributed
to the same reasons explained previously. A number of the studies in this category investigated the
relationship between the factors and labour productivity as well as the modeling and simulation of the
impact of the factors. Empirical studies help researchers validate their results with the use of
empirical data. Functional demonstration provides a means of validating a model through a
demonstration of the validity of the simulation or systems. For these reasons, the Empirical Studies
and Functional Demonstration methodologies are used relatively more frequently than the other
methods. The work presented in the paper that described the application of the Experimental Studies
and Surveys methodologies was validated through interviews with the members of the treated and
control groups, thus enabling the authors to conduct statistical analysis of the data. Since the effects
of scheduled overtime on labour productivity had been previously studied by numerous researchers,
the authors of paper FC-34 were able to validate their results with the use of the Archival Data
Analysis methodology.
5.2.2.12 Technologies Category
The percentages that represent the usage of the validation methodologies reported in the 42
Technologies papers were plotted as a histogram, as shown in Figure 5-12.
Figure 5-12 shows that the Functional Demonstration (F) methodology is associated with the
highest usage percentage: 45.45 %. The Empirical Studies (C) methodology ranks second, at 11.36 %,
followed by the Experimental Studies (A) methodology, at 6.82 %. The Observational Studies (B),
Surveys (E), and Archival Data Analysis (G) methodologies all represent relatively low percentages.
None of the papers reported the use of the Case Studies (D) methodology. For the same reasons
mentioned previously, in 27.27 % of the studies, the results were not rigorously validated.

107
The papers in this category focus on advanced technologies, such as automation and BIM, so
researchers are easily able to apply functional demonstration as a means of validating their results. A
few are able to acquire access to data from industry sources, enabling them to validate their models
and hypothesis through empirical studies. Paper TC-24 describes the use of a surveillance camera to
help validate the results.
Figure 5-12 Distribution of Validation Methodologies Used in the Technologies Category
5.2.3 Summary
Section 5.2 has presented the analysis and discussion of the distribution of the validation
methodologies in each source category. Some of the papers report application of a validation
methodology that was unclear for two main reasons: first, some authors are unaware of the
importance of the validation process; second, some papers are too descriptive to support the
application of any validation methodology. As shown in the figures included in this section, each
source category involved the use of specific, commonly applied validation methodologies.
Researchers who are investigating topics in these categories may therefore want to consider these
frequently used methodologies so that they can select the most appropriate technique when attempting
6.82% 2.27%
11.36%
0.00%
4.55%
45.45%
2.27%
27.27%
0.00%
5.00%
10.00%
15.00%
20.00%
25.00%
30.00%
35.00%
40.00%
45.00%
50.00%
A B C D E F G HUsa
ge P
erc
en
tage
of
the
Val
idat
ion
Me
thd
olo
gy
Types of Validation Methodologies
A - Experimental Studies B - Observational Studies C - Empirical Studies D - Case Studies E - Surveys F - Functional Demonstration G - Archival Data Analysis H - Unclear Validation

108
to validate the results of their studies. Based the highest usage percentages, Table 5-2 summarizes the
validation methodologies recommended for each source category.
Table 5-2 Top Validation Methodologies in Each Source Category
Source Category Top Validation Methodologies
Constructability Case Studies
Zero Accident Techniques Case Studies and Surveys
Resource Leveling Functional Demonstration
Alignment Surveys
Knowledge Management Case Studies
Risk Management Functional Demonstration
Contract and Project Delivery Surveys
Craft Training Empirical Studies and Surveys
Site Layout Functional Demonstration
Short-Term Scheduling Functional Demonstration
Factors Empirical Studies and Functional Demonstration
Technologies Functional Demonstration
5.3 Distribution of Source Categories for Each Type of Validation Methodology
5.3.1 Summary of Distribution Results
5.3.1.1 Introduction
The distribution of the source categories for which each validation methodology is reported is shown
in Table 5-3. The percentage of each source category for which a specific validation methodology
was used is calculated as follows:
∑ ( )
(5.2)
where indicates the percentage of the papers in source category that reported validation
methodology , represents the number of occurrences of validation methodology in source
category , and means the total number of articles in category .
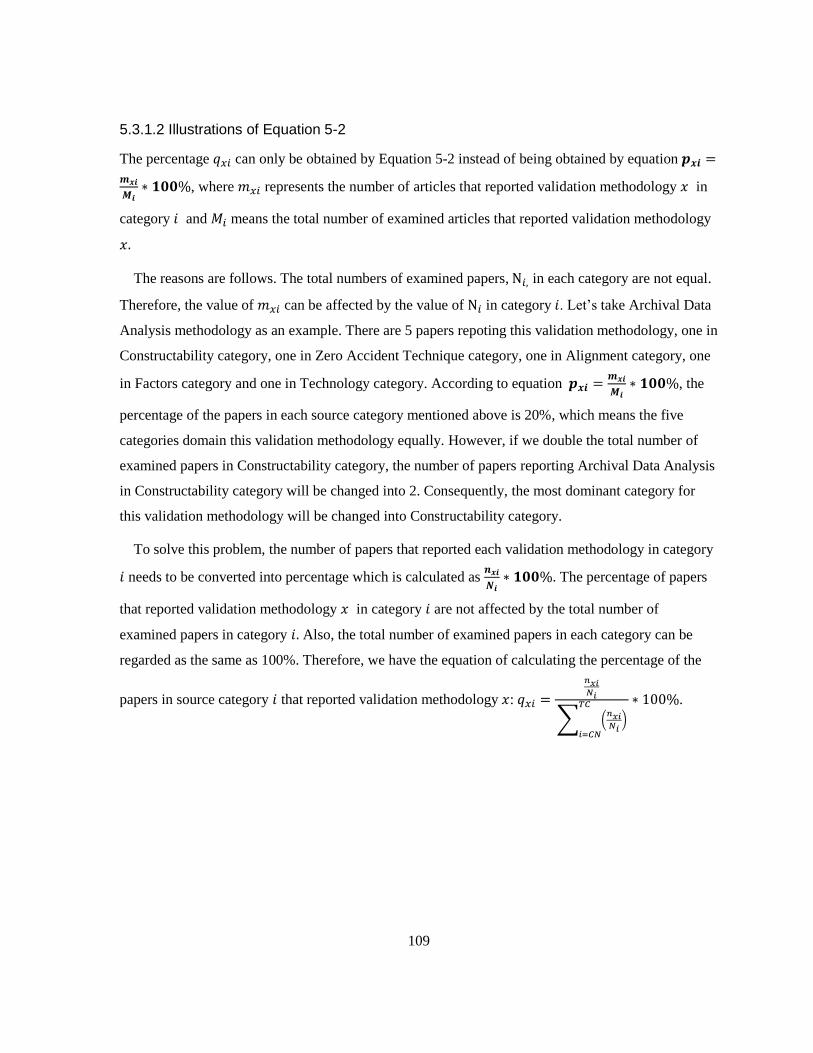
109
5.3.1.2 Illustrations of Equation 5-2
The percentage can only be obtained by Equation 5-2 instead of being obtained by equation
, where represents the number of articles that reported validation methodology in
category and means the total number of examined articles that reported validation methodology
The reasons are follows. The total numbers of examined papers, in each category are not equal.
Therefore, the value of can be affected by the value of in category . Let’s take Archival Data
Analysis methodology as an example. There are 5 papers repoting this validation methodology, one in
Constructability category, one in Zero Accident Technique category, one in Alignment category, one
in Factors category and one in Technology category. According to equation
, the
percentage of the papers in each source category mentioned above is 20%, which means the five
categories domain this validation methodology equally. However, if we double the total number of
examined papers in Constructability category, the number of papers reporting Archival Data Analysis
in Constructability category will be changed into 2. Consequently, the most dominant category for
this validation methodology will be changed into Constructability category.
To solve this problem, the number of papers that reported each validation methodology in category
needs to be converted into percentage which is calculated as
. The percentage of papers
that reported validation methodology in category are not affected by the total number of
examined papers in category Also, the total number of examined papers in each category can be
regarded as the same as 100%. Therefore, we have the equation of calculating the percentage of the
papers in source category that reported validation methodology :
∑ ( )
.

110
Table 5-3 Source Category Distribution Results for Each Validation Methodology
Source Category CN ZA RL AL KM RM CP CT SL SS FC TC
Vali
dati
on
Met
hod
olo
gie
s
Experimental
Studies 11.42 % 24.52 % 18.62 % 0.00 % 0.00 % 0.00 % 0.00 % 0.00 % 0.00 % 0.00 % 11.17 % 34.27 %
Observational
Studies 0.00 % 0.00 % 0.00 % 0.00 % 0.00 % 0.00 % 0.00 % 0.00 % 0.00 % 0.00 % 0.00 % 100.00 %
Empirical
Studies 7.19 % 3.86 % 2.93 % 9.89 % 7.91 % 2.55 % 22.61 % 22.61 % 0.00 % 0.00 % 19.34 % 8.99 %
Case Studies 17.12 % 31.50 % 0.00 % 8.97 % 25.11 % 0.00 % 5.01 % 5.12 % 0.00 % 0.00 % 7.17 % 0.00 %
Surveys 5.71 % 10.72 % 0.00 % 10.46 % 4.18 % 4.05 % 14.60 % 20.92 % 0.00 % 20.92 % 5.58 % 2.85 %
Functional
Demonstration 2.29 % 1.23 % 18.70 % 3.16 % 3.37 % 13.84 % 3.52 % 1.20 % 20.47 % 16.83 % 3.93 % 11.47 %
Archival Data
Analysis 16.99 % 18.24 % 0.00 % 31.16 % 0.00 % 0.00 % 0.00 % 0.00 % 0.00 % 0.00 % 16.62 % 16.99 %
Unclear
Validation 13.42 % 9.39 % 4.75 % 11.76 % 11.98 % 9.11 % 10.15 % 7.33 % 4.86 % 0.00 % 10.27 % 7.00 %
Legend:
Name of Category Abbreviation Name of Category Abbreviation
Constructability CN Contract and Project
Delivery CP
Zero Accident Technique ZA Craft Training CT
Resource Leveling RL Site Layout SL
Alignment AL Short-Term Scheduling SS
Knowledge Management KM Factors FC
Risk Management RM Technologies TC
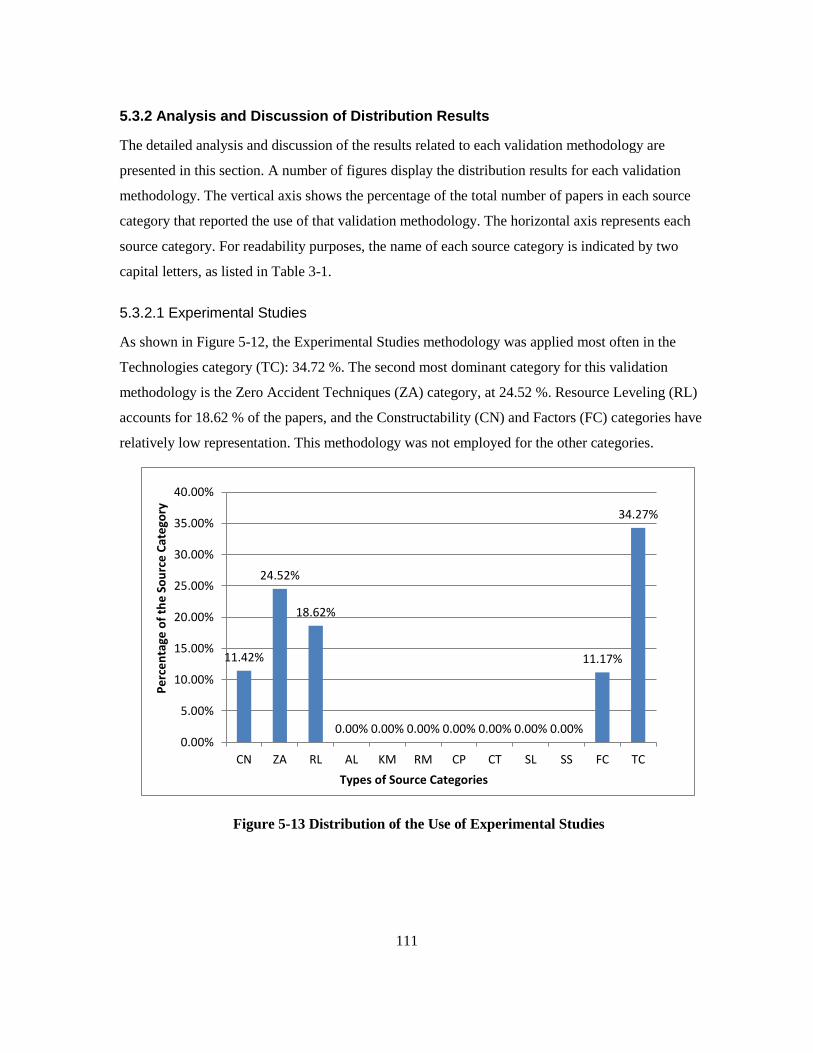
111
5.3.2 Analysis and Discussion of Distribution Results
The detailed analysis and discussion of the results related to each validation methodology are
presented in this section. A number of figures display the distribution results for each validation
methodology. The vertical axis shows the percentage of the total number of papers in each source
category that reported the use of that validation methodology. The horizontal axis represents each
source category. For readability purposes, the name of each source category is indicated by two
capital letters, as listed in Table 3-1.
5.3.2.1 Experimental Studies
As shown in Figure 5-12, the Experimental Studies methodology was applied most often in the
Technologies category (TC): 34.72 %. The second most dominant category for this validation
methodology is the Zero Accident Techniques (ZA) category, at 24.52 %. Resource Leveling (RL)
accounts for 18.62 % of the papers, and the Constructability (CN) and Factors (FC) categories have
relatively low representation. This methodology was not employed for the other categories.
Figure 5-13 Distribution of the Use of Experimental Studies
11.42%
24.52%
18.62%
0.00% 0.00% 0.00% 0.00% 0.00% 0.00% 0.00%
11.17%
34.27%
0.00%
5.00%
10.00%
15.00%
20.00%
25.00%
30.00%
35.00%
40.00%
CN ZA RL AL KM RM CP CT SL SS FC TC
Pe
rce
nta
ge o
f th
e S
ou
rce
Cat
ego
ry
Types of Source Categories
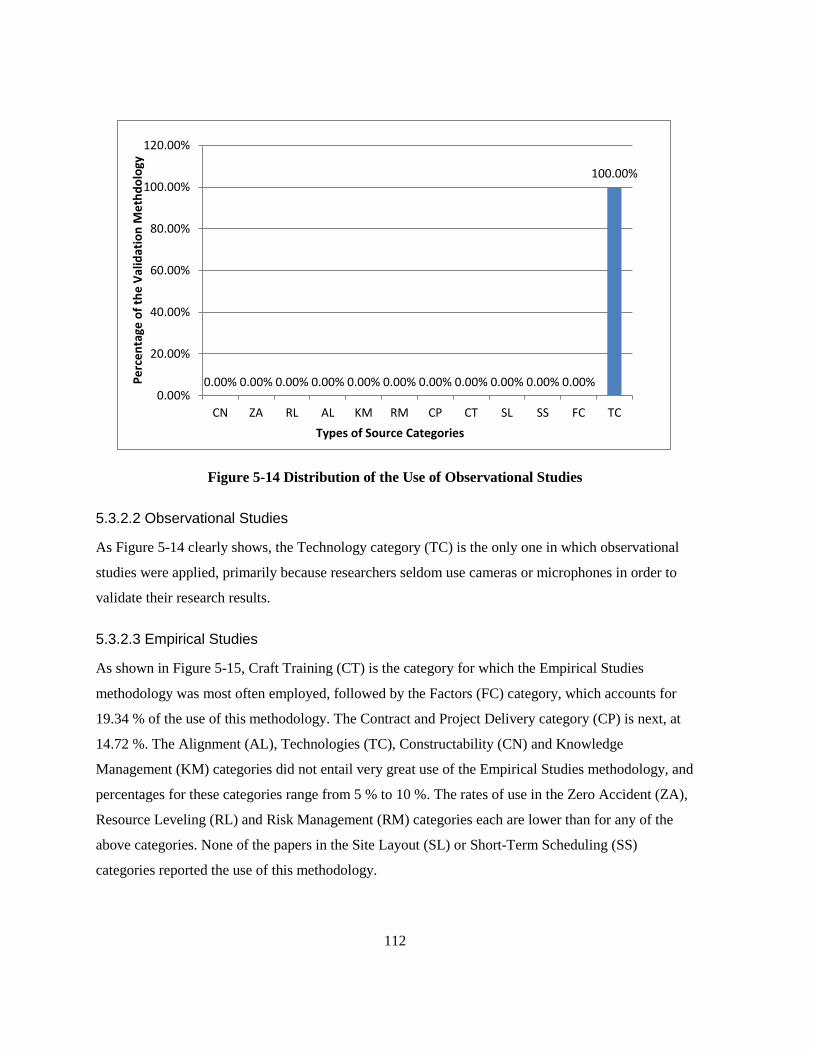
112
Figure 5-14 Distribution of the Use of Observational Studies
5.3.2.2 Observational Studies
As Figure 5-14 clearly shows, the Technology category (TC) is the only one in which observational
studies were applied, primarily because researchers seldom use cameras or microphones in order to
validate their research results.
5.3.2.3 Empirical Studies
As shown in Figure 5-15, Craft Training (CT) is the category for which the Empirical Studies
methodology was most often employed, followed by the Factors (FC) category, which accounts for
19.34 % of the use of this methodology. The Contract and Project Delivery category (CP) is next, at
14.72 %. The Alignment (AL), Technologies (TC), Constructability (CN) and Knowledge
Management (KM) categories did not entail very great use of the Empirical Studies methodology, and
percentages for these categories range from 5 % to 10 %. The rates of use in the Zero Accident (ZA),
Resource Leveling (RL) and Risk Management (RM) categories each are lower than for any of the
above categories. None of the papers in the Site Layout (SL) or Short-Term Scheduling (SS)
categories reported the use of this methodology.
0.00% 0.00% 0.00% 0.00% 0.00% 0.00% 0.00% 0.00% 0.00% 0.00% 0.00%
100.00%
0.00%
20.00%
40.00%
60.00%
80.00%
100.00%
120.00%
CN ZA RL AL KM RM CP CT SL SS FC TC
Pe
rce
nta
ge o
f th
e V
alid
atio
n M
eth
do
logy
Types of Source Categories

113
Figure 5-15 Distribution of the Use of Empirical Studies
5.3.2.4 Case Studies
As shown in Figure 5-16, the Zero Accident Techniques (ZA) category represents the most dominant
use of the Case Studies methodology, accounting for 31.50 %. The percentage for the Knowledge
Management (KM) category is also high, at 25.11 %, and the Constructability (CN) category
constitutes 17.12 % of the use of this methodology. The percentages for the Alignment (AL),
Contract and Project Delivery (CP), Craft Training (CT), and Factors (FC) categories are relatively
low. None of the studies in the Resource Leveling (RL), Risk Management (RM), Site Layout (SL),
Short-Term Scheduling (SS), or Technologies (TC) categories made use of the Case Studies
methodology.
5.3.2.5 Surveys
As shown in Figure 5-17, with the exception of the Resource Leveling (RL) and Site Layout (SL)
categories, every source category involved the application of the Surveys methodology. The highest
percentage, 20.92 %, is associated with both the Craft Training (CT) and Short-Term Scheduling (SS)
categories. The Contract and Project Delivery (CP), Alignment (AL), and Zero Accident Techniques
(ZA) categories follow. The percentages for the Constructability (CN), Knowledge Management
7.19%
3.86% 2.93%
9.89%
7.91%
2.55%
14.72%
22.61%
0.00% 0.00%
19.34%
8.99%
0.00%
5.00%
10.00%
15.00%
20.00%
25.00%
CN ZA RL AL KM RM CP CT SL SS FC TC
Pe
rce
nta
ge o
f th
e V
alid
atio
n M
eth
do
logy
Types of Source Categories

114
(KM), Risk Management (RM), Factors (FC), and Technologies (TC) categories are all relatively
low.
Figure 5-16 Distribution of the Use of Case Studies
Figure 5-17 Distribution of the Use of Surveys
17.12%
31.50%
0.00%
8.97%
25.11%
0.00%
5.01% 5.12%
0.00% 0.00%
7.17%
0.00% 0.00%
5.00%
10.00%
15.00%
20.00%
25.00%
30.00%
35.00%
CN ZA RL AL KM RM CP CT SL SS FC TC
Pe
rce
nta
ge o
f th
e V
alid
atio
n M
eth
do
logy
Types of Source Categories
5.71%
10.72%
0.00%
10.46%
4.18% 4.05%
14.60%
20.92%
0.00%
20.92%
5.58%
2.85%
0.00%
5.00%
10.00%
15.00%
20.00%
25.00%
CN ZA RL AL KM RM CP CT SL SS FC TC
Pe
rce
nta
ge o
f th
e V
alid
atio
n M
eth
do
logy
Types of Source Categories

115
5.3.2.6 Functional Demonstration
As can be seen in Figure 5-18, every source category includes the application of the Functional
Demonstration methodology. The greatest number of applications was in the Site Layout (SL)
category, which accounts for 20.47 %. The next most frequent use appears in the Resource Leveling
(RL) and Short-Term Scheduling (SS) categories, at 18.70 % and 16.83 %, respectively. The
percentages for Risk Management (RM) and Technologies (TC) categories are 13.84 % and 11.47 %,
respectively. The remainder of the categories account for relatively low percentages: less than 5 %
each.
Figure 5-18 Distribution of the Use of Functional Demonstration
5.3.2.7 Archival Data Analysis
As shown in Figure 5-19, the Alignment (AL) category accounts for the highest use of the Archival
Data Analysis methodology: 31.16 %. The second highest percentage, 18.24 %, is associated with the
Zero Accident Techniques (ZA) category. The percentages for the Constructability (CN), Factors
(FC), and Technologies (TC) categories are almost identical: about 16.80 %. The other categories did
not include studies in which the Archival Data Analysis methodology was employed.
2.29% 1.23%
18.70%
3.16% 3.37%
13.84%
3.52%
1.20%
20.47%
16.83%
3.93%
11.47%
0.00%
5.00%
10.00%
15.00%
20.00%
25.00%
CN ZA RL AL KM RM CP CT SL SS FC TC
Pe
rce
nta
ge o
f th
e V
alid
atio
n M
eth
do
logy
Types of Source Categories

116
Figure 5-19 Distribution of the Use of Archival Data Analysis
5.3.2.8 Distribution of Studies with Unclear Validation
As shown in Figure 5-20, except for Short-Term Scheduling (SS), every category contains papers that
did not describe any validation methodologies. The Constructability (CN) category is associated with
the highest percentage of papers that didn’t describe a rigorous validation methodology. The second
highest percentage is 11.98 %, for Knowledge Management (KM) category, followed by Alignment
Category (AL). At 10.27 % and 10.15 %, respectively, the Factors (FC) and Contract and Project
Delivery (CP) categories also include a relatively high percentage of studies in which unclear
validation methodology was applied. The categories that exhibit the lowest percentage of unclear-
validation papers are Resource Leveling (RL) and Site Layout (SL). The Short-Term Scheduling
category was not included in the consideration because the sample size of that category is too small to
support a conclusion that this category is associated with the lowest percentage.
16.99% 18.24%
0.00%
31.16%
0.00% 0.00% 0.00% 0.00% 0.00% 0.00%
16.62% 16.99%
0.00%
5.00%
10.00%
15.00%
20.00%
25.00%
30.00%
35.00%
CN ZA RL AL KM RM CP CT SL SS FC TC
Pe
rce
nta
ge o
f th
e V
alid
atio
n M
eth
do
logy
Types of Source Categories

117
Figure 5-20 Distribution of Unclear-Validation Papers
5.3.3 Discussion
This subsection includes a discussion of the results related to each validation methodology.
5.3.3.1 Comments about the Distribution
The Experimental Studies methodology requires researchers to collect sets of data and then conduct
statistical analysis in order to compare the control group with the treated group. Researchers who
study topics that fall into the Technology category find it easier to compare the results obtained from
groups who are given advanced technology with the results from non-treatment groups than do
researchers who investigate topics in the other categories.
With respect to the Observational Studies methodology, the Technologies category is the only
one that includes studies in which this methodology was applied, primarily because these papers were
focused on vision-based crane tracking, which involves the use of cameras.
The authors of the published articles included in the Craft Training and Factors categories
usually had access to data from industry sources that they could use to validate their models or
hypothesis, so these two categories thus contain the highest percentage of studies in which the
Empirical Studies methodology was applied.
13.42%
9.39%
4.75%
11.76% 11.98%
9.11%
10.15%
7.33%
4.86%
0.00%
10.27%
7.00%
0.00%
2.00%
4.00%
6.00%
8.00%
10.00%
12.00%
14.00%
16.00%
CN ZA RL AL KM RM CP CT SL SS FC TC
Pe
rce
nta
ge o
f th
e V
alid
atio
n M
eth
do
logy
Types of Source Categories

118
The Case Studies methodology is the dominant technique employed in the studies reported in
the Zero Accident Techniques and Knowledge Management source categories because validation
through intensive analysis that is based on other similar cases is more appropriate for these two
categories than for the other categories, and with respect to this method, these two categories rank
higher than the other categories. Perhaps the complex and behavioral nature of these practices is also
a fact in their prevalence of case studies.
The distribution of categories for the Surveys methodology is relatively less variable because
surveys are easier to conduct than other validation methodologies. Therefore, in almost every
category, surveys have been applied as a means of validating results; the only exceptions are the
Resource Leveling and Site Layout categories. Interestingly, because they contain more papers
related to modeling, simulation, and algorithms than the other categories, these two categories also
display the highest percentages of studies in which the Functional Demonstration methodology has
been employed. In fact, every category contains papers that report the use of the Functional
Demonstration methodology for the simple reason that it offers the most easily implemented method
of validating the proposed approaches, systems, and algorithms. On the other hand, only five
categories contain papers that describe the use of the more challenging Archival Data Analysis
methodology, which requires a range of documented data related to a specific topic as well as access
to the data source.
5.3.3.2 Case Studies and Functional Demonstration Methodologies
As shown in Table 2-1, the Case Studies methodology is popularly applied in the humanities, medical
science, biology, physics, and psychology but is not as common in construction engineering and
management (CEM). However, almost every author who applied the Functional Demonstration
methodology claimed to have validated their results through case studies.
As reviewed in section 2.3, the Case Studies validation methodology focuses on the intensive
analysis of a particular matter so that the subject of the case studies is in fact the “case” itself.
However, researchers who claimed to have applied the Case Studies methodology in their research
usually focused on the input and output of modeling and simulation, algorithms, or systems, etc.,
rather than on an intensive analysis of the case. If it is a case, it is more in the sense that the scope or
range of variability of the inputs and outputs is usually quite restricted to the conditions of the “case”
itself. Their validation of results involved inputting the data to the systems or algorithms followed by
either a comparison of the output with actual industry results or an evaluation of the results according

119
to specific principles. According to the definition of Functional Demonstration used in this thesis,
which is a process or evidence that demonstrates the valid functioning of the algorithm/model through
the input of data and comparisons of the output, those authors actually validated their research results
with the use of the Functional Demonstration methodology.
5.4 Trends in the Use of Validation Methodologies over the Past 33 Years
5.4.1 The Trend Results
This section discusses trends in each validation methodology. The research presented in this thesis
involved the examination of 365 papers that were sorted in chronological order from 1980 to 2013.
For an analysis of the trends over the past 34 years, the papers were divided into four periods: 1980 to
1989, 1990 to 1999, 2000 to 2009, and 2010 to the present. The percentage of each validation
methodology that was reported in each period is shown in Table 5-4.
Table 5-4 Percentages of Validation Methodology Use over Four Time Spans
Period 1980-1989 1990-1999 2000-2009 2010-2013
Vali
dati
on
Met
hod
olo
gy Experimental Studies 0.00 % 5.41 % 1.79 % 2.99 %
Observational studies 0.00 % 0.00 % 0.00 % 0.60 %
Empirical Studies 31.25 % 13.51 % 15.48 % 5.39 %
Case Studies 0.00 % 8.11 % 10.71 % 11.38 %
Surveys 12.50 % 2.70 % 8.93 % 13.17 %
Functional Demonstration 0.00 % 27.03 % 30.95 % 31.14 %
Archival Data Analysis 0.00 % 2.70 % 1.19 % 1.20 %
Unclear Validation 56.25 % 40.54 % 30.95 % 34.13 %
A comparison of all of the validation methodologies, including “Unclear Validation,” reveals an
obvious increasing trend in the use of the Functional Demonstration methodology and a decreasing
trend in the number of papers that didn’t report any rigorous validation methodology. These trends
are mainly the result of the advantages of the Functional Demonstration methodology: simple to
conduct and inexpensive. Usually a personal computer suffices. An increasing awareness of the
importance of validation processes has contributed to the decreasing trend in the use of unclear
validation.

120
5.4.2 Validation of the Trend Results
Considering the inconsistent sample sizes for each period, the decision was to validate the trends
revealed with respect to the Functional Demonstration methodology and the studies with unclear
validation, called Unclear-Validation, by conducting an empirical study. The data were all obtained
from the examination of the 365 papers.
The groups of papers were designated as follows: those published from 1980 to 1989 are named
Group I; those from 1990 to 1999, Group II; those from 2000 to 2009, Group III; and those from 2010
to 2013, Group IV. While grouping into decades rather than four equal length sub-periods of the
period studied may seem arbitrary, it was done with the intent that the study might be replicated more
easily in the future this way. Groups II and III each represent 10 data points; the number was smaller
in Group I because of the lack of papers from 1981 to 1984, and in Group IV because the papers were
published only from 2010 to the present. For the calculation of the parameters, such as the mean and
variance, for each data set, a total of 30 data points were used, with each data point representing the
usage percentage of either the Functional Demonstration methodology or the Unclear-Validation
methodology. The analysis of variance (ANOVA) and least significant difference (LSD) could thus
be determined for the data sets.
5.4.2.1 Validation of the Functional Demonstration Trend
5.4.2.1.1 ANOVA
The percentages of the occurrence of the Functional Demonstration methodology in each group are
presented in Table 5-5. The ANOVA tables that were generated with the use of the Excel Analysis
Tool Package are shown in Tables 5-6 and 5-7.

121
Table 5-5 Functional Demonstration Data Points in Each Group
Group No. Group I Group II Group III Group IV
Per
cen
tag
e o
f F
un
ctio
na
l
Dem
on
stra
tio
n
0.00 % 0.00 % 0.00 % 24.07 %
0.00 % 16.67 % 50.00 % 30.67 %
0.00 % 33.33 % 33.33 % 35.29 %
0.00 % 16.67 % 14.29 % 100.00 %
0.00 % 16.67 % 18.18 %
0.00 % 33.33 % 29.41 %
50.00 % 38.46 %
50.00 % 29.41 %
40.00 % 38.46 %
0.00 % 33.33 %
Table 5-6 Summary of Functional Demonstration Parameters in Each Group
Groups Count Sum Average Variance
Group I 6 0 0 0
Group II 10 2.57 0.26 0.03
Group III 10 2.85 0.28 0.02
Group IV 4 1.90 0.48 0.12
Table 5-7 ANOVA of Functional Demonstration (α = 5 %)
Source of Variation SS df MS F P-value F crit
Between Groups 0.59 3 0.20 5.91 0.003 2.98
Within Groups 0.86 26 0.03
Total 1.45 29
The goal was to determine whether the variation between group means is significantly larger than
the variation that occurs within groups. The null hypothesis in this test is as follows:
H0: There’s no difference between groups. H1: There exist differences between groups.
As shown in Table 5-7, we know that the F-value, which is 5.91, is larger than the F-critical value,
which is 2.98. Therefore, the null hypothesis can be rejected, with the conclusion that significant
differences exist between the groups at the 95 % confidence level.
5.4.2.1.2 LSD

122
The calculation of the LSD enables a determination of whether the difference between a specific pair
of means is significant at the 95 % confidence level. The difference between a specific pair of means
is significant at the 95 % confidence level if it exceeds the value of the LSD. The LSD equation is as
follows:
√
(5.3)
where means the total degree of freedom which, in this case, is 29; indicates the significance
level, which is 5 % here; represents the average number of data points in each group, which is
approximately 7; and denotes the mean of the sources of variation within groups, which is =
0.033, based on Table 5-7. The LSD value is thus . The results are
shown in Table 5-8.
Table 5-8 Analysis of the LSD for Functional Demonstration (α = 5 %)
Pair of Groups Difference Larger than LSD?
I and II 0.26 Yes
II and III 0.03 Yes
III and IV 0.19 Yes
It can therefore be concluded that a significant increasing trend exists with respect to the use of the
Functional Demonstration methodology over the past 34 years at the 95 % confidence level.
5.4.2.2 Validation of the Unclear-Validation Trend
5.4.2.2.1 ANOVA
The percentages of Unclear-Validation papers in each group are presented in Table 5-9. The ANOVA
tables that were generated with the use of the Excel Analysis Tool Package are shown in Tables 5-10
and 5-11.
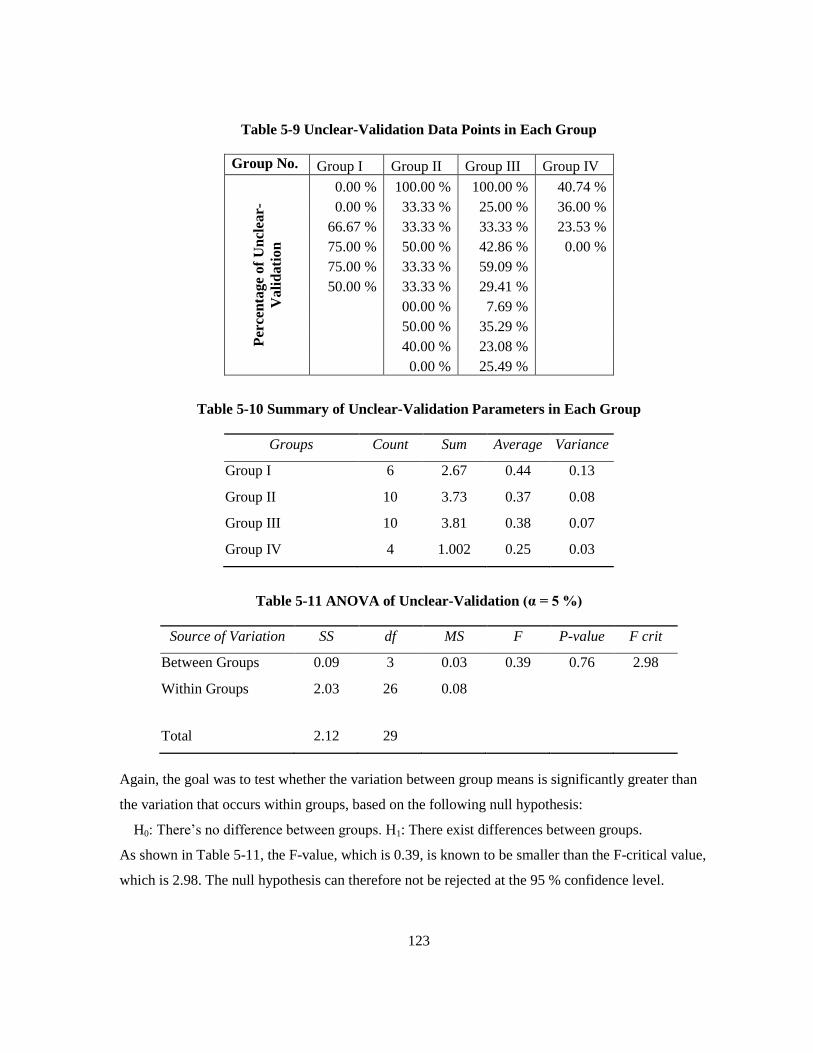
123
Table 5-9 Unclear-Validation Data Points in Each Group
Group No. Group I Group II Group III Group IV
Per
cen
tag
e o
f U
ncl
ear-
Va
lid
ati
on
0.00 % 100.00 % 100.00 % 40.74 %
0.00 % 33.33 % 25.00 % 36.00 %
66.67 % 33.33 % 33.33 % 23.53 %
75.00 % 50.00 % 42.86 % 0.00 %
75.00 % 33.33 % 59.09 %
50.00 % 33.33 % 29.41 %
00.00 % 7.69 %
50.00 % 35.29 %
40.00 % 23.08 %
0.00 % 25.49 %
Table 5-10 Summary of Unclear-Validation Parameters in Each Group
Groups Count Sum Average Variance
Group I 6 2.67 0.44 0.13
Group II 10 3.73 0.37 0.08
Group III 10 3.81 0.38 0.07
Group IV 4 1.002 0.25 0.03
Table 5-11 ANOVA of Unclear-Validation (α = 5 %)
Source of Variation SS df MS F P-value F crit
Between Groups 0.09 3 0.03 0.39 0.76 2.98
Within Groups 2.03 26 0.08
Total 2.12 29
Again, the goal was to test whether the variation between group means is significantly greater than
the variation that occurs within groups, based on the following null hypothesis:
H0: There’s no difference between groups. H1: There exist differences between groups.
As shown in Table 5-11, the F-value, which is 0.39, is known to be smaller than the F-critical value,
which is 2.98. The null hypothesis can therefore not be rejected at the 95 % confidence level.

124
5.4.2.2.2 LSD
The LSD for the Unclear-Validation papers was calculated according to Equation 5-3, where
. Therefore, . The results are
shown in Table 5-12.
Table 5-12 Analysis of the LSD of Unclear-Validation (α = 5 %)
The differences of the means between Group I and Group II on the one hand, and Group III and
Group IV on the other are significant at the 95 % confidence level because they exceed the value of
the LSD. However, we fail to reject hypothesis that there are no differences in the means between
Group II and Group III. Therefore, it cannot be concluded that the trend in the occurrence of Unclear-
Validation papers has been decreasing over the past 34 years. Nonetheless, the comparison of an
additional pair, Group I and Group IV, revealed that the mean of Group IV is significantly smaller
than that of Group I at the 95 % confidence level. A conclusion that can thus be drawn is that the
occurrence of Unclear-Validation papers has improved when Group IV is compared to the groups
representing other periods.
5.5 The Relationship between the Degree of Validation and the Number of
Citations
5.5.1 Introduction
This section explores the question of whether the degree of validation relates to the number of
citations. The comprehensive analysis of the data is twofold: the relationship in a specific category
and the relationship in a specific year. Please note that the searches of examined papers are done with
Scopus, ASCE, etc. while the citation study is done by using Google Scholar, because the information
of citations from Scopus is all included in Google Scholar.
Pair of Groups Difference Larger than LSD?
I and II -0.0711 Yes
II and III -0.0081 No
III and IV -0.1306 Yes
I and IV -0.1938 Yes

125
5.5.2 The Relationship in a Specific Category
5.5.2.1 Qualified Categories
The qualified categories must meet two requirements as follows:
The category contains an adequate number of articles, i.e. around or more than 40 articles.
The number of articles reporting validations and the number of articles reporting validations
that were unclear are close. In other words, the percentage of unclear-validation papers is
required to be close to 50%.
These two requirements aim to minimize the adverse impacts caused by problems of small sample
size. For a study that has a sample size which is too small it is possible to turn out inconclusive results.
Screened by the requirements, two qualified categories are Constructability and Factors. The
Constructability category contains 43 papers and the percentage of unclear-validation papers is
52.27 %. The Factors category contains 40 papers and the percentage of unclear-validation papers is
40%.
5.5.2.2 Results
Table 5-13 presents the number of citations of each paper in the Constructability category. Table 5-14
presents the number of citations of each paper in the Factors category. Papers in Group I reported
validations that were unclear and papers in Group II reported validation methodologies that were
clear.

126
Table 5-13 Number of Citations in the Constructability Category
Group I Group II
Year
Code
Name
Number of
Citations Year
Code
Name
Number of
Citations
2012 CN-3 2 2012 CN-1 1
2011 CN-4 5 2012 CN-2 1
2011 CN-8 9 2011 CN-5 0
2010 CN-11 36 2011 CN-6 0
2010 CN-12 16 2011 CN-7 0
2009 CN-13 7 2010 CN-9 0
2007 CN-16 27 2010 CN-10 0
2005 CN-19 17 2009 CN-14 26
2005 CN-21 21 2008 CN-15 3
2004 CN-22 7 2006 CN-17 14
2004 CN-23 1 2006 CN-18 24
2004 CN-24 5 2005 CN-20 38
2004 CN-26 4 2004 CN-25 17
1994 CN-31 18 2002 CN-27 61
1993 CN-33 15 2001 CN-28 71
1993 CN-34 1 1994 CN-29 19
1993 CN-36 24 1994 CN-30 28
1991 CN-38 19 1994 CN-32 33
1988 CN-39 55 1993 CN-35 12
1987 CN-40 70 1991 CN-37 55
1987 CN-41 8
1986 CN-42 49
1986 CN-43 23

127
Table 5-14 Number of Citations in the Factors Category
Group I Group II
Year Code
Name
Number of
Citations Year
Code
Name
Number of
Citations
2012 FC-2 0 2013 FC-1 1
2011 FC-4 8 2012 FC-3 0
2011 FC-7 0 2011 FC-5 4
2010 FC-8 1 2011 FC-6 10
2010 FC-9 7 2009 FC-10 4
2009 FC-12 13 2009 FC-11 6
2009 FC-13 5 2009 FC-16 2
2009 FC-14 1 2008 FC-17 26
2009 FC-15 5 2007 FC-18 4
2006 FC-20 8 2007 FC-19 33
2005 FC-24 12 2005 FC-21 0
2004 FC-25 0 2005 FC-22 45
2004 FC-27 2 2005 FC-23 49
2002 FC-29 15 2004 FC-26 22
1998 FC-30 19 2003 FC-28 79
1990 FC-35 25 1996 FC-31 69
1987 FC-37 16 1995 FC-32 72
1995 FC-33 102
1992 FC-34 49
1989 FC-36 89
1986 FC-38 74
1985 FC-39 66
1980 FC-40 253

128
In order to explore the relationship between the degree of validation and the number of citations,
scatter-charts are plotted in Figure 5-21 and 5-22.
Figure 5-21 Number of Citations in the Constructability Category
Figure 5-22 Number of Citations in the Factors Category
05
1015202530354045505560657075
1985 1987 1989 1991 1993 1995 1997 1999 2001 2003 2005 2007 2009 2011 2013
Nu
mb
er
of
Cit
atio
ns
Year
UnclearValidation
Clear Validation
Linear (UnclearValidation)
Linear (ClearValidation)
0
20
40
60
80
100
120
140
160
180
200
220
240
260
1980 1983 1986 1989 1992 1995 1998 2001 2004 2007 2010 2013
Nu
mb
er
of
Cit
atio
ns
Year
UnclearValidation
Clear Validation
Linear (UnclearValidation)
Linear (ClearValidation)

129
In both figures, the trend lines indicate that the number of citations is positively related to the degree
of validations before the year 2010. After 2010, the relationship is negative, which is mainly because
of the impacts of time. The articles after 2010 are too new to get enough number of citations.
In Figure 5-21, we find that a few articles before 90s reporting validations that were unclear have a
very large number of citations. This is because those articles focused on concepts related to the topics
of constructability and the authors of those articles have a relatively high reputation. From my
perspective, authors like me, who begin to do research in areas of constructability, would like to cite
their articles in order to get a comprehensive literature review. In sum, we can draw the conclusion
that in a specific category, the stronger the validation is, the larger the number of citations is.
5.5.3 The Relationship in a Specific Year
5.5.3.1 Qualified Years
The qualified years must meet two requirements similar to the ones of categories:
The number of articles in the specific year must be around or more than 40.
The number of articles reporting validations and the number of articles reporting validations
that were unclear are close. In other words, the percentage of unclear-validation papers is
required to be close to 50%.
These two requirements are for the same reasons as the ones for categories. Screened by the
requirements, only the year 2010 is qualified. There are 45 papers in the year 2010 and the percentage
of unclear-validation papers is 47.06 %.
5.5.3.2 Results
Table 5-15 presents the number of citations of each paper in the year 2010. Papers in Group I reported
validations that were unclear and papers in Group II reported clear validation methodologies.

130
Table 5-15 Citation Numbers of Each Article in Year 2010
Group I Group II
Code Name
Number of
Citations Code Name
Number of
Citations
CN-11 36 CN-9 0
CN-12 16 CN-10 0
ZA-18 3 ZA-16 4
ZA-21 0 ZA-17 5
ZA-22 0 ZA-19 5
ZA-24 4 ZA-20 0
RL-11 6 ZA-23 5
AL-9 6 RL-9 10
AL-10 27 RL-10 21
RM-17 7 RL-12 4
RM-19 4 AL-8 2
RM-20 2 KM-9 0
CP-14 4 KM-10 25
CP-15 4 RM-16 6
CP-19 3 RM-18 85
CP-20 1 RM-21 4
CP-21 1 CP-16 1
CP-22 7 CP-17 0
CP-26 20 CP-18 3
CP-28 4 CP-23 8
CT-2 1 CP-24 6
FC-8 1 CP-25 21
FC-9 7 CP-27 4
TC-25 35 SL-2 3
SL-3 2
TC-26 0
TC-27 6
The ANOVA tables that were generated with the use of the Excel Analysis Tool Package are
shown in Tables 5-16 and 5-17.
Table 5-16 Summary of the Number of Citations in Each Group
Groups Count Sum Average Variance
Group I 24 199 8.29 112.22
Group II 27 230 8.52 277.33
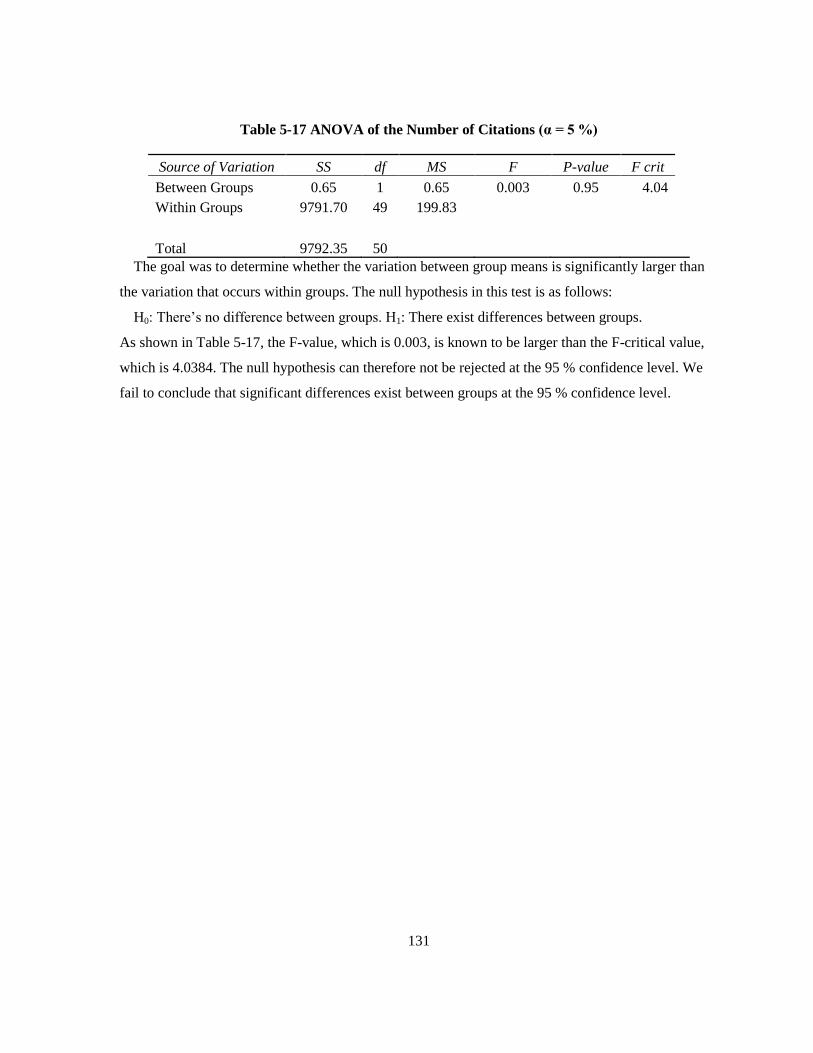
131
Table 5-17 ANOVA of the Number of Citations (α = 5 %)
Source of Variation SS df MS F P-value F crit
Between Groups 0.65 1 0.65 0.003 0.95 4.04
Within Groups 9791.70 49 199.83
Total 9792.35 50
The goal was to determine whether the variation between group means is significantly larger than
the variation that occurs within groups. The null hypothesis in this test is as follows:
H0: There’s no difference between groups. H1: There exist differences between groups.
As shown in Table 5-17, the F-value, which is 0.003, is known to be larger than the F-critical value,
which is 4.0384. The null hypothesis can therefore not be rejected at the 95 % confidence level. We
fail to conclude that significant differences exist between groups at the 95 % confidence level.

132
Chapter 6
Barriers to the Application of Meta-Analysis in CEM
6.1 Introduction
As mentioned in Section 2.7, meta-analysis is defined as the systematic statistical analysis of a
number of individual results from studies of the same topic and for the same purpose. As shown in
Table 2-1, meta-analysis has been used in numerous applications in education, human resources,
medical science, physics, and psychology because more scientific and objective conclusions can be
derived from meta-analysis than from traditional literature reviews. However, the examination of 365
papers for the research presented in this thesis revealed no examined papers that described the
application of meta-analysis. Even in a broader search in CEM, the only known example of meta-
analysis we can find, which is not a part in the sample, is the one written by Horman and Kenley
(2005). These are clear indications of the existence of barriers to the application of meta-analysis in
construction engineering and management (CEM). The following sections present a discussion of
each of these barriers.
6.2 Coding Process
To create a suitable dataset for meta-analysis, researchers must code the studies. Systematic coding is
an important preparation for measuring the effect size, which refers to the process of extracting the
information from the literature included in the meta-analysis. A well-designed coding process helps
researchers establish effective descriptions of the characteristics of the studies so that they can
conduct a comprehensive comparison and synthesis of the articles. The coding process also enables
readers to understand the detailed procedures used by the researchers, which makes the research
replicable.
Coding the literature involves several steps: first, select suitable characteristics; second, develop a
code book, which is similar to a dictionary, in which the details of each characteristic are recorded;
third, conduct a few training sessions for at least two coders before the literature is coded. Coders
must work on the coding process independently so that the second coder can check the calculations of
the effect size.
133
Considering all the requirements the coding process entails, the second and third steps are not
simple, and the writing of a code book and the training sessions are quite time-consuming. As well,
because the coding process requires two or more coders, the author needs at least one extra person to
help with the coding process.
6.3 Data Source
In contrast to conditions in fields such as education, human resources, medical science, etc., finding
consistent data from past CEM research is difficult, given the wide range of detailed content that can
be related to a topic. For example, a goal might be to study the impact of constructability on
construction projects. Only 5 of the 43 papers in the Constructability category include data sets to
which statistical analysis can be applied. In addition, the data-sets in each paper are focused on
different aspects of constructability so that the data cannot be combined. In contrast, in medical
science literature, it is easier to find consistent data related to a comparison of the effects within and
without a specific aspect of medicine. Establishing control groups and treated groups for construction
projects is also difficult in CEM because contractors are unwilling to take risks that might jeopardize
their projects. For example, normally they will not try a new method of contract delivery unless it has
already been proven successful.
6.4 Summary
In summary, the barriers to the application of meta-analysis in CEM are twofold: the difficulty
involved in coding the studies and the challenge of finding suitable data-sets. To solve these two
problems, adequate preparation is required at the very beginning of the research, for example, finding
at least two or more researchers to participate in the study. The literature review must also be
expanded so that an attempt is made to find additional papers related to the same topic.
134
Chapter 7
Conclusions and Recommendations for Future Research
7.1 Introduction
The primary goal of this research was to provide assistance for construction engineering and
management (CEM) researchers as well as for students undertaking master’s or doctoral studies in
this area so that they can select appropriate methodologies for the validation of their results. A
comprehensive literature review was conducted in order to help readers acquire an understanding of
the background and importance of choosing appropriate validation methodologies. The review also
illustrated the definitions, features, advantages, and disadvantages of each validation methodology. A
total of 365 CEM papers were examined in order to analyze the distributions of both the validation
methodologies and the source categories, to identify trends in the use of validation methodologies
over the past 34 years and to explore the relationship between the degree of validations and the
number of citations. This chapter summarizes the findings and conclusions and offers
recommendations for future studies.
7.2 Findings and Conclusions
The following are the findings and conclusions of this research.
7.2.1 Findings Related to the Distribution of Validation Methodologies in Each Source
Category
Every source category except Short-Term Scheduling contains papers that didn’t report any rigorous
validation methodology; the sample size of the Short-Term Scheduling category was not large enough
to permit conclusions to be drawn. Studies in the Constructability category were most often validated
with the use of the Case Studies methodology, as were studies in the Knowledge Management and
Zero Accident Techniques categories. The Surveys methodology was also frequently used in the Zero
Accident Techniques category. Papers in the Resource Leveling, Risk Management, Site Layout,
Short-Term Scheduling, Factors, and Technologies categories most often reported validation through
the Functional Demonstration methodology since a number of the papers in those categories were
focused on the development of modeling and simulation, algorithms, and systems. The Surveys
methodology accounts for the highest percentage in the Alignment category and is also commonly

135
applied to studies in the Craft Training category. Another popular methodology in the Craft Training
category is the Empirical Studies methodology, which is also prevalent in the Factors category.
7.2.2 Findings Related to the Distribution of Source Categories in Each Validation
Methodology
Of all the source categories, the Technology category contains the highest percentage of papers that
reported the application of Experimental Studies. With respect to Empirical Studies, the Craft
Training and Factors categories represent the top two categories in which this methodology was
applied. Only one study in the Technologies category applied the Observational Studies methodology.
The Case Studies methodology is dominated by the Zero Accident Techniques and Knowledge
Management source categories. Almost every category included the application of the Surveys
methodology. The exceptions were the Resource Leveling and Site Layout categories, which
represent the dominant areas in which the Functional Demonstration methodology was employed.
With respect to the Archival Data Analysis methodology, the Alignment category contains the highest
percentage of papers that reported this technique, with four other categories also including mention of
its use: Constructability, Zero Accident Techniques, Factors, and Technologies. The Constructability
category contains the highest percentage of studies in which unclear validation methodology was
applied.
7.2.3 Findings Related to Trends in the Usage of Validation Methodologies over the
Past 33 Years
Based on the data acquired from the examination of 365 papers, it can be concluded that the trend in
the use of the Functional Demonstration methodology over the past 34 years has increased
significantly at the 95 % confidence level. This result has been validated using ANOVA and LSD
analysis. Compared to the period from 1980 to 2009, the incidence of Unclear-Validation papers
decreased from 2010 to the present at the 95 % confidence level. However, a continuous decreasing
trend in the number of papers that reported validation methodology that was unclear over the past 34
years cannot be demonstrated because no significant difference exists between the means of the
period from 2000 to 2009 and the period from 1990 to 1999 at the 95 % confidence level.
136
7.2.4 Findings Related to the Relationship between the Degree of Validation and the
Number of Citations
Based on the data acquired from the examination of articles in Constructability and Factors categories,
it can be concluded that the number of citations is positively related to the degree of validations in a
specific category. The result can be observed from the scatter-plotting. However, based on the data
acquired from the examination of articles in the year 2010, we fail to conclude that significant
differences of the number of citations exist between clear-validation group and unclear validation
group at the 95 % confidence level.
7.3 Recommendations for Future Research
The research presented in this thesis has involved the examination of validation methodologies
reported in papers that present CEM research. However, many aspects of the study still need
improvement so that more comprehensive and reliable conclusions can be obtained. The
following possible areas for future research are suggested:
Additional papers should be examined. The research sample size was insufficient due to
the limited time available. The American Society of Civil Engineers published a special
journal issue devoted to CEM research methodologies (Taylor & Jaselskis, 2010). The
issue described the examination of 1102 manuscripts in order to analyze trends in
methodological utilization and rigour. Conclusions based such a large sample size would
be more reliable.
Gaps in the representation of time periods should be filled. In addition to enlarging the
sample size, researchers also need to review papers published during periods for which no
papers or an insufficient number of papers have been included. For this research, none of
the papers collected was published between 1981 and 1984, and only one paper was
published in 1980, one in 1985, two in 1989, and two in 1990. These gaps in the time span
represented by the papers may have created bias that influenced the final results.
CEM applications of meta-analysis need further exploration. The first step would be the
detailed study of a specific topic and the acquisition of the most source data possible. The
ideal research team would be comprised of two or more researchers.

137
References
Archival Data. (2010, Jan. 06). Retrieved March 11, 2013, from University of Virginia:
www.virginia.edu/vpr/irb/HSR_docs/Forms/Archival_Data.doc
Alarcón, L. F., & Calderón, R. (2003). Implementing Lean Production Strategies in Construction
Companies. Construction Research Congress (pp. 312-320). Reston: ASCE.
Andrew, S., & Halcomb, E. J. (2009). Mixed Methods Research for Nursing and the Health Sciences.
Chichester: Wiley-Blackwell Publishing Ltd.
Babbie, E. R. (1973). Survey Research Methods. Belmont, California: Wadsworth Publication.
Bansal, S., & DeStefano, A. (2007). Key Elements of Bioanalytical Method Validation for Small
Molecules. The AAPS Journal , 109-114.
Bernold, L. E., & Lee, T. S. (2010). Experimental Research in Construction. Journal of Construction
Engineering and Management, 26-35.
Burbank, J., Kasch, W., & Ward, J. (2011). An Introduction to Network Modeling and Simulation for
the Practicing Engineer. John Wiley & Sons.
Cerri, S. (2008, Dec.). Engineering v.s. Management. Retrieved 03 15, 2013, from StevenCerri:
http://www.stevencerri.com/Articles_Uploaded/Being_Right_or_Effective-NSPE-by-Steven-
Cerri.pdf
CII. (1986). Constructability: A Primer. Austin, TX: Construction Industry Institute.
CII. (2010). CII Best Practices Guide: Improving Project Performance. Austin, TX: Construction
Industry Institute.
CII: Research Team 252. (2009). Craft Productivity Program - Phase I Research Report. CII.
CII: Research Team 252. (2011). Craft Productivity Program - Phase III Research Report. CII.
CII: Research Team 252. (2013). The Productivity Handbook. CII.
CMAA. (2010). Construction management standards of practice. McLean, VA: Construction
Management Association of America.
Cohen, J. (1977). Statistical Power Analysis for the Behavioral Sciences. Hillsdale, N.J: L. Erlbaum
Associates .
Committee on Construction Change Orders, Building Research Board, National Research Council.
(1986). Construction Contract Modifications: Comparing the Experiences of Federal
Angencies with Other Owners. National Academies.
138
Construction Industry Institute. (1988). The Effect of Scheduled Overtime and Shift Scheduled on
Construction Craft Productivity. Construction Industry Institute.
Creswell, J. W. (2009). Research design : qualitative, quantitative, and mixed methods approaches .
Thousand Oaks, California: Sage Publications .
Dai, J., Goodrum, P. M., Maloney, W. F., & Srinivasan, C. (2009). Latent Structures of the Factors
Affecting Construction Labor Productivity. Journal of Construction Engineering and
Management, 397-406.
Denzin, N. K., & Lincoln, Y. S. (1944). Handbook of Qualitative Research. Thousand Oaks : Sage
Publications .
DiNardo, J. (2008). The New Palgrave Dictionary of Economics . Basingstoke, Hampshire : Palgrave
Macmillian .
Easterbrook, S. (2001). CSC444F: Software Engineering I. Retrieved Feb. 16, 2013, from University
of Toronto: http://www.cs.toronto.edu/~sme/CSC444F/slides/L08-Testing.pdf
EMEA. (2006). Validation of Analytical Procedures. London: European Medicines Agency.
Fellows, R., & Liu, A. (2008). Research Methods for Construction. Oxford: Wiley-Blackwell .
Flood, I., & Issa, R. R. (2010). Empirical Modeling Methodologies for Construction. Journal of
Construction Engineering and Management, 36-48.
Glaser, B. G. (1967). The discovery of grounded theory: Strategies for qualitative research. Chicago:
Aldine Publication.
Glass, G. V. (1976). Primary, Secondary and Meta-analysis of Research. Educational Researcher,
351-379.
Glass, G. V. (1981). Meta-analysis in Social Research . Beverly Hills, Calif.: Sage Publications.
Glass, G. V. (1981). Meta-analysis in Social Research. Beverly Hills, Calif.: Sage Publications.
Goldacre, B. (2010). Bad Science. New York : Faber and Faber .
Green, B. F., & Hall, J. A. (1984). Quantitative Methods for Literature Reviews. Annual Review of
Psychology, 37-54.
Groves, R. M. (1989). Survey Erros and Survey Costs. Hoboken: Wiley-Interscience .
Hammersly, M., & Gromm, R. (1997). Bias in social research. Retrieved Feb. 22, 2013, from
Sociological Research Online: http://socresonline.org.uk/2/1/2.html
Hanna, A. S., Camlic, R., Peterson, P. A., & Nordheim, E. V. (2002). Quantitative Definition of
Projects Impacted by Change Orders. Journal of Construction Engineering and Management,
Vol. 128, No. 1.
139
Hanna, A. S., Chang, C.-K., Lackney, J. A., & Sullivan, K. T. (2005). Overmanning Impact on
Construction Labor Productivity. Construction Research Congress. American Society of
Civil Engieers.
Hanna, A. S., Chang, C.-K., Sullivan, K. T., & Lackney, J. A. (2008). Impact of Shift Work on Labor
Productivity for Labor Intensive Contractor. Journal of Construction Engineering and
Management, Vol. 134, No.3.
Hanna, A. S., Menches, C. L., Sullivan, K. T., & Sargent, J. R. (2005). Factors Affecting the
Absenteeism in Electrical Construction. Journal of Construction Engineering and
Management, Vol. 131, No. 11.
Horman, M., & Kenley, R. (2005). Quantifying Levels of Wasted Time in Construction with Meta-
Analysis. Journal of Construction Engineering and Management, 52-61.
Hornby, A. S., Gatenby, E. V., & Wakefield, H. (1963). The Advanced Learner's Dictionary of
Current English. London: Oxford University Press .
Indrayan, A. (2008). Basic Methods of Medical Research. Delhi: A.I.T.B.S. Publishers.
Jackson, B. J. (2010). Construction Management JumpStart. San Francisco, CA : Sybex.
Koulinas, G. K., & Anagnostopoulos, K. P. (2012). Construction Resource Allocation and Leveling
Using a Threshold Accepting–Based Hyperheuristic Algorithm. Journal of Construction
Engineering and Management, 854-863.
Leedy, P. D. (1980). Practicle Research: Planning and Design. New York: Macmillan.
Leicht, R. M., Hunter, S. T., Saluja, C., & Messner, J. I. (2010). Implementing Observational
Research Methods to Study Team Performance in Construction Management. Journal of
Construction Engineering and Management, 76-86.
Lucko, G., & Mitchell, Z. W. (2010). Quantitative Research: Preparation of Incongruous Economic
Data Sets for Archival Data Analysis. Journal of Construction Engineering and Management,
49-57.
Lucko, G., & Rojas, E. M. (2010). Research Validation: Challenges and Opportunities in the
Construction Domain. Journal of Construction Engineering and Management, 127-135.
Maria, A. (1997). Introduction to Modeling and Simulation. Proceedings of the 1997 Winter
Simulation Conference (pp. 7-13). Atlanta: The Winter Simulation Conferences.
Mitchell, Z. W. (1998, April 24). Index of Public Theses. Retrieved March 11, 2013, from Digitral
Library and Archives: http://scholar.lib.vt.edu/theses/public/etd-32998-
134834/materials/zmitchel.pdf

140
Ommeren, J. v., & Gutièrrez-i-Puigarnau, E. (2009). Are workers with a long commute less
productive? An empirical analysis of absenteeism. Tinbergen Institute Discussion Paper .
Petty, M. D. (2009). Verification and Validation. In J. A. Sokolowski, & C. M. Banks, Principles of
Modeling and Simulation (pp. 121-149). Hoboken, N.J.: John Wiley .
Popper, K. R. (1965). Conjectures and Refutations: The Growth of Scientific Knowledge. . New York:
Basic Books.
Rajasekar, S., Philominathan, P., & Chinnathambi, V. (2006, Jan. 25). Research Methodology.
Retrieved Feb. 19, 2013, from Cornell University Library:
http://arxiv.org/pdf/physics/0601009.pdf
Rivas, R. A., Borcherding, J. D., González, V., & Alarcón, L. F. (2011). Analys is of Factors
Influencing Productivity Using Craftsmen Questionnaires: Case Study in a Chilean
Construction Company. Journal of Construction Engineering and Management, 312-320.
RT 252-c. (2010). CII Best Practices Productivity Improvement Index. Austin, Texas: CII.
Sapsford, R. (2007). Survey Research. London ; Thousand Oaks, Calif.: Sage Publications .
Schatteman, D., Herroelen, W., Vonder, S. V., & Boone, A. (2006). Methodology for Integrated Risk
Management and Proactive Scheduling of Construction Projects. Journal of Construction
Engineering and Management, 885-893.
Schwartzkopf, W. (2004). Calculating Lost Labor Productivity in Construction Claims. Aspen
Publishers.
Stake, R. E. (1995). The Art of Case Study Research. Thousand Oaks: Sage Publications.
Taylor, J. E., & Jaselskis, E. J. (2010). Introduction to the Special Issue on Research Methodologies
in Construction Engineering and Management. Journal of Construction Engineering and
Management, 1-2.
The U.S. Army Corps of Engineers. (July 1979). Modification Impact Evaluation Guide.
Thomas, H. R. (2009, Feberuary). Construction Learning Curves. Practice Periodical on Structural
Design and Construction, pp. 14-20.
Thomas, H. R., & Raynar, K. A. (1997). Scheduled Overtime and Labor Productivity: Quantitative
Analysis. Journal of Construction Engineering and Management, Vol. 123, No.2.
Thomas, H. R., Riley, D. R., & Sinha, S. K. (2006, Nov. 1). Fundamental Principles for Avoiding
Congested Work Areas—A Case Study. Practice Periodical on Structural Design and
Construction, pp. 197-205.
141
Thomas, H. R., Sanvido, V. E., & Sanders, S. R. (1989). Impact of Material Management on
Productivity- A Case Study. Journal of Construction Engineering and Management, 370-384.
Thomas, J. R., Nelson, J. K., & Silverman, S. J. (2011). Research Methods in Physical Activity.
Champaign, IL: Human Kinetics .
Thompson, J. R. (1989). Empirical Model Building. New York: Wiley Publications.
Waldron, A. J. (1968). Applied Principles of Project Planning and Control. Haddonfield, Englewood
Cliffs, N.J.
Wang, Y., Goodrum, P. M., Haas, C. T., & Glover, R. W. (2008). Craft Training Issues in American
Industrial and Commercial Construction. Journal of COnstruction Engineering and
Management, 795-803.
Wikipedia. (2011, July 29). Project Delivery Method. Retrieved March 25, 2013, from Wikipedia:
http://en.wikipedia.org/wiki/Project_delivery_method
Wikipedia. (2012). Psychology. Retrieved Feb. 16, 2013, from Wikipedia:
http://en.wikipedia.org/wiki/Psychology#Research_methods
Wikipedia. (2013, Feb. 25). Construction Engineering. Retrieved March 16, 2013, from WIikipedia:
http://en.wikipedia.org/wiki/Construction_engineering
Wikipedia. (2013, Jan. 29). Empirical Research. Retrieved Feb. 25, 2013, from Wikipedia:
http://en.wikipedia.org/wiki/Empirical_research
Wikipedia. (2013, Feb. 19). Experiments. Retrieved Feb. 22, 2013, from Wikipedia:
http://en.wikipedia.org/wiki/Experiment
Wikipedia. (2013, Jan. 20). Search engine (computing). Retrieved March 29, 2013, from Wikipedia:
http://en.wikipedia.org/wiki/Search_engine_%28computing%29
Wikipedia. (2013, Feb. 25). Survey Methodology. Retrieved March 4, 2013, from Wikipedia:
http://en.wikipedia.org/wiki/Survey_methodology
Wolf, F. M. (1986). Meta-analysis: Quantitative Methods for Research Synthesis. Beverly Hills,
Calif.: Sage Publications.
Wood, C., & Alvarez, M. (2005). Emerging Construction Technologies. Gaithersburg: National
Institute of Standards and Technology.
Yin, R. K. (1989). Case Study Research: Design and Methods. Newbury Park: Sage Publications .
Yin, R. K. (2003). Case Study Research: Design and Methods (3rd ed). Thousand Oaks: Sage
Publications.

142
Zhai, D., Goodrum, P. M., Haas, C. T., & Caldas, C. H. (2009). Relationship between Automation
and Integration of Construction Information Systems and Labor Productivity. Journal of
Construction Engineering and Management, 746-753.

143
Appendix A
Source of Examined Articles
# Name of Journals
1 Automation in Construction
2 Advanced Engineering Informatics
3 Advanced Materials Research
4 Annual ARCOM Conference
5 Applied Mechanics and Materials,
6 Architectural Science Review
7 Automation and Robotics in Construction
8 Building and Environment
9 Canadian Journal of Civil Engineering
10 Computer Modeling and New Technologies
11 Computing in Civil and Building Engineering
12 Construction and Building Materials
13 Construction Management & Economics
14 Construction Management and Economics
15 Construction Research Congress
16 Cost Engineering
17 Engineering Applications of Artificial Intelligence,
18 Journal of Architectural Engineering
19 Journal of Bridge Engineering
20 Journal of Civil Engineering and Management
21 Journal of Computing in Civil Engineering
22 Journal of Construction Engineering and Management
23 Journal of Energy Engineering
24 Journal of Engineering Design
25 Journal of Information Technology in Construction
26 Journal of Legal Affairs and Dispute Resolution in Engineering and Construction
27 Journal of Management in Engineering
28 Journal of Performance of Constructed Facilities
29 Journal of Professional Issues in Engineering
30 Journal of Urban Planning and Development
31 Journal of Water Resources Planning and Management

144
32 Leadership and Management in Engineering
33 Manufacturing Engineer
34 Natural Hazards Review
35 New Research on Knowledge Management
36 Ports 2010: Building on the Past, Respecting the Future
37 Practice Periodical on Structural Design and Construction
38 Scandinavian Journal of Work, Environment & Health
39 The Revay Report
40 Tinbergen Institute Discussion Paper
41 Tsinghua Science & Technology
42 Vulnerability, Uncertainty, and Risk
145
Appendix B
Bibliography of Examined Articles
AL-1: Elbarkouky, MMG, & Fayek, A. (2010a). Fuzzy similarity consensus model for early
alignment of construction project teams on the extent of their roles and responsibilities. Journal
of Construction Engineering and Management, (JUNE), 432–440.
doi:10.1061/(ASCE)CO.1943-7862.0000310.
AL-2: Chinowsky, P., Taylor, J. E., & Marco, M. Di. (2011). Project network interdependency
alignment: new approach to assessing project effectiveness. Journal of Management in
Engineering, (July), 170–178. doi:10.1061/(ASCE)ME.1943-5479
AL-3: Hartmann, T. (2011). Goal and process alignment during the implementation of decision
support systems by project teams. Journal of Construction Engineering and Management,
(December), 1134–1141. doi:10.1061/(ASCE)CO.1943-7862.0000389.
AL-4: Deshpande, A., Salem, O., & Miller, R. (2011). Analysis of the higher-order partial correlation
between CII Best Practices and performance of the design phase in fast-track industrial projects.
Journal of Construction Engineering and Management, (June), 716–724.
doi:10.1061/(ASCE)CO.1943-7862.0000487.
AL-5: Rahman, M., & Kumaraswamy, M. (2011). Multicountry Perspectives of Relational
Contracting and Integrated Project Teams. Journal of Construction Engineering and
Management, (April), 469–480. doi:10.1061/(ASCE)CO.1943-7862.0000463.
AL-6: Fawzy, S., & El-adaway, I. (2011). Contract administration guidelines for managing conflicts,
claims, and disputes under World Bank–funded projects. Journal of Legal Affairs and Dispute
Resolution in Engineering and Construction, (November), 101–110.
doi:10.1061/(ASCE)LA.1943-4170.0000091.
AL-7: Markert, C. D. (2011). Partnering: What must be done to avoid failure. Leadership and
Management in Engineering, 11(2), 155–161. doi:10.1061/(ASCE)LM.1943-5630.0000115
AL-8: Elbarkouky, M, & Fayek, A. (2010). Assessment of responsibilities of project teams for owner
managing contractor tasks—A fuzzy consensus approach. Construction Research Congress.
Retrieved from http://ascelibrary.org/doi/abs/10.1061/41109(373)85
AL-9: Ding, Z., & Ng, F. (2010). Personal construct-based factors affecting interpersonal. Journal of
Construction Engineering and Management, (February), 227–234.

146
AL-10: Chinowsky, P. S., Diekmann, J., & Brien, J. O. (2010). Project organizations as social
networks. Journal of Construction Engineering and Management, (April), 452–458.
AL-11: Tang, W., Qiang, M., & Duffield, C. (2009). Enhancing total quality management by
partnering in construction. Journal of Professional Issues in Engineering, (October), 129–141.
Retrieved from http://ascelibrary.org/doi/abs/10.1061/(ASCE)1052-3928(2009)135:4(129)
AL-12: Le, T., & Caldas, C. (2009). Assessing scope and managing risk in the highway project
development process. Journal of Construction Engineering and Management, (September), 900–
910. Retrieved from http://ascelibrary.org/doi/pdf/10.1061/(ASCE)CO.1943-7862.0000052
AL-13: Nasr, Z., & Menches, C. (2009). Aligning pre-construction planning and project management
in the elelectrical construction industry. Construction Research Congress, 796–805. Retrieved
from http://link.aip.org/link/ascecp/v339/i41020/p81/pdf&KEY=FREESR
AL-14: Ioannidou, D., & Fruchter, R. (2009). Predictive simulation as a decision support system to
manage A/E/C global teamwork. Computing in Civil Engineering, (Thompson 1967), 562–571.
AL-15: Anvuur, A., & Kumaraswamy, M. (2007). Conceptual model of partnering and alliancing.
Journal of Construction Engineering and Management, (March), 225–234. Retrieved from
http://ascelibrary.org/doi/abs/10.1061/(ASCE)0733-9364(2007)133:3(225)
AL-16: Fong, P., & Lung, B. (2007). Interorganizational teamwork in the construction industry.
Journal of Construction Engineering and Management, (February), 157–168. Retrieved from
http://ascelibrary.org/doi/pdf/10.1061/(ASCE)0733-9364(2007)133%3A2(157)
AL-17: Schaufelberger, J. (2000). Strategies for successful partnering relationships. Construction
Congress VI, (Lewis 1998), 463–470. Retrieved from
http://link.aip.org/link/ascecp/v278/i40475/p50/s1
AL-18: Bower, D., Ashby, G., Gerald, K., & Smyk, W. (2002). Incentive mechanisms for project
success. Journal of Management in Engineering, (January), 37–43. Retrieved from
http://ascelibrary.org/doi/abs/10.1061/(ASCE)0742-597X(2002)18:1(37)
AL-19: Cheng, E., & Li, H. (2002). Construction partnering process and associated critical success
factors: quantitative investigation. Journal of management in engineering, (October), 194–202.
Retrieved from http://ascelibrary.org/doi/abs/10.1061/(ASCE)0742-597X(2002)18:4(194)
AL-20: Spatz, D. (2000). Team-building in construction. Periodical on Structural Design and
Construction, (August), 93–105. Retrieved from
http://ascelibrary.org/doi/abs/10.1061/(ASCE)1084-0680(2000)5:3(93)

147
AL-21: Spatz, D. (1999). Leadership in the construction industry. Practice Periodical on Structural
Design and Construction, (MAY), 64–68. Retrieved from
http://ascelibrary.org/doi/abs/10.1061/(ASCE)1084-0680(1999)4%3A2(64)
AL-22: Thompson, P. J., & Sanders, S. R. (1998). Partnering Continuum. Journal of Management in
Engineering, (October), 73–78.
CN-1: Jarkas, A. (2012). Analysis and measurement of buildability factors influencing rebar
installation labor productivity of in situ reinforced concrete walls. Journal of Architectural
Engineering, (MARCH), 52–60. doi:10.1061/(ASCE)AE.1943-5568.0000043.
CN-2: Taylor, T., & Uddin, M. (2012). Change orders and lessons learned: knowledge from statistical
analyses of engineering change orders on Kentucky Highway Projects. Journal of Construction
Engineering and Management, (December), 1360–1369. doi:10.1061/(ASCE)CO.1943-
7862.0000550.
CN-3: Björnfot, A., & Stehn, L. (2007). A design structural matrix approach displaying structural and
assembly requirements in construction: a timber case study. Journal of Engineering Design,
18(2), 113–124. doi:10.1080/09544820600664721
CN-4: Jarkas, A., & Bitar, C. (2011). Factors affecting construction labor productivity in Kuwait.
Journal of Construction Engineering and Management, (July), 811–820.
doi:10.1061/(ASCE)CO.1943-7862.0000501.
CN-5: Deshpande, A., Salem, O., & Miller, R. (2011). Analysis of the higher-order partial correlation
between CII Best Practices and performance of the design phase in fast-track industrial projects.
Journal of Construction Engineering and Management, (June), 716–724.
doi:10.1061/(ASCE)CO.1943-7862.0000487.
CN-6: Sharafbayani, M., & Linzell, D. (2011). Effect of temporary shoring location on horizontally
curved steel I-girder bridges during construction. Journal of Bridge Engineering, (June), 537–
546. doi:10.1061/(ASCE)BE.1943-5592.0000269.
CN-7: Sullivan, K. T., & Michael, J. K. (2011). Performance measurement approach to contracting
and delivering design services. Journal of Professional Issues in Engineering & Practice,
(October), 248–257. doi:10.1061/(ASCE)EI
CN-8: Wong, F. W. H., De Saram, D. D., Lam, P. T. I., & Chan, D. W. M. (2006). A compendium of
buildability issues from the viewpoints of construction practitioners. Architectural Science
Review, 49(1), 81–90. doi:10.3763/asre.2006.4910
148
CN-9: Song, Yuanbin, CHUA, D. K. H., & Hu, H. (2010). Spatio-temporal analysis for improving
constructability of transportation projects. ICCTP 2010, 189–200.
CN-10: Milberg, C. T., & Tommelein, I. D. (2010). Tolerance and constructability of soldier piles in
slurry walls. Journal of Performance of Constructed Facilities, (April), 120–127.
CN-11: Dossick, C. S., & Neff, G. (2010). Organizational divisions in BIM-enabled commercial
construction. Journal of Construction Engineering and Management, (April), 459–467.
CN-12: Eldin, N. (1999). Impact of employee, management, and process issues on constructability
implementation. Construction Management & Economics, (December 2012), 37–41. Retrieved
from http://www.tandfonline.com/doi/full/10.1080/014461999371051
CN-13: Tuholski, S., & Gursel, A. (2009). “Lean” comparison using process charts of complex
seismic retrofit projects. Journal of Construction Engineering and Management, (April), 330–
339. Retrieved from http://ascelibrary.org/doi/abs/10.1061/(ASCE)0733-9364(2009)135:4(330)
CN-14: Song, L., Mohamed, Y., & AbouRizk, S. (2009). Early contractor involvement in design and
its impact on construction schedule performance. Journal of Management in Engineering,
(January), 12–20. Retrieved from http://ascelibrary.org/doi/abs/10.1061/(ASCE)0742-
597X(2009)25:1(12)
CN-15: Goodrum, Paul, & Smith, A. (2008). Case study and statistical analysis of utility conflicts on
construction roadway projects and best practices in their avoidance. Journal of Urban Planning
and Development, (June), 63–70. Retrieved from
http://ascelibrary.org/doi/abs/10.1061/(ASCE)0733-9488(2008)134:2(63)
CN-16: Lam, P., & Chan, A. (2007). Constructability rankings of construction systems based on the
analytical hierarchy process. Journal of Architectural Engineering, (March), 36–43. Retrieved
from http://ascelibrary.org/doi/pdf/10.1061/(ASCE)1076-0431(2007)13%3A1(36)
CN-17: Trigunarsyah, B. (2007). Project designers’ role in improving constructability of Indonesian
construction projects. Construction Management and Economics, 25(2), 207–215.
doi:10.1080/01446190600830649
CN-18: Pulaski, M., Horman, M., & Riley, D. (2006). Constructability practices to manage
sustainable building knowledge. Journal of Architectural Engineering, (June), 83–92. Retrieved
from http://ascelibrary.org/doi/abs/10.1061/(ASCE)1076-0431(2006)12%3A2(83)
CN-19: Pocock, J., & Kuennen, S. (2006). Constructability state of practice report. Journal of
Construction Engineering and Management, (April), 373–383. Retrieved from
http://ascelibrary.org/doi/abs/10.1061/(ASCE)0733-9364(2006)132:4(373)

149
CN-20: Pulaski, M., & Horman, M. (2005). Organizing constructability knowledge for design.
Journal of Construction Engineering and Management, (August), 911–919. Retrieved from
http://ascelibrary.org/doi/pdf/10.1061/(ASCE)0733-9364(2005)131%3A8(911)
CN-21: Tatum, C. (2005). Building better: technical support for construction. Journal of Construction
Engineering and Management, (January), 23–32. doi:10.1061/(ASCE)0733-9364(2005)131
CN-22: Staub-French, S. (2003). Providing cost and constructability feedback to designers.
Construction Research Congress, 1–8. Retrieved from
http://ascelibrary.org/doi/pdf/10.1061/40671(2003)18
CN-23: Goodrum, PM, Hancher, D., & Yasin, M. (2003). A review of constructability barriers and
issues in highway construction. Construction Research Congress, 1–9. Retrieved from
http://ascelibrary.org/doi/pdf/10.1061/40671(2003)14
CN-24: Song, Y, & Chua, D. (2004). POST: Product oriented scheduling technique for
constructability analysis. Computing in Civil Engineering, (2002). Retrieved from
http://link.aip.org/link/ascecp/v123/i40652/p11/s1
CN-25: Ford, D., & Anderson, S. (2004). Managing constructibility reviews to reduce highway
project durations. Journal of Construction Engineering and Management, (February), 33–42.
Retrieved from http://ascelibrary.org/doi/abs/10.1061/(ASCE)0733-9364(2004)130%3A1(33)
CN-26: Chua, D., & Song, Y. (2003). Component state criteria representation to incorporate
construction program knowledge for constructability analysis. Construction Research Congress,
(65), 1–8. Retrieved from http://ascelibrary.org/doi/abs/10.1061/40671(2003)90
CN-27: Arditi, D., Elhassan, A., & Toklu, Y. (2002). Constructability analysis in the design firm.
Journal of Construction Engineering and Management, (April), 117–126. Retrieved from
http://ascelibrary.org/doi/abs/10.1061/(ASCE)0733-9364(2002)128:2(117)
CN-28: Jergeas, G., & Put, J. (2001). Benefits of constructability on construction projects. Journal of
Construction Engineering and Management, (August), 281–290. Retrieved from
http://ascelibrary.org/doi/abs/10.1061/(ASCE)0733-9364(2001)127:4(281)
CN-29: Gugel, J., & Russell, J. (1994). Model for constructability approach selection. Journal of
Construction Engineering and Management, 120(3), 509–521. Retrieved from
http://ascelibrary.org/doi/pdf/10.1061/(ASCE)0733-9364(1994)120%3A3(509)
CN-30: O’Connor, J., & Miller, S. (1994a). Barriers to constructability implementation. Journal of
Performance of Constructed Facilities, 8(2), 110–128. Retrieved from
http://ascelibrary.org/doi/abs/10.1061/(ASCE)0887-3828(1994)8:2(110)

150
CN-31: Russell, J., & Swiggum, K. (1994). Constructability related to TQM, value engineering, and
cost/benefits. Journal of Performance of Constructed Facilities, 8(1). Retrieved from
http://ascelibrary.org/doi/pdf/10.1061/(ASCE)0887-3828(1994)8%3A1(31)
CN-32: O’Connor, J., & Miller, S. (1994b). Constructability programs: Method for assessment and
benchmarking. Journal of Performance of Constructed Facilities, 8(1), 46–64. Retrieved from
http://ascelibrary.org/doi/pdf/10.1061/(ASCE)0887-3828(1994)8%3A1(46)
CN-33: Radtke, M. W., & Russell, J. S. (1994). Project-level model process for implementing
constructability. Journal of Construction Engineering and Management, 119(4), 813–831.
CN-34: O’Connor, J., & Norwich, W. (1993). Fossil power plant constructability: applications of CII
concepts. Journal of Energy Engineering, 119(1), 55–73. Retrieved from
http://ascelibrary.org/doi/abs/10.1061/(ASCE)0733-9402(1993)119:1(55)
CN-35: Russell, J., Gugel, J., & Radtke, M. (1993). Documented constructability savings for
petrochemical-facility expansion. Journal of Performance of Constructed Facilities, 7(1), 27–45.
Retrieved from http://ascelibrary.org/doi/abs/10.1061/(ASCE)0887-3828(1993)7:1(27)
CN-36: Russell, J., & Gugel, J. (1993). Comparison of two corporate constructability programs.
Journal of Construction Engineering and Management, 119(4), 769–784. Retrieved from
http://ascelibrary.org/doi/abs/10.1061/(ASCE)0733-9364(1993)119%3A4(769)
CN-37: Sanders, S., & Thomas, H. (1991). Factors affecting masonry-labor productivity. Journal of
Construction Engineering and Management, 117(4), 626–644. Retrieved from
http://ascelibrary.org/doi/abs/10.1061/(ASCE)0733-9364(1991)117:4(626)
CN-38: Ardery, E. (1991a). Constructability and constructability programs: White paper. Journal of
Construction Engineering and Management, 117(1), 67–89. Retrieved from
http://scholar.google.com/scholar?hl=en&btnG=Search&q=intitle:CONSTRUCTABILITY+AN
D+CONSTRUCTABILITY+PROGRAMS:+white+paper#0
CN-39: O’Connor, J., & Davis, V. (1988). Constructability improvement during field operations.
Journal of Construction Engineering and Management, 114(4), 548–564. Retrieved from
http://ascelibrary.org/doi/abs/10.1061/(ASCE)0733-9364(1988)114:4(548)
CN-40: O’Connor, J., Rusch, S., & Schulz, M. (1987). Constructability concepts for engineering and
procurement. Journal of Construction Engineering and Management, 113(2), 235–248.
Retrieved from http://ascelibrary.org/doi/pdf/10.1061/(ASCE)0733-9364(1987)113%3A2(235)
CN-41: King, R. (1987). Designing plans for constructibility. Journal of Construction Engineering
and Management, 113(1), 1–5. doi:10.1061/(ASCE)0733-9364(1987)113:1(1)

151
CN-42: O’Connor, J., & Tucker, R. (1986). Industrial project constructability improvement. Journal
of Construction Engineering and Management, 112(1), 69–82. Retrieved from
http://ascelibrary.org/doi/abs/10.1061/(ASCE)0733-9364(1986)112%3A1(69)
CN-43: Connor, J. T. O. (1986). Impacts of Constructability Improvement. Journal of Construction
Engineering and Management, I(4), 404–410.
CP-1: Boyd, N., Khalfan, M. M., & Maqsood, T. (2012). Off-Site Construction of Apartment
Buildings. Journal of Architectural Engineering, 19(1), 51-57.
CP-2: Shrestha, P. P., T.O’Connor, J., & Gibson, G. E. (2012). Performance comparison of large
design-build and design-bid-build highway projects. Journal of Construction Engineering and
Management, (January), 1–13. doi:10.1061/(ASCE)CO.1943-7862.0000390.
CP-3: Gokhale, S. (2011). Integrated Project Delivery Method for Trenchless Projects. ICPTT 2011,
604–614. doi:10.1061/41202(423)66
CP-4: Culp, G. (2011). Alternative project delivery methods for water and wastewater projects: Do
They save time and money? Leadership and Management in Engineering, 231–240. Retrieved
from http://ascelibrary.org/doi/pdf/10.1061/(ASCE)LM.1943-5630.0000133
CP-5: Maria‐Sanchez, P., & Cather, R. (2011). Integrating risk management within the project
delivery process at Caltrans: A transportation project case study. Journal of Civil Engineering
and Management, 477–484. Retrieved from
http://ascelibrary.org/doi/pdf/10.1061/41170(400)58
CP-6: Azari-Najafabadi, R., & Ballard, G. (2011). A Dream of Ideal Project Delivery System. AEI
2011, 427–436. Retrieved from http://ascelibrary.org/doi/pdf/10.1061/41168(399)50
CP-7: Kunz, A., & Ballard, H. (2011). Global project delivery systems using BIM. AEI 2011, 472–
479. Retrieved from http://link.aip.org/link/ascecp/v399/i41168/p55/s1
CP-8: Moon, H., & Cho, K. (2011). Selection model for delivery methods for multifamily-housing
construction projects. Journal of Management in Engineering, (April), 106–115.
doi:10.1061/(ASCE)ME.1943-5479.0000038.
CP-9: Swarup, Lipika, Korkmaz, S., & Riley, D. (2011a). Project delivery metrics for sustainable,
high-performance buildings. Journal of Construction Engineering and Management, (December),
1043–1051. doi:10.1061/(ASCE)CO.1943-7862.0000379.
CP-10: Elbarkouky, MMG, & Fayek, A. R. (2010b). Fuzzy preference relations consensus approach
to reduce conflicts on shared responsibilities in the owner managing contractor delivery system.
152
Journal of Construction Engineering and Management, (August), 609–618.
doi:10.1061/(ASCE)CO.1943-7862.0000334.
CP-11: Howell, G. (2010). New operating system for project management: consequences and
opportunities. Journal of Construction Engineering and Management, (October), 882–886.
doi:10.1061/(ASCE)CO.1943-7862.0000323.
CP-12: Touran, A., Gransberg, D. D., Molenaar, K. R., & Ghavamifar, K. (2011). Selection of project
delivery method in transit: Drivers and objectives. Journal of Management in Engineering,
(January), 21–27.
CP-13: Swarup, Lipika, Korkmaz, S., & Riley, D. (2011b). Project delivery metrics for sustainable,
high-performance buildings. Journal of Construction Engineering and Management, (December),
1043–1051. doi:10.1061/(ASCE)CO.1943-7862.0000379.
CP-14: El-adaway, I. (2010). Integrated project delivery case study: Guidelines for drafting partnering
contract. Journal of Legal Affairs and Dispute Resolution in Engineering and Construction,
(November), 248–254. Retrieved from http://ascelibrary.org/doi/pdf/10.1061/(ASCE)LA.1943-
4170.0000024
CP-15: Lancaster, F., & Tobin, J. (2010). Integrated project delivery: next-generation BIM for
structural engineering. Structure Congress, 2809–2818. Retrieved from
http://ascelibrary.org/doi/abs/10.1061/41130(369)254
CP-16: Shane, J. S., & Gransberg, D. D. (2010). A critical analysis of innovations in construction
manager-at-risk project delivery. Construction Research Congress, 827–836.
CP-17: Swarup, L, & Korkmaz, S. (2010). Exploring the validity of qualitative methods to analyze
project delivery of sustainable, high performance buildings. Construction Research Congress,
1427–1436. Retrieved from http://ascelibrary.org/doi/pdf/10.1061/41109(373)143
CP-18: Enache-Pommer, E. (2010). A unified process approach to healthcare project delivery:
synergies between greening strategies, lean principles and BIM. Construction Research
Congress, 1376–1385. Retrieved from http://ascelibrary.org/doi/abs/10.1061/41109(373)138
CP-19: Levitt, R., & Henisz, W. (2010). Governance challenges of infrastructure delivery: the case
for Socio-Economic Governance Approaches. Construction Research Congress, 757–767.
Retrieved from http://ascelibrary.org/doi/abs/10.1061/41109(373)76
CP-20: El-adaway, I. H. (2010). Guidelines for a standard project partnering contract. Construction
Research Congress, 919–928.

153
CP-21: Shaw, R. F. (2010). Intergration of container terminal design and construction with operations
to reduce the project delivery cost and shorten the schedule. Ports 2010: Building on the Past,
Respecting the Future, 1088–1097.
CP-22: Creedy, G. D., Skitmore, M., & Wong, J. K. W. (2010). Evaluation of Risk Factors Leading to
Cost Overrun in Delivery of Highway Construction Projects. Journal of Construction
Engineering and Management, 136(5), 528–537. doi:10.1061/(ASCE)CO.1943-7862.0000160
CP-23: Hammad, A. A., & Ali, S. (2010). Statistical analysis on the cost and duration of public
building projects. Journal of Management in Engineering, (April), 105–112. Retrieved from
http://ascelibrary.org/doi/pdf/10.1061/(ASCE)0742-597X(2010)26%3A2(105)
CP-24: Mostafavi, A., & Karamouz, M. (2010). Selecting appropriate project delivery system: fuzzy
approach with risk analysis. Journal of Construction Engineering and Management, (August),
923–930. Retrieved from http://ascelibrary.org/doi/pdf/10.1061/(ASCE)CO.1943-7862.0000190
CP-25: Korkmaz, S., Riley, D., & Horman, M. (2010). Piloting evaluation metrics for sustainable
high-performance building project delivery. Journal of Construction Engineering and
Management, (August), 877–885.
CP-26: Kent, D., & Becerik-Gerber, B. (2010). Understanding construction industry experience and
attitudes toward integrated project delivery. Journal of Construction Engineering and
Management, (August), 815–825. Retrieved from
http://ascelibrary.org/doi/pdf/10.1061/(ASCE)CO.1943-7862.0000188
CP-27: Klotz, L., & Horman, M. (2010). Counterfactual analysis of sustainable project delivery
processes. Journal of Construction Engineering and Management, 136(5), 595–605.
doi:10.1061/(ASCE)CO.1943-7862.0000148
CP-28: El-adaway, I. (2010). Integrated project delivery case study: Guidelines for drafting partnering
contract. Journal of Legal Affairs and Dispute Resolution in Engineering and Construction,
(November), 248–254. Retrieved from http://ascelibrary.org/doi/pdf/10.1061/(ASCE)LA.1943-
4170.0000024
CP-29: Rosner, J., Jr, A. T., & West, C. (2009). Analysis of the design-build delivery method in air
force construction projects. Journal of Construction Engineering and Management, (August),
710–717. Retrieved from http://ascelibrary.org/doi/pdf/10.1061/(ASCE)CO.1943-7862.0000029
CP-30: Perkins, R. (2009). Sources of changes in design–build contracts for a governmental owner.
Journal of Construction Engineering and Management, (July), 588–593. Retrieved from
http://ascelibrary.org/doi/abs/10.1061/(ASCE)0733-9364(2009)135:7(588)

154
CP-31: Michael, J., Carey, B., & Sullivan, K. (2009). A new approach to contracting design
professionals. Construction Research Congress, 269–278. Retrieved from
http://ascelibrary.org/doi/abs/10.1061/41020(339)28
CP-32: Rahman, M. M., & Kumaraswamy, M. M. (2008). Relational contracting and teambuilding:
assessing potential contractual and noncontractual incentives. Journal of Management in
Engineering, 24(1), 48–63. doi:10.1061/(ASCE)0742-597X(2008)24:1(48)
CP-33: Puerto, C. L. del. (2008). Comparative analysis of owner goals for design/build projects.
Journal of Management in Engineering, (January), 32–39. Retrieved from
http://ascelibrary.org/doi/abs/10.1061/(ASCE)0742-597X(2008)24%3A1(32)
CP-34: Jeffrey, J., & Menches, C. (2008). Emergency contracting strategies for federal projects.
Journal of Professional Issues in Engineering, (October), 371–379. Retrieved from
http://ascelibrary.org/doi/abs/10.1061/(ASCE)1052-3928(2008)134%3A4(371)
CP-35: Rojas, E., & Kell, I. (2008). Comparative analysis of project delivery systems cost
performance in Pacific Northwest public schools. Journal of Construction Engineering and
Management, (June), 387–397. Retrieved from
http://ascelibrary.org/doi/abs/10.1061/(ASCE)0733-9364(2008)134%3A6(387)
CP-36: Aziz, A. M. A. (2008). Successful delivery of public-private oartnerships for infrastructure
development. Journal of Construction Engineering and Management, 133(12), 918–931.
CP-37: Oyetunji, A. A., & Anderson, S. D. (2006). Relative effectiveness of project delivery and
contract strategies. Journal of Construction Engineering and Management, (January), 3–13.
CP-38: Debella, D. C., & Ries, R. (2006). Construction delivery systems: A comparative analysis of
their performance within school districts. Journal of Construction Engineering and Management,
(November), 1131–1138. Retrieved from http://ascelibrary.org/doi/pdf/10.1061/(ASCE)0733-
9364(2006)132%3A11(1131)
CP-39: Kumaraswamy, M., & Ling, F. (2005). Constructing relationally integrated teams. Journal of
Construction Engineering and Management, (October), 1076–1086. Retrieved from
http://ascelibrary.org/doi/abs/10.1061/(ASCE)0733-9364(2005)131:10(1076)
CP-40: Kumaraswamy, M. M., Rahman, M. M., Ling, F. Y. Y., & Phng, S. T. (2005). Reconstructing
cultures for relational contracting. Journal of Construction Engineering and Management,
(October), 1065–1075.
CT-1: Grau, D., & Back, W. (2011). Impact of a construction management educational intervention
on the expertise and work practice of nonconstruction engineers. Journal of Professional Issues
155
in Engineering Education & Practice, (January), 73–85. doi:10.1061/(ASCE)EI.1943-
5541.0000088.
CT-2: Dai, J., & Goodrum, P. (2010). Differences in perspectives regarding labor productivity
between Spanish-and English-Speaking craft workers. Journal of Construction Engineering and
Management, (September), 689–697. doi:10.1061/(ASCE)CO.1943-7862.0000329.
CT-3: Dai, J., Goodrum, P. M., Maloney, W. F., & Srinivasan, C. (2009). Latent structures of the
factors affecting construction labor productivity. Journal of Construction Engineering and
Management, 135(5), 397–406. doi:10.1061/(ASCE)0733-9364(2009)135:5(397)
CT-4: Wang, Y., & Goodrum, P. (2009). Analysis of observed skill affinity patterns and motivation
for multiskilling among craft workers in the US industrial construction sector. Journal of
Construction Engineering and Management, (October), 999–1008. Retrieved from
http://ascelibrary.org/doi/pdf/10.1061/(ASCE)CO.1943-7862.0000072
CT-5: Garrett, J., & Teizer, J. (2009a). Human factors analysis classification system relating to
human error awareness taxonomy in construction safety. Journal of Construction Engineering
and Management, 135(8), 754–763. Retrieved from
http://ascelibrary.org/doi/pdf/10.1061/(ASCE)CO.1943-7862.0000034
CT-6: Alexander, D., Bramati, L., & Simonetta, M. (2009). Emergency preparedness training and
education in Lombardy region, Italy: Survey of supply and demand. Natural Hazards Review,
(August), 77–83. Retrieved from http://ascelibrary.org/doi/abs/10.1061/(ASCE)1527-
6988(2009)10%3A3(77)
CT-7: Wang, Y., & Goodrum, P. (2008). Craft training issues in American industrial and commercial
construction. Journal of Construction Engineering and Management, (October), 795–803.
Retrieved from http://ascelibrary.org/doi/abs/10.1061/(ASCE)0733-9364(2008)134:10(795)
CT-8: Srour, I., Haas, C., & Morton, D. (2006). Linear programming approach to optimize strategic
investment in the construction workforce. Journal of Construction Engineering and Management,
(November), 1158–1166. Retrieved from http://ascelibrary.org/doi/pdf/10.1061/(ASCE)0733-
9364(2006)132%3A11(1158)
CT-9: Canales, A. R., Arbelaez, M., Vasquez, E., Aveiga, F., Strong, K., Walters, R., Jaselskis, E. J.,
et al. (2009). Exploring training needs and development of construction language courses for
American supervisors and Hispanic craft workers. Journal of Construction Engineering and
Management, 135(5), 387–396. doi:10.1061/(ASCE)0733-9364(2009)135:5(387)

156
CT-10: Shiramizu, S., & Singh, A. (2007). Leadership to improve quality within an organization.
Leadership and Management in Engineering, 129–140. Retrieved from
http://ascelibrary.org/doi/pdf/10.1061/(ASCE)1532-6748(2007)7%3A4(129)
CT-11: Dai, J., Goodrum, P., & Maloney, W. (2009). Construction craft workers’ perceptions of the
factors affecting their productivity. Journal of Construction Engineering and Management,
(March), 217–226. Retrieved from http://ascelibrary.org/doi/abs/10.1061/(ASCE)0733-
9364(2009)135:3(217)
CT-12: Castañeda, J. A., Tucker, R. L., & Haas, C. T. (2005). Workers’skills and receptiveness to
operate under the Tier II Construction Management Strategy. Journal of Construction
Engineering and Management, (July), 799–807.
CT-13: Schaufelberger, J. E. (2000). Mechanical Craft Training in Western Washington. Construction
Congress VI, 244–252. doi:10.1061/40475(278)27
CT-14: Castaneda, J. A., Tucher, R. L., Haas, C. T. M., Glover, R. W., & Shields, D. R. (2004). A
revolutionAry and structured approach to construction work force management: The Tier II
Strategy. Construction Research Congress, (1999), 1–8.
CT-15: Kumaraswamy, M. (1997). Improving industry performance through integrated training
programs. Journal of Professional Issues in Engineering, (July), 93–97. Retrieved from
http://ascelibrary.org/doi/abs/10.1061/(ASCE)1052-3928(1997)123%3A3(93)
CT-16: Hinze, J., & Plautz, R. (1988). Positive effects of training, experience, and feedback. Journal
of Management in Engineering, 4(4), 337–344. Retrieved from
http://ascelibrary.org/doi/abs/10.1061/(ASCE)9742-597X(1988)4:4(337)
CT-17: Hopkins, W. E. (1987). Developing planning skills of engineers in management training.
Journal of Management in Engineering, 3(3), 249–256. doi:10.1061/(ASCE)9742-
597X(1987)3:3(249)
FC-1: Yi, W., & Chan, A. P. C. (2013). Optimizing work-rest schedule for construction rebar workers
in hot and humid environment. Building and Rnvironment, (January), 1–10.
FC-2: Nguyen, L., & Nguyen, H. (2012). Relationship between floor number and labor productivity
in multistory structural work: A case study. Construction Research Congress, 1520–1529.
Retrieved from http://ascelibrary.org/doi/pdf/10.1061/9780784412329.153
FC-3: Al-Humaidi, H., & Tan, F. (2011). New approach to model material-related problems
contributing to project delays using rotational fuzzy set. Journal of Performance of Constructed
Facilities, (June), 279–286. doi:10.1061/(ASCE)CF

157
FC-4: Brunies, R., & Emir, Z. (2001). Calculating loss of productivity due to overtime using
published charts—Fact or fiction. The Revay Report, 20(3). Retrieved from
http://scholar.google.com/scholar?hl=en&btnG=Search&q=intitle:Calculating+Loss+of+Produc
tivity+Due+to+Overtime+using+published+charts-fact+or+fiction#0
FC-5: Sichani, M. S. (2011). Understanding construction workforce absenteeism in industrial
construction. Canadian Journal of Civil Engineering, 858(December), 849–858.
doi:10.1139/L11-052
FC-6: Rivas, R., & Borcherding, J. (2010). Analysis of factors influencing productivity using
craftsmen questionnaires: case study in a Chilean construction company. Journal of
Construction Engineering and Management, (April), 312–320. doi:10.1061/(ASCE)CO.1943-
7862.0000274.
FC-7: Long, J., & Jiang, W. A. (2011). Maintenance for Improving Manufacturing Equipments
Availability Using Prognostics and Health Management. Advanced Materials Research, 199-200,
543–547. doi:10.4028/www.scientific.net/AMR.199-200.543
FC-8: Nguyen, L., & Kneppers, J. (2010). Analysis of adverse weather for excusable delays. Journal
of Construction Engineering and Management, (December), 1258–1267. Retrieved from
http://ascelibrary.org/doi/pdf/10.1061/(ASCE)CO.1943-7862.0000242
FC-9: Jarkas, A. (2010). Critical investigation into the applicability of the Learning Curve Theory to
rebar fixing labor productivity. Journal of Construction Engineering and Management,
(December), 1279–1288. Retrieved from
http://ascelibrary.org/doi/pdf/10.1061/(ASCE)CO.1943-7862.0000236
FC-10: Lee, Hyun-soo, Shin, J., Park, M., & Ryu, H. (2009). Probabilistic duration estimation model
for high-rise structural work. Journal of Construction Engineering and Management,
(December), 1289–1298.
FC-11: Jun, D. H., & El-Rayes, K. (2010). Optimizing the utilization of multiple labor shifts in
construction projects. Automation in Construction, 19(2), 109–119.
doi:10.1016/j.autcon.2009.12.015
FC-12: Ommeren, J. van, & Gutiérrez-i-Puigarnau, E. (2011). Are workers with a long commute less
productive? An empirical analysis of absenteeism. Tinbergen Institute Discussion Paper.
Retrieved from http://www.sciencedirect.com/science/article/pii/S0166046210000633

158
FC-13: Inman, R., & Blumenfeld, D. (2010). Assembly line team sizing with absenteeism.
International Journal of Production Research, 48(22), 6537–6558.
doi:10.1080/00207540903067169
FC-14: Hanna, A., & Haddad, G. (2009). Overtime and productivity in electrical construction.
Construction Research Congress, 171–180. Retrieved from
http://ascelibrary.org/doi/pdf/10.1061/41020(339)18
FC-15: Thomas, H. (2009). Construction learning curves. Prcatice Periodical on Structural Design
and Construction, (February), 14–20. Retrieved from
http://ascelibrary.org/doi/abs/10.1061/(ASCE)1084-0680(2009)14:1(14)
FC-16: Ailabouni, N., Gidado, K., & Painting, N. (2010). Factors affecting employee productivity in
the UAE construction industry, (September), 7–9. Retrieved from http://www.arcom.ac.uk/-
docs/proceedings/ar2009-0555-0564_Ailabouni_Painting_and_Ashton.pdf
FC-17: Hanna, A., & Chang, C. (2008). Impact of shift work on labor productivity for labor intensive
contractor. Journal of Construction Engineering and Management, (March), 197–204. Retrieved
from http://ascelibrary.org/doi/abs/10.1061/(ASCE)0733-9364(2008)134:3(197)
FC-18: Sonmez, R. (2007). Impact of occasional overtime on construction labor productivity:
quantitative analysis. Canadian Journal of Civil Engineering. Retrieved from
http://www.nrcresearchpress.com/doi/abs/10.1139/l07-004
FC-19: Lingard, H., Brown, K., & Bradley, L. (2007). Improving employees’ work-life balance in the
construction industry: Project alliance case study. Journal of Construction Engineering and
Management, (October), 807–815. Retrieved from
http://ascelibrary.org/doi/abs/10.1061/(ASCE)0733-9364(2007)133%3A10(807)
FC-20: Thomas, H., Riley, D., & Sinha, S. (2006). Fundamental principles for avoiding congested
work areas—A case study. Practice Periodical on Structural Design and Construction,
(November), 197–205. Retrieved from http://ascelibrary.org/doi/abs/10.1061/(ASCE)1084-
0680(2006)11:4(197)
FC-21: Hanna, A. S., Chang, C.-K., Lackney, J. a., & Sullivan, K. T. (2005). Overmanning impact on
construction labor productivity. Construction Research Congress, 1–10.
doi:10.1061/40754(183)75
FC-22: Hanna, A., Taylor, C., & Sullivan, K. (2005). Impact of extended overtime on construction
labor productivity. Journal of Construction Engineering and Management, (June), 734–739.
Retrieved from http://ascelibrary.org/doi/abs/10.1061/(ASCE)0733-9364(2005)131:6(734)

159
FC-23: Moselhi, O., Assem, I., & El-Rayes, K. (2005). Change orders impact on labor productivity.
Journal of Construction Engineering and Management, (March), 354–359. Retrieved from
http://ascelibrary.org/doi/abs/10.1061/(ASCE)0733-9364(2005)131:3(354)
FC-24: Hanna, A., & Menches, C. (2005). Factors affecting absenteeism in electrical construction.
Journal of Construction Engineering and Management, (November), 1212–1218. Retrieved from
http://ascelibrary.org/doi/abs/10.1061/(ASCE)0733-9364(2005)131:11(1212)
FC-25: Pace, C. (2004). Labor availability and productivity forecasting. Construction Research
Congress, (206), 1–8. Retrieved from http://ascelibrary.org/doi/abs/10.1061/40671(2003)111
FC-26: Hanna, A., & Camlic, R. (2004). Cumulative effect of project changes for electrical and
mechanical construction. Journal of Construction Engineering and Management, (December),
762–771. doi:10.1061/(ASCE)0733-9364(2004)130
FC-27: Sargent, J. R., Sullivan, K. T., & Hanna, A. S. (2003). Absenteeism and turnover impact on
labor productivity for electrical contractors. Construction Research Congress, 1–8.
FC-28: Thomas, H., & Horman, M. (2003). Improving labor flow reliability for better productivity as
lean construction principle. Journal of Construction Engineering and Management, (June), 251–
261. Retrieved from http://ascelibrary.org/doi/pdf/10.1061/(ASCE)0733-
9364(2003)129%3A3(251)
FC-29: Godfrey, P. (2002). Overall equipment effectiveness. Manufacturing Engineer. Retrieved
from http://ieeexplore.ieee.org/xpls/abs_all.jsp?arnumber=1015766
FC-30: Donn, E., & Hersham, A. (1998). The effect of hot weather on construction labor productivity
and costs. Cost Engineering, 32–36.
FC-31: Thomas, H. R., & Raynar, K. A. (1997). ScheduleD overtime and labor productivity:
Quantitative analysis. Journal of Construction Engineering and Management, (June), 181–188.
FC-32: Riley, D. R., & Sanvido, V. E. (1995). Patterns of construction-space use in multistory
buildings. Journal of Construction Engineering and Management, (DECEMBER), 464–473.
FC-33: Thomas, H., & Napolitan, C. (1995). Quantitative effects of construction changes on labor
productivity. Journal of Construction Engineering and Management, (September), 290–296.
Retrieved from http://ascelibrary.org/doi/abs/10.1061/(ASCE)0733-9364(1995)121:3(290)
FC-34: Thomas, H. (1992). Effects of scheduled overtime on labor productivity. Journal of
Construction Engineering and Management, 118(1), 60–76. Retrieved from
http://ascelibrary.org/doi/abs/10.1061/(ASCE)0733-9364(1992)118:1(60)

160
FC-35: Vorster, M., & Garza, J. D. La. (1990). Consequential equipment costs associated with lack of
availability and downtime. Journal of Construction Engineering and Management, 116(4), 656–
669. Retrieved from http://ascelibrary.org/doi/abs/10.1061/(ASCE)0733-
9364(1990)116%3A4(656)
FC-36: Thomas, H. R., Sanvido, V. E., & Sanders, S. R. (1990). Impact of material management on
productivity-A case study. Journal of Construction Engineering and Management, 115(3), 370–
384.
FC-37: Vorster, M., & Sears, G. (1987). Model for retiring, replacing, or reassigning construction
equipment. Journal of Construction Engineering and Management, 113(1), 125–137. Retrieved
from http://ascelibrary.org/doi/pdf/10.1061/(ASCE)0733-9364(1987)113%3A1(125)
FC-38: Thomas, H. R., Mathews, C. T., & Ward, J. G. (1986). Learning curve models of construction
productivity. Journal of Construction Engineering and Management, 112(2), 245–258.
FC-39: Koehn, E., & Brown, G. (1985). Climatic effects on construction. Journal of Construction
Engineering and Management, 111(2), 129–137. doi:10.1061/(ASCE)0733-
9364(1985)111:2(129)
FC-40: Torsvall, L., & Åkerstedt, T. (1980). A diurnal type scale. Construction, consistency and
validation in shift work. Scandinavian Journal of Work, Environment & Health, 6(4), 283–290.
doi:10.5271/sjweh.2608
KM-1: El-Diraby, T. (2011). Epistemology of construction informatics. Journal of Construction
Engineering and Management, (January), 53–65. doi:10.1061/(ASCE)CO.1943-7862.0000392.
KM-2: Chen, C., & Lin, Y. (n.d.). Enhancing knowledge management for engineers using mind
mapping in construction. New Research on Knowledge Management. Retrieved from
http://cdn.intechopen.com/pdfs/29148/InTech-
Enhancing_knowledge_management_for_engineers_using_mind_mapping_in_construction.pdf
KM-3: Lin, Y.-C., & Lee, H.-Y. (2012). Developing project communities of practice-based
knowledge management system in construction. Automation in Construction, 22, 422–432.
doi:10.1016/j.autcon.2011.10.004
KM-4: Yang, L.-R., Chen, J.-H., & Wang, H.-W. (2012). Assessing impacts of information
technology on project success through knowledge management practice. Automation in
Construction, 22, 182–191. doi:10.1016/j.autcon.2011.06.016

161
KM-5: Wu, J.-W., Tseng, J. C. R., Yu, W.-D., Yang, J.-B., Lee, S.-M., & Tsai, W.-N. (2012). An
integrated proactive knowledge management model for enhancing engineering services.
Automation in Construction, 24, 81–88. doi:10.1016/j.autcon.2012.02.006
KM-6: Sheriff, A., & Bouchlaghem, D. (2011). Information management in UK-based architecture
and engineering organizations: drivers, constraining factors, and barriers. Journal of
Management in Engineering, (April), 170–180. doi:10.1061/(ASCE)ME.1943-5479.0000085.
KM-7: Tan, H., Carrillo, P., & Anumba, C. (2011). Case study of knowledge management
implementation in a medium-sized construction sector firm. Journal of Management in
Engineering, (July), 338–347. doi:10.1061/(ASCE)ME.1943-5479.0000109.
KM-8: Javernick-Will, A. (2011). Motivating knowledge sharing in engineering and construction
organizations: power of social motivations. Journal of Management in Engineering, (April),
193–202. doi:10.1061/(ASCE)ME.1943-5479.0000076.
KM-9: Will, A. J. (2010). The embedment of a knowledge management program in an AEC
organization. Construction Research Congress, 697–707.
KM-10: Kanapeckiene, L., Kaklauskas, a., Zavadskas, E. K., & Seniut, M. (2010). Integrated
knowledge management model and system for construction projects. Engineering Applications
of Artificial Intelligence, 23(7), 1200–1215. doi:10.1016/j.engappai.2010.01.030
KM-11: Hwang, B., & Thomas, S. (2009). Measuring the impact of rework on construction cost
performance. Journal of Construction Engineering and Management, (March), 187–198.
Retrieved from http://ascelibrary.org/doi/abs/10.1061/(ASCE)0733-9364(2009)135:3(187)
KM-12: Caldas, C., & Jr, G. G. (2009). Identification of effective management practices and
technologies for lessons learned programs in the construction industry. Journal of Construction
Engineering and Management, (June), 531–539. Retrieved from
http://ascelibrary.org/doi/pdf/10.1061/(ASCE)CO.1943-7862.0000011
KM-13: Esmi, R., & Ennals, R. (2009). Knowledge management in construction companies in the
UK. Ai & Society, 24(2), 197–203. doi:10.1007/s00146-009-0202-9
KM-14: Dave, B., & Koskela, L. (2009). Collaborative knowledge management—A construction case
study. Automation in Construction, 18(7), 894–902. doi:10.1016/j.autcon.2009.03.015
KM-15: Zhang, X., Mao, X., & AbouRizk, S. M. (2009). Developing a knowledge management
system for improved value engineering practices in the construction industry. Automation in
Construction, 18(6), 777–789. doi:10.1016/j.autcon.2009.03.004

162
KM-16: Tupenaite, L., Kanapeckiene, L., & Naimaviciene, J. (2008). Knowledge management model
for construction projects. Computer Modelling and New Technologies, 12(3), 38–46. Retrieved
from https://www.tsi.lv/RSR/vol12_3/vol12_3-5.pdf
KM-17: Senaratne, S., & Sexton, M. (2008). Managing construction project change: a knowledge
management perspective. Construction Management and Economics, 26(12), 1303–1311.
doi:10.1080/01446190802621044
KM-18: Graham, B., Gahan, D., & Thomas, K. (2007). The application of Knowledge Management
practices in the procurement and construction of cleanroom projects. 23th Annual ARCOM
Conference, (September), 3–5. Retrieved from http://eprints.wit.ie/528/
KM-19: Chinowsky, P., & Carrillo, P. (2007). Knowledge management to learning organization
connection. Journal of Management in Engineering, (July), 122–130. Retrieved from
http://ascelibrary.org/doi/abs/10.1061/(ASCE)0742-597X(2007)23:3(122)
KM-20: Yang, J.-B. (2007). Developing a knowledge map for construction scheduling using a novel
approach. Automation in Construction, 16(6), 806–815. doi:10.1016/j.autcon.2007.02.005
KM-21: Lin, Y.-C., Wang, L.-C., & Tserng, H. P. (2006). Enhancing knowledge exchange through
web map-based knowledge management system in construction: Lessons learned in Taiwan.
Automation in Construction, 15(6), 693–705. doi:10.1016/j.autcon.2005.09.006
KM-22: Robinson, H. S., Carrillo, P. M., Anumba, C. J., & Al-Ghassani, A. M. (2005). Knowledge
management practices in large construction organisations. Engineering, Construction and
Architectural Management, 12(5), 431–445. doi:10.1108/09699980510627135
KM-23: Mohamed, S., & Anumba, C. (2004). Towards a framework for integrating knowledge
management processes into site management practices. 20th ARCOM Conference, 1(September
2004), 45–54. Retrieved from http://www.arcom.ac.uk/-docs/proceedings/ar2004-0045-
0054_Mohamed_and_Anumba.pdf
KM-24: Ping Tserng, H., & Lin, Y.-C. (2004). Developing an activity-based knowledge management
system for contractors. Automation in Construction, 13(6), 781–802.
doi:10.1016/j.autcon.2004.05.003
KM-25: Palaneeswaran, E., & Kumaraswamy, M. M. (2003). Knowledge Mining of Information
Sources for Research in Construction Management. Journal of Construction Engineering and
Management, 129(2), 182–191. doi:10.1061/(ASCE)0733-9364(2003)129:2(182)

163
KM-26: Charlesraj, V., & Kalidindi, S. (2006). An ontology-based knowledge management
framework for performance improvement of construction project managers. Automation and
Robotics in Construction, 762–767. Retrieved from
http://www.iaarc.org/publications/fulltext/isarc2006-00184_200606170319.pdf
KM-27: Wetherill, M., Rezgui, Y., Lima, C., & Zarli, A. (2002). Knowledge management for the
construction industry: the e-cognos project. ITcon, 7(August), 183–196. Retrieved from
http://itcon.org/cgi-bin/works/Search&format=RSS&sort=TIME&max=10/Show?2002_12
KM-28: Carrillo, P., Anumba, C., & Kamara, J. (2000). Knowledge management strategy for
construction: key IT and contextual issues. Retrieved from http://itc.scix.net/data/works/att/w78-
2000-155.content.pdf
RL-1: Taghaddos, H., Abourizk, S., Mohamed, Y., & Hermann, U. (2011). Simulation-based auction
protocol for resource scheduling problems. Journal of Construction Engineering and
Management, (January), 31–42. doi:10.1061/(ASCE)CO.1943-7862.0000399.
RL-2: Koulinas, G., & Anagnostopoulos, K. (2011). Construction resource allocation and leveling
using a threshold accepting–based hyperheuristic algorithm. Journal of Construction
Engineering and Management, (July), 854–863. doi:10.1061/(ASCE)CO.1943-7862.0000492.
RL-3: Hegazy, Tarek, & Menesi, W. (2011). Heuristic method for satisfying both deadlines and
resource constraints. Journal of Construction Engineering and Management, (June), 688–696.
doi:10.1061/(ASCE)CO.1943-7862.0000483.
RL-4: Hariga, M., & El-Sayegh, S. (2010). Cost optimization model for the multiresource leveling
problem with allowed activity splitting. Journal of Construction Engineering and Management,
(January), 56–64. Retrieved from http://ascelibrary.org/doi/abs/10.1061/(ASCE)CO.1943-
7862.0000251
RL-5: Jun, D. H., & El-Rayes, K. (2011). Multiobjective optimization of resource leveling and
allocation during construction scheduling. Journal of Construction Engineering and
Management, (December), 1080–1088. doi:10.1061/(ASCE)CO
RL-6: Doulabi, S. H. H. (2010). Efficient hybrid genetic algorithm for resource leveling via activity
splitting. Journal of Construction Engineering and Management, (February), 137–146. Retrieved
from http://ascelibrary.org/doi/abs/10.1061/(ASCE)CO.1943-7862.0000261
RL-7: Lucko, G. (2010). Integrating efficient resource optimization and linear schedule analysis with
singularity functions. Journal of Construction Engineering and Management, (January), 45–55.
Retrieved from http://ascelibrary.org/doi/abs/10.1061/(ASCE)CO.1943-7862.0000244

164
RL-8: Ashuri, B., & Tavakolan, M. (2011). Fuzzy enabled hybrid genetic algorithm–particle swarm
optimization approach to solve TCRO problems in construction project planning. Journal of
Construction Engineering and Management, (September), 1065–1074.
doi:10.1061/(ASCE)CO.1943-7862.0000513.
RL-9: Christodoulou, S. E., Ellinas, G., & Michaelidou-Kamenou, A. (2010). Minimum Moment
Method for Resource Leveling Using Entropy Maximization. Journal of Construction
Engineering and Management, 136(5), 518–527. doi:10.1061/(ASCE)CO.1943-7862.0000149
RL-10: Christodoulou, S. (2010). Scheduling resource-constrained projects with ant colony
optimization artificial agents. Journal of Computing in Civil Engineering, (February), 45–55.
RL-11: Kim, J., & Jr, R. E. (2010). Comparing schedule generation schemes in resource-constrained
project scheduling using elitist genetic algorithm. Journal of Construction Engineering and
Management, (February), 160–169. Retrieved from
http://ascelibrary.org/doi/abs/10.1061/(ASCE)0733-9364(2010)136%3A2(160)
RL-12: Orabi, W., & Senouci, A. (2010). Optimizing resource utilization during the recovery of civil
infrastructure systems. Journal of Management in Engineering, (October), 237–246. Retrieved
from http://ascelibrary.org/doi/abs/10.1061/(ASCE)ME.1943-5479.0000024
RL-13: El-Rayes, K., & Jun, D. (2009). Optimizing resource leveling in construction projects. Journal
of Construction Engineering and Management, (November), 1172–1180. Retrieved from
http://ascelibrary.org/doi/abs/10.1061/(ASCE)CO.1943-7862.0000097
RL-14: Zahraie, B., & Tavakolan, M. (2009). Stochastic time-cost-resource utilization optimization
using nondominated sorting genetic algorithm. Journal of Construction Engineering and
Management, (November), 1162–1171.
RL-15: Lu, M., Lau, S., & Poon, C. (2009). Simulation approach to evaluating cost efficiency of
selective demolition practices : Case of Hong Kong’s Kai Tak Airport Demolition. Journal of
Construction Engineering and Management, (June), 448–457.
RL-16: Kim, J., & Jr, R. E. (2008). Permutation-based elitist genetic algorithm for optimization of
large-sized resource-constrained project scheduling. Journal of Construction Engineering and
Management, (November), 904–913. Retrieved from
http://ascelibrary.org/doi/abs/10.1061/(ASCE)0733-9364(2008)134%3A11(904)
RL-17: Lu, M., & Lam, H.-C. (2008). Critical Path Scheduling under Resource Calendar Constraints.
Journal of Construction Engineering and Management, 134(1), 25–31.
doi:10.1061/(ASCE)0733-9364(2008)134:1(25)

165
RL-18: Vaziri, K., Carr, P. G., & Nozick, L. K. (2007). Project planning for construction under
uncertainty with limited resources. Journal of Construction Engineering and Management,
(April), 268–276.
RL-19: Ibbs, W., & Nguyen, L. (2007). Schedule analysis under the effect of resource allocation.
Journal of Construction Engineering and Management, (February), 131–138. Retrieved from
http://ascelibrary.org/doi/abs/10.1061/(ASCE)0733-9364(2007)133:2(131)
RL-20: Huang, R., & Sun, K. (2006). Non-unit-based planning and scheduling of repetitive
construction projects. Journal of Construction Engineering and Management, (June), 585–597.
RL-21: Vanhoucke, M. (2006). Work continuity constraints in project scheduling. Journal of
Construction Engineering and Management, (January), 14–25. Retrieved from
http://ascelibrary.org/doi/abs/10.1061/(ASCE)0733-9364(2006)132:1(14)
RL-22: Zhang, H., Li, H., & Tam, C. M. (2006). Particle swarm optimization for preemptive
scheduling under break and resource-constraints. Journal of Construction Engineering and
Management, (March), 259–267.
RL-23: Kim, Kyunghwan, & De la Garza, J. M. (2005). Evaluation of the Resource-Constrained
Critical Path Method Algorithms. Journal of Construction Engineering and Management, 131(5),
522–532. doi:10.1061/(ASCE)0733-9364(2005)131:5(522)
RL-24: Seibert, J. E., & Evans, G. W. (1992). Time-constrained resource leveling. Journal of
Construction Engineering and Management, 117(3), 503–520.
RL-25: Jaselskis, E. J., & Ashley, D. B. (1991). Optimal Allocation of Project Management
Resources for Achieving Success. Journal of Construction Engineering and Management,
117(2), 321–340. doi:10.1061/(ASCE)0733-9364(1991)117:2(321)
RL-26: Harris, R. B. (1990). Packing method for resource leveling (Pack). Journal of Construction
Engineering and Management, 116(2), 331–350. doi:10.1061/(ASCE)0733-
9364(1990)116:2(331)
RL-27: Easa, S. M. (1989). Resource leveling in construction by optimization. Journal of
Construction Engineering and Management, 115(2), 302–316. doi:10.1061/(ASCE)0733-
9364(1989)115:2(302)
RM-1: Attarzadeh, M., Chua, D., & Beer, M. (2011). Risk management of long term infrastructure
projects “PPP-BOT projects” by using Uncertainty, Probabilistic and Stochastic Methods and
Models. Vulnerability, Uncertainty, and Risk, 360–367. Retrieved from
http://ascelibrary.org/doi/pdf/10.1061/41170(400)44
166
RM-2: Lu, Y., Cui, Q., Mao, L., & Chen, L. (2011). National-level infrastructure risk evaluation
framework and best practices. Vulnerability, Uncertainty, and Risk, 284–291. Retrieved from
http://ascelibrary.org/doi/pdf/10.1061/41170(400)35
RM-3: Kim, B. (2011). Probabilistic performance risk evaluation of infrastructure projects.
Vulnerability, Uncertainty, and Risk, 292–299. Retrieved from
http://ascelibrary.org/doi/pdf/10.1061/41170(400)36
RM-4: Fidan, G., & Dikmen, I. (2011). Ontology for relating risk and vulnerability to cost overrun in
international projects. Journal of Computing in Civil Engineering, (August), 302–315.
doi:10.1061/(ASCE)CP.1943-5487.0000090.
RM-5: Zhou, H., & Zhang, H. (2011). Risk assessment methodology for a deep foundation pit
construction project in Shanghai, China. Journal of Construction Engineering and Management,
(December), 1185–1194. doi:10.1061/(ASCE)CO.1943-7862.0000391.
RM-6: Eybpoosh, M. (2011). Identification of risk paths in international construction projects using
structural equation modeling. Journal of Construction Engineering and Management,
(December), 1164–1175. doi:10.1061/(ASCE)CO.1943-7862.0000382.
RM-7: Wang, N. (2011). Risk allocation in the operational stage of private finance initiative projects.
Journal of Performance of Constructed Facilities, (December), 598–605.
doi:10.1061/(ASCE)CF.1943-5509.0000194.
RM-8: Lee, HS, Kim, H., & Park, M. (2011). Construction risk assessment using site influence
factors. Journal of Computing in Civil Engineering, (June), 319–330.
doi:10.1061/(ASCE)CP.1943-5487.0000146.
RM-9: Allan, N., & Yin, Y. (2010). Development of a methodology for understanding the potency of
risk connectivity. Journal of Management in Engineering, (April), 75–79.
doi:10.1061/(ASCE)ME.1943-5479.0000036
RM-10: Alarcón, L., & Ashley, D. (2010). Risk planning and management for the Panama Canal
Expansion Program. Journal of Construction Engineering and Management, (October), 762–771.
doi:10.1061/(ASCE)CO.1943-7862.0000317.
RM-11: Chan, A., & Yeung, J. (2010). Empirical study of risk assessment and allocation of public-
private partnership projects in China. Journal of Management in Engineering, (July), 136–148.
doi:10.1061/(ASCE)ME.1943-5479.0000049.

167
RM-12: Laryea, S., & Hughes, W. (2011). Risk and price in the bidding process of contractors.
Journal of Construction Engineering and Management, (April), 248–258.
doi:10.1061/(ASCE)CO
RM-13: Lehtiranta, L. (2011). Relational risk management in construction projects: modeling the
complexity. Leadership and Management in Engineering, 11(2), 141–154.
doi:10.1061/(ASCE)LM.1943-5630.0000114
RM-14: Marques, R. C., & Berg, S. (2011). Risks, contracts, and private-sector participation in
infrastructure. Journal of Construction Engineering and Management, (November), 925–932.
doi:10.1061/(ASCE)CO.1943-7862.0000347.
RM-15: Hashemi, H. (2011). Bootstrap technique for risk analysis with interval numbers in bridge
construction projects. Journal of Construction Engineering and Management, (August), 600–608.
doi:10.1061/(ASCE)CO.1943-7862.0000344.
RM-16: Zou, P. X. W., Chen, Y., & Chan, T. (2010). Understanding and improving your risk
management capability: Assessment model for construction organizations. Journal of
Construction Engineering and Management, (August), 854–863.
RM-17: Creedy, G. D., Skitmore, M., & Wong, J. K. W. (2010). Evaluation of Risk Factors Leading
to Cost Overrun in Delivery of Highway Construction Projects. Journal of Construction
Engineering and Management, 136(5), 528–537. doi:10.1061/(ASCE)CO.1943-7862.0000160
RM-18: Zavadskas, E. K., Turskis, Z., & Tamošaitiene, J. (2010). Risk assessment of construction
projects. Journal of Civil Engineering and Management, 16(1), 33–46.
doi:10.3846/jcem.2010.03
RM-19: Hallowell, M., & Gambatese, J. (2010). Population and initial validation of a formal model
for construction safety risk management. Journal of Construction Engineering and Management,
(September), 981–990. Retrieved from http://ascelibrary.org/doi/abs/10.1061/(ASCE)CO.1943-
7862.0000204
RM-20: Ling, F. Y. Y., & Hoang, V. T. P. (2010). Political, economic, and legal risks faced in
international projects: Case study of Vietnam. Journal of Professional Issues in Engineering &
Practice, (July), 156–164.
RM-21: Chan, D. W. M., Chan, A. P. C., Lam, P. T. I., & Wong, J. M. W. (2010). Empirical study of
the risks and difficulties in implementing guaranteed maximum price and target cost contracts in
construction. Journal of Construction Engineering and Management, 136(5), 495–507.
doi:10.1061/(ASCE)CO.1943-7862.0000153
168
RM-22: Imbeah, W., & Guikema, S. (2009). Managing construction projects using the advanced
programmatic risk analysis and management model. Journal of Construction Engineering and
Management, (August), 772–781. Retrieved from
http://ascelibrary.org/doi/abs/10.1061/(ASCE)0733-9364(2009)135:8(772)
RM-24: El-adaway, I., & Kandil, A. (2009). Contractors’ claims insurance: A risk retention approach.
Journal of Construction Engineering and Management, (September), 819–825. Retrieved from
http://ascelibrary.org/doi/abs/10.1061/(ASCE)CO.1943-7862.0000033
RM-25: Choi, H., & Mahadevan, S. (2008). Construction project risk assessment using existing
database and project-specific information. Journal of Construction Engineering and
Management, (November), 894–903. Retrieved from
http://ascelibrary.org/doi/abs/10.1061/(ASCE)0733-9364(2008)134:11(894)
RM-26: Ökmen, Ö., & Öztaş, A. (2008). Construction project network evaluation with correlated
schedule risk analysis model. Journal of Construction Engineering and Management, (January),
49–63. Retrieved from http://ascelibrary.org/doi/abs/10.1061/(ASCE)0733-9364(2008)134:1(49)
RM-27: Schatteman, D. (2008). Methodology for integrated risk management and proactive
scheduling of construction projects. Journal of Construction Engineering and Management,
(November), 885–893. Retrieved from http://ascelibrary.org/doi/abs/10.1061/(ASCE)0733-
9364(2008)134:11(885)
RM-28: Blackmore, J. M., & Plant, R. A. J. (2008). Risk and resilience to enhance sustainability with
application to urban water systems. Journal of Water Resources Planning and Management,
(June), 224–233.
RM-29: Nasir, D., McCabe, B., & Hartono, L. (2003). Evaluating risk in construction-schedule model
(ERIC-S): construction schedule risk model. Journal of Construction Engineering and
Management, (October), 518–527. Retrieved from
http://ascelibrary.org/doi/abs/10.1061/(ASCE)0733-9364(2003)129%3A5(518)
SL-1: Park, M., Asce, M., Yang, Y., Lee, H., Han, S., & Ji, S. (2011). Floor-level construction
material layout planning model considering actual travel path. Journal of Construction
Engineering and Management, (July), 905–915. doi:10.1061/(ASCE)CO.1943-7862.0000493.
SL-2: Said, H., & El-rayes, K. (2011). Optimizing material procurement and storage on construction
sites. Journal of Construction Engineering and Management, 137(6), 421–431.
doi:10.1061/(ASCE)CO.1943-7862.0000307.
169
SL-3: Said, H., & El-Rayes, K. (2010). Optimizing material logistics planning in construction projects.
Construction Research Congress, (1), 1194–1203. Retrieved from
http://trid.trb.org/view.aspx?id=924683
SL-4: Lam, K., Ning, X., & Lam, M. (2009). Conjoining MMAS to GA to solve construction site
layout planning problem. Journal of Construction Engineering and Management, (October),
1049–1057. Retrieved from http://ascelibrary.org/doi/pdf/10.1061/(ASCE)0733-
9364(2009)135%3A10(1049)
SL-5: El‐Rayes, K., & Said, H. (2009). Global optimization of dynamic site layout planning in
construction projects. Construction Research Congress, 846–855. Retrieved from
http://link.aip.org/link/ascecp/v339/i41020/p86/s1
SL-6: Sanad, H., Ammar, M., & Ibrahim, M. (2008). Optimal construction site layout considering
safety and environmental aspects. Journal of Construction Engineering and Management, (July),
536–544. Retrieved from http://ascelibrary.org/doi/abs/10.1061/(ASCE)0733-
9364(2008)134%3A7(536)
SL-7: El-Rayes, K., & Said, H. (2009). Dynamic site layout planning using approximate dynamic
programming. Journal of Computing in Civil Engineering, (April), 119–127. Retrieved from
http://ascelibrary.org/doi/abs/10.1061/(ASCE)0887-3801(2009)23%3A2(119)
SL-8: Easa, S., & Hossain, K. (2008). New mathematical optimization model for construction site
layout. Journal of Construction Engineering and Management, 134(8), 653–662. Retrieved from
http://ascelibrary.org/doi/abs/10.1061/(ASCE)0733-9364(2008)134:8(653)
SL-9: Zhang, H., & Wang, J. Y. (2008). Particle swarm optimization for construction site unequal-
area layout. Journal of Construction Engineering and Management, (September), 739–748.
SL-10: Lu, M., Chan, W., Zhang, J., & Cao, M. (2007). Generic process mapping and simulation
methodology for integrating site layout and operations planning in construction. Journal of
Computing in Civil Engineering, 21(6), 453–462. Retrieved from
http://ascelibrary.org/doi/abs/10.1061/(ASCE)0887-3801(2007)21%3A6(453)
SL-11: Khalafallah, A., & El-rayes, K. (2006). Optimizing airport construction site layouts to
minimize wildlife hazards. Journal of Management in Engineering, (October), 176–185.
SL-12: Sadeghpour, F., Moselhi, O., & Alkass, S. (2006). Computer-aided site layout planning.
Journal of Construction Engineering and Management, (February), 143–151. Retrieved from
http://ascelibrary.org/doi/pdf/10.1061/(ASCE)0733-9364(2006)132%3A2(143)

170
SL-13: El-Rayes, K., & Khalafallah, A. (2005). Trade-off between safety and cost in planning
construction site layouts. Journal of Construction Engineering and Management, (November),
1186–1195. Retrieved from http://ascelibrary.org/doi/abs/10.1061/(ASCE)0733-
9364(2005)131:11(1186)
SL-14: Osman, H., & Georgy, M. (2005). Layout planning of construction sites considering multiple
objectives: A goal-programming approach. Construction Research Congress, 1–10. Retrieved
from http://ascelibrary.org/doi/abs/10.1061/40754(183)130
SL-15: Harmanani, H., & Zouein, P. (2000). An evolutionary algorithm for solving the geometrically
constrained site layout problem. Computing in Civil and Building Engineering, 1442–1449.
Retrieved from http://citeseerx.ist.psu.edu/viewdoc/summary?doi=10.1.1.3.3378
SL-16: Ezell, B. C., Davis, M. J., & McGinnis, M. L. (2001). Designing a decision support system for
military base camp site selection and facility layout. Risk-Based Decisionmaking in Water
Resources IX, 96–102. doi:10.1061/40577(306)9
SL-17: Chau, K., Anson, M., & Zhang, J. (2004). Four-dimensional visualization of construction
scheduling and site utilization. Journal of Construction Engineering and Management, (August),
598–606. Retrieved from http://ascelibrary.org/doi/abs/10.1061/(ASCE)0733-
9364(2004)130:4(598)
SL-18: Elbeltagi, E., Hegazy, T., & Eldosouky, A. (2004). Dynamic layout of construction temporary
facilities considering safety. Journal of Construction Engineering and Management, (August),
534–541. Retrieved from http://ascelibrary.org/doi/abs/10.1061/(ASCE)0733-
9364(2004)130:4(534)
SL-19: Mawdesley, M., Al-Jibouri, S., & Yang, H. (2002). Genetic algorithms for construction site
layout in project planning. Journal of Construction Engineering and Management, (October),
418–426. Retrieved from http://ascelibrary.org/doi/abs/10.1061/(ASCE)0733-
9364(2002)128:5(418)
SL-20: Tam, C., & Tong, T. (2002). Site layout planning using nonstructural fuzzy decision support
system. Journal of Construction Engineering and Management, (June), 220–231. Retrieved from
http://ascelibrary.org/doi/abs/10.1061/(ASCE)0733-9364(2002)128:3(220)
SL-21: Zouein, P. P., Asce, A. M., Harmanani, H., & Hajar, A. (2002). Genetic algorithm for solving
site layout problem with unequal-size and constrained facilities. Journal of Civil Engineering
and Management, (April), 143–151.

171
SL-22: Cheng, M., & Yang, S. (2001). GIS-based cost estimates integrating with material layout
planning. Journal of Construction Engineering and Management, (August), 291–299. Retrieved
from http://ascelibrary.org/doi/abs/10.1061/(ASCE)0733-9364(2001)127:4(291)
SL-23: Tam, C. M., Tong, T. K. L., & Chan, W. K. W. (2002). Genetic algorithm for optimizing
supply locations around tower crane. Journal of Construction Engineering and Management,
127(4), 315–321.
SL-24: Zouein, P., & Tommelein, I. (2001). Improvement algorithm for limited space scheduling.
Journal of Construction Engineering and Management, (April), 116–124. Retrieved from
http://ascelibrary.org/doi/abs/10.1061/(ASCE)0733-9364(2001)127:2(116)
SL-25: Zhang, J., Anson, M., & Wang, Q. (2000). A new 4D management approach to construction
planning and site space utilization. Computing in Civil and Building Engineering, (2000).
Retrieved from http://ascelibrary.org/doi/abs/10.1061/40513(279)3
SL-26: Hegazy, T, & Elbeltagi, E. (1999). EvoSite: Evolution-based model for site layout planning.
Journal of Computing in Civil Engineering, 198–206. Retrieved from
http://ascelibrary.org/doi/abs/10.1061/(ASCE)0887-3801(1999)13:3(198)
SL-27: Zouein, P., & Tommelein, I. (1999). Dynamic layout planning using a hybrid incremental
solution method. Journal of Construction Engineering and Management, (December), 400–408.
Retrieved from http://ascelibrary.org/doi/abs/10.1061/(ASCE)0733-9364(1999)125:6(400)
SL-28: Li, H., & Love, P. E. D. (1998). Site-level facilities layout using genetic algorithms. Journal of
Computing in Civil Engineering, (October), 227–231.
SL-29: Riley, D. R., & Sanvido, V. E. (1997). Space planning method for multistory building
construction. Journal of Construction Engineering and Management, 123(2), 171–180.
doi:10.1061/(ASCE)0733-9364(1997)123:2(171)
SL-30: Cheng, M., & O’Connor, J. (1996). ArcSite: Enhanced GIS for construction site layout.
Journal of Construction Engineering and Management, (December), 329–336. Retrieved from
http://ascelibrary.org/doi/pdf/10.1061/(ASCE)0733-9364(1996)122%3A4(329)
SL-31: Yeh, I. (1995). Construction-site layout using annealed neural network. Journal of Computing
in Civil Engineering, (July), 201–208. Retrieved from
http://ascelibrary.org/doi/abs/10.1061/(ASCE)0887-3801(1995)9%3A3(201)
SL-32: Mahoney, J., & Tatum, C. (1994). Construction site applications of CAD. Journal of
Construction Engineering and Management, 120(3), 617–631. Retrieved from
http://ascelibrary.org/doi/abs/10.1061/(ASCE)0733-9364(1994)120%3A3(617)
172
SL-33: Tommelein, I. D., & Zouein, P. P. (1993). Interactive dynamic layout planning. Journal of
Construction Engineering and Management, 119(2), 266–287.
SL-34: Tommelein, B. I. D., & Levitt, R. E. (1993). Site-layout modeling: How can artificial
intelligence help? Journal of Construction Engineering and Management, 118(3), 594–611.
SL-35: Thmmelein, I. D., Levitt, R. E., & Hayes-Roth, B. (1993). Sightplan model for site layout.
Journal of Construction Engineering and Management, 118(4), 749–766.
SL-36: Tommelein, I. D., Levitt, R. E., Hayes-Roth, B., & Confrey, T. (1991). Sightplan experiments:
Alternate strategies for site layout design. Journal of Computing in Civil Engineering, 5(1), 42–
63.
SL-37: Vir, J., Patel, M., & Cividini, B. (1988). Site design for resource recovery facilities. Journal of
Energy Engineering, 114(3), 93–98. Retrieved from
http://ascelibrary.org/doi/pdf/10.1061/(ASCE)0733-9402(1988)114%3A3(93)
SS-1: Cheng, C., Shen, J., & Wu, X. (2012). Short-term scheduling for large-scale cascaded
hydropower systems with multivibration zones of high head. Journal of Water Resources
Planning and Management, (June), 257–267. doi:10.1061/(ASCE)WR.1943-5452.0000174.
SS-2: Kataoka, M. (2008). Automated generation of construction plans from primitive geometries.
Journal of Construction Engineering and Management, (August), 592–600. Retrieved from
http://ascelibrary.org/doi/abs/10.1061/(ASCE)0733-9364(2008)134:8(592)
SS-3: Veshosky, D. (1994). Portfolio approach to strategic management of A/E firms. Journal of
Management in Engineering, (October), 41–47.
TC-1: Lu, W., Peng, Y., Shen, Q., & Li, H. (2012). Generic model for measuring benefits of BIM as a
learning tool in construction tasks. Journal of Construction Engineering and Management,
(February), 195–203. doi:10.1061/(ASCE)CO.1943-7862.0000585.
TC-2: Kang, Sanghyeok, & Seo, J. (2013). GIS method for haul road layout planning in large
earthmoving projects: framework and analysis. Journal of Construction Engineering and
Management, (February), 236–246. doi:10.1061/(ASCE)CO.1943-7862.0000561.
TC-3: Irizarry, J., Karan, E. P., & Jalaei, F. (2013). Integrating BIM and GIS to improve the visual
monitoring of construction supply chain management. Automation in Construction, 31, 241–254.
doi:10.1016/j.autcon.2012.12.005
TC-4: Kim, T., Lim, H., Lee, U.-K., Cha, M., Cho, H., & Kang, K.-I. (2012). Advanced formwork
method integrated with a layout planning model for tall building construction. Canadian Journal
of Civil Engineering, 39(11), 1173–1183. doi:10.1139/l2012-104

173
TC-5: Hartmann, T., Van Meerveld, H., Vossebeld, N., & Adriaanse, A. (2012). Aligning building
information model tools and construction management methods. Automation in Construction,
22, 605–613. doi:10.1016/j.autcon.2011.12.011
TC-6: Porwal, A., & Hewage, K. (2011). Building information modeling–based analysis to minimize
waste rate of structural reinforcement. Journal of Construction Engineering and Management,
(August), 943–954. doi:10.1061/(ASCE)CO.1943-7862.0000508.
TC-7: Chavada, R., Dawood, N., & Kassem, M. (2012). Construction workspace management: the
development and application of a novel nD planning approach and tool. Journal of Information
Technology in Construction, 17(December 2011), 213–236. Retrieved from
http://tees.openrepository.com/tees/handle/10149/247112
TC-8: Rhim, H.-C., Kim, K.-M., & Kim, S.-W. (2012). Development of an optimum pre-founded
column system for top-down construction. Journal of Civil Engineering and Management, 18(5),
735–743. doi:10.3846/13923730.2012.723397
TC-9: Ardery, E. (1991b). Estimating productivity of earthmoving operations using spatial
technologies. Journal of Construction Engineering and Management, 1082, 1072–1082.
doi:10.1139/L2012-059
TC-10: Lee, J. H., Song, J. H., Oh, K. S., & Gu, N. (2013). Information lifecycle management with
RFID for material control on construction sites. Advanced Engineering Informatics, 27(1), 108–
119. doi:10.1016/j.aei.2012.11.004
TC-11: Demian, P., & Balatsoukas, P. (2012). Information retrieval from civil engineering
repositories: Importance of context and granularity. Journal of Computing in Civil Engineering,
(December), 727–740. doi:10.1061/(ASCE)CP.1943-5487.0000229.
TC-12: Hasan, S., Zaman, H., & Han, S. (2012). Integrated building information model to identify
possible crane instability caused by strong Winds. Construction Research Congress, 1281–1290.
Retrieved from http://ascelibrary.org/doi/pdf/10.1061/9780784412329.129
TC-13: Fathi, M. S., Rawai, N., & Abedi, M. (2012). Mobile Information System for Sustainable
Project Management. Applied Mechanics and Materials, 178-181(0), 2690–2693.
doi:10.4028/www.scientific.net/AMM.178-181.2690
TC-14: AlBahnassi, H., & Hammad, A. (2011a). Near real-time motion planning and simulation of
cranes in construction: Framework and system architecture. Journal of Computing in Civil
Engineering, (February), 54–63. doi:10.1061/(ASCE)CP.1943-5487.0000123.

174
TC-15: Díaz de Terán, J. R., Turmo, J., Jorquera, J. J., Barragán, B. E., Ramos, G., & Aparicio, Á. C.
(2013). Optimization of in situ construction of concrete decks: Flexure tests of compact splices
of reinforcement between phases. Construction and Building Materials, 41, 191–203.
doi:10.1016/j.conbuildmat.2012.11.085
TC-16: Lin, C., Hsie, M., & Hsiao, W. (2011). Optimizing the schedule of dispatching earthmoving
trucks through genetic algorithms and simulation. Journal of Performance of Constructed
Facilities, (April), 203–211. doi:10.1061/(ASCE)CF.1943-5509.0000219.
TC-17: Qin, W. (2012). Research on the modification control integrated technology of construction
project, 249–255.
TC-18: Scherer, R. J., & Schapke, S.-E. (2011). A distributed multi-model-based Management
Information System for simulation and decision-making on construction projects. Advanced
Engineering Informatics, 25(4), 582–599. doi:10.1016/j.aei.2011.08.007
TC-19: Wetherill, M., Rezgui, Y., Lima, C., & Zarli, A. (2002). Knowledge management for the
construction industry: the e-cognos project. ITcon, 7(August), 183–196. Retrieved from
http://itcon.org/cgi-bin/works/Search&format=RSS&sort=TIME&max=10/Show?2002_12
TC-20: Ruwanpura, J. Y., Hewage, K. N., & Silva, L. P. (2012). Evolution of the i-Booth© onsite
information management kiosk. Automation in Construction, 21, 52–63.
doi:10.1016/j.autcon.2011.05.012
TC-21: Elbeltagi, E., & Dawood, M. (2011). Integrated visualized time control system for repetitive
construction projects. Automation in Construction, 20(7), 940–953.
doi:10.1016/j.autcon.2011.03.012
TC-22: El-Omari, S., & Moselhi, O. (2011). Integrating automated data acquisition technologies for
progress reporting of construction projects. Automation in Construction, 20(6), 699–705.
doi:10.1016/j.autcon.2010.12.001
TC-23: Han, S., Hong, T., Kim, G., & Lee, S. (2011). Technical comparisons of simulation-based
productivity prediction methodologies by means of estimation tools focusing on conventional
earthmovings. Journal of Civil Engineering and Management, (April 2013), 37–41.
doi:10.3846/13923730.2011.574381
TC-24: Yang, J., Vela, P. a., Teizer, J., & Shi, Z. K. (2011). Vision-Based Crane Tracking for
Understanding Construction Activity. Computing in Civil Engineering (2011), 258–265.
doi:10.1061/41182(416)32

175
TC-25: Richards, E., & Clevenger, C. (2011). Interoperable learning leveraging building information
modeling (BIM) in construction management and structural engineering education. Retrieved
from http://ascpro0.ascweb.org/archives/cd/2011/paper/CEUE285002011.pdf
TC-26: Lee, Y. Il, Lee, U. K., & Kim, T. Il. (2013). Modularization technology development and
application for NPP in Korea. K-PVP Conference, 1–7.
TC-27: Kim, Kyoungmin, & Kim, K. J. (2010). Multi-agent-based simulation system for construction
operations with congested flows. Automation in Construction, 19(7), 867–874.
doi:10.1016/j.autcon.2010.05.005
TC-28: Kang, SH, Seo, J., & Baik, K. (2009). 3D-GIS based earthwork planning system for
productivity improvement. Construction Research Congress, 151–160. Retrieved from
http://ascelibrary.org/doi/abs/10.1061/41020(339)16
TC-29: Issa, R., & Suermann, P. (2009). Evaluating industry perceptions of building information
modeling (BIM) impact on construction. Journal of Information Technology in Construction,
14(December 2007), 574–594. Retrieved from
http://www.researchgate.net/publication/228506777_EVALUATING_INDUSTRY_PERCEPTI
ONS_OF_BUILDING_INFORMATION_MODELING_(BIM)_IMPACT_ON_CONSTRUCTI
ON/file/9fcfd509b1f0c69974.pdf
TC-30: Babič, N. Č., Podbreznik, P., & Rebolj, D. (2010). Integrating resource production and
construction using BIM. Automation in Construction, 19(5), 539–543.
doi:10.1016/j.autcon.2009.11.005
TC-31: Moselhi, O., & Alshibani, A. (2009). Optimization of earthmoving operations in heavy civil
engineering projects. Journal of Construction Engineering and Management, 135(10), 948–954.
Retrieved from http://ascelibrary.org/doi/abs/10.1061/(ASCE)0733-9364(2009)135:10(948)
TC-32: Zhai, D., Goodrum, P. M., Haas, C. T., & Caldas, C. H. (2009). Relationship between
automation and integration of construction information systems and labor productivity. Journal
of Construction Engineering and Management, (August), 746–753.
TC-33: Martinez, S., Jardon, A., Navarro, J. M., & Gonzalez, P. (2008). Building industrialization:
robotized assembly of modular products. Assembly Automation, 28(2), 134–142.
doi:10.1108/01445150810863716
TC-34: Kaner, I., Sacks, R., Kassian, W., & Quitt, T. (2008). Case studies of BIM adoption for
precast concrete design by mid-sized structural engineering firms. ITcon, 13(September 2007),
176
303–323. Retrieved from http://itcon.org/cgi-
bin/works/BrowseAZ&name=authors/Show?2008_21
TC-35: Hu, Z., Zhang, J., & Deng, Z. (2008). Construction process simulation and safety analysis
based on building information model and 4D technology. Tsinghua Science & Technology,
13(October), 266–272. Retrieved from
http://www.sciencedirect.com/science/article/pii/S1007021408701603
TC-36: Zhang, H. (2008). Multi-objective simulation-optimization for earthmoving operations.
Automation in Construction, 18(1), 79–86. doi:10.1016/j.autcon.2008.05.002
TC-37: Goodrum, P. M., & Haas, C. T. (2004). Long-term impact of equipment technology on labor
productivity in the U.S. construction industry at the activity level. Journal of Construction
Engineering and Management, (February), 124–133.
TC-38: Concrete, D., & Trade, I. (2004). Time saving technology succeeds for Fairfield Underpass.
Concrete, 26–27.
TC-39: Jonasson, S., & Dunston, P. (2002). Factors in productivity and unit cost for advanced
machine guidance. Journal of Construction Engineering and Management, (October), 367–374.
Retrieved from http://ascelibrary.org/doi/abs/10.1061/(ASCE)0733-9364(2002)128:5(367)
TC-40: Rosenfeld, Y., & Shapira, A. (1998). Automation of existing tower cranes: economic and
technological feasibility. Automation in Construction, 7(4), 285–298. doi:10.1016/S0926-
5805(98)00049-1
TC-41: Everett, J., & Slocum, A. (1993). CRANIUM: device for improving crane productivity and
safety. Journal of Construction Engineering and Management, 119(1), 23–39. Retrieved from
http://ascelibrary.org/doi/abs/10.1061/(ASCE)0733-9364(1993)119:1(23)
TC-42: Tatum, C. B., & Funke, A. T. (1988). Partially Automated Grading: Construction Process
Innovation. Journal of Construction Engineering and Management, 114(1), 19–35.
ZA-1: Boyd, N., Khalfan, M. M. a., & Maqsood, T. (2013a). Off-Site construction of apartment
buildings. Journal of Architectural Engineering, 19(1), 51–57. doi:10.1061/(ASCE)AE.1943-
5568.0000091
ZA-2: Shapira, A., Simcha, M., & Goldenberg, M. (2012). Integrative model for quantitative
evaluation of safety on construction sites with tower cranes. Journal of Construction
Engineering and Management, (November), 1281–1293. doi:10.1061/(ASCE)CO.1943-
7862.0000537.

177
ZA-3: Choudhry, R. (2012). Implementation of BBS and the impact of site-Level commitment.
Journal of Professional Issues in Engineering Education & Practice, (October), 296–304.
doi:10.1061/(ASCE)EI.1943-5541.0000111.
ZA-4: Zhou, Z., Li, Q., & Wu, W. (2011). Developing a versatile subway construction incident
database for safety management. Journal of Construction Engineering and Management,
(October), 1169–1180. doi:10.1061/(ASCE)CO.1943-7862.0000518.
ZA-5: AlBahnassi, H., & Hammad, A. (2011a). Near real-time motion planning and simulation of
cranes in construction: Framework and system architecture. Journal of Computing in Civil
Engineering, (February), 54–63. doi:10.1061/(ASCE)CP.1943-5487.0000123.
ZA-6: Sunindijo, R. Y., & Zou, P. X. W. (2012). Political skill for developing construction safety
climate. Journal of Construction Engineering and Management, (May), 605–612.
doi:10.1061/(ASCE)CO.1943-7862.0000482.
ZA-7: Lee, HS, Lee, K., & Park, M. (2011). RFID-based real-time locating system for construction
safety management. Journal of Computing in Civil Engineering, (June), 366–377. Retrieved
from http://ascelibrary.org/doi/abs/10.1061/(ASCE)CP.1943-5487.0000144
ZA-8: Hon, C., Chan, A., & Yam, M. (2011). Empirical study to investigate the difficulties of
implementing safety practices in the repair and maintenance sector in Hong Kong. Journal of
Construction Engineering and Management, 138(7), 877–884. doi:10.1061/(ASCE)CO.1943-
7862.0000497.
ZA-9: Cai, Y., Sun, R., & Yuan, L. (2011). Design and Implementation of Hazard Management
Information System for ATM Based on B/S Mode. Ictis 2011, 2129–2134.
doi:10.1061/41177(415)269
ZA-10: Ghaderi1, R., & Kasirossafar, M. (2011). Construction safety in design process. AEI 2011,
464–471. Retrieved from http://ascelibrary.org/doi/abs/10.1061/41168(399)54
ZA-11: Ikuma, L., Nahmens, I., & James, J. (2010). Use of safety and lean integrated kaizen to
improve performance in modular homebuilding. Journal of Construction Engineering and
Management, (JULY), 551–560. doi:10.1061/(ASCE)CO.1943-7862.0000330.
ZA-12: Gatti, U., Scharrer, A., Migliaccio, G. C., & Bogus, S. M. (2011). Using workforce’s
physiological strain monitoring to enhance social sustainability of construction. ICSDC 2011,
180–186.
178
ZA-13: Hallowell, M., & Calhoun, M. (2011). Interrelationships among highly effective construction
injury prevention strategies. Journal of Construction Engineering and Management,
(NOVEMBER), 985–993. doi:10.1061/(ASCE)CO.1943-7862.0000354.
ZA-14: Jia, N., Xie, M., & Chai, X. (2011). Development and implementation of a GIS-based safety
monitoring system for hydropower station construction. Journal of Computing in Civil
Engineering, (February), 44–53. doi:10.1061/(ASCE)CP.1943-5487.0000105.
ZA-15: Chen, Q., & Jin, R. (2012). Safety4Site commitment to enhance jobsite safety management
and performance. Journal of Construction Engineering and Management, (April), 509–519.
doi:10.1061/(ASCE)CO.1943-7862.0000453.
ZA-17: Hallowell, M. (2010). Risk-based framework for safety investment in construction
organizations. Journal of Construction Engineering and Management, (August), 592–599.
doi:10.1061/(ASCE)CO.1943-7862.0000339.
ZA-18: Zou, P. (2010). Fostering a strong construction safety culture. Leadership and Management in
Engineering, 11(1), 11–22. doi:10.1061/(ASCE)LM.1943-5630.0000093
ZA-19: Evia, C. (2010). Localizing and designing computer-based safety training solutions for
hispanic construction workers. Journal of Construction Engineering and Management, (June),
452–459. doi:10.1061/(ASCE)CO.1943-7862.0000313.
ZA-20: Goggin, A., Willis, C., & Rankin, J. (2010). The relationship between the maturity of safety
management practices and performance. Construction Research Congress, 1047–1056.
Retrieved from http://ascelibrary.org/doi/pdf/10.1061/41109(373)105
ZA-21: HAN, S., LEE, S., & Peña-Mora, F. (2009). System dynamics modeling of a safety culture
based on resilience engineering. Construction Congress VI, 389–397. Retrieved from
http://ascelibrary.org/doi/pdf/10.1061/41109(373)39
ZA-22: Calhoun, M., & Hallowell, M. (2010). Interrelationships among Construction Injury
Prevention Strategies: A Cross-Impact Analysis. Construction Research Congress, (303), 1264–
1273. Retrieved from http://ascelibrary.org/doi/pdf/10.1061/41109(373)127
ZA-23: Kheni, N., Gibb, A., & Dainty, A. (2010). Health and safety management within small-and
medium-sized enterprises (SMEs) in developing countries: study of contextual influences.
Journal of Construction Engineering and Management, (October), 1104–1115. Retrieved from
http://ascelibrary.org/doi/pdf/10.1061/(ASCE)CO.1943-7862.0000218

179
ZA-24: Al-Humaidi, H., & Tan, F. (2010). Construction safety in Kuwait. Journal of Performance of
Constructed Facilities, (February), 70–77. Retrieved from
http://ascelibrary.org/doi/abs/10.1061/(ASCE)CF.1943-5509.0000055
ZA-25: Rajendran, S., & Gambatese, J. (2009). Development and initial validation of sustainable
construction safety and health rating system. Journal of Construction Engineering and
Management, (October), 1067–1075. Retrieved from
http://ascelibrary.org/doi/abs/10.1061/(ASCE)0733-9364(2009)135:10(1067)
ZA-26: Wang, K., Zhang, X., Wang, X., Yu, J., & Yi, S. (2009). Establishment of construction safety
early-warning system for mountainous freeways. ICCTP 2009, 1523–1529. Retrieved from
http://books.google.com/books?hl=en&lr=&id=5OF747HH8KMC&oi=fnd&pg=PP2&dq=ICCT
P+2009:+Critical+Issues+in+Transportation+Systems+Planning,+Development,+and+Manage
ment+%C2%A92009+ASCE+1523&ots=n9oaziVUqq&sig=MLdsBMCg6h5rVihZtpXv_pG3Z
ng
ZA-27: Garrett, J., & Teizer, J. (2009a). Human factors analysis classification system relating to
human error awareness taxonomy in construction safety. Journal of Construction Engineering
and Management, 135(8), 754–763. Retrieved from
http://ascelibrary.org/doi/pdf/10.1061/(ASCE)CO.1943-7862.0000034
ZA-28: Hallowell, M., & Gambatese, J. (2009). Construction safety risk mitigation. Journal of
Construction Engineering and Management, (December), 1316–1323. Retrieved from
http://ascelibrary.org/doi/pdf/10.1061/(ASCE)CO.1943-7862.0000107
ZA-29: Goh, Y., & Chua, D. (2009). Case-based reasoning approach to construction safety hazard
identification: adaptation and utilization. Journal of Construction Engineering and Management,
(February), 170–178. Retrieved from http://ascelibrary.org/doi/pdf/10.1061/(ASCE)CO.1943-
7862.0000116
ZA-30: Molenaar, K., Park, J., & Washington, S. (2009). Framework for measuring corporate safety
culture and its impact on construction safety performance. Journal of Construction Engineering
and Management, (June), 488–496. Retrieved from
http://ascelibrary.org/doi/abs/10.1061/(ASCE)0733-9364(2009)135:6(488)
ZA-31: Fullerton, C. E., Allread, B. S., & Teizer, J. (2009). Pro-active-real-time personnel warning
system. Construction Research Congress, 31–40.
ZA-32: Kleiner, B., & Smith-Jackson, T. (2008). Design, development, and deployment of a rapid
universal safety and health system for construction. Journal of Construction Engineering and
180
Management, (April), 273–279. Retrieved from
http://ascelibrary.org/doi/abs/10.1061/(ASCE)0733-9364(2008)134%3A4(273)
ZA-33: Choudhry, R. M., Fang, D., & Ahmed, S. M. (2008). Safety management in construction:
Best practices in Hong Kong. Journal of Professional Issues in Engineering and Practice,
(January), 20–32.
ZA-34: Jr, R. M., & Glagola, C. (2006). Case for drug testing of construction workers. Journal of
Management in Engineering, 22(1), 43–50. Retrieved from
http://ascelibrary.org/doi/pdf/10.1061/(ASCE)0742-597X(2006)22%3A1(43)
ZA-35: Toole, T. (2005). Increasing engineers’ role in construction safety: Opportunities and barriers.
Journal of Professional Issues in Engineering, (July), 199–207. Retrieved from
http://ascelibrary.org/doi/abs/10.1061/(ASCE)1052-3928(2005)131%3A3(199)
ZA-36: Gambatese, J. A. (n.d.). Safety constructability: designer involvement in construction site
safety. Construction Congress VI, 650–660.
ZA-37: Hinze, J., & Appelgate, L. (1991). Costs of construction injuries. Journal of Construction
Engineering and Management, 117(3), 537–550. Retrieved from
http://ascelibrary.org/doi/abs/10.1061/(ASCE)0733-9364(1991)117:3(537)