validation of conceptual hydro-salinity model …
TRANSCRIPT

107
September
VALIDATION OF CONCEPTUAL HYDRO-SALINITY MODEL (CIRFLE) FOR THE IRRIGATED AREA OF KALAAT EL ANDALOUS IN TUNISIA
Noura Ferjani 1 and Hedi Daghari2
ABSTRACT
A simulation study of the volume of water, salt concentrations and loads in irrigation return flows was carried out in the irrigated area of Kalaât El Andalous during three hydrologic years (2007/2008, 2008/2009 and 2009/2010) using a Conceptual Irrigation Return Flow hydro-salinity model considering the Leaching Efficiency of salts (CIRFLE). Results show that the measured and calculated values are in good agreement. Scenario-analysis for management variable (irrigated area) and environmental parameters (precipitation) were performed. A good correlation between measured and calculated values was observed specially in the case of an average year (487 mm). Results show that in the case of wet year (800 mm), leaching of soil is operated naturally. So the leaching fraction can be reduced. However, if rainfall is low, there is a risk of salts accumulation in soil. In an average year (rainfall = 500 mm), if we project to irrigate the entire area (2905 ha), the water volume of surface irrigation return flow becomes very important (16. 106 m3). In such situation, the salt concentration of drainage water is increased by 12% and the mass of salts removed is very high (106 801 tons). In this case, there will be no risk of salinization.
Keywords: Irrigation; Simulation; Salt balance; CIRFLE; Drainage.
INTRODUCTION
Irrigated agriculture has faced the challenge of sustaining its productivity for centuries. Because of natural hydrological and geochemical factors as well as irrigation induced activities, soil and water salinity and associated drainage problems continue to plague agriculture. The problems have extended a beyond the farmlands, where saline soils and water impair crop production. Issues related to salts in soils include the concentration of salts (salinity) and the composition of sodium relative to calcium and magnesium (sodicity). Excessive salt concentrations have shown to be deleterious to crops, soils and human health (Tanji, 1990). Sodicity can contribute to the deterioration of soil physical properties, which can indirectly
affect plants via crusting, reduced infiltration, increased soil strength and reduced aeration resulting in anoxic or hypoxic conditions for roots (Naidu and Rengasamy, 1993; Oster and Jayawardane, 1998; Mengel and Kirkby, 2001).
Hydro-salinity balances have been performed in the last decades in several irrigated areas around the world for appraisal of salt loads in irrigation return flows (Australia: Prendergrast et al., 1994; India: Sharma, 1999; Iran: Noory et al., 2011; México: Palacios et al., 1978; Spain: Faci et al., 1985; Tunisia, Turkey: Aragüés et al., 2011; USA: Schoups et al., 2005). However, most studies were performed for short periods of time and did not allow
1 Faculty of Sciences of Bizerte, University of Carthage, 7021 Zarzouna Bizerte, Tunisia. 2 Resources Management and Conservation Research Unit, National Agronomic Institute of Tunisia
(INAT), 43 avenue Charles Nicolle, Cité Mahragène -Tunis 1002-Tunisia.

108
identifying the effects of long-term agronomic changes and climatic variability on salt load trends. Agricultural irrigation return flows (IRFs) are receiving increasing attention due to proliferating water quality regulations and the public’s mounting concern about water conservation. The overuse and misuse of water in irrigated agriculture causes undesirable on- site effects (e.g, waterlogging and soil salinization and/or sodification) as well as off-site effects (e.g degradation of water quality that affects potential down streams users) (Tanji and Kielen 2002). In arid and semi-arid area where the pressure on water resources is increasing, the management of irrigated areas to prevent salinization and degradation of water quality is becoming a critical issue (Prendergast et al., 1994; Heaven et al., 2002; Burkhalter and Gates, 2006).
In Tunisia, the irrigated area of Kalaât El Andalous, has been the focus of several hydrology, irrigation and mass balance studies since the beginning of the 1990’s (Bouksila, 1992; Slama et al., 2004; Saidi et al., 2010; Aragüés et al., 2011). This study aims to estimate the volume of water and the salt concentrations and loads in irrigation return flows using the model CIRFLE in the irrigated area of Kalaât El Andalous during 2007/2008, 2008/2009 and 2009/2010 hydrological years.
MATERIALS AND METHODS
Mode description
The Conceptual Irrigation Return Flow hydrosalinity model was developed by Tanji (1977), revised by Aragüés (1985) and Aragüés (1990) with the name CIRF, and updated by Quílez (1998) with the name CIRFLE (Conceptual Irrigation Return Flow hydro-salinity model with consideration for the Leaching Efficiency of salts). CIRFLE is a computer model that estimates the volume of water and the salt concentrations and loads
in irrigation return flows. The model CIRFLE focuses on the crop’s root zone and considers only the main flow-paths of water and salts in the system. CIRFLE is based in a mass balance approach for water and salts, and considers only the most important inputs and outputs from the system.
The model has been designed to be applied to large systems and for long periods, such as an irrigation season, a hydrologic year, or a series of consecutive years. The model should not be applied for short periods as, in general, steady state conditions do not hold. The model’s variables and parameters are spatial and temporal averages. Thus, CIRFLE must be applied to spatially homogeneous areas or the results can be misleading. CIRFLE model is based on the principle of conservation of mass, both water and salt and assume steady state conditions at which can only be used to predict the average behavior of an irrigation system for long periods of time as a water year or irrigation season (Quílez et al., 2009). CIRFLE consists of a hydrologic submodel coupled to a salinity submodel and requires a total of 25 inputs variables for resolution. In the hydrologic submodel the volume of water Q is considered. In the salinity submodel, the salt concentration (C) expressed as total dissolved solids (TDS), and the load or mass of salts (M) are considered. Salt load is obtained as the product of water volume, salt concentration and an adequate unit conversion factor (SMCF) that depends on the units of input data.
Hydrologic submodel
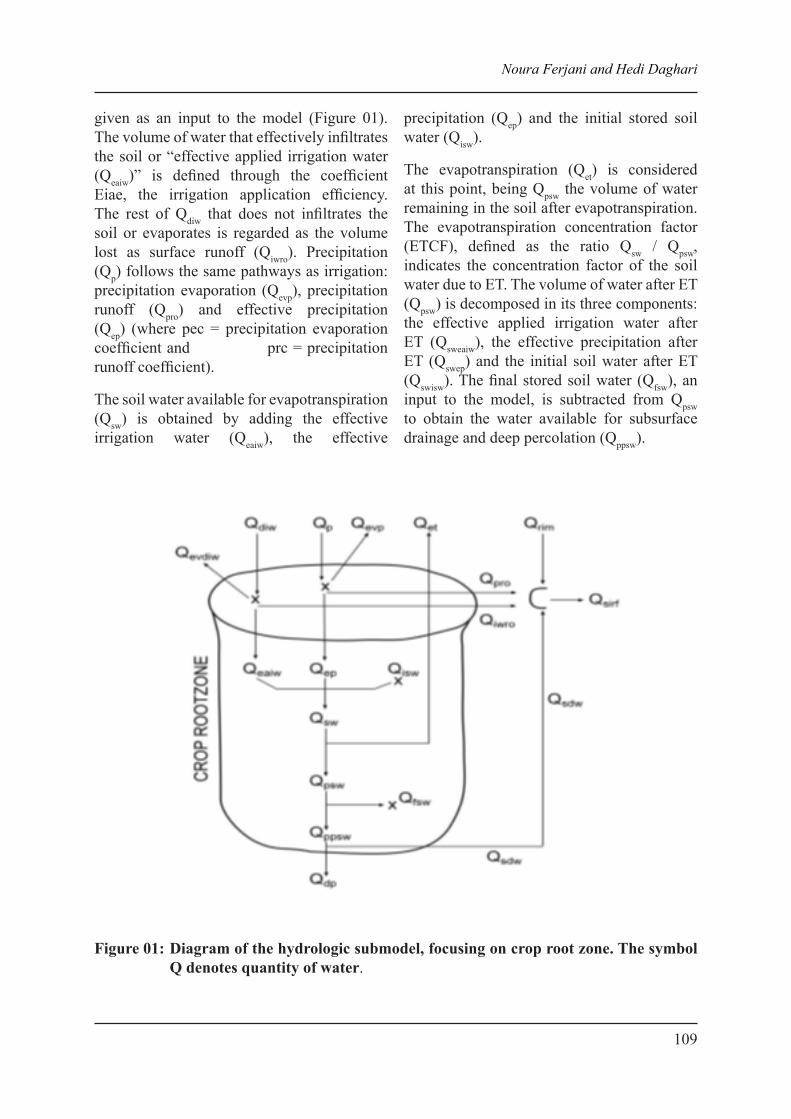
The main inputs to the system are volume of diverted irrigation water (Qdiw), precipitation (Qp), volume of surface rim inflows and outflows (Qrim) and the initial water soil (Qisw). The volume of irrigation water that evaporates directly from the soil surface or the plant canopy (Qevdiw) is defined through the irrigation water evaporation coefficient (iwec),
The Journal of Agricultural Sciences, 2013, vol.8, no3
109
given as an input to the model (Figure 01). The volume of water that effectively infiltrates the soil or “effective applied irrigation water (Qeaiw)” is defined through the coefficient Eiae, the irrigation application efficiency. The rest of Qdiw that does not infiltrates the soil or evaporates is regarded as the volume lost as surface runoff (Qiwro). Precipitation (Qp) follows the same pathways as irrigation: precipitation evaporation (Qevp), precipitation runoff (Qpro) and effective precipitation (Qep) (where pec = precipitation evaporation coefficient and prc = precipitation runoff coefficient).
The soil water available for evapotranspiration (Qsw) is obtained by adding the effective irrigation water (Qeaiw), the effective
precipitation (Qep) and the initial stored soil water (Qisw).
The evapotranspiration (Qet) is considered at this point, being Qpsw the volume of water remaining in the soil after evapotranspiration. The evapotranspiration concentration factor (ETCF), defined as the ratio Qsw / Qpsw, indicates the concentration factor of the soil water due to ET. The volume of water after ET (Qpsw) is decomposed in its three components: the effective applied irrigation water after ET (Qsweaiw), the effective precipitation after ET (Qswep) and the initial soil water after ET (Qswisw). The final stored soil water (Qfsw), an input to the model, is subtracted from Qpsw to obtain the water available for subsurface drainage and deep percolation (Qppsw).
Figure 01: Diagram of the hydrologic submodel, focusing on crop root zone. The symbol Q denotes quantity of water.
Noura Ferjani and Hedi Daghari

110
Salinity submodel
The submodel saline (Figure 02) is defined by the salt concentration (C Total Dissolved Solids mg/l) and the mass of salts which when associated with a water flow is obtained as the product of the volume and concentration (M = Q·C). The inputs to the system are the concentration and mass of salt water irrigation (Cdiw, Mdiw), precipitation (Cp, Mp), the input side (Crim, Mrim) and mass concentration and initial salts in the soil (Cisw, Misw) which depends on the salinity of the saturated extract (ECe). Part of the salts applied with irrigation and rainfall are lost through runoff which can dissolve the salts that are on the surface of field (Ciwrosp model inputs, Cprosp), increasing the final concentration of irrigation runoff and precipitation (Ciwro, Cpro). The effective concentration of irrigation water and precipitation (Ceaiw, Cep) is greater that Cdiw and Cp due to evaporation of the irrigation water and precipitation. Otherwise the salt mass infiltrating the soil (Meaiw, Mep) are slightly
lower and increase proportionally with irrigation efficiency coefficients (Eiae) and precipitation (1 - prc + pec).
The concentration of soil water (CSW), calculated as the mean volume weighted Ceaiw and concentrations Cisw and Cep is increased by reducing its volume due to evapotranspiration (CPSW) while the Salt mass is unaffected by this process (Msw = Mpsw). Rainfall - calcium carbonate dissolution and precipitation of gypsum (Msp-Msd) are estimated through its relationship with the leaching fraction, FL, established by regression: Csp - Csd = a + b · FL, where the parameters a and b (model inputs) are obtained from simulations with the program Watsuit (Oster and Rhoades, 1990) for different types of water. The dissolution of gypsum is considered independently in the model. The percentage of gypsum in the soil is a model input (Gypsum) and its solution occurs until reaching saturation (2.63 g/l) or until exhaustion in the soil, incorporating a mass of salts MGSP in to the soil solution.
Figure 02: Freebody diagram of salinity submodel, focusing on crop root zone. The symbols C and M denote total dissolved solids and mass of salts, respectively.
The Journal of Agricultural Sciences, 2013, vol.8, no3

111
After adding these two contributions MGSP and Msp-Msd and get a new concentration and mass of salts in the soil (C’psw, M’psw). Water salinity at the end in the ground (Cfsw) is obtained from the initial salinity and a coefficient of washing efficiency (k) which depends primarily on the physical characteristics of the ground. Thus, sandy soils with a high washing efficiency have values of k about 0.1 while silty clay soils with more efficiency washing has low values of k of 0.3 (Hoffman, 1986). After counting the final salt content in soil (Cfsw, Mfsw) the soil solution (Cppsw, Mppsw) is divided into two equal components concentration: deep percolation (CDP = Cppsw, MDP) and drainage subsuperfcial (CSDW = Cppsw, MSDW). The mass of salts in the surface ARR (Msirf) is the sum of the mass of the surface components of the irrigation area (Miwro, MPRO) and outside of the polygon (Mrim) and subsurface drainage water irrigation (MSDW). Its concentration (Csirf) is the volume weighted average concentrations of these components.
Site description
The irrigated area of Kalâat El Andalous (latitude: 36° 37’ and 37°2’ N; longitude: 10°5’ and 10° 10’ E) is located on the end part of the Medjerda watershed, with an average annual ETP of 1400 mm and an average annual rainfall of 490 mm. Irrigation area of Kalâat El Andalous was launched since 1992 on a flood area. It covers an area of 2905 ha and the
effective irrigated area changes from season to season and the maximum was observed in the summer (about 1000 ha). The irrigated area was divided into plots of 5 ha supplied by a flow rate of 3 l/s. All the irrigated area was equipped by a pressurized irrigation network and a subsurface drainage system with a length of 180 m and a depth of 1.8 m and spaced at intervals of 40 m. The irrigation water is taken from the Mejreda River. Irrigation water salinity ranges between 2.5 g/l and 3.1 g/l in winter and between 2.3 g/l and 2.4 g/l in summer. The drainage outlet is below sea level, and the drainage waters are discharged to the Mediterranean Sea through a pumping station (SP4). The soils have a fine texture, ranging from silty-clay to clayey-silt. Most soils have electrical conductivity values above 2 dS m-1, and may reach values up to 8-10 dS m-1 near to the south-east sebkha. The hydraulic conductivity varied between 0.2 cm/h and 3.6 cm/h. Soil pH ranged from 7.3 to 8.9. Some physical and chemical characteristics of the soil of the experimental site were determined (Table 01). The general characteristics of the irrigation district (Aragüés et al., 2011) were presented in Table 02. The average bulk density of the soil is about 1.5 g/cm3. Shallow water tables of about 1.4 m depth are present in the lower parts of the district, with very high salinity values that make them unsuitable for irrigation or other municipal and industrial uses.
Soil profile depth (cm)
SP (%)
Volumetric water content
(%)%
OM%
CaCO3 pH
WP FC 0-30 50 20 35 4.6 42.2 8.930-60 52 15 32 1.8 43.5 8.860-90 57 26 42 1.3 44 8.690-120 67 26 44 1.9 46.2 7.3120-150 55 27 44 1.3 36.8 8.5150-180 60 27 45 2.9 48 8.5
SP: Saturation percentage, WP: Wilting Point, FC: Field Capacity, OM: Organic Matter.
Table 01: Field soils characteristics of Kalâat El Andalous area.
Noura Ferjani and Hedi Daghari

112
Measurements
In order to estimate the volume of water and the salt concentrations and loads in irrigation return flows, a data base is needed for the following: climate, crops grown, crop rotations, soil properties, irrigation management practices, drainage conditions, and irrigation water volume and quality. For the purpose some measurements were carried out during the study period (May 2008 to Jun 2010) in a farm plot of 2.38 ha (170 m x 140 m) equipped by three subsurface drainage pipes D1, D2 and D3 and by drip irrigation. Measurements included irrigation water volume and salinity, drainage water volume and salinity, soil water content and salinity. In the field, measurements included soil water content and salinity and drain discharge. Soil samples were carried out to monitor soil salinity and soil water content. Sampling was done on three spots at 0-30 cm, 30-60 cm and 60-90 cm, 90-120 cm, 120-150 cm and 150-180 cm about once a month. Soil, irrigation water, drainage water were analysed to determine electrical conductivity. Also saturation percentage (of soil saturation paste) was calculated as:
(1) 100×=
PVPS
Table 02: Water budgets in the irrigation district of Kalâat EL Andalous during the hydrological year (2007/2008).
Parameter Value
Irrigation (I, mm) 1187
Precipitation (P, mm) 676
Reference ET(ET0) 1412
Crop ET (ETc, mm) 975
Surface drainage (Q, mm) 411
Where:
V: is volume of distilled water added to a dry weight of soil in the preparation of the saturated water paste.
P: is weight of dry soil.
This parameter refers to the amount of distilled water added to an air-dry, ground and sieved (< 2 mm) soil to prepare the saturated paste (units of g of water per 100 g of dry soil). To assess the amount of salts removed from the study area, drain discharge was measured monthly at the end of subsurface drainage pipes D1, D2 and D3. Irrigation and drainage water volumes were measured respectively at the entrance and the exit of the irrigated district (measurement are collected monthly from the SECADENORD : Society and operating water supply systems in North). For a given period, the salt load (SL) in each water input and output was obtained as the product of its salt concentration (TDS), its volume per unit irrigated area (V), the irrigated area (S), and the appropriate conversion factor:
510)()()/()( −= haSmmVLgTDStonsSL (2)
The Journal of Agricultural Sciences, 2013, vol.8, no3

113
Daily climatic data over the period of simulation were collected by a Campbel meteorological station located near the site and were used to calculate the reference evapotranspiration (ETo) with the FAO Penman-Monteith method. Crop evapotranspiration (ETc) was calculated as:
cc KETET 0= (3)
where Kc are crop’s coefficients taken from local information or the literature. Figure 03 shows the seasonal variation of climate by the monthly rainfall and potential evapotranspiration at the site.
Inputs and outputs of the model
Description of inputs
CIRFLE requires 25 inputs variables and parameters for each of the homogenous areas in which the Irrigation Project is disaggregated. Table 03 summarizes the names of the variables, their acronyms and values taken for these parameters. In this study CIRFLE was applied for three hydrologic years (2007/2008, 2008/2009 and 2009/2010). Some parameters
were measured while others are estimated.
The irrigated surface refers to the surface area of the irrigation district that can be irrigated during the period of simulation. The irrigation application efficiency (Eiae) refers to the fraction (0 to 1) of Qdiw that actually infiltrates the soil. In our case, this parameter was estimated as 75%. The precipitation surface runoff coefficient (prc) refers to the fraction (0 to 1) of Qp that becomes runoff over the soil surface, without infiltrating the soil. This parameter was estimated at 6%. The precipitation evaporation coefficient (pec) refers to the fraction (0 to 1) of Qp that evaporates before infiltrating the soil. This parameter was estimated à 4%. Average crop’s rooting depth (Dr) refers to the mean rooting depth (m) of the crops grown in the irrigated soils of the selected Area. Dr is taken as the average rooting depth of the crops. The root-zone salt balance is primarily used as an indicator for assessing root-zone salinity and likely impacts on crop production. The root-zone of most agricultural crops varies between 0.6 and 1.0 m depth below the surface.
Figure 03: Precipitation and reference evapotranspiration (ET0) during the study period.
Noura Ferjani and Hedi Daghari

114
Table 03: Variable names and acronyms for CIRFLE input variables and parameters.
Variable name Acronym unit1 Irrigated surface Area ha2 Volume of diverted irrigation water Qdiw mm3 Irrigation water evaporation coefficient evdiw4 Irrigation application efficiency Eiae5 Volume of Precipitation Qp mm 6 Precipitation surface runoff coefficient prc7 Precipitation evaporation coefficient pec8 Initial stored soil water Qisw %9 Final stored soil water Qfsw %10 Average crop’s rooting depth Dr m11 Volume of total real crop’s evapotranspiration Qet mm12 Deep percolation coefficient dpc %13 Volume of surface rim inflows and outflows Qrim mm14 Saturation Percentage SP %15 Soil bulk density Db g/cm3
16 Gypsum percentage in the soil Gypsum %17 Salt leaching efficiency coefficient k18 Intercept of the equation Csp - Csd= a + b · LF a (Csp-Csd)19 Slope of the equation Csp - Csd= a + b · LF b (Csp-Csd)20 Salt concentration (or EC) of irrigation water Cdiw mg/l21 Salt concentration (or EC) of surface rim inflows Crim mg/l22 Salt pickup by surface runoff irrigation Ciwrosp mg/l23 Salt concentration (or EC) of precipitation Cp mg/l24 Salt pickup from the soil by surface runoff precipitation Cprosp mg/l25 Electrical Conductivity of soil saturation extract ECe dS/m
Deep percolation coefficient (dpc) refers to the fraction of deep percolation waters (waters flowing below the crop’s root zone) that is not collected by the surface drainage systems present in the study areas and, thus, do not contribute to the surface return flows. Volume of surface rim inflows and outflows (Qrim) refers to lateral surface inflows into the study area or lateral shallow ground-water inflows that are collected by the surface drainage system therefore contributing to the outflows from the irrigated area. It is negligible in our case. The Gypsum percentage in the soil (Gypsum) was also negligeable. Salt leaching
efficiency coefficient (k) CIRFLE estimates the mass of salts leached from the root zone during the simulation period. In the literature this coefficient varied between 0.3 and 0.35 for clay loam (Hoffman, 1986). a and b are constants related to the concentration of dissolved salts (Csp) and the concentration of precipitated salts (Csd) by the formula : Csp-Csd= a + b FL.
Description of outputs
The outputs for CIRFLE are organized in three columns: (1) water volume (Q), (2) salt concentration (C) (given in mg/L), and (3) salt
The Journal of Agricultural Sciences, 2013, vol.8, no3

115
mass (M) (given in ton). Table 04 summarizes the names and acronyms of the main outputs.
The index of difference was used to compare
the estimated and the measured values as:
100)..1(% XvalueMeasuredvalueEstimatedDiff −=
(4)
Table 04: Definition of intermediate and final variables in the output data for the area menu (Q = volume of water; C = salt concentration; M = mass of salts)
Symbols DéfinitionQdiw Cdiw Mdiw Diverted irrigation water
Qeaiw Ceaiw Meaiw Effective applied irrigation water
Qiwro Ciwro Miwro Irrigation water runoff
Qevdiw Evaporation of diverted irrigation water
Qp Cp Mp Precipitation
Qep Cep Mep Effective precipitation
Qpro Cpro Mpro Precipitation runoff
Qevp Evaporation of precipitation
CseTDS of soil saturation extract corrected by gypsum solubility
o Cisw Misw Initial stored soil water
Qet Actual Evapotranspiration
Qsw Csw Msw Soil water after irrigation and precipitation/ before ET
Qpsw Cpsw Mpsw Soil water after ET
TDSgyp Concentration derived from soil gypsum dissolution
Csp-CsdConcentration derived from calcite pick-up/dissolution
Q’psw C’psw M’pswSoil water after ET, salt pick-up/dissolution and gypsum dissolution
C’fsw Final stored soil water corrected by gypsum
Qfsw Cfsw Mfsw Final stored soil water
Qppsw Cppsw MppswWater available for subsurface drainage and deep percolation
Qdp Cdp Mdp Deep percolation
Qsdw Csdw Msdw Subsurface drainage water
Qrim Crim Mrim Rim inflow/outflow
Qsirf Csirf Msirf Surface irrigation return flow
Noura Ferjani and Hedi Daghari
116
RESULTS AND DISCUSSION
Model calibration and validation
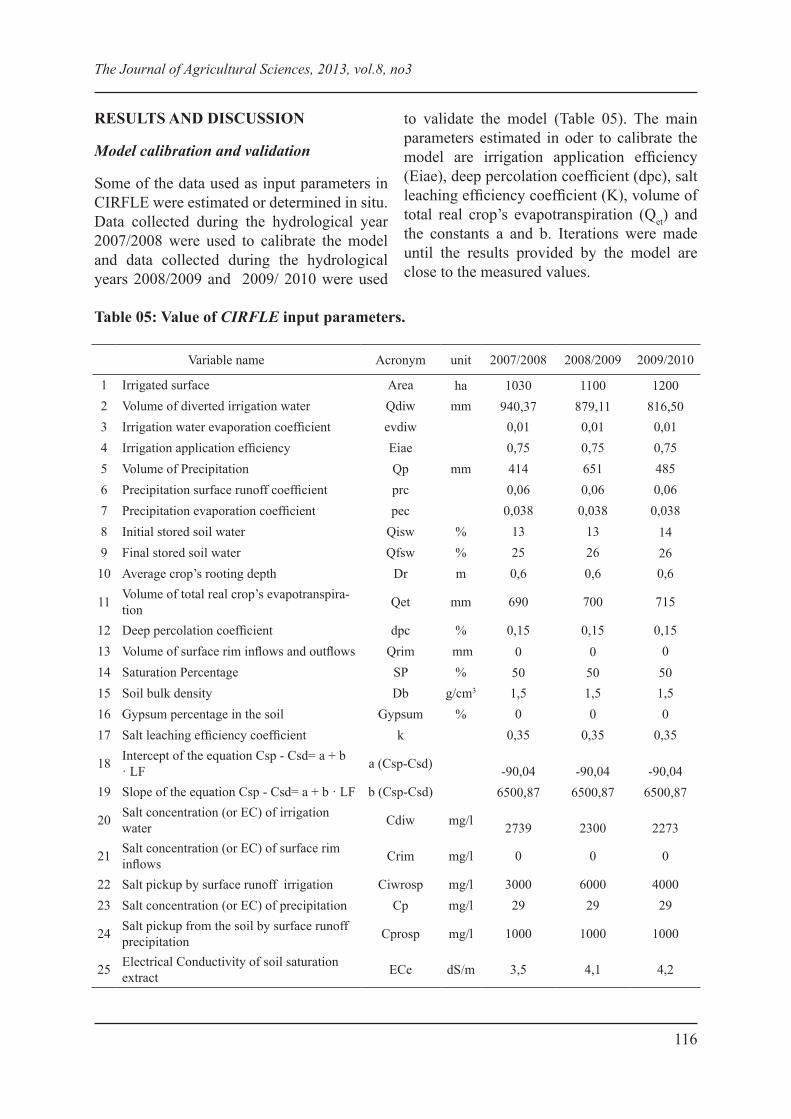
Some of the data used as input parameters in CIRFLE were estimated or determined in situ. Data collected during the hydrological year 2007/2008 were used to calibrate the model and data collected during the hydrological years 2008/2009 and 2009/ 2010 were used
to validate the model (Table 05). The main parameters estimated in oder to calibrate the model are irrigation application efficiency (Eiae), deep percolation coefficient (dpc), salt leaching efficiency coefficient (K), volume of total real crop’s evapotranspiration (Qet) and the constants a and b. Iterations were made until the results provided by the model are close to the measured values.
Table 05: Value of CIRFLE input parameters.
Variable name Acronym unit 2007/2008 2008/2009 2009/2010
1 Irrigated surface Area ha 1030 1100 12002 Volume of diverted irrigation water Qdiw mm 940,37 879,11 816,503 Irrigation water evaporation coefficient evdiw 0,01 0,01 0,014 Irrigation application efficiency Eiae 0,75 0,75 0,755 Volume of Precipitation Qp mm 414 651 4856 Precipitation surface runoff coefficient prc 0,06 0,06 0,067 Precipitation evaporation coefficient pec 0,038 0,038 0,0388 Initial stored soil water Qisw % 13 13 149 Final stored soil water Qfsw % 25 26 2610 Average crop’s rooting depth Dr m 0,6 0,6 0,6
11 Volume of total real crop’s evapotranspira-tion Qet mm 690 700 715
12 Deep percolation coefficient dpc % 0,15 0,15 0,1513 Volume of surface rim inflows and outflows Qrim mm 0 0 014 Saturation Percentage SP % 50 50 5015 Soil bulk density Db g/cm3 1,5 1,5 1,516 Gypsum percentage in the soil Gypsum % 0 0 017 Salt leaching efficiency coefficient k 0,35 0,35 0,35
18 Intercept of the equation Csp - Csd= a + b · LF a (Csp-Csd) -90,04 -90,04 -90,04
19 Slope of the equation Csp - Csd= a + b · LF b (Csp-Csd) 6500,87 6500,87 6500,87
20 Salt concentration (or EC) of irrigation water Cdiw mg/l 2739 2300 2273
21 Salt concentration (or EC) of surface rim inflows Crim mg/l 0 0 0
22 Salt pickup by surface runoff irrigation Ciwrosp mg/l 3000 6000 400023 Salt concentration (or EC) of precipitation Cp mg/l 29 29 29
24 Salt pickup from the soil by surface runoff precipitation Cprosp mg/l 1000 1000 1000
25 Electrical Conductivity of soil saturation extract ECe dS/m 3,5 4,1 4,2
The Journal of Agricultural Sciences, 2013, vol.8, no3

117
The calibrated model was validated with data measured during the hydrological years 2007/2008, 2008/2009 and 2009/2010. Results shows that the measured and calculated values are in good agreement. In fact, the estimates of data CIRFLE for the period (2008-2010) produced mean differences with the measured values of 0.8% (Qsirf), -2.2% (Csirf) and 0.6% (Msirf) (Table 06). Results showed that the values calculated by the model are very close to those measured. The difference observed between estimated and observed values of inputs data can be explained by error of measurement or estimation of parameters. The modeling results demonstrate that CIRFLE could properly simulate the volume of water and the salt concentrations and loads in irrigation return flows in the irrigated area of Kalaât El Andalous.
The original model of CIRFLE (Tanji, 1977) was first calibrated with data from the Glenne-Colusa Irrigation District (California) for the 1973 irrigation season. The water and soils in this district are low in dissolved mineral salts. After calibration, the modeled flow, TDS, and salt mass in the irrigation return flow were within ±2% of the observed data (Aragüés et al.,1990). The calibrated model was then validated with data from the 1970 irrigation season. The model’s estimates were within 33% and 23% of the observed values. Acording to Quílez et al., 1998, the calibration of CIRFLE in 1982 produced errors in Qsirf
prediction, and Msirf and Csirf below -2%. The calibrated model was validated with data measured in the hydrological years 1983 and 1984, with maximum errors of estimation-2% for Qsirf, 13% and 12% for Csirf and Msirf (Quílez et al., 2009). CIRFLE was further validated by comparing the TDS mean calculated for each ECc homogenous area with the mean annual TDS measured in waters draining areas within BID with similar ECe ranges. The calculated TDS mean for ECe<2 dS/m (error estimate=15%). Corresponding calculated TDSmean and measured TDS were 866 and 755 mg/l (standard deviation (one area with EC =2-4 dS/m)(error estimate=15%), and 2.241 and 2.301 mg/l (standard deviation=184 mg/l).
Sub-surface drainage systems typically removes more salt than is applied in irrigation and rainfall (Schoups et al., 2005). This is particularly the case in regions where the subsoil has a significant amount of stored salt. According to Aragues et al., 2011, in four Mediterranean irrigation districts located in Morocco, Spain, Tunisia and Turkey in terms of salt loads in irrigation return flows (IRF), the Tunisian district (Kalâat Landalous irrigation district) had the highest IRF salt load due to both high ECdw and Q values, whereas the Spanish district, despite its relatively high ECdw, had the lowest IRF-salt load due to its low Q (118 mm).
Table 06: Volume (Qsirf, m3), salinity (Csirf, g/l) and mass of salts (Msirf, tons) of the measured and estimated and differences estimates for model periods 2008-2010.
Qsirf (m
3) Csirf (g/l) Msirf (t/ha)
2007/ 2008
2008/ 2009
2009/ 2010
2007/ 2008
2008/ 2009
2009/ 2010
2007/ 2008
2008/ 2009
2009/ 2010
Measured values 5864400 7651800 4100000 5.9 6.4 7.5 34331 48716 30750
Calculated values 5556800 6152000 5014800 6.9 6.6 6.4 34529 44577 32640
Difference (%) 5.2 19.6 -22.3 -17.9 -3.4 14.7 -0.6 8.5 -6.1
Noura Ferjani and Hedi Daghari

118
Prediction of risk of salts accumulation in soil under different scenarios
Two scenario-analysis for management variable (irrigated area) and environmental parameter (precipitation) were performed. In the case of variation of rainfall, the model response to exceptional years ie, a wet year (800 mm), a dry year (288 mm) and an average year (490 mm) was made (Table 07). For the water volume of surface irrigation return flow, we note that there is a correlation between the measured and calculated values for only the dry year and average year. For example, during the hydrological year 2001/2002 considered a dry year, the water volume of surface irrigation return flow measured (3.8 million m3) is close to that calculated by the model (4.0 million m3). Regarding Salt concentration of surface irrigation return flow, a good correlation between measured and calculated values was observed specially in the case of an average
year (487 mm). Thus, the calculated value of salt concentration of surface irrigation return flow (6.6 g/l) is very close to the measured value (6.5 g/l). Results show that in the case of maximum rainfall, leaching of salts is operated naturally. So, the leaching fraction can be reduced. However, if rainfall is low, there is a risk of salts accumulation in soil, especially if the leaching fraction was not well estimated and the drought period lasts for several years.
In the case of increasing the irrigated area, in an average year (rainfall = 500 mm), if we project to irrigate the entire area (2905 ha) with the same amount of water (1100 mm), we note that the water volume of surface irrigation return flow becomes very important (16. 106 m3). The salt concentration of drainage water is increased by 12% and the mass of salts removed becomes more important (106 801 tons). In this case, there will be no risk of salinization (Table 08).
Table 07: Model’s response to different rainfull regimes (variation in rainfall)
Year Parameter
water volume of surface irrigation return flow Qsirf
(106m3)
Salt concentration of surface irrigation
return flow Csirf (g/l)
Mass of salts of surface irrigation return flow Msirf
(tonnes)Dry year
2001/2002 Measured 3.8 8.8 33907
(P=288 mm) Calculated 4.0 7.5 29715
Wet yearMeasured 12.1 9.8 105212
2003/2004
(P=800 mm) Calculated 8.3 5.5 46117
Average Year 1998/1999
Measured 6.4 6.5 41955
(P=487 mm) Calculated 5.7 6.6 37456
The Journal of Agricultural Sciences, 2013, vol.8, no3

119
Table 08: Results for the increasing the irrigated area
Parameter Actual value (measured) Prediction Difference
Rainfall (mm) 414 500 21%
Irrigated surface (ha) 1030 2905 182%
water volume of surface irrigation return flow Qsirf (106m3) 5,9 16.27 177%
Salt concentration of surface ir-rigation return flow Csirf (g/l) 5.9 6 .56 12%
Mass of salts of surface irrigation return flow Msirf (tons) 34331 106801 211%
Thus, it appears that the leaching occurs naturally in the case of a rainy year. Therefore the leaching fraction can be reduced. In this case, there will be no risk of accumulation of salts in the perimeter. However, if rainfall is low, there will be a risk of accumulation of salts in the soil, especially if the leaching fraction is insufficient and the dry period is extended. Our results agree with these found by Ben Rhouma and Hammami (2009) and Ltifi (2009).
CONCLUSION
In recent decades, significant advances have been made in the modeling of irrigation return flows. Models ranged from simple, mass balance routine, to state-of- the -art, modular digital codes. Simple mass balance, steady state models have inherent limitations and users should have a proper’s knowledge of the study area, and should be aware of scenarios where their use is inappropriate. In contrast, more sophisticated, transients models may provide more accurate estimates but the
extensive requirement in model inputs and parameters may prevent or limit their use in area with insufficient information.
In This study, the model CIRFLE was used to estimate the volume of water and the salt concentrations and loads in irrigation return flows in the irrigated area of Kalaât El Andalous during 2007/2008, 2008/2009 and 2009/2010 hydrological years. The modeling results demonstrate that CIRFLE could properly simulate the volume of water and the salt concentrations and loads in irrigation return flows in the irrigated area of Kalaât El Andalous. In fact, CIRFLE has proven to be useful for evaluating alternative salinity control practices such as increasing of irrigated area and variation of rainfall. Model simulations of these and other strategies should help in divising best management alternatives for a proper control of salt loading in IRFs.
ACKNOWLEDGMENTS This study was partially supported by the European Commission research project INCO-CT-2005-015031.
Noura Ferjani and Hedi Daghari

120
REFERENCES
Aragüés, R., Tanji, K.K., Quílez, D., Alberto, F., Faci, J., Machín, J. y Arrúe, J.L. (1985). Calibration and Verification of an Irrigation Return Flow Hydrosalinity Model, Irrigation Science. V-6, pp. 85-94.
Aragüés, R., Tanji, K.K., Quilez, D., Faci, J. (1990). Conceptual irrigation project hydrosalinity model, Chapter 24. In: Agricultural salinity assessment and management. American Society of Civil Engineering. New York, USA, pp. 504-529.
Aragüés, R., Urdanoz, V., Cetin, M., Kirda, C., Daghari, H., ltifi, W., Lahlou, M., Douaik, A. (2011). Soil salinity related to physical soil characteristics and irrigation management in four Mediterranean irrigation districts. Agricultural Water Management. 98, pp. 959-966. doi:10.1016/j. agwat.2011.01.004.
Ben Rhouma, A. Hammami, M. (2009). Détermination et essai de modélisation des bilans d’eau et des sels dans le périmètre irrigué de Kalâat El Andalous. Mémoire de Mastère Ressources en eau : hydrologie et hydrogéologie, Ecole Supérieur des Ingénieurs de l’Equipement Rural de Medjez El Bab.
Bouksila, F. (1992). Bonification des sols. Cas du périmètre irrigué de Kalaât El Andalous. Caractérisation physique des sols et étude de la variabilité spatiale de leurs propriétés en vue de la détermination des facteurs et des zones à risque de salinization. Mémoire de cycle de spécialisation en pédologie et mis en en valeur des terres. Institut National Agronomique de Tunisie, 192 pages.
Burkhalter, J.P., Ang Gates, T.K. (2006). Evaluating regional solutions to salinization and waterlogging in an irrigated river valley. Journal of Irrigation and Drainage Engnieering 132(1), pp. 21-30.
Faci, J., Aragüés, R., Alberto, F., Quilez, D., Machin, J., Arrue, J. L. (1985). Water and salt balance in an irrigated area of the Ebro River Basin (Spain). Irrigation Sciences. V-6, pp. 29-37.
Heaven, S., Kolosov, G.B., Lock, A.C., and Tanton, T.W. (2002). Water resources management in the Aral basin: a river basin management model for the Syr Darya. Irrigation Drainage, 51, pp. 109-118.
Hoffman, G. (1986). Guidelines for reclamation of salt-affected soils. Applied Agriculture Research, V1 (2), pp.65-72.
Ltifi, W. (2009). Bilan des eaux et de sels : cas du périmètre irrigué de Kalaât El Andalous (Basse Vallée de la Mejerda). Mémoire de Mastère, spécialité «Lutte contre la Désertification et Gestion Durable des Ressources en Milieu Aride», Institut National Agronomique de Tunisie.
Mengel, K., Kirkby EA. (2001). Principles of Plant Nutrition. Kluwer Academic Publishers: Dordrecht.
Naidu R, Rengasamy P. (1993). Ion interactions and constraints to plant nutrition in Australian sodic soils. Australian Journal of Soil Research V-31, pp. 801–819.
The Journal of Agricultural Sciences, 2013, vol.8, no3

121
Noory, H., van der Zee, S.E.A.T.M.,, Liaghat, A.-M., Parsinejad, M., van Dam, J.C. (2011). Distributed agro-hydrological modelling with SWAP to improve water and salt management of the Voshmgir irrigation and drainage network in Northern Iran. Agriculture Water Management, 98, pp. 1062-1070. doi:10.1016/j.agwat.2011.01.013.
Oster J.D., Rhoades J.D. (1990). Steady-state root zone salt balance. En: Tanji K.K. (ed.) Agricultural Salinity Assessment and Management, ASCE Manuals and Reports on Engineering Practice 71, ASCE. Cap. V-22, pp. 469-481.
Oster, J.D, Jayawardane, N.S. (1998). Agricultural management of sodic soils. In Sodic Soil: Distribution, Management and Environmental Consequences, Sumner ME, Naidu R (eds). Oxford University Press: NY; pp.126–147.
Palacios, O., Escamilla, M., Reyes, A. (1978). El balance de sales del distrito de Mexicali, B. C. National Resources. J. V-18, pp. 49-67.
Prendergast, J.B., Rose, C.W., Hogarth, W.L. (1994). Sustainability of conjunctive water use for salinity control in irrigation areas: Theory and application to the Shepparton Region, Australia. Irrigation Sciences. V-14(4), pp. 177-187.
Quílez, D. (1998). The salinity in the surface waters of the Ebro Basin: Potential Impact Analysis of Monegros II Irrigation. PhD thesis. Department of Environment and Soil Science, Technical School Of Agricultural Engineering, University of Lleida, Lleida, Spain, p. 352.
Quílez, D., Isidoro, D,. Aragüés, R. (2009). User’s Guide to CIRFLE vs 2.0 Conceptual irrigation return flow hydro-salinity model.
Saidi, A., Hammami, M., Daghari, H., Hatira, A., Ltifi, W., Hachani, K. (2010). Bilans d’eau et de sels dans le périmètre irrigué de Kalâat Landalous (Tunisie). Sécheresse. 21:1-5.
Schoups, G., Hopmans, J. W., Young, C. A., Vrugt, J. A., Wallender, W. W., Tanji, K. K. (2005). Sustainability of irrigated agriculture in the San Joaquin Valley, California. Proc. Natl. Acad. Sci. U. S. A. V-102 (43), pp. 15352-15356.
Sharma, B.R. (1999). Regional salt- and water-balance modeling for sustainable irrigated agriculture. Agriculture Water Management. V-40, pp.129-134.
Slama, F., Bahri, A., Bouarfa, S., Chaumont, C., Bouhlila, R. (2004). Pratiques d’irrigation et rôle du drainage pour le contrôle de la salinité : Cas du périmètre irrigue de Kalâat Landelous en Tunisie. Projet INCO-WADEMED Actes du Séminaire Modernisation de l’Agriculture Irriguée Rabat, du 19 au 23 avril 2004.
Tanji, K.K. (1990). Agricultural Salinity Assessment and management, ASCE Manuals and Reports on Engineering Practice No. 71. American Society of Civil Engineers, Reston, Va., 619 pp.
Tanji, K.K. (1977). A conceptual hydrosalinity model for predicting salt load in irrigation return flow. Managing saline water for irrigation. Texas Tech. Univ. pp.49-70.
Tanji, K.K., Kielen, N.C. (2002). Agricultural drainage water management in arid and semi-arid areas. FAO Irrig. Drain. Paper nº 61, Rome, Italy, 188 pp.
Noura Ferjani and Hedi Daghari