validation of control measures in a food chain using the fso concept
TRANSCRIPT
8132019 Validation of Control Measures in a Food Chain Using the FSO Concept
httpslidepdfcomreaderfullvalidation-of-control-measures-in-a-food-chain-using-the-fso-concept 17
Validation of control measures in a food chain using the FSO concept
MH Zwietering a CM Stewart b RC Whiting c International Commission on MicrobiologicalSpeci1047297cations for Foods (ICMSF)a Laboratory of Food Microbiology Wageningen University 6700 EV Wageningen The Netherlandsb Silliker Food Science Center 160 Armory Drive South Holland IL 60473 USAc Exponent 17000 Science Drive Suite 200 Bowie MD 20715 USA
a r t i c l e i n f o
Article history
Received 6 February 2010
Received in revised form
23 April 2010
Accepted 4 May 2010
Keywords
Food safety objective
HACCP
Validation
Veri1047297cation
a b s t r a c t
For the validation of control measures in a food chain the FSO concept can be used to structurally
combine the initial level reduction and increase of contaminants The impact of taking into consideration
both the level and the variability of these factors on the proportion of product meeting the FSO has been
investigated In this manner it can be examined where in the process the main factors are found to
control the proportion of product meeting the FSO Furthermore equivalence in performance either by
reducing the level or the variability in a level is investigated Both experimental and statistical aspects
are described that can together be combined to support the con1047297dence that a process can conform to
a set FSO
2010 Elsevier Ltd All rights reserved
1 Introduction
Validation of food processes is de1047297ned as establishing docu-
mented evidence which provides a high degree of assurance that
a speci1047297c process will consistently produce a food product meeting
its pre-determined speci1047297cations and quality attributes (Keener
2006) or as determining if an intervention when properly
applied will effectively control the microbial hazard(s) (Swanson amp
Anderson 2000) So validation is the collection and evaluation of
scienti1047297c and technical information to determine if the process
(treatment) when properly applied will effectively control the
microbiological hazard or in other words if the process criteria can
reliably deliver a speci1047297ed performance objective The overall
effectiveness of the control measures should be validated according
to the prevalence of microbial hazards in the food of concern taking
into consideration the characteristics of the individual hazards(s) of concern established food safety objectivesperformance objectives
and level of risk to the consumer (CAC 2007) Validation focuses on
the collection and evaluation of scienti1047297c technical and observa-
tional information In order to take full advantage of the 1047298exibility
that an outcome based risk management system offers it is
important to be able to demonstrate that the selected control
measures actually are capable on a consistent basis of achieving
the intended level of control Guidelines for the validation of food
hygiene control measures have been proposed by Codex (CAC
2008) Validation is different from veri1047297cation and monitoring
veri1047297cation is used to determine that the control measures have
been appropriately implemented showing that the system is
operating as designed while monitoring is the on-going collection
of information on a control measure at the time the control
measure is applied to ensure the HACCP system is operating as
intended
Food producers design their processes to meet performance
objectives (PO) which can be set at speci1047297c points throughout the
food chain to assure food safety Regulatory authorities are con-
cerned with whether a group of products or the consequences of
a series of processing steps at the time of consumption meets the
food safety objective (FSO) in order to be certain that those foods
achieve levels that are consistent with the appropriate level of
protection (ALOP)Various control measures include the appropriate selection of
food materials andingredients at the initial stage of food processing
or food chain and intensive protocols to reduce or eliminate the
contamination by washing heating disinfecting and many other
measures Control measures are also designed to prevent possible
or predicted increases of microbiological hazards during trans-
portation and storage by cross-contamination during processing of
the foods or even by recontamination after processing and during
packaging distribution retail and consumer storage
Control measures need to be validated to determine whether
the products will meet the objectives however depending upon Corresponding author thorn31 317 482233
E-mail address MarcelZwieteringwurnl (MH Zwietering)
Contents lists available at ScienceDirect
Food Control
j o u r n a l h o m e p a g e w w w e l s e v i e r co m l o c a t e f o o d c o nt
0956-7135$ e see front matter 2010 Elsevier Ltd All rights reserved
doi101016jfoodcont201005019
Food Control 21 (2010) 1716e1722
8132019 Validation of Control Measures in a Food Chain Using the FSO Concept
httpslidepdfcomreaderfullvalidation-of-control-measures-in-a-food-chain-using-the-fso-concept 27
the standpoints different elements of the food industry may take
the role of validating the (critical) control points (CCPrsquos) Food
producers may wish to validate the control measures taken in the
processes under their responsibility and validation should be
focused on the ability of the control measures to meet the desig-
nated PO For appropriate validation of a process both within-lot
and between-lot variability must be considered
On the other hand control measures to be validated under the
responsibility of regulatory authorities cover all control actions in
the system for multiple companies products and process controls
including consideration of between-lot variability In this case the
validation is targeted at assessing the established POs and FSOs
In this paper the ICMSF equation (ICMSF 2002) for the preva-
lence and levels of microorganisms from the initial contamination
(H 0) reduction (SR) growth and recontamination (SI ) and factors
in1047298uencing these are considered throughout food production until
consumption and in their role in meeting the FSO by the equation
H 0 SR thorn SI FSO Stochastic aspects of the parameters are taken
into account as well as deterministic values This is illustrated in the
following sections with various examples of the use of data to
validate one or a series of processes of food production for practical
application including statistical insights
2 Considerations for validation
Processes can be validated through the use of predictive
modeling microbiological challenge studies studies to show that
certain limiting parameters (egpHlt45) areachievedandoruse of
default criteria (safe harbors like 72 C 15 s for pasteurization of
milkor 121 C20 minforsterilization) Not alltheseneedto beused
however often several sources of information can be used together
to supply suf 1047297cientevidence When a safe harborapproachis usedit
is not normally necessary to conduct validation studies for that
process For example a safe harbor for milk pasteurization is to
delivera minimum processof 72 C for15s this process criterionhas
already been validated and therefore can be implemented by
processors without re-validation of the process The process would
still need to be veri1047297ed and monitored by the processors
3 Validation of control measures
When determining the processing criteria (PC) required to
achieve a desired PO generally microbiological studies begin on
a laboratory scale move to a pilot plant scale and then are 1047297nally
validated on a commercial scale when possible or necessary
Inactivation kinetic studies can be conducted over a small range of
treatments (a unique combination of factors and their levels for
example pH 65 and 70 C) or over a broad range of treatments that
would allow for the development of microbiological predictive
models Several good microbiological predictive models are avail-able including the USDA Pathogen Modeling Programs which can
be found at httparsusdagovServicesdocshtmdocidfrac146786
and COMBASE which can be found at httpwyndmoorarserrc
govcombase Challenge studies can also be used to determine
processing criteria although they are more limited in scope than
models they are often used as a way of validating the model
predictions Finally on a commercial scale challenge studies can be
conducted utilizing nonpathogenic surrogate microorganisms
shelf life studies with uninoculated product can also provide useful
information for validating a process
While microbiological challenge testing can also be used for
determining the stability of a product with regards to spoilage over
the intended shelf life the remainder of this discussion will focus
on product safety with regards to pathogens relevant to foods
In the following sections each of the terms in the ICMSF equa-
tion the initial contamination (H 0) reduction (SR) growth and
recontamination (SI ) and factors in1047298uencing these are discussed
sequentially including data needs some experimental consider-
ations and especially effects of their variability
31 Determining the initial level (H 0) standard deviation and
distribution
The design of the food process will determine the importance of
incoming material for product safety The main source of the path-
ogen of concern may be from a major or minor ingredient one
incorporated in the initial processing steps or one added later by
recontamination It is important to understand which of the ingre-
dient(s) may harbor the pathogen as well as to understand if there is
seasonal effect on the level of the pathogen present [for example the
number of lots of ground beef positive for Escherichia coli O157H7
increaseovertheJuneeOctober periodin theUSA (USDA-FSIS 2009)]
The geographical source of the ingredient may also play a role in the
likelihood of whether a certain foodborne pathogen is present in the
raw ingredients If contamination is not avoidable the goal is to
develop speci1047297cations and criteria for the incoming material thatwill
limit frequencies andor levels of contamination and lead toachievement of the 1047297nal PO and FSO in conjunction with the PC for
the other steps in the foodprocess The microbiological speci1047297cations
for accepting the incoming materials may include the acceptable
proportion above a limit or the mean level and standard deviation
Information for validating that incoming materials meet
required speci1047297cations can come from baseline data from govern-
ment agencies documentation from suppliers that speci1047297cations
are met (supplier provides validation and end product testing)
baseline data from the processorrsquos experience or test results of
incoming lots
32 Inactivation studies and modeling of kinetic inactivation (SR)
321 Modeling and laboratory studiesA microbiological predictive model can be de1047297ned as an equa-
tion that describes or predicts the growth survival or death of
microorganisms in foods In food microbiology these models are
often empirical and not based on biological mechanisms in other
words they simply relate the observed microbial growth survival
or death responses to the levels of the controlling factors Empirical
models should not be used outside the range of the factors used to
create them because there is no underlying principle on which to
base extrapolation Hence we must carefully consider the range
over which they will be used before beginning experimentation
(Legan Stewart Vandeven amp Cole 2002) Models that can predict
the rate of death of pathogens can be used to design safe and
effective processes A practical guide to modeling supported by
references to primary sources of modeling information is discussedby Legan et al (2002) McKellar and Lu (2004) Ross and McMeekin
(2003) Whiting and Buchanan (2007) and Van Gerwen and
Zwietering (1998)
When designing microbial inactivation experiments kinetic
studies measuring changes with time are preferred as they provide
more information than end-point measurements Additionally
kinetic studies offer 1047298exibility and a depth of understanding that is
not obtainable via end-point measurements alone (Legan et al
2002) Therefore experimental points should be selected to allow
the true nature of the microbial response to the lethal agent to be
determined The inoculation level should be suf 1047297ciently high to
demonstrate the performance criteria without the need for
extrapolation if practically possible Points should be spaced over
the time interval to allow any curvature in the response to be
MH Zwietering et al Food Control 21 (2010) 1716 e1722 1717
8132019 Validation of Control Measures in a Food Chain Using the FSO Concept
httpslidepdfcomreaderfullvalidation-of-control-measures-in-a-food-chain-using-the-fso-concept 37
described ideally this typically involves 10e12 points over
a 6e7 log10 (orgreater) reduction in population size This implies an
inoculation level of at least 108e109 CFUml or g A zero-time point
is critical and equidistant time intervals are often selected except
for very slow inactivation rates where intervals that increase
geometrically between samplings are often useful
322 Growth (SI)
The population of a pathogen will increase during storage
periods if the food storage temperature and packaging conditions
support growth Storage periods may occur for raw ingredients or
at intermediate points during the manufacturing After manufac-
ture there will be a series of storage periods through distribution
including at the retail level in the home andor in food service
operations Generally public health cannot be assured unless the
potential for growth of pathogens is minimized Nevertheless if the
pathogen is not completely inactivated and growth is possible then
an accurate estimation and validation of the amount of growth
during storage and distribution that would be expected in normal
and occasional abuse becomes an important component in vali-
dating that the FSO is achieved
As previously described for validating microbial inactivation
processes estimates for growth may be obtained from a variety of sources including the literature models and challenge tests (Scott
et al 2005) Increasing reliance is given to different studies as the
experimental conditions more closely re1047298ect the actual conditions
of thefood eg laboratory vs pilotplantor pureculturevs food with
spoilage 1047298ora For satisfactory validation of a pathogenrsquos growth in
a food challenge tests with the normal background 1047298ora will bethe
authoritative source of information Models and broth studies can
provide support for evaluating minor changes in formulation and
strain differences and for interpolating to conditions not explicitly
tested in the challenge tests Applications of predictive models in
food microbiology include models that predict the growth rate of
bacterial pathogens in response to product or environmental factors
such as water activity (aw) temperature or pH Growth models can
be used to design safe product formulations to set appropriatestorage conditions and to explore the maximum interval between
cleaning and sanitizing for process equipment
Factors that should be considered when evaluating growth data
include the strain(s) used surrogates physiological state of the
inoculum method of inoculation degree of simulation of the
experimental or pilot plant conditions to the commercial process
inclusion of all environmental factors in the food (pH aw acid
anions) and externalfactors(temperature packaging) and inclusion
of the spoilage 1047298ora Detailed information on the design and
implementation of microbiological challenge studies (also referred
to as inoculated pack studies) has been reported by IFT (2001) and
Scott et al (2005)
323 Recontamination (SI)If a food process includes pasteurization or another lethal step
that eliminates the pathogen then all of the pathogens present at
consumption are the consequence of recontamination Foods pro-
cessed to deliver 6e8 log10 reduction of the pathogen will result in
a very low frequency of contaminated packages after such
a process For example a product containing initially a homoge-
neous contamination level of 100 cfug in a 100 g package will
contain 0001 cfupackage after a 7 log10 reduction meaning 1 in
1000 packages contaminated with one (or a few) cells When
determining whether such a food meets a PO at a further step or
FSO calculation of the food process begins after the lethal step The
appropriate parameters to consider are the frequency and level of
contamination essentially they form a new H 0 Little literature
data exists for guidance concerning frequencies and levels of
recontamination and few applicable models have been developed
to estimate the results of recontamination Suf 1047297cient sampling of
the speci1047297c process at this step or at a subsequent step with a back
calculation is the only way to obtain valid data on recontamination
A food process without a lethal step and with several potential
points of additional recontamination is dif 1047297cult to predict Suf 1047297-
cient sampling of the food after the last point of recontamination is
a possible way to validate whether a PO or FSO is being achieved
Another approach to controlling contamination is environmental
monitoring and monitoring of food contact surfaces and integrating
this information into the sanitation program Other factors to
consider are packaging integrity and proper training on handling
practices by employees
4 Validation of FSO compliance probabilistic aspects the
effect of variability in processing on non-conformance to an
FSOPO
41 Introduction
One way to show compliance to an FSO is by using the ICMSF
equation
H 0 X
R thornX
I FSO (1)
By combining information from different sources concerning
the initial level (H 0) reductions (SR) and increases (SI ) of the
microbiological hazard through the food production and distribu-
tion chain it can be determined if the FSO or PO will be reliably
met It can also be determined how variability in the steps in the
processfood chain in1047298uences the ability to meet the FSO
In the following examples the impact of including the effect of
statistical distributions for H 0 SR and SI on the hazardlevel and the
percentage non-conformance (percentage of product above the PO
or FSO) is calculated First the problem will be solved by a point-
estimateapproach Thenthe impact on variability in the initial levels
processing (using as an example of washing produce to achievea reduction in the pathogen of concern) and growth during distri-
bution(increase) in meeting thePO andFSO will be determined The
process and product example is fresh cut washed and packaged
lettuce where Listeria monocytogenes is the target pathogenic
microorganism of concern For illustrative purposes it is assumed
that to reach an ALOP a maximum exposure of L monocytogenes of
100 cfug (FSO frac14 2 log10 cfug) for ready-to-eat foods is set
42 Point-estimate approach
In the paper of Szabo Simons Coventry and Cole (2003) esti-
mates are made of the initial contamination level of L mono-
cytogenes on pre-cut lettuce reduction using sanitizing rinses and
the increase in levels of the pathogen after packaging and during
storage and distribution For a given initial level of L monocytogenes
on lettuce and an expected level of growth (increase) during
storage and distribution the necessary reduction level in order to
achieve a given FSO can be determined For example in Szabo et al
(2003) itis giventhat for an H 0 of 01 log10 cfug of L monocytogenes
and for a potential increase of SI frac14 27 log10 cfug during storage for
14 days at 8 C a SR 08 log10 cfug is necessary to achieve the set
FSO of 2 log10 cfug
H 0 P
R thornP
I frac14 2001 08 thorn 27 frac14 20
(2)
The average process can therefore be considered to exactly
achieve the FSO
MH Zwietering et al Food Control 21 (2010) 1716 e17221718
8132019 Validation of Control Measures in a Food Chain Using the FSO Concept
httpslidepdfcomreaderfullvalidation-of-control-measures-in-a-food-chain-using-the-fso-concept 47
43 Including variability in the process
Now let the standard deviation s for SI be 059 (Szabo et al
2003 with SI the log10 increase of the levels of L monocytogenes
being normally distributed) but still consider the H 0 and SR levels
as exact Due to the variability of the increase in levels of L mon-
ocytogenes (the distribution) the producer must target a lower
average initial level in order to reduce the proportion of defective
units (units with L monocytogenes levels higher than the FSO) If thesame limit (ie FSO frac14 2 log10 cfug) is considered 50 of the
products would not conform to the FSO The level of reduction
needed to achieve a certain level of conformity is given for various
other examples in Table 1 which shows the fraction of servings that
does not meet the FSO given different reductions (SR) The greater
the reduction the lower the frequency of non-conforming servings
This frequency of non-conformity is a risk managers decision
44 Including variability in the process for all process stages
In nearly every process all three variables H 0 SI and SR will have
a distribution with values as for example given in Table 2 The
resulting 1047297nal distribution (which describes the distribution of levels
of L monocytogenes in packages of fresh cut lettuce at the point of consumption) can be described by a mean value that is equal to the
sum of the means of H 0 SI and SR The mean however is not
a correct indicator of the risk without representing alsothe variance
The variance of the total distribution is equal to the sum of the vari-
ances (the1047297nalstandarddeviation is thesquare rootof the sum of the
squares of the variable standard deviations (Snedecor amp Cochran
1989) The distributions are represented graphically in Fig 1
Given this distribution of outcomes the proportion of packages of
lettuce not meeting the FSO can be determined which in this
example is 02 (This proportion can be determined from the area
under a normal curve that exceeds the FSO using the Excel or similar
function following the procedure as given in the footnote in Table 1)
45 Ineffective washing step
Assuming that the lettuce washing step is not effective (SR frac14 0)
in reducing the level of L monocytogenes (Table 3 Fig 2) the effect
on the overall effectiveness of the process can be determined We
can see that the mean level of L monocytogenes in packages of fresh
cut lettuce is higher (from e12 to 02) and the overall standard
deviation of the level decreases (from 1112 to 0994) compared to
the previous calculation (Table 2) The proportion of packages of
lettuce having levels of L monocytogenes at the point of
consumption that are above the FSO (2 log10 cfug) increases to
35 Note that the standard deviation does not differ much since
the overall standard deviation is mainly determined by the largest
contributors which in this case is H 0
In this example due to the ineffectiveness of the washing
procedure there is a higher proportion of packages (35) of lettuce
with levels of L monocytogenes which do not meet the FSO
(2 log10 cfug) therefore this may be a condition under which
a producer would not wantbe able to operate
46 Effect of shortening the shelf life of the packaged lettuce
If the product supports growth of the pathogen the length of the
shelf life can in1047298uence its impact on public health In this example
the effect of a shorter product shelf life on the proportion of lettuce
packages that do not meet the FSO is evaluated by reducing the
predicted value for SI (Table 4 Fig 3) If the product is stored for 7
days at 8 C rather than 14 days the increase in L monocytogenes is
estimated to be 19 with a standard deviation of 056 compared to
the previous growth of 27 log10 cfug(Szabo et al 2003)
By decreasing the shelf life which decreases the extent of
growth of L monocytogenes in the packages of fresh cut lettuce (and
very slightly decreases the standard deviation) the proportion of
packages of lettuce that do not meet the FSO is decreased to 0013
47 Impact of more effective process control
The impact of better process control on the proportion of pack-
ages of fresh cut lettuce that meet the FSO can be evaluated If for
Table 1
Results of various levels of reduction (SR) on the proportion of defective units (P )
with standard deviation of the increase step frac14 059 (log10 increase normally
distributed with standard deviation of 059)a
SR H 0 SR thorn SI P (H 0 SR thorn SI )gt2 (sd frac14 059)
08 01e08 thorn 27 frac14 20 05 (50)
12 01e12 thorn 27 frac14 160 025 (25)
177 01e177 thorn 27 frac14 103 005 (5)
217 01e
217 thorn 27 frac14 063 001 (1)262 01e262 thorn 27 frac14 018 0001 (01)
a Note the proportion above the FSO can be calculated in Excel by 1-NORMDIST
(2 xs1) for example for the last line frac14 1-NORMDIST(20180591) frac14 0001019 so
theproportionof being above 2 logs for a lognormal distribution withlog mean 018
and standard deviation 059 is 01 In this example H 0 and SR have no variation
Table 2
Resultson theproportionof products that donot meetthe FSO (packages offreshcut
lettuce calculated to have greater than 2 log10 cfug L monocytogenes present at the
point of consumption) with various mean and standard deviation values (s) for H 0
SI and SR
H 0 SR SI Totala
mean log10 250 14 27 12 H 0 SR thorn SI
s 08 05 059 1112 s frac14 sqrt(s12 thorn s2
2 thorn s32)
P (gtFSO) 020
a Total is the level of L monocytogenes present in a package of lettuce at the point
of consumption
0
01
02
03
04
05
06
07
08
09
-8 -6 -4 -2 0 2 4 6 8
log(C)
P r o b a
b i l i t y
d i s t r i b u t i o n
Fig 1 Probability distribution of the initial level (H 0 A) reduction (SR -) and
increase (SI ) of L monocytogenes on fresh cut lettuce and resulting overall distri-
bution (solid line meaning the distribution of the levels of L monocytogenes in
packages of lettuce at the point of consumption) following the input values in Table 2
Proportion of packages that do not meet the FSO (dashed line) is 020
Table 3
The impact of a washing step (SR) that does not reduce levels of Listeria mono-
cytogenes on lettuce on the proportion of packages of fresh cut lettuce that do not
meet the Food Safety Objective
H 0 SR SI Total
mean log10 250 0 27 02 H 0 SR thorn SI
s 08 e 059 0994 s frac14 sqrt(s12 thorn s2
2 thorn s32)
P (gtFSO) 35
MH Zwietering et al Food Control 21 (2010) 1716 e1722 1719
8132019 Validation of Control Measures in a Food Chain Using the FSO Concept
httpslidepdfcomreaderfullvalidation-of-control-measures-in-a-food-chain-using-the-fso-concept 57
instance raw materials with less variability (standard deviation) in
thelevels of L monocytogenes present on thelettuce canbe obtainedby supplier selection changing supplier speci1047297cations or better
input control the standard deviation of H 0 can be reduced (Table 5
Fig 4 compare with Table 2) By this better process control the
average level of L monocytogenes on the raw materials remains the
same but the 1047297nal standard deviation goes down resulting in
a lower percentage of packages of fresh cut lettuce that donot meet
the FSO (going from 02 to 0012) or conversely a larger
percentage of product now meets the FSO comparable to a reduc-
tion in shelf life to 7 days (Table 4)
48 Ability to meet the FSO at the same level of performance by
different means
It can also be determined how an equivalent outcome can beachieved (same proportion of the products meeting the FSO) in this
instance only 02 of packages of fresh cut lettuce not meeting the
FSO (see Table 2) by reducing the variability of one of the inputs
For example if the variability (standard deviation) of the initial
levels of L monocytogenes on the raw materials is reduced from 08
to 04 the required level of reduction of L monocytogenes during
the lettuce washing step (SR) could be decreased from 14 to 07
while still achieving the same proportion of product that meets the
FSO (Table 6)
49 Relation between log mean value standard deviation and
proportion of products that do not meet the FSO (levels of L
monocytogenes at thepointof consumption are greater than theFSO)
The proportion of products in which the level of L monocytogenes
is above the FSO is determined by both the mean log levels and the
standard deviation of the combined distributions for H 0 SR and SI
Different combinations of the mean and standard deviation resulting
in thesame overall proportion of products notmeeting theFSO canbe
calculated and the results are shown in Fig 5The values in Fig 5 can also be determined by calculation since
the probability that a value is higher than a certain level can be
determined with the z -score (Snedecor amp Cochran 1989) For an
FSO of 2 the calculation becomes x thorn z $s frac14 2 so for a given mean
value x the s value that gives a certain probability to surpass the
FSO equals s frac14 (2 x) z with z the value determined by the
probability level (Table 7) For example at the line in Fig 5 for 005
(5) the probability is described by
s frac14 eth2 xTHORN= z frac14 eth2 xTHORN=1645 (3)
In Table 1 the levels of 103 063 and 018 and with a standard
deviation of 059 correspond to a probability level of 005 001 and
0001 respectively (2 103)1645 frac14 059 ( z -value for 005 prob-
ability level) (2 063)2326 frac14 059 (2 018)309 frac14 059The effect of reducing the standard deviation in raw materials
or elsewhere can be converted in a log gain by this approach
Having two different processes that have equal probability to
surpass the FSO it can be derived from x1 thorn z ∙s1 frac14 x2 thorn z ∙s2 that
D x frac14 z Ds (4)
resulting in a formula that canprovide an equivalent changein level
following a reduction of the standard deviation
For example for an FSO set with a con1047297dence level of 99
(meaning that 99 of the product units do con1047297rm to this level) z
equals 233 resulting in
D x frac14 233Ds (5)
Therefore a 01 log10 decrease in the standard deviation is
equivalent to a 0233 log10 decrease in average level
To calculate the difference in equivalent reduction necessary to
achieve a 02 defectiveratefor an H 0 with a 08 standard deviation
0
01
02
03
04
05
06
07
08
-8 -6 -4 -2 0 2 4 6 8
log(C)
n o i t u b i r t s i d
y t i l i b
a b o r P
Fig 2 Probability distribution of the initial level (H 0 A) increase (SI ) and
resulting overall distribution (solid line meaning the distribution of the levels of L
monocytogenes in packages of lettuce at the point of consumption) for a process in
which the washing step is not effective in reducing the levels of L monocytogenes
(SR frac14 0) following the input values in Table 3 Proportion of packages that do not meet
the FSO (dashed line) is 35
Table 4
The impact of shortening the shelf life of the product from 14 to 7 days thus
reducing the level of growth (SI ) on the proportion of packages of fresh cut lettuce
that do not meet the Food Safety Objective
H 0 SR SI Total
mean log10 250 14 19 2 H 0 SR thorn SI
s 08 05 056 1097 s frac14 sqrt(s12 thorn s2
2 thorn s32)
P (gtFS O) 0 013
0
01
02
03
04
05
06
07
08
09
-8 -6 -4 -2 0 2 4 6 8
log(C)
n o i t u b i r t s i d
y t i l i b
a b o r P
Fig 3 Probability distribution of the initial level ( H 0 A) reduction (SR -) and
increase (SI ) and resulting overall distribution (solid line meaning the distribution
of the levels of L monocytogenes in packages of lettuce at the point of consumption) for
a product with a shortened shelf life (see Table 4) therefore the level of growth of L
monocytogenes in the packaged lettuce (SI ) is decreased Proportion of packages that
do not meet the FSO (dashed lined) is 0013
Table 5
The impact of a reduction in the variability (smaller standarddeviation) of the initial
levels of L monocytogenes on raw materials (H 0) on the proportion of packages of
fresh cut lettuce that do not meet the Food Safety Objective
H 0 SR SI Total
mean log10 250 14 27 12 H 0 SR thorn SI
s 04 05 059 08707 s frac14 sqrt(s12 thorn s2
2 thorn s32)
P (gtFSO) 0012
MH Zwietering et al Food Control 21 (2010) 1716 e17221720
8132019 Validation of Control Measures in a Food Chain Using the FSO Concept
httpslidepdfcomreaderfullvalidation-of-control-measures-in-a-food-chain-using-the-fso-concept 67
(Table 2) to a H 0 with a 04 standard deviation (Table 6) we canperform the following calculation
By reducing the s in H 0 from 08 to 04 the standard deviation of
theoveralllevel willreducefrom 1112(sqrt(08^2 thorn 05^2 thorn 059^2)
see Table 2) to 08707 (sqrt(04^2 thorn 05^2 thorn 059^2) see Table 6) so
this translates to a ldquogainrdquo in log mean of 2878(1112 08707) frac14
0697 logs Instead of a 14 log10 reduction (Table 2) a 07 log10
reduction is suf 1047297cient (Table 6)
So how much one could change the mean concentration while
retaining the same proportion of defective products depends both
on the change in overall standard deviation but also on the
conformity level (eg 1 proportion of product that does not meet
the FSO) set (Fig 5)
5 Conclusions
From the various examples presented in this paper the impact
of taking into consideration both the level and the variability of H 0
SR and SI on the proportion of product meeting the FSO has been
demonstrated With this consideration a deeper level of under-
standing is obtained of the in1047298uence of both the levels and vari-
ability of the initial microbiological load on the incoming materials
the level of process control achieved for those processes which
reduce the level of the microorganism of concern and the level and
variability of the increase of the pathogen of concern during storage
and distribution A food manufacturer can determine where in the
process they can have the biggest impact on ensuring that the
appropriate proportion of product meets the FSO (ie decreasing
variability of a lethal process vs decreasing the initial level of themicroorganism of concern on the raw materials)
The following information about the assumptions made with
these calculations should be recognized
All variables are assumed to be log normally distributed So the
log of the variables as used in the FSO equation is normally
distributed This makes also their sum in the FSO equationhaving a normal distribution If values have other distributions
Monte-Carlo type calculations are necessary to determine the
statistical distribution of the sum It should be noted however
that for initial levels log10 increase and log10 reduction
a lognormal distribution is often found (and described) in
literature although in actuality the distributions may not
precisely meet this assumption they are usually suf 1047297ciently
close
In this example it was assumed that calculations hold even for
low levels It should be noted that for instance a product unit
of 100 g with an initial pathogen level of 2 log 10 contains after
a 6 log10 inactivation step a level of 4 log10 This is not a level
of 4 log10 in all products but in reality a level of 1 microor-
ganism in 100 g unit (2 log10) for only 1 of the units Theother 99 of the units are free of the microorganism This can
in certain cases have implications that should be investigated
Because microorganisms are discrete entities it is important to
check that a situation does not arise with less than one
microorganism per container or package If this occurs Poisson
distributions must be considered for the fraction of packages
that would contain no microorganisms
If no data on standard deviation are available but minmax-
data are present representing the range where 95 of the data
will be the standard deviation can be estimated by
s frac14 (05 (max min))196
Products with a same level of conformity (equal probability to
be above a certain FSO) but different standard deviations of the
1047297nal level of pathogens could have a different risk of illness
depending on the doseeresponse relation
Both experimental and statistical aspects have been described
that can be combined to support the con1047297dence that a process can
conform to a set FSO (ie validation) The effects of variability in
0
02
04
06
08
1
12
-8 -6 -4 -2 0 2 4 6 8
log(C)
n o i t u b i r t s i d
y t i l i b a b o r P
Fig 4 Probability distribution of the initial level (H 0 A) reduction (SR -) and
increase (SI ) and resulting overall distribution (solid line meaning the distribution
of the levels of L monocytogenes in packages of lettuce at the point of consumption) for
a product with reduced variability of initial levels ( H 0) of L monocytogenes on raw
materials following the input values in Table 5 Proportion of packages that do not
meet the FSO (dashed line) is 0012
Table 6
The impact of reducing the variability of the initial levels of L monocytogenes on raw
materials (H 0) at the same time as lowering the level of reduction of L mono-
cytogenes during the washing step (SR) on the proportion of packages of fresh cut
lettuce that do not meet the Food Safety Objective (compare to Table 2)
H 0 SR SI Total
mean log10 250 07 27 05 H 0 SR thorn SI
s 04 05 059 08707 s frac14 sqrt(s12 thorn s2
2 thorn s32)
P (gtFSO) 0 20
0
05
1
15
2
25
3
-25 -2 -15 -1 -05 0 05
log(C)
s t a n
d a r d
d e v i a t i o n
Fig 5 Various combinations of mean log levels log( C ) and standard deviation of the
combined distributions for H 0 SR and SI resulting in a particular proportion of product
that does not meet the FSO (in this case FSO frac14 2) The various lines represent different
proportions (A frac14 5 - frac14 1 frac14 05 x frac14 02 solid line frac14 01) of products not
meeting the FSO The examples from Tables 2 and 6 are indicated for a 02 level
Table 7
z -values at various probability levels (one sided test)
Probability level z -score
005 1645
001 2326
0005 2576
0002 2878
0001 3090
MH Zwietering et al Food Control 21 (2010) 1716 e1722 1721
8132019 Validation of Control Measures in a Food Chain Using the FSO Concept
httpslidepdfcomreaderfullvalidation-of-control-measures-in-a-food-chain-using-the-fso-concept 77
initial level reduction andor growth is illustrated and it is shown
how to determine an equivalence in performance either by the
level or the variability in a level Given the above mentioned
assumptions in certain cases this analysis may be needed to be
followed up by a more detailed risk assessment
References
CAC (Codex Alimentarius Commission) (2007) Recommended international code of hygienic practice for egg products CACRCP 15 Rome FAO
CAC (Codex Alimentarius Commission) (2008) Guideline for the validation of foodsafety control measures CACGL 69 Rome FAO
ICMSF (International Commission on Microbiological Speci1047297cations for Foods)(2002) Microorganisms in foods 7 Microbiological testing in food safetymanagement New York Kluwer AcademicPlenum Publishers
IFT (2001) Evaluation and de 1047297nition of potentially hazardous foods A report by theinstitute of food technologists for the food and drug administration of the USDepartment of Health and Human Services httpmembersiftorgNRrdonlyresF537AA13-CFDB-420D-94BC-ED763D9C0A4D0crfsfssupn2p001007pdf (Accessed 211209)
Keener L (2006) Hurdling new technology challenges investing in process vali-dation of novel technologies Food Safety Magazine (FebruaryMarch issue)
Legan J D Stewart C M Vandeven M amp Cole M B (2002) Modelling thegrowth survival and death of bacterial pathogens in foods In C Blackburn amp
P J McClure (Eds) Foodborne pathogens Hazards risk and control (pp 53e95)Cambridge UK Woodhead Publishing
McKellar R C amp Lu X (2004) Modeling microbial responses in foods Boca Raton FLCRC Press
Ross T amp McMeekin T A (2003) Modeling microbial growth within food safetyrisk assessments Risk Analysis 23 179e197
Scott V N Swanson K M J Freier T A Pruett W P Jr Sveum W H Hall P Aet al (2005) Guidelines for conducting Listeria monoctogenes challenge testingof foods Food Protection Trends 25 818e825
Snedecor G W amp Cochran W G (1989) Statistical methods (8th ed) Ames IA
Iowa State University PressSwanson K M J amp Anderson J E (2000) Industry perspectives on the use of
microbial data for hazard analysis and critical control point validation andveri1047297cation Journal of Food Protection 63 815e818
Szabo E A Simons L Coventry M J amp Cole M B (2003) Assessment of controlmeasures to achieve a food safety objective of less than 100 CFU of Listeriamonocytogenes per gram at the point of consumption for fresh precut iceberglettuce Journal of Food Protection 66 256e264
USDA-FSIS (2009) Raw ground beef e E coli testing results Available at httpwwwfsisusdagovscience2009_Ecoli_positive_resultsindexasp (Accessed 211209)
Van Gerwen S J C amp Zwietering M H (1998) Growth and inactivation models tobe used in quantitative risk assessments Journal of Food Protection 611541e1549
Whiting R C amp Buchanan R L (2007) Predictive modeling and risk assessment InM P Doyle amp L R Beuchat (Eds) Food microbiology Fundamentals and frontiers(3rd ed) (pp 953e969) Washington DC ASM Press Chapter 45
MH Zwietering et al Food Control 21 (2010) 1716 e17221722
8132019 Validation of Control Measures in a Food Chain Using the FSO Concept
httpslidepdfcomreaderfullvalidation-of-control-measures-in-a-food-chain-using-the-fso-concept 37
described ideally this typically involves 10e12 points over
a 6e7 log10 (orgreater) reduction in population size This implies an
inoculation level of at least 108e109 CFUml or g A zero-time point
is critical and equidistant time intervals are often selected except
for very slow inactivation rates where intervals that increase
geometrically between samplings are often useful
322 Growth (SI)
The population of a pathogen will increase during storage
periods if the food storage temperature and packaging conditions
support growth Storage periods may occur for raw ingredients or
at intermediate points during the manufacturing After manufac-
ture there will be a series of storage periods through distribution
including at the retail level in the home andor in food service
operations Generally public health cannot be assured unless the
potential for growth of pathogens is minimized Nevertheless if the
pathogen is not completely inactivated and growth is possible then
an accurate estimation and validation of the amount of growth
during storage and distribution that would be expected in normal
and occasional abuse becomes an important component in vali-
dating that the FSO is achieved
As previously described for validating microbial inactivation
processes estimates for growth may be obtained from a variety of sources including the literature models and challenge tests (Scott
et al 2005) Increasing reliance is given to different studies as the
experimental conditions more closely re1047298ect the actual conditions
of thefood eg laboratory vs pilotplantor pureculturevs food with
spoilage 1047298ora For satisfactory validation of a pathogenrsquos growth in
a food challenge tests with the normal background 1047298ora will bethe
authoritative source of information Models and broth studies can
provide support for evaluating minor changes in formulation and
strain differences and for interpolating to conditions not explicitly
tested in the challenge tests Applications of predictive models in
food microbiology include models that predict the growth rate of
bacterial pathogens in response to product or environmental factors
such as water activity (aw) temperature or pH Growth models can
be used to design safe product formulations to set appropriatestorage conditions and to explore the maximum interval between
cleaning and sanitizing for process equipment
Factors that should be considered when evaluating growth data
include the strain(s) used surrogates physiological state of the
inoculum method of inoculation degree of simulation of the
experimental or pilot plant conditions to the commercial process
inclusion of all environmental factors in the food (pH aw acid
anions) and externalfactors(temperature packaging) and inclusion
of the spoilage 1047298ora Detailed information on the design and
implementation of microbiological challenge studies (also referred
to as inoculated pack studies) has been reported by IFT (2001) and
Scott et al (2005)
323 Recontamination (SI)If a food process includes pasteurization or another lethal step
that eliminates the pathogen then all of the pathogens present at
consumption are the consequence of recontamination Foods pro-
cessed to deliver 6e8 log10 reduction of the pathogen will result in
a very low frequency of contaminated packages after such
a process For example a product containing initially a homoge-
neous contamination level of 100 cfug in a 100 g package will
contain 0001 cfupackage after a 7 log10 reduction meaning 1 in
1000 packages contaminated with one (or a few) cells When
determining whether such a food meets a PO at a further step or
FSO calculation of the food process begins after the lethal step The
appropriate parameters to consider are the frequency and level of
contamination essentially they form a new H 0 Little literature
data exists for guidance concerning frequencies and levels of
recontamination and few applicable models have been developed
to estimate the results of recontamination Suf 1047297cient sampling of
the speci1047297c process at this step or at a subsequent step with a back
calculation is the only way to obtain valid data on recontamination
A food process without a lethal step and with several potential
points of additional recontamination is dif 1047297cult to predict Suf 1047297-
cient sampling of the food after the last point of recontamination is
a possible way to validate whether a PO or FSO is being achieved
Another approach to controlling contamination is environmental
monitoring and monitoring of food contact surfaces and integrating
this information into the sanitation program Other factors to
consider are packaging integrity and proper training on handling
practices by employees
4 Validation of FSO compliance probabilistic aspects the
effect of variability in processing on non-conformance to an
FSOPO
41 Introduction
One way to show compliance to an FSO is by using the ICMSF
equation
H 0 X
R thornX
I FSO (1)
By combining information from different sources concerning
the initial level (H 0) reductions (SR) and increases (SI ) of the
microbiological hazard through the food production and distribu-
tion chain it can be determined if the FSO or PO will be reliably
met It can also be determined how variability in the steps in the
processfood chain in1047298uences the ability to meet the FSO
In the following examples the impact of including the effect of
statistical distributions for H 0 SR and SI on the hazardlevel and the
percentage non-conformance (percentage of product above the PO
or FSO) is calculated First the problem will be solved by a point-
estimateapproach Thenthe impact on variability in the initial levels
processing (using as an example of washing produce to achievea reduction in the pathogen of concern) and growth during distri-
bution(increase) in meeting thePO andFSO will be determined The
process and product example is fresh cut washed and packaged
lettuce where Listeria monocytogenes is the target pathogenic
microorganism of concern For illustrative purposes it is assumed
that to reach an ALOP a maximum exposure of L monocytogenes of
100 cfug (FSO frac14 2 log10 cfug) for ready-to-eat foods is set
42 Point-estimate approach
In the paper of Szabo Simons Coventry and Cole (2003) esti-
mates are made of the initial contamination level of L mono-
cytogenes on pre-cut lettuce reduction using sanitizing rinses and
the increase in levels of the pathogen after packaging and during
storage and distribution For a given initial level of L monocytogenes
on lettuce and an expected level of growth (increase) during
storage and distribution the necessary reduction level in order to
achieve a given FSO can be determined For example in Szabo et al
(2003) itis giventhat for an H 0 of 01 log10 cfug of L monocytogenes
and for a potential increase of SI frac14 27 log10 cfug during storage for
14 days at 8 C a SR 08 log10 cfug is necessary to achieve the set
FSO of 2 log10 cfug
H 0 P
R thornP
I frac14 2001 08 thorn 27 frac14 20
(2)
The average process can therefore be considered to exactly
achieve the FSO
MH Zwietering et al Food Control 21 (2010) 1716 e17221718
8132019 Validation of Control Measures in a Food Chain Using the FSO Concept
httpslidepdfcomreaderfullvalidation-of-control-measures-in-a-food-chain-using-the-fso-concept 47
43 Including variability in the process
Now let the standard deviation s for SI be 059 (Szabo et al
2003 with SI the log10 increase of the levels of L monocytogenes
being normally distributed) but still consider the H 0 and SR levels
as exact Due to the variability of the increase in levels of L mon-
ocytogenes (the distribution) the producer must target a lower
average initial level in order to reduce the proportion of defective
units (units with L monocytogenes levels higher than the FSO) If thesame limit (ie FSO frac14 2 log10 cfug) is considered 50 of the
products would not conform to the FSO The level of reduction
needed to achieve a certain level of conformity is given for various
other examples in Table 1 which shows the fraction of servings that
does not meet the FSO given different reductions (SR) The greater
the reduction the lower the frequency of non-conforming servings
This frequency of non-conformity is a risk managers decision
44 Including variability in the process for all process stages
In nearly every process all three variables H 0 SI and SR will have
a distribution with values as for example given in Table 2 The
resulting 1047297nal distribution (which describes the distribution of levels
of L monocytogenes in packages of fresh cut lettuce at the point of consumption) can be described by a mean value that is equal to the
sum of the means of H 0 SI and SR The mean however is not
a correct indicator of the risk without representing alsothe variance
The variance of the total distribution is equal to the sum of the vari-
ances (the1047297nalstandarddeviation is thesquare rootof the sum of the
squares of the variable standard deviations (Snedecor amp Cochran
1989) The distributions are represented graphically in Fig 1
Given this distribution of outcomes the proportion of packages of
lettuce not meeting the FSO can be determined which in this
example is 02 (This proportion can be determined from the area
under a normal curve that exceeds the FSO using the Excel or similar
function following the procedure as given in the footnote in Table 1)
45 Ineffective washing step
Assuming that the lettuce washing step is not effective (SR frac14 0)
in reducing the level of L monocytogenes (Table 3 Fig 2) the effect
on the overall effectiveness of the process can be determined We
can see that the mean level of L monocytogenes in packages of fresh
cut lettuce is higher (from e12 to 02) and the overall standard
deviation of the level decreases (from 1112 to 0994) compared to
the previous calculation (Table 2) The proportion of packages of
lettuce having levels of L monocytogenes at the point of
consumption that are above the FSO (2 log10 cfug) increases to
35 Note that the standard deviation does not differ much since
the overall standard deviation is mainly determined by the largest
contributors which in this case is H 0
In this example due to the ineffectiveness of the washing
procedure there is a higher proportion of packages (35) of lettuce
with levels of L monocytogenes which do not meet the FSO
(2 log10 cfug) therefore this may be a condition under which
a producer would not wantbe able to operate
46 Effect of shortening the shelf life of the packaged lettuce
If the product supports growth of the pathogen the length of the
shelf life can in1047298uence its impact on public health In this example
the effect of a shorter product shelf life on the proportion of lettuce
packages that do not meet the FSO is evaluated by reducing the
predicted value for SI (Table 4 Fig 3) If the product is stored for 7
days at 8 C rather than 14 days the increase in L monocytogenes is
estimated to be 19 with a standard deviation of 056 compared to
the previous growth of 27 log10 cfug(Szabo et al 2003)
By decreasing the shelf life which decreases the extent of
growth of L monocytogenes in the packages of fresh cut lettuce (and
very slightly decreases the standard deviation) the proportion of
packages of lettuce that do not meet the FSO is decreased to 0013
47 Impact of more effective process control
The impact of better process control on the proportion of pack-
ages of fresh cut lettuce that meet the FSO can be evaluated If for
Table 1
Results of various levels of reduction (SR) on the proportion of defective units (P )
with standard deviation of the increase step frac14 059 (log10 increase normally
distributed with standard deviation of 059)a
SR H 0 SR thorn SI P (H 0 SR thorn SI )gt2 (sd frac14 059)
08 01e08 thorn 27 frac14 20 05 (50)
12 01e12 thorn 27 frac14 160 025 (25)
177 01e177 thorn 27 frac14 103 005 (5)
217 01e
217 thorn 27 frac14 063 001 (1)262 01e262 thorn 27 frac14 018 0001 (01)
a Note the proportion above the FSO can be calculated in Excel by 1-NORMDIST
(2 xs1) for example for the last line frac14 1-NORMDIST(20180591) frac14 0001019 so
theproportionof being above 2 logs for a lognormal distribution withlog mean 018
and standard deviation 059 is 01 In this example H 0 and SR have no variation
Table 2
Resultson theproportionof products that donot meetthe FSO (packages offreshcut
lettuce calculated to have greater than 2 log10 cfug L monocytogenes present at the
point of consumption) with various mean and standard deviation values (s) for H 0
SI and SR
H 0 SR SI Totala
mean log10 250 14 27 12 H 0 SR thorn SI
s 08 05 059 1112 s frac14 sqrt(s12 thorn s2
2 thorn s32)
P (gtFSO) 020
a Total is the level of L monocytogenes present in a package of lettuce at the point
of consumption
0
01
02
03
04
05
06
07
08
09
-8 -6 -4 -2 0 2 4 6 8
log(C)
P r o b a
b i l i t y
d i s t r i b u t i o n
Fig 1 Probability distribution of the initial level (H 0 A) reduction (SR -) and
increase (SI ) of L monocytogenes on fresh cut lettuce and resulting overall distri-
bution (solid line meaning the distribution of the levels of L monocytogenes in
packages of lettuce at the point of consumption) following the input values in Table 2
Proportion of packages that do not meet the FSO (dashed line) is 020
Table 3
The impact of a washing step (SR) that does not reduce levels of Listeria mono-
cytogenes on lettuce on the proportion of packages of fresh cut lettuce that do not
meet the Food Safety Objective
H 0 SR SI Total
mean log10 250 0 27 02 H 0 SR thorn SI
s 08 e 059 0994 s frac14 sqrt(s12 thorn s2
2 thorn s32)
P (gtFSO) 35
MH Zwietering et al Food Control 21 (2010) 1716 e1722 1719
8132019 Validation of Control Measures in a Food Chain Using the FSO Concept
httpslidepdfcomreaderfullvalidation-of-control-measures-in-a-food-chain-using-the-fso-concept 57
instance raw materials with less variability (standard deviation) in
thelevels of L monocytogenes present on thelettuce canbe obtainedby supplier selection changing supplier speci1047297cations or better
input control the standard deviation of H 0 can be reduced (Table 5
Fig 4 compare with Table 2) By this better process control the
average level of L monocytogenes on the raw materials remains the
same but the 1047297nal standard deviation goes down resulting in
a lower percentage of packages of fresh cut lettuce that donot meet
the FSO (going from 02 to 0012) or conversely a larger
percentage of product now meets the FSO comparable to a reduc-
tion in shelf life to 7 days (Table 4)
48 Ability to meet the FSO at the same level of performance by
different means
It can also be determined how an equivalent outcome can beachieved (same proportion of the products meeting the FSO) in this
instance only 02 of packages of fresh cut lettuce not meeting the
FSO (see Table 2) by reducing the variability of one of the inputs
For example if the variability (standard deviation) of the initial
levels of L monocytogenes on the raw materials is reduced from 08
to 04 the required level of reduction of L monocytogenes during
the lettuce washing step (SR) could be decreased from 14 to 07
while still achieving the same proportion of product that meets the
FSO (Table 6)
49 Relation between log mean value standard deviation and
proportion of products that do not meet the FSO (levels of L
monocytogenes at thepointof consumption are greater than theFSO)
The proportion of products in which the level of L monocytogenes
is above the FSO is determined by both the mean log levels and the
standard deviation of the combined distributions for H 0 SR and SI
Different combinations of the mean and standard deviation resulting
in thesame overall proportion of products notmeeting theFSO canbe
calculated and the results are shown in Fig 5The values in Fig 5 can also be determined by calculation since
the probability that a value is higher than a certain level can be
determined with the z -score (Snedecor amp Cochran 1989) For an
FSO of 2 the calculation becomes x thorn z $s frac14 2 so for a given mean
value x the s value that gives a certain probability to surpass the
FSO equals s frac14 (2 x) z with z the value determined by the
probability level (Table 7) For example at the line in Fig 5 for 005
(5) the probability is described by
s frac14 eth2 xTHORN= z frac14 eth2 xTHORN=1645 (3)
In Table 1 the levels of 103 063 and 018 and with a standard
deviation of 059 correspond to a probability level of 005 001 and
0001 respectively (2 103)1645 frac14 059 ( z -value for 005 prob-
ability level) (2 063)2326 frac14 059 (2 018)309 frac14 059The effect of reducing the standard deviation in raw materials
or elsewhere can be converted in a log gain by this approach
Having two different processes that have equal probability to
surpass the FSO it can be derived from x1 thorn z ∙s1 frac14 x2 thorn z ∙s2 that
D x frac14 z Ds (4)
resulting in a formula that canprovide an equivalent changein level
following a reduction of the standard deviation
For example for an FSO set with a con1047297dence level of 99
(meaning that 99 of the product units do con1047297rm to this level) z
equals 233 resulting in
D x frac14 233Ds (5)
Therefore a 01 log10 decrease in the standard deviation is
equivalent to a 0233 log10 decrease in average level
To calculate the difference in equivalent reduction necessary to
achieve a 02 defectiveratefor an H 0 with a 08 standard deviation
0
01
02
03
04
05
06
07
08
-8 -6 -4 -2 0 2 4 6 8
log(C)
n o i t u b i r t s i d
y t i l i b
a b o r P
Fig 2 Probability distribution of the initial level (H 0 A) increase (SI ) and
resulting overall distribution (solid line meaning the distribution of the levels of L
monocytogenes in packages of lettuce at the point of consumption) for a process in
which the washing step is not effective in reducing the levels of L monocytogenes
(SR frac14 0) following the input values in Table 3 Proportion of packages that do not meet
the FSO (dashed line) is 35
Table 4
The impact of shortening the shelf life of the product from 14 to 7 days thus
reducing the level of growth (SI ) on the proportion of packages of fresh cut lettuce
that do not meet the Food Safety Objective
H 0 SR SI Total
mean log10 250 14 19 2 H 0 SR thorn SI
s 08 05 056 1097 s frac14 sqrt(s12 thorn s2
2 thorn s32)
P (gtFS O) 0 013
0
01
02
03
04
05
06
07
08
09
-8 -6 -4 -2 0 2 4 6 8
log(C)
n o i t u b i r t s i d
y t i l i b
a b o r P
Fig 3 Probability distribution of the initial level ( H 0 A) reduction (SR -) and
increase (SI ) and resulting overall distribution (solid line meaning the distribution
of the levels of L monocytogenes in packages of lettuce at the point of consumption) for
a product with a shortened shelf life (see Table 4) therefore the level of growth of L
monocytogenes in the packaged lettuce (SI ) is decreased Proportion of packages that
do not meet the FSO (dashed lined) is 0013
Table 5
The impact of a reduction in the variability (smaller standarddeviation) of the initial
levels of L monocytogenes on raw materials (H 0) on the proportion of packages of
fresh cut lettuce that do not meet the Food Safety Objective
H 0 SR SI Total
mean log10 250 14 27 12 H 0 SR thorn SI
s 04 05 059 08707 s frac14 sqrt(s12 thorn s2
2 thorn s32)
P (gtFSO) 0012
MH Zwietering et al Food Control 21 (2010) 1716 e17221720
8132019 Validation of Control Measures in a Food Chain Using the FSO Concept
httpslidepdfcomreaderfullvalidation-of-control-measures-in-a-food-chain-using-the-fso-concept 67
(Table 2) to a H 0 with a 04 standard deviation (Table 6) we canperform the following calculation
By reducing the s in H 0 from 08 to 04 the standard deviation of
theoveralllevel willreducefrom 1112(sqrt(08^2 thorn 05^2 thorn 059^2)
see Table 2) to 08707 (sqrt(04^2 thorn 05^2 thorn 059^2) see Table 6) so
this translates to a ldquogainrdquo in log mean of 2878(1112 08707) frac14
0697 logs Instead of a 14 log10 reduction (Table 2) a 07 log10
reduction is suf 1047297cient (Table 6)
So how much one could change the mean concentration while
retaining the same proportion of defective products depends both
on the change in overall standard deviation but also on the
conformity level (eg 1 proportion of product that does not meet
the FSO) set (Fig 5)
5 Conclusions
From the various examples presented in this paper the impact
of taking into consideration both the level and the variability of H 0
SR and SI on the proportion of product meeting the FSO has been
demonstrated With this consideration a deeper level of under-
standing is obtained of the in1047298uence of both the levels and vari-
ability of the initial microbiological load on the incoming materials
the level of process control achieved for those processes which
reduce the level of the microorganism of concern and the level and
variability of the increase of the pathogen of concern during storage
and distribution A food manufacturer can determine where in the
process they can have the biggest impact on ensuring that the
appropriate proportion of product meets the FSO (ie decreasing
variability of a lethal process vs decreasing the initial level of themicroorganism of concern on the raw materials)
The following information about the assumptions made with
these calculations should be recognized
All variables are assumed to be log normally distributed So the
log of the variables as used in the FSO equation is normally
distributed This makes also their sum in the FSO equationhaving a normal distribution If values have other distributions
Monte-Carlo type calculations are necessary to determine the
statistical distribution of the sum It should be noted however
that for initial levels log10 increase and log10 reduction
a lognormal distribution is often found (and described) in
literature although in actuality the distributions may not
precisely meet this assumption they are usually suf 1047297ciently
close
In this example it was assumed that calculations hold even for
low levels It should be noted that for instance a product unit
of 100 g with an initial pathogen level of 2 log 10 contains after
a 6 log10 inactivation step a level of 4 log10 This is not a level
of 4 log10 in all products but in reality a level of 1 microor-
ganism in 100 g unit (2 log10) for only 1 of the units Theother 99 of the units are free of the microorganism This can
in certain cases have implications that should be investigated
Because microorganisms are discrete entities it is important to
check that a situation does not arise with less than one
microorganism per container or package If this occurs Poisson
distributions must be considered for the fraction of packages
that would contain no microorganisms
If no data on standard deviation are available but minmax-
data are present representing the range where 95 of the data
will be the standard deviation can be estimated by
s frac14 (05 (max min))196
Products with a same level of conformity (equal probability to
be above a certain FSO) but different standard deviations of the
1047297nal level of pathogens could have a different risk of illness
depending on the doseeresponse relation
Both experimental and statistical aspects have been described
that can be combined to support the con1047297dence that a process can
conform to a set FSO (ie validation) The effects of variability in
0
02
04
06
08
1
12
-8 -6 -4 -2 0 2 4 6 8
log(C)
n o i t u b i r t s i d
y t i l i b a b o r P
Fig 4 Probability distribution of the initial level (H 0 A) reduction (SR -) and
increase (SI ) and resulting overall distribution (solid line meaning the distribution
of the levels of L monocytogenes in packages of lettuce at the point of consumption) for
a product with reduced variability of initial levels ( H 0) of L monocytogenes on raw
materials following the input values in Table 5 Proportion of packages that do not
meet the FSO (dashed line) is 0012
Table 6
The impact of reducing the variability of the initial levels of L monocytogenes on raw
materials (H 0) at the same time as lowering the level of reduction of L mono-
cytogenes during the washing step (SR) on the proportion of packages of fresh cut
lettuce that do not meet the Food Safety Objective (compare to Table 2)
H 0 SR SI Total
mean log10 250 07 27 05 H 0 SR thorn SI
s 04 05 059 08707 s frac14 sqrt(s12 thorn s2
2 thorn s32)
P (gtFSO) 0 20
0
05
1
15
2
25
3
-25 -2 -15 -1 -05 0 05
log(C)
s t a n
d a r d
d e v i a t i o n
Fig 5 Various combinations of mean log levels log( C ) and standard deviation of the
combined distributions for H 0 SR and SI resulting in a particular proportion of product
that does not meet the FSO (in this case FSO frac14 2) The various lines represent different
proportions (A frac14 5 - frac14 1 frac14 05 x frac14 02 solid line frac14 01) of products not
meeting the FSO The examples from Tables 2 and 6 are indicated for a 02 level
Table 7
z -values at various probability levels (one sided test)
Probability level z -score
005 1645
001 2326
0005 2576
0002 2878
0001 3090
MH Zwietering et al Food Control 21 (2010) 1716 e1722 1721
8132019 Validation of Control Measures in a Food Chain Using the FSO Concept
httpslidepdfcomreaderfullvalidation-of-control-measures-in-a-food-chain-using-the-fso-concept 77
initial level reduction andor growth is illustrated and it is shown
how to determine an equivalence in performance either by the
level or the variability in a level Given the above mentioned
assumptions in certain cases this analysis may be needed to be
followed up by a more detailed risk assessment
References
CAC (Codex Alimentarius Commission) (2007) Recommended international code of hygienic practice for egg products CACRCP 15 Rome FAO
CAC (Codex Alimentarius Commission) (2008) Guideline for the validation of foodsafety control measures CACGL 69 Rome FAO
ICMSF (International Commission on Microbiological Speci1047297cations for Foods)(2002) Microorganisms in foods 7 Microbiological testing in food safetymanagement New York Kluwer AcademicPlenum Publishers
IFT (2001) Evaluation and de 1047297nition of potentially hazardous foods A report by theinstitute of food technologists for the food and drug administration of the USDepartment of Health and Human Services httpmembersiftorgNRrdonlyresF537AA13-CFDB-420D-94BC-ED763D9C0A4D0crfsfssupn2p001007pdf (Accessed 211209)
Keener L (2006) Hurdling new technology challenges investing in process vali-dation of novel technologies Food Safety Magazine (FebruaryMarch issue)
Legan J D Stewart C M Vandeven M amp Cole M B (2002) Modelling thegrowth survival and death of bacterial pathogens in foods In C Blackburn amp
P J McClure (Eds) Foodborne pathogens Hazards risk and control (pp 53e95)Cambridge UK Woodhead Publishing
McKellar R C amp Lu X (2004) Modeling microbial responses in foods Boca Raton FLCRC Press
Ross T amp McMeekin T A (2003) Modeling microbial growth within food safetyrisk assessments Risk Analysis 23 179e197
Scott V N Swanson K M J Freier T A Pruett W P Jr Sveum W H Hall P Aet al (2005) Guidelines for conducting Listeria monoctogenes challenge testingof foods Food Protection Trends 25 818e825
Snedecor G W amp Cochran W G (1989) Statistical methods (8th ed) Ames IA
Iowa State University PressSwanson K M J amp Anderson J E (2000) Industry perspectives on the use of
microbial data for hazard analysis and critical control point validation andveri1047297cation Journal of Food Protection 63 815e818
Szabo E A Simons L Coventry M J amp Cole M B (2003) Assessment of controlmeasures to achieve a food safety objective of less than 100 CFU of Listeriamonocytogenes per gram at the point of consumption for fresh precut iceberglettuce Journal of Food Protection 66 256e264
USDA-FSIS (2009) Raw ground beef e E coli testing results Available at httpwwwfsisusdagovscience2009_Ecoli_positive_resultsindexasp (Accessed 211209)
Van Gerwen S J C amp Zwietering M H (1998) Growth and inactivation models tobe used in quantitative risk assessments Journal of Food Protection 611541e1549
Whiting R C amp Buchanan R L (2007) Predictive modeling and risk assessment InM P Doyle amp L R Beuchat (Eds) Food microbiology Fundamentals and frontiers(3rd ed) (pp 953e969) Washington DC ASM Press Chapter 45
MH Zwietering et al Food Control 21 (2010) 1716 e17221722
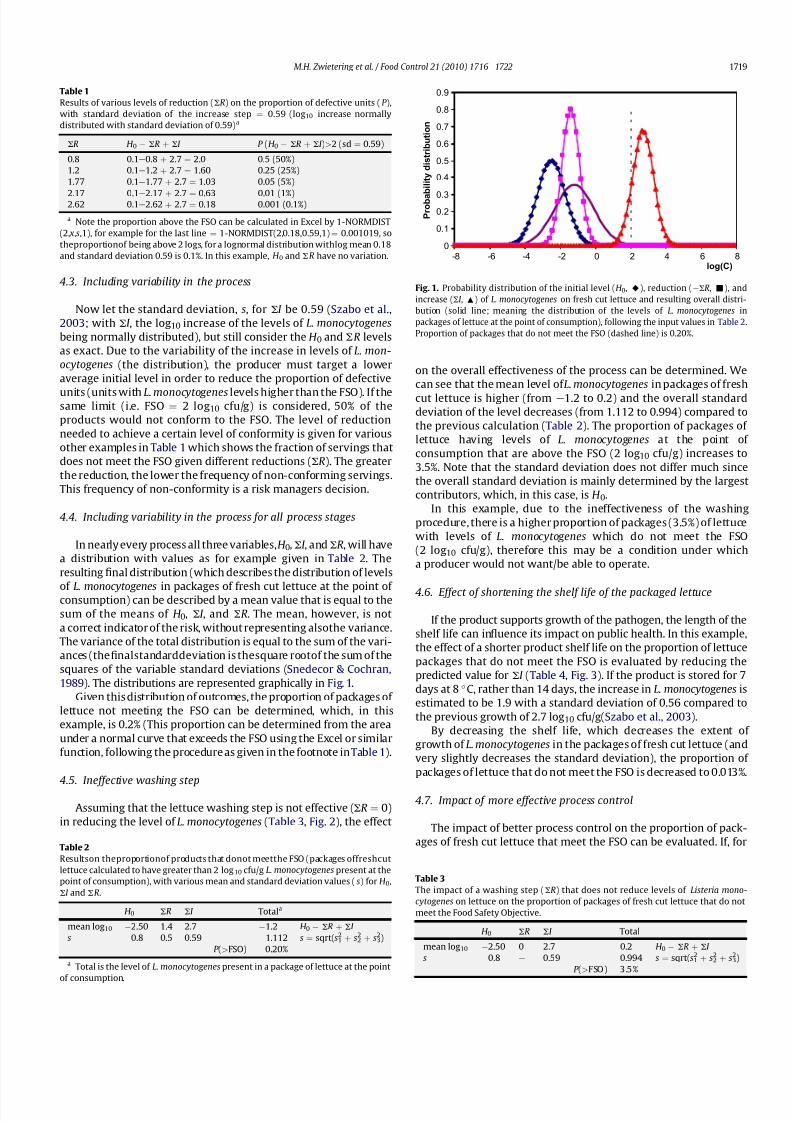
8132019 Validation of Control Measures in a Food Chain Using the FSO Concept
httpslidepdfcomreaderfullvalidation-of-control-measures-in-a-food-chain-using-the-fso-concept 47
43 Including variability in the process
Now let the standard deviation s for SI be 059 (Szabo et al
2003 with SI the log10 increase of the levels of L monocytogenes
being normally distributed) but still consider the H 0 and SR levels
as exact Due to the variability of the increase in levels of L mon-
ocytogenes (the distribution) the producer must target a lower
average initial level in order to reduce the proportion of defective
units (units with L monocytogenes levels higher than the FSO) If thesame limit (ie FSO frac14 2 log10 cfug) is considered 50 of the
products would not conform to the FSO The level of reduction
needed to achieve a certain level of conformity is given for various
other examples in Table 1 which shows the fraction of servings that
does not meet the FSO given different reductions (SR) The greater
the reduction the lower the frequency of non-conforming servings
This frequency of non-conformity is a risk managers decision
44 Including variability in the process for all process stages
In nearly every process all three variables H 0 SI and SR will have
a distribution with values as for example given in Table 2 The
resulting 1047297nal distribution (which describes the distribution of levels
of L monocytogenes in packages of fresh cut lettuce at the point of consumption) can be described by a mean value that is equal to the
sum of the means of H 0 SI and SR The mean however is not
a correct indicator of the risk without representing alsothe variance
The variance of the total distribution is equal to the sum of the vari-
ances (the1047297nalstandarddeviation is thesquare rootof the sum of the
squares of the variable standard deviations (Snedecor amp Cochran
1989) The distributions are represented graphically in Fig 1
Given this distribution of outcomes the proportion of packages of
lettuce not meeting the FSO can be determined which in this
example is 02 (This proportion can be determined from the area
under a normal curve that exceeds the FSO using the Excel or similar
function following the procedure as given in the footnote in Table 1)
45 Ineffective washing step
Assuming that the lettuce washing step is not effective (SR frac14 0)
in reducing the level of L monocytogenes (Table 3 Fig 2) the effect
on the overall effectiveness of the process can be determined We
can see that the mean level of L monocytogenes in packages of fresh
cut lettuce is higher (from e12 to 02) and the overall standard
deviation of the level decreases (from 1112 to 0994) compared to
the previous calculation (Table 2) The proportion of packages of
lettuce having levels of L monocytogenes at the point of
consumption that are above the FSO (2 log10 cfug) increases to
35 Note that the standard deviation does not differ much since
the overall standard deviation is mainly determined by the largest
contributors which in this case is H 0
In this example due to the ineffectiveness of the washing
procedure there is a higher proportion of packages (35) of lettuce
with levels of L monocytogenes which do not meet the FSO
(2 log10 cfug) therefore this may be a condition under which
a producer would not wantbe able to operate
46 Effect of shortening the shelf life of the packaged lettuce
If the product supports growth of the pathogen the length of the
shelf life can in1047298uence its impact on public health In this example
the effect of a shorter product shelf life on the proportion of lettuce
packages that do not meet the FSO is evaluated by reducing the
predicted value for SI (Table 4 Fig 3) If the product is stored for 7
days at 8 C rather than 14 days the increase in L monocytogenes is
estimated to be 19 with a standard deviation of 056 compared to
the previous growth of 27 log10 cfug(Szabo et al 2003)
By decreasing the shelf life which decreases the extent of
growth of L monocytogenes in the packages of fresh cut lettuce (and
very slightly decreases the standard deviation) the proportion of
packages of lettuce that do not meet the FSO is decreased to 0013
47 Impact of more effective process control
The impact of better process control on the proportion of pack-
ages of fresh cut lettuce that meet the FSO can be evaluated If for
Table 1
Results of various levels of reduction (SR) on the proportion of defective units (P )
with standard deviation of the increase step frac14 059 (log10 increase normally
distributed with standard deviation of 059)a
SR H 0 SR thorn SI P (H 0 SR thorn SI )gt2 (sd frac14 059)
08 01e08 thorn 27 frac14 20 05 (50)
12 01e12 thorn 27 frac14 160 025 (25)
177 01e177 thorn 27 frac14 103 005 (5)
217 01e
217 thorn 27 frac14 063 001 (1)262 01e262 thorn 27 frac14 018 0001 (01)
a Note the proportion above the FSO can be calculated in Excel by 1-NORMDIST
(2 xs1) for example for the last line frac14 1-NORMDIST(20180591) frac14 0001019 so
theproportionof being above 2 logs for a lognormal distribution withlog mean 018
and standard deviation 059 is 01 In this example H 0 and SR have no variation
Table 2
Resultson theproportionof products that donot meetthe FSO (packages offreshcut
lettuce calculated to have greater than 2 log10 cfug L monocytogenes present at the
point of consumption) with various mean and standard deviation values (s) for H 0
SI and SR
H 0 SR SI Totala
mean log10 250 14 27 12 H 0 SR thorn SI
s 08 05 059 1112 s frac14 sqrt(s12 thorn s2
2 thorn s32)
P (gtFSO) 020
a Total is the level of L monocytogenes present in a package of lettuce at the point
of consumption
0
01
02
03
04
05
06
07
08
09
-8 -6 -4 -2 0 2 4 6 8
log(C)
P r o b a
b i l i t y
d i s t r i b u t i o n
Fig 1 Probability distribution of the initial level (H 0 A) reduction (SR -) and
increase (SI ) of L monocytogenes on fresh cut lettuce and resulting overall distri-
bution (solid line meaning the distribution of the levels of L monocytogenes in
packages of lettuce at the point of consumption) following the input values in Table 2
Proportion of packages that do not meet the FSO (dashed line) is 020
Table 3
The impact of a washing step (SR) that does not reduce levels of Listeria mono-
cytogenes on lettuce on the proportion of packages of fresh cut lettuce that do not
meet the Food Safety Objective
H 0 SR SI Total
mean log10 250 0 27 02 H 0 SR thorn SI
s 08 e 059 0994 s frac14 sqrt(s12 thorn s2
2 thorn s32)
P (gtFSO) 35
MH Zwietering et al Food Control 21 (2010) 1716 e1722 1719
8132019 Validation of Control Measures in a Food Chain Using the FSO Concept
httpslidepdfcomreaderfullvalidation-of-control-measures-in-a-food-chain-using-the-fso-concept 57
instance raw materials with less variability (standard deviation) in
thelevels of L monocytogenes present on thelettuce canbe obtainedby supplier selection changing supplier speci1047297cations or better
input control the standard deviation of H 0 can be reduced (Table 5
Fig 4 compare with Table 2) By this better process control the
average level of L monocytogenes on the raw materials remains the
same but the 1047297nal standard deviation goes down resulting in
a lower percentage of packages of fresh cut lettuce that donot meet
the FSO (going from 02 to 0012) or conversely a larger
percentage of product now meets the FSO comparable to a reduc-
tion in shelf life to 7 days (Table 4)
48 Ability to meet the FSO at the same level of performance by
different means
It can also be determined how an equivalent outcome can beachieved (same proportion of the products meeting the FSO) in this
instance only 02 of packages of fresh cut lettuce not meeting the
FSO (see Table 2) by reducing the variability of one of the inputs
For example if the variability (standard deviation) of the initial
levels of L monocytogenes on the raw materials is reduced from 08
to 04 the required level of reduction of L monocytogenes during
the lettuce washing step (SR) could be decreased from 14 to 07
while still achieving the same proportion of product that meets the
FSO (Table 6)
49 Relation between log mean value standard deviation and
proportion of products that do not meet the FSO (levels of L
monocytogenes at thepointof consumption are greater than theFSO)
The proportion of products in which the level of L monocytogenes
is above the FSO is determined by both the mean log levels and the
standard deviation of the combined distributions for H 0 SR and SI
Different combinations of the mean and standard deviation resulting
in thesame overall proportion of products notmeeting theFSO canbe
calculated and the results are shown in Fig 5The values in Fig 5 can also be determined by calculation since
the probability that a value is higher than a certain level can be
determined with the z -score (Snedecor amp Cochran 1989) For an
FSO of 2 the calculation becomes x thorn z $s frac14 2 so for a given mean
value x the s value that gives a certain probability to surpass the
FSO equals s frac14 (2 x) z with z the value determined by the
probability level (Table 7) For example at the line in Fig 5 for 005
(5) the probability is described by
s frac14 eth2 xTHORN= z frac14 eth2 xTHORN=1645 (3)
In Table 1 the levels of 103 063 and 018 and with a standard
deviation of 059 correspond to a probability level of 005 001 and
0001 respectively (2 103)1645 frac14 059 ( z -value for 005 prob-
ability level) (2 063)2326 frac14 059 (2 018)309 frac14 059The effect of reducing the standard deviation in raw materials
or elsewhere can be converted in a log gain by this approach
Having two different processes that have equal probability to
surpass the FSO it can be derived from x1 thorn z ∙s1 frac14 x2 thorn z ∙s2 that
D x frac14 z Ds (4)
resulting in a formula that canprovide an equivalent changein level
following a reduction of the standard deviation
For example for an FSO set with a con1047297dence level of 99
(meaning that 99 of the product units do con1047297rm to this level) z
equals 233 resulting in
D x frac14 233Ds (5)
Therefore a 01 log10 decrease in the standard deviation is
equivalent to a 0233 log10 decrease in average level
To calculate the difference in equivalent reduction necessary to
achieve a 02 defectiveratefor an H 0 with a 08 standard deviation
0
01
02
03
04
05
06
07
08
-8 -6 -4 -2 0 2 4 6 8
log(C)
n o i t u b i r t s i d
y t i l i b
a b o r P
Fig 2 Probability distribution of the initial level (H 0 A) increase (SI ) and
resulting overall distribution (solid line meaning the distribution of the levels of L
monocytogenes in packages of lettuce at the point of consumption) for a process in
which the washing step is not effective in reducing the levels of L monocytogenes
(SR frac14 0) following the input values in Table 3 Proportion of packages that do not meet
the FSO (dashed line) is 35
Table 4
The impact of shortening the shelf life of the product from 14 to 7 days thus
reducing the level of growth (SI ) on the proportion of packages of fresh cut lettuce
that do not meet the Food Safety Objective
H 0 SR SI Total
mean log10 250 14 19 2 H 0 SR thorn SI
s 08 05 056 1097 s frac14 sqrt(s12 thorn s2
2 thorn s32)
P (gtFS O) 0 013
0
01
02
03
04
05
06
07
08
09
-8 -6 -4 -2 0 2 4 6 8
log(C)
n o i t u b i r t s i d
y t i l i b
a b o r P
Fig 3 Probability distribution of the initial level ( H 0 A) reduction (SR -) and
increase (SI ) and resulting overall distribution (solid line meaning the distribution
of the levels of L monocytogenes in packages of lettuce at the point of consumption) for
a product with a shortened shelf life (see Table 4) therefore the level of growth of L
monocytogenes in the packaged lettuce (SI ) is decreased Proportion of packages that
do not meet the FSO (dashed lined) is 0013
Table 5
The impact of a reduction in the variability (smaller standarddeviation) of the initial
levels of L monocytogenes on raw materials (H 0) on the proportion of packages of
fresh cut lettuce that do not meet the Food Safety Objective
H 0 SR SI Total
mean log10 250 14 27 12 H 0 SR thorn SI
s 04 05 059 08707 s frac14 sqrt(s12 thorn s2
2 thorn s32)
P (gtFSO) 0012
MH Zwietering et al Food Control 21 (2010) 1716 e17221720
8132019 Validation of Control Measures in a Food Chain Using the FSO Concept
httpslidepdfcomreaderfullvalidation-of-control-measures-in-a-food-chain-using-the-fso-concept 67
(Table 2) to a H 0 with a 04 standard deviation (Table 6) we canperform the following calculation
By reducing the s in H 0 from 08 to 04 the standard deviation of
theoveralllevel willreducefrom 1112(sqrt(08^2 thorn 05^2 thorn 059^2)
see Table 2) to 08707 (sqrt(04^2 thorn 05^2 thorn 059^2) see Table 6) so
this translates to a ldquogainrdquo in log mean of 2878(1112 08707) frac14
0697 logs Instead of a 14 log10 reduction (Table 2) a 07 log10
reduction is suf 1047297cient (Table 6)
So how much one could change the mean concentration while
retaining the same proportion of defective products depends both
on the change in overall standard deviation but also on the
conformity level (eg 1 proportion of product that does not meet
the FSO) set (Fig 5)
5 Conclusions
From the various examples presented in this paper the impact
of taking into consideration both the level and the variability of H 0
SR and SI on the proportion of product meeting the FSO has been
demonstrated With this consideration a deeper level of under-
standing is obtained of the in1047298uence of both the levels and vari-
ability of the initial microbiological load on the incoming materials
the level of process control achieved for those processes which
reduce the level of the microorganism of concern and the level and
variability of the increase of the pathogen of concern during storage
and distribution A food manufacturer can determine where in the
process they can have the biggest impact on ensuring that the
appropriate proportion of product meets the FSO (ie decreasing
variability of a lethal process vs decreasing the initial level of themicroorganism of concern on the raw materials)
The following information about the assumptions made with
these calculations should be recognized
All variables are assumed to be log normally distributed So the
log of the variables as used in the FSO equation is normally
distributed This makes also their sum in the FSO equationhaving a normal distribution If values have other distributions
Monte-Carlo type calculations are necessary to determine the
statistical distribution of the sum It should be noted however
that for initial levels log10 increase and log10 reduction
a lognormal distribution is often found (and described) in
literature although in actuality the distributions may not
precisely meet this assumption they are usually suf 1047297ciently
close
In this example it was assumed that calculations hold even for
low levels It should be noted that for instance a product unit
of 100 g with an initial pathogen level of 2 log 10 contains after
a 6 log10 inactivation step a level of 4 log10 This is not a level
of 4 log10 in all products but in reality a level of 1 microor-
ganism in 100 g unit (2 log10) for only 1 of the units Theother 99 of the units are free of the microorganism This can
in certain cases have implications that should be investigated
Because microorganisms are discrete entities it is important to
check that a situation does not arise with less than one
microorganism per container or package If this occurs Poisson
distributions must be considered for the fraction of packages
that would contain no microorganisms
If no data on standard deviation are available but minmax-
data are present representing the range where 95 of the data
will be the standard deviation can be estimated by
s frac14 (05 (max min))196
Products with a same level of conformity (equal probability to
be above a certain FSO) but different standard deviations of the
1047297nal level of pathogens could have a different risk of illness
depending on the doseeresponse relation
Both experimental and statistical aspects have been described
that can be combined to support the con1047297dence that a process can
conform to a set FSO (ie validation) The effects of variability in
0
02
04
06
08
1
12
-8 -6 -4 -2 0 2 4 6 8
log(C)
n o i t u b i r t s i d
y t i l i b a b o r P
Fig 4 Probability distribution of the initial level (H 0 A) reduction (SR -) and
increase (SI ) and resulting overall distribution (solid line meaning the distribution
of the levels of L monocytogenes in packages of lettuce at the point of consumption) for
a product with reduced variability of initial levels ( H 0) of L monocytogenes on raw
materials following the input values in Table 5 Proportion of packages that do not
meet the FSO (dashed line) is 0012
Table 6
The impact of reducing the variability of the initial levels of L monocytogenes on raw
materials (H 0) at the same time as lowering the level of reduction of L mono-
cytogenes during the washing step (SR) on the proportion of packages of fresh cut
lettuce that do not meet the Food Safety Objective (compare to Table 2)
H 0 SR SI Total
mean log10 250 07 27 05 H 0 SR thorn SI
s 04 05 059 08707 s frac14 sqrt(s12 thorn s2
2 thorn s32)
P (gtFSO) 0 20
0
05
1
15
2
25
3
-25 -2 -15 -1 -05 0 05
log(C)
s t a n
d a r d
d e v i a t i o n
Fig 5 Various combinations of mean log levels log( C ) and standard deviation of the
combined distributions for H 0 SR and SI resulting in a particular proportion of product
that does not meet the FSO (in this case FSO frac14 2) The various lines represent different
proportions (A frac14 5 - frac14 1 frac14 05 x frac14 02 solid line frac14 01) of products not
meeting the FSO The examples from Tables 2 and 6 are indicated for a 02 level
Table 7
z -values at various probability levels (one sided test)
Probability level z -score
005 1645
001 2326
0005 2576
0002 2878
0001 3090
MH Zwietering et al Food Control 21 (2010) 1716 e1722 1721
8132019 Validation of Control Measures in a Food Chain Using the FSO Concept
httpslidepdfcomreaderfullvalidation-of-control-measures-in-a-food-chain-using-the-fso-concept 77
initial level reduction andor growth is illustrated and it is shown
how to determine an equivalence in performance either by the
level or the variability in a level Given the above mentioned
assumptions in certain cases this analysis may be needed to be
followed up by a more detailed risk assessment
References
CAC (Codex Alimentarius Commission) (2007) Recommended international code of hygienic practice for egg products CACRCP 15 Rome FAO
CAC (Codex Alimentarius Commission) (2008) Guideline for the validation of foodsafety control measures CACGL 69 Rome FAO
ICMSF (International Commission on Microbiological Speci1047297cations for Foods)(2002) Microorganisms in foods 7 Microbiological testing in food safetymanagement New York Kluwer AcademicPlenum Publishers
IFT (2001) Evaluation and de 1047297nition of potentially hazardous foods A report by theinstitute of food technologists for the food and drug administration of the USDepartment of Health and Human Services httpmembersiftorgNRrdonlyresF537AA13-CFDB-420D-94BC-ED763D9C0A4D0crfsfssupn2p001007pdf (Accessed 211209)
Keener L (2006) Hurdling new technology challenges investing in process vali-dation of novel technologies Food Safety Magazine (FebruaryMarch issue)
Legan J D Stewart C M Vandeven M amp Cole M B (2002) Modelling thegrowth survival and death of bacterial pathogens in foods In C Blackburn amp
P J McClure (Eds) Foodborne pathogens Hazards risk and control (pp 53e95)Cambridge UK Woodhead Publishing
McKellar R C amp Lu X (2004) Modeling microbial responses in foods Boca Raton FLCRC Press
Ross T amp McMeekin T A (2003) Modeling microbial growth within food safetyrisk assessments Risk Analysis 23 179e197
Scott V N Swanson K M J Freier T A Pruett W P Jr Sveum W H Hall P Aet al (2005) Guidelines for conducting Listeria monoctogenes challenge testingof foods Food Protection Trends 25 818e825
Snedecor G W amp Cochran W G (1989) Statistical methods (8th ed) Ames IA
Iowa State University PressSwanson K M J amp Anderson J E (2000) Industry perspectives on the use of
microbial data for hazard analysis and critical control point validation andveri1047297cation Journal of Food Protection 63 815e818
Szabo E A Simons L Coventry M J amp Cole M B (2003) Assessment of controlmeasures to achieve a food safety objective of less than 100 CFU of Listeriamonocytogenes per gram at the point of consumption for fresh precut iceberglettuce Journal of Food Protection 66 256e264
USDA-FSIS (2009) Raw ground beef e E coli testing results Available at httpwwwfsisusdagovscience2009_Ecoli_positive_resultsindexasp (Accessed 211209)
Van Gerwen S J C amp Zwietering M H (1998) Growth and inactivation models tobe used in quantitative risk assessments Journal of Food Protection 611541e1549
Whiting R C amp Buchanan R L (2007) Predictive modeling and risk assessment InM P Doyle amp L R Beuchat (Eds) Food microbiology Fundamentals and frontiers(3rd ed) (pp 953e969) Washington DC ASM Press Chapter 45
MH Zwietering et al Food Control 21 (2010) 1716 e17221722
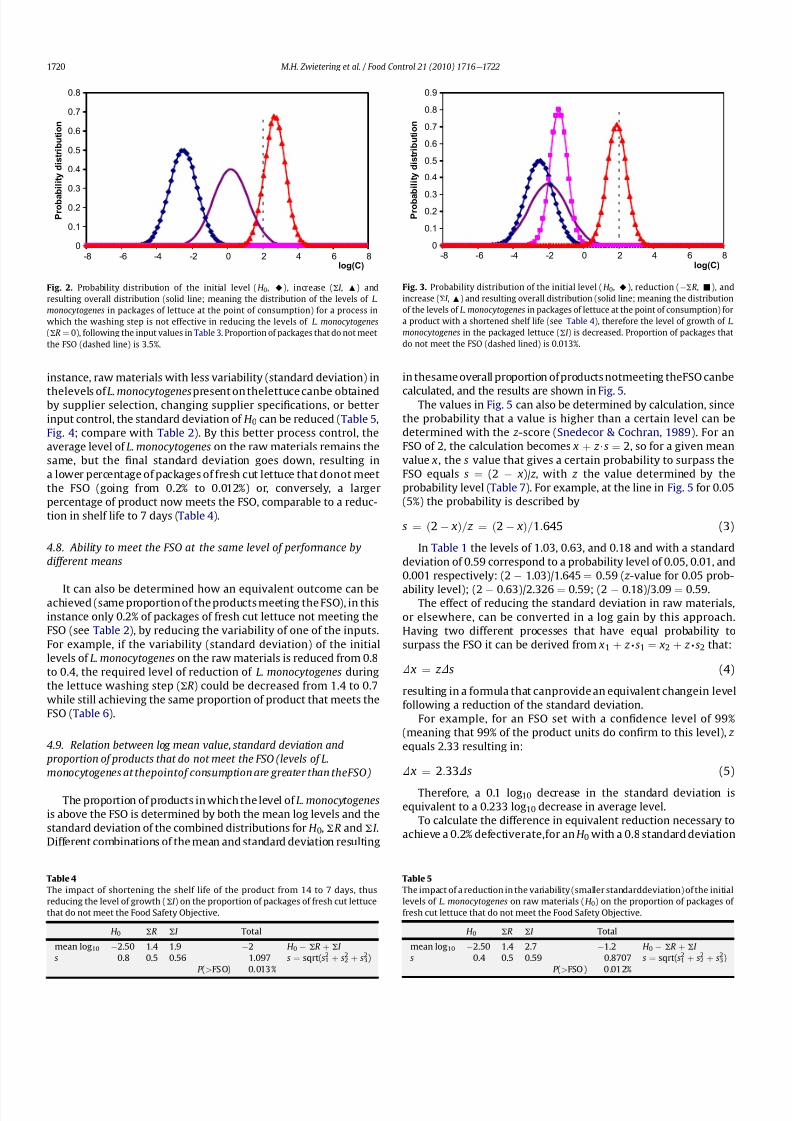
8132019 Validation of Control Measures in a Food Chain Using the FSO Concept
httpslidepdfcomreaderfullvalidation-of-control-measures-in-a-food-chain-using-the-fso-concept 57
instance raw materials with less variability (standard deviation) in
thelevels of L monocytogenes present on thelettuce canbe obtainedby supplier selection changing supplier speci1047297cations or better
input control the standard deviation of H 0 can be reduced (Table 5
Fig 4 compare with Table 2) By this better process control the
average level of L monocytogenes on the raw materials remains the
same but the 1047297nal standard deviation goes down resulting in
a lower percentage of packages of fresh cut lettuce that donot meet
the FSO (going from 02 to 0012) or conversely a larger
percentage of product now meets the FSO comparable to a reduc-
tion in shelf life to 7 days (Table 4)
48 Ability to meet the FSO at the same level of performance by
different means
It can also be determined how an equivalent outcome can beachieved (same proportion of the products meeting the FSO) in this
instance only 02 of packages of fresh cut lettuce not meeting the
FSO (see Table 2) by reducing the variability of one of the inputs
For example if the variability (standard deviation) of the initial
levels of L monocytogenes on the raw materials is reduced from 08
to 04 the required level of reduction of L monocytogenes during
the lettuce washing step (SR) could be decreased from 14 to 07
while still achieving the same proportion of product that meets the
FSO (Table 6)
49 Relation between log mean value standard deviation and
proportion of products that do not meet the FSO (levels of L
monocytogenes at thepointof consumption are greater than theFSO)
The proportion of products in which the level of L monocytogenes
is above the FSO is determined by both the mean log levels and the
standard deviation of the combined distributions for H 0 SR and SI
Different combinations of the mean and standard deviation resulting
in thesame overall proportion of products notmeeting theFSO canbe
calculated and the results are shown in Fig 5The values in Fig 5 can also be determined by calculation since
the probability that a value is higher than a certain level can be
determined with the z -score (Snedecor amp Cochran 1989) For an
FSO of 2 the calculation becomes x thorn z $s frac14 2 so for a given mean
value x the s value that gives a certain probability to surpass the
FSO equals s frac14 (2 x) z with z the value determined by the
probability level (Table 7) For example at the line in Fig 5 for 005
(5) the probability is described by
s frac14 eth2 xTHORN= z frac14 eth2 xTHORN=1645 (3)
In Table 1 the levels of 103 063 and 018 and with a standard
deviation of 059 correspond to a probability level of 005 001 and
0001 respectively (2 103)1645 frac14 059 ( z -value for 005 prob-
ability level) (2 063)2326 frac14 059 (2 018)309 frac14 059The effect of reducing the standard deviation in raw materials
or elsewhere can be converted in a log gain by this approach
Having two different processes that have equal probability to
surpass the FSO it can be derived from x1 thorn z ∙s1 frac14 x2 thorn z ∙s2 that
D x frac14 z Ds (4)
resulting in a formula that canprovide an equivalent changein level
following a reduction of the standard deviation
For example for an FSO set with a con1047297dence level of 99
(meaning that 99 of the product units do con1047297rm to this level) z
equals 233 resulting in
D x frac14 233Ds (5)
Therefore a 01 log10 decrease in the standard deviation is
equivalent to a 0233 log10 decrease in average level
To calculate the difference in equivalent reduction necessary to
achieve a 02 defectiveratefor an H 0 with a 08 standard deviation
0
01
02
03
04
05
06
07
08
-8 -6 -4 -2 0 2 4 6 8
log(C)
n o i t u b i r t s i d
y t i l i b
a b o r P
Fig 2 Probability distribution of the initial level (H 0 A) increase (SI ) and
resulting overall distribution (solid line meaning the distribution of the levels of L
monocytogenes in packages of lettuce at the point of consumption) for a process in
which the washing step is not effective in reducing the levels of L monocytogenes
(SR frac14 0) following the input values in Table 3 Proportion of packages that do not meet
the FSO (dashed line) is 35
Table 4
The impact of shortening the shelf life of the product from 14 to 7 days thus
reducing the level of growth (SI ) on the proportion of packages of fresh cut lettuce
that do not meet the Food Safety Objective
H 0 SR SI Total
mean log10 250 14 19 2 H 0 SR thorn SI
s 08 05 056 1097 s frac14 sqrt(s12 thorn s2
2 thorn s32)
P (gtFS O) 0 013
0
01
02
03
04
05
06
07
08
09
-8 -6 -4 -2 0 2 4 6 8
log(C)
n o i t u b i r t s i d
y t i l i b
a b o r P
Fig 3 Probability distribution of the initial level ( H 0 A) reduction (SR -) and
increase (SI ) and resulting overall distribution (solid line meaning the distribution
of the levels of L monocytogenes in packages of lettuce at the point of consumption) for
a product with a shortened shelf life (see Table 4) therefore the level of growth of L
monocytogenes in the packaged lettuce (SI ) is decreased Proportion of packages that
do not meet the FSO (dashed lined) is 0013
Table 5
The impact of a reduction in the variability (smaller standarddeviation) of the initial
levels of L monocytogenes on raw materials (H 0) on the proportion of packages of
fresh cut lettuce that do not meet the Food Safety Objective
H 0 SR SI Total
mean log10 250 14 27 12 H 0 SR thorn SI
s 04 05 059 08707 s frac14 sqrt(s12 thorn s2
2 thorn s32)
P (gtFSO) 0012
MH Zwietering et al Food Control 21 (2010) 1716 e17221720
8132019 Validation of Control Measures in a Food Chain Using the FSO Concept
httpslidepdfcomreaderfullvalidation-of-control-measures-in-a-food-chain-using-the-fso-concept 67
(Table 2) to a H 0 with a 04 standard deviation (Table 6) we canperform the following calculation
By reducing the s in H 0 from 08 to 04 the standard deviation of
theoveralllevel willreducefrom 1112(sqrt(08^2 thorn 05^2 thorn 059^2)
see Table 2) to 08707 (sqrt(04^2 thorn 05^2 thorn 059^2) see Table 6) so
this translates to a ldquogainrdquo in log mean of 2878(1112 08707) frac14
0697 logs Instead of a 14 log10 reduction (Table 2) a 07 log10
reduction is suf 1047297cient (Table 6)
So how much one could change the mean concentration while
retaining the same proportion of defective products depends both
on the change in overall standard deviation but also on the
conformity level (eg 1 proportion of product that does not meet
the FSO) set (Fig 5)
5 Conclusions
From the various examples presented in this paper the impact
of taking into consideration both the level and the variability of H 0
SR and SI on the proportion of product meeting the FSO has been
demonstrated With this consideration a deeper level of under-
standing is obtained of the in1047298uence of both the levels and vari-
ability of the initial microbiological load on the incoming materials
the level of process control achieved for those processes which
reduce the level of the microorganism of concern and the level and
variability of the increase of the pathogen of concern during storage
and distribution A food manufacturer can determine where in the
process they can have the biggest impact on ensuring that the
appropriate proportion of product meets the FSO (ie decreasing
variability of a lethal process vs decreasing the initial level of themicroorganism of concern on the raw materials)
The following information about the assumptions made with
these calculations should be recognized
All variables are assumed to be log normally distributed So the
log of the variables as used in the FSO equation is normally
distributed This makes also their sum in the FSO equationhaving a normal distribution If values have other distributions
Monte-Carlo type calculations are necessary to determine the
statistical distribution of the sum It should be noted however
that for initial levels log10 increase and log10 reduction
a lognormal distribution is often found (and described) in
literature although in actuality the distributions may not
precisely meet this assumption they are usually suf 1047297ciently
close
In this example it was assumed that calculations hold even for
low levels It should be noted that for instance a product unit
of 100 g with an initial pathogen level of 2 log 10 contains after
a 6 log10 inactivation step a level of 4 log10 This is not a level
of 4 log10 in all products but in reality a level of 1 microor-
ganism in 100 g unit (2 log10) for only 1 of the units Theother 99 of the units are free of the microorganism This can
in certain cases have implications that should be investigated
Because microorganisms are discrete entities it is important to
check that a situation does not arise with less than one
microorganism per container or package If this occurs Poisson
distributions must be considered for the fraction of packages
that would contain no microorganisms
If no data on standard deviation are available but minmax-
data are present representing the range where 95 of the data
will be the standard deviation can be estimated by
s frac14 (05 (max min))196
Products with a same level of conformity (equal probability to
be above a certain FSO) but different standard deviations of the
1047297nal level of pathogens could have a different risk of illness
depending on the doseeresponse relation
Both experimental and statistical aspects have been described
that can be combined to support the con1047297dence that a process can
conform to a set FSO (ie validation) The effects of variability in
0
02
04
06
08
1
12
-8 -6 -4 -2 0 2 4 6 8
log(C)
n o i t u b i r t s i d
y t i l i b a b o r P
Fig 4 Probability distribution of the initial level (H 0 A) reduction (SR -) and
increase (SI ) and resulting overall distribution (solid line meaning the distribution
of the levels of L monocytogenes in packages of lettuce at the point of consumption) for
a product with reduced variability of initial levels ( H 0) of L monocytogenes on raw
materials following the input values in Table 5 Proportion of packages that do not
meet the FSO (dashed line) is 0012
Table 6
The impact of reducing the variability of the initial levels of L monocytogenes on raw
materials (H 0) at the same time as lowering the level of reduction of L mono-
cytogenes during the washing step (SR) on the proportion of packages of fresh cut
lettuce that do not meet the Food Safety Objective (compare to Table 2)
H 0 SR SI Total
mean log10 250 07 27 05 H 0 SR thorn SI
s 04 05 059 08707 s frac14 sqrt(s12 thorn s2
2 thorn s32)
P (gtFSO) 0 20
0
05
1
15
2
25
3
-25 -2 -15 -1 -05 0 05
log(C)
s t a n
d a r d
d e v i a t i o n
Fig 5 Various combinations of mean log levels log( C ) and standard deviation of the
combined distributions for H 0 SR and SI resulting in a particular proportion of product
that does not meet the FSO (in this case FSO frac14 2) The various lines represent different
proportions (A frac14 5 - frac14 1 frac14 05 x frac14 02 solid line frac14 01) of products not
meeting the FSO The examples from Tables 2 and 6 are indicated for a 02 level
Table 7
z -values at various probability levels (one sided test)
Probability level z -score
005 1645
001 2326
0005 2576
0002 2878
0001 3090
MH Zwietering et al Food Control 21 (2010) 1716 e1722 1721
8132019 Validation of Control Measures in a Food Chain Using the FSO Concept
httpslidepdfcomreaderfullvalidation-of-control-measures-in-a-food-chain-using-the-fso-concept 77
initial level reduction andor growth is illustrated and it is shown
how to determine an equivalence in performance either by the
level or the variability in a level Given the above mentioned
assumptions in certain cases this analysis may be needed to be
followed up by a more detailed risk assessment
References
CAC (Codex Alimentarius Commission) (2007) Recommended international code of hygienic practice for egg products CACRCP 15 Rome FAO
CAC (Codex Alimentarius Commission) (2008) Guideline for the validation of foodsafety control measures CACGL 69 Rome FAO
ICMSF (International Commission on Microbiological Speci1047297cations for Foods)(2002) Microorganisms in foods 7 Microbiological testing in food safetymanagement New York Kluwer AcademicPlenum Publishers
IFT (2001) Evaluation and de 1047297nition of potentially hazardous foods A report by theinstitute of food technologists for the food and drug administration of the USDepartment of Health and Human Services httpmembersiftorgNRrdonlyresF537AA13-CFDB-420D-94BC-ED763D9C0A4D0crfsfssupn2p001007pdf (Accessed 211209)
Keener L (2006) Hurdling new technology challenges investing in process vali-dation of novel technologies Food Safety Magazine (FebruaryMarch issue)
Legan J D Stewart C M Vandeven M amp Cole M B (2002) Modelling thegrowth survival and death of bacterial pathogens in foods In C Blackburn amp
P J McClure (Eds) Foodborne pathogens Hazards risk and control (pp 53e95)Cambridge UK Woodhead Publishing
McKellar R C amp Lu X (2004) Modeling microbial responses in foods Boca Raton FLCRC Press
Ross T amp McMeekin T A (2003) Modeling microbial growth within food safetyrisk assessments Risk Analysis 23 179e197
Scott V N Swanson K M J Freier T A Pruett W P Jr Sveum W H Hall P Aet al (2005) Guidelines for conducting Listeria monoctogenes challenge testingof foods Food Protection Trends 25 818e825
Snedecor G W amp Cochran W G (1989) Statistical methods (8th ed) Ames IA
Iowa State University PressSwanson K M J amp Anderson J E (2000) Industry perspectives on the use of
microbial data for hazard analysis and critical control point validation andveri1047297cation Journal of Food Protection 63 815e818
Szabo E A Simons L Coventry M J amp Cole M B (2003) Assessment of controlmeasures to achieve a food safety objective of less than 100 CFU of Listeriamonocytogenes per gram at the point of consumption for fresh precut iceberglettuce Journal of Food Protection 66 256e264
USDA-FSIS (2009) Raw ground beef e E coli testing results Available at httpwwwfsisusdagovscience2009_Ecoli_positive_resultsindexasp (Accessed 211209)
Van Gerwen S J C amp Zwietering M H (1998) Growth and inactivation models tobe used in quantitative risk assessments Journal of Food Protection 611541e1549
Whiting R C amp Buchanan R L (2007) Predictive modeling and risk assessment InM P Doyle amp L R Beuchat (Eds) Food microbiology Fundamentals and frontiers(3rd ed) (pp 953e969) Washington DC ASM Press Chapter 45
MH Zwietering et al Food Control 21 (2010) 1716 e17221722
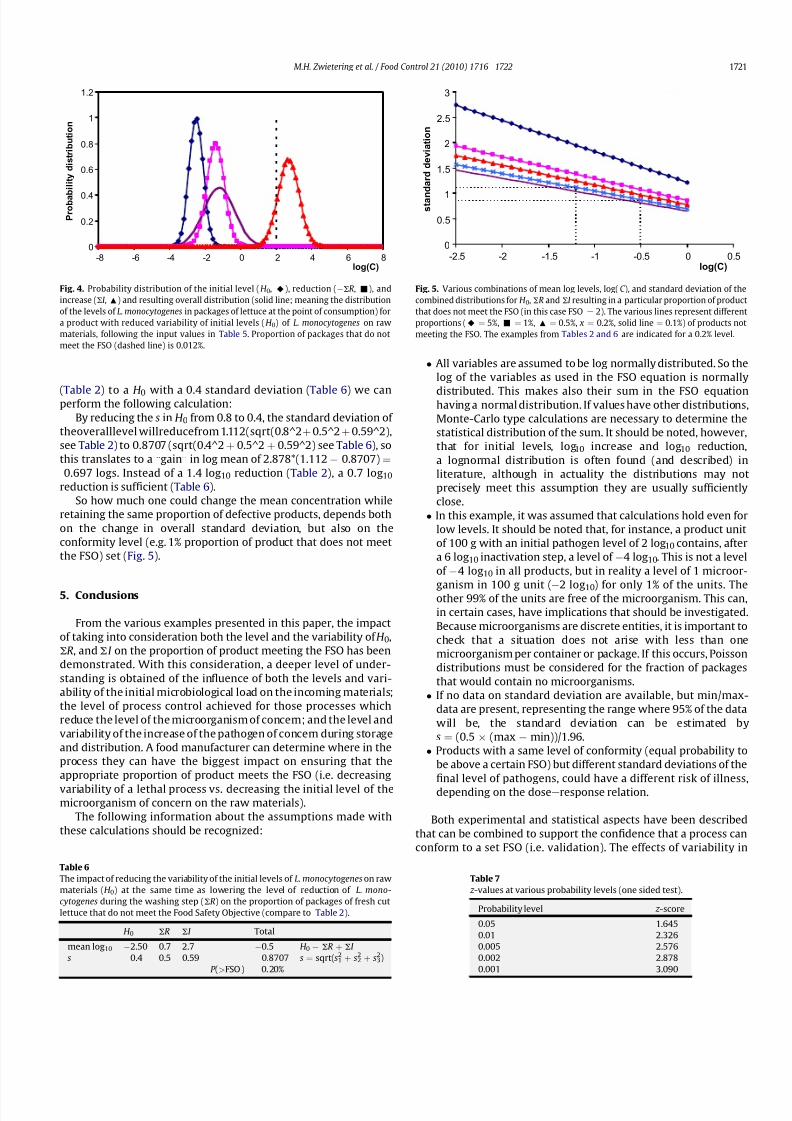
8132019 Validation of Control Measures in a Food Chain Using the FSO Concept
httpslidepdfcomreaderfullvalidation-of-control-measures-in-a-food-chain-using-the-fso-concept 67
(Table 2) to a H 0 with a 04 standard deviation (Table 6) we canperform the following calculation
By reducing the s in H 0 from 08 to 04 the standard deviation of
theoveralllevel willreducefrom 1112(sqrt(08^2 thorn 05^2 thorn 059^2)
see Table 2) to 08707 (sqrt(04^2 thorn 05^2 thorn 059^2) see Table 6) so
this translates to a ldquogainrdquo in log mean of 2878(1112 08707) frac14
0697 logs Instead of a 14 log10 reduction (Table 2) a 07 log10
reduction is suf 1047297cient (Table 6)
So how much one could change the mean concentration while
retaining the same proportion of defective products depends both
on the change in overall standard deviation but also on the
conformity level (eg 1 proportion of product that does not meet
the FSO) set (Fig 5)
5 Conclusions
From the various examples presented in this paper the impact
of taking into consideration both the level and the variability of H 0
SR and SI on the proportion of product meeting the FSO has been
demonstrated With this consideration a deeper level of under-
standing is obtained of the in1047298uence of both the levels and vari-
ability of the initial microbiological load on the incoming materials
the level of process control achieved for those processes which
reduce the level of the microorganism of concern and the level and
variability of the increase of the pathogen of concern during storage
and distribution A food manufacturer can determine where in the
process they can have the biggest impact on ensuring that the
appropriate proportion of product meets the FSO (ie decreasing
variability of a lethal process vs decreasing the initial level of themicroorganism of concern on the raw materials)
The following information about the assumptions made with
these calculations should be recognized
All variables are assumed to be log normally distributed So the
log of the variables as used in the FSO equation is normally
distributed This makes also their sum in the FSO equationhaving a normal distribution If values have other distributions
Monte-Carlo type calculations are necessary to determine the
statistical distribution of the sum It should be noted however
that for initial levels log10 increase and log10 reduction
a lognormal distribution is often found (and described) in
literature although in actuality the distributions may not
precisely meet this assumption they are usually suf 1047297ciently
close
In this example it was assumed that calculations hold even for
low levels It should be noted that for instance a product unit
of 100 g with an initial pathogen level of 2 log 10 contains after
a 6 log10 inactivation step a level of 4 log10 This is not a level
of 4 log10 in all products but in reality a level of 1 microor-
ganism in 100 g unit (2 log10) for only 1 of the units Theother 99 of the units are free of the microorganism This can
in certain cases have implications that should be investigated
Because microorganisms are discrete entities it is important to
check that a situation does not arise with less than one
microorganism per container or package If this occurs Poisson
distributions must be considered for the fraction of packages
that would contain no microorganisms
If no data on standard deviation are available but minmax-
data are present representing the range where 95 of the data
will be the standard deviation can be estimated by
s frac14 (05 (max min))196
Products with a same level of conformity (equal probability to
be above a certain FSO) but different standard deviations of the
1047297nal level of pathogens could have a different risk of illness
depending on the doseeresponse relation
Both experimental and statistical aspects have been described
that can be combined to support the con1047297dence that a process can
conform to a set FSO (ie validation) The effects of variability in
0
02
04
06
08
1
12
-8 -6 -4 -2 0 2 4 6 8
log(C)
n o i t u b i r t s i d
y t i l i b a b o r P
Fig 4 Probability distribution of the initial level (H 0 A) reduction (SR -) and
increase (SI ) and resulting overall distribution (solid line meaning the distribution
of the levels of L monocytogenes in packages of lettuce at the point of consumption) for
a product with reduced variability of initial levels ( H 0) of L monocytogenes on raw
materials following the input values in Table 5 Proportion of packages that do not
meet the FSO (dashed line) is 0012
Table 6
The impact of reducing the variability of the initial levels of L monocytogenes on raw
materials (H 0) at the same time as lowering the level of reduction of L mono-
cytogenes during the washing step (SR) on the proportion of packages of fresh cut
lettuce that do not meet the Food Safety Objective (compare to Table 2)
H 0 SR SI Total
mean log10 250 07 27 05 H 0 SR thorn SI
s 04 05 059 08707 s frac14 sqrt(s12 thorn s2
2 thorn s32)
P (gtFSO) 0 20
0
05
1
15
2
25
3
-25 -2 -15 -1 -05 0 05
log(C)
s t a n
d a r d
d e v i a t i o n
Fig 5 Various combinations of mean log levels log( C ) and standard deviation of the
combined distributions for H 0 SR and SI resulting in a particular proportion of product
that does not meet the FSO (in this case FSO frac14 2) The various lines represent different
proportions (A frac14 5 - frac14 1 frac14 05 x frac14 02 solid line frac14 01) of products not
meeting the FSO The examples from Tables 2 and 6 are indicated for a 02 level
Table 7
z -values at various probability levels (one sided test)
Probability level z -score
005 1645
001 2326
0005 2576
0002 2878
0001 3090
MH Zwietering et al Food Control 21 (2010) 1716 e1722 1721
8132019 Validation of Control Measures in a Food Chain Using the FSO Concept
httpslidepdfcomreaderfullvalidation-of-control-measures-in-a-food-chain-using-the-fso-concept 77
initial level reduction andor growth is illustrated and it is shown
how to determine an equivalence in performance either by the
level or the variability in a level Given the above mentioned
assumptions in certain cases this analysis may be needed to be
followed up by a more detailed risk assessment
References
CAC (Codex Alimentarius Commission) (2007) Recommended international code of hygienic practice for egg products CACRCP 15 Rome FAO
CAC (Codex Alimentarius Commission) (2008) Guideline for the validation of foodsafety control measures CACGL 69 Rome FAO
ICMSF (International Commission on Microbiological Speci1047297cations for Foods)(2002) Microorganisms in foods 7 Microbiological testing in food safetymanagement New York Kluwer AcademicPlenum Publishers
IFT (2001) Evaluation and de 1047297nition of potentially hazardous foods A report by theinstitute of food technologists for the food and drug administration of the USDepartment of Health and Human Services httpmembersiftorgNRrdonlyresF537AA13-CFDB-420D-94BC-ED763D9C0A4D0crfsfssupn2p001007pdf (Accessed 211209)
Keener L (2006) Hurdling new technology challenges investing in process vali-dation of novel technologies Food Safety Magazine (FebruaryMarch issue)
Legan J D Stewart C M Vandeven M amp Cole M B (2002) Modelling thegrowth survival and death of bacterial pathogens in foods In C Blackburn amp
P J McClure (Eds) Foodborne pathogens Hazards risk and control (pp 53e95)Cambridge UK Woodhead Publishing
McKellar R C amp Lu X (2004) Modeling microbial responses in foods Boca Raton FLCRC Press
Ross T amp McMeekin T A (2003) Modeling microbial growth within food safetyrisk assessments Risk Analysis 23 179e197
Scott V N Swanson K M J Freier T A Pruett W P Jr Sveum W H Hall P Aet al (2005) Guidelines for conducting Listeria monoctogenes challenge testingof foods Food Protection Trends 25 818e825
Snedecor G W amp Cochran W G (1989) Statistical methods (8th ed) Ames IA
Iowa State University PressSwanson K M J amp Anderson J E (2000) Industry perspectives on the use of
microbial data for hazard analysis and critical control point validation andveri1047297cation Journal of Food Protection 63 815e818
Szabo E A Simons L Coventry M J amp Cole M B (2003) Assessment of controlmeasures to achieve a food safety objective of less than 100 CFU of Listeriamonocytogenes per gram at the point of consumption for fresh precut iceberglettuce Journal of Food Protection 66 256e264
USDA-FSIS (2009) Raw ground beef e E coli testing results Available at httpwwwfsisusdagovscience2009_Ecoli_positive_resultsindexasp (Accessed 211209)
Van Gerwen S J C amp Zwietering M H (1998) Growth and inactivation models tobe used in quantitative risk assessments Journal of Food Protection 611541e1549
Whiting R C amp Buchanan R L (2007) Predictive modeling and risk assessment InM P Doyle amp L R Beuchat (Eds) Food microbiology Fundamentals and frontiers(3rd ed) (pp 953e969) Washington DC ASM Press Chapter 45
MH Zwietering et al Food Control 21 (2010) 1716 e17221722