validation of design and analysis techniques of … 2004 nasa/cr-2004-212650 validation of design...
TRANSCRIPT

December 2004
NASA/CR-2004-212650
Validation of Design and Analysis Techniques
of Tailored Composite Structures
Dulnath D. Wijayratne
The George Washington University
Joint Institute for Advancement of Flight Sciences
Langley Research Center, Hampton, Virginia
https://ntrs.nasa.gov/search.jsp?R=20040200977 2018-07-01T11:20:31+00:00Z
The NASA STI Program Office . . . in Profile
Since its founding, NASA has been dedicated to the
advancement of aeronautics and space science. The
NASA Scientific and Technical Information (STI)
Program Office plays a key part in helping NASA
maintain this important role.
The NASA STI Program Office is operated by
Langley Research Center, the lead center for NASA’s
scientific and technical information. The NASA STI
Program Office provides access to the NASA STI
Database, the largest collection of aeronautical and
space science STI in the world. The Program Office is
also NASA’s institutional mechanism for
disseminating the results of its research and
development activities. These results are published by
NASA in the NASA STI Report Series, which
includes the following report types:
• TECHNICAL PUBLICATION. Reports of
completed research or a major significant phase
of research that present the results of NASA
programs and include extensive data or
theoretical analysis. Includes compilations of
significant scientific and technical data and
information deemed to be of continuing
reference value. NASA counterpart of peer-
reviewed formal professional papers, but having
less stringent limitations on manuscript length
and extent of graphic presentations.
• TECHNICAL MEMORANDUM. Scientific
and technical findings that are preliminary or of
specialized interest, e.g., quick release reports,
working papers, and bibliographies that contain
minimal annotation. Does not contain extensive
analysis.
• CONTRACTOR REPORT. Scientific and
technical findings by NASA-sponsored
contractors and grantees.
• CONFERENCE PUBLICATION. Collected
papers from scientific and technical
conferences, symposia, seminars, or other
meetings sponsored or co-sponsored by NASA.
• SPECIAL PUBLICATION. Scientific,
technical, or historical information from NASA
programs, projects, and missions, often
concerned with subjects having substantial
public interest.
• TECHNICAL TRANSLATION. English-
language translations of foreign scientific and
technical material pertinent to NASA’s mission.
Specialized services that complement the STI
Program Office’s diverse offerings include creating
custom thesauri, building customized databases,
organizing and publishing research results ... even
providing videos.
For more information about the NASA STI Program
Office, see the following:
• Access the NASA STI Program Home Page at
http://www.sti.nasa.gov
• E-mail your question via the Internet to
• Fax your question to the NASA STI Help Desk
at (301) 621-0134
• Phone the NASA STI Help Desk at
(301) 621-0390
• Write to:
NASA STI Help Desk
NASA Center for AeroSpace Information
7121 Standard Drive
Hanover, MD 21076-1320
National Aeronautics and
Space Administration
Langley Research Center Prepared for Langley Research Center
Hampton, Virginia 23681-2199 under Cooperative Agreement NCC1-03008
December 2004
NASA/CR-2004-212650
Validation of Design and Analysis Techniques
of Tailored Composite Structures
Dulnath D. Wijayratne
The George Washington University
Joint Institute for Advancement of Flight Sciences
Langley Research Center, Hampton, Virginia

Available from:
NASA Center for AeroSpace Information (CASI) National Technical Information Service (NTIS)
7121 Standard Drive 5285 Port Royal Road
Hanover, MD 21076-1320 Springfield, VA 22161-2171
(301) 621-0390 (703) 605-6000
Acknowledgments
The author would like to thank the following individuals for making this research
possible:
• Dawn Jegley from NASA Langley Research Center for passing on her knowledge of
structures and experimentation.
• Dr. Paul Cooper of The George Washington University for his guidance and advice.
• Dr. Damodar Ambur of the Mechanics and Durability Branch at NASA Langley
Research Center for providing the opportunity to perform my research.
• Bert Cano and Brian Grimsley for the fabrication of the composite panels.
• Louis Simmons of the Advanced Prototype Development Branch at NASA Langley for
all his time and effort.
• Jeff Gragg, Brian Cheshire, George Cowely, Theresa Oneil, and Ann Cole for their
assistance in the laboratory.

iii
Table of Contents
Abstract...................................................................................................................................... v
List of Figures ........................................................................................................................... vi
Nomenclature .......................................................................................................................... viii
Chapter 1 : Introduction............................................................................................................. 1
1.1 Objectives......................................................................................................................... 2
1.2 Review of Literature ......................................................................................................... 3
Chapter 2 : Design and Fabrication............................................................................................ 5
2.1 Methods of Filamentary Composite Tailoring ................................................................... 5
2.1.1 Laminate Rotation...................................................................................................... 5
2.1.2 Angle Ply Rotation..................................................................................................... 6
2.1.3 Box Bend-Twist Coupling.......................................................................................... 7
2.2 Wing Box Specimen Design ........................................................................................... 10
2.3 Panel and Box Fabrication .............................................................................................. 14
2.4 Mechanical Property Tests.............................................................................................. 19
2.4.1 Specimens................................................................................................................ 19
2.4.2 Test Setup and Procedure ......................................................................................... 20
2.4.3 Property Test Results ............................................................................................... 21
Chapter 3 : Analysis ................................................................................................................. 24
3.1 Closed Form Analysis..................................................................................................... 24
3.1.1 Derivation................................................................................................................ 24
3.1.2 CFC Wing Box Analysis.......................................................................................... 29
3.2 Finite Element Analysis .................................................................................................. 30

iv
3.2.1 Linear Analysis ........................................................................................................ 31
3.2.2 Failure Analysis ....................................................................................................... 33
Chapter 4 : Wing Box Test ....................................................................................................... 37
4.1 Instrumentation............................................................................................................... 37
4.2 Test Setup and Procedure................................................................................................ 42
Chapter 5 : Discussion of Results ............................................................................................. 46
5.1 Finite Element Analysis .................................................................................................. 46
5.2 Failure ............................................................................................................................ 53
5.3 Closed Form Code .......................................................................................................... 55
Chapter 6 : Concluding Remarks .............................................................................................. 59
6.1 Conclusions .................................................................................................................... 59
6.2 Recommendations for Future Work ................................................................................ 60
References................................................................................................................................ 62
Appendix: Closed Form Code .................................................................................................. 65

v
Abstract
Aeroelasticity is the relationship between the elasticity of an aircraft structure and its
aerodynamics. This relationship can cause instabilities such as flutter in a wing. Engineers have
long studied aeroelasticity to ensure such instabilities do not become a problem within normal
operating conditions. In recent decades structural tailoring has been used to take advantage of
aeroelasticity. It is possible to tailor an aircraft structure to respond favorably to multiple
different flight regimes such as takeoff, landing, cruise, 2-g pull up, etc. Structures can be
designed so that these responses provide an aerodynamic advantage.
This research investigates the ability to design and analyze tailored structures made from
filamentary composites. Specifically the accuracy of tailored composite analysis must be verified
if this design technique is to become feasible. To pursue this idea, a validation experiment has
been performed on a small-scale filamentary composite wing box. The box is tailored such that
its cover panels induce a global bend-twist coupling under an applied load. Two types of
analysis were chosen for the experiment. The first is a closed form analysis based on a
theoretical model of a single cell tailored box beam and the second is a finite element analysis.
The predicted results are compared with the measured data to validate the analyses.
The comparison of results show that the finite element analysis is capable of predicting
displacements and strains to within 10% on the small-scale structure. The closed form code is
consistently able to predict the wing box bending to 25% of the measured value. This error is
expected due to simplifying assumptions in the closed form analysis. Differences between the
closed form code representation and the wing box specimen caused large errors in the twist
prediction. The closed form analysis prediction of twist has not been validated from this test
vi
List of Figures
Figure 1-1: X-29 Technology Demonstrator (Photo by NASA) .................................................. 1
Figure 1-2: Starboard Structural Wing Box................................................................................. 3
Figure 2-1: Laminate Rotation Strategy ...................................................................................... 6
Figure 2-2: Angle Ply Rotation Strategy ..................................................................................... 7
Figure 2-3: Extension-Shear Coupling in Generally Orthotropic Laminates ................................ 9
Figure 2-4: Box Bend-Twist Coupling caused by Laminate Shear-Extension Coupling .............. 9
Figure 2-5: Wing Box Specimen Dimensions ........................................................................... 11
Figure 2-6: Bend-Twist Coupling Parameter vs. Angle Ply [0/ /90]s ........................................ 13
Figure 2-7: Resin Infiltration .................................................................................................... 15
Figure 2-8: C-scan of Panel C1................................................................................................. 16
Figure 2-9: C-scan of Panel C2................................................................................................. 17
Figure 2-10: C-scan of Panel TS-2............................................................................................ 17
Figure 2-11: Panel C1 Thickness Variation............................................................................... 18
Figure 2-12: Panel C2 Thickness Variation............................................................................... 18
Figure 2-13: Tension Specimen (axial gage shown).................................................................. 20
Figure 3-1: Multiple Load Scenario .......................................................................................... 26
Figure 3-2: Closed Form Code Model....................................................................................... 27
Figure 3-3: CFC Output – Box Twist vs. Span.......................................................................... 28
Figure 3-4: CFC Output – Bending vs. Span............................................................................. 28
Figure 3-5: Finite Element Wing Box Model ............................................................................ 32

vii
Figure 3-6: Finite Element Mesh Bias....................................................................................... 32
Figure 3-7: Ply Failure Plot ...................................................................................................... 34
Figure 4-1: Cover Panel Strain Gage Layout............................................................................. 37
Figure 4-2: DCDT Layout ........................................................................................................ 39
Figure 4-3: Tip DCDT’s ........................................................................................................... 39
Figure 4-4: Mid-Span DCDTs .................................................................................................. 40
Figure 4-5: Trailing Edge Potting DCDT’s ............................................................................... 40
Figure 4-6: Bottom Potting DCDT’s......................................................................................... 41
Figure 4-7: Panel Root DCDT .................................................................................................. 41
Figure 4-8: Clamped Root End ................................................................................................. 43
Figure 4-9: Load Introduction................................................................................................... 43
Figure 5-1: Measured and Predicted Displacements for 100 lb BTE Load................................. 47
Figure 5-2: Measured and Calculated Displacements for 100 lb BLE Load............................... 48
Figure 5-3: FEA Deformation Plot (100 lb BLE Load) ............................................................. 49
Figure 5-4: Camber Curvature during 100 lb BLE Load ........................................................... 49
Figure 5-5: Wing Root Element Strain Gradient ....................................................................... 51
Figure 5-6: Lower Cover Panel Strain Trends........................................................................... 52
Figure 5-7: Bracket/Panel Delamination ................................................................................... 54
Figure 5-8: Bond Shear/Peeling Failure .................................................................................... 54
viii
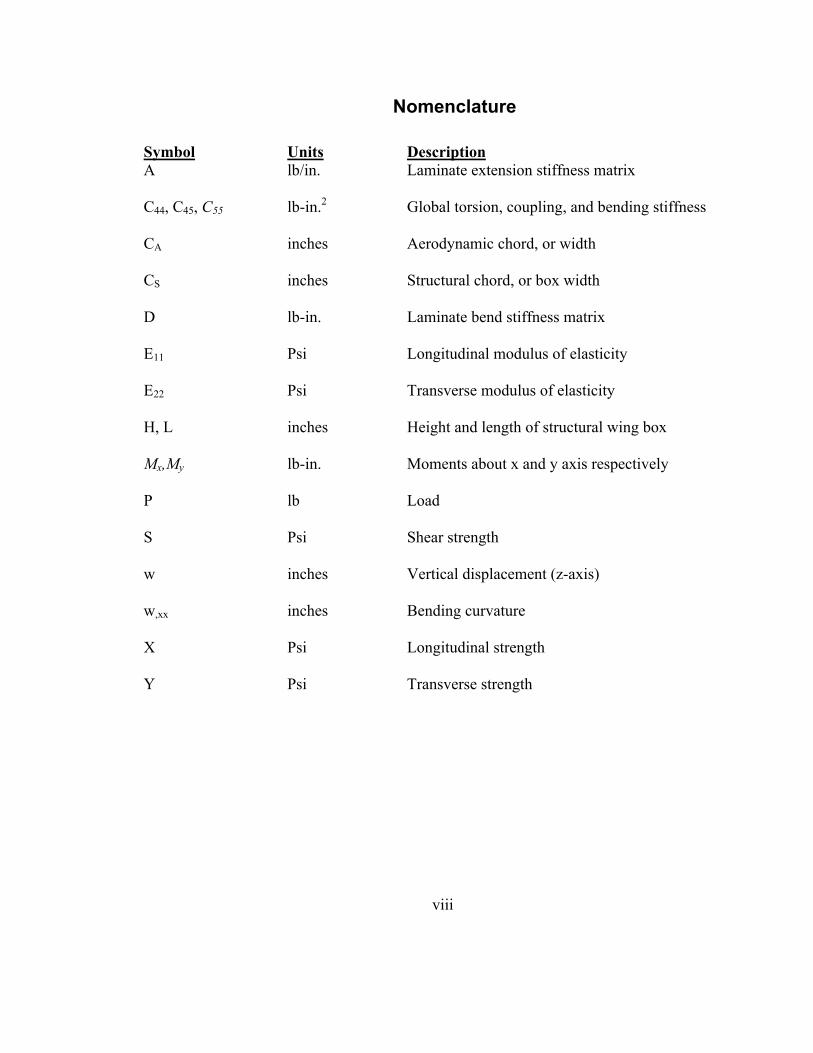
Nomenclature
Symbol Units Description
A lb/in. Laminate extension stiffness matrix
C44, C45, C55 lb-in.2
Global torsion, coupling, and bending stiffness
CA inches Aerodynamic chord, or width
CS inches Structural chord, or box width
D lb-in. Laminate bend stiffness matrix
E11 Psi Longitudinal modulus of elasticity
E22 Psi Transverse modulus of elasticity
H, L inches Height and length of structural wing box
Mx,My lb-in. Moments about x and y axis respectively
P lb Load
S Psi Shear strength
w inches Vertical displacement (z-axis)
w,xx inches Bending curvature
X Psi Longitudinal strength
Y Psi Transverse strength
ix
Symbol Units Description
- Bend twist coupling parameter
radians Box twist
,x radians Rate of twist
µ - Microstrain or 10-6
inches/inch
12 - Poisson’s ratio
degrees off-axis angle of angle ply
Acronym Description
AR Angle Ply Rotation
BTE Bottom Trailing Edge
BLE Bottom Leading Edge
DCDT Direct Current Displacement Transducer
CFC Closed Form Code
LR Laminate Rotation

x

1
Chapter 1 : Introduction
In the aerodynamics discipline engineers have always understood that the optimal shape
of a wing is dependent upon the particular stage of flight. Engineers use devices such as slats and
flaps to modify the camber and angle of attack of a wing in flight. The compromise of adding
such devices is increased weight and complexity. With structural tailoring using filamentary
composites, it may be possible to design a wing to provide deformations under flight loads that
result in an increase in aerodynamic performance.
An example of aeroelastic tailoring is the wing design of the X-29 technology
demonstrator (Figure 1-1). The X-29 has swept forward wings, which is a configuration that
encounters low-speed divergence. This problem was solved by tailoring the skin material to
induce a wing bend-twist coupling that counters the divergence1. In the sweptback configuration,
an aircraft’s wings do not encounter the low speed elastic divergence that the X-29 must
withstand. However, the tailoring may instead be used for a performance enhancement.
Figure 1-1: X-29 Technology Demonstrator (Photo by NASA)
2
Previous research on tailored structures allowed the development of analytical tools to
quantify their behavior. However little experimentation has been performed to validate the
analyses. Before these tools can be used to design structure, they must be validated with actual
specimens.
1.1 Objectives
This research focuses on the design, analysis, and testing of a small-scale wing box
(Figure 1-2) for the purposes of design and analysis validation. The wing box represents the
structural component of a composite wing. The objectives of the research are as follows:
1. Design a small-scale tailored wing box that can measurably demonstrate box
bend-twist coupling. Conduct an experiment to measure the behavior of the wing
box specimen
2. Analyze the box to predict its response under load using a closed form code
(CFC) and a finite element analysis (FEA). Compare these predicted values to the
measured values to help validate the analyses.

3
Figure 1-2: Starboard Structural Wing Box
1.2 Review of Literature
Research regarding structural tailoring can be found as far back as the 1940’s. Engineers
proposed orienting wood fibers in propellers to provide a favorable elastic response. In the early
1980’s a body of work was completed regarding the use of aeroelastic tailoring to solve the low
speed divergence problem of swept forward wings. A paper written by Sherrer, Hertz, and Shirk
describes a wind tunnel demonstration of tailoring in a swept forward wing2. Shirk also co-wrote
a paper validating aeroelastically tailored design methods for selected wing configurations3. Also
in the 1980’s, Valisetty and Rehfield developed a theoretical beam model for the use in
composite rotor blades4. This model considers a single cell box beam with tailored cover panels

4
that induce a bend-twist coupling in the beam. Later Rehfield co-wrote a paper with Hodges and
Nixon that correlated the single cell beam model with an MSC/NASTRAN finite element
model5. A NASA contractor report by Rehfield, Chang, and Zischka describe methods of chord-
wise aeroelastic tailoring6.
More recently a paper written by Rehfield and Cheung extends the tailored box model
analysis by developing rate-of-twist and bending-curvature formulas7. These are the governing
equations used to create the closed form code in this research. Rehfield and Cheung also use the
simple tailored box model in an optimization code. Minimum weight stacking sequences are
found as a function of the ply rotation angle while constrained by a maximum axial strain in the
fiber direction.
5
Chapter 2 : Design and Fabrication
To validate the analysis methods, they must be compared to the response of an actual test
specimen. A small-scale tailored wing box was designed and fabricated from filamentary
composites at NASA Langley Research Center for this purpose. Using a structural tailoring
technique, the wing box specimen was designed to exhibit bend-twist coupling under load. The
design and fabrication process is discussed in this chapter.
2.1 Methods of Filamentary Composite Tailoring
Structural tailoring involves the implementation of directional stiffness to control the
deformations caused by external forces1. Filamentary composite materials can be used to create
these stiffnesses. Fibers can be oriented in any direction to provide the required behavior. Two
strategies for tailoring of composites described in reference 7 are the Laminate Rotation (LR)
method and the Angle ply Rotation (AR) method.
2.1.1 Laminate Rotation
In this strategy a stacking sequence is selected that contains a combination of axial,
transverse and angle plies. In most cases a balanced laminate (- to match each + ) is chosen to
avoid difficulties during fabrication7. The resulting balanced panel has orthotropic properties.
The entire laminate is then rotated such that the principal material axes are not aligned with the
natural body axes of the structure, as shown in Figure 2-1, producing an unsymetric response
when loaded8.
6
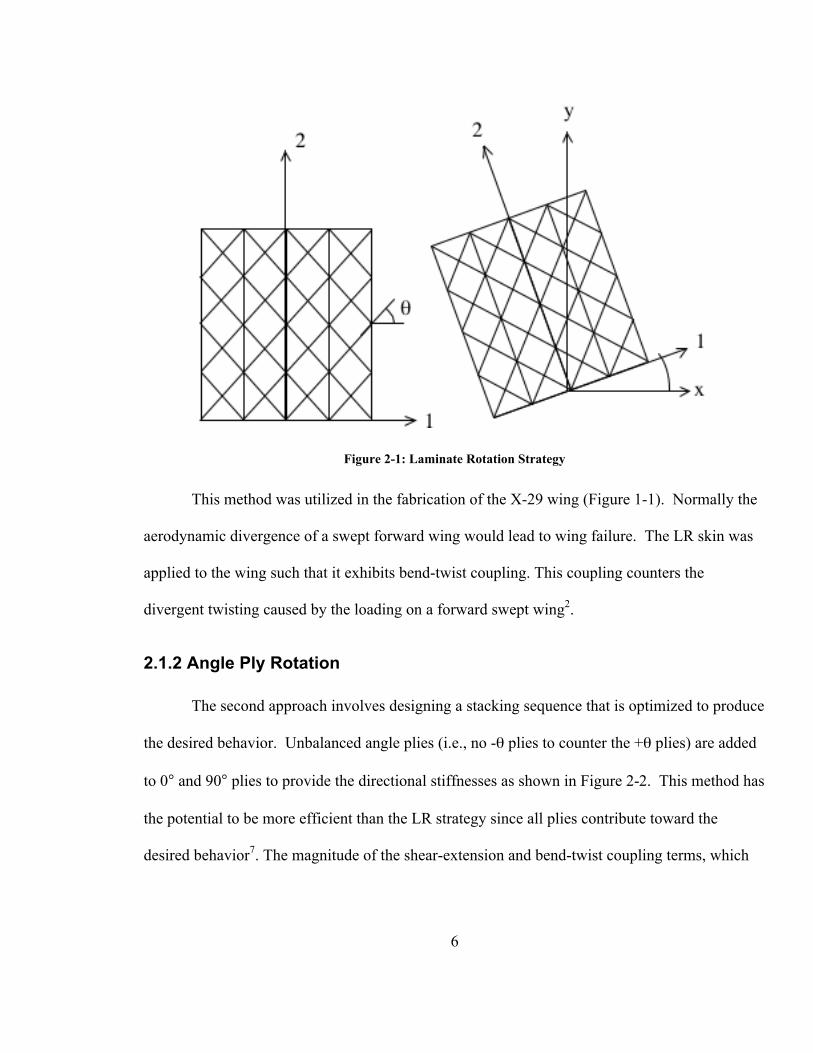
Figure 2-1: Laminate Rotation Strategy
This method was utilized in the fabrication of the X-29 wing (Figure 1-1). Normally the
aerodynamic divergence of a swept forward wing would lead to wing failure. The LR skin was
applied to the wing such that it exhibits bend-twist coupling. This coupling counters the
divergent twisting caused by the loading on a forward swept wing2.
2.1.2 Angle Ply Rotation
The second approach involves designing a stacking sequence that is optimized to produce
the desired behavior. Unbalanced angle plies (i.e., no - plies to counter the + plies) are added
to 0° and 90° plies to provide the directional stiffnesses as shown in Figure 2-2. This method has
the potential to be more efficient than the LR strategy since all plies contribute toward the
desired behavior7. The magnitude of the shear-extension and bend-twist coupling terms, which

7
are necessary for tailoring, depend on the stacking sequence and number of plies. As the number
of plies increases the coupling terms tend to vanish.
Figure 2-2: Angle Ply Rotation Strategy
Neither strategy requires stacking sequences that are unsymmetric about the mid-plane. A
symmetric arrangement is generally desirable from a manufacturing aspect to avoid warping
caused by thermally induced loads during the curing process on a laminate with bend-extension
coupling. The shear-extension coupling can also affect the laminate when cooled but will not
directly cause out-of-plane deformations8.
2.1.3 Box Bend-Twist Coupling
The specific deformation of interest in this research is the box bend-twist coupling that
can be induced under an applied load. The simple tailored box model as described in reference 2
considers only the cover panels to be the load-bearing component. Therefore box tailoring occurs
8
through these panels. To understand the global box bend-twist coupling mechanism, the panel
behavior must be examined.
A laminate’s behavior can be described by its stiffness matrices found in the force and
moment equations (Eq. 2-1 and 2-2).
+
°
°
°
=
xy
y
x
xy
y
x
xy
y
x
BBB
BBB
BBB
AAA
AAA
AAA
N
N
N
662616
262212
161211
662616
262212
161211
Eq. 2-1
+
°
°
°
=
xy
y
x
xy
y
x
xy
y
x
DDD
DDD
DDD
BBB
BBB
BBB
M
M
M
662616
262212
161211
662616
262212
161211
Eq. 2-2
The A, B, and D matrices represent the extension, bending-extension coupling, and the
bending stiffness, respectively, of a laminate. Since all laminates fabricated for this experiment
are symmetric about the mid-plane, the bending-extension (B) matrix disappears. In a generally
orthotropic laminate, the A and D matrices are fully populated. The appearance of the A16 and
A26 terms indicate an extension-shear coupling while the D16 and D26 terms indicate bend-twist
coupling.
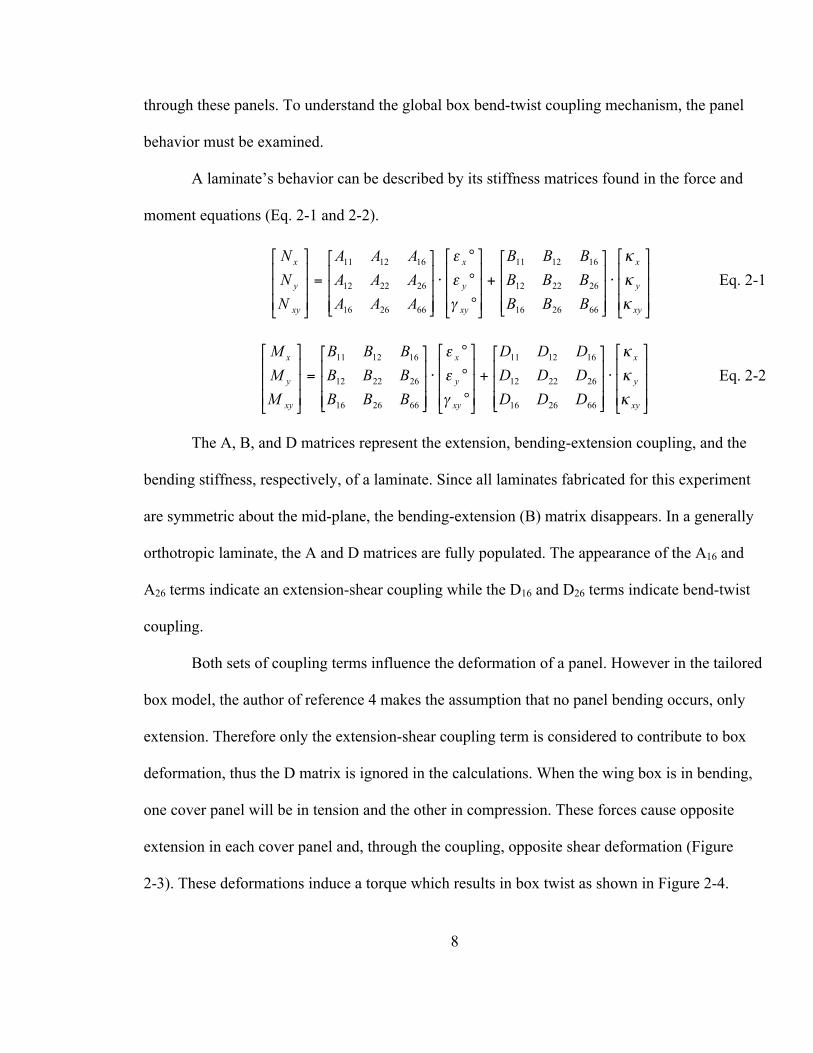
Both sets of coupling terms influence the deformation of a panel. However in the tailored
box model, the author of reference 4 makes the assumption that no panel bending occurs, only
extension. Therefore only the extension-shear coupling term is considered to contribute to box
deformation, thus the D matrix is ignored in the calculations. When the wing box is in bending,
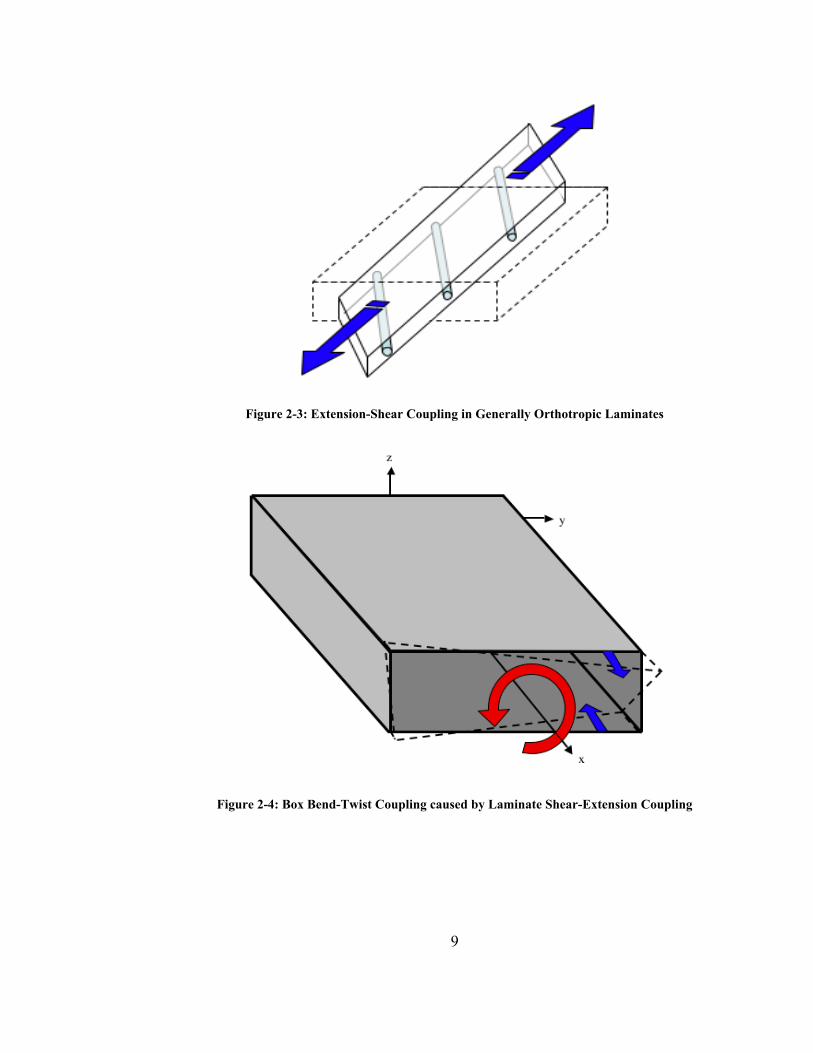
one cover panel will be in tension and the other in compression. These forces cause opposite
extension in each cover panel and, through the coupling, opposite shear deformation (Figure
2-3). These deformations induce a torque which results in box twist as shown in Figure 2-4.
9
Figure 2-3: Extension-Shear Coupling in Generally Orthotropic Laminates
Figure 2-4: Box Bend-Twist Coupling caused by Laminate Shear-Extension Coupling

10
2.2 Wing Box Specimen Design
The design goal set for the box is to demonstrate the bend-twist coupling phenomenon.
Therefore the tailored cover panels were designed to maximize this effect. For the same reason,
the response (displacements and strains) must be measurable. The Direct Current Displacement
Transducers (DCDT’s) used in this test require a displacement of at least 0.01 inches to
confidently disregard experimental error due to noise, imperfect boundary conditions, etc.
The wing box consists of three main parts; the cover panels, web panels, and angle
brackets. The cover panels are the primary load bearing pieces of the structure and are the
tailored components. The webs are loaded primarily in shear and were designed as symmetric
laminates with orthotropic behavior such that they should not affect the bend-twist coupling.
Similarly the brackets are designed to minimize the impact on the behavior of the tailored box.
The lower two brackets are molded from the same composite as the box while the upper two
brackets are made of aluminum. All brackets are bonded to the wing box to hold the assembly
together.
The maximum dimensions of the wing box were limited by the tooling available to
fabricate composite panels. The largest panel that could be created was approximately 33 inches
by 20 inches. Preliminary studies completed with the CFC and FEA model indicated that a
structure of this relative size would exhibit very small deflections. Therefore the length was set
to the maximum manufacturable length of 33 inches to maximize the end displacement. One inch
of the span at the wing root would be potted to represent the clamped boundary conditions,
leaving a wing box span of 32 unsupported inches. The cover panels are 14 inches wide with 1

11
inch on either side for fixturing, leaving a 12-inch chord for the box. The box height is 2.27
inches. The wing box specimen is illustrated in Figure 2-5.
Figure 2-5: Wing Box Specimen Dimensions
With the box dimensions in place, the stacking sequences of the cover panels are
designed to maximize bend-twist coupling. To determine the properties of each panel, the
membrane stiffness (A matrix) of each composite panel is found.
Aij = Qij(k )hk
k=1
N
(i,j = 1,2,6) Eq. 2-3
N refers to the total number of plies, hk is the thickness of ply k, and Qij(k)
is the reduced stiffness
matrix for ply k. The A matrix can be used to find the uniaxial wall plane stress stiffnesses6:
K11 = A11 (A12)2 /A22 (Extension) Eq. 2-4
K12 = A16 (A12A26) /A22 (Shear) Eq. 2-5
K22 = A66 (A26)2 /A22 (Coupling) Eq. 2-6
12
These stress stiffnesses are then used to find the global box stiffness7:
C44 =Cs2H 2
(Cs+ H)2(K22
u + K22l )Cs+ (A66
TE + A66LE )H[ ] Eq. 2-7
C45 =Cs2H 2
2(Cs+ H)K12
u + K12l[ ] Eq. 2-8
C55 =CsH 2
4K11
u + K11l[ ] Eq. 2-9
C44, C45, and C55 are the box torsion, coupling, and bending stiffnesses respectively. In reference
7, the value 2 is defined as a bend-twist coupling parameter.
2=(C45)
2
C44 C55
Eq. 2-10
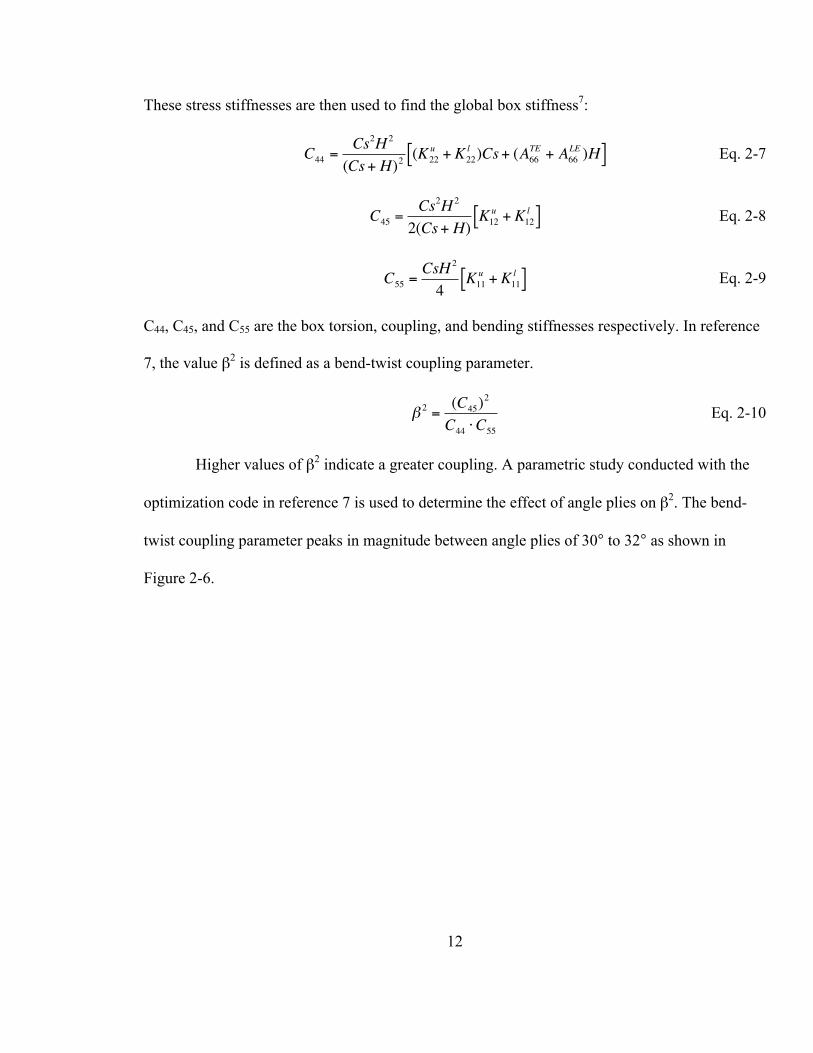
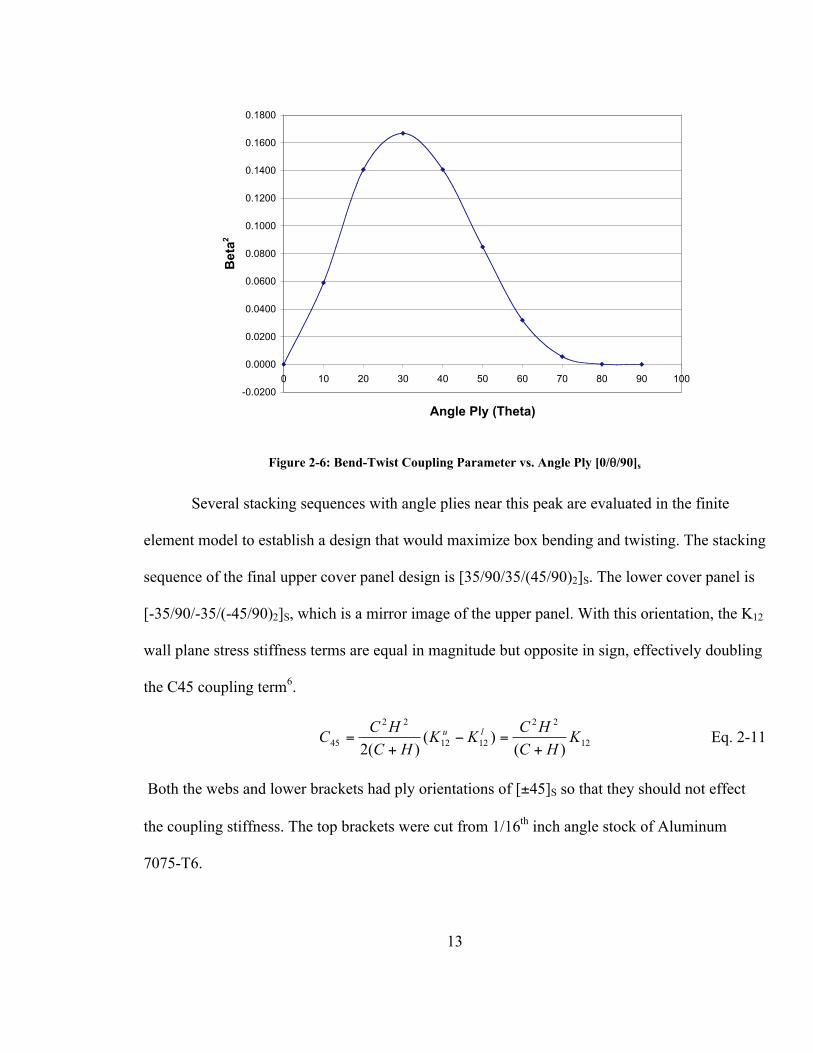
Higher values of 2 indicate a greater coupling. A parametric study conducted with the
optimization code in reference 7 is used to determine the effect of angle plies on 2. The bend-
twist coupling parameter peaks in magnitude between angle plies of 30° to 32° as shown in
Figure 2-6.
13
-0.0200
0.0000
0.0200
0.0400
0.0600
0.0800
0.1000
0.1200
0.1400
0.1600
0.1800
0 10 20 30 40 50 60 70 80 90 100
Angle Ply (Theta)
Beta
2
Figure 2-6: Bend-Twist Coupling Parameter vs. Angle Ply [0/ /90]s
Several stacking sequences with angle plies near this peak are evaluated in the finite
element model to establish a design that would maximize box bending and twisting. The stacking
sequence of the final upper cover panel design is [35/90/35/(45/90)2]S. The lower cover panel is
[-35/90/-35/(-45/90)2]S, which is a mirror image of the upper panel. With this orientation, the K12
wall plane stress stiffness terms are equal in magnitude but opposite in sign, effectively doubling
the C45 coupling term6.
12
22
1212
22
45)(
)()(2
KHC
HCKK
HC
HCC
lu
+=
+= Eq. 2-11
Both the webs and lower brackets had ply orientations of [±45]S so that they should not effect
the coupling stiffness. The top brackets were cut from 1/16th
inch angle stock of Aluminum
7075-T6.

14
2.3 Panel and Box Fabrication
Facilities operated by the Advanced Materials and Processing Branch at the NASA
Langley Research Center were used to manufacture all of the composite panels. The composite
fabrication process used is called Vacuum Assisted Resin Transfer Molding (VARTM). This
technique does not require an autoclave, which makes it more flexible in terms of panel size and
reduces cost. VARTM was chosen as the fabrication process because it has been successful in
creating panels with unbalanced stacking sequence without warping as required by the AR
strategy.
Fabrication begins with the stacking of unidirectional fabric at different angles to create
the desired stacking sequence. The fabric consisted of Magnamite IM7 high performance fibers
in a 6K-filament count. The fabric is then enclosed in a conformable bag to which a vacuum is
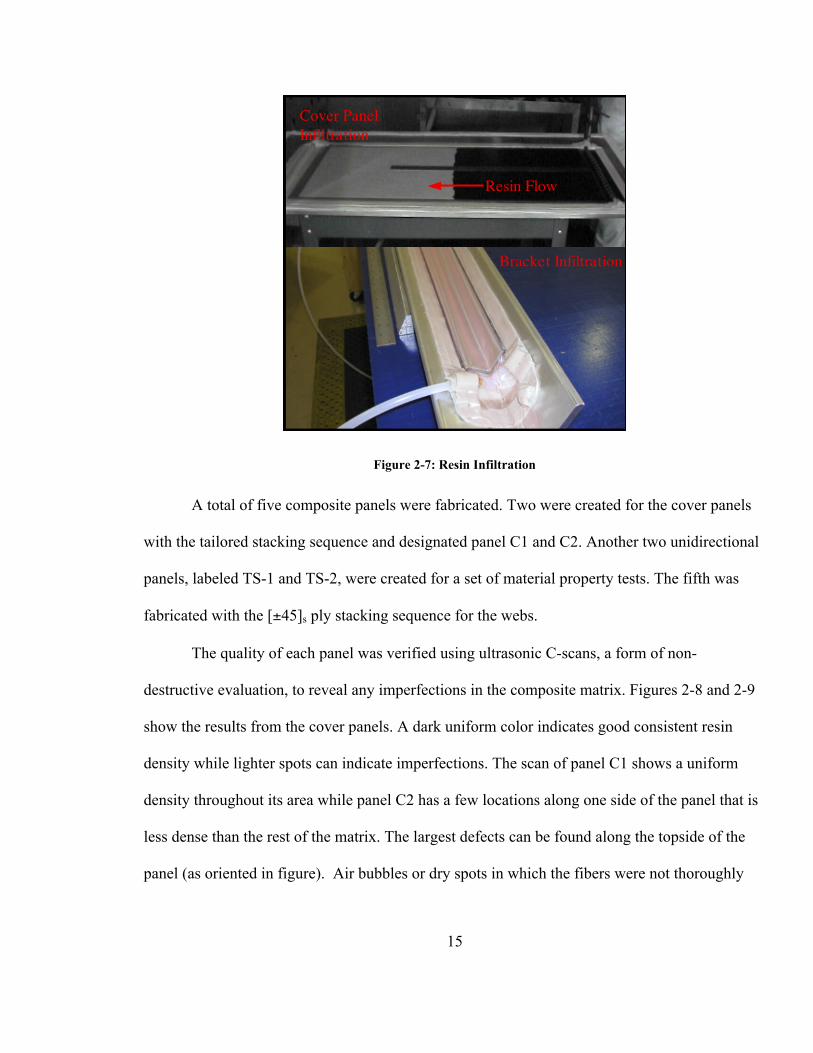
drawn. VR56-19 VARTM resin flows into the bag and infiltrates the fibers as see in Figure 2-7.
Once fully impregnated, the part is placed in an oven to cure. The cure cycle consists of a ramp
up from room temperature to 67°C at 1.1°C/minute and hold for 2.75 hours, followed by a ramp
at 1.4°C/minute to 123°C and hold for another 2.75 hours. The part is then cooled at
1.0°C/minute to room temperature, released from the mold and subjected to a freestanding post
cure for six hours at 177°C9.
15
Figure 2-7: Resin Infiltration
A total of five composite panels were fabricated. Two were created for the cover panels
with the tailored stacking sequence and designated panel C1 and C2. Another two unidirectional
panels, labeled TS-1 and TS-2, were created for a set of material property tests. The fifth was
fabricated with the [±45]s ply stacking sequence for the webs.
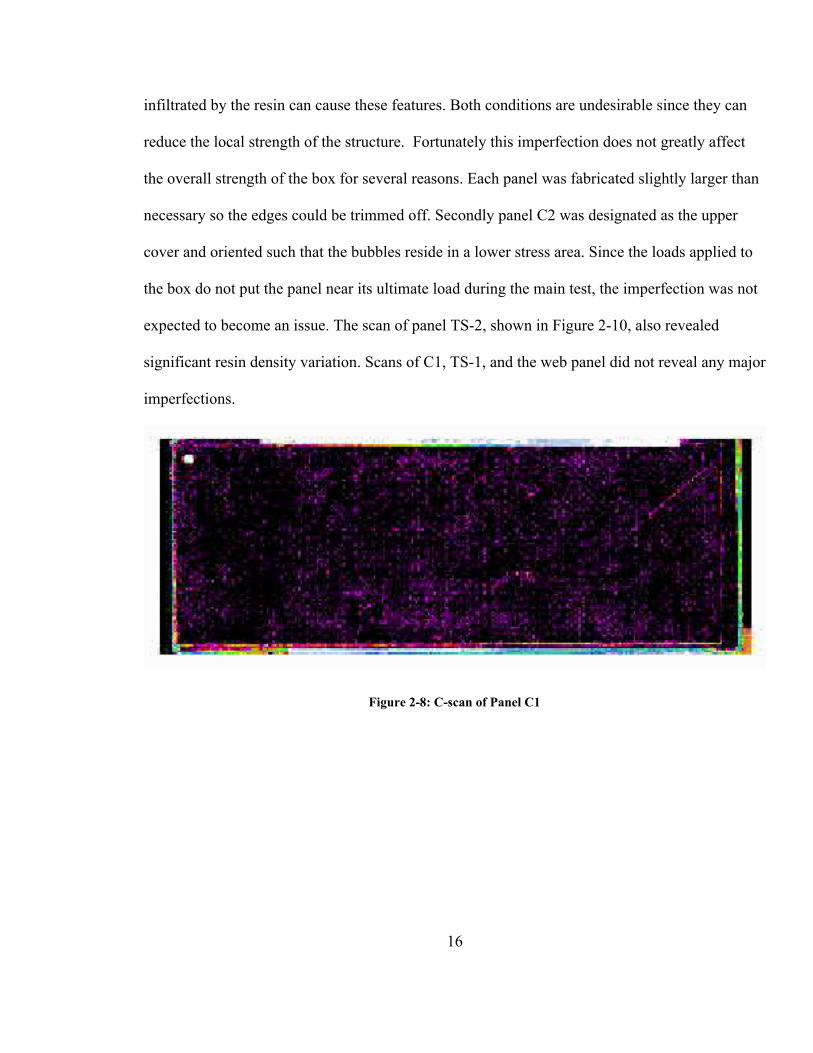
The quality of each panel was verified using ultrasonic C-scans, a form of non-
destructive evaluation, to reveal any imperfections in the composite matrix. Figures 2-8 and 2-9
show the results from the cover panels. A dark uniform color indicates good consistent resin
density while lighter spots can indicate imperfections. The scan of panel C1 shows a uniform
density throughout its area while panel C2 has a few locations along one side of the panel that is
less dense than the rest of the matrix. The largest defects can be found along the topside of the
panel (as oriented in figure). Air bubbles or dry spots in which the fibers were not thoroughly
16
infiltrated by the resin can cause these features. Both conditions are undesirable since they can
reduce the local strength of the structure. Fortunately this imperfection does not greatly affect
the overall strength of the box for several reasons. Each panel was fabricated slightly larger than
necessary so the edges could be trimmed off. Secondly panel C2 was designated as the upper
cover and oriented such that the bubbles reside in a lower stress area. Since the loads applied to
the box do not put the panel near its ultimate load during the main test, the imperfection was not
expected to become an issue. The scan of panel TS-2, shown in Figure 2-10, also revealed
significant resin density variation. Scans of C1, TS-1, and the web panel did not reveal any major
imperfections.
Figure 2-8: C-scan of Panel C1

17
Figure 2-9: C-scan of Panel C2
Figure 2-10: C-scan of Panel TS-2
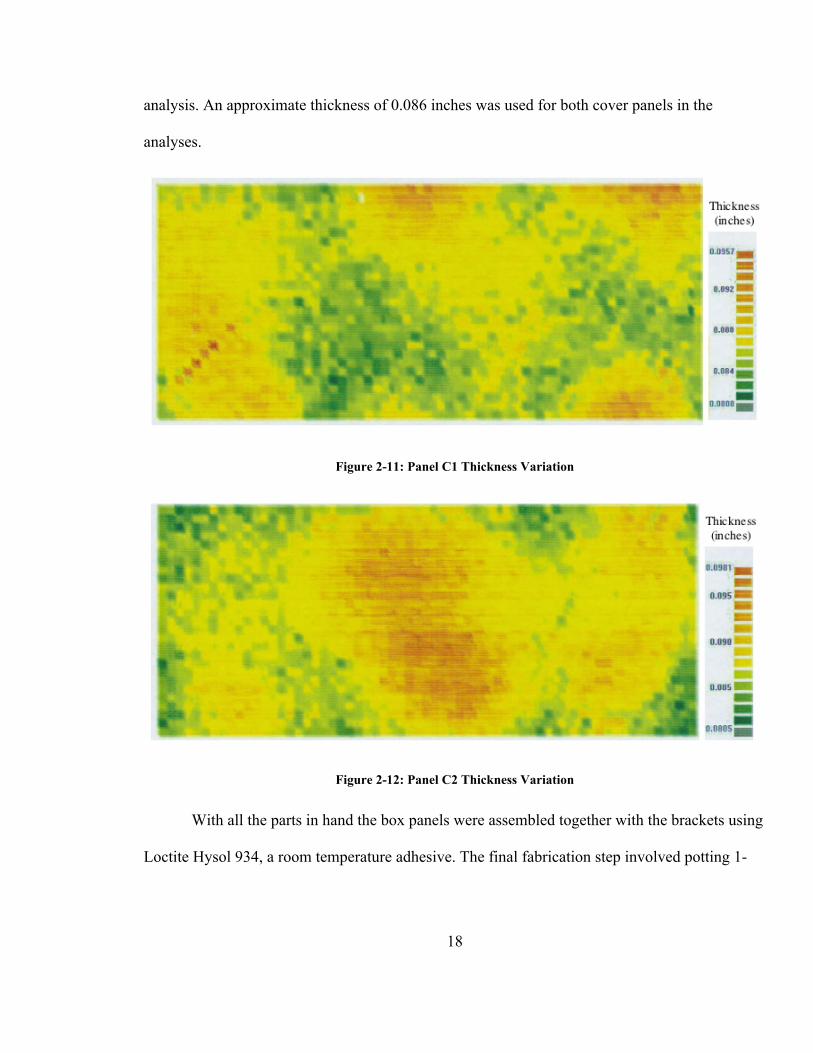
The two cover panels were checked for geometric imperfections. In this case the goal was
to quantify the thickness variation throughout the panel’s length. The thickness of panel C2
varied by approximately ±0.009 inches and panel C1 varied by ±0.008 inches (Figure 2-11 and
2-12). This variation is nearly 10% of the panel thickness, which may affect the accuracy of the
18
analysis. An approximate thickness of 0.086 inches was used for both cover panels in the
analyses.
Figure 2-11: Panel C1 Thickness Variation
Figure 2-12: Panel C2 Thickness Variation
With all the parts in hand the box panels were assembled together with the brackets using
Loctite Hysol 934, a room temperature adhesive. The final fabrication step involved potting 1-

19
inch of the root end of the box in a resin-aluminum mixture that is cured in an aluminum mold.
The root end of the wing box is placed in the mixture while it is curing. When hardened the
potting provides a stiff root edge that is represented by clamped boundary conditions in the finite
element model. It also distributes boundary loads without causing local failure. The potting
frame is clamped to the test wall to complete the clamped conditions.
2.4 Mechanical Property Tests
Since the material used to create the panels is a relatively new fiber and resin system,
material characterization was required. Two mechanical property tests were completed for this
purpose. These tests were completed in accordance with the American Society for Testing of
Materials (ASTM D 3039)10
. Properties that were obtained from these tests include E11, E22, and
12.
2.4.1 Specimens
Fifteen specimens were cut from unidirectional panel TS-1 with the fibers in the
longitudinal or 0° direction and were labeled TS-1-1 through TS-1-15. Ten specimens were cut
from unidirectional panel TS-2 with the fibers transverse, or 90°, from the loading direction.
These transverse specimens were labeled TS-2-1 through TS-2-10. Since the C-scan of panel TS-
2 revealed some resin variation, the specimens were sampled from different areas of the panel to
determine if the resin density affected the results. Each specimen was 0.5 inches wide and 10
inches long. Specimens TS-1-1 through TS-1-8 were instrumented with longitudinal gages and
TS-1-9 to TS-1-15 were instrumented with transverse gages. The TS-2 specimens were
20
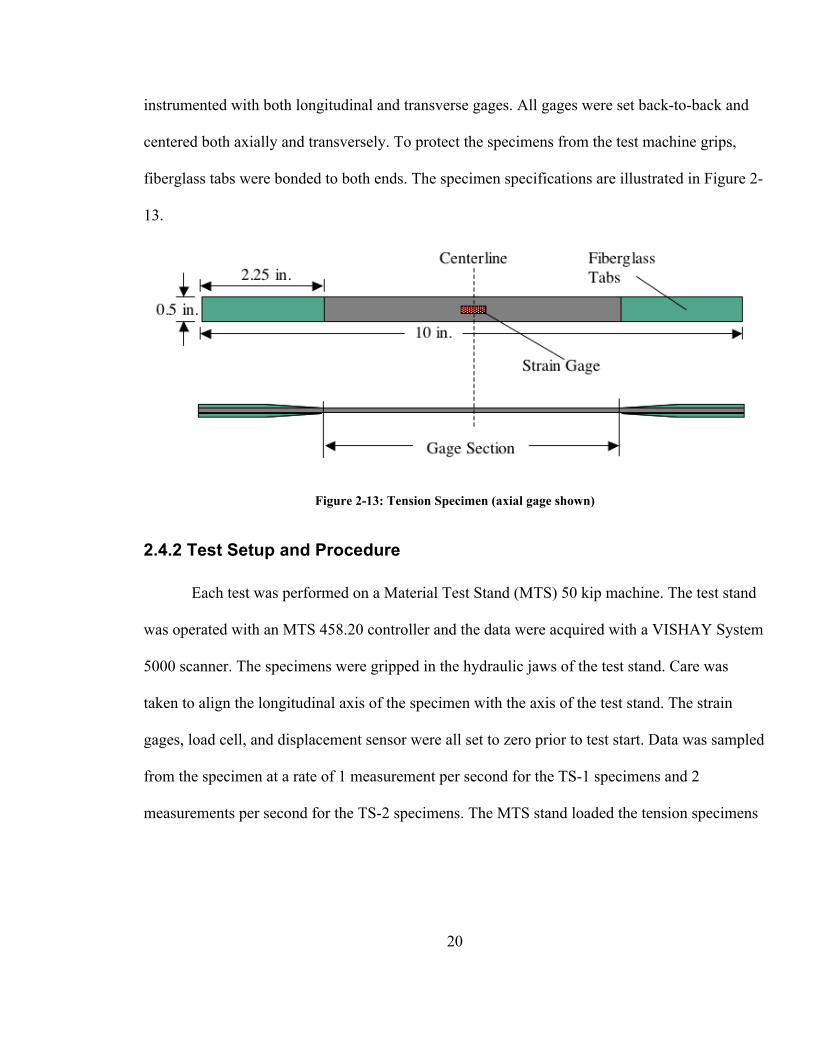
instrumented with both longitudinal and transverse gages. All gages were set back-to-back and
centered both axially and transversely. To protect the specimens from the test machine grips,
fiberglass tabs were bonded to both ends. The specimen specifications are illustrated in Figure 2-
13.
Figure 2-13: Tension Specimen (axial gage shown)
2.4.2 Test Setup and Procedure
Each test was performed on a Material Test Stand (MTS) 50 kip machine. The test stand
was operated with an MTS 458.20 controller and the data were acquired with a VISHAY System
5000 scanner. The specimens were gripped in the hydraulic jaws of the test stand. Care was
taken to align the longitudinal axis of the specimen with the axis of the test stand. The strain
gages, load cell, and displacement sensor were all set to zero prior to test start. Data was sampled
from the specimen at a rate of 1 measurement per second for the TS-1 specimens and 2
measurements per second for the TS-2 specimens. The MTS stand loaded the tension specimens

21
in strain control mode at 0.05 inches/minute until failure. After failure the maximum load and
failure location and type were noted.
2.4.3 Property Test Results
Most of the tension specimens failed in the grip region so failure information is not
representative of the specimen strength. The elastic modulus E11 is calculated from data from
specimens TS-1-1 through TS-1-8 using the relationship =E and is shown in Table 2-1.
The stress between 1000 and 3000 µ is used for the calculation. The remaining TS-1 specimens
provide the relationship between longitudinal strain and transverse strain required to calculate
tl=
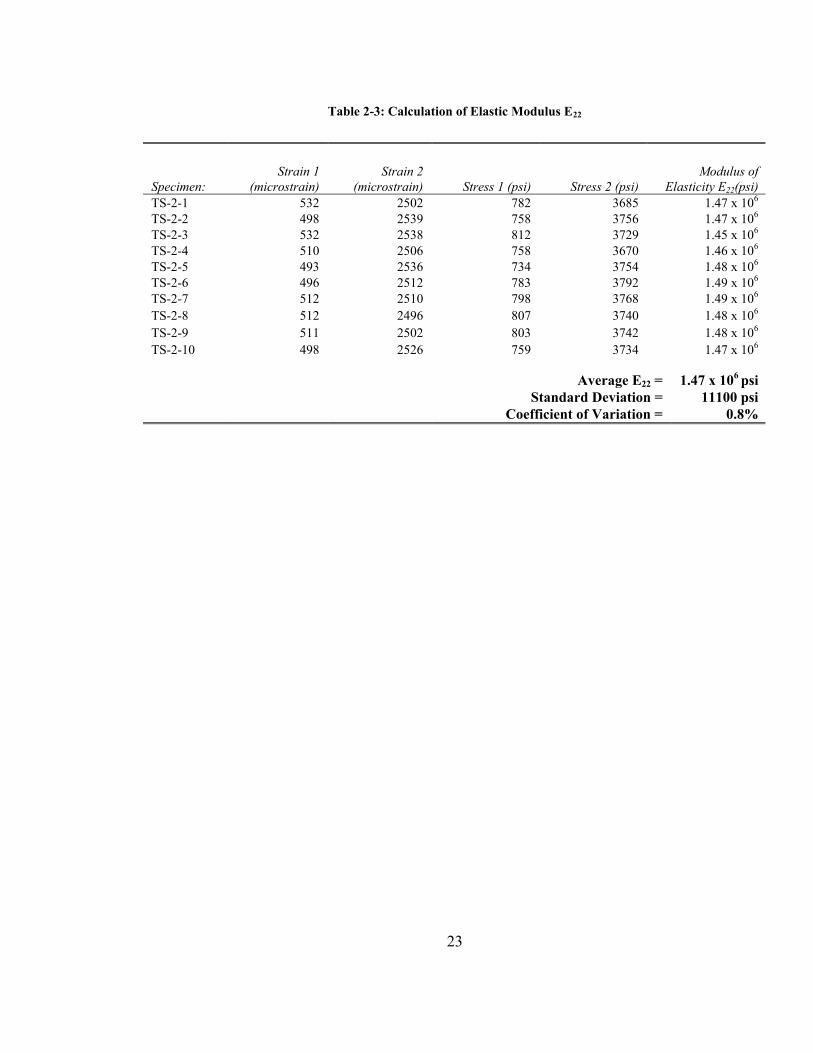
12 as shown in Table 4-2. Finally the TS-2 specimens are used to find E22 shown
in Table 4-3. A range of 500 to 2500 µ was used for the calculations. The coefficient of
variation for the calculation of E22 is only 0.8%. The minor variation in resin density in panel
TS-2 did not seem to affect the results of the test. The shear modulus of elasticity was taken from
the resin manufacturer’s data sheet and was G12 = 0.64 msi14
.

22
Table 2-1: Calculation of Elastic Modulus E11
Specimen
Strain 1
(Microstrain)
Strain 2
(Microstrain) Stress 1 (psi) Stress 2 (psi)
Modulus of
Elasticity E11(psi)
TS-1-1 1014 2984 19560 59030 2.00 x 10⁷
TS-1-2 1004 3037 18690 57820 1.93 x 10⁷
TS-1-3 1020 2965 19520 58040 1.98 x 10⁷
TS-1-4 1033 2971 19740 58090 1.98 x 10⁷
TS-1-5 1013 2995 19270 58380 1.97 x 10⁷
TS-1-6 1021 2977 20250 60550 2.06 x 10⁷
TS-1-7 981 2989 20160 62660 2.12 x 10⁷
TS-1-8 977 2998 19600 61370 2.07 x 10⁷
Average E11 = 2.01 x 10
7psi
Standard Deviation = 583000 psi
Coefficient of Variation = 2.9%
Table 2-2: Calculation of Poisson's Ratio
Strain 1
(Microstrain)
Strain 2
(Microstrain)
longitudinal 1000 3000 2000
transverse -308 -929 -620
12 = 0.310
23
Table 2-3: Calculation of Elastic Modulus E22
Specimen:
Strain 1
(microstrain)
Strain 2
(microstrain) Stress 1 (psi) Stress 2 (psi)
Modulus of
Elasticity E22(psi)
TS-2-1 532 2502 782 3685 1.47 x 10⁶
TS-2-2 498 2539 758 3756 1.47 x 10⁶
TS-2-3 532 2538 812 3729 1.45 x 10⁶
TS-2-4 510 2506 758 3670 1.46 x 10⁶
TS-2-5 493 2536 734 3754 1.48 x 10⁶
TS-2-6 496 2512 783 3792 1.49 x 10⁶
TS-2-7 512 2510 798 3768 1.49 x 10⁶
TS-2-8 512 2496 807 3740 1.48 x 10⁶
TS-2-9 511 2502 803 3742 1.48 x 10⁶
TS-2-10 498 2526 759 3734 1.47 x 10⁶
Average E22 = 1.47 x 10
6 psi
Standard Deviation = 11100 psi
Coefficient of Variation = 0.8%

24
Chapter 3 : Analysis
Engineers benefit from an analytical tool to aid in the design of tailored structures. The
finite element technique can provide an accurate analysis of a structure. However creating a
finite element model can be time consuming. A closed form analysis provides a fast alternate that
may be helpful to a designer. Both of these techniques are applied to the wing box specimen to
predict its behavior. The predicted results are compared with the measured values in Chapter 5.
3.1 Closed Form Analysis
The work by Cheung in reference 7 regarding tailored composite box beams provides the
mathematical groundwork for the closed form code. The author develops an analytical model of
a single cell box beam by using the simplified tailored box model based on the theory of thin
walled composite beams by Rehfield6. By extending this work, a closed form code (CFC) is
written in Matlab to provide twist ( ) and deflection (w) of a simplified wing box given
geometry, material properties, and loading information.
3.1.1 Derivation
The model is a pair of cover panels that are connected by two web panels. This box
represents the load bearing structure of a composite wing (Figure 1-2). Boundary conditions for
the model are set to represent an aircraft wing with a clamped root and a free end. The Rate of
Twist of the wing and the Bending Curvature are derived in reference 3 and can be found from
the following expressions:
25
,x =1
C44C55(12)(C55Mx C45My ) Eq. 3-1
w,xx =1
C44C55(12)(C45Mx C44My ) Eq. 3-2
The terms Mx and My are moments about the span-wise axis (x) and chord-wise axis (y),
respectively.
A more useful set of equations would provide the actual magnitude of twist and vertical
displacement with respect to x, or span. The first, (x), can be obtained by integrating equation
3-1 with respect to x.
(x) = , d0
x=
1
C44C55(12)(C55Mx C45My )d0
xEq. 3-3
The global stiffness and bend-twist coupling parameters are dependent solely on the
material system and box cross-section, which are constant in this experiment. They can therefore
be moved outside the integral. Moments Mx and My are functions of x and are determined by the
distribution of loads. Since the relationship is linear, the contribution to twist from each load can
be evaluated separately and then summed to find the total wing twist. In a general form, the twist
at point x on a wing box with N loads is expressed as:
(x) =1
C44C55(12)
(C55MxiC45Myi
)d0
ui
i=1
N
Eq. 3-4
ui =di x > dix x < di
N refers to the number of loads on the wing box and di is the span-wise distance of load i
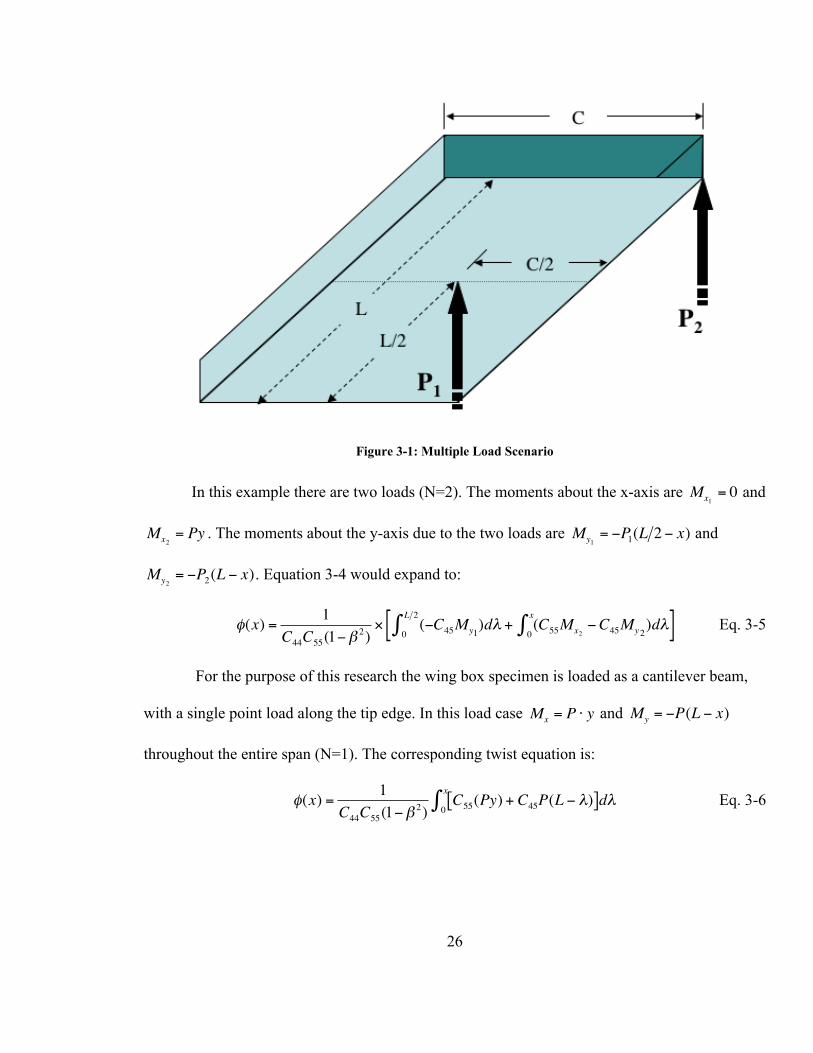
from the root. An example of a multiple load scenario is illustrated in Figure 3-1.
26
Figure 3-1: Multiple Load Scenario
In this example there are two loads (N=2). The moments about the x-axis are Mx1= 0 and
Mx2= Py . The moments about the y-axis due to the two loads are My1
= P1(L 2 x) and
My2= P2(L x). Equation 3-4 would expand to:
(x) =1
C44C55(12)
( C45My1)d
0
L 2+ (C55Mx2
C45My2)d
0
x
[ ] Eq. 3-5
For the purpose of this research the wing box specimen is loaded as a cantilever beam,
with a single point load along the tip edge. In this load case Mx = P y and My = P(L x)
throughout the entire span (N=1). The corresponding twist equation is:
(x) =1
C44C55(12)
C55(Py) + C45P(L )[ ]d0
xEq. 3-6

27
which upon evaluation becomes a quadratic of x:
(x) =P
C44C55(12)(C55y + C45L)x
1
2C45x
2
Eq. 3-7
Similarly, the deflection in the vertical direction can be found to be a cubic of x:
w(x) =P
C44C55(12)(C45y + C44L)
x 2
2C44
x 3
6
Eq. 3-8
The constants of integration disappear due to the clamped boundary conditions (i.e.,
(0)=0, dw/dx(0)=0, and w(0)=0). With equations 3-7 and 3-8 the CFC model, illustrated in
Figure 3-2, can be used to evaluate a wing box design. The CFC plots vs. span and w vs. span
are shown in figures 3-3 and 3-4 respectively. From these plots a user can determine the wing
twist and vertical bending at any point along the span. The program code can be found in the
Appendix.
Figure 3-2: Closed Form Code Model

28
Figure 3-3: CFC Output – Box Twist vs. Span
Figure 3-4: CFC Output – Bending vs. Span

29
3.1.2 CFC Wing Box Analysis
The Matlab Aeroelasticity program was used to perform an analysis of the wing box final
design. The program input requires material properties, stacking sequence and thickness of each
panel, and the load condition. The material properties and geometry of the final wing box design
are shown in Tables 3-1 and 3-2.
Table 3-1: Ply Properties of IM7 Fiber/VR56-19 Resin
Property Value (psi)
E11 20.1x10⁶
E22 1.47x10⁶
G12 1.53x10⁶
12 0.31
Table 3-2: Panel Geometry
Panel Stacking Sequence Thickness Dimension
Upper Cover [35/90/35/(45/90)2]s 0.086 in. 12 x 31.6 in.
Lower Cover [-35/90/-35/(-45/90)2]s 0.086 in. 12 x 31.6 in.
Trailing Web [±45]s 0.050 in. 2 x 31.6 in.
Leading Web [±45]s 0.050 in. 2 x 31.6 in.
The upper and lower cover panels are identical except that the angle plies in the stacking
sequence are opposite in sign. The CFC model in Figure 3-2 illustrates the box coordinate
system, of which the z-axis always points outward from the box panel. Therefore to represent the
required orientation, the angle plies must be positive on the upper cover and negative on the
lower cover panel.
The specimen is loaded individually at two locations. The first location is at the Bottom
Trailing Edge corner at the wing tip. This point is designated as the BTE corner. Similarly the

30
second location is at the Bottom Leading Edge (BLE) corner on the wing tip as shown in Figure
3-2. Since it is difficult to load the box specimen exactly on the wing tip, the actual load points
are located 0.4 inches inboard from the tip. To adjust for this change the wing box length was
analyzed as 31.6 inches as opposed to the full 32 inches of the box. The analysis was applied to
each load case.
While this analysis using the closed form code is relatively quick and simple, it has a few
drawbacks. The CFC is unable to consider complex parts. A real wing box specimen requires
fixtures to hold the panels together and to secure it to the test wall. These extra parts add stiffness
and imperfections to the structure that are not considered by the closed form analysis. In
addition, the CFC is unable to predict local deformations that could affect the global behavior of
the structure. Therefore this form of analysis is useful only for the early stages of design work
and is not suitable for a refined analysis.
3.2 Finite Element Analysis
The finite element analysis (FEA) was used for two purposes. First, in the specimen
design phase, the FEA was used to aid in achieving the design goals set for the wing box
specimen. Second, the analysis was used to predict the behavior of the actual specimen. The
finite element model was refined to account for measured specimen dimensions and the added
stiffness due to the presence of angle brackets and other fixtures used to assemble the box. Pre
and post processing of the model was performed in PATRAN11
and STAGS12
was used as the
finite element solver.
31
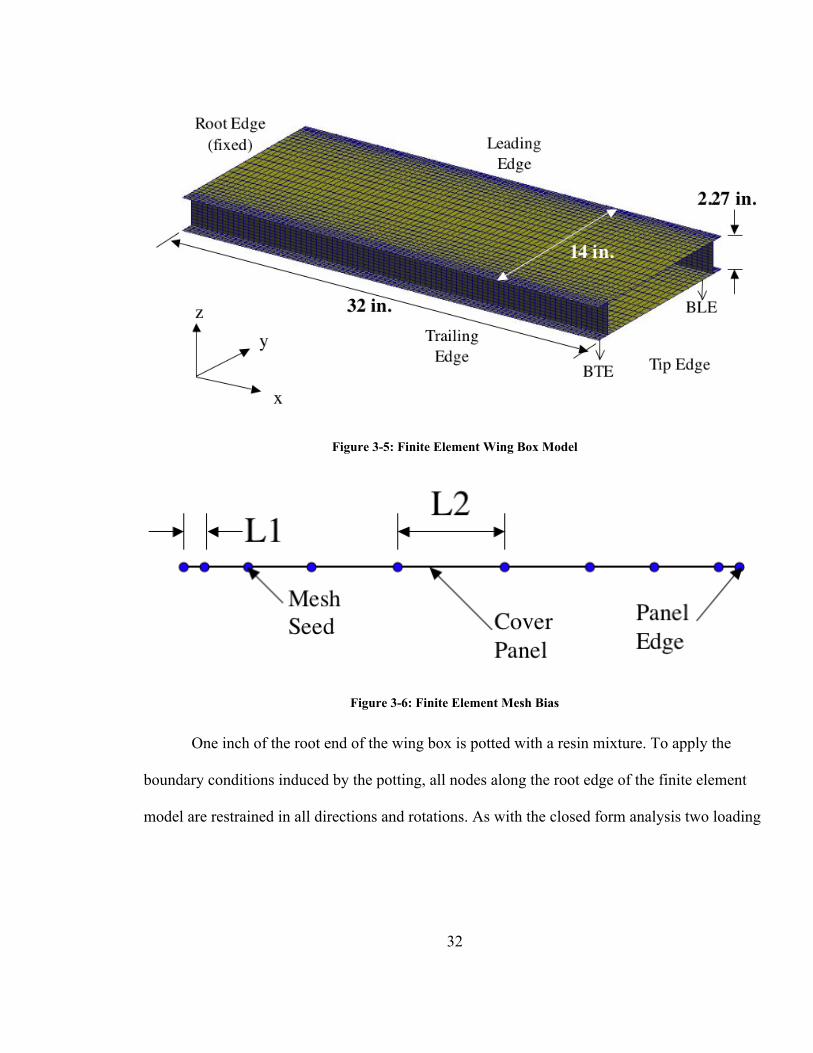
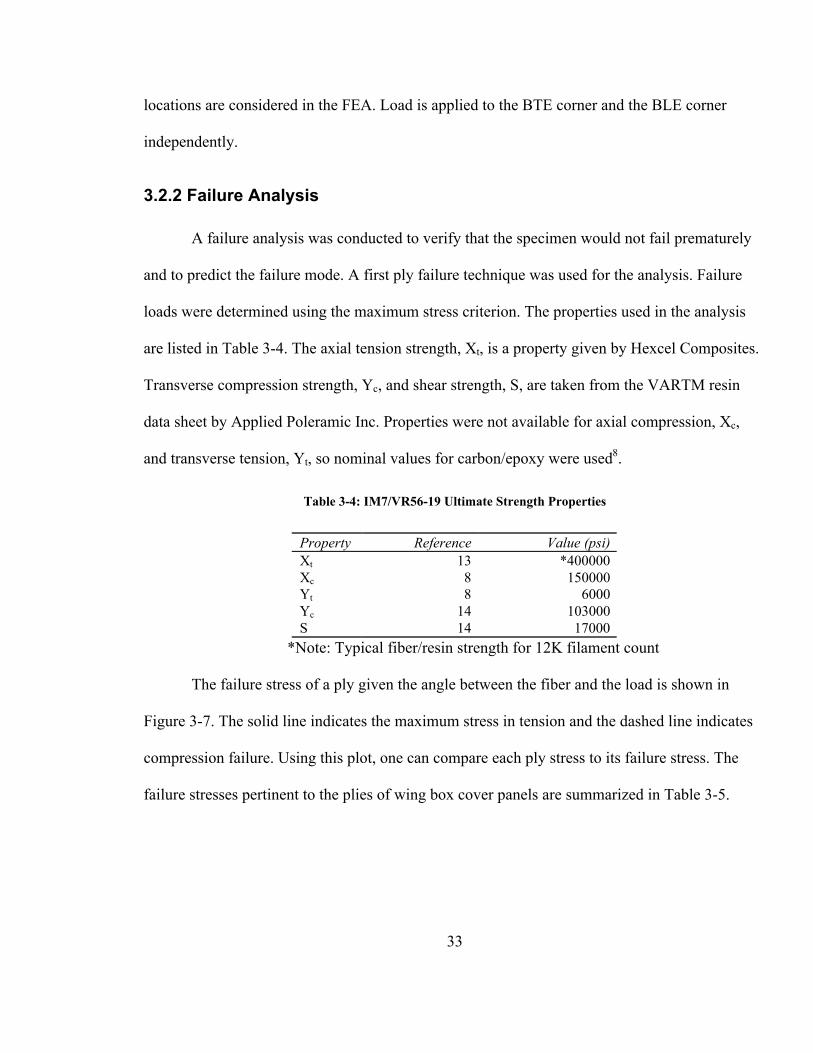
3.2.1 Linear Analysis
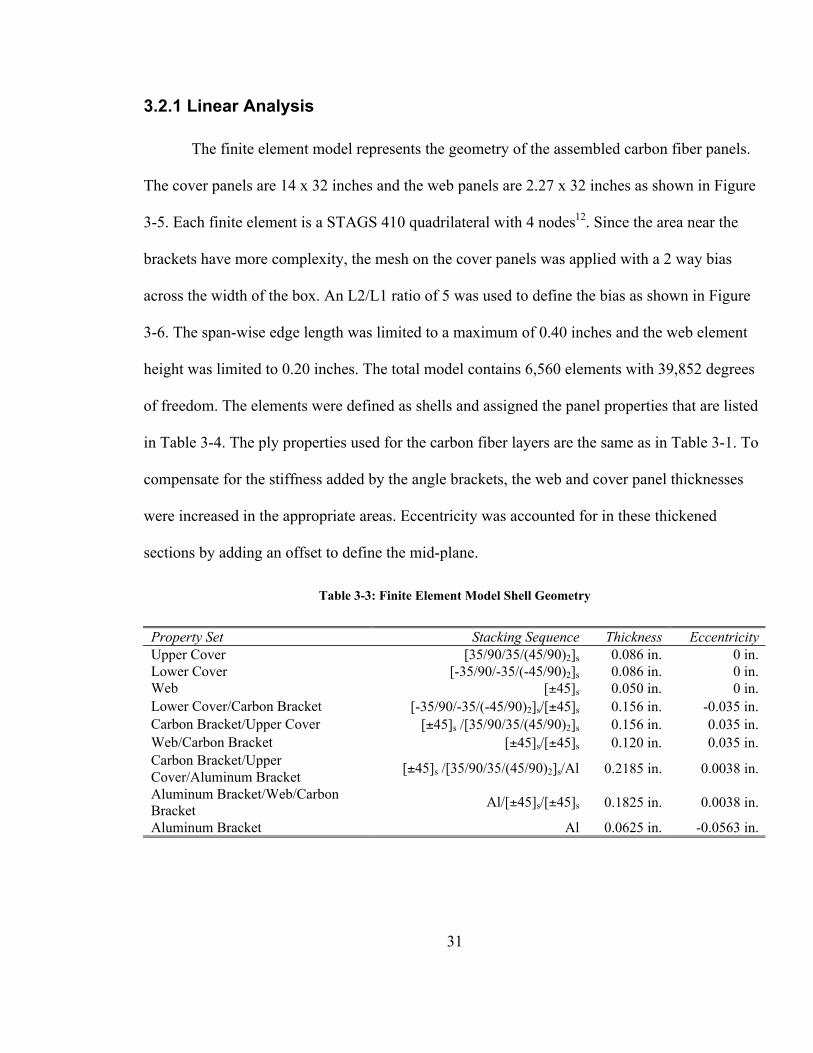
The finite element model represents the geometry of the assembled carbon fiber panels.
The cover panels are 14 x 32 inches and the web panels are 2.27 x 32 inches as shown in Figure
3-5. Each finite element is a STAGS 410 quadrilateral with 4 nodes12
. Since the area near the
brackets have more complexity, the mesh on the cover panels was applied with a 2 way bias
across the width of the box. An L2/L1 ratio of 5 was used to define the bias as shown in Figure
3-6. The span-wise edge length was limited to a maximum of 0.40 inches and the web element
height was limited to 0.20 inches. The total model contains 6,560 elements with 39,852 degrees
of freedom. The elements were defined as shells and assigned the panel properties that are listed
in Table 3-4. The ply properties used for the carbon fiber layers are the same as in Table 3-1. To
compensate for the stiffness added by the angle brackets, the web and cover panel thicknesses
were increased in the appropriate areas. Eccentricity was accounted for in these thickened
sections by adding an offset to define the mid-plane.
Table 3-3: Finite Element Model Shell Geometry
Property Set Stacking Sequence Thickness Eccentricity
Upper Cover [35/90/35/(45/90)2]s 0.086 in. 0 in.
Lower Cover [-35/90/-35/(-45/90)2]s 0.086 in. 0 in.
Web [±45]s 0.050 in. 0 in.
Lower Cover/Carbon Bracket [-35/90/-35/(-45/90)2]s/[±45]s 0.156 in. -0.035 in.
Carbon Bracket/Upper Cover [±45]s /[35/90/35/(45/90)2]s 0.156 in. 0.035 in.
Web/Carbon Bracket [±45]s/[±45]s 0.120 in. 0.035 in.
Carbon Bracket/Upper
Cover/Aluminum Bracket[±45]s /[35/90/35/(45/90)2]s/Al 0.2185 in. 0.0038 in.
Aluminum Bracket/Web/Carbon
BracketAl/[±45]s/[±45]s 0.1825 in. 0.0038 in.
Aluminum Bracket Al 0.0625 in. -0.0563 in.
32
Figure 3-5: Finite Element Wing Box Model
Figure 3-6: Finite Element Mesh Bias
One inch of the root end of the wing box is potted with a resin mixture. To apply the
boundary conditions induced by the potting, all nodes along the root edge of the finite element
model are restrained in all directions and rotations. As with the closed form analysis two loading
33
locations are considered in the FEA. Load is applied to the BTE corner and the BLE corner
independently.
3.2.2 Failure Analysis
A failure analysis was conducted to verify that the specimen would not fail prematurely
and to predict the failure mode. A first ply failure technique was used for the analysis. Failure
loads were determined using the maximum stress criterion. The properties used in the analysis
are listed in Table 3-4. The axial tension strength, Xt, is a property given by Hexcel Composites.
Transverse compression strength, Yc, and shear strength, S, are taken from the VARTM resin
data sheet by Applied Poleramic Inc. Properties were not available for axial compression, Xc,
and transverse tension, Yt, so nominal values for carbon/epoxy were used8.
Table 3-4: IM7/VR56-19 Ultimate Strength Properties
Property Reference Value (psi)
Xt 13 *400000
Xc 8 150000
Yt 8 6000
Yc 14 103000
S 14 17000
*Note: Typical fiber/resin strength for 12K filament count
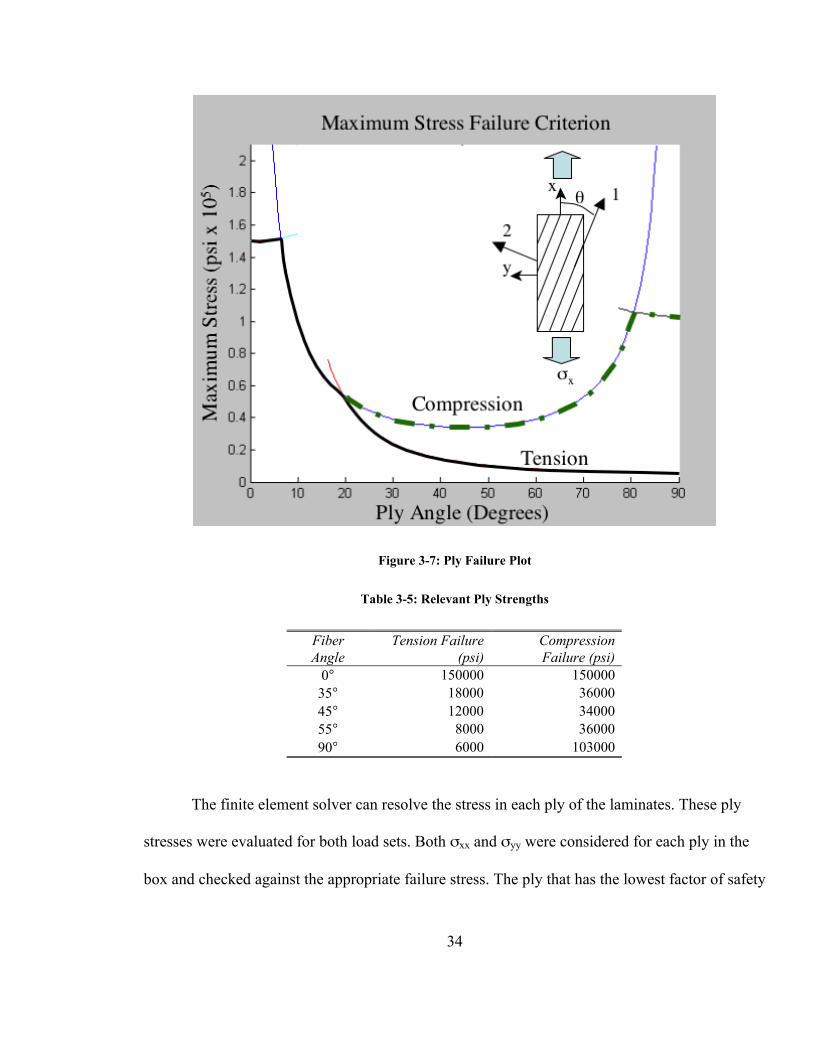
The failure stress of a ply given the angle between the fiber and the load is shown in
Figure 3-7. The solid line indicates the maximum stress in tension and the dashed line indicates
compression failure. Using this plot, one can compare each ply stress to its failure stress. The
failure stresses pertinent to the plies of wing box cover panels are summarized in Table 3-5.
34
Figure 3-7: Ply Failure Plot
Table 3-5: Relevant Ply Strengths
Fiber
Angle
Tension Failure
(psi)
Compression
Failure (psi)
0° 150000 150000
35° 18000 36000
45° 12000 34000
55° 8000 36000
90° 6000 103000
The finite element solver can resolve the stress in each ply of the laminates. These ply
stresses were evaluated for both load sets. Both xx and yy were considered for each ply in the
box and checked against the appropriate failure stress. The ply that has the lowest factor of safety

35
(stress limit to ply stress ratio) will be the first ply to fail. Since the strength of the plies in
compression is much greater than in tension, the lower cover panel is the most critical region of
the box. The lowest factors of safety shown in Table 3-6 occurred during the BTE load in the x-
direction ( xx). In this case the 35° ply #14 of the lower cover panel would be the first to reach
its failure stress. Since the FEA is linear, the failure load can be found simply by multiplying 100
lb by ply fourteen’s factor. Based on the maximum stress criterion ply 14 of the lower cover
panel is predicted to fail at approximately 225 lb to 230 lb, so the wing box specimen should not
fail during test loads.
Table 3-6: Lower Cover Panel Axial Ply Stresses Under BTE Load
Ply
Fiber
Angle Ply Stress (psi) Stress Limit (psi)
Factor of
Safety
1 35 7090 18237 2.57
2 90 1390 6000 4.32
3 35 7240 18237 2.52
4 45 4030 12000 2.98
5 90 1380 6000 4.35
6 45 4170 12000 2.88
7 90 1480 6000 4.05
8 90 1550 6000 3.87
9 45 4370 12000 2.75
10 90 1430 6000 4.20
11 45 4500 12000 2.67
12 35 7880 18237 2.31
13 90 1400 6000 4.29
14 35 8020 18237 2.27
Another possible failure mode is failure of the bond between the brackets and web or
cover panels. FEA results indicated that the trailing edge root had the highest shear stress of
either load case. However insufficient information is available concerning the adhesive
36
properties. While the adhesive failure could not be predicted, it was not expected to occur during
the test loads.
The forces introduced to the specimen corners induce compressive loads into the upper
cover panel. A linear buckling analysis was applied to the finite element model to determine if
buckling would occur in the test load range. STAGS did not find any critical loads between 0 and
250 lb when applied to the BTE or BLE corners, so panel buckling was not expected to occur
prior to box failure.

37
Chapter 4 : Wing Box Test
The small-scale wing box that was designed and analyzed using methods described in
Chapter 3 was fabricated and tested at the NASA Langley Research Center. Facilities operated
by the Mechanics and Durability Branch were used to perform the test. The data obtained from
the experiment is used in Chapter 5 for analysis validation.
4.1 Instrumentation
Twenty-four back-to-back strain gages were used to measure wing box behavior. Two
sets of axial gages were placed along the root of each cover panel, measuring strain in the x-
direction. Strain rosettes measuring strain at 0°, 45°, and 90° were placed near the center of each
cover panel and along the wing tip. The gage layout for the cover panels is shown in Figure 4-1.
Both web panels had mid-span axial gages aligned at 0° and one aligned at 90° to the x-axis
Figure 4-1: Cover Panel Strain Gage Layout
38
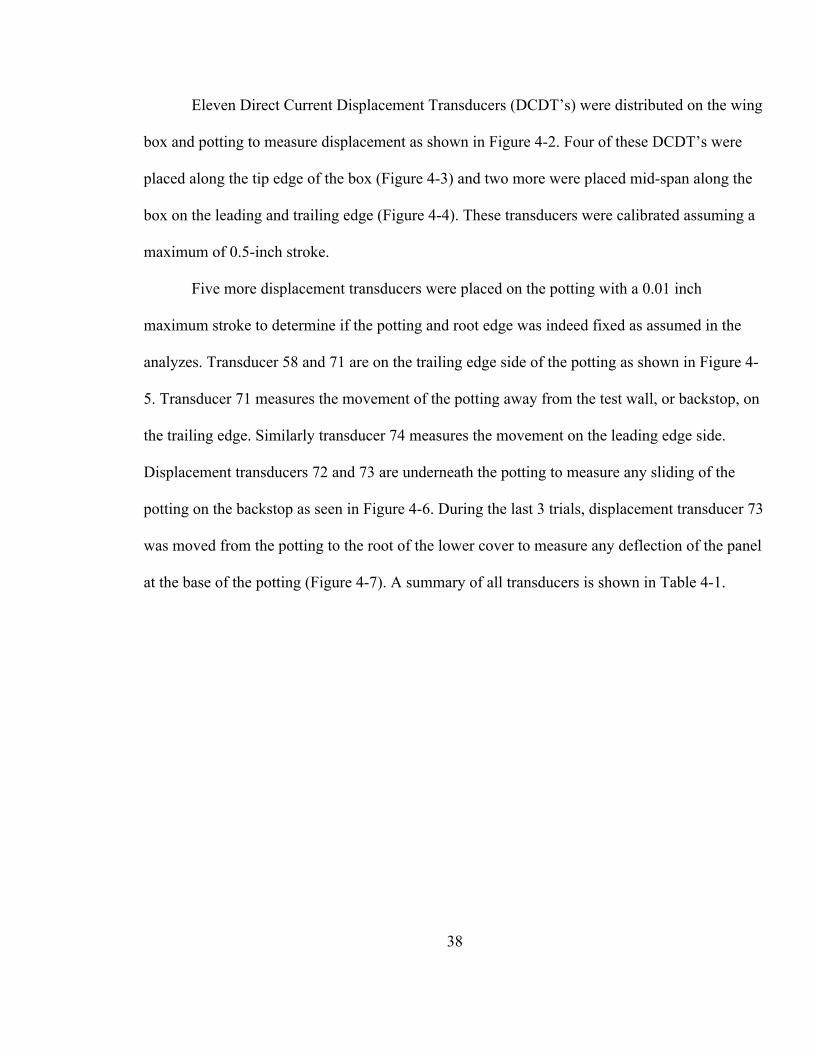
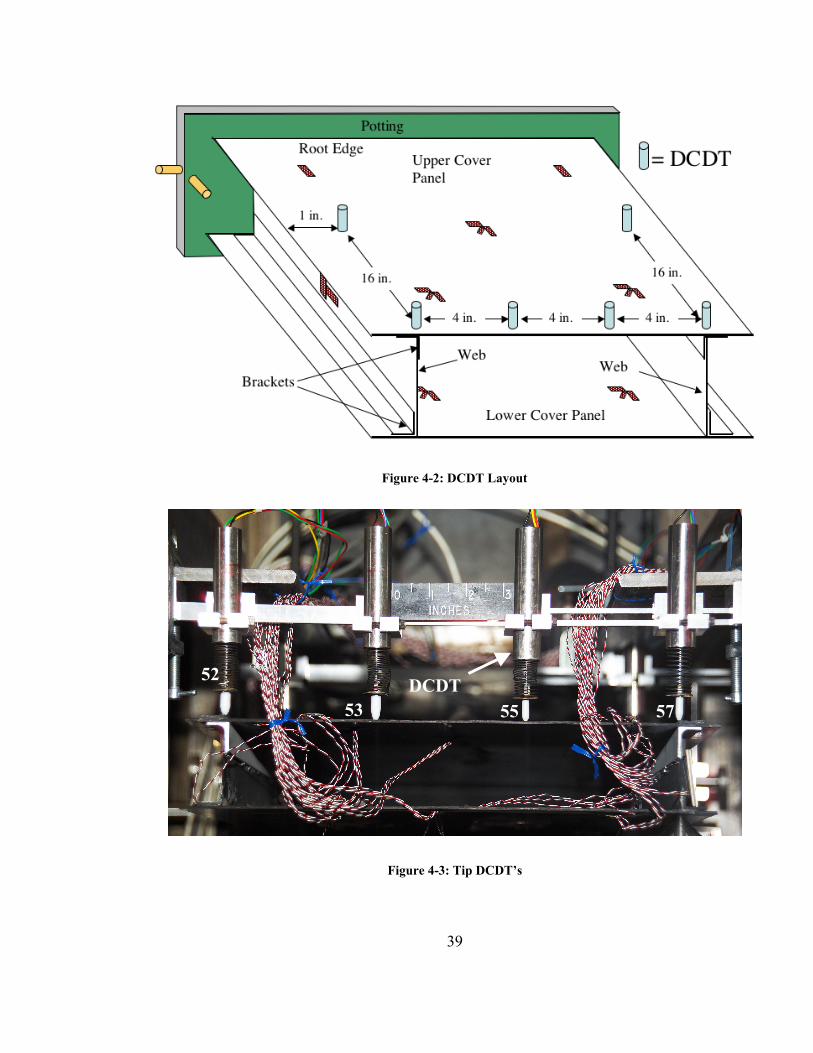
Eleven Direct Current Displacement Transducers (DCDT’s) were distributed on the wing
box and potting to measure displacement as shown in Figure 4-2. Four of these DCDT’s were
placed along the tip edge of the box (Figure 4-3) and two more were placed mid-span along the
box on the leading and trailing edge (Figure 4-4). These transducers were calibrated assuming a
maximum of 0.5-inch stroke.
Five more displacement transducers were placed on the potting with a 0.01 inch
maximum stroke to determine if the potting and root edge was indeed fixed as assumed in the
analyzes. Transducer 58 and 71 are on the trailing edge side of the potting as shown in Figure 4-
5. Transducer 71 measures the movement of the potting away from the test wall, or backstop, on
the trailing edge. Similarly transducer 74 measures the movement on the leading edge side.
Displacement transducers 72 and 73 are underneath the potting to measure any sliding of the
potting on the backstop as seen in Figure 4-6. During the last 3 trials, displacement transducer 73
was moved from the potting to the root of the lower cover to measure any deflection of the panel
at the base of the potting (Figure 4-7). A summary of all transducers is shown in Table 4-1.
39
Figure 4-2: DCDT Layout
Figure 4-3: Tip DCDT’s
DCDT52
53 55 57

40
Figure 4-4: Mid-Span DCDTs
Figure 4-5: Trailing Edge Potting DCDT’s
Mid-Span DCDTs
Wing Box Trailing Edge
Potting
Aluminum
Frame
DCDT 71DCDT 58

41
Figure 4-6: Bottom Potting DCDT’s
Figure 4-7: Panel Root DCDT
DCDT 72 DCDT 73
Lower Wing Box Root
Potting
DCDT 73
Wing Box Root

42
Table 4-1: List of Instrumentation
Transducers
# Type Box Region Location
1-2 Strain: axial Upper Cover Trailing edge, root
3-4 Strain: axial Upper Cover Leading edge, root
7-8 Strain: rosette Upper Cover Center, mid-span
11-12 Strain: rosette Upper Cover Trailing edge, tip
15-16 Strain: rosette Upper Cover Leading edge, tip
17-18 Strain: axial Lower Cover Leading edge, root
19-20 Strain: axial Lower Cover Trailing edge, root
23-24 Strain: rosette Lower Cover Center, mid-span
27-28 Strain: rosette Lower Cover Leading edge, tip
31-32 Strain: rosette Lower Cover Trailing edge, tip
33-34 Strain: axial Web Leading edge, mid-span
35-36 Strain: transverse Web Leading edge, mid-span
37-38 Strain: axial Web Trailing edge, mid-span
39-40 Strain: transverse Web Trailing edge, mid-span
50 DCDT: 0.5 inch Upper Cover Trailing edge, mid-span, Z-Disp.
51 DCDT: 0.5 inch Upper Cover Leading edge, mid-span, Z-Disp.
52 DCDT: 0.5 inch Upper Cover Trailing edge, tip, Z-Disp.
53 DCDT: 0.5 inch Upper Cover Trailing edge + 4 inches, tip, Z-Disp.
55 DCDT: 0.5 inch Upper Cover Trailing edge + 8 inches, tip, Z-Disp.
57 DCDT: 0.5 inch Upper Cover Leading edge, tip, Z-Disp.
58 DCDT: 0.001 inch Potting Trailing edge, Y-Disp.
71 DCDT: 0.001 inch Potting Trailing edge, X-Disp.
72 DCDT: 0.001 inch Potting Bottom, Z-Disp.
73 DCDT: 0.001 inch Potting/Lower Cover Bottom, Z-Disp.
74 DCDT: 0.001 inch Potting Leading edge, X-Disp.
4.2 Test Setup and Procedure
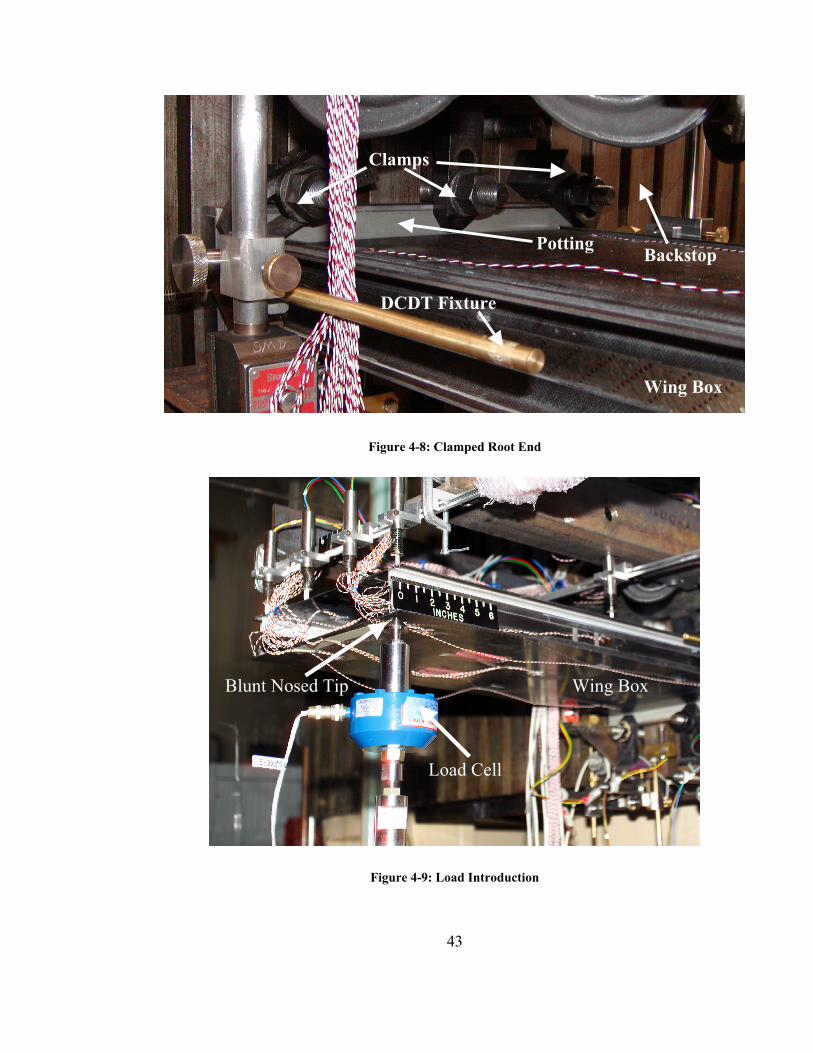
The wing box was secured to a test wall using several clamps as shown in Figure 4-8. A
hydraulic actuator was positioned underneath the tip end of the wing box to apply the load. This
actuator was attached to a steel plate with clamps to allow easy movement between the two load
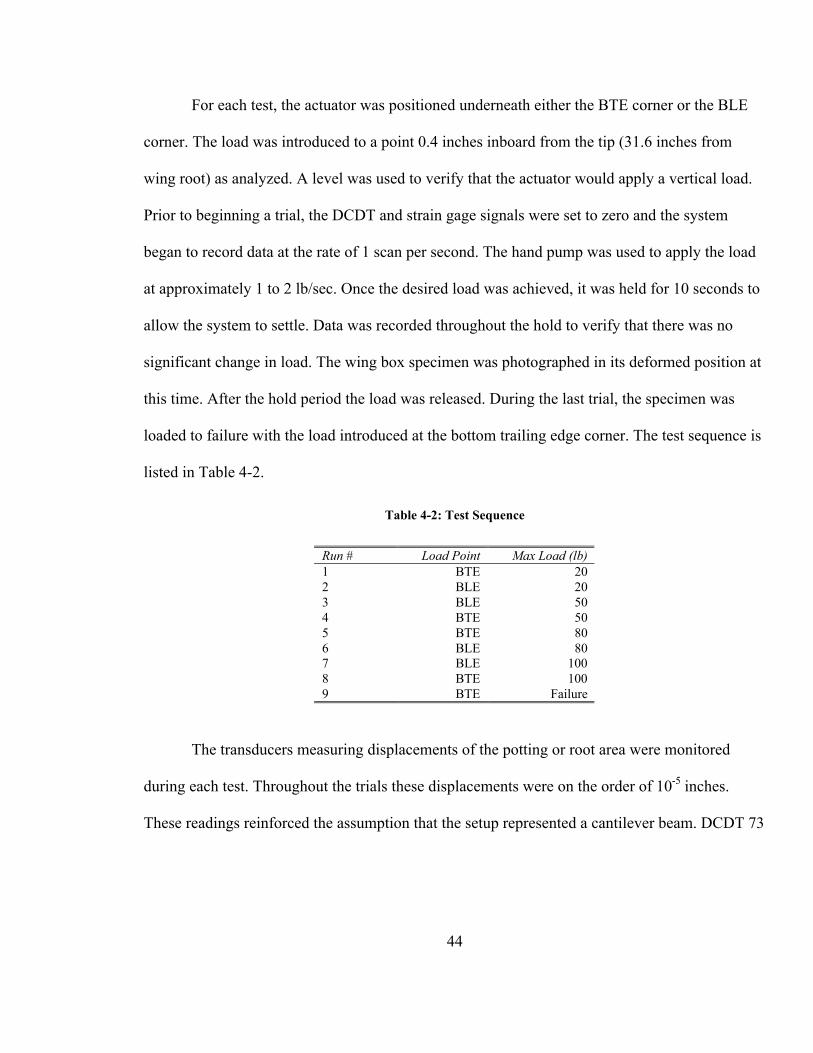
points. The actuator was controlled using a hand pump. Load was measured by a 300-lb capacity
load cell attached to the top of the actuator arm. A rod with a blunt nosed cone was threaded into
the load cell for load introduction as shown in Figure 4-9.
43
Figure 4-8: Clamped Root End
Figure 4-9: Load Introduction
Clamps
Potting
Wing Box
Backstop
Wing Box
Load Cell
Blunt Nosed Tip
DCDT Fixture
44
For each test, the actuator was positioned underneath either the BTE corner or the BLE
corner. The load was introduced to a point 0.4 inches inboard from the tip (31.6 inches from
wing root) as analyzed. A level was used to verify that the actuator would apply a vertical load.
Prior to beginning a trial, the DCDT and strain gage signals were set to zero and the system
began to record data at the rate of 1 scan per second. The hand pump was used to apply the load
at approximately 1 to 2 lb/sec. Once the desired load was achieved, it was held for 10 seconds to
allow the system to settle. Data was recorded throughout the hold to verify that there was no
significant change in load. The wing box specimen was photographed in its deformed position at
this time. After the hold period the load was released. During the last trial, the specimen was
loaded to failure with the load introduced at the bottom trailing edge corner. The test sequence is
listed in Table 4-2.
Table 4-2: Test Sequence
Run # Load Point Max Load (lb)
1 BTE 20
2 BLE 20
3 BLE 50
4 BTE 50
5 BTE 80
6 BLE 80
7 BLE 100
8 BTE 100
9 BTE Failure
The transducers measuring displacements of the potting or root area were monitored
during each test. Throughout the trials these displacements were on the order of 10-5
inches.
These readings reinforced the assumption that the setup represented a cantilever beam. DCDT 73

45
was placed underneath the root of the lower cover panel to quantify any movement within the
potting. The measured deflections at this location were negligible.
46
Chapter 5 : Discussion of Results
This chapter compares the predicted results from the analyses to the measured values
from the experiment. Displacement and strain results from the finite element analysis are directly
compared to the response of the wing box. The twist and bending of the wing box specimen is
calculated for comparison to the closed form code results. Unless otherwise specified, percent
errors are calculated based on the measured value.
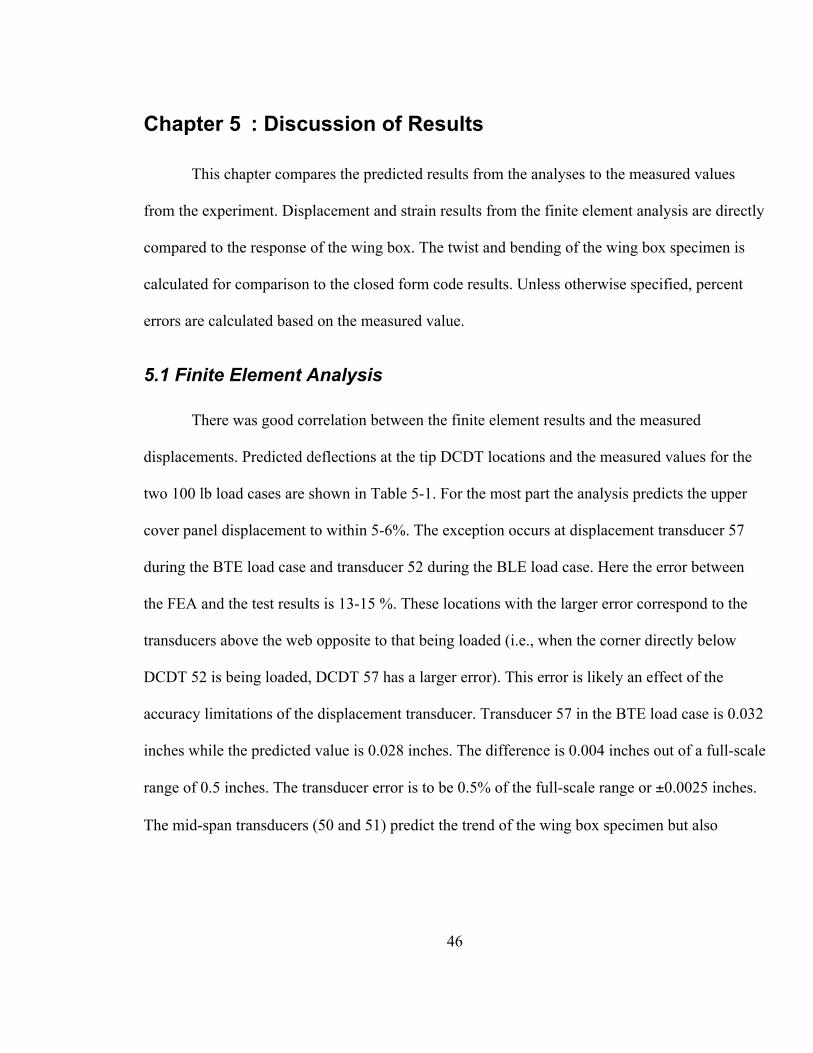
5.1 Finite Element Analysis
There was good correlation between the finite element results and the measured
displacements. Predicted deflections at the tip DCDT locations and the measured values for the
two 100 lb load cases are shown in Table 5-1. For the most part the analysis predicts the upper
cover panel displacement to within 5-6%. The exception occurs at displacement transducer 57
during the BTE load case and transducer 52 during the BLE load case. Here the error between
the FEA and the test results is 13-15 %. These locations with the larger error correspond to the
transducers above the web opposite to that being loaded (i.e., when the corner directly below
DCDT 52 is being loaded, DCDT 57 has a larger error). This error is likely an effect of the
accuracy limitations of the displacement transducer. Transducer 57 in the BTE load case is 0.032
inches while the predicted value is 0.028 inches. The difference is 0.004 inches out of a full-scale
range of 0.5 inches. The transducer error is to be 0.5% of the full-scale range or ±0.0025 inches.
The mid-span transducers (50 and 51) predict the trend of the wing box specimen but also
47
encounter high error due to small displacements. At higher deflections, the finite element
analysis results in a maximum error of 7%.
Table 5-1: Comparison of Tip Displacements
100 lb BTE Load 100 lb BLE Load
Location DCDT
Predicted
Disp. (in.)
Measured
Disp. (in.) Error
Predicted
Disp. (in.)
Measured
Disp. (in.) Error
52 0.219 0.233 6% 0.028 0.033 15%
53 0.183 0.197 7% 0.044 0.043 2%
55 0.085 0.090 6% 0.124 0.124 0%Tip
57 0.028 0.032 13% 0.163 0.171 5%
Note: Error based on measured value
The measured and FEA predicted values for the deflection of the upper cover panel at
100 lb load in BTE and BLE locations are shown in Figures 5-1 and 5-2 respectively. The plots
show that the actual wing box specimen deflected slightly more than predicted by the analysis.
This behavior indicates that the finite element model is slightly stiffer than the actual specimen.
0.000
0.050
0.100
0.150
0.200
0.250
0.000 2.000 4.000 6.000 8.000 10.000 12.000
Chord (inches)
Verti
cal
Dis
pla
cem
en
t (in
ch
es)
Predicted Displacement
Measured Displacement
Figure 5-1: Measured and Predicted Displacements for 100 lb BTE Load

48
0.000
0.050
0.100
0.150
0.200
0.250
0.000 2.000 4.000 6.000 8.000 10.000 12.000
Chord (inches)
Verti
cal
Dis
pla
cem
en
t (in
ch
es)
Predicted Displacement
Measured Displacement
Figure 5-2: Measured and Calculated Displacements for 100 lb BLE Load
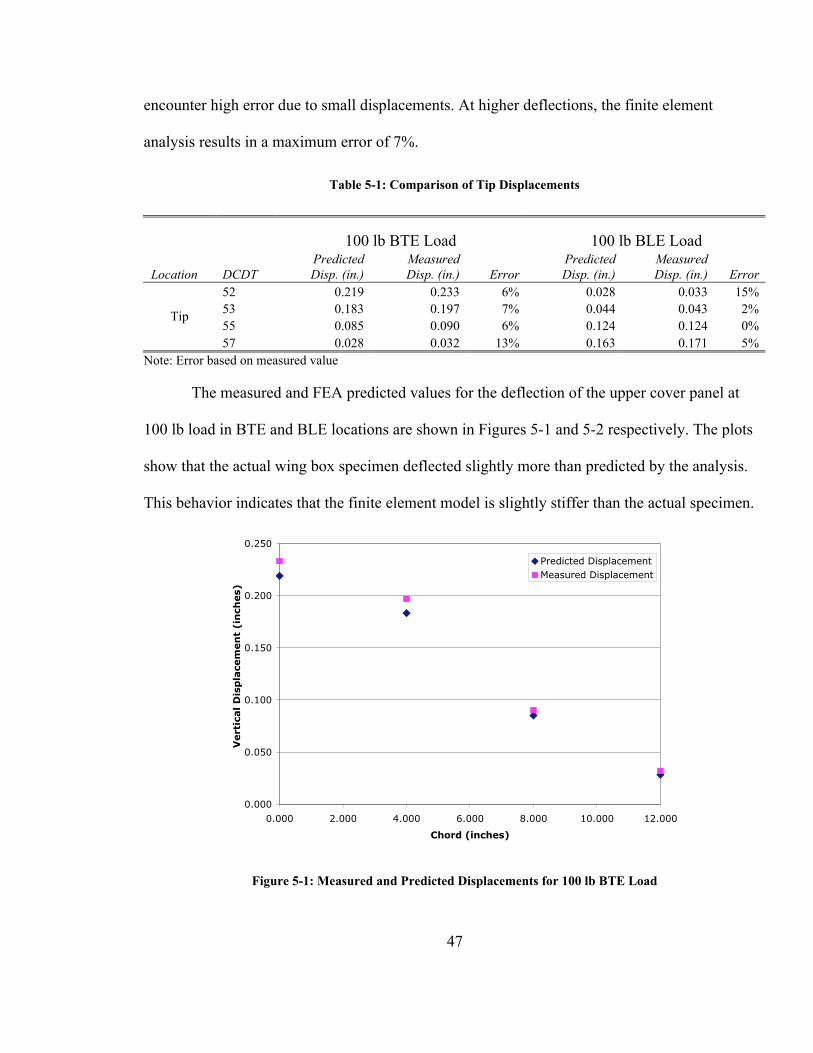
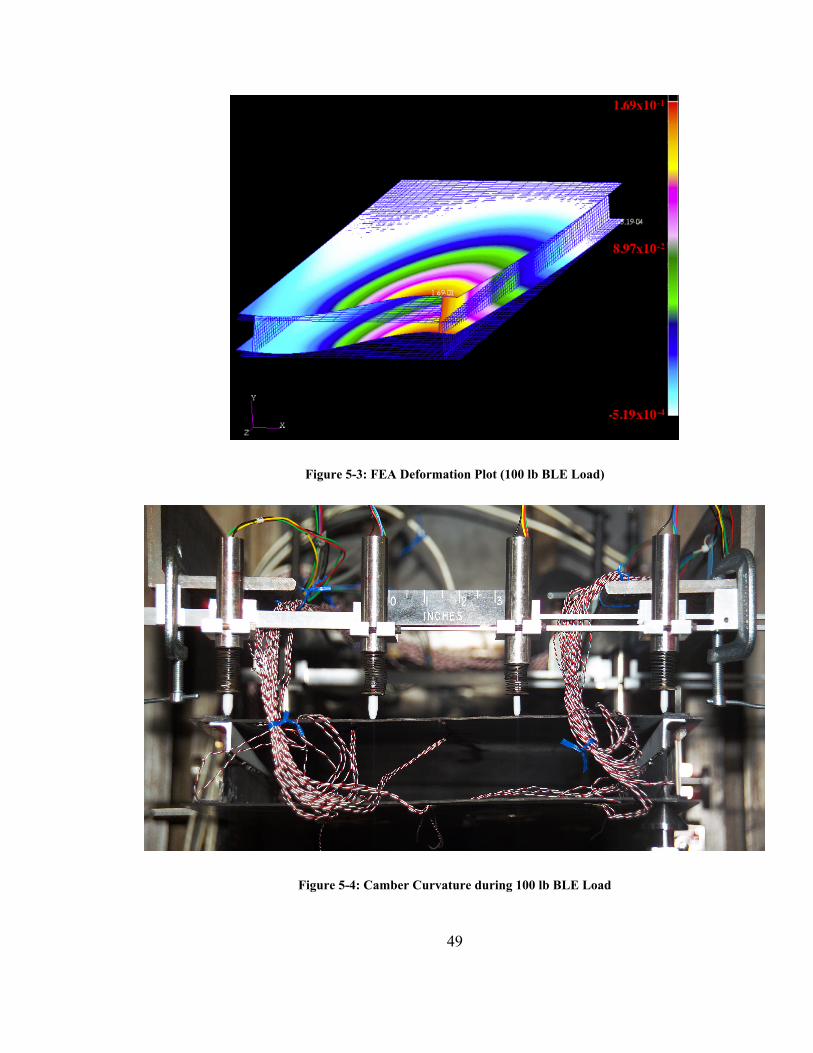
An interesting feature to note is the curve along the tip of the cover panels. A
deformation plot of the wing box with a 100 lb BLE load is shown in Figure 5-3. In this figure
the deformation is magnified by ten. The bending of the cover panels takes the shape of a
flattened S-curve along the tip. Figure 5-4 is a picture of the box specimen under load. If the
upper cover panel is inspected closely, the S-curve can be seen in the specimen. The finite
element model has the capability to predict the camber curvatures of the wing box.
49
Figure 5-3: FEA Deformation Plot (100 lb BLE Load)
Figure 5-4: Camber Curvature during 100 lb BLE Load
50
The predicted axial strains along with the measured strains from the wing box root are
listed in Table 5-2. The error based on the measured value ranges from 1% to 15%. Gages on the
trailing edge side (# 1-2, 17-18) have smaller errors than the gages on the leading edge side (# 3-
4, 19-20).
Table 5-2: Wing Box Root Axial Strains
100 lb BTE Load 100 lb BLE Load
Strain (µ ) Strain (µ )
Gage # Analysis Measured Error Gage # Analysis Measured Error
1 -514 -484 6% 1 -163 -157 4%
2 -465 -448 4% 2 -155 -146 6%
3 -175 -152 15% 3 -411 -371 11%
4 -161 -143 13% 4 -376 -344 9%
17 642 637 1% 17 182 175 4%
18 685 641 7% 18 189 177 7%
19 203 190 7% 19 496 457 9%
Root
Gag
es
20 219 202 8% R
oot
Gag
es20 534 487 10%
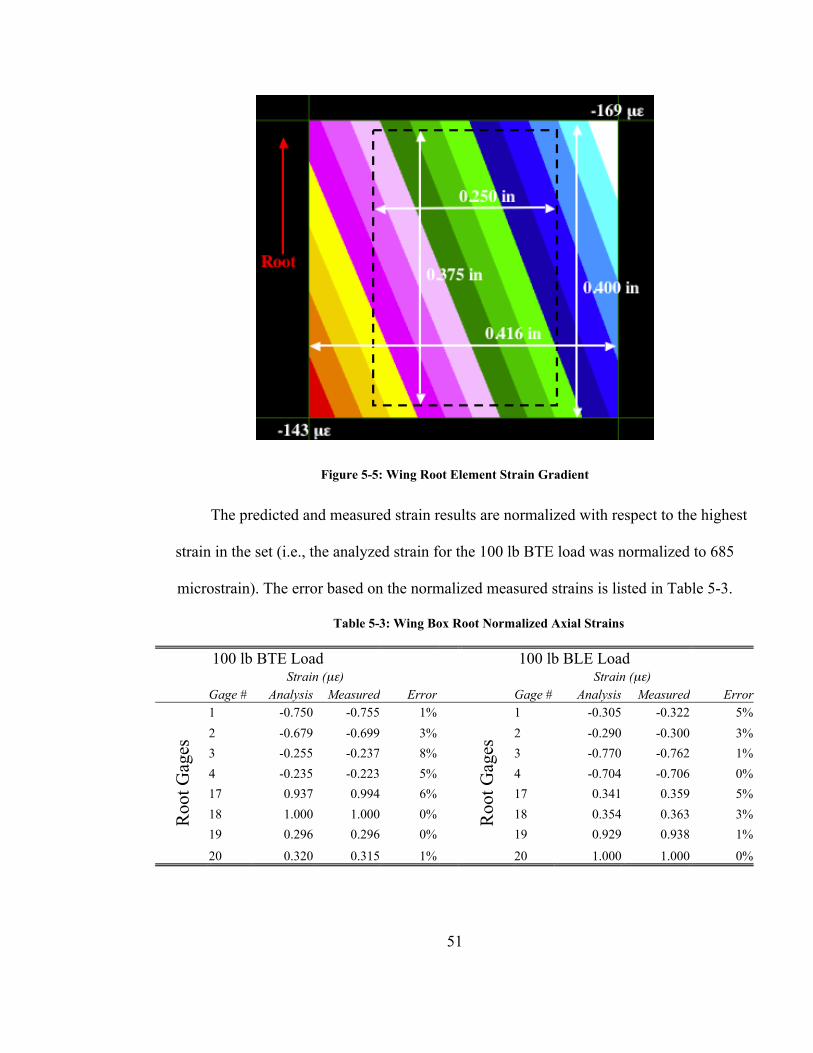
Difficulties occur in the comparison since the strain gradient is steep in this specimen. An
element near the root of the finite element model, shown in Figure 5-5, illustrates the
interpolated strain range over a 0.400-inch by 0.416-inch area. The strain in the element has a 26
µ range, which is 15.3% of the largest value on the element. Any imperfections in the boundary
conditions or panels of the wing box specimen can shift the strain gradient causing a larger error
when compared to the FEA predicted strains. The dashed line in Figure 5-5 indicates the relative
size of the axial strain gages. A direct comparison of strain results and analysis is problematic
since the gages measure an average strain over an area rather than a point.
51
Figure 5-5: Wing Root Element Strain Gradient
The predicted and measured strain results are normalized with respect to the highest
strain in the set (i.e., the analyzed strain for the 100 lb BTE load was normalized to 685
microstrain). The error based on the normalized measured strains is listed in Table 5-3.
Table 5-3: Wing Box Root Normalized Axial Strains
100 lb BTE Load 100 lb BLE Load
Strain (µ ) Strain (µ )
Gage # Analysis Measured Error Gage # Analysis Measured Error
1 -0.750 -0.755 1% 1 -0.305 -0.322 5%
2 -0.679 -0.699 3% 2 -0.290 -0.300 3%
3 -0.255 -0.237 8% 3 -0.770 -0.762 1%
4 -0.235 -0.223 5% 4 -0.704 -0.706 0%
17 0.937 0.994 6% 17 0.341 0.359 5%
18 1.000 1.000 0% 18 0.354 0.363 3%
19 0.296 0.296 0% 19 0.929 0.938 1%
Ro
ot
Gag
es
20 0.320 0.315 1%
Ro
ot
Gag
es
20 1.000 1.000 0%

52
The errors of the predicted normalized values with respect to the measured normalized
values are less than 8%. The FEA is able to predict the strain trends of the wing box specimen. It
is likely that the finite element analysis would perform well in predicting the behavior of a full-
scale tailored structure. The percentage error of the predicted results would be expected to
decrease with a larger specimen and higher loads.
The axial strains measured by the five gages on the outer side of the lower cover panel
and the predicted values when loaded at 100 lb BTE load are plotted in Figure 5-6. The dashed
line indicates the measured values and the solid line indicates the predicted values. In general the
predicted values are higher than the measured values. However the strain trends are predicted
indicating that the finite element model represents the overall box stiffness well.
-50
50
150
250
350
450
550
650
750
30 40 50 60 70 80 90 100 110
Load (lb)
Mic
ro
str
ain
FEA 18
FEA 20
FEA 24a
FEA 28a
FEA 32a
Gage 18
Gage 20
Gage 24a
Gage 28a
Gage 32a
Figure 5-6: Lower Cover Panel Strain Trends

53
The strain measurements can be used to determine the presence of axial panel bending.
Back-to-back upper cover panel strains associated with the 100 lb load cases are listed in Table
5-4. The percent axial bending relative to extension can be determined by the equation
B = t b
t + b
100 were t is the measured strain on the top of the panel, b is the strain on the
bottom, and B is the percent bending10
. Near the root and at the center of the panel the bending is
small. However the percent bending is 20%-60% at the tip gage closest to the load introduction
and over 200% at the tip gage farthest from the load. While the strains are small near the tip,
strain due to bending is more significant strain due to extension.
Table 5-4: Axial Bending in Upper Cover Panel for 100 lb BTE Load
100 lb BTE Load 100 lb BLE Load
Upper Cover
Location
Top Gage
(µ )
Bottom Gage
(µ ) % Bending
Top Gage
(µ )
Bottom Gage
(µ ) % Bending
Trailing Edge Root -484 -448 4% -157 -146 4%
Leading Edge Root -152 -143 3% -371 -344 4%
Center Mid-span -189 -186 1% -118 -136 7%
Trailing Edge Tip -107 -72 20% 10 -23 254%
Leading Edge Tip -12 30 233% -15 -61 61%
5.2 Failure
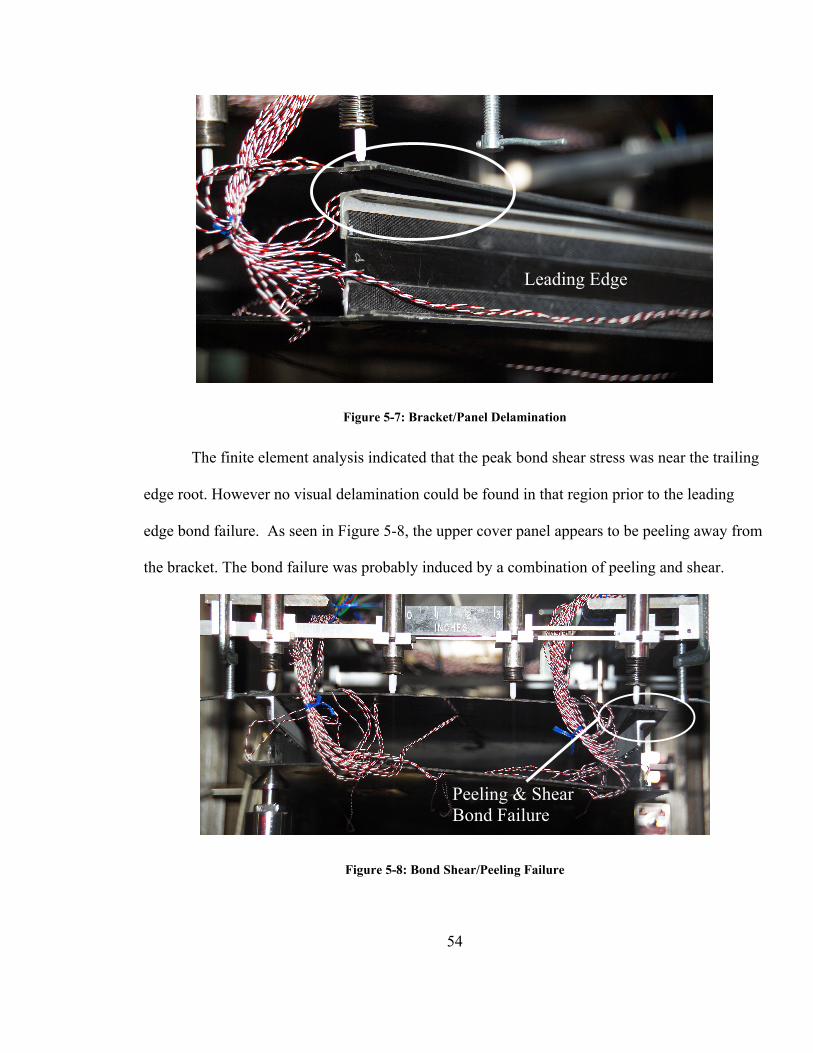
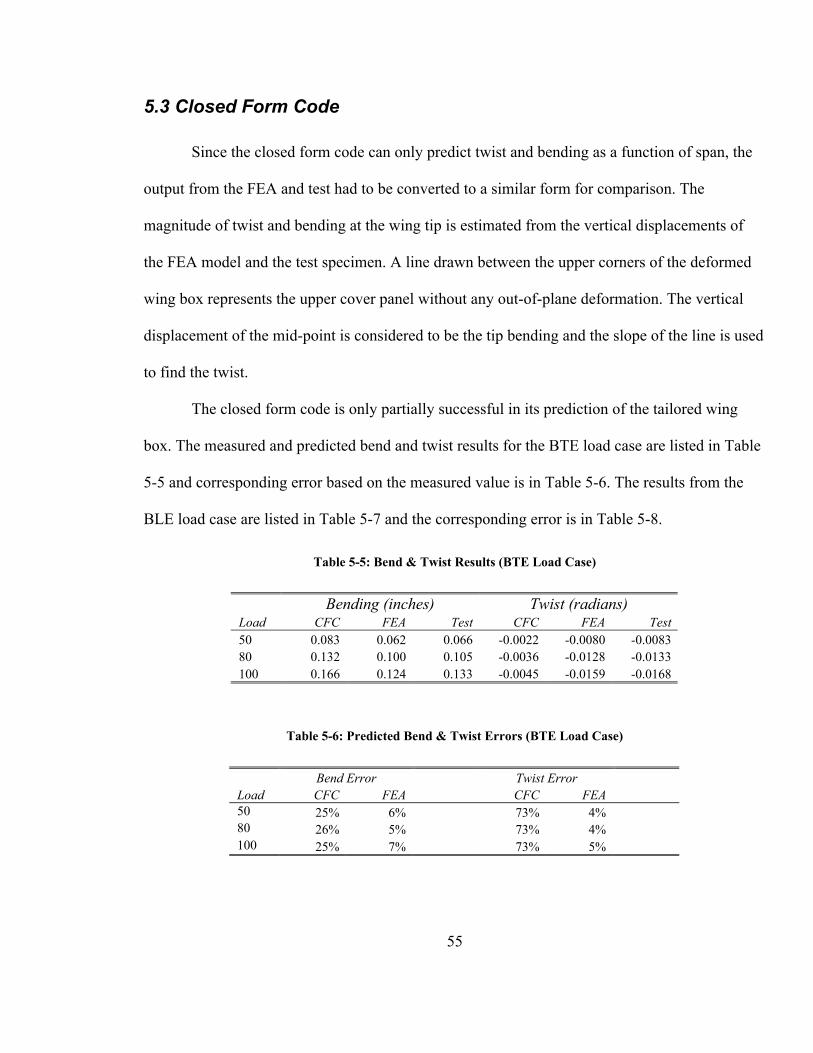
The first noticeable sign of box failure occurred at a load of 231 lb at the BTE corner by a
significant drop in load. This failure took place at the leading edge tip through a delamination
between the aluminum bracket and the upper cover panel as shown in Figure 5-7. After
unloading the specimen, the panels were visually checked for any damage. There is no surface
evidence of any laminate failure on any of the panels.
54
Figure 5-7: Bracket/Panel Delamination
The finite element analysis indicated that the peak bond shear stress was near the trailing
edge root. However no visual delamination could be found in that region prior to the leading
edge bond failure. As seen in Figure 5-8, the upper cover panel appears to be peeling away from
the bracket. The bond failure was probably induced by a combination of peeling and shear.
Figure 5-8: Bond Shear/Peeling Failure
Leading Edge
Peeling & ShearBond Failure
55
5.3 Closed Form Code
Since the closed form code can only predict twist and bending as a function of span, the
output from the FEA and test had to be converted to a similar form for comparison. The
magnitude of twist and bending at the wing tip is estimated from the vertical displacements of
the FEA model and the test specimen. A line drawn between the upper corners of the deformed
wing box represents the upper cover panel without any out-of-plane deformation. The vertical
displacement of the mid-point is considered to be the tip bending and the slope of the line is used
to find the twist.
The closed form code is only partially successful in its prediction of the tailored wing
box. The measured and predicted bend and twist results for the BTE load case are listed in Table
5-5 and corresponding error based on the measured value is in Table 5-6. The results from the
BLE load case are listed in Table 5-7 and the corresponding error is in Table 5-8.
Table 5-5: Bend & Twist Results (BTE Load Case)
Bending (inches) Twist (radians)Load CFC FEA Test CFC FEA Test
50 0.083 0.062 0.066 -0.0022 -0.0080 -0.0083
80 0.132 0.100 0.105 -0.0036 -0.0128 -0.0133
100 0.166 0.124 0.133 -0.0045 -0.0159 -0.0168
Table 5-6: Predicted Bend & Twist Errors (BTE Load Case)
Bend Error Twist Error
Load CFC FEA CFC FEA
50 25% 6% 73% 4%
80 26% 5% 73% 4%
100 25% 7% 73% 5%

56
Table 5-7: Bend & Twist Results (BLE Load Case)
Bending (inches) Twist (radians)Load CFC FEA Test CFC FEA Test
50 0.064 0.048 0.051 -0.0009 0.0056 0.0057
80 0.102 0.077 0.082 -0.0015 0.0089 0.0093
100 0.128 0.100 0.102 -0.0018 0.0113 0.0115
Table 5-8: Predicted Bend & Twist Errors (BLE Load Case)
Bend Error Twist Error
Load CFC FEA CFC FEA
50 25% 7% 116% 2%
80 25% 6% 116% 4%
100 25% 2% 116% 2%
At all loads, the bending predicted by the CFC is 25% greater than the actual bending in
the specimen. The consistency of this error between the load cases indicates that the CFC can
predict the bending trend, however the magnitude is greater. As discussed in Chapter 3, the CFC
model contains only cover panels and web panels. The stiffness of the aluminum and composite
brackets is not included in the closed form analysis. Therefore the CFC model is not expected to
be as stiff as the actual wing box specimen.
The twist prediction is significantly different from the experimental results. The error is
73% when loaded on the BTE corner and 116% when loaded on the BLE corner. In addition to
the difference in magnitude, the CFC predicts twist that is opposite in sign when loaded on the
BLE corner. To determine if the brackets were causing the difference between the predicted and
measure results, a finite element analysis of the wing box was carried out without the brackets.
57
The FEA results still contradict the CFC in wing twist. Therefore the current form of the CFC is
not capable of predicting box twist. The analysis method requires some refinement.
A basic assumption made in Rehfield’s tailored box model is that only the extension-
shear coupling terms are significant during box bending6. In other words the cover panels only
undergo extension and not out-of-plane bending. Based on this assumption, the CFC neglects the
bend-twist coupling terms in the laminate D matrix when calculating the twist and bending of the
wing box. The axial strains listed in Table 5-4 show that near the tip panel bending is significant
when compared to extension. Examination of the transverse gages indicates that the panels are
nearly in pure bending in the chord-wise direction as shown in Table 5-9. These measurements
indicate that the assumption of no significant panel bending is no longer valid at the tip. The
bend-twist coupling terms in the laminate D matrix may need to be considered in the
calculations.
Table 5-9: Transverse Back-to-Back Strains
100 lb BTE Load 100 lb BLE Load
Upper Cover Location Top Gage (µ ) Bottom Gage (µ ) Top Gage (µ ) Bottom Gage (µ )
Center Mid-span -22 53 23 15
Trailing Edge Tip 227 -233 -232 244
Leading Edge Tip -257 276 285 -262
The transverse bending strains are caused by local bending in the cover panels. With
these local deformations the wing box does not maintain a constant cross-section throughout the
span, which is another assumption made in the derivation of the CFC. The global box stiffnesses
(C44, C45, and C55) are no longer constant and the bending and twist calculations are affected.

58
The chord-wise bending of the cover panels may partly be a product of the manner in
which the load is introduced into the test article. If this is the case, it might be possible to
redesign the test such that it better represents the CFC model. However the loading conditions of
a real aircraft wing must be considered when evaluating the inadequacies of the CFC model.

59
Chapter 6 : Concluding Remarks
A 32 in. x 12 in. x 2.27 in. wing box specimen was designed and fabricated to
demonstrate elastic tailoring. The wing box consists of two tailored cover panels with 35° and
45° angle plies and two balanced/symmetric web panels. The specimen was loaded as a
cantilever beam with two individual tip corner loads to represent a wing structure under span-
wise bending and chord-wise twisting. The test load range was 0 to 100 lbs. Displacement and
strain data were gathered to characterize the response.
The wing box specimen was analyzed using two separate methods. First a Closed Form
Code (CFC) based on a single cell box theory was derived to predict twist and bending of the
wing box. Second a Finite Element Analysis (FEA) was used to predict the displacement and
strain response of the box specimen. The measured results were compared with the predicted
results for analysis validation.
6.1 Conclusions
The finite element analysis adequately predicted both strains and displacements. Trends
in box behavior correlated well with the finite element solution. The magnitude of the error in
the displacement prediction is generally within 7%. Predictions of average bending and twist are
within 4-7%. The results indicate that the finite element analysis would accurately predict the
behavior of a full-scale tailored structure. Prediction error should decrease in a larger structure
due to reduction of the influence of small inaccuracies in measurements and imperfections.

60
The CFC model was only partially validated. The magnitude of bending is consistently
25% greater than the measured values from the wing box specimen. This error can partly be
attributed to the presence of stiffening structures such as brackets in the specimen that are not
included in the CFC model. While further development and testing is required, the box bending
prediction of the closed form analysis may be applied successfully to a larger wing box. The
CFC proved to be unable to accurately predict the twist of the test specimen. When developing
the governing equations for the tailored box model, an assumption is made that bending in the
cover panels is insignificant and that extension-shear coupling is the dominant mechanism.
Measured strains taken from the test specimen indicate that bending in the cover panels is a
significant factor near the wing tips. The cover panels undergo both span-wise and chord-wise
bending. This panel bending causes bend-twist coupling within the cover panels, which
contradicts the assumptions made in the CFC derivation. Therefore the CFC twist model is not
suitable for this test specimen and needs further development before it can be used as a design
tool.
6.2 Recommendations for Future Work
While the finite element analysis was able to accurately predict the displacement and
strain trends of the wing box specimen, the errors in some areas are high (i.e., >10%). These
errors generally occur in areas of the box with small displacements or strains and could be
attributable to measurement sensitivities. A next step would be to apply these analysis techniques
to a larger or full-scale structure. A larger model would produce smaller percentage errors to due
to measurement inaccuracies and imperfections in the wing box.

61
It was apparent from the response of the wing box specimen that tailored structures can
undergo camber deformations. Previous analytical research has been performed regarding chord-
wise tailoring, however the analysis method has not been compared to the response of a test
specimen. Future wing box specimens can be designed to be chord-wise deformable to validate
that aspect of aeroelastic tailoring.
The adhesive layer between the brackets and the panels failed due to a combination of
shear and peeling. A second specimen may benefit from the addition of fixtures to prevent
peeling forces on the adhesive.
The CFC requires further development and revisions before it can be validated. However
when the code is ready, it has the potential to be much more flexible in terms of geometry of the
model. The code can be expanded to allow for a wing taper (i.e., variable cross-section), sweep,
stiffeners, and other features. Allowing multiple material properties and load cases would also be
necessary.
The ultimate goal in aeronautical engineering is always to achieve the desired
performance at the minimum weight. It would be useful to put a validated CFC in the form of a
constrained optimization program. This could potentially allow an engineer to specify bending,
twist, and camber requirements and search for a minimum weight solution in the range of
feasible designs.

62
References
1. Patil, M.J., “Aeroelastic tailoring of composite box beams,” AIAA Meeting Papers on Disc
[CD-ROM], Reno, NV, 1997.
2. Sherrer, M.H., Hertz, T.J., and Shirk, M.H., “A Wind Tunnel Demonstration of the Principle
of Aeroelastic Tailoring Applied to Forward Swept Wings,” Journal of Aircraft, 1981 pp.
976-983.
3. Roger, W.A., Braymen, W.W., Shirk, M.H., “Design, Analyses, and Model Tests of an
Aeroelastically Tailored Lifting Sufrace,” AIAA Aircraft Systems and Technology
Conference, Dayton, OH, August 11-13, 1981, AIAA-81-1673.
4. Valisetty, R.R. and Rehfield, L.W., “Simple Theoretical Models for Composite Rotor
Blades,” Georgia Institute of Technology, Atlanta, GA, 1984.
5. Hodges, R.V., Nixon, M.W., and Rehfield, L.W., “Comparison of Composite Rotor Blade
Models: A Coupled-Beam Analysis and an MSC/NASTRAN Finite-Element Model,”
NASA Technical Memorandum 89024, March 1987
63
6. Rehfield, Lawrence W. “A Refined Simple Model for Tailoring Box Beams with
Composites,” 42nd
AIAA/ASME/ASCE/AHS/ASC Structures, Structural Dynamics, and
Materials Conference, Seattle, WA, April 16-19, 2001, AIAA 2000-1333, published on
CD-ROM, AIAA, Reston, VA, 2001.
7. Cheung, R. H.,“Some Basic Strategies for Aeroelastic Tailoring of Wings with Bend-Twist
Coupling,” MS Thesis, University of California, Davis, 2002.
8. Jones, R.M., Mechanics of Composite Materials, 2nd
ed., Taylor & Francis, Inc., Philadelphia,
1999, Chaps. 2, 4.
9. Grimsley, B. W., Song, X., Hubert, P., Cano, R. J., Loos, A. C., and Jensen, Modeling of the
Vacuum Assisted Resin Transfer Molding Process: Permeability and Compaction
Characterization, ASC Conference, Gainesville, FL, October 2003.
10. “Standard Test Method for Tensile Properties of Polymer Matrix Composite Materials,”
ASTM D 3039/D 3039M – 00, West Conshohocken, PA, 2000.
11. Patran, Ver. 2003, MSC. Software Corporation, Santa Ana, CA, 2003.
12. Ranking, C.C, Brogan, F. A., and Loden, W.A, “STAS User Manual,” Version 4.0,
Lockheed Martin Missiles & Space Co., Inc, Palo Alto, CA, 2001.
64
13. Magnamite IM7 (5000) Product Data Sheet, Hexcel Corporation, March 2000.
14. VR56-19 Aircraft Structural VARTM Resin Data Sheet, Applied Poleramic Inc., Banicia,
CA, 2000.
15. Hysol EA 934NA Data Sheet, Loctite Aerospace, Bay Point, CA, 2000.

65
Appendix: Closed Form Code
The script listed here is code for the closed form analysis. This code is written for Matlab
v6. The values in the input section can be modified to represent a wing box specimen with
tailored cover panels (up to 2 angle plies) and web panels.
Main Program
%===================================================================
% COMPOSITE WING BOX ANALAYSIS TOOL
% Author: Dulnath Wijayratne
%
% Description: The purpose of this program is to provide an analysis tool for the early design
%stages aeroelastically tailored wings. Specifcally, this program outputs the twist and bending
%as a function of span for a structural composite wing box given geometric, material, and
%loading parameters.
%
% Wing Diagram
%
% ^ y
% |
% |
% | Leading Edge
% |____________________________________________________________
% | | TIP
% | |
% ROOT ----------------> x TOP VIEW OF WING BOX |
% | |
% |____________________________________________________________|
%
% Trailing Edge
%
%
% Notes: -Boundary Conditions assume wing root is fixed.
% -This program limits load to tip edge.
% -Maximum of 2 angle plies
%
%===================================================================

66
clear
clc
%############################################################################
% USER INPUT!
%###########################################################################
%Geometric Data (inches)
%***********************
C=12; %Structural box chord (width)
H=2.27; %Box Height
L=31.6; %Box Length (span)
%Material Data
%*************
%Material Name: IM7 Fiber in VR56-19 VARTM Resin
E11=20100000;
E22=1470000;
G12=640000;
v12=.31;
%Top Cover Panel
u_thick=.086; %Panel thickness (inches)
u_ply=14; %# of plies
u_theta1=35; %Specify Angle Ply 1
u_theta2=45; %Specify Angle Ply 2
u_sequence=[35;90;35;45;90;45;90;90;45;90;45;35;90;35]; %stacking sequence
%Lower Cover Panel
l_thick=.086; %Panel thickness (inches)
l_ply=14; %# of plies
l_theta1=-35; %Specify Angle Ply 1
l_theta2=-45; %Specify Angle Ply 2
l_sequence=[-35;90;-35;-45;90;-45;90;90;-45;90;-45;-35;90;-35]; %stacking sequence
%Front (leading edge) web panel
f_thick=.05; %Panel thickness (inches)
f_ply=4; %# of plies

67
f_theta1=45; %Specify Angle Ply 1
f_theta2=-45; %Specify Angle Ply 2
f_sequence=[45;-45;-45;45]; %stacking sequence
%Rear (trailing edge) web panel
r_thick=.05; %Panel thickness (inches)
r_ply=4; %# of plies
r_theta1=45; %Specify Angle Ply 1
r_theta2=-45; %Specify Angle Ply 2
r_sequence=[45;-45;-45;45]; %stacking sequence
%Load Data
%**********
P=100; %Load (lb)
y=-6; %Offset from x-axis (inches) Note: Load must be on tip edge
%Program Data
%***********
e=100; %Number points generated over the span
%###########################################################################
%===================================================================
%Calculations
%Ply thicknesses
u_h=u_thick/u_ply;
l_h=l_thick/l_ply;
f_h=f_thick/f_ply;
r_h=r_thick/r_ply;
%Reduced Stiffness Matrix
Q0 = Qmatrix(E11,E22,G12,v12);
%Transformed Stiffness Matrices
Q90 = QTransform(Q0,90);
u_Qtheta1 = QTransform(Q0,u_theta1);
u_Qtheta2 = QTransform(Q0,u_theta2);

68
l_Qtheta1 = QTransform(Q0,l_theta1);
l_Qtheta2 = QTransform(Q0,l_theta2);
f_Qtheta1 = QTransform(Q0,f_theta1);
f_Qtheta2 = QTransform(Q0,f_theta2);
r_Qtheta1 = QTransform(Q0,r_theta1);
r_Qtheta2 = QTransform(Q0,r_theta2);
% A,B, and D Matrices
[Au] = abd(u_sequence,u_h,u_theta1,u_theta2,Q0,u_Qtheta1,u_Qtheta2,Q90);
[Al] = abd(l_sequence,l_h,l_theta1,l_theta2,Q0,l_Qtheta1,l_Qtheta2,Q90);
[Af] = abd(f_sequence,f_h,f_theta1,f_theta2,Q0,f_Qtheta1,f_Qtheta2,Q90);
[Ar] = abd(r_sequence,r_h,f_theta1,f_theta2,Q0,r_Qtheta1,r_Qtheta2,Q90);
%Wall Plane Stress Stiffnesses
K11u = Au(1,1)-(Au(1,2))^2/Au(2,2); %Upper Extensional
K12u = Au(1,3)-(Au(1,2)*Au(2,3))/Au(2,2); %Upper Coupling
K22u = Au(3,3)-(Au(2,3))^2/Au(2,2); %Upper Shear
K11l = Al(1,1)-(Al(1,2))^2/Al(2,2); %Lower Extensional
K12l = Al(1,3)-(Al(1,2)*Al(2,3))/Al(2,2); %Lower Coupling
K22l = Al(3,3)-(Al(2,3))^2/Al(2,2); %Lower Shear
K11f = Af(1,1)-(Af(1,2))^2/Af(2,2); %Front Extensional
K12f = Af(1,3)-(Af(1,2)*Af(2,3))/Af(2,2); %Front Coupling
K22f = Af(3,3)-(Af(2,3))^2/Af(2,2); %Front Shear
K11r = Ar(1,1)-(Ar(1,2))^2/Ar(2,2); %Right Extensional
K12r = Ar(1,3)-(Ar(1,2)*Ar(2,3))/Ar(2,2); %Right Coupling
K22r = Ar(3,3)-(Ar(2,3))^2/Ar(2,2); %Right Shear
%Global "Box" Stiffnesses
C44 = ((C*H)^2/(C+H)^2) * ((K22u+K22l)*C + (K22r + K22f)*H);
C45 = ((C*H)^2/(2*(C+H))) * (K12l-K12u);
C55 = ((C*H^2)/4) * (K11u+K11l);
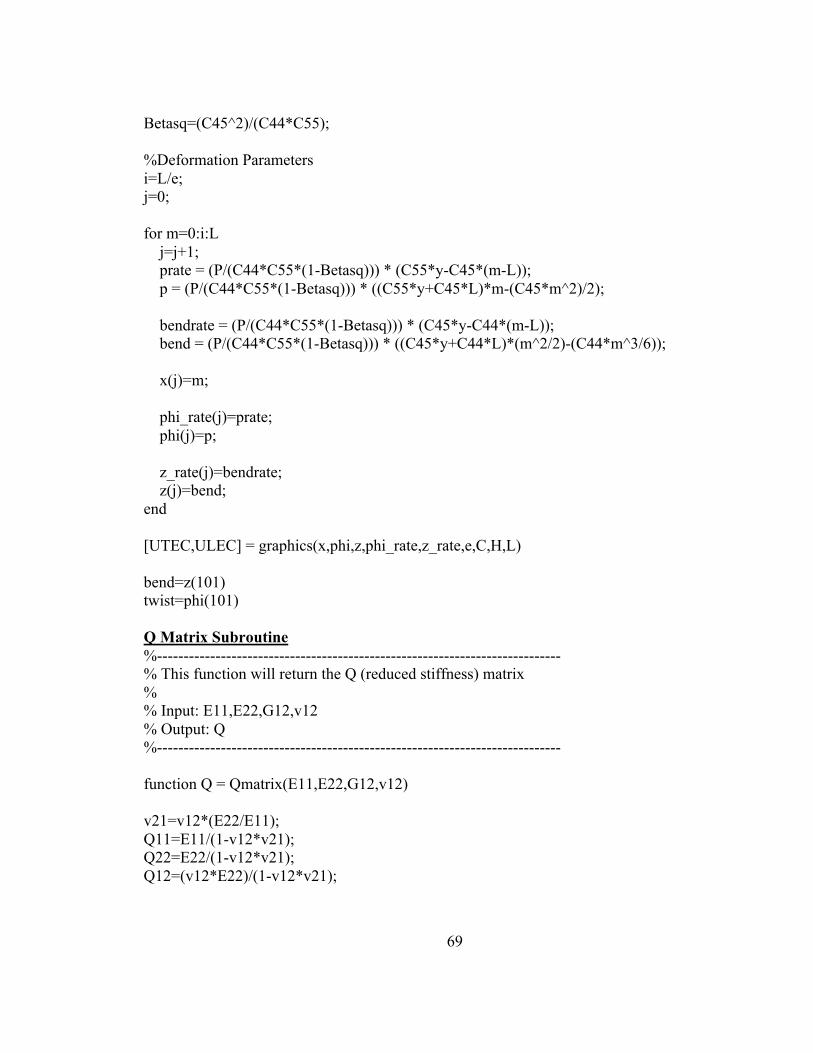
69
Betasq=(C45^2)/(C44*C55);
%Deformation Parameters
i=L/e;
j=0;
for m=0:i:L
j=j+1;
prate = (P/(C44*C55*(1-Betasq))) * (C55*y-C45*(m-L));
p = (P/(C44*C55*(1-Betasq))) * ((C55*y+C45*L)*m-(C45*m^2)/2);
bendrate = (P/(C44*C55*(1-Betasq))) * (C45*y-C44*(m-L));
bend = (P/(C44*C55*(1-Betasq))) * ((C45*y+C44*L)*(m^2/2)-(C44*m^3/6));
x(j)=m;
phi_rate(j)=prate;
phi(j)=p;
z_rate(j)=bendrate;
z(j)=bend;
end
[UTEC,ULEC] = graphics(x,phi,z,phi_rate,z_rate,e,C,H,L)
bend=z(101)
twist=phi(101)
Q Matrix Subroutine
%----------------------------------------------------------------------------
% This function will return the Q (reduced stiffness) matrix
%
% Input: E11,E22,G12,v12
% Output: Q
%----------------------------------------------------------------------------
function Q = Qmatrix(E11,E22,G12,v12)
v21=v12*(E22/E11);
Q11=E11/(1-v12*v21);
Q22=E22/(1-v12*v21);
Q12=(v12*E22)/(1-v12*v21);
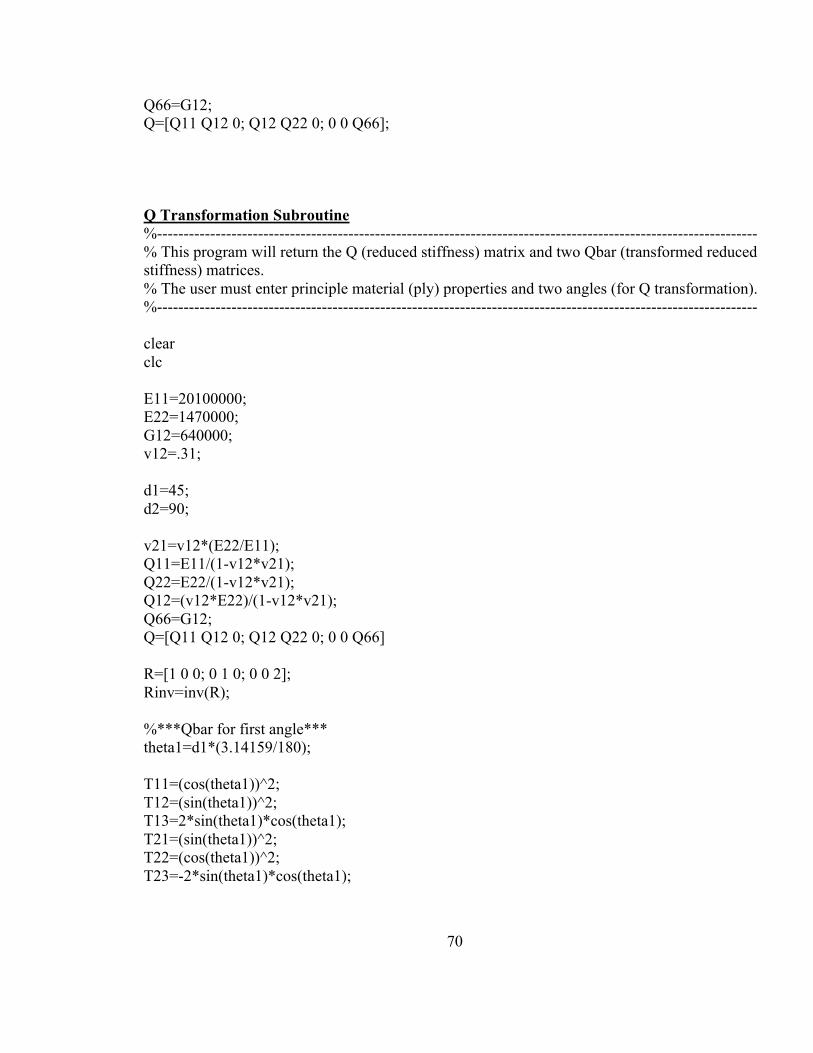
70
Q66=G12;
Q=[Q11 Q12 0; Q12 Q22 0; 0 0 Q66];
Q Transformation Subroutine
%-----------------------------------------------------------------------------------------------------------------
% This program will return the Q (reduced stiffness) matrix and two Qbar (transformed reduced
stiffness) matrices.
% The user must enter principle material (ply) properties and two angles (for Q transformation).
%-----------------------------------------------------------------------------------------------------------------
clear
clc
E11=20100000;
E22=1470000;
G12=640000;
v12=.31;
d1=45;
d2=90;
v21=v12*(E22/E11);
Q11=E11/(1-v12*v21);
Q22=E22/(1-v12*v21);
Q12=(v12*E22)/(1-v12*v21);
Q66=G12;
Q=[Q11 Q12 0; Q12 Q22 0; 0 0 Q66]
R=[1 0 0; 0 1 0; 0 0 2];
Rinv=inv(R);
%***Qbar for first angle***
theta1=d1*(3.14159/180);
T11=(cos(theta1))^2;
T12=(sin(theta1))^2;
T13=2*sin(theta1)*cos(theta1);
T21=(sin(theta1))^2;
T22=(cos(theta1))^2;
T23=-2*sin(theta1)*cos(theta1);
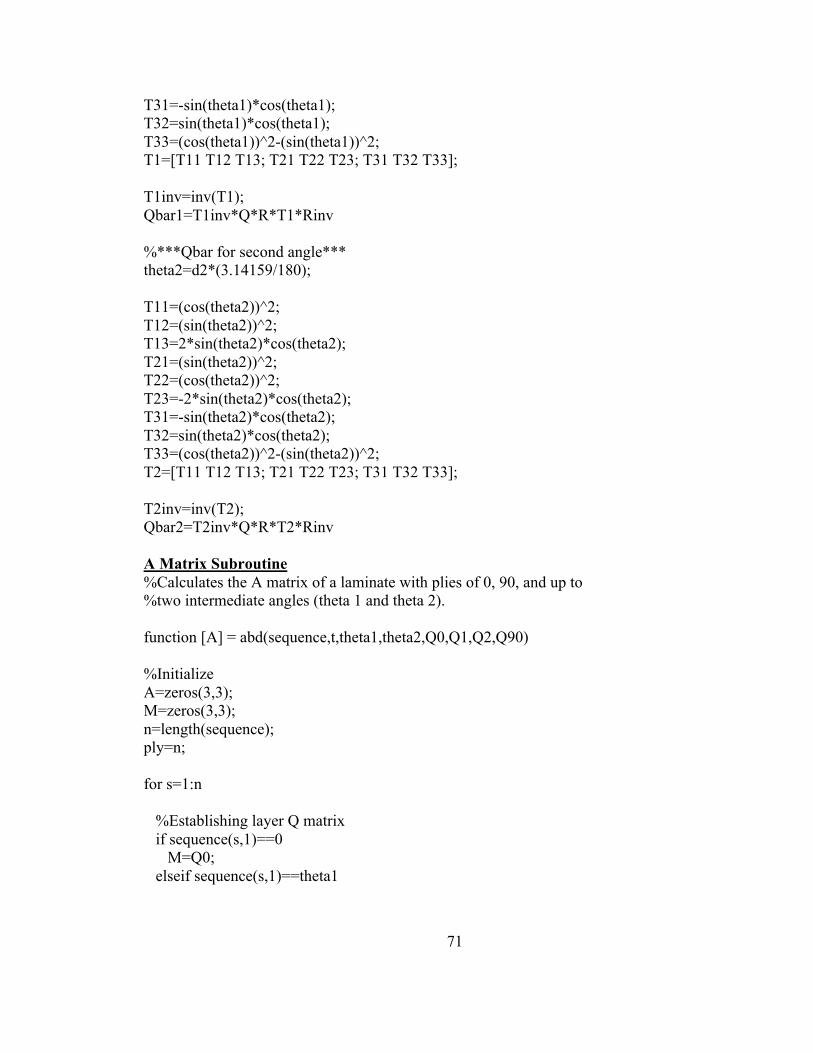
71
T31=-sin(theta1)*cos(theta1);
T32=sin(theta1)*cos(theta1);
T33=(cos(theta1))^2-(sin(theta1))^2;
T1=[T11 T12 T13; T21 T22 T23; T31 T32 T33];
T1inv=inv(T1);
Qbar1=T1inv*Q*R*T1*Rinv
%***Qbar for second angle***
theta2=d2*(3.14159/180);
T11=(cos(theta2))^2;
T12=(sin(theta2))^2;
T13=2*sin(theta2)*cos(theta2);
T21=(sin(theta2))^2;
T22=(cos(theta2))^2;
T23=-2*sin(theta2)*cos(theta2);
T31=-sin(theta2)*cos(theta2);
T32=sin(theta2)*cos(theta2);
T33=(cos(theta2))^2-(sin(theta2))^2;
T2=[T11 T12 T13; T21 T22 T23; T31 T32 T33];
T2inv=inv(T2);
Qbar2=T2inv*Q*R*T2*Rinv
A Matrix Subroutine
%Calculates the A matrix of a laminate with plies of 0, 90, and up to
%two intermediate angles (theta 1 and theta 2).
function [A] = abd(sequence,t,theta1,theta2,Q0,Q1,Q2,Q90)
%Initialize
A=zeros(3,3);
M=zeros(3,3);
n=length(sequence);
ply=n;
for s=1:n
%Establishing layer Q matrix
if sequence(s,1)==0
M=Q0;
elseif sequence(s,1)==theta1
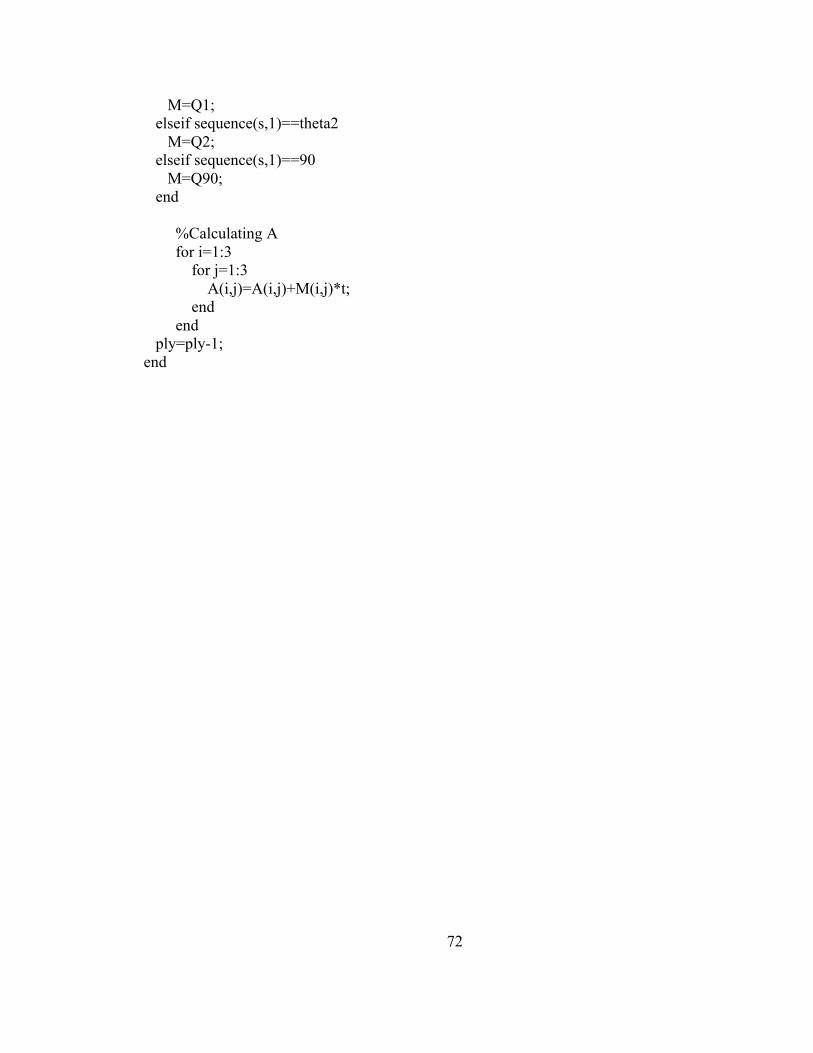
72
M=Q1;
elseif sequence(s,1)==theta2
M=Q2;
elseif sequence(s,1)==90
M=Q90;
end
%Calculating A
for i=1:3
for j=1:3
A(i,j)=A(i,j)+M(i,j)*t;
end
end
ply=ply-1;
end

REPORT DOCUMENTATION PAGE Form ApprovedOMB No. 0704-0188
2. REPORT TYPE
Contractor Report 4. TITLE AND SUBTITLE
Validation of Design and Analysis Techniques of Tailored Composite Structures
5a. CONTRACT NUMBER
6. AUTHOR(S)
Wijayratne, Dulnath D.
7. PERFORMING ORGANIZATION NAME(S) AND ADDRESS(ES)
The George Washington UniversityJoint Institute for Advancement of Flight SciencesLangley Research CenterHampton, VA 23681
9. SPONSORING/MONITORING AGENCY NAME(S) AND ADDRESS(ES)
National Aeronautics and Space AdministrationWashington, DC 20546-0001
8. PERFORMING ORGANIZATION REPORT NUMBER
10. SPONSOR/MONITOR'S ACRONYM(S)
NASA
13. SUPPLEMENTARY NOTESThesis to the Faculty of Structures and Dynamics Department, The George Washington University, in partial fulfillment of the requirements for the Degree of Master of Science, August 2004. Langley Technical Monitor: Dawn C. Jegley.An electronic version can be found at http://techreports.larc.nasa.gov/ltrs/ or http://ntrs.nasa.gov
12. DISTRIBUTION/AVAILABILITY STATEMENTUnclassified - UnlimitedSubject Category 39Availability: NASA CASI (301) 621-0390
19a. NAME OF RESPONSIBLE PERSON
STI Help Desk (email: [email protected])
14. ABSTRACT
Aeroelasticity is the relationship between the elasticity of an aircraft structure and its aerodynamics. This relationship can cause instabilities such as flutter in a wing but it is possible to use aeroelastic tailoring to cause an aircraft structure to respond favorably to flight loading conditions. This research investigates the ability to design and analyze tailored structures made from filamentary composites. A validation experiment has been performed on a small-scale filamentary composite wing box. The box is tailored such that its cover panels induce a global bend-twist coupling under an applied load. A closed form analysis based on a theoretical model of a single cell tailored box beam and a finite element analysis are used to analyze the structures. The comparison of predicted and experimental results show that the finite element analysis is capable of predicting displacements and strains to within 10% and the closed form code is able to predict the wing box bending to25% of the measured value but resulted in larger errors in the twist prediction. Initial assumptions in the closed form code limit its accuracy.
15. SUBJECT TERMS
Structural tailoring; Aeroelastic; VARTM; Composite; Graphite-epoxy
18. NUMBER OF PAGES
85
19b. TELEPHONE NUMBER (Include area code)
(301) 621-0390
a. REPORT
U
c. THIS PAGE
U
b. ABSTRACT
U
17. LIMITATION OF ABSTRACT
UU
Prescribed by ANSI Std. Z39.18Standard Form 298 (Rev. 8-98)
3. DATES COVERED (From - To)
5b. GRANT NUMBER
5c. PROGRAM ELEMENT NUMBER
5d. PROJECT NUMBER
NCC1-030085e. TASK NUMBER
5f. WORK UNIT NUMBER
23-762-55-TA
11. SPONSOR/MONITOR'S REPORT NUMBER(S)
NASA/CR-2004-212650
16. SECURITY CLASSIFICATION OF:
The public reporting burden for this collection of information is estimated to average 1 hour per response, including the time for reviewing instructions, searching existing data sources, gathering and maintaining the data needed, and completing and reviewing the collection of information. Send comments regarding this burden estimate or any other aspect of this collection of information, including suggestions for reducing this burden, to Department of Defense, Washington Headquarters Services, Directorate for Information Operations and Reports (0704-0188), 1215 Jefferson Davis Highway, Suite 1204, Arlington, VA 22202-4302. Respondents should be aware that notwithstanding any other provision of law, no person shall be subject to any penalty for failing to comply with a collection of information if it does not display a currently valid OMB control number.PLEASE DO NOT RETURN YOUR FORM TO THE ABOVE ADDRESS.
1. REPORT DATE (DD-MM-YYYY)
12 - 200401-