validation of diagnostic imaging criteria for primary
TRANSCRIPT

Validation of Diagnostic Imaging Criteria for Primary
Progressive Aphasia
Dissertation
zur Erlangung des akademischen Grades
Dr. rer. med.
an der Medizinischen Fakultät
der Universität Leipzig
eingereicht von:
Dipl.-Psych. Sandrine Bisenius
geboren am 11.12.1986 in Luxemburg (Stadt)
angefertigt am:
Max-Planck-Institut für Kognitions- und Neurowissenschaften, Leipzig
Betreuer: Prof. Dr. Dr. Matthias L. Schroeter
Beschluss über die Verleihung des Doktorgrades vom: 24.10.2017

ii
Table of Contents
1 General Introduction ............................................................................................... 8
1.1 Development of the terminology and diagnostic criteria for primary progressive aphasia .................................................................................................................. 8
1.2 Risk factors for primary progressive aphasia ....................................................... 13
1.3 Incidence and prevalence of primary progressive aphasia .................................. 14
1.4 German and Italian Consortium of Frontotemporal Lobar Degeneration ............. 15
1.5 Therapeutic approaches for primary progressive aphasia ................................... 16
1.6 Neuroimaging ...................................................................................................... 17
1.6.1 Positron emission tomography .................................................................... 17
1.6.2 Structural magnetic resonance imaging ...................................................... 18
1.7 Aim of this thesis .................................................................................................. 19
2 Validating New Diagnostic Imaging Criteria for Primary Progressive Aphasia via ALE Meta-Analyses .......................................................................... 21
2.1 Introduction .......................................................................................................... 21
2.2 Materials and methods ........................................................................................ 22
2.2.1 General study selection criteria ................................................................... 22
2.2.2 Anatomical likelihood estimation meta-analysis method ............................. 22
2.3 Results ................................................................................................................. 23
2.3.1 Identified studies ......................................................................................... 23
2.3.2 Separate meta-analyses for the different variants of primary progressive aphasia........................................................................................................ 24
2.3.2.1 Semantic variant PPA ........................................................................... 24
2.3.2.2 Progressive nonfluent aphasia .............................................................. 27
2.3.2.3 Logopenic progressive aphasia ............................................................. 28
2.3.2.4 Comparison between the meta-analyses on the different variants of primary progressive aphasia ................................................................. 29
2.4 Discussion ........................................................................................................... 30
2.4.1 Validation and refinement of diagnostic imaging criteria for primary progressive aphasia .................................................................................... 30
2.4.2 Open up the road to method-specific diagnostic imaging criteria for primary progressive aphasia ....................................................................... 31
2.5 Limitations ........................................................................................................... 32
2.6 Conclusion ........................................................................................................... 33
3 Predicting Primary Progressive Aphasia with Support Vector Machine Approaches in structural MRI data ...................................................................... 34
3.1 Introduction .......................................................................................................... 34

iii
3.2 Materials and methods ........................................................................................ 37
3.2.1 Subjects ...................................................................................................... 37
3.2.2 Image acquisition ........................................................................................ 38
3.2.3 Data analysis ............................................................................................... 38
3.2.3.1 Clinical characteristics ........................................................................... 38
3.2.3.2 Voxel-based morphometry .................................................................... 39
3.3 Results ................................................................................................................. 40
3.3.1 Demographic and clinical characteristics .................................................... 40
3.3.2 Voxel-based morphometry results ............................................................... 42
3.3.3 Support vector machine classification results.............................................. 42
3.3.3.1 Group comparisons between patients and healthy controls .................. 43
3.3.3.2 Group comparisons between PPA variants ........................................... 46
3.4 Discussion ........................................................................................................... 49
3.4.1 Atrophy in the different variants of primary progressive aphasia ................. 50
3.4.2 Support vector machine classification is a useful tool to differentiate between healthy controls and primary progressive aphasia variants .......... 51
3.4.3 Regions-of-interest approach or whole brain approach? ............................. 54
3.5 Limitations ........................................................................................................... 56
3.6 Conclusion ........................................................................................................... 56
4 General Discussion .............................................................................................. 58
4.1 Evaluation of the validity of the current diagnostic criteria for primary progressive aphasia ............................................................................................. 58
4.2 How useful are the current diagnostic imaging criteria for clinical routine? .......... 62
4.3 General limitations ............................................................................................... 65
4.4 General conclusion .............................................................................................. 65
5 Summary (Zusammenfassung) ............................................................................ 67
5.1 German summary ................................................................................................ 67
5.2 English summary ................................................................................................. 72
6 References ............................................................................................................. 77
7 Appendix ................................................................................................................ 89
7.1 Supplementary material ....................................................................................... 89
7.1.A Supplementary material for “Validating New Diagnostic Imaging Criteria for Primary Progressive Aphasia via ALE Meta-analyses” .......................... 89
7.1.B Supplementary material for “Validating New Diagnostic Imaging Criteria for Primary Progressive Aphasia via ALE Meta-analyses” ........................ 100
7.2 Declaration of contribution (Erklärung über den Beitrag zur Publikation) ........... 103
7.3 Declaration of authenticity (Eigenständigkeitserklärung) ................................... 104

iv
7.4 Curriculum vitae ................................................................................................. 105
7.5 List of publications ............................................................................................. 106
7.6 List of conference contributions ......................................................................... 108
7.7 Acknowledgment ............................................................................................... 113

v
List of Abbreviations
AD Alzheimer’s disease
ALE anatomical likelihood estimation
BAs Brodmann areas
CDR Clinical Dementia Rating Scale
FDR false discovery rate
FWE family-wise error
FDG-PET fluorodeoxyglucose positron emission tomography
FTD frontotemporal dementia
FTLD frontotemporal lobar degeneration
FTLD-CDR FTLD-modified Clinical Dementia Rating Scale
HC healthy controls
lvPPA logopenic variant PPA
MMSE Mini-Mental State Examination
MNI Montreal Neurological Institute
MRI magnetic resonance imaging
PET positron emission tomography
PPA primary progressive aphasia
nfvPPA nonfluent/agrammatic variant PPA
ROI regions-of-interest
SPECT single photon emission computed tomography
TDP TAR DNA-binding protein 43
svPPA semantic variant PPA
SVM support vector machine
VBM voxel-based morphometry

vi
List of Figures
Figure 1: Timeline of the development of the terminology and diagnostic criteria for primary progressive aphasia............................................................... 10
Figure 2: Sites of the German study centers involved in the German and Italian Research Consortium for Frontotemporal Lobar Degeneration ............... 16
Figure 3: Results of the anatomical likelihood estimation (ALE) meta-analyses for each of the different variants of primary progressive aphasia ............ 25
Figure 4: Comparison between the anatomical likelihood estimation (ALE) meta-analyses across different imaging modalities for semantic variant PPA (svPPA) and nonfluent variant PPA (nfvPPA) to identify method-specific and –common neural networks ...................................... 28
Figure 5: Comparison between the meta-analyses on the different variants of primary progressive aphasia for atrophy as measured with magnetic resonance imaging (MRI) ........................................................................ 29
Figure 6: Voxel-based morphometry and support vector machine classification results for nonfluent variant PPA as compared to healthy controls .......... 43
Figure 7: Voxel-based morphometry and support vector machine classification results for semantic variant PPA as compared to healthy controls .......... 44
Figure 8: Voxel-based morphometry and support vector machine classification results for logopenic variant PPA as compared to healthy controls ......... 45
Figure 9: Support vector machine classification results for the comparison and discrimination between semantic variant PPA and nonfluent variant PPA ......................................................................................................... 47
Figure 10: Support vector machine classification results for the comparison and discrimination between logopenic variant PPA and semantic variant PPA ......................................................................................................... 48
Figure 11: Support vector machine classification results for the comparison and discrimination between logopenic variant PPA and nonfluent/agrammatic variant PPA .......................................................... 49

vii
List of Tables
Table 1: Current diagnostic clinical and imaging criteria for primary progressive aphasia (adapted from Gorno-Tempini et al., 2011) ................................ 12
Table 2: Clinical characteristics of the patient groups ............................................ 24
Table 3: Results of the anatomical likelihood estimation meta-analyses on semantic variant PPA, nonfluent variant PPA, and logopenic variant PPA ......................................................................................................... 26
Table 4: Demographic and clinical characteristics of patients and healthy controls .................................................................................................... 41

1. General Introduction
8
1 General Introduction
1.1 Development of the terminology and diagnostic criteria for
primary progressive aphasia
Progressive fluent and nonfluent language disorders associated with atrophy in left
frontal, perisylvian, and temporal regions were first described by Pick, Sérieux, and
Rosenfeld (Pick, 1892; 1904 available in translation by Girling and Berrios, 1994,
1997; Rosenfeld, 1909; Sérieux, 1893). Pick (1892) described a woman who suffered
from a social disorder characterized by disinhibition and poor insight and whose
language abilities progressively deteriorated until she finally became mute. Sérieux
(1893) provided the first case report of an isolated progressive language disorder by
describing a patient with halting speech, but intact memory, visuospatial abilities, and
social functioning. Rosenfeld provided an early description of a patient with word-
finding difficulties, including a striking loss of the names of objects, circumlocutions,
and semantic paraphasic errors in spontaneous speech (Rosenfeld, 1909). A few
decades later, more single cases with fluent and nonfluent aphasia were described
(Holland, McBurney, Moossy, & Reinmuth, 1985; Tyrrell, Kartsounis, Frackowiak,
Findley, & Rossor, 1991; Warrington, 1975). Selective impairment of semantic
memory (component of long-term memory containing knowledge of objects, facts,
and concepts as well as words and their meaning; Tulving, 1972, 1983) was first
introduced by Warrington (1975) to describe three patients with cerebral atrophy
presenting with progressive anomia (i.e., problems recalling words or names) and
impaired word comprehension.
Mesulam (1982) introduced slowly progressive aphasia without dementia as a
syndrome that maintains relatively isolated aphasia until the terminal stages of the
disease and is mainly associated with neurodegeneration in left perisylvian regions.
Five years later, he renamed this syndrome into primary progressive aphasia (PPA;
Mesulam, 1987). Snowden, Goulding, and Neary (1989) proposed to distinguish
between three subtypes of PPA: fluent progressive aphasia, non-fluent progressive
aphasia, and a mixed subtype. These authors furthermore introduced the term
semantic dementia to designate fluent progressive aphasia characterized by a
1. General Introduction
9
progressive breakdown in language and visual perception due to loss of semantic
information and circumscribed cerebral atrophy in the temporal lobes (Snowden et
al., 1989). Hodges, Patterson, Oxbury, and Funnell (1992) provided a comprehensive
characterization of five case reports suffering from semantic dementia, and
Grossman et al. (1996) described extensively four case reports of progressive
nonfluent aphasia.
The Lund and Manchester Groups proposed the first general guidelines for the
clinical diagnosis of frontotemporal dementia (FTD), mentioning PPA by referring the
reader to single case studies for a more detailed description of PPA (Brun et al.,
1994; Neary, Snowden, & Mann, 1993a, 1993b; Snowden, Neary, Mann, Goulding, &
Testa, 1992). A consensus on more specific clinical and research diagnostic criteria
for PPA was reached in 1998 (Neary et al., 1998). Here, the core diagnostic features
for progressive nonfluent aphasia encompassed the insidious onset and gradual
progression of the disease as well as nonfluent spontaneous speech with
agrammatism, phonemic paraphasias, and/or anomia. The core diagnostic criteria for
semantic dementia, on the other hand, included the insidious onset and gradual
progression of the disease, progressive fluent empty spontaneous speech, loss of
word meaning which becomes manifest by impaired naming and comprehension,
semantic paraphasias and/or a perceptual disorder characterized by prosopagnosia
(i.e., impaired recognition of identity of familiar faces) and/or associative agnosia (i.e.,
impaired recognition of object identity). Perceptual matching and drawing
reproduction, preserved single-word repetition, and ability to read aloud and write to
dictation orthographically regular words were assumed to be preserved in patients
suffering from semantic dementia (Neary et al., 1998). In 2001, an international group
of clinical and basic scientists reassessed the clinical criteria for FTD and proposed
that a part of the patients suffering from FTD could be characterized by an early
progressive change in language, characterized by problems with expression of
language or severe naming difficulties and problems with word meaning (McKhann et
al., 2001).

1. General Introduction
10
At the same time, Mesulam (2001) proposed to define PPA as a disease starting with
anomia that progresses either into a) nonfluent language with phonemic paraphasia
associated with atrophy and hypometabolism within left frontal and perisylvian
atrophy or b) semantic memory loss associated with atrophy and hypometabolism
within the left temporal lobe (Abe, Ukita, & Yanagihara, 1997; Mesulam, 2001).
Mesulam (2001) furthermore proposed that language impairments should be the
most important symptoms for at least two years and to refine the use of semantic
dementia that had originally been adopted for patients showing a combination of
verbal and visual processing deficits (e.g., Neary et al., 1998) to patients without
visual processing deficits.
Figure 1: Timeline of the development of the terminology and diagnostic criteria for primary progressive aphasia.
For two decades, researchers and clinicians have been using the diagnostic criteria
for FTD (Brun et al., 1994; McKhann et al., 2001) to generally diagnose a patient as
Gorno-Tempini et al.: Development of new diagnostic clinical and research criteria for the three variants of PPA
2001 2001 2004 2004 2011 1998 1996 1994 1992 1989 1987 1982 1975 1892
Hodges: Detailed description of five case reports suffering from semantic dementia
Grossman et al.: Description of four case reports suffering from progressive nonfluent aphasia
Gorno-Tempini et al.: Introduction of logopenic subtype PPA or logopenic progressive aphasia as a third variant of PPA
Neary et al.: Development of consensus clinical and research diagnostic criteria for PPA
temporal lobes
Snowden: Distinction between fluent subtype (semantic dementia), non-fluent subtype, and mixed subtype Introduction of the term semantic dementia to designate fluent progressive aphasia characterized by a progressive breakdown in language and visual perception due to loss of semantic information and circumscribed atrophy in temporal lobes temporal lobes
Mesulam: Introduction of slowly progressive aphasia without dementia as a syndrome
The Lund and Manchester Groups: Development of clinical diagnostic criteria for frontotemporal dementia
Mesulam: Development of diagnostic criteria for PPA
Mc Khann et al.: Development of clinical diagnostic criteria for frontotemporal dementia including PPA
Mesulam: Slowly progressive aphasia has been renamed into primary progressive aphasia
Warrington: First description of a selective impairment of semantic memory in three patients with cerebral atrophy
Grossman and Ash: A number of PPA cases could not be classified according to the diagnostic criteria of Neary et al. (1998)
Pick: First description of a progressive language disorder associated with atrophy in left frontal and temporal lobes

1. General Introduction
11
suffering from PPA and the criteria of Neary et al. (1998) to further specify the
diagnosis as progressive nonfluent aphasia or semantic dementia. However, there
were a number of PPA cases that could not be classified according to the criteria of
Neary and colleagues (Gorno-Tempini et al., 2004; Grossman & Ash, 2004; Neary et
al., 1998). Given that many of these unclassifiable cases of PPA showed a similar
pattern of symptoms, Gorno-Tempini et al. (2004) proposed to introduce a third
subtype for PPA named logopenic progressive aphasia or logopenic variant PPA.
Logopenic variant PPA is mainly characterized by impaired single-word retrieval in
spontaneous speech and naming, impaired repetition of sentences and phrases,
phonologic errors in spontaneous speech and naming, spared single-word
comprehension and object knowledge, spared motor speech, and absence of frank
agrammatism (Gorno-Tempini et al., 2008; Gorno-Tempini et al., 2004). In response
to these new insights into PPA, an international consortium proposed new diagnostic
clinical and research criteria in 2011 (Gorno-Tempini et al., 2011). The chronological
development of the terminology and diagnostic criteria for PPA are shown in Figure
1.
According to the revised diagnostic clinical and research criteria (Gorno-Tempini et
al., 2011), a patient first needs to meet the basic criteria for PPA in general (i.e.,
prominent, isolated language disorder during the initial phase of the disease) as
proposed by Mesulam in 2001. Thereafter, the patient can be further diagnosed more
specifically as suffering from one of the three subtypes of PPA. In order to
standardize the terminology for PPA, it has been proposed to use the terms
nonfluent/agrammatic variant PPA (nfvPPA), semantic variant PPA (svPPA), and
logopenic variant PPA (lvPPA). In the following, we will apply this terminology. Note
that the abbreviated form nonfluent variant PPA instead of nonfluent/agrammatic
variant PPA will be used to increase the readability. The current diagnosis of the
variants of PPA is threefold, designating the probability of the diagnosis: clinical
diagnosis, imaging-supported diagnosis, and diagnosis with definite pathology
(Gorno-Tempini et al., 2011; see Table 1).

1. General Introduction
12
Table
1
Curr
ent d
iagnostic c
linic
al a
nd r
esearc
h c
rite
ria f
or
pri
mary
pro
gre
ssiv
e a
phasia
(a
dapte
d fro
m G
orn
o-T
em
pin
i et
al., 20
11)
log
ope
nic
vari
ant
PP
A
C
linic
al d
iag
nosis
Both
of th
e f
ollo
win
g c
ore
featu
res:
- Im
pa
ired s
ing
le-w
ord
retr
ieval in
sponta
ne
ous s
peech
an
d n
am
ing
- Im
pa
ired r
epetition o
f sente
nces a
nd
phra
ses
At le
ast 3
of th
e f
ollo
win
g o
ther
fea
ture
s:
- S
pe
ech (
ph
ono
log
ic)
err
ors
in
sponta
ne
ous s
peech
an
d n
am
ing
- S
pare
d s
ingle
-word
co
mp
rehensio
n a
nd
ob
ject know
ledge
- S
pare
d m
oto
r spe
ech
- A
bsence o
f fr
ank a
gra
mm
atism
Imag
ing-s
upport
ed d
iagnosis
Both
crite
ria m
ust be p
rese
nt:
- C
linic
al d
iag
nosis
of
logo
penic
vari
ant
P
PA
- Im
ag
ing
must sh
ow
:
P
red
om
ina
nt
left p
oste
rior
perisylv
ian o
r
pari
eta
l atr
ophy o
n M
RI or
hypop
erf
usio
n
or
hypo
meta
bo
lism
on P
ET
/SP
EC
T
Dia
gnosis
with d
efin
ite p
ath
olo
gy
Clin
ica
l d
iagnosis
of
log
op
enic
vari
ant
PP
A
and
his
topa
tho
log
ic e
vid
en
ce o
f a
specific
neuro
deg
enera
tive
path
olo
gy
(e.g
.,
AD
,
FT
LD
-tau,
FT
LD
-TD
P,
oth
er)
or
pre
sence
of a k
now
n p
ath
oge
nic
muta
tio
n
Note
. A
D
Alz
he
imer’s
dis
ease;
FT
LD
fr
onto
tem
pora
l lo
bar
dege
nera
tio
n;
MR
I m
ag
netic
resonance
imag
ing;
PE
T
positro
n
em
issio
n t
om
ogra
phy;
PP
A p
rim
ary
pro
gre
ssiv
e a
phasia
; S
PE
CT
sin
gle
photo
n e
mis
sio
n c
om
pute
d t
om
ogra
phy;
TD
P T
AR
DN
A-
bin
din
g p
rote
in 4
3
sem
antic v
aria
nt
PP
A
C
linic
al d
iag
nosis
Both
of th
e f
ollo
win
g c
ore
featu
res:
- Im
pa
ired c
onfr
onta
tion n
am
ing
- Im
pa
ired s
ing
le-w
ord
com
pre
he
nsio
n
At
least
3
of
the
follo
win
g
oth
er
featu
res:
- Im
pa
ired o
bje
ct know
ledg
e,
part
icu
larl
y for
low
fre
que
ncy o
r lo
w-
fa
mili
ari
ty ite
ms
- S
urf
ace d
ysle
xia
or
dysgra
ph
ia
- S
pare
d r
ep
etitio
n
- S
pare
d s
pe
ech p
rod
uctio
n (
gra
mm
ar
and
moto
r speech)
Imag
ing-s
upport
ed d
iagnosis
Both
of th
e f
ollo
win
g c
rite
ria:
- C
linic
al d
iag
nosis
of
sem
antic v
aria
nt
P
PA
- Im
ag
ing
must sh
ow
:
P
red
om
ina
nt a
nte
rior
tem
pora
l lo
be
atr
op
hy o
n M
RI
or
hypo
pe
rfusio
n o
r
hypom
eta
bo
lism
on P
ET
/SP
EC
T
Dia
gnosis
with d
efin
ite p
ath
olo
gy
Clin
ica
l d
iag
nosis
o
f sem
antic varia
nt
PP
A a
nd
his
topa
tho
log
ic e
vid
ence
of
a
specific
n
euro
dege
nera
tive
path
olo
gy
(e.g
.,
FT
LD
-ta
u,
FT
LD
-TD
P,
AD
,
oth
er)
or
pre
sence
of
a
kn
ow
n
path
oge
nic
muta
tio
n
nonflue
nt/a
gra
mm
atic v
aria
nt P
PA
C
linic
al d
iag
nosis
At le
ast o
ne o
f th
e fo
llow
ing
core
featu
res:
- A
gra
mm
atism
in lan
gua
ge
pro
duction
- E
ffort
ful, h
altin
g s
pe
ech w
ith
in
co
nsis
tent
speech s
oun
d e
rrors
and
d
isto
rtio
ns (
apra
xia
of sp
eech)
At le
ast 2
of th
e f
ollo
win
g o
ther
fea
ture
s:
- Im
pa
ired c
om
pre
hensio
n o
f synta
ctica
lly
com
ple
x s
ente
nces
- S
pare
d s
ingle
-word
co
mp
rehensio
n
- S
pare
d o
bje
ct kn
ow
ledg
e
Imag
ing-s
upport
ed d
iagnosis
Both
of th
e f
ollo
win
g c
rite
ria:
- C
linic
al d
iag
nosis
of
non
flu
ent/
agra
mm
atic v
ari
ant
PP
A
- Im
ag
ing
must sh
ow
:
P
red
om
ina
nt
left p
oste
rior
fronto
-insula
r
atr
op
hy o
n M
RI
or
hypo
pe
rfusio
n o
r
hypom
eta
bo
lism
on P
ET
/SP
EC
T
Dia
gnosis
with d
efin
ite p
ath
olo
gy
Clin
ica
l dia
gn
osis
o
f nonfluen
t/
agra
mm
atic
vari
ant
PP
A
and
h
isto
-
path
olo
gic
evid
ence
of
a
sp
ecific
neuro
deg
enera
tive
pa
tho
logy (
e.g
., F
TL
D-
tau,
FT
LD
-TD
P,
AD
, oth
er)
or
pre
sence o
f
a k
now
n p
ath
og
en
ic m
uta
tion

1. General Introduction
13
The current diagnostic criteria for PPA variants with definite pathology are relatively
unspecific because there is no straightforward correspondence between any variant
of PPA and a given pathology (Gorno-Tempini et al., 2011). In most cases, the
pathology is either FTLD (predominantly FTLD-TDP or FTLD-tau) or an atypical form
of Alzheimer’s disease (AD; Gorno-Tempini et al., 2011; Grossman, 2014; Mesulam
et al., 2014). FTLD-TDP refers to an accumulation in central nervous system neurons
of transactive response DNA-binding protein of ~ 43kD, known as TDP-43 and FTLD-
tau refers to an accumulation of the microtubule-associated protein tau (MAPT) in
neurons and glia (Grossman, 2014). FTLD pathology can arise either sporadically
(most cases) or autosomal dominantly inherited with mutations most commonly in the
progranulin (GRN) gene (associated with FTLD-TDP pathology), the MAPT gene
(associated with FTLD-tau pathology), or the chromosome 9 open reading frame 72
(C9orf72) gene (associated with FTLD-TDP pathology; Grossman, 2014). Regardless
whether sporadic or autosomal dominantly inherited, studies on clinical-pathologic
correlations in PPA suggest that nfvPPA might be rather related to tau-positive
pathology, while svPPA might be rather related to TDP-43-positive pathology
(Josephs et al., 2006; Mesulam et al., 2014; Mesulam et al., 2008). LvPPA has been
proposed to be rather related to AD pathology (Mesulam et al., 2014; Mesulam et al.,
2008; Rabinovici et al., 2008). However, there is no one-to-one correspondence
between a PPA variant and a given pathology as each PPA variant has been related
to several different pathologies (Gorno-Tempini et al., 2011; Mesulam et al., 2014).
1.2 Risk factors for primary progressive aphasia
Identical underlying pathology can thus lead to different syndromes (e.g., AD, PPA or
bvFTD; Gorno-Tempini et al., 2011; Mesulam et al., 2014). It has been proposed that
there might exist susceptibility factors that interact with the neurodegenerative
disease to determine its primary anatomical location (Rogalski, Weintraub, &
Mesulam, 2013). Except for a high prevalence of learning disabilities (especially
dyslexia) in the personal history of PPA patients (regardless of the underlying
pathology or PPA variant) or in the history of their first-degree relatives, there is
however little evidence for the existence of susceptibility factors until now (Rogalski
et al., 2013). One study showed that vasectomy rates were significantly higher in

1. General Introduction
14
PPA patients (40 %) as compared to healthy controls (16 %) (Weintraub et al., 2006).
Weintraub et al. (2006) speculated that vasectomy might induce an immune
response to sperm, akin to paraneoplastic encephalitis, which somehow interacts
with the primary neurodegenerative disease to make the language network the most
important locus of neurosynaptic loss. However, there is currently no evidence of an
overt immune-mediated neuropathology in PPA. Therefore, this suggestion remains
highly speculative (Rogalski et al., 2013).
1.3 Incidence and prevalence of primary progressive aphasia
During the last decade, several population studies investigated the prevalence and
incidence of FTD patients in Italy, the Netherlands, Spain, Finland, the United
Kingdom, Canada, the United States, Australia, Korea, China, Japan, and India (Kim
et al., 2014; Luukkainen, Bloigu, Moilanen, & Remes, 2015; Riedl, Mackenzie, Förstl,
Kurz, & Diehl-Schmid, 2014; Withall, Draper, Seeher, & Brodaty, 2014). LvPPA is
only rarely included in population studies on FTD, because this syndrome has rather
been related to AD pathology (Mesulam et al., 2014; Mesulam et al., 2008;
Rabinovici et al., 2008).
The estimates for the prevalence of FTD range from 2/100,000 to 31/100,000 (Riedl
et al., 2014). This wide variation is due to several reasons. Many population studies
report point prevalence estimates, while some studies report (cumulative) period
prevalence estimates. Another reason is that different studies considered different
age ranges and partly also different diagnostic criteria (Riedl et al., 2014).
Unfortunately, most population studies report prevalence and/or incidence estimates
across FTD syndromes and there are only a few studies which actually included PPA
patients. In studies, where PPA patients were included, the estimated point
prevalence of FTD is estimated at 15-22 per 100,000 in the population between 45
and 65 years (Borroni et al., 2015; Harvey, Skelton-Robinson, & Rossor, 2003;
Knopman & Roberts, 2011; Onyike & Diehl-Schmid, 2013; Ratnavalli, Brayne,
Dawson, & Hodges, 2002; Riedl et al., 2014). This point prevalence corresponds
approximately to the prevalence of AD in this age group (Onyike & Diehl-Schmid,
2013; Riedl et al., 2014). The incidence for FTD (including PPA patients) estimates

1. General Introduction
15
for this age group ranged from 2.7-4.1 per 100,000 in the population (Onyike & Diehl-
Schmid, 2013).
Until now, there are however no community-based prevalence and incidence
estimates for the three PPA variants available (Grossman, 2014). Based on autopsy-
proven cases, however, it has been estimated that about 40 % of the patients with
FTLD pathology have PPA (Grossman, 2014). BvFTD is thus almost three to four
times as common as one of the three PPA variants (Hogan et al., 2016; Knopman &
Roberts, 2011). This suggests a prevalence for PPA of 1.1-6.0 per 100,000 in the
population with FTLD pathology and additional cases with AD pathology (Grossman,
2014). The estimated incidence for PPA is approximately 0.88-1.4 per 100,000 in the
population with FTLD pathology. Men and women seem to be equally affected
(Hogan et al., 2016; Riedl et al., 2014) and the mean age of onset is approximately
58 years with later peak ages at initial diagnosis for nfvPPA (70-79 years; Coyle-
Gilchrist et al., 2016; Grossman, 2014; Riedl et al., 2014). The survival time after
initial diagnosis varies between 3-14 years with svPPA patients surviving a little bit
longer (median of 12 years) than nfvPPA (median of 9 years). For lvPPA, there are
currently no data on gender distribution, age at initial diagnosis and average survival
time available. Due to its rareness, PPA has been declared an orphan disease
(Orpha number ORPHA282, http://www.orpha.net).
1.4 German and Italian Consortium of Frontotemporal Lobar
Degeneration
In order to gain more insight into prevalence and incidence estimates of the different
clinical syndromes of frontotemporal lobar degeneration (FTLD), several national and
international consortia have been established during the last years. Examples include
the Italian FTD Network under the aegis of the Italian Neurological Society for
Dementia (SINDEM) which includes 85 study centers (Borroni et al., 2015), the
longitudinal study on FTD of the Clinical Research Center for Dementia of South
Korea including 16 centers (Kim et al., 2014), or the German and Italian Research
Consortium of FTLD (Otto et al., 2011).

1. General Introduction
16
The German and Italian Research Consortium of FTLD encompasses currently 12
centers in Germany (see Figure 2) and 11 centers in Italy (www.ftld.de). All centers
use a common study protocol involving medical assessment, neuropsychological and
language assessment, MRI (and PET if available) scanning, as well as blood
sampling. All instructions and materials are available in German and Italian language.
The aims of this consortium besides collecting data on epidemiology, are to improve
disease recognition along with its management, monitor disease progression, find
early disease markers and to develop and evaluate possible therapeutic approaches
(Otto et al., 2011)
Figure 2: Sites of the German study centers involved in the German and Italian Research Consortium for Frontotemporal Lobar Degeneration (modified from http://www.ftld.de).
1.5 Therapeutic approaches for primary progressive aphasia
There are a few studies that report minor improvements of confrontation naming
immediately following speech therapy on word-finding abilities in patients with PPA
and two studies reported successful short-term outcomes of treatment of written
language (Riedl et al., 2014; Tippett, Hillis, & Tsapkini, 2015). A few studies also
1. General Introduction
17
showed short-term improvement of language abilities when repetitive transcranial
magnetic stimulation or transcranial direct current stimulation was applied while
participants were performing a language task. Note however that most intervention
studies were case reports or included only a small number of participants (Tippett et
al., 2015) and that there is no evidence for the sustainability and generalizability of
any of these treatments (Riedl et al., 2014; Tippett et al., 2015). Symptoms in lvPPA
might be reduced with medications that have been shown to reduce or delay the
progression of symptoms in AD (acetylcholinesterase inhibitors as donepezil,
rivastigmine, or galantamine and/or N-Methyl-D-Aspartat glutamate receptor
antagonists as memantine) as most lvPPA patients show underlying AD pathology
(see section 1.1). This assumption needs however still to be empirically supported by
large-scale randomized clinical trials (Otto et al., 2011; Tippett et al., 2015). Selective
serotonin reuptake inhibitors such as citalopram or sertraline have been shown to
reduce behavioral disturbances such as obsessive-compulsive behavior,
restlessness, eating disorders or disinhibition (Manoochehri & Huey, 2012).
Therefore, clinicians are currently advised to prescribe selective serotonin reuptake
inhibitors to PPA patients who show additionally symptoms that are rather
prototypical for bvFTD (Manoochehri & Huey, 2012; Otto et al., 2011). All in all, there
are currently no recommended medications for the treatment of PPA symptoms.
1.6 Neuroimaging
1.6.1 Positron emission tomography
In positron emission tomography (PET), the patient receives an intravenous injection
of a radiotracer that emits a positron (Berns, 1999; Small et al., 2008). When the
positron encounters an electron, they annihilate each other and their collective
energy is transformed into two gamma photons that are emitted in opposite directions
and can be recorded by detectors that are 180° apart from each other. PET scanners
are equipped with a ring of detectors that determine the line along which the
annihilation occurs in order to reconstruct the 3D localization of the physiological
process of interest with a spatial resolution of 3-5 mm. A physiological process that is
often measured using PET is local glucose metabolism which changes in response to

1. General Introduction
18
synaptic activity and depends on cell density. PET is thus well suited to detect
neurodegenerative diseases and monitor their disease progression. The most
common radioactive tracer used to measure local glucose metabolism in the brain is
fluoro-deoxyglucose (18FDG) which leads to the general use of the term FDG-PET to
designate this neuroimaging method (Berns, 1999; Small et al., 2008).
1.6.2 Structural magnetic resonance imaging
Another neuroimaging method that is well suited to detect neurodegenerative
diseases and monitor their progression is structural MRI. Structural MRI has some
advantages over FDG-PET: it does not require the injection of a radioactive tracer
(and is thus not invasive) and it provides images with a high resolution of ~1 mm
(e.g., Berns, 1999).
The magnetic resonance imaging technique is based on an intrinsic property of
hydrogen protons, namely their spin (Berns, 1999; Small et al., 2008). Normally, the
spin axes are oriented randomly, but when a strong external magnetic field (e.g., MRI
scanner) is applied, the axes align themselves in the direction of that field. This leads
to a measurable magnetization along the scanner magnet. The time to reach this
magnetization is called T1. Similar to a spinning top, the single hydrogen protons do
not spin exactly along a single axis, but instead, there is a slow wobble called
precession. In MRI, after the hydrogen protons’ spins are aligned, a radiofrequency
pulse at the precession frequency of the hydrogen protons is applied to knock the
precession axis out of its original orientation. If enough protons get bumped, the
tissue acquires a slight magnetization perpendicular to the external field which is
called transverse magnetization. After switching off the radiofrequency pulse, the
transverse magnetization decays. Different processes reflect the decay of the
induced transverse magnetization, called T1-, T2- and T2*-relaxation. The duration of
these different relaxation processes depends on the molecular environment of the
protons, which allows differentiating between grey matter, white matter, and
cerebrospinal fluid. By repeating the process of excitation and relaxation several
times and varying the magnetic field gradients, 3D images of the brain can be
encoded and reconstructed.

1. General Introduction
19
Before structural 3D images of the brain (acquired using PET or MRI) can be used in
group-level analyses, they need to be preprocessed which includes realignment of
the single slices, coregistration and normalization to a standard brain template, and
segmentation of the different tissue types (grey matter, white matter, and
cerebrospinal fluid) as well as smoothing by a Gaussian kernel (e.g., Ashburner &
Friston, 2000, see section 3.2.3.2).
1.7 Aim of this thesis
For two decades, researchers and clinicians have been using the diagnostic criteria
for FTD (Brun et al., 1994; McKhann et al., 2001) to generally diagnose a patient as
suffering from PPA and the criteria of Neary et al. (1998) to further specify the
diagnosis as progressive nonfluent aphasia or semantic dementia. However, there
were a number of PPA cases that could not be classified according to the criteria of
Neary and colleagues (Gorno-Tempini et al., 2004; Grossman & Ash, 2004; Neary et
al., 1998), which led to a revision of the diagnostic clinical and research criteria for
PPA (Gorno-Tempini et al., 2011). The revised criteria encompass three PPA
variants (svPPA, nfvPPA, and lvPPA) with three stages characterized by increasing
evidence: clinical diagnosis, imaging-supported diagnosis, and diagnosis with definite
pathology. As compared to the previous diagnostic criteria, more emphasis is placed
on imaging markers as supportive features. These imaging criteria were however
proposed based on a purely qualitative evaluation of the literature and have not been
validated so far.
The aim of this thesis was to evaluate the validity of the new diagnostic imaging
criteria for PPA variants (first study) and to investigate the usefulness of these
imaging criteria for the individual diagnosis of PPA patients in clinical routine (second
study).
In the first study (Bisenius et al., 2016), we raised the question whether the proposed
diagnostic imaging criteria indeed represent subtype-specific prototypical atrophic
networks for PPA variants (chapter 2). In order to address this question, we provided
a quantitative evaluation (meta-analyses) of all currently available imaging studies on
PPA. We hypothesized to find specific atrophic networks for each of the PPA variants

1. General Introduction
20
that are in line with the current diagnostic imaging criteria. Furthermore, we raised the
question whether the proposed imaging criteria apply similarly to different imaging
modalities (MRI and PET) as suggested in the current diagnostic criteria for PPA
(Gorno-Tempini et al., 2011). Given that for other types of dementia (e.g., AD and
bvFTD), separate diagnostic imaging criteria have been proposed for MRI and PET
scans (Dubois et al., 2007; Schroeter et al., 2014), we hypothesized that separate
imaging modality-specific criteria might also apply for PPA.
In the second study (Bisenius et al., 2017), we first addressed the question whether
(whole brain) structural MRI scans provide indeed useful information for the correct
individual diagnosis of PPA patients (chapter 3). We were also interested in finding
out which brain regions would be the most indicative for the correct diagnosis of PPA
patients. We hypothesized that, when considering the whole brain MRI scan, the
most important brain regions for the correct individual diagnosis of PPA patients
would correspond to brain regions that are largely atrophied in these patients. In a
second step, we raised the question whether focusing exclusively on the prototypical
atrophic networks for PPA revealed by the meta-analyses reported in the first study,
would enhance the diagnostic value of MRI scans for the correct diagnosis of PPA
patients. These prototypical atrophic networks constitute in a sense a quantification
of the current imaging criteria for PPA. Therefore, we hypothesized that considering
only these prototypical atrophic networks would further enhance the diagnostic value
of MRI scans (and thus provide empirical support for the usefulness of the proposed
diagnostic imaging criteria for PPA in clinical routine).

2. Anatomical likelihood estimation meta-analyses on PPA
21
2 Validating New Diagnostic Imaging Criteria for
Primary Progressive Aphasia via ALE Meta-
Analyses
2.1 Introduction
Primary progressive aphasia (PPA) subsumes three gradually progressive language
disorders, namely its semantic variant (svPPA) or semantic dementia, the nonfluent
variant (nfvPPA) or progressive nonfluent aphasia, and the logopenic variant (lvPPA)
or logopenic progressive aphasia (Gorno-Tempini et al., 2008; Gorno-Tempini et al.,
2004; Gorno-Tempini et al., 2011; Mesulam, 1982; Neary et al., 1998). Recently, an
international consortium has refined the diagnostic clinical and imaging criteria for
PPA variants (Gorno-Tempini et al., 2011). The imaging criteria include changes of
structure, metabolism or perfusion in the anterior (ventral and lateral) temporal lobe
for svPPA, in left posterior fronto-insular regions (inferior frontal gyrus, insula,
premotor, and supplementary motor areas) for nfvPPA, and in left posterior
perisylvian or parietal areas (posterior parietal, supramarginal, and angular gyri) for
lvPPA (Gorno-Tempini et al., 2011).
Here, we used anatomical likelihood estimation (ALE) meta-analyses to validate the
current imaging criteria with higher statistical power than can be provided by single
studies (Chein, Fissell, Jacobs, & Fiez, 2002; Turkeltaub, Eden, Jones, & Zeffiro,
2002). ALE meta-analyses have been applied to investigate neurodegenerative
diseases like mild cognitive impairment, AD, or FTD (Schroeter, Raczka, Neumann,
& von Cramon, 2008; Schroeter, Stein, Maslowski, & Neumann, 2009; Yang, Pan,
Song, Huang, et al., 2012; Yang, Pan, Song, & Shang, 2012). We wanted to identify
the neural networks affected in the three PPA variants and examine their regional
specificity in subtraction and conjunction analyses identifying specific and
overlapping networks, respectively. It has been proposed that different diagnostic
imaging criteria should be applied for AD and bvFTD to different imaging modalities –
FDG-PET visualizing hypometabolism, MRI showing atrophy, and perfusion changes

2. Anatomical likelihood estimation meta-analyses on PPA
22
(Dubois et al., 2007; Schroeter et al., 2014). Accordingly, we hypothesized that the
new diagnostic imaging criteria for PPA should be differentiated for MRI and PET.
2.2 Materials and methods
2.2.1 General study selection criteria
The present work was done following the Preferred Reporting Items for Systematic
Reviews and Meta-Analyses (PRISMA) statement guidelines (Moher, Liberati,
Tetzlaff, & Altman, 2010). PubMed was queried for abstracts published between
January 1990/April 2012 containing following keywords: (primary progressive
aphasia OR progressive nonfluent aphasia OR semantic dementia OR logopenic
progressive aphasia) AND (positron emission tomography OR PET OR magnetic
resonance imaging OR MRI). Following inclusion criteria were applied: peer-reviewed
original studies, patients classified according to internationally recognized diagnostic
criteria (Brun et al., 1994; Gorno-Tempini et al., 2011; McKhann et al., 2001; Neary et
al., 1998), age-matched healthy controls, whole-brain analyses reporting 3D-
coordinates of atrophy/hypometabolism maxima in standardized stereotaxic space,
Talairach atlas or Montreal Neurological Institute (MNI) templates. Studies reporting
only regions-of-interest (ROI) analyses were excluded to avoid a potential publication
bias. When studies fulfilled the inclusion criteria, but no coordinates were reported,
authors were asked to provide coordinates.
2.2.2 Anatomical likelihood estimation meta-analysis method
ALE meta-analyses were computed within BrainMap Ginger ALE 2.1.1 (online at
http://www.brainmap.org/ALE; Eickhoff, Bzdok, Laird, Kurth, & Fox, 2012; Eickhoff et
al., 2009; Laird et al., 2005; Turkeltaub et al., 2002). Before data analysis,
coordinates in Talairach space were converted into MNI coordinate space using the
tal2icbm transform (Lancaster et al., 2007) except for one study (Perneczky, Diehl-
Schmid, Pohl, Drzezga, & Kurz, 2007) where we used the tal2mni transform (Brett,
Johnsrude, & Owen, 2002) because these authors transformed data via mni2tal
transform (Brett et al., 2002) into Talairach space.

2. Anatomical likelihood estimation meta-analyses on PPA
23
In the ALE method, foci are modeled as 3D Gaussian probability distributions with
variable full width at half maximum that takes into account between-subject and
between-template variance (Eickhoff et al., 2009). We computed separate meta-
analyses for each of the three PPA variants at a false discovery rate (FDR) corrected
significance level of p < 0.05. Cluster inference thresholds were chosen to exceed
the number of voxels corresponding to 5 % possible false positives.
We additionally computed subtraction analyses (Eickhoff et al., 2011) between the
different meta-analyses on svPPA (MRI vs. PET) and the different variants of PPA.
Here, the ALE maps (p < 0.05, FDR corrected) resulting from the separate meta-
analyses are subtracted from each other and compared against a null-distribution of
differences in ALE scores (5000 permutations). The cluster inference threshold for
the subtraction analyses was set to 200 mm3 (p < 0.05, uncorrected; Huang et al.,
2012). Conjunctions were assessed by a minimum statistic of images containing
significant results from the individual meta-analyses (Nichols, Brett, Andersson,
Wager, & Poline, 2005).
2.3 Results
2.3.1 Identified studies
Out of 658 originally identified studies, 478 studies had to be excluded due to none-
relevant topics and 150 studies for specific reasons (see Supplementary Figure A).
The final pool consisted of 30 studies (20 MRI, seven FDG-PET, three MRI & FDG-
PET) fulfilling the inclusion criteria. As some studies investigated more than one
variant of PPA, the search resulted finally in 22 studies for semantic variant PPA (15
MRI, six FDG-PET, one MRI & FDG-PET), 14 for nfvPPA (11 MRI, three FDG-PET),
and six for lvPPA (six MRI, zero FDG-PET) including 396 patients. The one study on
svPPA that reported both MRI and FDG-PET coordinates (Desgranges et al., 2007)
was counted as one MRI and one FDG-PET study. Age, duration, and severity of
disease as measured with the Mini-Mental State Examination did not differ between
patients of the different PPA variants (Table 2). Detailed information for all included
studies is available in the supplement (Supplementary Table A.1 and Supplementary
References A).

2. Anatomical likelihood estimation meta-analyses on PPA
24
Table 2
Clinical characteristics of the patient groups
Note. lvPPA logopenic variant PPA, MMSE Mini-Mental State Examination, MRI magnetic resonance imaging, nfvPPA nonfluent variant PPA, PET positron emission tomography, svPPA semantic variant PPA. Age, disease duration, and MMSE are indicated as mean±standard deviation. Age and disease duration are indicated in years.
2.3.2 Separate meta-analyses for the different variants of primary progressive
aphasia
2.3.2.1 Semantic variant PPA
MRI: As illustrated in dark green color in Figure 3 on the top, the meta-analysis on
svPPA across the 16 MRI studies including 177 foci and 169 subjects yielded
significant clusters of atrophy bilaterally in the inferior, middle, and superior temporal
gyri, fusiform gyri, hippocampus, parahippocampal gyri, and right amygdala. Details
on the respective MNI coordinates, cluster sizes, ALE values, and Brodmann Areas
(Bas) are given in Table 3.
FDG-PET: The meta-analysis on svPPA across the seven FDG-PET studies
encompassed 36 foci and 70 subjects. As illustrated in light-green in Figure 3,
second row, consistent hypometabolism was found bilaterally in the anterior inferior
temporal gyri, the left fusiform gyrus, posterior midcingulate gyrus, corpus callosum,
and left medial thalamus (for more details, see Table 3).
svPPA MRI svPPA PET nfvPPA MRI nfvPPA PET lvPPA MRI ANOVA (df, F, p)
Number of studies/foci
16/177 7/36 11/101 3/26 6/70
Number of patients
169 57 93 26 51
Age 64.66 ± 2.91 64.29 ± 1.57 66.64 ± 2.32 67.90 ± 2.57 64.55 ± 4.47 (4,41), 1.32, 0.28
Disease duration
4.87 ± 1.64 3.82 ± 0.47 4.03 ± 1.22 3.30 ± 0.14 3.73 ± 1.30 (4,31), 1.86, 0.14
MMSE 23.12 ± 2.18 23.10 ± 2.51 23.20 ± 3.44 21.34 ± 2.15 21.38 ± 1.15 (4,39), 0.89, 0.48

2. Anatomical likelihood estimation meta-analyses on PPA
25
Figure 3: Results of the anatomical likelihood estimation (ALE) meta-analyses for each of the different variants of primary progressive aphasia. Atrophy was measured with magnetic resonance imaging (MRI), glucose hypometabolism with fluorodeoxyglucose positron emission tomography (PET). Logopenic variant PPA (lvPPA), nonfluent variant PPA (nfvPPA), semantic variant PPA (svPPA). False discovery rate (FDR) corrected p < 0.05. Left side is left.

2. Anatomical likelihood estimation meta-analyses on PPA
26
Table 3
Results of the anatomical likelihood estimation meta-analyses on semantic variant PPA, nonfluent variant PPA, and logopenic variant PPA
Note. ALE anatomical likelihood estimation, Bas Brodmann areas, FDG-PET fluorodeoxyglucose positron emission tomography, Lat. Lateralization, L left, lvPPA logopenic variant PPA, MNI Montreal Neurological Institute, MRI magnetic resonance imaging, nfvPPA nonfluent variant PPA, R right, svPPA semantic variant PPA.
Region Lat. Bas MNI
coordinates
Volume ALE
x y z (mm3)
svPPA MRI Inferior, middle, & superior temporal gyri/fusiform gyrus/hippocampus/
R 20/21/ 24 0 -22 11312 0.0202
parahippocampal gyrus/amygdala 36/38 Hippocampus/parahippocampal gyrus/fusiform gyrus
L 36 -26 -12 -16 6744 0.0235
Superior temporal gyrus L 38 -38 16 -28 2568 0.0172 Inferior & middle temporal gyrus L 21/38 -46 2 -44 1552 0.0167 Fusiform gyrus L 20 -44 -32 -24 1536 0.0227
svPPA PET Inferior temporal gyrus/fusiform gyrus L 20/21 -38 -12 -34 1976 0.0127 Inferior temporal gyrus L 20 -48 -26 -30 520 0.0108 Inferior temporal gyrus R 20 42 -2 -42 448 0.0076 Inferior temporal gyrus L 38 -40 2 -46 424 0.0106 Posterior midcingulate gyrus/corpus callosum
L 24 -10 6 26 424 0.0083
Thalamus L -6 -20 14 376 0.0080
nfvPPA MRI Insula/inferior frontal gyrus L 13 -44 12 2 1360 0.0107 Middle & superior temporal gyri L 21 -62 -58 6 624 0.0109 Inferior & middle frontal gyrus L 9/10 -34 46 20 552 0.0097 Inferior frontal gyrus L -48 16 24 544 0.0131 Superior frontal gyrus L 6 -22 -4 64 448 0.0102 Putamen L -22 10 -6 424 0.0110 Middle frontal gyrus/precentral gyrus L 6 -42 2 50 424 0.0115
nfvPPA PET Superior temporal gyrus L 21 -62 -14 -16 744 0.0089 Insula/inferior frontal gyrus, pars opercularis L 13 -46 12 -6 160 0.0067 Lateral orbital gyrus L 46 -50 46 -2 160 0.0073 Middle temporal gyrus L -50 -28 -12 88 0.0068 Nucleus caudatus R 10 6 4 88 0.0068 Thalamus L -2 -22 6 88 0.0068 Nucleus caudatus L 22 -10 2 6 88 0.0068 Middle frontal gyrus L 9 -52 28 28 88 0.0068
lvPPA MRI Middle & superior temporal gyri/parallel sulcus
L 22/41 -54 -38 14 3344 0.0120
Supramarginal gyrus L 39/40 -54 -54 32 2184 0.0136 Superior temporal gyrus L 21 -66 -22 -4 1192 0.0135 Dorsal posterior cingulate gyrus L 23 0 -32 28 488 0.0117

2. Anatomical likelihood estimation meta-analyses on PPA
27
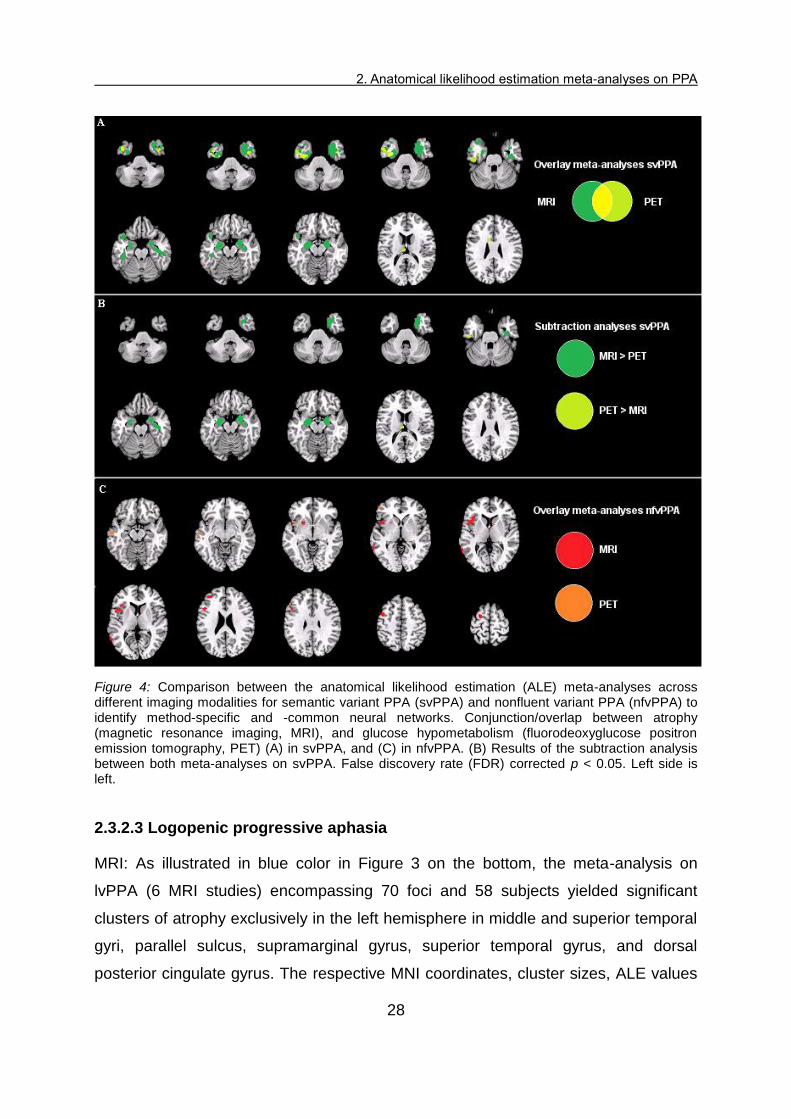
MRI & FDG-PET: The results of both imaging meta-analyses on svPPA were
projected together onto the same MNI template, which revealed only small
conjunctions between MRI and FDG-PET studies in the left inferior and middle
temporal gyrus (see Figure 4 on the top). To validate the specificity between imaging
modalities, we conducted additionally subtraction analyses between both meta-
analyses on svPPA. As shown in Figure 4 in the middle upper part, right inferior,
middle and superior temporal gyri, right fusiform gyrus, and bilateral
hippocampus/parahippocampal gyri/amygdalae were specifically related to atrophy
as measured with MRI, while left thalamus and left inferior temporal gyrus/fusiform
gyrus were more specifically related to hypometabolism as measured by FDG-PET.
A detailed overview is given in Supplementary Table A.2.
2.3.2.2 Progressive nonfluent aphasia
MRI: An overview of the results for nfvPPA is given in Table 3 and the relevant
clusters are depicted in red in Figure 3, third row. The meta-analysis on nfvPPA
across the 11 MRI studies (101 foci, 90 subjects) revealed clusters of significant
atrophy solely in the left hemisphere, in particular in the putamen, anterior and middle
insula, inferior, middle, and superior frontal gyri, as well as middle and superior
temporal gyri. This result was in essence replicated in an analysis including only the
seven studies that explicitly excluded subjects with lvPPA.
FDG-PET: As illustrated in orange color in Figure 4, fourth row, the meta-analysis on
nfvPPA across the three PET studies including 26 foci and 26 subjects yielded
significant clusters of hypometabolism bilaterally in the caudate nuclei as well as in
the left hemisphere in the thalamus, middle and superior temporal gyri, insula/inferior
frontal gyrus, pars opercularis, lateral orbital gyrus, and middle frontal gyrus.
MRI & FDG-PET: The results of both imaging meta-analyses on nfvPPA were
projected together onto the same MNI template to visualize possible conjunct atrophy
and hypometabolism to identify common networks. As shown in Figure 4 on the
bottom, the results of both meta-analyses were disjunct. Note however that due to
the small number of studies in the meta-analysis on nfvPPA across PET studies, no
subtraction analysis was performed.
2. Anatomical likelihood estimation meta-analyses on PPA
28
Figure 4: Comparison between the anatomical likelihood estimation (ALE) meta-analyses across different imaging modalities for semantic variant PPA (svPPA) and nonfluent variant PPA (nfvPPA) to identify method-specific and -common neural networks. Conjunction/overlap between atrophy (magnetic resonance imaging, MRI), and glucose hypometabolism (fluorodeoxyglucose positron emission tomography, PET) (A) in svPPA, and (C) in nfvPPA. (B) Results of the subtraction analysis between both meta-analyses on svPPA. False discovery rate (FDR) corrected p < 0.05. Left side is left.
2.3.2.3 Logopenic progressive aphasia
MRI: As illustrated in blue color in Figure 3 on the bottom, the meta-analysis on
lvPPA (6 MRI studies) encompassing 70 foci and 58 subjects yielded significant
clusters of atrophy exclusively in the left hemisphere in middle and superior temporal
gyri, parallel sulcus, supramarginal gyrus, superior temporal gyrus, and dorsal
posterior cingulate gyrus. The respective MNI coordinates, cluster sizes, ALE values

2. Anatomical likelihood estimation meta-analyses on PPA
29
and Bas are shown in Table 3. For FDG-PET, we did not find any study in the
literature investigating lvPPA.
Figure 5: Comparison between the meta-analyses on the different variants of primary progressive aphasia for atrophy as measured with magnetic resonance imaging (MRI). (A) Conjunction/overlap between semantic variant PPA (svPPA), nonfluent variant PPA (nfvPPA), and logopenic variant PPA (lvPPA). (B) Results of the subtraction analyses to identify PPA variant-specific networks. False
discovery rate (FDR) corrected p < 0.05. Left side is left.
2.3.2.4 Comparison between the meta-analyses on the different variants of
primary progressive aphasia
The results of the three MRI meta-analyses on the different variants of PPA were
projected together onto an MNI template to investigate the variant-specificity. For
FDG-PET such an analysis was not possible due to limited study numbers. As shown
in Figure 5 at the top, there was no overlap between the results of the meta-analyses
across MRI studies on svPPA (dark green), nfvPPA (red), and lvPPA (blue), except
for a small conjunction (64 mm3, purple) between nfvPPA and lvPPA in the left
posterior middle temporal gyrus. To validate the regional specificity for each PPA
variant, we conducted additionally subtraction analyses (nfvPPA > svPPA & lvPPA,
svPPA > nfvPPA & lvPPA, lvPPA > svPPA & nfvPPA) between the meta-analyses on
2. Anatomical likelihood estimation meta-analyses on PPA
30
the different PPA variants. The results of the subtraction analyses are shown in
Figure 5 at the bottom and details on the respective MNI coordinates, cluster sizes,
ALE values, and BAs are reported in Supplementary Table A.2. The analysis
revealed that almost all atrophic brain regions as identified in the ALE meta-analysis
for each PPA variant separately (see Figure 3) were also specific for this variant (see
anatomical description above).
2.4 Discussion
The present work validated the recently proposed imaging criteria for the three
variants of PPA using ALE meta-analyses. In the following, we will first focus on the
results of the variant-specific meta-analyses. Thereafter, we will emphasize the
distinctiveness of the networks of atrophy for svPPA, nfvPPA, and lvPPA and discuss
future clinical implications of the relative disjunction between the meta-analyses on
svPPA (and nfvPPA) across different imaging modalities.
2.4.1 Validation and refinement of diagnostic imaging criteria for primary
progressive aphasia
The new diagnostic imaging criteria for svPPA include anterior (ventral and lateral)
temporal lobes (Gorno-Tempini et al., 2011). Our meta-analyses on svPPA across
MRI studies confirmed atrophy bilateral in anterior ventral temporal lobe (inferior
temporal gyrus) and anterior lateral temporal lobe (middle/superior temporal gyri,
fusiform gyrus), but extended the proposed regions towards the anterior medial
temporal lobe (right amygdala and bilaterally hippocampus/parahippocampal gyri).
Similarly, the results of our meta-analysis on nfvPPA across MRI studies confirmed
insula, inferior frontal gyrus, premotor (inferior, middle, and superior frontal gyrus),
and supplementary motor areas (superior frontal gyrus) as useful diagnostic imaging
criteria for nfvPPA (Gorno-Tempini et al., 2011). The results of our meta-analysis on
nfvPPA across MRI studies additionally showed consistent atrophy in middle and
superior temporal gyri, putamen, and precentral gyrus, thus emphasizing the role of
these regions for the diagnosis of nfvPPA.
The proposed imaging criteria for lvPPA encompass posterior perisylvian/parietal
areas, supramarginal gyrus, and angular gyrus (Gorno-Tempini et al., 2011). The

2. Anatomical likelihood estimation meta-analyses on PPA
31
results of our meta-analysis on lvPPA support the supramarginal gyrus and posterior
perisylvian regions (superior temporal gyrus), but not the angular gyrus as
consistently atrophied regions across studies. Interestingly, our meta-analysis on
lvPPA showed additionally atrophy in the dorsal posterior cingulate gyrus and in
superior/middle temporal gyrus, thus highlighting the importance of these regions for
future MRI based diagnosis of lvPPA. Furthermore, atrophy in the posterior cingulate
cortex in lvPPA supports the assumption that lvPPA is pathologically closely related
to AD (Rabinovici et al., 2008; Schroeter et al., 2009). Interestingly, the conjunction of
the different meta-analyses across MRI studies showed a regional overlap in the
posterior middle temporal gyrus between nfvPPA and lvPPA, which suggests that
this region might play an important role in both PPA variants. However, given that
this overlap was very small, a high clinical specificity and usability of the diagnostic
imaging criteria for PPA variants is still guaranteed. This was further supported by the
subtraction analysis identifying specific atrophic networks related to each PPA
variant.
Although the new diagnostic criteria contain also brain perfusion markers, we could
not detect any studies with this imaging modality in PPA. Interestingly, recent studies
for AD revealed regionally coinciding reductions in glucose metabolism and perfusion
(e.g., Dubois et al., 2007). In analogy, we assume that changes of these imaging
modalities coincide regionally in PPA variants as well, although this hypothesis has to
be proofed by future meta-analyses.
2.4.2 Open up the road to method-specific diagnostic imaging criteria for
primary progressive aphasia
Interestingly, there were only small conjunctions (in inferior and middle temporal
gyrus) between the results of the meta-analysis on svPPA across MRI studies and
the one across FDG-PET studies. The meta-analysis on svPPA across FDG-PET
studies furthermore extended the relevant regions for this PPA variant towards limbic
regions, in particular the posterior midcingulate gyrus, and the thalamus. This
implicates on the one hand that the posterior midcingulate gyrus and thalamus might
play a larger role as diagnostic imaging criteria for svPPA as formerly assumed.
However, the specificity of these regions is hampered by the fact that comparable

2. Anatomical likelihood estimation meta-analyses on PPA
32
meta-analyses have identified these regions as relevant for bvFTD and AD as well
(Dubois et al., 2007; Schroeter et al., 2008). On the other hand, results suggest
different diagnostic imaging criteria for FDG-PET than for MRI as has already been
proposed for bvFTD and AD (Dubois et al., 2007; Schroeter et al., 2014; Schroeter et
al., 2008). There was no overlap between the meta-analysis on nfvPPA across MRI
studies and the one across FDG-PET studies, which further supports this idea. Note
however, that this descriptive disjunction should be considered with caution as only
three FDG-PET studies had been included, and, accordingly, no method-specific
subtraction analysis could be conducted. There were no FDG-PET studies available
for lvPPA. Therefore, no conclusions can be drawn regarding potential differences for
FDG-PET and MRI in lvPPA. Future meta-analyses on nfvPPA and lvPPA across
FDG-PET studies (when more data are available) will show whether the disjunction
between hypometabolism and atrophy found in svPPA can be replicated in other
PPA variants.
2.5 Limitations
Results of the pilot meta-analysis on nfvPPA across FDG-PET studies and the
descriptive disjunction between atrophy and hypometabolism in nfvPPA are
considered to show trends based on the present state of knowledge, but should be
interpreted cautiously as only three FDG-PET studies were included. Also for the
meta-analysis on svPPA across FDG-PET studies and the meta-analysis on lvPPA,
the number of clusters might be increased by future additionally involved studies.
However, a previous ALE meta-analysis including MRI studies with svPPA and
nfvPPA identified comparable clusters (Schroeter et al., 2008), supporting generally
the stability and reliability of our findings. The clinical Neary criteria are not
completely interchangeable with the clinical Gorno-Tempini criteria (see
Supplementary Table A.3). Therefore, some of the patients diagnosed with nfvPPA
according to the Neary criteria may actually have suffered from lvPPA. However, as
in seven of the 11 MRI studies and in one of the three PET studies the authors
explicitly differentiated between both variants of PPA, this bias had, if ever, a minor
impact on our results. This assumption was confirmed by an analysis including only
the seven MRI studies on nfvPPA that explicitly excluded subjects with lvPPA. As the

2. Anatomical likelihood estimation meta-analyses on PPA
33
foci included in the ALE meta-analyses were reported by different research groups
using different statistical approaches and thresholds, the results might be influenced
by the methodological quality (e.g., sample size) of the single studies. This problem
is partly addressed in the ALE meta-analysis method by modeling results of studies
with smaller sample sizes by smaller Gaussian probability distributions than those of
studies reporting larger sample sizes (Eickhoff et al., 2009).
2.6 Conclusion
We used anatomical likelihood estimation meta-analyses to validate and refine the
new diagnostic imaging criteria for the different variants of PPA. As there was almost
no overlap between the meta-analyses on semantic variant PPA, nonfluent variant
PPA, and logopenic variant PPA across MRI studies, the new imaging criteria are
highly distinctive. Limbic regions, in particular the posterior midcingulate gyrus and
thalamus might play a larger role for logopenic variant PPA and semantic variant
PPA as has been assumed until now. Finally, our results on semantic variant PPA
suggest different diagnostic imaging criteria for FDG-PET than for MRI scans. Future
meta-analyses on nonfluent variant PPA and logopenic variant PPA across FDG-
PET studies will show whether this disjunction between hypometabolism and atrophy
also concerns the other variants of PPA.

3. Support vector machine classification in primary progressive aphasia
34
3 Predicting Primary Progressive Aphasia with
Support Vector Machine Approaches in
structural MRI data
3.1 Introduction
Primary progressive aphasia (PPA) is a neurodegenerative disease with insidious
onset mainly characterized by a language dysfunction that remains isolated for at
least two years without significant impairment in other cognitive domains (Gorno-
Tempini et al., 2011; Mesulam, 1982; Neary et al., 1998). PPA subsumes three
gradually progressive language disorders, namely semantic variant PPA (svPPA) or
semantic dementia, nonfluent/agrammatic variant PPA (nfvPPA) or progressive
nonfluent aphasia, and logopenic variant PPA (lvPPA) or logopenic progressive
aphasia (Gorno-Tempini et al., 2008; Gorno-Tempini et al., 2004; Gorno-Tempini et
al., 2011). SvPPA is mainly characterized by impairments in confrontation naming,
single-word comprehension, and object-knowledge, as well as surface dyslexia or
dysgraphia (Gorno-Tempini et al., 2011). The imaging supported diagnosis of svPPA
is given when patients additionally show atrophy and/or hypometabolism in the
anterior (ventral and lateral) temporal lobe. Patients suffering from nfvPPA show
predominantly agrammatism, effortful halting speech with inconsistent speech sound
errors and distortions (apraxia of speech), and impaired comprehension of
syntactically complex sentences. These language deficits are often associated with
atrophy or hypometabolism in left inferior frontal gyrus, insula, premotor, and
supplementary motor areas. LvPPA is characterized by impaired single-word retrieval
in spontaneous speech and naming as well as impaired repetition of sentences.
Patients suffering from lvPPA furthermore often show phonologic paraphasias in
spontaneous speech and naming. The imaging supported diagnosis of lvPPA is
given when patients additionally show atrophy and/or hypometabolism in left
posterior parietal, supramarginal, and angular gyri (Gorno-Tempini et al., 2011). The
suggested imaging criteria have recently been validated by comprehensive meta-
analyses (Bisenius et al., 2016).
3. Support vector machine classification in primary progressive aphasia
35
The prevalence of PPA is roughly estimated to range from 3-15/100,000 in the US
population (Grossman, 2010; Harvey et al., 2003; Ratnavalli et al., 2002). PPA is thus
a rare disease, which makes it very difficult for neurologists outside specialized
clinics to correctly recognize and differentiate between the three PPA variants in
routine hospital practice (e.g., Wilson et al., 2009). Given that the current imaging
criteria are only supportive for the diagnosis of PPA, magnetic resonance imaging
(MRI) scans are often not included as standard in the clinical assessment of PPA, but
mainly used to exclude differential diagnoses (e.g., Wilson et al., 2009). It has been
shown for other types of dementia like for instance, AD that changes in atrophy as
visualized by MRI are an especially good biomarker for correct early diagnosis and
furthermore even predictive for individuals with mild cognitive impairment to decline
into AD (e.g., Frisoni et al., 2010; McEvoy and Brewer, 2010; Schroeter et al., 2009;
Weiner et al., 2010). Therefore, it might be highly interesting to investigate whether
MRI scans have a similar predictive value for the correct early diagnosis of PPA and
to investigate which brain regions contribute the most to the classification of its three
variants.
On the one hand, it seems plausible that brain regions proposed in the current
diagnostic imaging criteria and based on a large range of imaging studies (Bisenius
et al., 2016; Gorno-Tempini et al., 2011) enable the correct diagnosis of the three
PPA variants. On the other hand, most of the current imaging studies report
comparisons of the three variants of PPA with age-matched healthy controls at a
group-level and it has been critically discussed that statistical differences at group
level might not necessarily reveal the most important regions to correctly diagnose
individual cases (Davatzikos et al., 2008a; Davatzikos et al., 2008b; Wilson et al.,
2009). Therefore, it might advance our knowledge in this field crucially to investigate
whether brain regions contributing the most to the correct diagnosis of the three PPA
variants indeed correspond to regions that are especially atrophied in these three
variants. Moreover, it might be highly interesting to explore whether disease-specific
regions of interest (ROIs) in comparison with whole brain approaches even enhance
the predictive power of MRI scans for the correct PPA classification.
To address these issues, we investigated here atrophy, namely changes in grey
matter density, with voxel-based morphometry (VBM) in patients suffering from one

3. Support vector machine classification in primary progressive aphasia
36
of the PPA variants in comparison with healthy controls as well as by comparing
patients with different PPA variants at a group level. Subsequently, we used linear
support vector machine (SVM) classification of the individual grey matter density
maps to investigate their discriminative or predictive power for the correct
classification of single subjects as belonging to one of the PPA variants or healthy
controls. A number of recent studies have used similar pattern classification methods
to classify patients with AD, FTD, and mild cognitive impairment (Davatzikos et al.,
2008a; Davatzikos et al., 2008b; Dukart et al., 2013; Dukart et al., 2011; Fan et al.,
2008; Klöppel et al., 2008b; Lerch et al., 2008; Misra et al., 2009; Teipel et al., 2007;
Vemuri et al., 2008). Wilson and colleagues (2009) investigated the utility of structural
MRI scans for SVM classification in PPA variants in a single center study. Here, we
investigated patients included in the multi-center study of the German consortium for
frontotemporal lobar degeneration (FTLD; Otto et al., 2011) to replicate and
generalize previously reported results, where the multi-center design is a
precondition for application in clinical routine in the future. Additionally, we compared
a whole-brain approach to a disease-specific ROI approach based on comprehensive
anatomical likelihood estimation meta-analyses on the three variants of PPA
(Bisenius et al., 2016). These ROIs represent the prototypical networks consistently
affected in the three variants of PPA across MRI studies reporting group-level
statistics. Note that these ROIs are based on a totally different cohort avoiding
circularity. In order to better understand possible differences between the whole brain
and the regions-of-interest approach, we furthermore computed and visualized the
voxels that contributed the most to the SVM classification in the whole brain
approach. To reveal whether the brain regions that contributed the most to the SVM
classification in the whole brain approach corresponded to the regions that were
especially atrophic in the three PPA variants, we also report pairwise group-level
comparisons of grey matter probability maps between patients and healthy controls,
respectively between PPA variants. For the pairwise group-level comparisons, we
hypothesized that, according to the current imaging criteria and previously published
VBM studies, atrophy is focused to left fronto-insular regions in nfvPPA, to the
(mainly left) anterior temporal lobe in svPPA, and to the (predominantly left) posterior
perisylvian or parietal cortex in lvPPA (e.g., Bisenius et al., 2016; Desgranges et al.,

3. Support vector machine classification in primary progressive aphasia
37
2007; Gorno-Tempini et al., 2011; Grossman et al., 2004; Mummery et al., 2000).
Furthermore, we hypothesized that the same brain regions would mainly contribute to
the correct SVM classification in PPA variants and healthy controls and that disease-
specific ROI approaches would reveal a higher predictive power for the SVM
classification than whole-brain approaches.
3.2 Materials and methods
3.2.1 Subjects
Patients and healthy controls were recruited within seven centers (located in Ulm,
Munich, Leipzig, Homburg, Erlangen, Bonn, and Goettingen) of the German
consortium for FTLD (http://www.ftld.de). All subjects gave written consent. The
research protocol was in accordance with the latest version of the Declaration of
Helsinki and approved by the universities’ ethics committees. For each center, the
clinical evaluation and the assessment of the MRI scans were done on site according
to standard operating procedures. That is, all of these centers used the same study
protocol (diagnostic criteria, demographic, neuropsychological and language
assessment, and scanning parameters), except for one center, where different
scanning parameters were used (see section 2.2). The diagnosis of PPA required
progressive deterioration of speech and that the main deficits were restricted to
speech and language for at least two years. Patients were diagnosed more
specifically with nfvPPA, svPPA, or lvPPA according to the newest diagnostic criteria
(Gorno-Tempini et al., 2011). Note that data from the patient’s first visit in the multi-
centric FTLD consortium’s study was included guaranteeing the relevance of our
results for early diagnosis of PPA syndromes. None of the patients included in this
study had any comorbid psychiatric or neurodegenerative disease. The degree of
clinical impairment of the patients was assessed using the Clinical Dementia Rating
scale (CDR) and the FTLD-modified Clinical Dementia Rating scale (FTLD-CDR). We
compared 44 right-handed patients suffering from a variant of PPA (16 nfvPPA, 17
svPPA, and 11 lvPPA) with 20 right-handed healthy controls. We report all possible
pairwise comparisons between PPA variants. Subjects from the larger group of a
given group comparison were matched as closely as possible to the smaller group for
1) number, 2) scanning parameter, 3) age, and where possible 4) gender.
3. Support vector machine classification in primary progressive aphasia
38
3.2.2 Image acquisition
All structural images were acquired on Siemens Magnetom 3T scanners (2xVerio,
2xSkyra, 2xTrio, 1xAllegra, Erlangen, Germany). 47 T1-weighted images (12 svPPA,
11 nfvPPA, ten lvPPA, 14 healthy controls) were acquired using a magnetization
prepared rapid gradient echo sequence with a matrix=240x256x176,
resolution=1x1x1 mm, field of view=240 mm, repetition time=2300 ms, echo
time=2.98 ms, inversion time=900 ms, and flip angle=9°. For 17 subjects (five
nfvPPA, five svPPA, one lvPPA, six healthy controls), T1-weighted images were
acquired using a magnetization prepared rapid gradient echo sequence with a
matrix=208x256x256, resolution=1x1x1 mm, field of view=256 mm, repetition
time=2200 ms, echo time=4.38 ms, inversion time=1200 ms, and flip angle=8°. The
distribution of the two sequences (scanning parameters) did not differ significantly,
neither between patient groups nor between patient groups and healthy control
groups (see Table 4). The very first MRI scans that were assessed as soon as the
subjects were enrolled in the study, were used for analyses.
3.2.3 Data analysis
3.2.3.1 Clinical characteristics
We used SPSS version 22 (IBM Corporation, Armonk, NY) to compute descriptive
group scores (mean and standard deviation) for the overall patient and healthy
control groups as well as for the respective subsets after matching for sample size,
age, gender, and scanning parameters. Group comparisons for age, disease
duration, education, and total grey matter density between all patient and healthy
control groups as well as between PPA variants were performed using one-way
ANOVAs, Kruskal-Wallis tests, and post-hoc t-tests in SPSS. Group comparisons for
demographic and clinical characteristics between the matched subsets were
performed using independent t tests (normally distributed data) and Mann-Whitney U
tests (not normally distributed data) in SPSS. Group comparisons for gender and
scanning parameter were done using chi-square tests in SPSS.

3. Support vector machine classification in primary progressive aphasia
39
3.2.3.2 Voxel-based morphometry
Images were processed with the VBM toolbox (http://dbm.neuro.uni-jena.de/vbm/) in
SPM 8 (Wellcome Department of Imaging Neuroscience, London, UK;
http://www.fil.ion.ucl.ac.uk/spm/software/spm8/) running in a MATLAB 8.5
environment (Mathworks, Inc., Sherbon, MA, USA) using the default parameters. MRI
images were segmented into grey matter, white matter, and cerebrospinal fluid using
the unified segmentation module (Ashburner and Friston, 2005) and normalized to
the standard Montreal Neurological Institute template including affine and non-linear
modulation to account for local compression and expansion during transformation.
The normalized segmented grey matter density maps were smoothed with a
Gaussian kernel of 8 mm full-width-at-half-maximum. The group comparisons
between the three variants of PPA and healthy controls as well as between PPA
variants were performed in FSL (FMRIB Analysis Group, Oxford University, UK.,
http://fsl.fmrib.ox.ac.uk/fsl/fslwiki/FSL) using permutation-based non-parametric
testing (5000 permutations) with the Threshold-Free Cluster Enhancement (TFCE)
method (Smith and Nichols, 2009; Winkler et al., 2014). Age, gender, and total grey
matter were entered as covariates in the general linear model and results are
reported at a family-wise error (FWE) corrected p < 0.05.
SVM classification (Vapnik, 1995; Vapnik, 1998) was performed using libsvm version
3.18 (Chang and Lin, 2001; https://www.csie.ntu.edu.tw/~cjlin/libsvm) in a MATLAB
8.5 environment (Mathworks, Inc., Sherbon, MA, USA). Analyses were done using a
linear kernel and the default solver C-SVC with C=1. In the training step, SVM
assigns a weight to the scan of each subject which indicates its importance for the
discrimination between groups. This weight is multiplied by a label vector which
indicates the group of the scan (e.g., patient or healthy control). The cross-validation
of the trained SVM was performed using the leave-one (subject)-out method. This
procedure iteratively leaves-out the information of one subject of each group and
trains the model on the remaining subjects for subsequent class assignment of the
respective subject that was not included in the training procedure. This validation
method allows the generalization of the trained SVM to data that have not been
presented to the SVM algorithm previously and avoids the danger of inflating
accuracies

3. Support vector machine classification in primary progressive aphasia
40
In the whole brain approach, we included all voxels that had a probability for grey
matter higher than 0.2 (because voxels lying between white matter and ventricular
cerebrospinal fluid tend to be misclassified as grey matter (e.g., Ashburner and
Friston, 2000; Dukart et al., 2011). In the ROI approach, we used the results from a
recently published anatomical likelihood estimation meta-analysis on the three
variants of PPA (p < 0.05 false discovery rate corrected) across MRI studies as a
prototypical disease-specific template (Bisenius et al., 2016). The original meta-
analytic clusters were coregistered to the Montreal Neurological Institute template of
the VBM results using SPM 8 and dilated by two voxels using the 3 D dilation
function implemented in the WFU PickAtlas (Maldjian,
http://www.nitrc.org/projects/wfu_pickatlas). Non-parametric statistical comparisons
were calculated between the performance (as indicated by the area under the
receiver operating characteristic curve, AUC) of the ROI approach and the whole
brain approach for all pairwise comparisons at p<0.05 in StAR (Vergara et al., 2008;
www.melolab.org/star/home.php). In order to determine and visualize the importance
of each voxel for the discrimination between groups in the whole brain approach, we
multiplied each grey matter probability map (containing only voxels where p > 0.2) by
the product of weight and label and summed on a voxel basis (Klöppel et al., 2008b).
3.3 Results
3.3.1 Demographic and clinical characteristics
The demographic and clinical characteristics of the overall patient and healthy control
groups are shown in Table 1. The patient and healthy control groups did not differ
significantly from each other in age, education, or disease duration. The patient and
healthy control groups differed however significantly in total grey matter density
(F(3,63)=4.06, p=0.01) with svPPA and lvPPA showing lower values than healthy
controls. The three PPA variants did not differ significantly from each other in age,
education, disease duration, or total grey matter density.
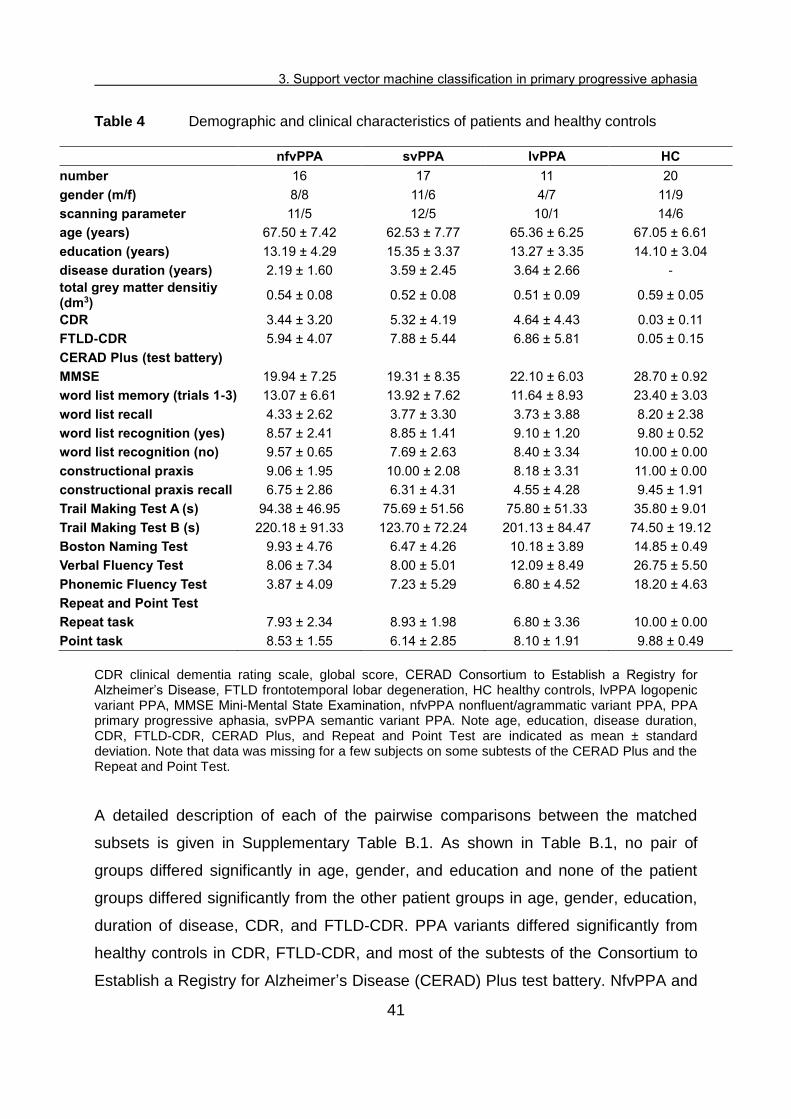
3. Support vector machine classification in primary progressive aphasia
41
Table 4 Demographic and clinical characteristics of patients and healthy controls
nfvPPA svPPA lvPPA HC
number 16 17 11 20
gender (m/f) 8/8 11/6 4/7 11/9
scanning parameter 11/5 12/5 10/1 14/6
age (years) 67.50 ± 7.42 62.53 ± 7.77 65.36 ± 6.25 67.05 ± 6.61
education (years) 13.19 ± 4.29 15.35 ± 3.37 13.27 ± 3.35 14.10 ± 3.04
disease duration (years) 2.19 ± 1.60 3.59 ± 2.45 3.64 ± 2.66 -
total grey matter densitiy (dm3)
0.54 ± 0.08 0.52 ± 0.08 0.51 ± 0.09 0.59 ± 0.05
CDR 3.44 ± 3.20 5.32 ± 4.19 4.64 ± 4.43 0.03 ± 0.11
FTLD-CDR 5.94 ± 4.07 7.88 ± 5.44 6.86 ± 5.81 0.05 ± 0.15
CERAD Plus (test battery)
MMSE 19.94 ± 7.25 19.31 ± 8.35 22.10 ± 6.03 28.70 ± 0.92
word list memory (trials 1-3) 13.07 ± 6.61 13.92 ± 7.62 11.64 ± 8.93 23.40 ± 3.03
word list recall 4.33 ± 2.62 3.77 ± 3.30 3.73 ± 3.88 8.20 ± 2.38
word list recognition (yes) 8.57 ± 2.41 8.85 ± 1.41 9.10 ± 1.20 9.80 ± 0.52
word list recognition (no) 9.57 ± 0.65 7.69 ± 2.63 8.40 ± 3.34 10.00 ± 0.00
constructional praxis 9.06 ± 1.95 10.00 ± 2.08 8.18 ± 3.31 11.00 ± 0.00
constructional praxis recall 6.75 ± 2.86 6.31 ± 4.31 4.55 ± 4.28 9.45 ± 1.91
Trail Making Test A (s) 94.38 ± 46.95 75.69 ± 51.56 75.80 ± 51.33 35.80 ± 9.01
Trail Making Test B (s) 220.18 ± 91.33 123.70 ± 72.24 201.13 ± 84.47 74.50 ± 19.12
Boston Naming Test 9.93 ± 4.76 6.47 ± 4.26 10.18 ± 3.89 14.85 ± 0.49
Verbal Fluency Test 8.06 ± 7.34 8.00 ± 5.01 12.09 ± 8.49 26.75 ± 5.50
Phonemic Fluency Test 3.87 ± 4.09 7.23 ± 5.29 6.80 ± 4.52 18.20 ± 4.63
Repeat and Point Test
Repeat task 7.93 ± 2.34 8.93 ± 1.98 6.80 ± 3.36 10.00 ± 0.00
Point task 8.53 ± 1.55 6.14 ± 2.85 8.10 ± 1.91 9.88 ± 0.49
CDR clinical dementia rating scale, global score, CERAD Consortium to Establish a Registry for Alzheimer’s Disease, FTLD frontotemporal lobar degeneration, HC healthy controls, lvPPA logopenic variant PPA, MMSE Mini-Mental State Examination, nfvPPA nonfluent/agrammatic variant PPA, PPA primary progressive aphasia, svPPA semantic variant PPA. Note age, education, disease duration, CDR, FTLD-CDR, CERAD Plus, and Repeat and Point Test are indicated as mean ± standard deviation. Note that data was missing for a few subjects on some subtests of the CERAD Plus and the Repeat and Point Test.
A detailed description of each of the pairwise comparisons between the matched
subsets is given in Supplementary Table B.1. As shown in Table B.1, no pair of
groups differed significantly in age, gender, and education and none of the patient
groups differed significantly from the other patient groups in age, gender, education,
duration of disease, CDR, and FTLD-CDR. PPA variants differed significantly from
healthy controls in CDR, FTLD-CDR, and most of the subtests of the Consortium to
Establish a Registry for Alzheimer’s Disease (CERAD) Plus test battery. NfvPPA and

3. Support vector machine classification in primary progressive aphasia
42
svPPA additionally differed significantly from healthy controls in the Repeat and Point
Test. In the pairwise comparisons between PPA variants, svPPA showed a
significantly lower test score in the Point task than nfvPPA and a significantly higher
test score in the Repeat task than lvPPA (see Supplementary Table B.1).
3.3.2 Voxel-based morphometry results
Significant results of the statistical comparison between grey matter density maps of
healthy controls and patients are shown in red (nfvPPA), light green (svPPA), and
blue (lvPPA) color in Figures 6-8 on the top left (for more details, see Supplementary
Table B.2). All results are reported at an FEW corrected significance level of p <
0.05. The results of the statistical comparison between grey matter density maps of
svPPA and nfvPPA are shown in Figure 9 on the top left (svPPA < nfvPPA in light
green color, nfvPPA < svPPA in red color). The results for the statistical comparison
between lvPPA and svPPA are shown in Figure 10 on the top left (svPPA < lvPPA in
light green color, lvPPA < svPPA no significant results at p < 0.05). There were no
significant results for the comparison between lvPPA and nfvPPA at a FEW corrected
significance level of p < 0.05 (therefore not shown). More details on the pairwise
comparisons between PPA variants are given in Supplementary Table B.2.
3.3.3 Support vector machine classification results
SVM classification was applied separately to each group comparison: 1) nfvPPA vs.
healthy controls, 2) svPPA vs. healthy controls, 3) lvPPA vs. healthy controls, and 4)
svPPA vs. nfvPPA. The reported accuracy is the percentage of subjects correctly
assigned to the clinical diagnosis (patient/healthy control or svPPA/nfvPPA).
Sensitivity refers to the proportion of patients correctly classified as patients and
specificity to the proportion of healthy controls correctly classified as healthy controls.
Positive predictive value refers to the number of correctly classified patients out of all
subjects classified as patients and negative predictive value refers to the number of
correctly classified healthy controls out of all subjects classified as healthy controls.

3. Support vector machine classification in primary progressive aphasia
43
3.3.3.1 Group comparisons between patients and healthy controls
Figure 6: Voxel-based morphometry and support vector machine classification results for nonfluent/agrammatic variant PPA as compared to healthy controls. Top left: voxel-based morphometry (VBM) results for the comparison between nonfluent/agrammatic variant PPA (nfvPPA) and healthy controls (HC) (family-wise error corrected p < 0.05). Bottom left: Regions of interest (ROIs) based on independent meta-analyses. Right: Results of support vector machine classification (SVM) classification. Top: Regions most relevant for classification as patients in yellow, HC in light green. Note that the scale of the distance weights has no applicable units. Bottom: Sensitivity, specificity, and accuracy for the ROI approach and the whole brain approach in SVM classification.
The accuracy for the classification between different variants and healthy controls
using the leave-one-out approach ranged from 91 to 97 % for the whole brain
approach and from 82 to 100 % for the ROI approach. Details on the respective
sensitivity, specificity, and accuracy are given in Figures 6-8 on the bottom right and
details on positive and negative predictive values are shown in Supplementary Table
B.3. The results of the SVM classification between patients and healthy controls for
the whole brain approach are shown on the top right of Figures 6-8. Here, values
range between -1 and 0 or 0 and 1 and reflect the relative importance of these voxels
in the discrimination between both groups. Voxels that contributed the most to the
classification of subjects as patients (i.e., had a higher negative value) are depicted in
yellow and the voxels that contributed the most to the classification of subjects as
healthy controls (i.e., had a higher positive value) are shown in light green. A value

3. Support vector machine classification in primary progressive aphasia
44
near 0 indicates that this voxel was neither indicative for the classification as patient
nor as healthy control.
Brain regions that contributed the most to the classification of subjects as nfvPPA vs.
control subjects (Figure 6 on the top right) encompass bilaterally cerebellum, inferior,
middle, and superior temporal gyri, middle occipital gyrus, parahippocampal gyrus,
crus cerebri, thalamus, precuneus, inferior and superior frontal gyri, as well as in the
left hemisphere orbital gyrus, insula, pre- and postcentral gyri, middle frontal gyrus,
and angular gyrus. Classification accuracy was 91 % for the whole brain approach
and 84 % for the ROI approach. The statistical comparison between both approaches
revealed high AUC values, but without significant differences (AUCROI=0.90, AUCwhole
brain=0.94, p=0.48).
Figure 7: Voxel-based morphometry and support vector machine classification results for semantic variant PPA as compared to healthy controls. Top left: voxel-based morphometry (VBM) results for the comparison between semantic variant PPA (svPPA) and healthy controls (HC) (family-wise error corrected p < 0.05). Bottom left: Regions of interest (ROIs) based on independent meta-analyses. Right: Results of support vector machine (SVM) classification. Top: Regions most relevant for classification as patients in yellow, HC in light green. Note that the scale of the distance weights has no applicable units. Bottom: Sensitivity, specificity, and accuracy for the ROI approach and the whole brain approach in SVM classification.
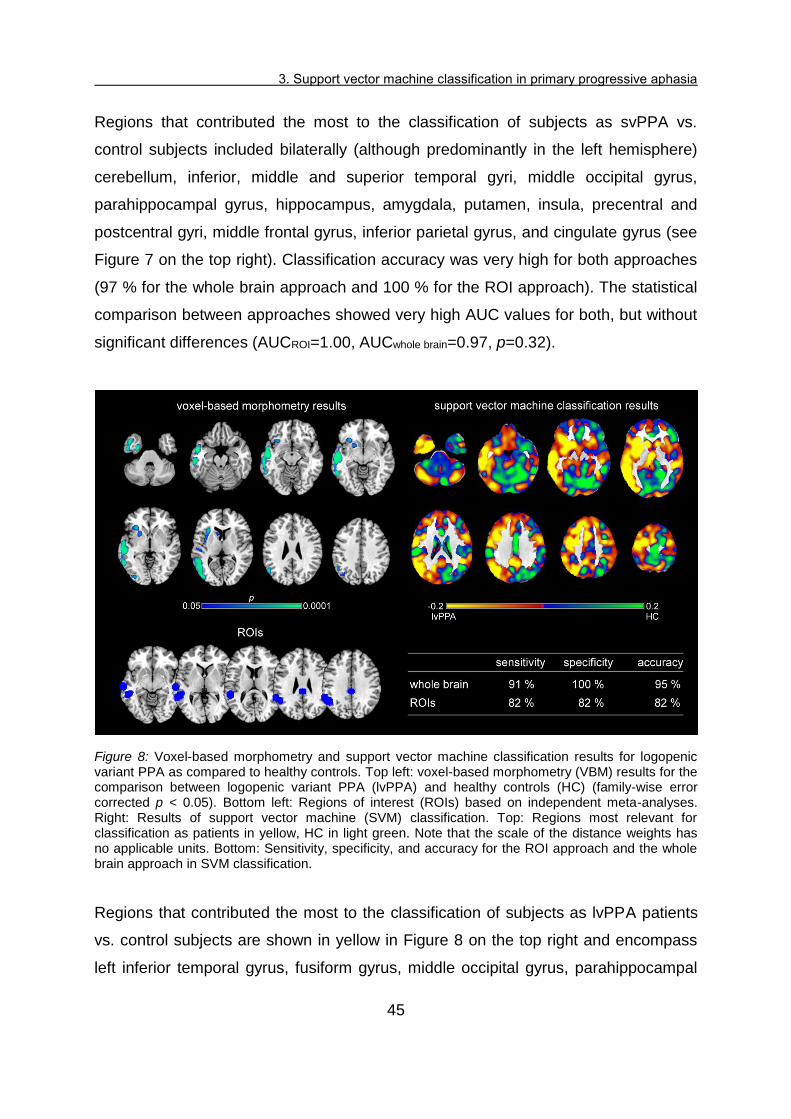
3. Support vector machine classification in primary progressive aphasia
45
Regions that contributed the most to the classification of subjects as svPPA vs.
control subjects included bilaterally (although predominantly in the left hemisphere)
cerebellum, inferior, middle and superior temporal gyri, middle occipital gyrus,
parahippocampal gyrus, hippocampus, amygdala, putamen, insula, precentral and
postcentral gyri, middle frontal gyrus, inferior parietal gyrus, and cingulate gyrus (see
Figure 7 on the top right). Classification accuracy was very high for both approaches
(97 % for the whole brain approach and 100 % for the ROI approach). The statistical
comparison between approaches showed very high AUC values for both, but without
significant differences (AUCROI=1.00, AUCwhole brain=0.97, p=0.32).
Figure 8: Voxel-based morphometry and support vector machine classification results for logopenic variant PPA as compared to healthy controls. Top left: voxel-based morphometry (VBM) results for the comparison between logopenic variant PPA (lvPPA) and healthy controls (HC) (family-wise error corrected p < 0.05). Bottom left: Regions of interest (ROIs) based on independent meta-analyses. Right: Results of support vector machine (SVM) classification. Top: Regions most relevant for classification as patients in yellow, HC in light green. Note that the scale of the distance weights has no applicable units. Bottom: Sensitivity, specificity, and accuracy for the ROI approach and the whole brain approach in SVM classification.
Regions that contributed the most to the classification of subjects as lvPPA patients
vs. control subjects are shown in yellow in Figure 8 on the top right and encompass
left inferior temporal gyrus, fusiform gyrus, middle occipital gyrus, parahippocampal

3. Support vector machine classification in primary progressive aphasia
46
gyrus, hippocampus, putamen, insula, thalamus, precentral gyrus, middle and
superior frontal gyri, angular gyrus, supramarginal gyrus, and cingulate gyrus as well
as bilaterally cerebellum, middle and superior temporal gyri, caudate nucleus,
thalamus, middle and superior frontal gyri, precuneus, and superior parietal gyrus.
Classification accuracy was high for both, the whole brain approach (95 %) and the
ROI approach (82 %). The statistical comparison between both approaches did show
high AUC values without significant differences (AUCROI=0.91, AUCwhole brain=0.95,
p=0.38).
3.3.3.2 Group comparisons between PPA variants
Figure 9 illustrates on top right in yellow the regions that contributed the most to the
classification as svPPA and in green the regions that contributed the most to the
classification as nfvPPA. Here, sensitivity refers to the ratio of correctly classified
svPPA patients and specificity to the ratio of correctly classified nfvPPA patients.
Details on positive and negative predictive values are given in Supplementary Table
B.3. The regions that contributed the most to the classification of a subject as svPPA
included bilaterally cerebellum, inferior, middle and superior temporal gyri, middle
occipital gyrus, fusiform gyrus, parahippocampal gyrus, hippocampus, putamen,
insula, cuneus, precuneus, inferior frontal gyrus, superior parietal gyrus, cingulate
gyrus, and left precentral gyrus. Regions that contributed the most to the
classification of nfvPPA included bilateral cerebellum, middle and superior occipital
gyrus, superior temporal gyrus, gyrus rectus, posterior orbital gyrus, caudate nuclei,
thalamus, inferior, middle, and superior frontal gyrus, precentral gyrus, postcentral
gyrus, inferior parietal gyrus, angular gyrus, supramarginal gyrus, right precuneus,
right superior parietal gyrus, and right cingulate gyrus. Classification accuracy was
78 % for both, the whole brain and the ROI approach. Both approaches revealed
high AUC values without significant differences between them (AUCROI=0.87,
AUCwhole brain=0.88, p= 0.72).

3. Support vector machine classification in primary progressive aphasia
47
Figure 9: Support vector machine classification results for the comparison and discrimination between semantic variant PPA and nonfluent/agrammatic variant PPA. Top left: VBM results for the comparison between semantic variant PPA (svPPA) and nonfluent/agrammatic variant PPA (nfvPPA) (svPPA<nfvPPA green, nfvPPA<svPPA red, family-wise error corrected p < 0.05). Bottom left: Regions of interest (ROIs) based on independent meta-analyses. Right: Results of support vector machine (SVM) classification. Top: Regions most relevant for classification as svPPA in yellow, nfvPPA in light green. Note that the scale of the distance weights has no applicable units. Bottom: Sensitivity, specificity, and accuracy for the ROI approach and the whole brain approach in SVM classification.
Figure 10 illustrates on top right in yellow the regions that contributed the most to the
classification as lvPPA and in green the regions that contributed the most to the
classification as svPPA. Sensitivity refers to the ratio of correctly classified lvPPA
patients and specificity to the ratio of correctly classified svPPA patients. Positive and
negative predictive values are given in Supplementary Table B.3. The regions that
contributed the most to the classification of a subject as lvPPA included bilateral
cerebellum, middle occipital gyrus, middle and superior temporal gyri, caudate nuclei,
thalamus, superior frontal gyrus, supramarginal gyrus, angular gyrus, precuneus,
cingulate gyrus, right lateral orbital gyrus, inferior and middle frontal gyrus, and
superior parietal gyrus. Regions that contributed the most to the classification of
svPPA included bilateral cerebellum, inferior, middle, and superior temporal gyrus,
parahippocampal gyrus, hippocampus, insula, and right putamen. Classification
accuracy was 95 % for both, the whole brain and the ROI approach. Both

3. Support vector machine classification in primary progressive aphasia
48
approaches reached high AUC values without significant differences between them
(AUCROI=0.91, AUCwhole brain=0.93, p=0.41).
Figure 10: Support vector machine classification results for the comparison and discrimination between logopenic variant PPA and semantic variant PPA. Top left: VBM results for the comparison between logopenic variant PPA (lvPPA) and semantic variant PPA (svPPA) (svPPA<lvPPA family-wise error corrected p < 0.05). Bottom left: Regions of interest (ROIs) based on independent meta-analyses. Right: Results of support vector machine (SVM) classification. Top: Regions most relevant for classification as lvPPA in yellow, svPPA in light green. Note that the scale of the distance weights has no applicable units. Bottom: Sensitivity, specificity, and accuracy for the ROI approach and the whole brain approach in SVM classification.
Figure 11 illustrates on top in yellow the regions that contributed the most to the
classification as lvPPA and in green the regions that contributed the most to the
classification as nfvPPA. Sensitivity refers to the ratio of correctly classified lvPPA
patients and specificity to the ratio of correctly classified nfvPPA patients. For details
on positive and negative predictive values see Supplementary Table B.3. The
regions that contributed the most to the classification of a subject as lvPPA included
bilateral cerebellum, inferior, middle occipital gyrus, middle and superior temporal
gyri, thalamus, putamen, middle and superior frontal gyrus, supramarginal gyrus,
angular gyrus, precentral gyrus, cingulate gyrus, precuneus, superior parietal gyrus.
Regions that contributed the most to the classification of nfvPPA included right
inferior temporal gyrus, bilateral middle and superior temporal gyri, gyrus rectus,

3. Support vector machine classification in primary progressive aphasia
49
lateral orbital gyrus, insula, caudate nuclei, cuneus, cingulate gyrus, middle and
superior frontal gyri, postcentral gyrus, supramarginal gyrus, and superior parietal
gyrus. Classification accuracy was low with 55 % for the whole brain approach and
higher with 64 % for the ROI approach. AUC values were comparable, namely higher
for the ROI than the whole brain approach, but without significant differences
between them (AUCROI=0.64, AUCwhole brain=0.59, p=0.50).
Figure 11: Support vector machine classification results for the discrimination between logopenic variant PPA and nonfluent/agrammatic variant PPA. Top: Regions most relevant for support vector machine classification as logopenic variant PPA (lvPPA) in yellow, nonfluent/agrammatic variant PPA (nfvPPA) in light green. Note that the scale of the distance weights has no applicable units. VBM results are not shown for the group comparisons, because no significant results were obtained. Middle: Sensitivity, specificity, and accuracy for the ROI approach and the whole brain approach in SVM classification. Bottom Regions of interest (ROIs) based on independent meta-analyses.
3.4 Discussion
To our knowledge, this is the first study demonstrating that SVM classification in
multi-center MRI data can be used to diagnose and dissociate PPA subtypes, where
the multi-center design is a precondition for application in clinical routine in the future.
Moreover, we compare a whole brain vs. data-driven disease-specific ROI approach
for SVM classification. We used ROIs reported in a recent comprehensive meta-
analysis on PPA (Bisenius et al., 2016). In order to reveal whether the regions that
contributed the most to the whole brain SVM classification of the three variants of
PPA corresponded to the regions that were especially atrophic in the respective

3. Support vector machine classification in primary progressive aphasia
50
variant, we additionally conducted statistical group-level comparisons between
patient groups and healthy control groups. In the following, we are going to introduce
the results of these group-level comparisons, before we discuss in more detail the
results of the SVM classification for the whole brain approach and the ROI approach
as well as possible further implications.
3.4.1 Atrophy in the different variants of primary progressive aphasia
The group comparisons in our study revealed regional brain atrophy that included the
disease-specific brain areas identified in comprehensive systematic and quantitative
meta-analyses across imaging studies from the literature, if one compares this data
for each PPA variant (see left top and bottom images in Figures 6-8). Beyond that our
group-level comparisons are in line with studies showing that, with the progression of
the disease, the atrophic networks in the three subtypes of PPA partly converge (e.g.,
Gorno-Tempini et al., 2011; Rogalski et al., 2011). Mild and early svPPA has been
shown to involve atrophy in (predominantly left) anterior temporal lobe, with extension
to the adjacent temporoparietal junction, hippocampus and amygdala and posterior
orbital cortex as well as in the right anterior temporal lobe (Czarnecki et al., 2008;
Grossman, 2010 Krueger et al., 2010; Mesulam et al., 2012; Rohrer et al., 2008) and
to progress bilaterally into posterior and superior temporal lobe, left temporoparietal
junction, bilateral cingulate cortex and orbitofrontal gyri, left superior orbitofrontal
gyrus, left inferior and superior frontal gyri (e.g., Grossman, 2010; Kumfor et al.,
2016; Rogalski et al., 2011). Early and mild stages of nfvPPA, on the other hand,
have been shown to be characterized by atrophy in left inferior frontal gyrus,
temporoparietal junction, anterior superior temporal gyrus, posterior middle frontal
gyrus and precentral gyrus (Mesulam et al., 2012) and to progress into left anterior
temporal lobe, orbital cortex, dorsolateral prefrontal cortex, anterior cingulate cortex,
and along the perisylvian fissure into the parietal lobe (e.g., Grossman 2010;
Rogalski et al., 2011). For lvPPA, atrophy has been shown to progress from
(predominantly left) posterior superior temporal cortex, inferior parietal cortex,
posterior cingulate cortex and medial temporal cortex into the anterior and lateral
temporal cortex, caudate nucleus, insula, inferior frontal gyrus and dorsal frontal

3. Support vector machine classification in primary progressive aphasia
51
cortex as well as into the temporo-parietal junction, posterior cingulate and
precuneus of the right hemisphere. (e.g., Rogalski et al., 2011; Rohrer et al., 2013).
3.4.2 Support vector machine classification is a useful tool to differentiate
between healthy controls and primary progressive aphasia variants
Accuracies for the whole brain approach in SVM classification between patients and
healthy controls ranged from 91 % for nfvPPA over 95 % for lvPPA to 97 % for
svPPA. The between-subtype whole brain SVM classification enabled high accuracy
of 78 and 95 % for the discrimination between svPPA vs. nfvPPA and svPPA vs.
lvPPA variant. Only for the discrimination between nfvPPA and lvPPA variants
accuracy was low with 55 %. These numbers are in line with previously reported
accuracies ranging from 58-100 % in studies on neurodegenerative diseases like AD
(e.g., (e.g., Chetelat and Baron, 2003; Davatzikos et al., 2008b; Dukart et al., 2013;
Dukart et al., 2011; Klöppel et al., 2008b; Lerch et al., 2008; Teipel et al., 2007;
Vemuri et al., 2008), mild cognitive impairment (e.g., Davatzikos et al., 2008a; Teipel
et al., 2007), FTD (e.g., Davatzikos et al., 2008b; Dukart et al., 2011; Klöppel et al.,
2008a), and PPA (Wilson et al., 2009; Zhang et al., 2013).
Until now, there has only been one study investigating the three variants of PPA with
SVM classification (Wilson et al., 2009). These authors performed a principal
component analysis on MRI scans from one study center and subsequently used the
results for the pairwise SVM classification between patients and healthy controls as
well as between the three patient groups. Wilson et al. (2009) found an accuracy of
100 % for the discrimination between svPPA patients and healthy controls, 100 % for
the classification between lvPPA patients and healthy controls, and an accuracy of
89 % for the discrimination between nfvPPA and healthy controls. These authors
report an accuracy of 89 % for the discrimination between svPPA and nfvPPA
patients, 93.8 % for svPPA vs. lvPPA, and 81.3 % for lvPPA vs. nfvPPA. Our SVM
results using the whole brain approach on grey matter density maps in the multi-
center cohort of the FTLD consortium are thus comparable with the results of Wilson
et al. (2009) with regard to the classification between patients and healthy controls
showing higher accuracies for svPPA and lvPPA than for nfvPPA and the
3. Support vector machine classification in primary progressive aphasia
52
classification between lvPPA and nfvPPA showing a lower classification accuracy
than the other classifications between PPA variants.
Additionally, we performed group-level comparisons on the grey matter density maps
between patients and healthy controls as well as between PPA variants in order to
investigate whether the regions that contributed the most to the SVM classification of
patients also corresponded to the regions mostly atrophied in these patients. Figures
7 and 8 show that brain regions that were most consistently atrophied in svPPA and
lvPPA indeed also contributed the most to the SVM classification of these patients.
For nfvPPA, on the other hand, brain regions that contributed the most to the SVM
classification as patients were not constrained to the regions that were atrophied in
our nfvPPA patients, but also encompassed very similar regions in the contralateral
(right) hemisphere (see Figure 6). A possible explanation for the importance of the
additional brain regions in the right hemisphere might be that they were affected to a
lesser extent (and thus not significant in the group-level comparison) and that SVM
classification as a more sensitive method already took into account early atrophy in
these regions. There is a general consensus that the results of group-level statistics
might not be applicable to individual scans, because their sensitivity and specificity at
early stages of brain pathology is insufficient for the prediction of the status of
individual scans (Davatzikos et al., 2008b; Fan et al., 2008; Wilson et al., 2009).
Interestingly, for the discrimination between svPPA and nfvPPA, the regions that
contributed to the SVM classification as svPPA patients (see Figure 9 on the top),
corresponded to the regions that were most consistently atrophied in these patients
(see Figure 7 on the top left). The regions that contributed to the SVM classification
as nfvPPA, on the other hand, were (except for two characteristic regions in the
inferior and middle frontal gyri) rather spread. This might be due to the fact that the
group comparisons between patients and healthy controls showed for both, svPPA
and nfvPPA, significant atrophy in the superior temporal gyrus, parahippocampal
area, hippocampus, insula, and inferior frontal gyrus (see Figures 6 and 7 on the top
left). Although atrophy in the superior temporal gyrus, parahippocampal area, and
hippocampus have been discussed to be rather specific for svPPA, while insula, and
inferior frontal gyrus have been discussed to be rather characteristic for nfvPPA, it
has been shown in longitudinal studies that with the progression of the disease, the

3. Support vector machine classification in primary progressive aphasia
53
atrophic networks in the three variants of PPA partly converge (e.g., Gorno-Tempini
et al., 2011; Rogalski et al., 2011). Given that on the one hand several regions might
be affected similarly in nfvPPA and svPPA depending upon the current stage of the
respective disease and on the other hand structural MRI scans do not provide any
information regarding the temporal dynamic pattern of brain atrophy, the SVM
classification method, given its high sensitivity, might not always be able to perfectly
discriminate between these two variants. For both subtype-specific classifications,
svPPA vs. nfvPPA and svPPA vs. lvPPA, we reached a high classification accuracy,
although the number of patients was rather low for lvPPA and the respective
comparison. The high accuracy might be related to a relatively strong (in the sense of
high t-values) and regionally focused atrophy in svPPA. This is obvious in the group
comparisons revealing much higher atrophy in svPPA than nfvPPA or lvPPA,
whereas nfvPPA showed stronger atrophy only in a very small area and lvPPA did
not show any atrophy in comparison with svPPA. Note that disease duration and
severity did generally not significantly differ between PPA subtypes excluding these
factors as explanation for differences in classification accuracy.
As stated before the whole-brain SVM classification between nfvPPA and lvPPA
variants reached only a low accuracy. This might be related to relatively small and
rather distributed atrophy in these two PPA variants or to conceptual issues. In a
prospective data-driven study, Sajjadi et al. (2012) examined to which extent PPA
patients would be classifiable according to the revised clinical diagnostic criteria and
which linguistic impairments would cluster together (and thus form distinct
syndromes) using principal factor analysis. In this cohort, 58.7 % of the patients could
be assigned to one of the three variants of PPA proposed by Gorno-Tempini et al.
(2011), while 41.3 % of the patients were classified as mixed PPA because their
deficits either extended beyond a single PPA variant or they met the diagnostic
criteria for more than one variant. The principal factor analysis identified two clear
syndromes corresponding to the proposed syndromes of svPPA and nfvPPA as well
as a residual miscellany. Interestingly, impaired sentence repetition, which has been
proposed as a cardinal diagnostic feature for lvPPA, aligned with the factor
corresponding to nfvPPA. One might therefore speculate that low classification
accuracy between nfvPPA and lvPPA in imaging data might not only be related to the

3. Support vector machine classification in primary progressive aphasia
54
rather relatively small and distributed atrophy, but possibly also to problems in
clinically distinguishing both PPA syndromes.
3.4.3 Regions-of-interest approach or whole brain approach?
We compared the whole brain approach for SVM classification with an ROI approach
using ROIs from a recent meta-analysis on the three variants of PPA (Bisenius et al.,
2016). A similar approach has already been adopted by Dukart and colleagues who
compared the whole brain versus ROI approach for SVM classification between FTD
and AD as well as between these patient groups and healthy controls using structural
MRI and PET scans (Dukart et al., 2013; Dukart et al., 2011). These authors reported
that for MRI scans, the ROI approach was comparable to the whole brain approach
for the discrimination between patients and healthy controls, but had a lower
accuracy for the discrimination between patient groups (AD vs. FTD) (Dukart et al.,
2013; Dukart et al., 2011). In the current study, the ROI approach reached generally
a high accuracy in diagnosis and, at least mainly, differential diagnosis/classification
of PPA syndromes, comparable to the whole-brain approach. In detail, it showed a
higher accuracy as compared to healthy controls for svPPA patients and a slightly
lower accuracy for nfvPPA and lvPPA patients, while it showed a similar accuracy for
svPPA vs. nfvPPA and svPPA vs. lvPPA patients as compared to the whole brain
approach. Remarkably, for the lvPPA vs. nfvPPA comparison the ROI approach
showed a higher accuracy than the whole brain approach, may be due to the
diffusivity and similar strength (in the sense of t-values) of brain atrophy requiring
higher regional specificity for the analysis. One might speculate that ROI-based
classification might be given preference for special questions in differentiating
between syndromes in the future. Given however that none of these trends was
statistically significant, we consider both approaches as equally valid.
The visual comparison between the whole brain approach and the ROI approach
raises however the question about the optimal method to choose ROIs for SVM
classification in PPA. The optimal number of ROIs for SVM classification needs to be
such as to accurately capture all subtleties of the structural abnormality in these
patients and thus achieve a sufficient predictive accuracy without however reducing
predictive accuracy through the increase of noise that possibly accompanies

3. Support vector machine classification in primary progressive aphasia
55
additional ROIs that are less relevant to the classification. Selecting ROIs based on
group-level comparison between patients and healthy control groups might for
instance provide a higher discriminative power for the SVM classification in the same
study sample. These ROIs would however be biased to at least some extent by the
specific study sample and might therefore not necessarily lead to similar good results
in other study samples. Another possibility to find the optimal ROIs for the SVM
classification between nfvPPA (or lvPPA) and healthy controls might consist in
rerunning meta-analyses on the three variants of PPA across MRI studies using a
less conservative statistical threshold. This methodological approach might no longer
exclusively reveal the brain regions that are specific to a given variant (and to some
extent possibly even false positive results), but due to the higher sensitivity, also
common networks between variants that become usually only visible in longitudinal
studies monitoring the progression of the disease (e.g., Rogalski et al., 2011). For the
ROI approach of SVM classification between the different variants of PPA, on the
other hand, it might be rather promising to only consider ROIs that are either more
severely impaired in one variant as in the other variants as for instance the inferior
and middle temporal gyri in svPPA, or rather specific to the given variant (e.g., middle
frontal gyrus in nfvPPA as compared to svPPA). The considerations regarding the
optimal ROI for SVM classification in PPA are however purely hypothetical and need
to be investigated in future studies.
Furthermore, it might be interesting to compare the ROI approach to the whole brain
approach using combined imaging data as for instance MRI and PET as has already
been done for AD and FTD (e.g., Davatzikos et al., 2008b; Dukart et al., 2013; Dukart
et al., 2011) or using MRI and diffusion tensor imaging data as has been done by
Zhang et al. (2013), who showed, in a small sample, higher accuracies for whole
brain SVM classification of diffusion tensor imaging data than of MRI data for nfvPPA
and svPPA versus healthy controls. Moreover, the potential of ROI approaches for
disease classification has to be validated in longitudinal studies, where one would
assume higher accuracy in early stages.
3. Support vector machine classification in primary progressive aphasia
56
3.5 Limitations
The relatively small number of subjects might hamper the generalization of the
results to the overall population of PPA patients. Given however that our results are
very similar to another study including more patients but using a different approach
(Wilson et al., 2009) this should not really constitute a major issue. A problem that
might occur in pattern classification methods is the risk of overfitting the data due to
the high-dimensionality of the data, which can however be reduced by using the
leave-one out approach as has been done in the current study. Segmentation and
normalization processes are not always perfect which might result in underestimation
of atrophy in patients or underestimation of grey matter in healthy controls, which
leads to lower accuracies in the SVM classification. This issue should however at
least partly be addressed in the current study as that our data have been acquired on
different scanners and were well balanced between patient and healthy control
groups. Finally, the classification between pairs of groups was a highly idealized
situation that does not reflect the problem in the real world of differential diagnosis
between several neurological diseases with different prevalence rates – an issue that
has to be addressed in future studies validating the application of SVM approaches in
every day diagnostic life.
3.6 Conclusion
Our study aimed at validating the potential of structural multi-center MRI data for
disease classification in PPA. We compared the whole brain approach with a
disease-specific ROI approach for SVM classification in the three variants of PPA.
Generally, both the whole brain and the disease-specific approach reached high
classification accuracy in diagnosis and differential diagnosis of PPA syndromes
without significant differences. Our results showed that for svPPA, the ROI approach
using prototypical disease-related networks as revealed by meta-analyses across
MRI studies revealed a higher accuracy (perfect discrimination of 100 %) than the
whole brain approach. For nfvPPA and lvPPA on the other hand, the SVM
classification showed higher accuracies when using the whole brain approach. The
regions contributing to the correct SVM classification of patients mostly corresponded
to regions that were consistently atrophied in these patients as shown by the VBM

3. Support vector machine classification in primary progressive aphasia
57
results. For the discrimination between svPPA and nfvPPA, and between svPPA and
lvPPA the whole brain approach and the ROI approach showed similar results. The
ROI approach increased accuracy in classification between lvPPA and nfvPPA in
comparison with the whole brain approach, which might be related to the diffusivity
and similar strength (in the sense of t-values) in these PPA syndromes requiring
higher regional specificity for the analysis. Given that the accuracies for SVM
classification using the ROI approach were still quite high despite the relatively small
size of the chosen ROIs as compared to the regions that were taken into account in
the whole brain SVM classification of the respective patients, future studies shall
further explore the potential of the ROI approach using different ROIs for SVM
classification of PPAs.

4. General Discussion
58
4 General Discussion
In the revised diagnostic criteria for PPA (Gorno-Tempini et al., 2011), more
importance is attributed to the assessment of imaging scans as has been the case in
the previous consensus diagnostic criteria for PPA (Neary et al., 1998). The current
imaging criteria have been proposed based on a qualitative evaluation of the
literature in this field. Here, we provided a quantitative evaluation of the currently
available MRI and PET studies in order to statistically validate the proposed
diagnostic imaging criteria using ALE meta-analyses. Thereafter, we investigated the
diagnostic value of MRI scans for early individual diagnosis of PPA in clinical routine
using support vector machine classification and explored whether focusing
exclusively on prototypical networks for the single PPA variants would ameliorate the
diagnostic value of MRI scans. In the following, we are not going to discuss in detail
the results of the two studies presented on the previous pages as this has already
been done extensively in section 2.3 and section 2.4, but rather discuss the
usefulness of these findings for clinicians within a broader framework.
4.1 Evaluation of the validity of the current diagnostic criteria for
primary progressive aphasia
To a great extent, the results of our separate meta-analyses on nfvPPA, svPPA, and
lvPPA studies validated the revised diagnostic imaging criteria. Interestingly, the
results of our meta-analyses across MRI studies even extended the proposed
imaging criteria by showing additional atrophy in the anterior medial temporal lobe
(right amygdala and bilaterally hippocampus/parahippocampal gyri) for svPPA and in
the middle temporal gyrus, superior temporal gyrus, putamen, and precentral gyrus
for nfvPPA. Furthermore, the results of our meta-analysis on lvPPA showed that the
angular gyrus might not be as consistently atrophied in these patients as has been
assumed so far, while the dorsal posterior cingulate gyrus and superior/middle
temporal gyrus most probably constitute additional diagnostic imaging marker for
lvPPA. We suggest that these findings should be considered in future revisions of the
diagnostic criteria for PPA.

4. General Discussion
59
Another highly interesting finding resulted from the comparison between the results
of both meta-analyses (one across MRI and one across PET studies) on svPPA. This
comparison showed that it might be useful, at least for this PPA variant, to define
separate diagnostic imaging criteria for FDG-PET and MRI scans. Future studies will
show whether separate imaging criteria for FDG-PET and MRI should be applied
similarly to nfvPPA and lvPPA. Separate imaging modality-specific diagnostic criteria
have also already been proposed for other types of dementia (Dubois et al., 2007;
Schroeter et al., 2014; Schroeter et al., 2008). We suggest that future revisions of the
diagnostic criteria for PPA should include the current knowledge about separate
imaging markers for FDG-PET and MRI scans.
While we evaluated and validated the revised diagnostic imaging criteria, other
authors evaluated the revised diagnostic clinical criteria for PPA (Harris et al., 2013;
Mesulam, Wieneke, Thompson, Rogalski, & Weintraub, 2012; Sajjadi, Patterson,
Arnold, Watson, & Nestor, 2012; Wicklund et al., 2014). In a prospective data-driven
study, Sajjadi et al. (2012) examined to which extent 46 consecutively recruited
patients would be classifiable according to the revised clinical diagnostic criteria for
PPA. Additionally, these authors investigated which linguistic impairments would
cluster together (and thus form distinct syndromes) using principal factor analysis. In
this patient cohort, 58.7 % of the patients could be assigned to one of the three
variants of PPA proposed by Gorno-Tempini et al. (2011), while 41.3 % of the
patients were classified as mixed PPA because their deficits either extended beyond
a single PPA variant (i.e., showed also linguistic impairments expected to be spared
in this syndrome) or they met the diagnostic criteria for more than one variant
(whithout showing differences in disease duration). The principal factor analysis
identified two clear syndromes corresponding to the proposed syndromes of svPPA
and nfvPPA as well as a residual miscellany. Interestingly, impaired sentence
repetition which has been proposed as a cardinal diagnostic feature for lvPPA
aligned with the factor corresponding to nfvPPA (Sajjadi et al., 2012). Similarly,
Wicklund et al. (2014) showed that 31 % of 84 PPA patients were unclassifiable
according to the current diagnostic criteria (some fulfilled simultaneously the
diagnostic criteria for more than one PPA variant and some fulfilled the criteria for
lvPPA except for the core feature of impaired repetition).

4. General Discussion
60
It has been proposed that some of the problems of unclassifiable patients according
to the diagnostic criteria of Gorno-Tempini et al. (2011) might be circumvented if
impaired repetition would be regarded as an ancillary rather than a core feature of
lvPPA and if the “absence of definite grammar and comprehension impairment”
would be regarded as a core feature of lvPPA (Mesulam & Weintraub, 2014).
Mesulam and Weintraub (2014) furthermore proposed that the recognition of a
“mixed” PPA variant might highly decrease the number of unclassifiable cases
because some patients already show at very early stages of the disease a
combination of agrammatism and semantic impairment. It is thus highly probable that
the diagnostic criteria for PPA will be revised within the next years.
Changes in consensus diagnostic criteria can have a major impact as has for
instance been shown for the shift from the previous consensus criteria on PPA
proposed by Neary et al. (1998) to the current diagnostic criteria for PPA of Gorno-
Tempini et al. (2011). Chare and colleagues showed that the comparison of the
diagnostic criteria of Neary et al. (1998) and the revised criteria of Gorno-Tempini et
al. (2011) revealed no changes in the diagnosis of 87 % of the svPPA patients, but
that 51 % of the nfvPPA patients were reclassified as suffering from lvPPA (Chare et
al., 2014). These reclassifications of patients were due to several reasons (Mesulam
& Weintraub, 2014). Altough Neary et al. (1998) did not explicitly claim to cover and
characterize all possible variants of PPA in their diagnostic criteria, most researchers
and clinical practicioners used these diagnostic criteria as such (Mesulam &
Weintraub, 2014). Consequently, lvPPA was not recognized as a distinct syndrome
and PPA patients with a pathology different from FTLD were previously implicitly
excluded from the diagnosis of PPA. Furthermore, in the revised diagnostic criteria of
Gorno-Tempini et al. (2011) impaired repetition is no longer one of the supportive
criteria for nfvPPA, but is included as a core diagnostic criterium for lvPPA. Anomia,
which has previously been part of the diagnostic features for nfvPPA (Neary et al.,
1998), is meanwhile attributed to svPPA if it is accompagnied with loss of word
meaning and to lvPPA if it appears without loss of word meaning (Mesulam &
Weintraub, 2014). By first diagnosing PPA according to Mesulam (2001) before
further specifying the concrete variant of PPA, patients whose most prominent
problem is prosopagnosia and/or an associative agnosia (and would therefore have

4. General Discussion
61
been classified as svPPA according to the criteria of Neary et al. (1998)) are now
explicitly excluded from the diagnosis of svPPA (Mesulam & Weintraub, 2014).
The changes from the diagnostic criteria for PPA proposed by Neary et al. (1998) to
the current diagnostic criteria for PPA of Gorno-Tempini et al. (2011) lead to a
relatively large number of reclassified patients (Chare et al., 2014). One might
wonder how importantly the suggested revisions of the diagnostic criteria of Gorno-
Tempini et al. (2011) might affect the current diagnoses of PPA patients. The
suggested revisions for future consensus diagnostic criteria concern mostly lvPPA
(i.e., regard impaired repetition as ancillary feature and the absence of definite
grammar and comprehension impairment as core features for lvPPA) and the
recognition of patients showing a combination of agrammatism and semantic
impairment as distinct “mixed” PPA variant (Mesulam & Weintraub, 2014; Mesulam et
al., 2014).
In the following, we will discuss possible implications of future revisions of the
diagnostic criteria for the validity and informative value of the two imaging studies
presented in this thesis. As svPPA and nfvPPA are not affected by the recommended
revisions, we do not expect that future imaging results (after revision of the current
diagnostic criteria) for svPPA and nfvPPA will differ importantly from the ones
presented here. For lvPPA on the other hand, we expect larger study samples
(including lvPPA with and without impaired repetition), which will enhance the
statistical power of future studies and thus provide more solid results. Sajjadi,
Patterson, and Nestor (2014) showed that PPA patients that were unclassifiable
according to the diagnostic criteria of Gorno-Tempini et al. (2011) showed at group-
level atrophy similar to the currently proposed imaging criteria for lvPPA. Therefore,
we assume that also for lvPPA, the results of future imaging studies (after revision of
the current diagnostic criteria) will not differ drastically from the ones presented here.
Note however, that it is not sure yet, whether the diagnostic criteria of Gorno-Tempini
et al. (2011) will indeed be revised in near future. The assumptions regarding
imaging results for PPA variants after the revision of the current diagnostic criteria
are thus purely speculative and need to be substantiated by future studies.

4. General Discussion
62
4.2 How useful are the current diagnostic imaging criteria for
clinical routine?
In the following, we are going to discuss the usefulness of the current diagnostic
imaging criteria (respectively their quantification via ALE meta-analysis) for clinical
routine. The comparison of the separate meta-analyses across MRI studies (via
conjunction and subtraction analyses) showed that the imaging criteria for the PPA
variants are highly distinct. The conjunction analysis showed a small regional overlap
in the posterior middle temporal gyrus between nfvPPA and lvPPA, which suggests
that this region might play an important role in both PPA variants. Nevertheless, as
this overlap was very small, a high clinical distinctiveness is still guaranteed. At first
sight, studies comparing PPA patients to healthy controls at group-level thus suggest
that these imaging markers constitute useful guidelines for clinicians to correctly
distinguish between PPA variants in clinical routine.
We used support vector machine classification to investigate statistically how useful
MRI scans are actually for the individual diagnosis of PPA patients. In order to
represent the situation in clinical routine as closely as possible, we considered scans
assessed at initial presentation for each subjet. Our SVM results showed accuracies
(in the whole brain approach) ranging from 55 % to 97 %. In a second step, we
investigated whether it would be sufficient to only consider brain regions
corresponding to the proposed diagnostic imaging criteria (respectively their
quantification via ALE meta-analysis) or whether additional brain regions should be
taken into account. Our results showed that for svPPA, focusing only on the
(quantification of the) proposed diagnostic imaging criteria lead to a perfect
discrimination (of 100 %) between patients and healthy controls. For nfvPPA and
lvPPA on the other hand, the SVM classification showed slightly higher accuracies
when considering the whole brain. For the discrimination between svPPA and
nfvPPA/lvPPA, both approaches showed similar results. For the discrimination
between lvPPA and nfvPPA, the ROI approach showed a higher accuracy than the
whole brain approach. Given that none of the differences between both approaches
were statistically significant, we consider both approaches as equally valid. Our
accuracies for SVM classification considering only the (quantification of the)

4. General Discussion
63
proposed diagnostic imaging criteria were (except for the discrimination between
lvPPA and nfvPPA) quite high despite the relatively small size of the chosen brain
regions. These findings thus provide empirical evidence that (except for the
differential diagnosis between lvPPA and nfvPPA) the proposed supportive imaging
criteria constitute (not only at group-level, but) also at individual subject level useful
guidelines for clinicians to correctly diagnose PPA variants in clinical routine.
Besides providing a sound statistical method to evaluate the discriminative power
(and thus the usefulness) of single features (e.g., MRI scans) for the correct
diagnosis of patients in clinical routine, the SVM method has the practical advantage
that its algorithm (used to classify subjects after the classifier has been trained), can
be implemented in an imaging software. SVM is a highly sensitive method which
takes into account early changes in atrophy that cannot easily be perceived by the
naked eye. Providing such a software might thus ensure the best use of imaging
scans to support the diagnosis of PPA patients in clinical routine. Before such a
software can be put on the market, the algorithm needs however to be optimized in
order to provide classification accuracies of approximatively 100 %. In the following,
we are going to discuss possible ways to improve the algorithm and thereby the
accuracy of support vector machine classification for PPA.
One possibility to improve the accuracy of the SVM classification using MRI might
consist in further exploring the optimal number and size of brain regions to be taken
into account (see section 3.4.3). Regarding this our results unveiled matters of a
rather technical nature. The SVM classification method is highly sensitive and
therefore takes into account also very early atrophy. Supposed that several regions
might be affected similarly in the three PPA variants depending upon the current
stage of the respective disease (e.g., Rogalski et al., 2011) and structural MRI scans
do not provide any information regarding the temporal dynamic pattern of brain
atrophy, SVM classification might not always be able to perfectly discriminate
between PPA variants. In order to address this rather technical issue, it might be
highly interesting to investigate in future studies, whether considering disease-
specific networks including also very early atrophy and additionally weighting more
importantly the brain regions that are rather specific for a given PPA variant as

4. General Discussion
64
compared to the other PPA variants, would increase the accuracy of SVM
classification significantly.
Another possibility to improve the accuracy of the SVM classification using MRI might
consist in including further parameters like for instance additional imaging data (e.g.,
FDG-PET or diffusion tensor imaging) or language test scores (e.g., Dukart et al.,
2011; Wilson et al., 2009; Zhang et al., 2013) or constructing dynamic disease
models based on longitudinal data. Wilson et al. (2009) showed for instance, that at
least for the discrimination between svPPA and nfvPPA, adding linguistic variables to
MRI data improved significantly the accuracy of the SVM classification. In this regard,
it might be highly interesting to further investigate which standard language tests
used in clinical routine provide the most promising results. It has for instance been
proposed that the Repeat and Point Test (Hodges, Martinos, Woollams, Patterson, &
Adlam, 2008) assessing single word repetition and comprehension might be
especially useful for the discrimination between svPPA and nfvPPA. Other authors in
contrast proposed that considering language tests assessing comprehension and
grammaticality might discriminate best between PPA variants (Mesulam & Weintraub,
2014; Mesulam et al., 2014). It might thus be of interest to investigate whether these
assumptions can be empirically supported using SVM classification and to provide a
good overview for clinicians regarding the informative value of standard language
tests used in clinical routine.
Note however that including further parameters like language test scores and
additional imaging data into SVM classification for PPA is most probably rather of
scientific interest than of practical benefit in the sense of realistically implementable
into an imaging software for clinical purposes. This is due to the fact that different
clinics use partly different standard tests to evaluate language impairments in their
PPA patients. Furthermore, most clinics are rather in the possession of an MRI
scanner than of a PET scanner, because of the great expenses of PET and
invasiveness of the radioactive tracers (e.g., Berns, 1999). Similarly, diffusion tensor
imaging sequences on MRI scanners are usually run for scientific purposes only and
not included as standard sequences in clinical routine.

4. General Discussion
65
4.3 General limitations
The main limitations of the work presented in this thesis are the relatively small
number of studies included in the ALE meta-analyses as well as the relatively small
number of patients included in the SVM study. Small sample sizes in this research
field are due to the fact that PPA is an orphan disease with an estimated prevalence
of approximately 1.1-6.0 per 100,000 in the population (Grossman, 2014). Although
the cooperation between several clinics and research centers within national and
international consortia has already largely alleviated this problem, the number of
subjects recruited over a period of several years is still relatively low.
Another reason for the relatively small sample sizes in cross-sectional studies is that
it is advisable to include patients at a relatively early stage of the disease, because it
has been shown in longitudinal studies that with the progression of the disease, the
language impairments as well as the atrophic networks in the three variants of PPA
partly converge (Gorno-Tempini et al., 2011; Rogalski et al., 2011). Furthermore, it
has been shown that there are considerable longitudinal shifts in PPA variant
classification while the disease progresses (Mesulam et al., 2014). This seems to
concern especially lvPPA where seven out of 11 patients progressed over time into
nfvPPA, svPPA, or mixed PPA (Mesulam et al., 2014). Other authors showed that
these longitudinal shifts are not limited to the diagnosis of PPA variants, but also
include other FTLD syndromes (Knibb & Hodges, 2005). Whereas svPPA patients
frequently develop characteristical features of bvFTD, nfvPPA patients often show
similarities to patients with corticobasal syndrome (Knibb & Hodges, 2005). In order
to gain new insights into PPA, it is thus necessary to include patients at a relatively
early or middle stage of the disease and recruit them over a longer period of time.
4.4 General conclusion
The aim of the two studies presented in this thesis was to evaluate the validity of the
new diagnostic imaging criteria for PPA variants using anatomical likelihood
estimation meta-analysis and to investigate the usefulness of these criteria for the
individual diagnosis of PPA patients in clinical routine. To a great extent, the results
of our separate meta-analyses on nfvPPA, svPPA, and lvPPA studies validated and

4. General Discussion
66
even extended the revised diagnostic imaging criteria. Furthermore, our results
suggest that at least for svPPA, it might be useful to define separate diagnostic
imaging criteria for FDG-PET and MRI scans. Our support vector machine
classification results showed that the accuracies for SVM classification considering
only the (quantification of the) proposed diagnostic imaging criteria were (except for
the discrimination between lvPPA and nfvPPA) quite high despite the relatively small
size of the chosen brain regions. Our findings thus suggest that (except for the
differential diagnosis between lvPPA and nfvPPA) the proposed supportive imaging
criteria constitute (not only at group-level, but) also at individual subject level useful
guidelines to correctly diagnose PPA variants in clinical routine.

5.Summary
67
5 Summary (Zusammenfassung)
Zusammenfassung der Arbeit
Dissertation zur Erlangung des akademischen Grades Dr. rer. med.
Validation of diagnostic imaging criteria for PPA
eingereicht von: Sandrine Bisenius
angefertigt am: Max-Planck-Institut für Kognitions- und Neurowissenschaften, Leipzig
betreut von: Prof. Dr. Dr. Matthias Schroeter
April 2017
5.1 German summary
Primär progrediente Aphasien (PPA) sind neurodegenerative Erkrankungen, die zu
einer alltagsrelevanten Beeinträchtigung von Sprachfunktionen führen können. Die
ersten Studien, die zu PPA und ihren Varianten veröffentlicht wurden, berichteten
Ergebnisse über sehr geringe Stichprobengrößen oder aber waren Fallbeispiele.
Dies lag daran, dass es sich bei PPA um eine seltene Erkrankung handelt, deren
Prävalenz auf circa 1.1-6.0 pro 100.000 Personen in der Bevölkerung geschätzt wird
(Grossman, 2014). Erst der Zusammenschluss von mehreren Studienzentren zu
nationalen und internationalen Konsortien machte es möglich größere Stichproben
zu erheben, welche für repräsentative inferenzstatistische Erkenntnisse unabdinglich
sind. Weitere Ziele solcher Konsortien sind die Verbesserung der Früherkennung der
Erkrankung, die Erhebung des Krankheitsverlaufs, das Sammeln von
epidemiologischen Daten, das Aufdecken von möglichen Risikofaktoren, die
Evaluation von möglichen Therapien, sowie die Etablierung von einheitlichen
Diagnosekriterien (z.B., Otto et al., 2011; Brun et al., 1994).
5.Summary
68
Während zwei Jahrzehnten wurden die allgemeinen Diagnosekriterien für
frontotemporale Demenz (Brun et al., 1994; McKhann et al., 2001) herangezogen,
um Patienten mit PPA zu diagnostizieren. Die anschließende Spezifizierung des
Subtyps als progressive nichtflüssige Aphasie oder semantische Demenz erfolgte
nach den Diagnosekriterien von Neary und Kollegen (Neary et al., 1998). Es stellte
sich jedoch mit der Zeit heraus, dass nicht alle PPA Patienten eindeutig einem der
beiden Subtypen zugeordnet werden konnten (z.B., Gorno-Tempini et al., 2004), was
eine Revision der Diagnosekriterien für PPA zur Folge hatte (Gorno-Tempini et al.,
2011). PPA wurde neu definiert als eine neurodegenerative Erkrankung mit
schleichendem Beginn, welche sich in den ersten zwei Jahren hauptsächlich als
isolierte, progrediente Sprachstörung (ohne bedeutsame Beeinträchtigung in
anderen kognitiven Bereichen) bemerkbar macht. PPA umfasst drei Varianten: die
semantische Variante (svPPA, früher als semantische Demenz bezeichnet), die
nichtflüssige Variante (nfvPPA, früher als progressive nichtflüssige Aphasie
bezeichnet), und die logopenische Variante (lvPPA). Das klinische Erscheinungsbild
der svPPA ist hauptsächlich gekennzeichnet durch Beeinträchtigungen im Benennen
und im Verständnis von einzelnen Wörtern, zunehmenden Verlust des Wissens um
die Bedeutung von Wörtern, Oberflächendyslexie und Oberflächendysgraphie. Die
Diagnose gilt als bildgebungsgestützt, wenn Patienten zusätzlich Atrophie,
Hypometabolismus oder Hypoperfusion im anterioren Temporallappen aufzeigen.
Die nfvPPA ist charakterisiert durch eine nichtflüssige Spontansprache mit
Sprechanstrengung und langen Pausen, Agrammatismus, Sprechapraxie (Störung
der Initiierung und Exekution der für das Sprechen notwendigen Bewegungsabläufe),
sowie beeinträchtigtes Verständnis von grammatikalisch komplexen Sätzen. Diese
Sprachstörung geht häufig mit Schädigungen in links posterioren frontoinsulären
Gehirnregionen einher. Die lvPPA ist hauptsächlich gekennzeichnet durch
beeinträchtigten Wortabruf in der Spontansprache und beim Benennen, sowie
beeinträchtigtes Nachsprechen von längeren Sätzen. Die Diagnose der lvPPA gilt als
bildgebungsgestützt, wenn die Patienten zusätzlich zu den genannten klinischen
Symptomen ebenfalls Atrophie, Hypometabolismus oder Hypoperfusion in links
posterioren perisylvischen oder parietalen Gehirnregionen aufzeigen.

5.Summary
69
In den revidierten Diagnosekriterien für PPA wird den Ergebnissen aus
Bildgebungsverfahren ein größerer Wert beigemessen, als es in den vorherigen
Diagnosekriterien der Fall war (Gorno-Tempini et al., 2011 vs. Neary et al., 1998).
Die neuen bildgebenden Diagnosekriterien wurden jedoch auf Grund einer rein
qualitativen Evaluation der Literatur vorgeschlagen. Ziel der beiden im Folgenden
dargestellten Studien war es, die Validität der neuen bildgebenden Diagnosekriterien
für PPA zu evaluieren (erste Studie) und ihren praktischen Nutzen für die individuelle
Diagnosestellung von PPA-Patienten im klinischen Alltag zu untersuchen (zweite
Studie).
Die erste Studie befasste sich mit der inferenzstatistischen (quantitativen)
Evaluierung der Validität der neuen bildgebenden Diagnosekriterien für PPA. Zu
diesem Zweck wurden Metaanalysen über alle verfügbaren MRT und PET Studien
durchgeführt (Kapitel 2). Ziel war es die in den einzelnen PPA-Varianten konsistent
(über mehrere Studien hinweg) betroffenen Gehirnregionen auszumachen und mit
Hilfe von Subtraktions- und Konjunktionsanalysen herauszufinden, wie
subtypspezifisch oder überlappend diese Regionen zwischen den einzelnen
Varianten sind. Ein weiteres Ziel bestand darin zu untersuchen, ob die
vorgeschlagenen bildgebenden Diagnosekriterien gleichermaßen für alle
Bildgebungsverfahren gelten, oder ob unterschiedliche Diagnosekriterien für MRT
und PET angewendet werden sollten, wie es bereits für andere Demenzen
vorgeschlagen wurde (Dubois et al., 2007; Schroeter et al., 2014). Unsere
systematische Literaturrecherche ergab 22 Studien (15 MRT, sechs FDG-PET, eine
MRT & FDG-PET) für svPPA, 14 Studien (11 MRT, drei FDG-PET) für nfvPPA, und
sechs Studien (sechs MRT, null FDG-PET) für lvPPA. Die Ergebnisse unserer
Metaanalysen bestätigten größtenteils die vorgeschlagenen bildgebenden
Diagnosekriterien (p < 0.05, False Discovery Rate korrigiert). Interessanterweise
zeigten unsere Metaanalysen über MRT-Studien zusätzliche bedeutsame
Gehirnareale für die einzelnen PPA-Varianten auf. So fanden wir zusätzliche
Atrophie im anterioren medialen Temporallappen (rechte Amygdala und beidseitig
Hippocampus) für svPPA sowie im mittleren und superioren Gyrus temporalis,
Putamen und Gyrus praecentralis für nfvPPA. Des Weiteren zeigten unsere
Ergebnisse zu lvPPA, dass der Gyrus angularis nicht so konsistent in dieser Variante

5.Summary
70
betroffen ist, wie bislang angenommen wurde, während der dorsale posteriore Gyrus
cinguli sowie der mittlere und superiore Gyrus temporalis möglicherweise weitere
bildgebende Marker für lvPPA darstellen. Die Ergebnisse der Subtraktions- und
Konjunktionsanalysen zeigten, dass (bis auf eine kleine regionale Überlappung
zwischen nfvPPA und lvPPA im posterioren mittleren Gyrus temporalis), die
betroffenen Regionen in hohem Maße spezifisch für die einzelnen Varianten sind.
Der Vergleich zwischen beiden Metaanalysen zu svPPA (eine über MRT- und eine
über PET-Studien) zeigte nur sehr kleine Überlappungen im inferioren und mittleren
Gyrus temporalis auf. Diese Ergebnisse legen nahe, dass für svPPA, ähnlich wie für
andere Demenzen (z.B., Dubois et al., 2007), separate bildgebende
Diagnosekriterien für PET und MRT von Nutzen sein könnten. Zukünftige Studien
werden zeigen, ob dies ebenfalls für nfvPPA und lvPPA zutrifft.
Die vorgeschlagenen bildgebenden Diagnosekriterien für PPA scheinen folglich
(zumindest für die Beurteilung von MRT-Scans) nützliche Richtlinien für Kliniker
darzustellen. Es besteht jedoch genereller Konsens, dass Studienergebnisse, die auf
Gruppenvergleichen basieren, nicht unbedingt zur Evaluierung einzelner individueller
MRT-Scans herangezogen werden können, weil die Sensitivität und Spezifizität von
Gruppenvergleichen nicht ausreichend sind, um anfängliche Atrophie zu erfassen.
In der zweiten Studie wollten wir mittels Support Vektor Maschinen (SVM)-
Klassifikation statistisch untersuchen, wie nützlich MRT-Scans allgemein für die
Diagnosestellung von PPA-Patienten im klinischen Alltag sind (Kapitel 3). Des
Weiteren wollten wir gezielter untersuchen, ob hierbei die ausschließliche
Fokussierung auf die vorgeschlagenen bildgebenden Diagnosekriterien (bzw. deren
Quantifizierung mittels Metaanalysen, welche in der ersten Studie berichtet wurde)
den diagnostischen Wert von MRT-Scans verbessern würde. Wir verglichen hier 44
rechtshändige PPA Patienten (16 nfvPPA, 17 svPPA und 11 lvPPA) mit 20
rechtshändigen gesunden älteren Kontrollen, welche für Stichprobengröße, Alter,
Geschlecht und Scanning-Parameter gematcht waren. Alle Probanden wurden im
Rahmen des Deutschen und Italienischen Konsortiums für Frontotemporale
Lobärdegeneration erhoben (Otto et al., 2011). Die verglichenen Gruppen
unterschieden sich nicht signifikant in Alter, Geschlecht, Bildungsstand, oder
Krankheitsdauer. Die Vorhersagegenauigkeit für die Analysen, die das gesamte

5.Summary
71
Gehirn umfassten, variierten für die SVM-Klassifikationen zwischen PPA-Patienten
und Kontrollen von 91 % für nfvPPA über 95 % für lvPPA zu 97 % für svPPA. Die
SVM Klassifikation zeigte eine Genauigkeit von 78 % für svPPA versus nfvPPA und
eine Genauigkeit von 95 % für lvPPA versus svPPA. Für die Unterscheidung
zwischen lvPPA und nfvPPA zeigte die SVM Klassifikation eine Genauigkeit von
55 %. Diese Zahlen sind im Einklang mit SVM Studien zu anderen
neurodegenerativen Erkrankungen (z.B. Alzheimer-Krankheit oder leicht kognitive
Einschränkung; Davatzikos, Resnick, et al., 2008; Dukart et al., 2011). Um
herauszufinden ob die Gehirnregionen, die am meisten zur SVM-Klassifikation
zwischen Patienten und Kontrollen beitragen, den Gehirnregionen entsprechen, die
am meisten in diesen Patientengruppen atrophisch sind, haben wir zusätzlich
statistische Gruppenvergleiche zwischen Patienten und gesunden Kontrollen
gerechnet. Unsere Ergebnisse zeigten, dass die Regionen, die am meisten zur SVM-
Klassifikation zwischen Patienten und Kontrollen beitrugen, in der Tat größtenteils
den Regionen entsprachen, die in den entsprechenden Patientengruppen atrophisch
waren. Die ausschließliche Fokussierung auf die (Quantifizierung mittels
Metaanalysen der) bildgebenden Diagnosekriterien zeigte für svPPA eine höhere
Vorhersagegenauigkeit auf (100 %) als wenn das gesamte Gehirn berücksichtigt
wurde (97 %). Die Vorhersagegenauigkeiten für nfvPPA (84 %) und lvPPA (82 %)
hingegen waren leicht geringer, wenn ausschließlich die bildgebenden
Diagnosekriterien in Betracht gezogen wurde. Für die Klassifikation zwischen svPPA
und nfvPPA bzw. lvPPA war die Vorhersagegenauigkeit bei beiden Methoden gleich
(78 % bzw. 95 %). Für die Klassifikation zwischen lvPPA und nfvPPA war die
Vorhersagegenauigkeit leicht höher (64 %), wenn ausschließlich auf die
bildgebenden Diagnosekriterien fokussiert wurde. Zusammengefasst waren die
Vorhersagegenauigkeiten der SVM-Klassifikationen, wo ausschließlich die
(Quantifizierung der) bildgebenden Diagnosekriterien berücksichtigt wurde, trotz der
geringen Größe der betrachteten Regionen, (außer für die Unterscheidung zwischen
lvPPA und nfvPPA) recht hoch. Unsere Ergebnisse untermauern den praktischen
Nutzen der vorgeschlagenen bildgebenden Diagnosekriterien für die Beurteilung von
MRT-Scans zur Diagnosestellung von PPA-Patienten im klinischen Alltag (mit
Ausnahme für die Differentialdiagnose zwischen lvPPA und nfvPPA).

5.Summary
72
5.2 English summary
Primary progressive aphasias (PPA) are neurodegenerative diseases that lead to
profound impairments in language functions. For almost a decade, most studies on
PPA and its variants were either case reports or single-center studies reporting very
small sample sizes. Until now, there are no community-based prevalence estimates
for PPA available, but based on autopsy-proven cases, the prevalence for PPA is
estimated at approximately 1.1-6.0 per 100,000 in the population (Grossman, 2014).
PPA is thus an orphan disease. Only the cooperation between several study centers
within national and international consortia in recent years made it possible to gather
sufficiently large sample sizes making deductive statistical research in this field
possible. Further aims of these consortia are to improve disease recognition along
with its management, evaluate disease progression, collect data on epidemiology,
find risk factors and early disease markers, evaluate possible therapeutic approaches
as well as to discuss and establish standard diagnostic criteria (e.g., Otto et al., 2011;
Brun et al., 1994).
For two decades, researchers and clinicians have been using the diagnostic criteria
for frontotemporal dementia (Brun et al., 1994; McKhann et al., 2001) to generally
diagnose a patient as suffering from PPA and the criteria of Neary et al. (1998) to
further specify the diagnosis as progressive nonfluent aphasia or semantic dementia.
However, there were a number of PPA cases that could not be classified according
to the criteria of Neary and colleagues (Gorno-Tempini et al., 2004; Grossman & Ash,
2004; Neary et al., 1998), which led to a revision of the diagnostic criteria for PPA
(Gorno-Tempini et al., 2011). PPA has been redefined as a neurodegenerative
disease with insidious onset mainly characterized by a language dysfunction that
remains isolated for at least two years without significant impairment in other
cognitive domains. PPA subsumes three gradually progressive language disorders,
namely the semantic variant PPA (svPPA, formerly also known as semantic
dementia), nonfluent variant PPA (nfvPPA, formerly also known as progressive
nonfluent aphasia), and the logopenic variant PPA (lvPPA). SvPPA is clinically
mainly characterized by impairments in confrontation naming, single-word
comprehension, and object-knowledge, as well as surface dyslexia or dysgraphia.

5.Summary
73
The imaging supported diagnosis of svPPA is given when patients additionally show
atrophy and/or hypoperfusion/-metabolism in the anterior (ventral and lateral)
temporal lobe. Patients suffering from nfvPPA show predominantly agrammatism,
effortful halting speech with inconsistent speech sound errors and distortions (apraxia
of speech), as well as impaired comprehension of syntactically complex sentences.
These language deteriorations are often conjoined with atrophy or hypoperfusion/-
metabolism in left posterior fronto-insular regions (e.g., inferior frontal gyrus, insula,
premotor, and supplementary motor areas). LvPPA is characterized by impaired
single-word retrieval in spontaneous speech and naming as well as impaired
repetition of sentences. The imaging supported diagnosis of lvPPA is given when
patients additionally show atrophy and/or hypoperfusion/-metabolism in left posterior
perisylvian or parietal areas (e.g., posterior parietal, supramarginal, and angular gyri).
In the revised diagnostic criteria for PPA, more importance is attributed to the
diagnostic assessment of imaging scans as has been the case in previous diagnostic
criteria (Neary et al., 1998). The diagnostic imaging criteria were however proposed
based on a qualitative evaluation of the literature and have not been validated so far.
The aim of the two studies presented in this thesis was to evaluate the validity of the
new diagnostic imaging criteria for PPA (first study) and to investigate the usefulness
of the diagnostic imaging criteria for the individual diagnosis of PPA patients in
clinical routine (second study).
The aim of the first study was to validate the proposed diagnostic imaging criteria for
PPA at a deductive statistical level. Therefore, we quantitatively evaluated all
currently available PET and MRI studies using anatomical likelihood estimate meta-
analyses (chapter two). Our objective was to identify the neural networks affected in
the three PPA variants and examine their regional specificity in subtraction and
conjunction analyses identifying specific and overlapping networks, respectively. A
further objective was to investigate whether the proposed imaging criteria would
apply similarly to PET and MRI scans or whether separate, imaging modality-specific
imaging criteria should be applied for PPA as has been suggested for other types of
dementia (Dubois et al., 2007; Schroeter et al., 2014). Our systematic literature
search yielded 22 studies (15 MRI, six FDG-PET, one MRI & FDG-PET) for svPPA,
14 studies (11 MRI, three FDG-PET) for nfvPPA, and six studies (six MRI, zero FDG-

5.Summary
74
PET) for lvPPA. Analyses were conducted using a false discovery rate corrected
threshold of p < 0.05. To a great extent, the results of our separate meta-analyses on
nfvPPA, svPPA, and lvPPA studies validated the revised diagnostic imaging criteria.
Interestingly, our meta-analytic results across MRI studies even extended the
proposed imaging criteria by showing additional atrophy in the anterior medial
temporal lobe (right amygdala and bilaterally hippocampus/parahippocampal gyri) for
svPPA and in the middle temporal gyrus, superior temporal gyrus, putamen, and
precentral gyrus for nfvPPA. Furthermore, the results of our meta-analysis on lvPPA
showed that the angular gyrus might not be as consistently atrophied in these
patients as has been assumed so far, while the dorsal posterior cingulate gyrus and
superior/middle temporal gyrus most probably constitute additional diagnostic
imaging markers for lvPPA. The conjunction and subtraction analyses between the
separate meta-analyses on PPA variants across MRI studies showed that except for
a very small regional overlap in the posterior middle temporal gyrus between nfvPPA
and lvPPA, the neural networks affected in the three PPA variants were highly
distinct. The comparison between the results of both meta-analyses (one across MRI
and one across PET studies) on svPPA showed only small conjunctions in inferior
and middle temporal gyrus, which suggest that it might be useful to define separate
diagnostic imaging criteria for FDG-PET and MRI. Future studies will show whether
separate imaging modality-specific criteria apply similarly to nfvPPA and lvPPA.
At first sight, these results thus suggest that the current imaging criteria indeed
constitute useful supportive guidelines for clinicians to correctly distinguish between
PPA variants in clinical routine. There is however a general consensus that the
results of group-level statistics might not be applicable to individual scans, because
their sensitivity and specificity at early stages of brain pathology is insufficient for the
prediction of the status of individual scans (Davatzikos, Resnick, et al., 2008; Fan et
al., 2008; Wilson et al., 2009).
In the second study presented in this thesis, we therefore aimed at investigating
statistically how useful MRI scans are for the individual diagnosis of PPA patients
using support vector machine (SVM) classification. Furthermore, we raised the
question whether focusing exclusively on the diagnostic imaging criteria (respectively
their quantification via anatomical likelihood estimate meta-analyses presented in the

5.Summary
75
first study) would improve the diagnostic value of MRI scans for the individual
diagnosis. We compared 44 right-handed patients suffering from a variant of PPA (16
nfvPPA, 17 svPPA, and 11 lvPPA) with 20 right-handed healthy controls that were
matched as closely as possible for sample size, age, gender, and scanning
parameters. All data were acquired within the German and Italian Consortium for
FTLD (Otto et al., 2011). No pair of groups differed significantly in age, gender,
education, or disease duration (if applicable). Accuracies for the whole brain
approach in SVM classification between patients and healthy controls ranged from
91 % for nfvPPA over 95 % for lvPPA to 97 % for svPPA. The SVM classification of
svPPA vs. nfvPPA showed an accuracy of 78 %. The SVM classification for lvPPA
vs. svPPA showed an accuracy of 95 % and the SVM classification for lvPPA vs.
nfvPPA showed an accuracy of 55 %. These numbers are in line with previously
reported accuracies ranging from 58-100 % in studies on neurodegenerative
diseases as Alzheimer’s disease and mild cognitive impairment (e.g., Davatzikos,
Resnick, et al., 2008; Dukart et al., 2011; Klöppel, Stonnington, Barnes, et al., 2008).
In order to reveal whether the regions that contributed the most to the whole brain
SVM classification of the three variants of PPA corresponded to the regions that were
especially atrophied in the respective variants, we additionally conducted statistical
group-level comparisons between patients and healthy controls. Brain regions that
were most consistently atrophied in svPPA and lvPPA indeed also contributed the
most to the SVM classification of these patients. For nfvPPA, on the other hand,
brain regions that contributed the most to the SVM classification as patients were not
constrained to the regions that were atrophied in our nfvPPA patients, but also
encompassed very similar regions in the contralateral hemisphere. A possible
explanation for the importance of the additional brain regions in the right hemisphere
might be that they were affected to a lesser extent (and thus not significant in the
group-level comparison) and that SVM classification as a more sensitive method
already took into account early atrophy in these regions. For the discrimination
between svPPA and nfvPPA, the regions that contributed to the SVM classification
as svPPA patients corresponded to the regions that were most consistently atrophied
in these patients, while the regions that contributed to the classification as nfvPPA
were rather spread. Our results showed that for svPPA, focusing only on the

5.Summary
76
(quantification using anatomical likelihood estimate meta-analyses of the) diagnostic
imaging criteria for PPA showed a higher accuracy (100 %) than the whole brain
approach (94 %). The accuracy for nfvPPA (84 %) and lvPPA (82 %) was slightly
lower when focusing only on the (quantification of the) diagnostic imaging criteria as
compared to the whole brain approach. For svPPA versus nfvPPA (78 %) as well as
for svPPA versus lvPPA patients (95 %), the accuracy remained unchanged. For
lvPPA versus nfvPPA, the accuracy was slightly higher when focusing only on the
(quantification of the) diagnostic imaging criteria (64 %). All in all, the accuracies for
SVM classification considering only the (quantification of the) proposed diagnostic
imaging criteria were (except for the discrimination between lvPPA and nfvPPA) quite
high despite the relatively small size of the chosen brain regions. These findings
suggest that (except for the differential diagnosis between lvPPA and nfvPPA) the
diagnostic imaging criteria constitute (not only at group-level, but) also at individual
level useful guidelines for clinicians to correctly diagnose PPA variants in clinical
routine.

References
77
6 References
Abe, K., Ukita, H., & Yanagihara, T. (1997). Imaging in primary progressive aphasia.
Neuroradiology, 39(8), 556–559.
Ashburner, J., & Friston, K. J. (2000). Voxel-based morphometry–the methods.
NeuroImage, 11(6), 805–821.
Ashburner, J., & Friston, K. J. (2005). Unified segmentation. NeuroImage, 26(3),
839–851.
Berns, G. S. (1999). Functional neuroimaging. Life Sciences, 65, 2531–2540.
Bisenius, S., Mueller, K., Diehl-Schmid, J., Fassbender, K., Grimmer, T., Jessen, F.,
Kassubek, J., Kornhuber, J., Landwehrmeyer, B., Ludolph, A., Schneider, A.,
Anderl-Straub, S., Stuke, K., Danek, A., Otto, M., Schroeter, M. L., & FTLDc
study group. (2017). Predicting primary progressive aphasias with support
vector machine approaches in structural MRI data. NeuroImage: Clinical, 14,
334–343.
Bisenius, S., Neumann, J., & Schroeter, M. L. (2016). Validating new diagnostic
imaging criteria for primary progressive aphasia via anatomical likelihood
estimation meta-analyses. European Journal of Neurology, 23(4), 704–712.
Borroni, B., Turrone, R., Galimberti, D., Nacmias, B., Alberici, A., Benussi, A., . . .
Bruni, A. C. (2015). Italian Frontotemporal Dementia Network (FTD Group-
SINDEM): sharing clinical and diagnostic procedures in Frontotemporal
Dementia in Italy. Neurological Sciences, 36(5), 751–757.
Brett, M., Johnsrude, I. S., & Owen, A. M. (2002). The problem of functional
localization in the human brain. Nature Reviews Neuroscience, 3(3), 243–249.
Brun, A., Englund, E., Gustafson, L., Passant, U., Mann, D., Neary, D., & Snowden,
J. S. (1994). Clinical and neuropathological criteria for frontotemporal
dementia. The Lund and Manchester Groups. Journal of Neurology,
Neurosurgery, and Psychiatry, 57(4), 416–418.

References
78
Chang, C.-C., & Lin, C.-J. (2011). LIBSVM : a library for support vector machines.
ACM Transactions on Intelligent Systems and Technology, 2(3), 27:1–27:27.
Chare, L., Hodges, J. R., Leyton, C. E., McGinley, C., Tan, R. H., Kril, J. J., &
Halliday, G. M. (2014). New criteria for frontotemporal dementia syndromes:
clinical and pathological diagnostic implications. Journal of Neurology,
Neurosurgery, and Psychiatry, 85(8), 865–870.
Chein, J. M., Fissell, K., Jacobs, S., & Fiez, J. A. (2002). Functional heterogeneity
within Broca's area during verbal working memory. Physiology & Behavior,
77(4-5), 635–639.
Chetelat, G., & Baron, J. C. (2003). Early diagnosis of Alzheimer's disease:
contribution of structural neuroimaging. NeuroImage, 18(2), 525–541.
Coyle-Gilchrist, I. T., Dick, K. M., Patterson, K., Vazquez Rodriquez, P., Wehmann,
E., Wilcox, A., . . . Rowe, J. B. (2016). Prevalence, characteristics, and
survival of frontotemporal lobar degeneration syndromes. Neurology, 86(18),
1736–1743.
Czarnecki, K., Duffy, J., Nehl, C. R., Cross, S. A., Jack, Jr C. R., Shiung, M. M., . . .
Boeve, B. F. (2008). Very early semantic dementia with progressive left > right
temporal lobe atrophy: an eight-year longitudinal study. Archives of Neurology,
65(12),1659–1663.
Davatzikos, C., Fan, Y., Wu, X., Shen, D., & Resnick, S. M. (2008). Detection of
prodromal Alzheimer's disease via pattern classification of magnetic
resonance imaging. Neurobiology of Aging, 29(4), 514–523.
Davatzikos, C., Resnick, S. M., Wu, X., Parmpi, P., & Clark, C. M. (2008). Individual
patient diagnosis of AD and FTD via high-dimensional pattern classification of
MRI. NeuroImage, 41(4), 1220–1227.
Desgranges, B., Matuszewski, V., Piolino, P., Chetelat, G., Mezenge, F., Landeau,
B., . . . Eustache, F. (2007). Anatomical and functional alterations in semantic
dementia: a voxel-based MRI and PET study. Neurobiology of Aging, 28(12),
1904–1913.

References
79
Dubois, B., Feldman, H. H., Jacova, C., Dekosky, S. T., Barberger-Gateau, P.,
Cummings, J., . . . Scheltens, P. (2007). Research criteria for the diagnosis of
Alzheimer's disease: revising the NINCDS-ADRDA criteria. The Lancet
Neurology, 6(8), 734–746.
Dukart, J., Mueller, K., Barthel, H., Villringer, A., Sabri, O., & Schroeter, M. L. (2013).
Meta-analysis based SVM classification enables accurate detection of
Alzheimer's disease across different clinical centers using FDG-PET and MRI.
Psychiatry Research: Neuroimaging, 212(3), 230–236.
Dukart, J., Mueller, K., Horstmann, A., Barthel, H., Moller, H. E., Villringer, A., . . .
Schroeter, M. L. (2011). Combined evaluation of FDG-PET and MRI improves
detection and differentiation of dementia. PLoS One, 6(3), e18111.
Eickhoff, S. B., Bzdok, D., Laird, A. R., Kurth, F., & Fox, P. T. (2012). Activation
likelihood estimation meta-analysis revisited. NeuroImage, 59(3), 2349–2361.
Eickhoff, S. B., Bzdok, D., Laird, A. R., Roski, C., Caspers, S., Zilles, K., & Fox, P. T.
(2011). Co-activation patterns distinguish cortical modules, their connectivity
and functional differentiation. NeuroImage, 57(3), 938–949.
Eickhoff, S. B., Laird, A. R., Grefkes, C., Wang, L. E., Zilles, K., & Fox, P. T. (2009).
Coordinate-based activation likelihood estimation meta-analysis of
neuroimaging data: a random-effects approach based on empirical estimates
of spatial uncertainty. Human Brain Mapping, 30(9), 2907–2926.
Fan, Y., Batmanghelich, N., Clark, C. M., & Davatzikos, C. (2008). Spatial patterns of
brain atrophy in MCI patients, identified via high-dimensional pattern
classification, predict subsequent cognitive decline. NeuroImage, 39(4), 1731–
1743.
Frisoni, G. B., Fox, N. C., Jack, C. R., Jr., Scheltens, P., & Thompson, P. M. (2010).
The clinical use of structural MRI in Alzheimer disease. Nature Reviews
Neurology, 6(2), 67–77.
Gorno-Tempini, M. L., Brambati, S. M., Ginex, V., Ogar, J., Dronkers, N. F., Marcone,
A., . . . Miller, B. L. (2008). The logopenic/phonological variant of primary
progressive aphasia. Neurology, 71(16), 1227–1234.

References
80
Gorno-Tempini, M. L., Dronkers, N. F., Rankin, K. P., Ogar, J. M., Phengrasamy, L.,
Rosen, H. J., . . . Miller, B. L. (2004). Cognition and anatomy in three variants
of primary progressive aphasia. Annals of Neurology, 55(3), 335–346.
Gorno-Tempini, M. L., Hillis, A. E., Weintraub, S., Kertesz, A., Mendez, M., Cappa, S.
F., . . . Grossman, M. (2011). Classification of primary progressive aphasia
and its variants. Neurology, 76(11), 1006–1014.
Grossman, M. (2010). Primary progressive aphasia: clinicopathological correlations.
Nature Reviews Neurology, 6(2), 88–97.
Grossman, M. (2014). Biomarkers in the primary progressive aphasias. Aphasiology,
28(8-9), 922–940.
Grossman, M., & Ash, S. (2004). Primary progressive aphasia: a review. Neurocase,
10(1), 3–18.
Grossman, M., McMillan, C., Moore, P., Ding, L., Glosser, G., Work, M., & Gee, J.
(2004). What's in a name: voxel-based morphometric analyses of MRI and
naming difficulty in Alzheimer's disease, frontotemporal dementia and
corticobasal degeneration. Brain, 127(3), 628–649.
Grossman, M., Mickanin, J., Onishi, K., Hughes, E., D'Esposito, M., Ding, X. S., . . .
Reivich, M. (1996). Progressive nonfluent aphasia: language, cognitive, and
PET measures contrasted with probable Alzheimer's disease. Journal of
Cognitive Neuroscience 8(2), 135–154.
Harris, J. M., Gall, C., Thompson, J. C., Richardson, A. M., Neary, D., du Plessis,
D., . . . Jones, M. (2013). Classification and pathology of primary progressive
aphasia. Neurology, 81(21), 1832–1839.
Harvey, R. J., Skelton-Robinson, M., & Rossor, M. N. (2003). The prevalence and
causes of dementia in people under the age of 65 years. Journal of Neurology,
Neurosurgery, and Psychiatry, 74(9), 1206–1209.
Hodges, J. R., Martinos, M., Woollams, A. M., Patterson, K., & Adlam, A. L. (2008).
Repeat and Point: differentiating semantic dementia from progressive non-
fluent aphasia. Cortex, 44(9), 1265–1270.

References
81
Hodges, J. R., Patterson, K., Oxbury, S., & Funnell, E. (1992). Semantic dementia.
Progressive fluent aphasia with temporal lobe atrophy. Brain, 115 (6), 1783–
1806.
Hogan, D. B., Jette, N., Fiest, K. M., Roberts, J. I., Pearson, D., Smith, E. E., . . .
Maxwell, C. J. (2016). The prevalence and incidence of frontotemporal
dementia: a systematic review. Canadian Journal of Neurological Sciences, 43
Suppl 1, S96–S109.
Holland, A. L., McBurney, D. H., Moossy, J., & Reinmuth, O. M. (1985). The
dissolution of language in Pick's disease with neurofibrillary tangles: a case
study. Brain and Language, 24(1), 36–58.
Huang, W., Pach, D., Napadow, V., Park, K., Long, X., Neumann, J., . . . Witt, C. M.
(2012). Characterizing acupuncture stimuli using brain imaging with FMRI–a
systematic review and meta-analysis of the literature. PLoS One, 7(4),
e32960.
Josephs, K. A., Duffy, J. R., Strand, E. A., Whitwell, J. L., Layton, K. F., Parisi, J.
E., . . . Petersen, R. C. (2006). Clinicopathological and imaging correlates of
progressive aphasia and apraxia of speech. Brain, 129(6), 1385–1398.
Kim, E. J., Park, K. W., Lee, J. H., Choi, S., Jeong, J. H., Yoon, S. J., . . . Na, D. L.
(2014). Clinical and neuropsychological characteristics of a nationwide
hospital-based registry of frontotemporal dementia patients in Korea: A
CREDOS-FTD study. Dementia and Geriatric Cognitive Disorders Extra, 4(2),
242–251.
Klöppel, S., Stonnington, C. M., Barnes, J., Chen, F., Chu, C., Good, C. D., . . .
Frackowiak, R. S. (2008). Accuracy of dementia diagnosis: a direct
comparison between radiologists and a computerized method. Brain, 131(11),
2969–2974.
Klöppel, S., Stonnington, C. M., Chu, C., Draganski, B., Scahill, R. I., Rohrer, J.
D., . . . Frackowiak, R. S. (2008). Automatic classification of MR scans in
Alzheimer's disease. Brain, 131(3), 681–689.

References
82
Knibb, J. A., & Hodges, J. R. (2005). Semantic dementia and primary progressive
aphasia: a problem of categorization? Alzheimer Disease and Associated
Disorders, 19 Suppl 1, S7–14.
Knopman, D. S., & Roberts, R. O. (2011). Estimating the number of persons with
frontotemporal lobar degeneration in the US population. Journal of Molecular
Neuroscience, 45(3), 330–335.
Krueger, C. E., Dean, D. L., Rosen, H. J., Halabi, C., Weiner, M., Miller, B. L., . . .
Kramer, J. H. (2010). Longitudinal rates of atrophy in frontotemporal dementia,
semantic dementia, and alzheimer’s disease. Alzheimer Disease and
Associated Disorders, 24(1), 43–48.
Kumfor, F., Landin-Romero, R., Devenney, E., Hutchings, R., Grasso, R., Hodges,
J.R. . . . Piguet, O. (2016). On the right side? A longitudinal study of left-versus
right-lateralize semantic dementia. Brain, epub ahead of print.
Laird, A. R., Fox, P. M., Price, C. J., Glahn, D. C., Uecker, A. M., Lancaster, J. L., . . .
Fox, P. T. (2005). ALE meta-analysis: controlling the false discovery rate and
performing statistical contrasts. Human Brain Mapping, 25(1), 155–164.
Lancaster, J. L., Tordesillas-Gutierrez, D., Martinez, M., Salinas, F., Evans, A., Zilles,
K., . . . Fox, P. T. (2007). Bias between MNI and Talairach coordinates
analyzed using the ICBM-152 brain template. Human Brain Mapping, 28(11),
1194–1205.
Lerch, J. P., Pruessner, J., Zijdenbos, A. P., Collins, D. L., Teipel, S. J., Hampel, H.,
& Evans, A. C. (2008). Automated cortical thickness measurements from MRI
can accurately separate Alzheimer's patients from normal elderly controls.
Neurobiology of Aging, 29(1), 23–30.
Luukkainen, L., Bloigu, R., Moilanen, V., & Remes, A. M. (2015). Epidemiology of
frontotemporal lobar degeneration in Northern Finland. Dementia and Geriatric
Cognitive Disorders Extra, 5(3), 435–441.
McEvoy, L. K., & Brewer, J. B. (2010). Quantitative structural MRI for early detection
of Alzheimer's disease. Expert Review of Neurotherapeutics 10(11), 1675–
1688.

References
83
McKhann, G. M., Albert, M. S., Grossman, M., Miller, B., Dickson, D., & Trojanowski,
J. Q. (2001). Clinical and pathological diagnosis of frontotemporal dementia:
report of the Work Group on Frontotemporal Dementia and Pick's Disease.
Archives of Neurology, 58(11), 1803–1809.
Mesulam, M. M. (1982). Slowly progressive aphasia without generalized dementia.
Annals of Neurology, 11(6), 592–598.
Mesulam, M. M. (2001). Primary progressive aphasia. Annals of Neurology, 49(4),
425–432.
Mesulam, M. M., & Weintraub, S. (2014). Is it time to revisit the classification
guidelines for primary progressive aphasia? Neurology, 82(13), 1108–1109.
Mesulam, M. M., Weintraub, S., Rogalski, E. J., Wieneke, C., Geula, C., & Bigio, E.
H. (2014). Asymmetry and heterogeneity of Alzheimer's and frontotemporal
pathology in primary progressive aphasia. Brain, 137(4), 1176–1192.
Mesulam, M. M., Wicklund, A., Johnson, N., Rogalski, E., Leger, G. C., Rademaker,
A., . . . Bigio, E. H. (2008). Alzheimer and frontotemporal pathology in subsets
of primary progressive aphasia. Annals of Neurology, 63(6), 709–719.
Mesulam, M. M., Wieneke, C., Thompson, C., Rogalski, E., & Weintraub, S. (2012).
Quantitative classification of primary progressive aphasia at early and mild
impairment stages. Brain, 135(5), 1537–1553.
Misra, C., Fan, Y., & Davatzikos, C. (2009). Baseline and longitudinal patterns of
brain atrophy in MCI patients, and their use in prediction of short-term
conversion to AD: results from ADNI. NeuroImage, 44(4), 1415–1422.
Manoochehri, M., Huey, E.D. (2012). Diagnosis and management of behavioral
issues in frontotemporal dementia. Current Neurology and Neuroscience
Reports, 12, 528–536.
Moher, D., Liberati, A., Tetzlaff, J., & Altman, D. G. (2010). Preferred reporting items
for systematic reviews and meta-analyses: the PRISMA statement.
International Journal of Surgery, 8(5), 336–341.

References
84
Mummery, C. J., Patterson, K., Price, C. J., Ashburner, J., Frackowiak, R. S., &
Hodges, J. R. (2000). A voxel-based morphometry study of semantic
dementia: relationship between temporal lobe atrophy and semantic memory.
Annals of Neurology, 47(1), 36–45.
Neary, D., Snowden, J. S., Gustafson, L., Passant, U., Stuss, D., Black, S., . . .
Benson, D. F. (1998). Frontotemporal lobar degeneration: a consensus on
clinical diagnostic criteria. Neurology, 51(6), 1546–1554.
Neary, D., Snowden, J. S., & Mann, D. M. (1993a). The clinical pathological
correlates of lobar atrophy. Dementia, 4(3-4), 154–159.
Neary, D., Snowden, J. S., & Mann, D. M. (1993b). Familial progressive aphasia: its
relationship to other forms of lobar atrophy. Journal of Neurology,
Neurosurgery, and Psychiatry, 56(10), 1122–1125.
Nichols, T., Brett, M., Andersson, J., Wager, T., & Poline, J. B. (2005). Valid
conjunction inference with the minimum statistic. NeuroImage, 25(3), 653–660.
Onyike, C. U., & Diehl-Schmid, J. (2013). The epidemiology of frontotemporal
dementia. International Review of Psychiatry, 25(2), 130–137.
Otto, M., Ludolph, A. C., Landwehrmeyer, B., Förstl, H., Diehl-Schmid, J., Neumann,
M., . . . FTLD consortium (2011). Konsortium zur Erforschung der
frontotemporalen Lobärdegeneration [German consortium for frontotemporal
lobar degeneration]. Nervenarzt, 82, 1002–1005.
Perneczky, R., Diehl-Schmid, J., Pohl, C., Drzezga, A., & Kurz, A. (2007). Non-fluent
progressive aphasia: cerebral metabolic patterns and brain reserve. Brain
Research, 1133(1), 178–185.
Pick, A. (1892). Über die Beziehungen der senilen Hirnatrophie zur Aphasie. Prager
Medizinische Wochenschrift, 17, 165–167.
Pick, A. (1904). Zur Symptomatologie der linksseitigen Schäfenlappenatrophie.
Monatschrift für Psychiatrie und Neurologie, 16, 378–388.
Rabinovici, G. D., Jagust, W. J., Furst, A. J., Ogar, J. M., Racine, C. A., Mormino, E.
C., . . . Gorno-Tempini, M. L. (2008). Abeta amyloid and glucose metabolism

References
85
in three variants of primary progressive aphasia. Annals of Neurology, 64(4),
388–401.
Ratnavalli, E., Brayne, C., Dawson, K., & Hodges, J. R. (2002). The prevalence of
frontotemporal dementia. Neurology, 58(11), 1615–1621.
Riedl, L., Mackenzie, I. R., Förstl, H., Kurz, A., & Diehl-Schmid, J. (2014).
Frontotemporal lobar degeneration: current perspectives. Neuropsychiatric
Disease and Treatment, 10, 297–310.
Rogalski, E., Cobia, D., Harrison, T. M., Wieneke, C., Weintraub, S., & Mesulam, M.
M. (2011). Progression of language decline and cortical atrophy in subtypes of
primary progressive aphasia. Neurology, 76(21), 1804–1810.
Rogalski, E., Weintraub, S., & Mesulam, M. M. (2013). Are there susceptibility factors
for primary progressive aphasia? Brain and Language, 127(2), 135–138.
Rohrer, J. D., Caso, F., Mahoney, C., Henry, M., Rosen, H. J., Rabinovici, G., . . .
Gorno-Tempini, M. L. (2013). Patterns of longitudinal brain atrophy in the
logopenic variant of primary progressive aphasia. Brain and Language, 127,
121–126.
Rohrer, J. D., McNaught, E., Foster, J., Clegg, S. L., Barnes, J., Omar, R., . . . Fox,
N. C. (2008). Tracking progression in frontotemporal lobar degeneration: serial
MRI in semantic dementia. Neurology,71(18), 1445–1451.
Rosenfeld, M. (1909). Die partielle Großhirnatrophie. Journal für Psychologie und
Neurologie, 14, 115–130.
Sajjadi, S. A., Patterson, K., Arnold, R. J., Watson, P. C., & Nestor, P. J. (2012).
Primary progressive aphasia: a tale of two syndromes and the rest. Neurology,
78(21), 1670–1677.
Sajjadi, S. A., Patterson, K., & Nestor, P. J. (2014). Logopenic, mixed, or Alzheimer-
related aphasia? Neurology, 82(13), 1127–1131.
Schroeter, M. L., Laird, A. R., Chwiesko, C., Deuschl, C., Schneider, E., Bzdok,
D., . . . Neumann, J. (2014). Conceptualizing neuropsychiatric diseases with

References
86
multimodal data-driven meta-analyses - the case of behavioral variant
frontotemporal dementia. Cortex, 57, 22–37.
Schroeter, M. L., Raczka, K., Neumann, J., & von Cramon, D. Y. (2008). Neural
networks in frontotemporal dementia–a meta-analysis. Neurobiology of Aging,
29(3), 418–426.
Schroeter, M. L., Stein, T., Maslowski, N., & Neumann, J. (2009). Neural correlates of
Alzheimer's disease and mild cognitive impairment: a systematic and
quantitative meta-analysis involving 1351 patients. NeuroImage, 47(4), 1196–
1206.
Sérieux, P. (1893). Sur un cas de surdité verbale pure. Revue De Medecine, 13,
733–750.
Small, G. W., Bookheimer, S. Y., Thompson, P. M., Cole, G. M., Huang, S. C., Kepe,
V., & Barrio, J. R. (2008). Current and future uses of neuroimaging for
cognitively impaired patients. The Lancet Neurology, 7(2), 161–172.
Smith, S. M., & Nichols, T. E. (2009). Threshold-free cluster enhancement:
addressing problems of smoothing, threshold dependence and localisation in
cluster inference. NeuroImage,44, 83–98.
Snowden, J. S., Goulding, P. J., & Neary, D. (1989). Semantic dementia: A form of
circumscribed cerebral atrophy. Behavioral Neurology, 2, 167–182.
Snowden, J. S., Neary, D., Mann, D. M., Goulding, P. J., & Testa, H. J. (1992).
Progressive language disorder due to lobar atrophy. Annals of Neurology,
31(2), 174–183.
Teipel, S. J., Born, C., Ewers, M., Bokde, A. L., Reiser, M. F., Moller, H. J., &
Hampel, H. (2007). Multivariate deformation-based analysis of brain atrophy to
predict Alzheimer's disease in mild cognitive impairment. NeuroImage, 38(1),
13–24.
Tippett, D. C., Hillis, A. E., & Tsapkini, K. (2015). Treatment of primary progressive
aphasia. Current Treatment Options in Neurology, 17(8), 362.

References
87
Turkeltaub, P. E., Eden, G. F., Jones, K. M., & Zeffiro, T. A. (2002). Meta-analysis of
the functional neuroanatomy of single-word reading: method and validation.
NeuroImage, 16(3), 765–780.
Tyrrell, P. J., Kartsounis, L. D., Frackowiak, R. S., Findley, L. J., & Rossor, M. N.
(1991). Progressive loss of speech output and orofacial dyspraxia associated
with frontal lobe hypometabolism. Journal of Neurology, Neurosurgery, and
Psychiatry, 54(4), 351–357.
Vapnik, V. (1995). The nature of statistical learning theory. Berlin: Springer.
Vapnik, V. (1998). Statistical Learning Theory. New York: Wiley Interscience.
Vemuri, P., Gunter, J. L., Senjem, M. L., Whitwell, J. L., Kantarci, K., Knopman, D.
S., . . . Jack, C. R., Jr. (2008). Alzheimer's disease diagnosis in individual
subjects using structural MR images: validation studies. NeuroImage, 39(3),
1186–1197.
Vergara, I. A., Norambuena, T., Ferrada, E., Slater, A. W., & Melo, F. (2008). StAR: a
simple tool for the statistical comparison of ROC curves. BMC Bioinformatics,
9, 265.
Warrington, E. K. (1975). The selective impairment of semantic memory. Quarterly
Journal of Experimental Psychology, 27(4), 635–657.
Weiner, M. W., Aisen, P. S., Jack, C. R., Jr., Jagust, W. J., Trojanowski, J. Q., Shaw,
L., . . . Schmidt, M. (2010). The Alzheimer's disease neuroimaging initiative:
progress report and future plans. Alzheimer's & Dementia, 6(3), 202–
211.e207.
Weintraub, S., Fahey, C., Johnson, N., Mesulam, M. M., Gitelman, D. R., Weitner, B.
B., & Rademaker, A. (2006). Vasectomy in men with primary progressive
aphasia. Cognitive and Behavioral Neurology, 19(4), 190–193.
Wicklund, M. R., Duffy, J. R., Strand, E. A., Machulda, M. M., Whitwell, J. L., &
Josephs, K. A. (2014). Quantitative application of the primary progressive
aphasia consensus criteria. Neurology, 82(13), 1119–1126.
References
88
Wilson, S. M., Ogar, J. M., Laluz, V., Growdon, M., Jang, J., Glenn, S., . . . Gorno-
Tempini, M. L. (2009). Automated MRI-based classification of primary
progressive aphasia variants. NeuroImage, 47(4), 1558–1567.
Winkler, A., Ridgway, G. R., Webster, M., Smith, S., & Nichols, T. E. (2014).
Permutation inference for the general linear model. NeuroImage, 92, 381–397.
Withall, A., Draper, B., Seeher, K., & Brodaty, H. (2014). The prevalence and causes
of younger onset dementia in Eastern Sydney, Australia. International
Psychogeriatrics, 26(12), 1955–1965.
Yang, J., Pan, P., Song, W., Huang, R., Li, J., Chen, K., . . . Shang, H. (2012).
Voxelwise meta-analysis of gray matter anomalies in Alzheimer's disease and
mild cognitive impairment using anatomic likelihood estimation. Journal of the
Neurological Sciences, 316(1-2), 21–29.
Yang, J., Pan, P., Song, W., & Shang, H. F. (2012). Quantitative meta-analysis of
gray matter abnormalities in semantic dementia. Journal of Alzheimer’s
Disease, 31(4), 827–833.
Zahn, R., Buechert, M., Overmans, J., Talazko, J., Specht, K., Ko, C.-W., . . . Hüll, M.
(2005). Mapping of temporal and parietal cortex in nonfluent variant PPA and
Alzheimer’s disease using chemical shift imaging, voxel-based morphometry
and positron emission tomography. Psychiatry Research: Neuroimaging, 140,
115–131.
Zhang, Y., Tartaglia, M. C., Schuff, N., Chiang, G. C., Ching, C., Rosen, H. J., . . .
Weiner, M. W. (2013). MRI signatures of brain macrostructural atrophy and
microstructural degradation in frontotemporal lobar degeneration subtypes.
Journal of Alzheimer's Disease, 33(2), 431–444.

7. Appendix
89
7 Appendix
7.1 Supplementary material
7.1.A Supplementary material for “Validating New Diagnostic Imaging Criteria
for Primary Progressive Aphasia via ALE Meta-analyses”
Supplementary Table A.1
Overview of the studies included in the separate meta-analyses on semantic variant PPA, nonfluent variant PPA, and logopenic variant PPA
Study
N Diagnostic criteria Age Disease duration MMSE
SvPPA MRI
Adlam et al. (2006) 7 svPPA Gorno-Tempini et al. (2004)
62.8 (57-72) n.a. 26.0 (23-29)
12 HC 65.0 (55-75) 28.8 (27-30)
Agosta et al. (2012) 7 svPPA 27 HC
Gorno-Tempini et al. (2011)
71.5 ± 6.5 5.6 ± 1.5 20.4 ± 8.6
68.9 ± 5.9
Boxer et al. (2003) 11 svPPA Neary et al. (1998) 66.2 ± 9.8 n.a. 21.7 ± 7.1
15 HC 65.1 ± 8.3 29.5 ± 0.5
Brambati et al. (2009) 13 svPPA Neary et al. (1998) 62.0 ± 6.3 3.2 ± 1.1 22.0 ± 6.9
6 svPPA 63.1 ± 6.3 5.7 ± 3.7 27.0 ± 2.6
25 HC 64.8 ± 6.9 29.6 ± 0.8
Desgranges et al. 10 svPPA Neary et al. (1998) 65.7 ± 8.6 3.3 ± 2.5 24.2 ± 3.08
(2007) 17 HC 65.8 ± 7.4 n.a.
Gorno-Tempini et al. 10 svPPA Neary et al. (1998) 63.0 ± 5.8 4.0 ± 1.2 23.1 ± 6.5
(2004) 64 HC Gorno-Tempini et al. (2004)
68.2 (56-81) n.a.
Grossman et al. (2004)
8 svPPA McKhann et al. (2001) 65.5 ± 13 3.46 ± 3.27 23.8 ± 4.6
12 HC Neary et al. (1998) 68.5 ± 9.4 n.a.
The L&MG (1994)
Halpern et al. (2004) 3 svPPA McKhann et al. (2001) 67.73 ± 8.75 4.72 ± 1.73 22.87 ± 3.72
12 HC Neary et al. (1998) matched
The L&MG (1994)
Josephs et al. (2008) 15 svPPA Neary et al. (1998) 64 (54-74) 3.7´(0.7-0.5) 21 (9-28)
12 svPPA 64 (49-77) 3.4 (1.2-5.4) 26 (18-29)
27 HC 64 (53-75) 29 (27-30)
Josephs et al. (2009) 8 svPPA Neary et al. (1998) 68 (56-73) n.a. 26 (20-27)
30 HC matched
Mummery et al. (2000)
6 svPPA Neary et al. (1998) 60.5 (58-65) n.a. n.a.
14 HC 62 (60–65)
Noppeney et al. (2007)
6 svPPA The L&MG (1994) 61.17 (59-66)
n.a. 21.83
60 HC
Pereira et al. (2009) 8 svPPA Neary et al. (1998) 62.9 ± 6.40 5.0 ± 2.52 21.0 ± 5.86
25 HC 63.8 ± 7.20 29.3 ± 0.84
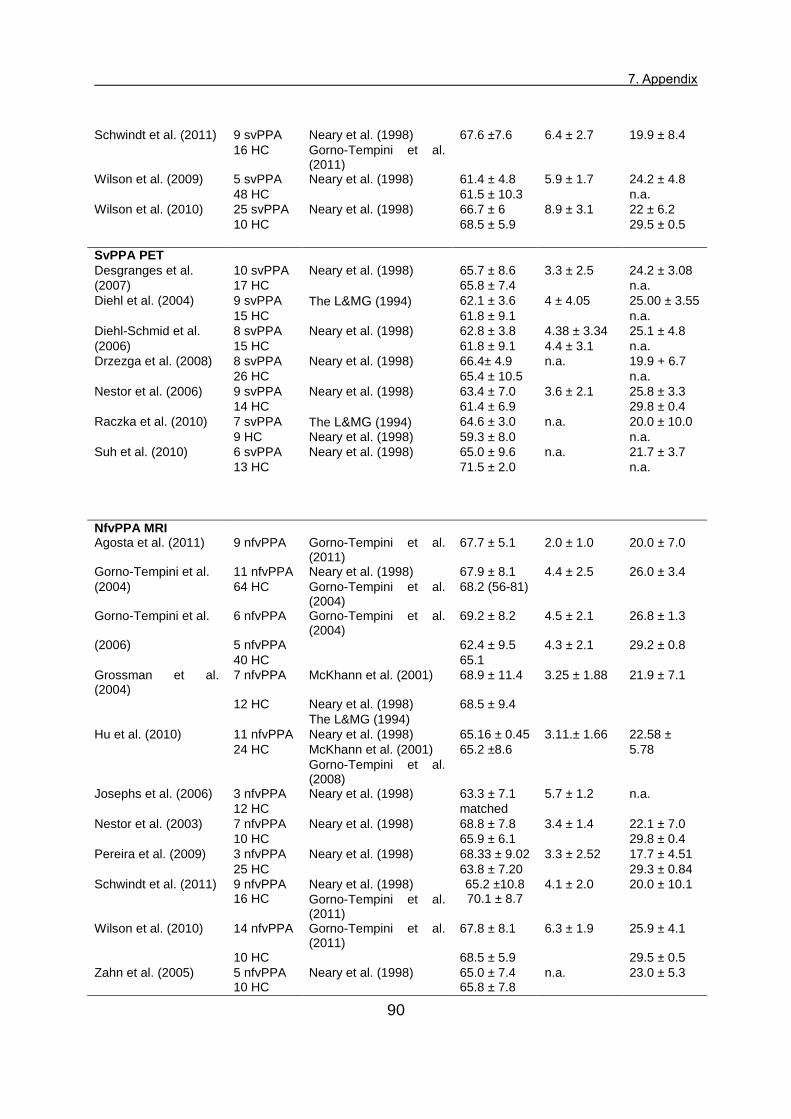
7. Appendix
90
Schwindt et al. (2011) 9 svPPA Neary et al. (1998) 67.6 ±7.6 6.4 ± 2.7 19.9 ± 8.4
16 HC Gorno-Tempini et al. (2011)
Wilson et al. (2009) 5 svPPA Neary et al. (1998) 61.4 ± 4.8 5.9 ± 1.7 24.2 ± 4.8
48 HC 61.5 ± 10.3 n.a.
Wilson et al. (2010) 25 svPPA Neary et al. (1998) 66.7 ± 6 8.9 ± 3.1 22 ± 6.2
10 HC 68.5 ± 5.9 29.5 ± 0.5
SvPPA PET
Desgranges et al. 10 svPPA Neary et al. (1998) 65.7 ± 8.6 3.3 ± 2.5 24.2 ± 3.08
(2007) 17 HC 65.8 ± 7.4 n.a.
Diehl et al. (2004) 9 svPPA The L&MG (1994) 62.1 ± 3.6 4 ± 4.05 25.00 ± 3.55
15 HC 61.8 ± 9.1 n.a.
Diehl-Schmid et al. 8 svPPA Neary et al. (1998) 62.8 ± 3.8 4.38 ± 3.34 25.1 ± 4.8
(2006) 15 HC 61.8 ± 9.1 4.4 ± 3.1 n.a.
Drzezga et al. (2008) 8 svPPA Neary et al. (1998) 66.4± 4.9 n.a. 19.9 + 6.7
26 HC 65.4 ± 10.5 n.a.
Nestor et al. (2006) 9 svPPA Neary et al. (1998) 63.4 ± 7.0 3.6 ± 2.1 25.8 ± 3.3
14 HC 61.4 ± 6.9 29.8 ± 0.4
Raczka et al. (2010) 7 svPPA The L&MG (1994) 64.6 ± 3.0 n.a. 20.0 ± 10.0
9 HC Neary et al. (1998) 59.3 ± 8.0 n.a.
Suh et al. (2010) 6 svPPA Neary et al. (1998) 65.0 ± 9.6 n.a. 21.7 ± 3.7
13 HC 71.5 ± 2.0 n.a.
NfvPPA MRI Agosta et al. (2011) 9 nfvPPA Gorno-Tempini et al.
(2011) 67.7 ± 5.1 2.0 ± 1.0 20.0 ± 7.0
Gorno-Tempini et al. 11 nfvPPA Neary et al. (1998) 67.9 ± 8.1 4.4 ± 2.5 26.0 ± 3.4
(2004) 64 HC Gorno-Tempini et al. (2004)
68.2 (56-81)
Gorno-Tempini et al. 6 nfvPPA Gorno-Tempini et al. (2004)
69.2 ± 8.2 4.5 ± 2.1 26.8 ± 1.3
(2006) 5 nfvPPA 62.4 ± 9.5 4.3 ± 2.1 29.2 ± 0.8
40 HC 65.1
Grossman et al. (2004)
7 nfvPPA McKhann et al. (2001) 68.9 ± 11.4 3.25 ± 1.88 21.9 ± 7.1
12 HC Neary et al. (1998) 68.5 ± 9.4
The L&MG (1994)
Hu et al. (2010) 11 nfvPPA Neary et al. (1998) 65.16 ± 0.45 3.11.± 1.66 22.58 ±
24 HC McKhann et al. (2001) 65.2 ±8.6 5.78
Gorno-Tempini et al. (2008)
Josephs et al. (2006) 3 nfvPPA Neary et al. (1998) 63.3 ± 7.1 5.7 ± 1.2 n.a.
12 HC matched
Nestor et al. (2003) 7 nfvPPA Neary et al. (1998) 68.8 ± 7.8 3.4 ± 1.4 22.1 ± 7.0
10 HC 65.9 ± 6.1 29.8 ± 0.4
Pereira et al. (2009) 3 nfvPPA Neary et al. (1998) 68.33 ± 9.02 3.3 ± 2.52 17.7 ± 4.51
25 HC 63.8 ± 7.20 29.3 ± 0.84
Schwindt et al. (2011) 9 nfvPPA 16 HC
Neary et al. (1998) 65.2 ±10.8 70.1 ± 8.7
4.1 ± 2.0 20.0 ± 10.1
Gorno-Tempini et al. (2011)
Wilson et al. (2010) 14 nfvPPA Gorno-Tempini et al. (2011)
67.8 ± 8.1 6.3 ± 1.9 25.9 ± 4.1
10 HC 68.5 ± 5.9 29.5 ± 0.5
Zahn et al. (2005) 5 nfvPPA 10 HC
Neary et al. (1998) 65.0 ± 7.4 65.8 ± 7.8
n.a. 23.0 ± 5.3

7. Appendix
91
NfvPPA PET
Nestor et al. (2003) 7 nfvPPA Neary et al. (1998) 68.8 ± 7.8 3.4 ± 1.4 22.1 ± 7.0
10 HC 65.9 ± 6.1 29.8 ± 0.4 Perneczky et al. (2007)
11 nfvPPA 16 HC
Neary et al. (1998) 69.91 ± 8.10 67.88 ± 9.99
3.20 ± 2.04 18.91 ± .76 30.00 ± 0.00
Zahn et al. (2005) 5 nfvPPA Neary et al. (1998) 65.0 ± 7.4 n.a 23.0 ± 5.3
12 HC 48.0 ± 16.0 n.a.
LvPPA MRI
Agosta et al. (2011) 4 lvPPA 27 HC
Gorno-Tempini et al. (2011)
66.8 ± 6.4 68.9 ± 5.9
2.5 ± 0.7 19.5 ± 5.2
Gorno-Tempini et al. 10 lvPPA Neary et al. (1998) 72.0 ± 8.5 4.5 ± 0.8 22.2 ± 4.6
(2004) 64 HC Gorno-Tempini et al. (2004)
68.2(56–81)
Gorno-Tempini et al. (2008)
4 lvPPA 40 HC
Gorno-Tempini et al. (2004)
58.75 ± 2.9 matched
3 ± 0 21.5 ± 2.87
Hu et al. (2010) 12 lvPPA Neary et al. (1998) 62.74 ± 8.36 3.05 ± 1.9 22.28 ± 7.73
24 HC McKhann et al. (2001) 65.2 ±8.6
Gorno-Tempini et al. (2008)
Migliaccio et al. (2009)
10 lvPPA 65 HC
Gorno-Tempini et al. (2004)
63.5 ± 7.2 60.7 ± 10.1
3.3 ± 2.1 20.5 ± 4.4 28 ± 1.5
Wilson et al. (2010) 11 lvPPA 10 HC
Gorno-Tempini et al. (2011)
63.5 ± 7.3 68.5 ± 5.9
6 ± 2.8 22.3 ± 6.2 29.5 ± 0.5
Note. HC healthy controls, lvPPA logopenic variant PPA, L&MG Lund and Manchester groups, MMSE Mini-Mental State Examination, MRI magnetic resonance imaging, nfvPPA nonfluent variant PPA, n.a. not available, N number of subjects, PET positron emission tomography, svPPA semantic variant PPA. Age (years), disease duration (years), and MMSE are indicated either as mean (range) or mean ± standard deviation as reported in the respective single studies. The diagnostic criteria were taken as they were from the original studies.

7. Appendix
92
Supplementary Table A.2
Results of the subtraction analyses between meta-analyses on semantic variant PPA (magnetic resonance imaging studies versus positron emission tomography studies) and between meta-analyses on different variants of primary progressive aphasia (magnetic resonance imaging studies)
Note. ALE anatomical likelihood estimation, BAs Brodmann areas, FDG-PET fluorodeoxyglucose positron emission tomography, Lat. lateralization, L left, lvPPA logopenic variant PPA, MNI Montreal Neurological Institute, MRI magnetic resonance imaging, nfvPPA nonfluent variant PPA, R right, svPPA semantic variant PPA.
Region Lat. BAs MNI
coordinates x y z
Volume (mm3)
ALE-value
SvPPA MRI > PET Inferior, middle, & superior temporal gyri/fusiform gyrus/
R 28/34/38 27 -0 -21 6592 3.2389
hippocampus/parahippocampal gyrus/amygdala
Hippocampus/parahippocampal gyrus/amygdala
L 28/34 -26 -4 -20 3504 2.9478
SvPPA PET > MRI Thalamus L -7 -18 15 280 1.8807 Inferior temporal gyrus /fusiform gyrus
L 20 -48 -22 -32 240 2.2903
SvPPA > nfvPPA & lvPPA Inferior, middle, & superior temporal gyri/fusiform gyrus/ hippocampus/parahippocampal gyrus/amygdala
R 28/34/38/ 27 -1 -1 8952 3.7190
Inferior temporal gyrus/hippocampus/parahippocampal gyrus
L 20/28 -28 -4 -7 5304 3.7190
Fusiform & parahippocampal gyri L 20/36 -38 -30 -22 1432 3.1559 Superior temporal gyrus L 38 -44 15 -3 912 1.9881 Inferior temporal gyrus L 21/38 -42 -2 -44 664 2.5366 Middle temporal gyrus R 21 48 10 -44 472 2.9112 Superior temporal gyrus L 38 -36 14 -42 248 2.1200
NfvPPA > svPPA & lvPPA Insula/inferior frontal gyrus L 6 -42 22 2 944 3.2388 Middle frontal gyrus L 13/44 -35 42 21 448 2.2903 Superior frontal gyrus L -21 -7 62 448 2.9478 Insula L 13 -40 4 49 424 1.8694 Putamen L 10 -24 10 -4 416 2.8208 Insula L 9 -52 14 18 368 1.9172
LvPPA > svPPA & nfvPPA Middle & superior temporal gyri L 13/21/22 -55 -39 9 3352 3.7190 Supramarginal gyrus L 39/40 -55 -52 33 2184 3.5401 Temporal gyrus L 21/22 -65 -22 1 1192 3.7190

7. Appendix
93
Dia
gn
osti
c c
rite
ria f
or
fro
nto
tem
po
ral d
em
en
tia
Mc K
han
n a
nd
co
lleag
ues
(2001)
The d
eve
lopm
ent o
f be
havio
ral or
co
gn
itiv
e d
eficits is m
an
ifeste
d b
y
•
early a
nd p
rogre
ssiv
e c
ha
nge in p
ers
ona
lity, ch
ara
cte
rized b
y
difficu
lty in m
odu
lating b
ehavio
r, o
ften r
esu
ltin
g in ina
ppro
priate
respo
nses o
r activitie
s
or •
ea
rly
and
pro
gre
ssiv
e
ch
ange
in
lang
uag
e,
chara
cte
rized
by
pro
ble
ms
with
expre
ssio
n
of
lan
gua
ge
or
severe
n
am
ing
difficulty a
nd p
rob
lem
s w
ith
word
mean
ing
The
deficits
cause
sig
nific
ant
impa
irm
ent
in
socia
l or
occupa
tio
na
l
functionin
g a
nd r
epre
sent
a s
ignific
an
t d
eclin
e f
rom
a p
revio
us l
eve
l of
functionin
g
The c
ours
e i
s c
hara
cte
rize
d b
y a
gra
dua
l onset
and c
ontin
uin
g d
eclin
e
in f
unction.
The d
eficits a
re n
ot
due t
o o
ther
nerv
ous s
yste
m c
onditio
ns,
syste
mic
conditio
ns, or
substa
nce
-in
duced c
onditio
ns
The d
eficits d
o n
ot
occur
exclu
siv
ely
durin
g a
de
liriu
m
The d
istu
rba
nce is n
ot b
ett
er
accounte
d f
or
by a
psychia
tric
dia
gn
osis
Th
e L
un
d a
nd
Man
ch
este
r G
rou
p (
19
94)
This
art
icle
focused o
n t
he
dia
gnostic f
ea
ture
s f
or
the b
ehavio
ral
variant
of
fron
tote
mp
ora
l dem
entia
and
re
ferr
ed
the
rea
der
to
pre
vio
us lit
era
ture
(N
eary
et
al.,
199
3a,
199
3b;
Sno
wden
et
al.,
1992)
for
a m
ore
deta
iled d
escription o
f th
e d
iagnostic f
eatu
res o
f
the lan
gua
ge v
ari
ant
of fr
on
tote
mpora
l d
em
entia.
Neary
an
d
co
lleag
ue
s
(1993
a,
19
93b
) &
S
no
wd
en
an
d
co
lleag
ue
s (
19
92)
Pro
file
A (
anom
ia/n
on
flu
ent)
om
issio
n o
r in
corr
ect use o
f pre
positio
ns a
nd o
ther
fille
r w
ord
s
nonflue
nt
aph
asia
with a
hesitan
t, b
roken,
tele
gra
mm
atic s
tyle
of
speech
rela
tively
spare
d
co
mpre
hensio
n
(how
ever
difficultie
s
in
the
unders
tand
ing o
f spa
tia
l pre
positio
ns a
nd
of co
mp
lex s
ynta
x)
dysle
xia
and d
ysgra
ph
ia
imp
aire
d r
ep
etitio
n w
ith s
ou
nd
-base
d/p
hone
mic
err
ors
word
-fin
din
g d
ifficulty, w
ith litera
l an
d v
erb
al p
ara
phasia
s
Pro
file
B (
anom
ia +
co
mpre
hensio
n d
isord
er/
flu
ent)
imp
aire
d
confr
onta
tio
n
nam
ing
and
und
ers
tand
ing
of
word
mean
ing
rela
tively
pre
serv
ed r
ea
din
g a
loud
an
d w
ritin
g to d
icta
tion
spare
d r
ep
etitio
n
flue
nt
aph
asia
w
ith
norm
al
art
icu
lation,
pro
so
dy,
and
synta
x
nam
ing d
ifficu
ltie
s
a p
rop
ort
ion o
f th
ese
patie
nts
develo
ps v
isua
l associa
tive a
gn
osia
verb
al p
ara
phasia
s
Pro
file
C (
share
d f
eatu
res o
f pro
file
s A
and B
)
Sup
ple
me
nta
ry T
ab
le A
.3
Form
er
dia
gnostic c
rite
ria f
or
prim
ary
pro
gre
ssiv
e a
ph
asia

7. Appendix
94
Dia
gn
osti
c c
rite
ria f
or
pri
mary
pro
gre
ssiv
e a
ph
asia
((M
esu
lam
, 2
001)
•
Insid
ious o
nset a
nd g
radu
al pro
gre
ssio
n o
f w
ord
fin
din
g, ob
ject-
na
min
g,
or
word
-com
pre
hensio
n im
pair
ments
as m
an
ifeste
d d
urin
g
sponta
neo
us c
onvers
ation o
r as a
ssessed thro
ugh f
orm
al neuro
psycholo
gic
al te
sts
of la
ng
uag
e
•
All
limitatio
n o
f da
ily liv
ing a
ctivitie
s a
ttri
buta
ble
to
the
langu
ag
e im
pa
irm
ent, f
or
at
least
2 y
ears
aft
er
onset
•
Inta
ct pre
morb
id la
ngu
age f
unctio
n
•
Absence o
f sig
nific
ant a
path
y, dis
inh
ibitio
n, fo
rgetf
uln
ess for
recent even
ts, vis
uospatial im
pa
irm
en
t, v
isua
l re
cognitio
n d
eficits o
r
sensory
-moto
r dysfu
nction w
ith
in t
he in
itia
l 2 y
ears
of
the illn
ess
•
Acalc
ulia
an
d ideo
moto
r ap
raxia
may b
e p
resent
even in t
he f
irst 2 y
ears
•
Oth
er
do
ma
ins p
ossib
ly a
ffecte
d a
fter
the f
irst 2 y
ears
but w
ith la
ngu
age r
em
ain
ing the
most
impair
ed f
unctio
n thro
ugh
out th
e c
ours
e o
f
the illn
ess a
nd d
ete
riora
ting
faste
r th
an o
ther
affecte
d d
om
ain
s
•
Absence o
f “s
pecific
” cause
s s
uch a
s s
troke o
r tu
mor
as a
scert
ain
ed b
y n
euro
ima
gin
g
Dia
gn
osti
c c
rite
ria f
or
the
su
bty
pes o
f p
rim
ary
pro
gre
ss
ive a
ph
asia
(N
eary
et
al.,
199
8)
Sem
antic d
em
en
tia
Core
dia
gnostic f
eatu
res
•
Insid
ious o
nset a
nd g
radu
al pro
gre
ssio
n
•
Lang
uag
e D
isord
er
chara
cte
rized b
y
◦
Pro
gre
ssiv
e, flu
ent,
em
pty
sponta
neo
us s
peech
◦
Loss o
f w
ord
me
an
ing,
ma
nifest
by im
pa
ired n
am
ing a
nd
com
pre
hensio
n
◦
Sem
antic p
ara
phasia
s a
nd o
r
•
Perc
eptu
al dis
ord
er
chara
cte
rized b
y
◦
Pro
sopa
gnosia
: im
pair
ed r
ecognitio
n o
f id
entity
of fa
mili
ar
faces
and/o
r
◦
Associa
tive a
gnosia
: im
pair
ed r
ecog
nitio
n o
f ob
ject id
entity
•
Pre
serv
ed p
erc
eptu
al m
atc
hin
g a
nd d
raw
ing r
epro
duction
•
Pre
serv
ed s
ingle
-word
re
pe
tition
•
Pre
serv
ed a
bili
ty t
o r
ea
d a
loud a
nd w
rite
to d
icta
tio
n o
rthogra
phic
ally
regula
r w
ord
s
Pro
gre
ssiv
e n
onflu
ent
aph
asia
Core
dia
gnostic f
eatu
res
•
Insid
ious o
nset a
nd g
radu
al pro
gre
ssio
n
•
Nonflue
nt spo
nta
neo
us s
pe
ech w
ith a
t le
ast on
e o
f th
e
follo
win
g:
agra
mm
atism
, ph
onem
ic p
ara
ph
asia
s,
ano
mia
Sup
ple
me
nta
ry T
ab
le A
.3 (
contin
ued)
Form
er
dia
gnostic c
rite
ria f
or
prim
ary
pro
gre
ssiv
e a
ph
asia

7. Appendix
95
Dia
gn
osti
c c
rite
ria f
or
the
su
bty
pes o
f p
rim
ary
pro
gre
ss
ive a
ph
asia
(N
eary
et
al.,
199
8)
(co
nti
nu
ed
)
Sup
port
ive
dia
gn
ostic f
eatu
res
•
Spe
ech a
nd lan
gua
ge
◦
Pre
ss o
f spe
ech
◦
Idio
syncra
tic w
ord
usa
ge
◦
Absence o
f p
ho
nem
ic p
ara
phasia
s
◦
Surf
ace d
ysle
xia
an
d d
ysgra
ph
ia
◦
Pre
serv
ed c
alc
ula
tio
n
•
Beh
avio
r
◦
Loss o
f sym
path
y a
nd e
mp
ath
y
◦
Narr
ow
ed p
reoccup
ations
◦
Pars
imony
•
Physic
al sig
ns
◦
Absent
or
late
prim
itiv
e r
eflexes
◦
Akin
esia
, ri
gid
ity,
and
tre
mor
•
Investig
ations
•
Neuro
psycho
logy
◦
Pro
found s
em
antic loss, m
anifest in
fa
ilure
of
word
com
pre
hensio
n a
nd n
am
ing a
nd/o
r fa
ce
an
d o
bje
ct
recognitio
n
◦
Pre
serv
ed p
hon
olo
gy a
nd s
ynta
x, an
d e
lem
enta
ry p
erc
eptu
al
pro
cessin
g, sp
atial skill
s,
and d
ay-t
o-d
ay m
em
ori
zin
g
•
Ele
ctr
oencep
ha
logra
phy: n
orm
al
•
Bra
in im
ag
ing (
str
uctu
ral an
d/o
r fu
nctio
na
l): pre
dom
ina
nt an
terior
tem
pora
l abn
orm
alit
y (
sym
metr
ic o
r asym
metr
ic)
Sup
port
ive
dia
gn
ostic f
eatu
res
•
Spe
ech a
nd lan
gua
ge
◦
Stu
tterin
g o
r ora
l apra
xia
◦
Impa
ired r
epetition
◦
Ale
xia
, agra
phia
◦
Early p
reserv
atio
n o
f w
ord
me
an
ing
◦
Late
mutism
•
Beh
avio
r
◦
Early p
reserv
atio
n o
f socia
l skill
s
◦
Late
beh
avio
ral cha
nges s
imila
r to
FT
D
•
Physic
al sig
ns
◦
late
contr
ala
tera
l prim
itiv
e r
eflexes,
akin
esia
,
rigid
ity, a
nd tre
mor
•
Investig
ations
◦
Neuro
psycho
logy:
nonflu
en
t aph
asia
in t
he a
bsence
of severe
am
nesia
or
perc
eptu
osp
atial dis
ord
er
◦
Ele
ctr
oencep
ha
logra
phy: n
orm
al or
min
or
asym
metr
ic s
low
ing
◦
Bra
in im
ag
ing (
str
uctu
ral an
d/o
r fu
nctio
na
l):
asym
metr
ic a
bn
orm
alit
y p
redom
inantly a
ffectin
g
dom
ina
nt (u
sua
lly left)
he
mis
phere
Sup
ple
me
nta
ry T
ab
le A
.3 (
contin
ued)
Form
er
dia
gnostic c
rite
ria f
or
prim
ary
pro
gre
ssiv
e a
ph
asia

7. Appendix
96
Supplementary Figure A: PRISMA 2009 Flow Diagram of the study selection for the meta-analyses on primary progressive aphasia
Records identified through database searching (n = 658)
Additional records identified through other sources
(n = 0)
Records after duplicates removed (n = 658)
Records screened based on title and abstract
(n = 180)
Full-text articles excluded (n = 150)
42 reviews/case reports
31 no whole brain coordinates
(region of interest, correlation between atrophy and psychological functions)
24 no healthy controls
41 PPA without further specification
12 other methods (fMRI, cortical thickness)
Iden
tificatio
n
Scre
en
ing
Elig
ibility
In
clu
ded
Full-text articles assessed for eligibility
(n = 180)
Studies included in qualitative data synthesis
(n = 30)
Records excluded (n = 478)
Studies included in quantitative data synthesis
(meta-analysis) (n = 30)

7. Appendix
97
Supplementary references A
Reference list of the studies included in the ALE meta-analyses on primary
progressive aphasia.
Adlam, A. L., Patterson, K., Rogers, T. T., Nestor, P. J., Salmond, C. H., Acosta-
Cabronero, J., & Hodges, J. R. (2006). Semantic dementia and fluent primary
progressive aphasia: two sides of the same coin? Brain, 129, 3066–3080.
Agosta, F., Scola, E., Canu, E., Marcone, A., Magnani, G., Sarro, L., . . . Filipp, M.
(2012). White matter damage in frontotemporal lobar degeneration spectrum.
Cerebral Cortex, 22, 2705–2714.
Boxer, A. L., Rankin, K. P., Miller, B. L., Schuff, N., Weiner, M., Gorno-Tempini, M. L.,
& Rosen, H. J. (2003). Cinguloparietal atrophy distinguishes Alzheimer
disease from semantic dementia. Archives of Neurology, 60, 949–956.
Brambati, S. M., Rankin, K. P., Narvid, J., Seeley, W. W., Dean, D., Rosen, H. J., . . .
Gorno-Tempini, M. L. (2007). Atrophy progression in semantic dementia with
asymmetric temporal involvement: A tensor-based morphometry study.
Neurobiology of Aging, 30(1), 103–111.
Desgranges, B., Matuszewski, V., Piolino, P., Chetelat, G., Mezenge, F., Landeau,
B., . . . Eustache, F. (2007). Anatomical and functional alterations in semantic
dementia: a voxel-based MRI and PET study. Neurobiology of Aging, 28,
1904–1913.
Diehl-Schmid, J., Grimmer, T., Drzezga, A., Bornschein, S., Perneczky, R., Förstl,
H., . . . Kurz, A. (2006). Longitudinal changes of cerebral glucose metabolism
in semantic dementia. Dementia and Geriatric Cognitive Disorders, 22, 346–
351.
Diehl, J., Grimmer, T., Drzezga, A., Riemenschneider, M., Förstl, H., & Kurz, A.
(2004). Cerebral metabolic patterns at early stages of frontotemporal dementia
and semantic dementia. A PET study. Neurobiology of Aging, 25, 1051–1056.
Drzezga, A., Grimmer, T., Henriksen, G., Stangier, I., Perneczky, R., Diehl-Schmid,
J., . . . Kurz, A. (2008). Imaging of amyloid plaques and cerebral glucose
metabolism in semantic dementia and Alzheimer’s disease. NeuroImage, 39,
619–633.
Gorno-Tempini, M. L., Brambati, S. M., Ginex, V., Ogar, J., Dronkers, N. F., Marcone,
A., . . . Miller, B. L. (2008). The logopenic/phonological variant of primary
progressive aphasia. Neurology, 71, 1227–1234.

7. Appendix
98
Gorno-Tempini, M. L., Dronkers, N. F., Rankin, K. P., Ogar, J. M., Phengrasamy, L.,
Rosen, H. J., . . . Miller, B. L. (2004). Cognition and anatomy in three variants
of primary progressive aphasia. Annals of Neurology, 55, 335–346.
Gorno-Tempini, M. L., Ogar, J. M., Brambati, S. M., Wang, P., Jeong, J. H., Rankin,
K. P., . . . Miller, B. L. (2006). Anatomical correlates of early mutism in
progressive nonfluent aphasia. Neurology, 67, 1849–1851.
Grossman, M., McMillan, C., Moore, P., Ding, L., Glosser, G., Work, M., & Gee, J.
(2004). What’s in a name: voxel-based morphometric analyses of MRI and
naming difficulty in Alzheimer’s disease, frontotemporal dementia and
corticobasal degeneration. Brain, 127, 628–649.
Halpern, C. H., Glosser, G., Clark, R., Gee, J., Moore, P., Dennis, K., . . . Grossman,
M. (2004). Dissociation of numbers and objects in corticobasal degeneration
and semantic dementia. Neurology, 62, 1163–1169.
Hu, W. T., McMillan, C., Libon, D., Leight, S., Forman, M., Lee, V. M., . . . Grossman,
M. (2010). Multimodal predictors for Alzheimer disease in nonfluent primary
progressive aphasia. Neurology, 75, 595–602.
Josephs, K. A., Duffy, J. R., Strand, E. A., Whitwell, J. L., Layton, K. F., Parisi, J.
E., . . . Petersen, R. C. (2006). Clinicopathological and imaging correlates of
progressive aphasia and apraxia of speech. Brain, 129, 1385–1398.
Josephs, K. A., Whitwel, J., ., Knopman, D. S., Boeve, B. F., Vemuri, P., Senjem, M.
L., . . . Jack, C. R. J. (2009). Two distinct subtypes of right temporal variant
frontotemporal dementia. Neurology, 73, 1443–1450.
Josephs, K. A., Whitwell, J. L., Vemuri, P., Senjem, M. L., Boeve, B. F., Knopman, D.
S., . . . Jack, C. R. J. (2008). The anatomic correlate of prosopagnosia in
semantic dementia. Neurology, 71, 1628–1633.
Migliaccio, R., Agosta, F., Rascovsky, K., Karydas, A., Bonasera, S., Rabinovici, G.
D., . . . Gorno-Tempini, M. L. (2009). Clinical syndromes associated with
posterior atrophy: early age at onset AD spectrum. Neurology 73, 1571–1578.
Mummery, C. J., Patterson, K., Price, C. J., Ashburner, J., Frackowiak, R. S., &
Hodges, J. R. (2000). A voxel-based morphometry study of semantic
dementia: Relationship between temporal lobe atrophy and semantic memory.
Annals of Neurology, 47, 36–45.
Nestor, P. J., Fryer, T. D., & Hodges, J. R. (2006). Declarative memory impairments
in Alzheimer’s disease and semantic dementia. NeuroImage, 30, 1010–1020.
Nestor, P. J., Graham, N. L., Fryer, T. D., Williams, G. B., Patterson, K., & Hodges, J.
R. (2003). Progressive non‐fluent aphasia is associated with hypometabolism
centred on the left anterior insula. Brain, 126, 2406–2418.

7. Appendix
99
Noppeney, U., Patterson, K., Tyler, L. K., Moss, H. E., Stamatakis, E. A., Bright,
P., . . . Price, C. J. (2007). Temporal lobe lesions and semantic impairment: a
comparison of herpes simplex virus encephalitis and semantic dementia.
Brain, 130, 1138–1147.
Pereira, J. M., Williams, G. B., Acosta-Cabronero, J., Pengas, G., Spillantini, M. G.,
Xuereb, J. H., . . . Nestor, P. J. (2009). Atrophy patterns in histologic vs clinical
groupings of frontotemporal lobar degeneration. Neurology, 72, 19, 1653–
1660.
Perneczky, R., Diehl-Schmid, J., Pohl, C., Drzezga, A., & Kurz, A. (2007). Non-fluent
progressive aphasia: cerebral metabolic patterns and brain reserve. Brain
Research, 1133, 178–185.
Raczka, K. A., Becker, G., Seese, A., Frisch, S., Heiner, S., Marschhauser, A., . . .
Schroeter, M. L. (2010). Executive and behavioral deficits share common
neural substrates in frontotemporal lobar degeneration – a pilot FDG-PET
study. Psychiatry Research: Neuroimaging, 182, 274–280.
Schwindt, G. C., Graham, N. L., Rochon, E., Tang-Wai, D. F., Lobaugh, N. J., Chow,
T. W., & Black, S. E. Whole-brain white matter disruption in semantic and
nonfluent variants of primary progressive aphasia. Human Brain Mapping,
34(4), 973–984.
Suh, M. K., Kim, E. J., Lee, B. H., Seo, S. W., Chin, J., Kang, S. J., & Na, D. L.
(2010). Hanja (Ideogram) alexia and agraphia in patients with semantic
dementia. Neurocase, 16, 146–156.
Wilson, S. M., Brambati, S. M., Henry, R. G., Handwerker, D. A., Agosta, F., Miller, B.
L., . . . Gorno-Tempini, M. L. (2009). The neural basis of surface dyslexia in
semantic dementia. Brain, 132, 71–86.
Wilson, S. M., Henry, M. L., Besbris, M., Ogar, J. M., Dronkers, N. F., Jarrold, W., . . .
Gorno-Tempini, M. L. (2010). Connected speech production in three variants
of primary progressive aphasia. Brain, 133, 2069–2088.
Zahn, R., Buechert, M., Overmans, J., Talazko, J., Specht, K., Ko, C. W., . . . Hüll, M.
(2005). Mapping of temporal and parietal cortex in progressive nonfluent
aphasia and Alzheimer’s disease using chemical shift imaging, voxel-based
morphometry and positron emission tomography. Psychiatry Research:
Neuroimaging, 140, 115–131

7. Appendix
100
7.1.B Supplementary material for “Validating New Diagnostic Imaging Criteria
for Primary Progressive Aphasia via ALE Meta-analyses”
Supplementary Table B.1 Demographic and clinical characteristics of the investigated subject groups
HC
lvP
PA
11
5/6
10
/1
63
.45
± 7
.01
14
.36
± 3
.33
- 0.6
0 ±
0.0
5
0.0
0 ±
0.0
0
0.0
5 ±
0.1
5
28
.91
± 0
.83
22
.73
± 3
.13
7.5
5 ±
2.7
3
9.7
3 ±
0.6
5
10
.00
± 0
.00
11
.00
± 0
.00
9.2
7 ±
1.9
0
38
.45
± 1
0.4
1
78
.64
± 2
1.7
7
14
.73
± 0
.65
25
.82
± 5
.65
17
.36
± 5
.22
10
.00
± 0
.00
10
.00
± 0
.00
HC
nfv
PP
A
16
9/7
11
/5
68
.38
± 7
.15
13
.88
± 3
.24
- 0.5
9
± 0
.05
0.0
3 ±
0.1
3
0.0
6 ±
0.1
7
28
.06
± 2
.84
22
.33
± 4
.08
7.4
7 ±
2.9
0
9.7
3 ±
0.5
9
9.8
7 ±
0.5
2
11
.00
± 0
.00
9.2
0 ±
2.1
5
41
.80
± 1
7.6
2
77
.29
± 2
0.2
3
14
.00
± 2
.83
25
.06
± 7
.68
16
.85
± 6
.56
9.7
9 ±
0.5
8
9.7
1 ±
0.7
3
HC
sv
PP
A
17
9/8
12
/5
66
.00
± 7
.79
14
.59
± 2
.96
- 0.5
9 ±
0.0
5
0.0
0 ±
0.0
0
0.0
3 ±
0.1
2
28
.71
± 0
.92
23
.56
±3
.14
8.2
5 ±
2.4
9
9.8
1 ±
0.5
4
10
.00
± 0
.00
11
.00
± 0
.00
9.6
9 ±
1.7
0
35
.94
± 9
.36
75
.44
± 2
0.3
7
14
.81
± 0
.54
26
.76
± 4
.88
17
.59
± 5
.06
9.9
3 ±
0.2
6
10
.00
± 0
.00
sv
PP
A
(HC
svP
PA)
17
11
/6
12
/5
62
.53
± 7
.77
15
.35
± 3
.37
3.5
9 ±
2.4
5
0.5
2 ±
0.0
8**
*
5.3
2 ±
4.1
9**
*
7.8
8 ±
5.4
4**
*
19
.31
± 8
.35
***
13
.92
± 7
.62
***
3.7
7 ±
3.3
0 *
**
8.8
5 ±
1.4
1**
*
7.6
9 ±
2.6
3**
*
10
.00
± 2
.08
6.3
1 ±
4.3
1**
*
75
.96
± 5
1.5
6**
*
12
3.7
0 ±
72
.24
6.4
7 ±
4.2
6**
*
8.0
0 ±
5.0
1**
*
7.2
3 ±
5.2
9**
*
8.9
3 ±
1.9
8
6.1
4 ±
2.8
5
nfv
PP
A
(lv
PP
A)
11
5/6
10
/1
67
.27
± 7
.21
13
.82
± 3
.71
2.4
5 ±
1.7
5
0.5
7 ±
0.0
7
4.2
3 ±
3.5
8
7.0
9 ±
4.2
5
19
.09
± 8
.07
12
.90
± 7
.74
4.1
0 ±
2.8
5
8.0
0 ±
2.8
5
9.6
7 ±
0.5
0
9.4
5 ±
1.5
1
7.0
± 2
.93
10
2.6
4 ±
52
.90
22
2.7
1 ±
85
.76
8.6
4 ±
4.9
3
6.2
7 ±
5.6
8
3.5
0 ±
3.7
8
9.0
0 ±
1.2
5
8.1
0 ±
1.6
0
lvP
PA
(H
Clv
PP
A)
11
4/7
10
/1
65
.36
± 6
.25
13
.27
± 3
.35
3.6
4 ±
2.6
6
0.5
1 ±
0.0
9*
4.6
4 ±
4.4
3**
6.8
6 ±
5.8
1**
22
.10
± 6
.03
**
11
.64
± 8
.93
**
3.7
3 ±
3.8
8*
9.1
0 ±
1.2
0
8.4
0 ±
3.3
4
8.1
8 ±
3.3
1*
4.5
5 ±
4.2
8**
75
.80
± 5
1.3
3*
20
1.1
3 ±
84
.47
**
10
.18
± 3
.98
**
12
.09
± 8
.49
***
6.8
0 ±
4.5
2**
*
6.8
0 ±
3.3
6*
8.1
0 ±
1.9
1*
sv
PP
A (
lvP
PA
)
11
5/6
10
/1
64
.36
± 7
.66
14
.82
± 3
.66
3.6
6 ±
2.6
9
0.5
4 ±
0.0
8
4.8
6 ±
4.4
3
7.4
5 ±
5.7
1
19
.09
± 9
.76
16
.00
± 7
.57
4.5
6 ±
3.3
2
9.0
0 ±
1.5
0
7.7
8 ±
2.9
9
10
.30
± 1
.34
7.2
2 ±
3.7
7
74
.56
± 4
7.5
1
13
0.5
7 ±
87
.21
6.5
0 ±
4.5
8
8.5
0 ±
5.7
4
7.7
8 ±
5.9
3
9.4
4 ±
1.3
3*
6.2
2 ±
2.6
4
sv
PP
A
(nfv
PP
A)
16
10
/6
11
/5
63
.38
± 7
.17
15
.13
± 3
.34
3.5
6 ±
2.5
3
0.5
0 ±
0.0
9
5.0
9 ±
4.2
2
7.5
0 ±
5.3
7
19
.31
± 8
.35
13
.92
± 8
.35
3.7
7 ±
3.3
0
8.8
5 ±
1.4
1
7.6
9 ±
2.6
3
10
.00
± 2
.08
6.3
1 ±
4.3
1
67
.00
± 4
2.7
6
12
3.7
0 ±
72
.24
6.4
7 ±
4.2
6
8.0
0 ±
5.0
1
7.2
3 ±
5.2
9
8.9
3 ±
1.9
8
6.1
4 ±
2.8
5**
nfv
PP
A
(HC
nfv
PP
A)
16
8/8
11
/5
67
.50
± 7
.42
13
.19
± 4
.29
2.1
9 ±
1.6
0
0.5
4 ±
0.0
8
3.4
4 ±
3.2
0**
*
5.9
4 ±
4.0
7**
*
19
.94
± 7
.25
**
13
.07
± 6
.61
***
4.3
3 ±
2.6
2**
8.5
7 ±
2.4
1
9.5
7 ±
0.6
5
9.0
6 ±
1.9
5**
*
6.7
5 ±
2,8
6*
94
.38
± 4
6.9
5**
*
22
0.1
8 ±
91
.33
***
9.9
3 ±
4.7
6**
8.0
6 ±
7.3
4**
*
3.8
7 ±
4.0
9**
*
7.9
3 ±
2.3
4*
8.5
3 ±
1.5
5*
nu
mb
er
ge
nd
er
(m/f
)
sc
an
nin
g
pa
ram
ete
r a
ge
(ye
ars
)
ed
uc
ati
on
(ye
ars
)
dis
ea
se
du
rati
on
(ye
ars
) T
ota
l g
rey
ma
tte
r
de
ns
ity
(d
m3)
CD
R
FT
LD
-CD
R
CE
RA
D P
lus
MM
SE
wo
rd l
ist
me
mo
ry
(tri
als
1-3
) w
ord
lis
t re
ca
ll
wo
rd l
ist
rec
og
nit
ion
(ye
s)
wo
rd l
ist
rec
og
nit
ion
(n
o)
co
nstr
uc
tio
na
l
pra
xis
co
nstr
uc
tio
na
l
pra
xis
re
ca
ll
Tra
il M
ak
ing
Te
st
A (
s)
Tra
il M
ak
ing
Te
st
B (
s)
Bo
sto
n N
am
ing
Te
st
Ve
rba
l F
luen
cy
Te
st
Ph
on
em
ic
Flu
en
cy
Te
st
Re
pe
at
an
d P
oin
t
Re
pe
at
Ta
sk
Po
int
Ta
sk
CD
R c
linic
al dem
entia r
atin
g s
cale
, g
lob
al score
, C
ER
AD
Consort
ium
to E
sta
blis
h a
Regis
try f
or
Alz
heim
er’s D
isease;
FT
LD
fronto
tem
pora
l lo
bar
de
genera
tio
n,
HC
h
ea
lthy
contr
ols
, lv
PP
A
logop
enic
variant
PP
A,
MM
SE
M
ini-M
enta
l S
tate
Exam
inatio
n,
nfv
PP
A n
onfluent/
agra
mm
atic v
ari
ant
PP
A,
PP
A p
rim
ary
pro
gre
ssiv
e a
ph
asia
, svP
PA
se
man
tic v
aria
nt
PP
A.
Note
age,
ed
ucation,
dis
ea
se d
ura
tion
, C
DR
, F
TLD
-CD
R, C
ER
AD
Plu
s,
and R
ep
eat a
nd P
oin
t T
est are
in
dic
ate
d a
s m
ean ±
sta
ndard
devia
tion.
No
te t
hat d
ata
was m
issin
g for
a f
ew
subje
cts
on
som
e s
ubte
sts
of th
e C
ER
AD
Plu
s a
nd t
he R
epe
at
and
Poin
t T
est. P
airw
ise g
rou
p-level
co
mpari
sons w
ere
perf
orm
ed
usin
g i
nde
pen
de
nt
t te
sts
(norm
ally
dis
trib
ute
d d
ata
) and
Mann-W
hitn
ey
U
tests
(n
ot
norm
ally
dis
trib
ute
d
da
ta).
A
ste
risks
denote
th
e
level
of
sig
nific
ance
*p≤
0.0
5;
**p≤0.0
1;
***p
≤0.0
01.

7. Appendix
101
Supplementay Table B.2
Voxel-based morphometry results for the three variants of PPA as compared to healthy controls
Note. Lat. Lateralization, MNI Montreal Neurological Institute, PPA primary progressive aphasia.
region Lat. MNI coordinates p-value T-value x y z
Nonfluent variant PPA < healthy controls
Inferior, middle, and superior temporal gyri/parahippocampal gyrus/hippocampus/amygdala/orbital gyri/putamen/insula/inferior frontal gyrus/angular gyrus/supramarginal gyrus
L -42 -16 10 < 0.0001 6.92
-42 -12 18 6.14
-18 -15 -12 6.09
Inferior frontal gyrus/precentral gyrus/middle frontal gyrus
L -52 8 31 < 0.0001 5.86
-28 5 52 5.43
-30 -10 63 4.68
Middle frontal gyrus/superior frontal gyrus L -26 48 21 < 0.0001 5.82
-6 63 12 5.80
-21 41 24 5.61
Inferior frontal gyrus, pars orbitalis/insula 34 24 9 0.036 4.82
Semantic variant PPA < healthy controls
Inferior, middle, and superior temporal gyri/fusiform gyrus/parahippocampal gyrus/hippocampus/amgdala/gyrus rectus/orbital gyrus/insula /inferior frontal gyrus/cingulate gyrus/putamen/caudate nucleus/angular gyrus
L/R -27 2 -36 < 0.0001 13.98
-15 3 -45 11.98
-44 -15 -45 11.58
Superior frontal gyrus/cingulate gyrus L -3 15 34 0.009 4.65
-3 2 42 4.30
-3 44 19 4.30
Logopenic variant PPA < healthy controls
Inferior, middle, and superior temporal gyri/fusiform gyrus/middle occipital gyrus/gyrus rectus/orbital gyrus/putamen/caudate nucleus/thalamus/insula/inferior frontal gyrus, pars orbitalis/middle frontal gyrus/superior frontal gyrus/cingulate gyrus/precentral gyrus/postcentral gyrus/angular gyrus/precuneus/supramarginal gyrus
L -32 26 9 < 0.0001 10.29
-46 -52 4 8.41
-30 3 52 7.72
Middle and superior temporal gyri R 69 -40 9 < 0.0001 5.75
54 -25 -11 5.36
50 -27 1 5.25
Cingulate gyrus/precuneus
L -12 -54 27 0.040 6.08
-15 -49 42
5.14
Semantic variant PPA < nonfluent variant PPA
Inferior, middle, and superior temporal gyri/fusiform gyrus/parahippocampal gyrus/hippocampus/amgydala/insula
L -16 3 -44 < 0.0001 7.99
-33 -25 -30 7.92
-22 12 -32 7.22
Inferior, middle, and superior temporal gyri/fusiform gyrus/parahippocampal gyrus/hippocampus/amgydala/insula
R 42 -4 -29 < 0.0001 6.50
36 4 -32 6.16
45 27 -33 5.93

7. Appendix
102
Supplementary Table B.3
Positive and negative predictive values for the support vector machine classification results between the three variants of primary progressive aphasia and healthy controls as well as between PPA
variants
Positive predictive value Negative predictive value nfvPPA versus healthy controls regions-of-interest 87 % 82 % whole brain 93 % 88 % svPPA versus healthy controls regions-of-interest 100 % 100 % whole brain 100 % 94 % lvPPA versus healthy controls regions-of-interest 82 % 82 % whole brain 100 % 92 % svPPA versus nfvPPA regions-of-interest 76 % 80 % whole brain 76 % 80 % lvPPA versus svPPA regions-of-interest 92 % 100 % whole brain 92 % 100 % lvPPA versus nfvPPA regions-of-interest 62 % 67 % whole brain 54 % 56 %
Note. LvPPA logopenic variant PPA, nfvPPA nonfluent/agrammatic variant PPA, PPA primary progressive aphasia, svPPA semantic variant PPA. Positive predictive value=true positives (patients that were correctly classified as patients)/all subjects that were (correctly or incorrectly) classified as patients. Negative predictive value=true negatives (healthy controls that were correctly classified as healthy controls)/all subjects that were (correctly or incorrectly) classified as healthy controls. For svPPA versus nfvPPA, the positive predictive value refers to the number of correctly classified svPPA patients/all patients that were (correctly or incorrectly) classified as svPPA patients, while the negative predictive value refers to the number of correctly classified nfvPPA patients/all patients that were (correctly or incorrectly) classified as nfvPPA patients. For lvPPA versus svPPA/nfvPPA, the positive predictive value refers to the number of correctly classified lvPPA patients/all patients that were (correctly or incorrectly) classified as lvPPA patients, while the negative predictive value refers to the number of correctly classified svPPA/nfvPPA patients/all patients that were (correctly or incorrectly) classified as svPPA/nfvPPA patients.
7. Appendix
103
7.2 Declaration of contribution (Erklärung über den Beitrag zur
Publikation)
Erklärung über den wissenschaftlichen Beitrag des Promovenden zur
Publikation
Hiermit erkläre ich in meinem Namen und dem Namen aller Koautoren, folgenden
Beitrag zur Publikation „Validating New Diagnostic Imaging Criteria for Primary
Progressive Aphasia via ALE Meta-analyses“ geleistet zu haben: (Mit)Konzeption der
Studie, Durchführung der Literaturrecherche sowie der statistischen Analysen,
Erstellung der Abbildungen und Tabellen, Interpretation der Ergebnisse, Verfassen
der Publikation.
Leipzig, 05.02.2017 .......................... .......................... ..........................
Datum Unterschriften
Hiermit erkläre ich in meinem Namen und dem Namen aller Koautoren, folgenden
Beitrag zur Publikation „Predicting Primary Progressive Aphasia with Support Vector
Machine Approaches in structural MRI data“ geleistet zu haben: (Mit)Konzeption der
Studie, Beitrag zur Datenerhebung, Durchführung der statistischen Analysen,
Erstellung der Abbildungen und Tabellen, Interpretation der Ergebnisse, Verfassen
der Publikation.
Leipzig, 05.02.2017 .......................... .......................... ..........................
Datum Unterschriften

7. Appendix
104
7.3 Declaration of authenticity (Eigenständigkeitserklärung)
Erklärung über die eigenständige Abfassung der Arbeit
Hiermit erkläre ich, dass ich die vorliegende Arbeit selbstständig und ohne
unzulässige Hilfe oder Benutzung anderer als der angegebenen Hilfsmittel
angefertigt habe. Ich versichere, dass Dritte von mir weder unmittelbar noch mittelbar
eine Vergütung oder geldwerte Leistungen für Arbeiten erhalten haben, die im
Zusammenhang mit dem Inhalt der vorgelegten Dissertation stehen, und dass die
vorgelegte Arbeit weder im Inland noch im Ausland in gleicher oder ähnlicher Form
einer anderen Prüfungsbehörde zum Zweck einer Promotion oder eines anderen
Prüfungsverfahrens vorgelegt wurde. Alles aus anderen Quellen und von anderen
Personen übernommene Material, das in der Arbeit verwendet wurde oder auf das
direkt Bezug genommen wird, wurde als solches kenntlich gemacht. Insbesondere
wurden alle Personen genannt, die direkt an der Entstehung der vorliegenden Arbeit
beteiligt waren. Die aktuellen gesetzlichen Vorgaben in Bezug auf die Zulassung der
klinischen Studien, die Bestimmungen des Tierschutzgesetzes, die Bestimmungen
des Gentechnikgesetzes und die allgemeinen Datenschutzbestimmungen wurden
eingehalten. Ich versichere, dass ich die Regelungen der Satzung der Universität
Leipzig zur Sicherung guter wissenschaftlicher Praxis kenne und eingehalten habe.
Leipzig, 07.04.2017 ....................................
Datum Unterschrift
7. Appendix
105
7.4 Curriculum vitae
Personal data
Name Sandrine Bisenius
Date & place of birth 11.12.1986 in Luxembourg
Nationality Luxembourgish
Address Waldstraße 24, 04105 Leipzig
Email [email protected]
Education
since 04/2012 department of Neurology, Max-Planck-Institute for Human Cognitive
and Brain Sciences (MPI), Leipzig
PhD: Validation of diagnostic imaging criteria for primary progressive
aphasia (Prof. Dr. Dr. Matthias L. Schroeter)
05/2011-04/2012 diploma thesis: Neural correlates of visual consciousness
(Prof. Dr. Dr. Matthias L. Schroeter, MPI Leipzig, Prof. Dr. Julius Kuhl,
University of Osnabrück)
10/2006-04/2012 diploma in Psychology, Department of Psychology, University of
Osnabrück
06/2006 Abitur, Lycée Hubert Clément Esch (Esch/Alzette in Luxembourg)

7. Appendix
106
7.5 List of publications
2017
Bisenius, S., Mueller, K., Diehl-Schmid, J., Fassbender, K., Grimmer, T., Jessen, F.,
Kassubek, J., Kornhuber, J., Landwehrmeyer, B., Ludolph, A., Schneider, A.,
Anderl-Straub, S., Stuke, K., Danek, A., Otto, M., Schroeter, M. L., & FTLDc
study group. (2017). Predicting primary progressive aphasias with support
vector machine approaches in structural MRI data. NeuroImage: Clinical, 14,
334–343.
Albrecht, F., Bisenius, S., Schaack, R. M., Neumann, J., & Schroeter, M. L. (2017).
Disentangling the neural correlates of corticobasal syndrome & corticobasal
degeneration with systematic & quantitative ALE meta-analyses. npj
Parkinson's Disease, 3(12), 1–8.
Meyer, S., Mueller, K., Stuke, K., Bisenius, S., Diehl-Schmid, J., Jessen, F.,
Kassubek, J., Kornhuber, J., Ludolph, A.C., Prudlo, J., Schneider, A.,
Schuemberg, K., Yakushev, I., Otto, M., Schroeter, M.L., & FTLDc study group
(2017). Predicting behavioral variant frontotemporal dementia with pattern
classification in multi-center structural MRI data. NeuroImage: Clinical, 14,
656–662.
2016
Bisenius, S., Neumann, J., & Schroeter, M. L. (2016). Validating new diagnostic
imaging criteria for primary progressive aphasia via anatomical likelihood
estimation meta-analyses. European Journal of Neurology, 23(4), 704–712.
Bisenius, S., Neumann, J., & Schroeter, M. L. (2016). Response to the letter on
'Validating new diagnostic imaging criteria for primary progressive aphasia via
anatomical likelihood estimation meta-analyses'. European Journal of
Neurology, 23(8), e52–3.

7. Appendix
107
Teipel, S., Raiser, T., Riedl, L., Riederer, I., Schroeter, M.L., Bisenius, S., Schneider,
A., Kornhuber, J., Fliessbach, K., Spottke, A., Grothe, M.J., Prudlo, J.,
Kassubek, J., Ludolph, A., Landwehrmeyer, B., Straub, S., Otto, M.,* Danek,
A.,* & the FTLDc study group (2016). Atrophy and structural covariance of the
cholinergic basal forebrain in primary progressive aphasia. Cortex, 83,124–
135.
2015
Bisenius, S., Trapp, S., Neumann, J. & Schroeter, M.L. (2015) Identifying neural
correlates of visual consciousness with ALE meta-analyses. Neuroimage, 122,
177–187.

7. Appendix
108
7.6 List of conference contributions
Talks
2016
Bisenius, S. Imaging data in PPA: Results from meta-analyses and support vector
machine classification in patients enrolled in the study of the FTLD-
consortium. Paper presented at the colloquium of the Disease oriented
competence network degenerative dementias (KNDD), Göttingen, Germany.
2015
Bisenius, S., Müller, K., Danek, A., Diehl-Schmid, J., Fassbender, K., Foerstl, H.,
Giese, A., Jahn, H., Jessen, F., Kassubek, J., Landwehrmeyer, B., Lauer, M.,
Ludolph, A. C., Otto, M., Prudlo, J., Schneider, A., Stuke, K., & Schroeter, M.
L. (2015, November). Support vector machine classification enables detection
of primary progressive aphasia subtypes with MRI. Paper presented at the
Annual Meeting of the German Association for Psychiatry, Psychotherapy and
Psychosomatics, Berlin, Germany.
Schroeter, M. L., Meyer, S., Stuke, K., Bisenius, S., Neumann, J., Mueller, K., Otto,
M., & FTLD-Konsortium Germany (2015, November). Meta-analyses and
pattern classification of imaging data enable prediction of behavioral variant
frontotemporal dementia. Paper presented at the Annual Meeting of the
German Association for Psychiatry, Psychotherapy and Psychosomatics,
Berlin, Germany.
Stuke, K., Holiga, S., Bisenius, S., Kassubek, J., Prudlo, J., Otto, M., & Schroeter,
M. L. (2015, November). Behavioral Variant Frontotemporal Dementia Patients
Reveal Changes in Functional Connectivity in Cingulate Cortex – Data from
the German FTLD Consortium. Paper presented at the Annual Meeting of the
German Association for Psychiatry, Psychotherapy and Psychosomatics,
Berlin, Germany.

7. Appendix
109
2014
Bisenius, S., Neumann, J., Schroeter, M. L. (2014, November). Validation of the new
diagnostic imaging criteria for the subtypes of primary progressive aphasia
using ALE meta-analyses. Paper presented at the Annual Meeting of the
German Association for Psychiatry, Psychotherapy and Psychosomatics,
Berlin, Germany.
Stuke, K., Mueller, K., Bisenius, S., Danek, A., Diehl-Schmid, J., Fassbender, K.,
Foerstl, H., Giese, A., Jahn, H., Jessen, F., Kassubek, J., Kornhuber, J.,
Landwehrmeyer, B., Lauer, M., Ludolph, A. C., Otto, M., Prudlo, J., Schneider,
A., Schroeter, M. L., & FTLD Study Group Germany. (2014, November).
Voxel-based morphometry in behavioral variant frontotemporal dementia –
Data from the multicentric FTLD consortium’s study Germany. Paper
presented at the Annual Meeting of the German Association for Psychiatry,
Psychotherapy and Psychosomatics, Berlin, Germany.
Müller, K., Bisenius, S., Danek, A., Diehl-Schmid, J., Fassbender, K., Foerstl, H.,
Giese, A., Jahn, H., Jessen, F., Kassubek, J., Kornhuber, J., Landwehrmeyer,
B., Lauer, M., Ludolph, A. C., Otto, M., Prudlo, J., Schneider, A., Stuke, K.,
Schroeter, M. L., & FTLD Study Group Germany (2014, November).
Investigating brain structure in different FTLD subtypes using voxel-based
morphometry – Data from the multicentric FTLD consortium‘s study Germany.
Paper presented at the Annual Meeting of the German Association for
Psychiatry, Psychotherapy and Psychosomatics, Berlin, Germany.

7. Appendix
110
Poster
2016
Bisenius, S., Mueller, K., Diehl-Schmid, J., Fassbender, K., Jessen, F., Kassubek,
J., Kornhuber, J., Schneider, A., Stuke, K., Danek, A., Otto, M., Schroeter, M.
L., & FTLD Study Group Germany. (2016, August/September). Classifying
primary progressive aphasias individually with support vector machine
approaches in MRI data. Poster presented at the 10th International
Conference on Frontotemporal Dementias (ICFTD), Munich, Germany.
Albrecht, A., Bisenius, S., Schaack, R. M., & Schroeter, M. L. (2016,
August/September). Disentangling the neural correlates of corticobasal
syndrome & corticobasal degeneration with systematic & quantitative ALE
meta-analyses. Poster presented at the 10th International Conference on
Frontotemporal Dementias (ICFTD), Munich, Germany.
Meyer, S., Mueller, K., Bisenius, S., Diehl-Schmid, J., Foerstl, H., Fassbender, K.,
Kassubek, J., Landwehrmeyer, B., Ludolph, A. C., Kornhuber, J., Prudlo, K.,
Schneider, A., Stuke, K., Schroeter, M. L. (2016, August/September).
Neurofilament light chain protein concentration in CSF and atrophy are
correlated in bvFTD patients –Data from the multicentric FTLD consortium’s
study. Poster presented at the 10th International Conference on
Frontotemporal Dementias (ICFTD), Munich, Germany.
2015
Mueller, K., Bisenius, S., Danek, A., Diehl-Schmid, J., Fassbender, K., Foerstl, H.,
Giese, A., Jahn, H., Jessen, F., Kassubek, J., Kornhuber, J., Landwehrmeyer,
B., Lauer, M., Ludolph, A. C., Otto, M., Prudlo, J., Schneider, A., Stuke, K.,
Schroeter, M. L. (2015, May/June). Characterizing Neurodegeneration in
Progressive Supranuclear Palsy Using VBM and SVM Classification. Poster
presented at the ISMRM 23rd Annual Meeting and Exhibition, Toronto,
Ontario, Canada.

7. Appendix
111
Schroeter, M. L., Meyer, S., Stuke, K., Bisenius, S., Otto, M., Neumann, J., Mueller,
K. (2015, June). Predicting behavioral variant FTD with metaanalyses &
pattern classification of imaging data. Poster presented at the 21th Annual
Meeting of the Organization for Human Brain Mapping, Honolulu, Hawai.
Stuke, K., Holiga, S., Bisenius, S., Kassubek, J., Prudlo, J., Otto, M., Schroeter, M.
L. (2015, June). Reduced Functional Connectivity in Cingulate Cortex in
Behavioral Variant Frontotemporal Dementia. Poster presented at the 21th
Annual Meeting of the Organization for Human Brain Mapping, Honolulu,
Hawai.
2014
Bisenius, S., Neumann, J., Schroeter, M. L. (2014, October). Validation of the new
diagnostic imaging criteria for primary progressive aphasia by ALE meta-
analyses. Poster presented at the 9th International Conference on
Frontotemporal Dementias (ICFTD), Vancouver, Canada.
Bisenius, S., Müller, K., Danek, A., Diehl-Schmid, J., Fassbender, K., Foerstl, H.,
Giese, A., Jahn, H., Jessen, F., Kassubek, J., Kornhuber, J., Landwehrmeyer,
B., Lauer, M., Ludolph, A. C., Otto, M., Prudlo, J., Schneider,A., Stuke, & K.,
Schroeter, M. L. (2014, October). Voxel-based morphometry in primary
progressive aphasia and its subtypes–data from the multicentric FTLD
consortium’s study Germany. Poster presented at the 9th International
Conference on Frontotemporal Dementias (ICFTD), Vancouver, Canada.
Bisenius, S., Müller, K., Danek, A., Diehl-Schmid, J., Fassbender, K., Foerstl, H.,
Giese, A., Jahn, H., Jessen, F., Kassubek, J., Kornhuber, J., Landwehrmeyer,
B., Lauer, M., Ludolph, A. C., Otto, M., Prudlo, J., Schneider, A., Stuke, & K.,
Schroeter, M. L. (2014, November). Investigating primary progressive aphasia
with MRI in the multicentric FTLD consortium’s study. Poster presented at the
Annual Meeting of the German Association for Psychiatry, Psychotherapy and
Psychosomatics, Berlin, Germany.

7. Appendix
112
Mueller, K., Bisenius, S., Danek, A., Diehl-Schmid, J., Fassbender, K., Foerstl, H.,
Giese, A., Jahn, H., Jessen, F., Kassubek, J., Kornhuber, J., Landwehrmeyer,
B., Lauer, M., Ludolph, A. C., Otto, M., Prudlo, J., Schneider, A., Stuke, K.,
Schroeter, M. L., & FTLD Study Group Germany. (2014, October)
Investigating brain structure in different FTLD subtypes using voxel-based
morphometry – data from the multicentric FTLD consortium’s study Germany.
Poster presented at the 9th International Conference on Frontotemporal
Dementias (ICFTD), Vancouver, Canada.
Stuke, K., Mueller, K., Bisenius, S., Danek, A., Diehl-Schmid, J., Fassbender, K.,
Foerstl, H., Giese, A., Jahn, H., Jessen, F., Kassubek, J., Kornhuber, J.,
Landwehrmeyer, B., Lauer, M., Ludolph, A. C., Otto, M., Prudlo, J., Schneider,
A., Schroeter, M. L., & FTLD Study Group Germany. (2014, October). Voxel-
based morphometry in behavioral variant frontotemporal dementia – data from
the multicentric FTLD consortium’s study Germany. Poster presented at 9th
International Conference on Frontotemporal Dementias (ICFTD), Vancouver,
Canada.
2013
Bisenius, S., Trapp, S., Neumann, J. & Schroeter, M. L. (2013, June). Identifying
neural correlates of visual consciousness with ALE meta-analyses. Poster
presented at the 19th Annual Meeting of the Organization for Human Brain
Mapping, Seattle, WA, USA.
Bisenius, S., Trapp, S., Neumann, J. & Schroeter, M. L. (2013, November).
Identifying neural correlates of visual consciousness with ALE meta-analyses.
Poster presented at the Annual Meeting of the German Association for
Psychiatry, Psychotherapy and Psychosomatics, Berlin, Germany.

7. Appendix
113
7.7 Acknowledgment
I would like to thank Prof. Dr. Dr. Matthias Schroeter, Prof. Dr. Karsten Müller, and
Prof. Dr. Jane Neumann for methodological advice and supervision during the time of
my PhD. Furthermore, I would like to thank the coordinators of the Max Planck
International Research Network on Aging (MaxNetAging) Research School, Prof. Dr.
Mirko Sporket and Dr. André Schmandke for the funding of my PhD project.
Additionally, I would like to thank Annett Döpke, Cornelia Ketscher, Birgit Mittag, and
Ramona Menger for their help in administrative affairs. I would like to thank the
patients and healthy controls enrolled in the study of the German and Italian
Consortium of Frontotemporal Lobar Degeneration for their participation. I would also
like to thank my colleagues from the German and Italian Consortium of
Frontotemporal Lobar Degeneration as well as Anne Schrimpf, Jana Kube, Maria
Richter, Eva Weig, Isabel García‐García, Shahrzad Kharabian-Masouleh, Katharina
Stuke, Anja Dietrich, and Claudia Grellmann for the great atmosphere at work.
Finally, I would like to thank my family and friends, especially Romain Bisenius,
Selma Ghobrial, Sandra Schnülle, and Karl-Christian Dames for their moral support.