validation of multibody program to optimize simulated
TRANSCRIPT

October 2009
NASA/TP–2009-215765
Validation of Multibody Program to Optimize Simulated Trajectories II Parachute Simulation With Interacting Forces Behzad Raiszadeh and Eric M. Queen Langley Research Center, Hampton, Virginia
Nathaniel J. Hotchko Analytical Mechanics Associates, Inc., Hampton, Virginia

NASA STI Program . . . in Profile
Since its founding, NASA has been dedicated to the advancement of aeronautics and space science. The NASA scientific and technical information (STI) program plays a key part in helping NASA maintain this important role.
The NASA STI program operates under the auspices of the Agency Chief Information Officer. It collects, organizes, provides for archiving, and disseminates NASA’s STI. The NASA STI program provides access to the NASA Aeronautics and Space Database and its public interface, the NASA Technical Report Server, thus providing one of the largest collections of aeronautical and space science STI in the world. Results are published in both non-NASA channels and by NASA in the NASA STI Report Series, which includes the following report types:
• TECHNICAL PUBLICATION. Reports of
completed research or a major significant phase of research that present the results of NASA programs and include extensive data or theoretical analysis. Includes compilations of significant scientific and technical data and information deemed to be of continuing reference value. NASA counterpart of peer-reviewed formal professional papers, but having less stringent limitations on manuscript length and extent of graphic presentations.
• TECHNICAL MEMORANDUM. Scientific
and technical findings that are preliminary or of specialized interest, e.g., quick release reports, working papers, and bibliographies that contain minimal annotation. Does not contain extensive analysis.
• CONTRACTOR REPORT. Scientific and
technical findings by NASA-sponsored contractors and grantees.
• CONFERENCE PUBLICATION. Collected
papers from scientific and technical conferences, symposia, seminars, or other meetings sponsored or co-sponsored by NASA.
• SPECIAL PUBLICATION. Scientific,
technical, or historical information from NASA programs, projects, and missions, often concerned with subjects having substantial public interest.
• TECHNICAL TRANSLATION. English-
language translations of foreign scientific and technical material pertinent to NASA’s mission.
Specialized services also include creating custom thesauri, building customized databases, and organizing and publishing research results. For more information about the NASA STI program, see the following: • Access the NASA STI program home page at
http://www.sti.nasa.gov • E-mail your question via the Internet to
[email protected] • Fax your question to the NASA STI Help Desk
at 443-757-5803 • Phone the NASA STI Help Desk at
443-757-5802 • Write to:
NASA STI Help Desk NASA Center for AeroSpace Information 7115 Standard Drive Hanover, MD 21076-1320

National Aeronautics and Space Administration Langley Research Center Hampton, Virginia 23681-2199
October 2009
NASA/TP–2009-215765
Validation of Multibody Program to Optimize Simulated Trajectories II Parachute Simulation With Interacting Forces Behzad Raiszadeh and Eric M. Queen Langley Research Center, Hampton, Virginia
Nathaniel J. Hotchko Analytical Mechanics Associates, Inc., Hampton, Virginia

Available from:
NASA Center for AeroSpace Information 7115 Standard Drive
Hanover, MD 21076-1320 443-757-5802
Acknowledgments
The authors would like to thank the following people for their contributions. Thanks to the members of the MER EDL team, the tool has gone through extensive scrutiny. Chia-Yen Peng, Wayne Lee, Rob Grover, Bob Mitcheltree, Adam Steltzner, Erik Bailey, Robin Bruno, John Spanos, Miguel San Martin all from JPL, Juan Cruz, and Mark Schoenenberger of NASA Langley Research Center, all members of the MER EDL team deserve credit for their efforts. Scott Striepe of NASA Langley Research Center has been a valuable resource because of his in-depth knowledge of POST 2. John Aguirre of Vigyan Inc., Kwak Fan, and Loreyna Yeung of Swales Aerospace should be thanked for configuration management and configuration control of POST 2 source code. Finally, thanks should go to Kay Forrest of NCI Information Systems, Inc. for technical editing.
Trade names and trademarks are used in this report for identification only. Their usage does not constitute an official endorsement, either expressed or implied, by the National Aeronautics and Space Administration.

NASA/TP—2009–215765
v
ABSTRACT
A capability to simulate trajectories of multiple interacting rigid bodies has been developed, tested, and validated. This capability uses the Program to Optimize Simulated Trajectories II (POST 2). The standard version of POST 2 allows trajectory simulation of multiple bodies without force interaction. In the current implementation, the force interaction between the parachute and the suspended bodies has been modeled using flexible lines, allowing accurate trajectory simulation of the individual bodies in flight. The POST 2 multibody capability is intended to be general purpose and applicable to any parachute entry trajectory simulation. This research paper explains the motivation for multibody parachute simulation, discusses implementation methods, and presents validation of this capability.

NASA/TP—2009–215765
vi
TABLE OF CONTENTS
ACKNOWLEDGMENT S.............................................................................................................. ivABSTRACT .................................................................................................................................... vTABLE OF CONTENTS ............................................................................................................... viLIST OF TABLES ....................................................................................................................... viiiLIST OF FIGURES ....................................................................................................................... ixNOMENCLATURE AND LIST OF ACRONYMS..................................................................... xii
Chapter 1 INTRODUCTION ...................................................................................................... 1
1.1. General Overview ........................................................................................................... 1
1.2. Post and Post 2 Background Information ....................................................................... 3
1.3. Multibody Parachute Simulation Historical Background ............................................... 3
Chapter 2 APPROACH ............................................................................................................... 5
2.1. Theory of Multibody Parachute Modeling ..................................................................... 5
2.2. Multibody Parachute Configurations .............................................................................. 7
2.3. Summary of Test Cases .................................................................................................. 9
2.4. Simulation Input Parameters ......................................................................................... 11
2.4.1. Initial Body Orientation ................................................................................................ 11
2.4.2. Planet Model ................................................................................................................. 12
2.4.3. Parachute Models .......................................................................................................... 13
2.4.4. Parachute Riser Line Configuration .............................................................................. 14
2.4.5. Riser/Bridle Elastic Line Properties .............................................................................. 15
Chapter 3 TEST CASES COMPARISON RESULTS .............................................................. 16
3.1. Test Case 1 .................................................................................................................... 16
3.2. Test Case 2 .................................................................................................................... 17
3.3. Test Case 3 .................................................................................................................... 19
3.4. Test Case 4a .................................................................................................................. 21
3.5. Test Case 4b .................................................................................................................. 25
3.6. Test Case 4c .................................................................................................................. 28
3.7. Test Case 4d .................................................................................................................. 31
3.8. Test Case 4e .................................................................................................................. 35
3.9. Test Case 5 .................................................................................................................... 38
3.10. Test Case 6a .................................................................................................................. 41
3.11. Test Case 6b .................................................................................................................. 45

NASA/TP—2009–215765
vii
3.12. Test Case 6c .................................................................................................................. 49
3.13. Test Case 7a .................................................................................................................. 52
3.14. Test Case 7b .................................................................................................................. 55
3.15. Test Case 7c .................................................................................................................. 57
3.16. Test Case 8a .................................................................................................................. 59
3.17. Test Case 8b .................................................................................................................. 62
3.18. Test Case 8c .................................................................................................................. 66
Chapter 4 RESULTS SUMMARY ............................................................................................ 70
Chapter 5 REFERENCES ......................................................................................................... 71

NASA/TP—2009–215765
viii
LIST OF TABLES
Table 2.2-1. Three-body configuration mass properties. ............................................................... 7
Table 2.2-2. Five-body configuration mass properties. ................................................................. 8
Table 2.3-1. Test case matrix. ...................................................................................................... 11
Table 2.4.2-1. Planet Model. ........................................................................................................ 12
Table 2.4.5-1. Elastic properties of the lines. .............................................................................. 15
Table 3.1-1. Case 1 initial conditions. ......................................................................................... 16
Table 3.2-1. Case 2 initial conditions. ......................................................................................... 18
Table 3.3-1. Case 3 initial conditions. ........................................................................................ 19
Table 3.4-1. Case 4a initial conditions. ........................................................................................ 22
Table 3.5-1. Case 4b initial conditions. ....................................................................................... 25
Table 3.6-1. Case 4c initial conditions. ........................................................................................ 28
Table 3.7-1. Case 4d initial conditions. ....................................................................................... 31
Table 3.8-1. Case 4e initial conditions. ........................................................................................ 35
Table 3.9-1. DRL input parameters. ............................................................................................ 39
Table 3.10-1. Case 6a initial conditions. ...................................................................................... 41
Table 3.11-1. Case 6b initial conditions. .................................................................................... 45Table 3.12-1. Case 6c initial conditions. ...................................................................................... 49
Table 3.13-1. Case 7a initial conditions. ...................................................................................... 53
Table 3.14-1. Case 7b initial conditions. ..................................................................................... 55
Table 3.15-1. Case 7c initial conditions. ...................................................................................... 57
Table 3.16-1. Case 8a initial conditions. ...................................................................................... 60
Table 3.17-1. Case 8b initial conditions. ..................................................................................... 62
Table 3.18-1. Case 8c initial conditions. ...................................................................................... 66

NASA/TP—2009–215765
ix
LIST OF FIGURES
Figure 1.1-1. MER sequence of events. ......................................................................................... 2
Figure 2.1-1. Line force interaction between arbitrary bodies. ...................................................... 5
Figure 2.2-1. Three-body configuration. ........................................................................................ 8
Figure 2.2-2. Five-body configuration. .......................................................................................... 9
Figure 2.4.1-1. Initial orientation of the bodies (for all cases except 7b, 7c). ............................. 12
Figure 2.4.2-1. Atmospheric density model. ................................................................................ 13
Figure 2.4.3-1. Zero trim parachute model (all test cases except 7c). ......................................... 13
Figure 2.4.3-2. Nonzero trim parachute model (test case 7c only). ............................................. 14
Figure 2.4.4-1. Backshell line attachment configuration. ............................................................ 15
Figure 3.1-1. Case 1 single riser force. ........................................................................................ 17
Figure 3.1-2. Case 1 triple riser 3 force. ...................................................................................... 17
Figure 3.2-1. Case 2 single riser force. ........................................................................................ 18
Figure 3.2-2. Case 2 triple riser 3 force. ...................................................................................... 19
Figure 3.3-1. Case 3 single riser force. ........................................................................................ 20
Figure 3.3-2. Case 3 triple riser 3 force. ...................................................................................... 20
Figure 3.3-3. Case 3 body angles from vertical, north component. ............................................. 21Figure 3.4-1. Case 4a single riser force. ...................................................................................... 22
Figure 3.4-2. Case 4a triple riser 3 force. .................................................................................... 23
Figure 3.4-3. Case 4a triple bridle 3 force. .................................................................................. 23
Figure 3.4-4. Case 4a single bridle force. .................................................................................... 24
Figure 3.4-5. Case 4a body angles from vertical, north component. ........................................... 25
Figure 3.5-1. Case 4b single riser force. ...................................................................................... 26
Figure 3.5-2. Case 4b triple riser 3 force. ..................................................................................... 26
Figure 3.5-3. Case 4b triple bridle 3 force. ................................................................................... 27
Figure 3.5-4. Case 4b single bridle force. .................................................................................... 27
Figure 3.5-5. Case 4b body angles from vertical, north component. ........................................... 28
Figure 3.6-1. Case 4c single riser force. ...................................................................................... 29
Figure 3.6-2. Case 4c triple riser 3 force. .................................................................................... 29
Figure 3.6-3. Case 4c triple bridle 3 force. .................................................................................. 30
Figure 3.6-4. Case 4c single bridle force. .................................................................................... 30

NASA/TP—2009–215765
x
Figure 3.6-5. Case 4c body angles from vertical, north component. ........................................... 31
Figure 3.7-1. Case 4d single riser force. ....................................................................................... 32
Figure 3.7-2. Case 4d triple riser 3 force. .................................................................................... 32
Figure 3.7-3. Case 4d triple bridle 3 force. .................................................................................. 33
Figure 3.7-4. Case 4d single bridle force. .................................................................................... 33
Figure 3.7-5. Case 4d body angles from vertical, north component. ........................................... 34
Figure 3.7-6. Case 4d body angles from vertical, east component. ............................................. 34
Figure 3.8-1. Case 4e single riser force. ...................................................................................... 35
Figure 3.8-2. Case 4e triple riser 3 force. .................................................................................... 36
Figure 3.8-3. Case 4e triple bridle 3 force. .................................................................................. 36
Figure 3.8-4. Case 4e single bridle force. .................................................................................... 37
Figure 3.8-5. Case 4e body angles from vertical, north component. ............................................ 37
Figure 3.8-6. Case 4e body angles from vertical, east component. ............................................. 38
Figure 3.9-1. Case 5 single riser force. ........................................................................................ 39
Figure 3.9-2. Case 5 triple riser 3 line force. ............................................................................... 40
Figure 3.9-3. Case 5 triple bridle 3 force. .................................................................................... 40
Figure 3.9-4. Case 5 single bridle force. ...................................................................................... 41
Figure 3.10-1. Case 6a wind gust. ................................................................................................ 42
Figure 3.10-2. Case 6a single riser force. .................................................................................... 42
Figure 3.10-3. Case 6a triple riser 3 force. .................................................................................. 43
Figure 3.10-4. Case 6a triple bridle 3 force. ................................................................................ 43
Figure 3.10-5. Case 6a single bridle force. .................................................................................. 44
Figure 3.10-6. Case 6a body angles from vertical, north component. ......................................... 44
Figure 3.11-1. Case 6b wind gusts. .............................................................................................. 45
Figure 3.11-2. Case 6b single riser force. .................................................................................... 46
Figure 3.11-3. Case 6b triple riser 3 force. .................................................................................. 46
Figure 3.11-4. Case 6b triple bridle 3 force. ................................................................................ 47
Figure 3.11-5. Case 6b single bridle force. .................................................................................. 47
Figure 3.11-6. Case 6b body angles from vertical, north component. ......................................... 48
Figure 3.11-7. Case 6b body angles from vertical, east component. ........................................... 48
Figure 3.12-1. Case 6c wind gusts. .............................................................................................. 49
Figure 3.12-2. Case 6c single riser force. .................................................................................... 50

NASA/TP—2009–215765
xi
Figure 3.12-3. Case 6c triple riser 3 force. .................................................................................. 50
Figure 3.12-4. Case 6c triple bridle 3 force. ................................................................................ 51
Figure 3.12-5. Case 6c single bridle force. .................................................................................. 51
Figure 3.12-6. Case 6c body angles from vertical, north component. ......................................... 52
Figure 3.12-7. Case 6c body angles from vertical, east component. ........................................... 52
Figure 3.13-1. Parachute inflation profile. ................................................................................... 53
Figure 3.13-2. Case 7a single riser force. .................................................................................... 54
Figure 3.13-3. Case 7a triple riser 3 force. .................................................................................. 54
Figure 3.14-1. Case 7b single riser force. .................................................................................... 55
Figure 3.14-2. Case 7b triple riser 3 force. .................................................................................. 56
Figure 3.14-3. Case 7b body angles from vertical, north component. ......................................... 56
Figure 3.15-1. Case 7c single riser force. .................................................................................... 57
Figure 3.15-2. Case 7c triple riser 3 force. .................................................................................. 58
Figure 3.15-3. Case 7c body angles from vertical, north component. ......................................... 58
Figure 3.16-1. RAD Configuration. ............................................................................................. 59
Figure 3.16-2. Case 8a single riser force. .................................................................................... 60
Figure 3.16-3. Case 8a triple riser 3 force. .................................................................................. 61
Figure 3.16-4. Case 8a triple bridle 3 force. ................................................................................. 61
Figure 3.16-5. Case 8a single bridle force. .................................................................................. 62
Figure 3.17-1. Case 8b wind gust. ............................................................................................... 63
Figure 3.17-2. Case 8b single riser force. .................................................................................... 63
Figure 3.17-3. Case 8b triple riser 3 force. .................................................................................. 64
Figure 3.17-4. Case 8b triple bridle 3 force. ................................................................................ 64
Figure 3.17-5. Case 8b single bridle force. .................................................................................. 65
Figure 3.17-6. Case 8b body angles from vertical, north component. ......................................... 65
Figure 3.18-1. Case 8c wind gusts. .............................................................................................. 66
Figure 3.18-2. Case 8c single riser force. .................................................................................... 67
Figure 3.18-3. Case 8c triple riser 3 force. .................................................................................. 67
Figure 3.18-4. Case 8c triple bridle 3 force. ................................................................................ 68
Figure 3.18-5. Case 8c single bridle force. .................................................................................. 68
Figure 3.18-6. Case 8c body angles from vertical, north component. ......................................... 69
Figure 3.18-7. Case 8c body angles from vertical, east component. ........................................... 69

NASA/TP—2009–215765
xii
NOMENCLATURE AND LIST OF ACRONYMS
aoa angle of attack
BLDT Balloon Launched Decelerator Test
c mechanical constant related to the DRL mechanism design
C line damping coefficient
CD
CM center of mass
drag coefficient
CM1
CM
center of mass of body 1
2
C
center of mass of body 2
P
DCM direction cosine matrix
center of pressure
DOF degree of freedom
d DRL line length
d DRL descent rate
DRL descent rate limiter
e line strain
e line strain rate
EDL entry, descent, and landing
i12,f
line force vector from end 1 to end 2
b1f
line force on body 1 in body 1 body frame
b2f
line force on body 2 in body 2 body frame
fpa flight path angle
FDRL
[ ]1IB
DRL damping force
DCM from inertial to body frame of body 1
[ ]2IB DCM from inertial to body frame of body 2
Ixx
I
moment of inertia about the roll axis
yy
I
moment of inertia about the pitch axis
zz moment of inertia about the yaw axis

NASA/TP—2009–215765
xiii
IC initial conditions
J2, J3, J4
JPL Jet Propulsion Laboratory
, … Mars gravity zonal harmonics
K line stiffness coefficient
L line length
L0
b1M
free length
moment about body 1 due to line force
b2M
moment about body 2 due to line force
MER Mars Exploration Rover
MPF Mars Pathfinder
POST Program to Optimize Simulated Trajectories
RAD rocket assisted descent
R DRL drum radius
R0
R
DRL initial drum radius
1
R
DRL final drum radius
e
R
Mars equatorial radius
p
s initial DRL line slack
Mars polar radius
Sref
TMC trajectory correction maneuver
reference surface area
û12
icm,1V
unit vector between the attach points from body 1 to 2 in inertial frame
velocity vector of body 1 center of mass in inertial frame
icm,2V
velocity vector of body 2 center of mass in inertial frame
iatt,1V
velocity vector of the attach point on body 1 in inertial frame
iatt,2V
velocity vector of the attach point on body 2 in inertial frame
icm,1X
position vector of body 1 center of mass in inertial frame
icm,2X
position vector of body 2 center of mass in inertial frame

NASA/TP—2009–215765
xiv
batt,1X
position vector of the attach point in body 1 body frame
batt,2X
position vector of the attach point in body 2 body frame
iatt,1X
position vector of the attach point on body 1 in inertial frame
iatt,2X
position vector of the attach point on body 2 in inertial frame
μ Mars gravitational constant
1ω
body 1 attitude rate vector
2ω
body 2 attitude rate vector
Ω Mars rotation rate

NASA/TP—2009–215765
1
CHAPTER 1 INTRODUCTION
1.1. General Overview
Flight simulation of entry bodies using a parachute is mathematically complicated and not easily characterized with traditional approaches. A planetary entry flight simulation on a parachute involves multiple bodies, some of which are very flexible, flying in close proximity to each other with significant interaction forces and moments. In past atmospheric entry mission simulations, the terminal descent phase on a parachute has been analyzed separately from the remainder of the trajectory, because the dynamics are so different. The goal of this work is to develop a multibody flight simulation under a parachute that can be incorporated into a larger simulation of the entire entry, descent, and landing (EDL) sequence.
Following the failures of Mars Climate Orbiter ’98 and Mars Polar Lander ’99, the MER project required that critical systems be analyzed on independently developed simulations in parallel to ensure correctness. The POST 2 (Program to Optimize Simulated Trajectories II) multibody tool was developed for the MER mission as a result of this “dual path analysis” policy. The POST 2 multibody tool provided a redundant analysis capability along with a JPL-developed ADAMS tool that simulated the parachute phase. Other parts of the trajectory, namely the hypersonic portion before parachute deployment, were simulated using other JPL tools, and the non-multibody version of POST 2 (ref. 1). The POST 2 multibody parachute simulation tool provided the capability to create detailed end-to-end simulations from the atmospheric interface to touchdown. This includes capturing the dynamics caused by all events in the end-to-end sequence such as hypersonic entry, parachute deployment, and terminal descent (Fig. 1.1-1). In addition, simulating the entire EDL with one tool minimizes the risk associated with handing off data from one simulation to another, where the coordinate systems, initial conditions, Euler angle sequences, planet models, etc. may not be defined consistently.

NASA/TP—2009–215765
2
Figure 1.1-1. MER sequence of events.
Multibody parachute simulations provide realistic attitude history predictions of all bodies throughout the flight and are able to address issues such as recontact of jettisoned elements, design of parachute and suspension lines, desirable elastic properties of the lines, and instrument performance during parachute phase. The POST 2 multibody tool provides an ideal environment for integration of flight sensor models. Models of the accelerometers, gyros, radars, communication antennae, etc. can be incorporated into the simulation to make a complete assessment of the flight systems, including flight code and sensor models, in a wide variety of simulated flight conditions. The end-to-end POST 2 simulation was needed to quantify the risk associated with landing at various candidate sites on Mars’s surface for the MER project. In the landing site selection analyses, parameters that were judged to have a significant impact on a successful landing were varied statistically. In the Monte Carlo analyses, the critical parameter list included wind profiles, atmospheric density, mass property uncertainties, and thrust variations, etc. The Monte-Carlo process was used to statistically quantify the risk associated with landing on various sites. The end-to-end POST 2 simulation, with multibody parachute model for the terminal descent phase and integrated with the sensor models and the flight code, was the prime simulation tool for the MER project and was used to tune critical EDL systems for optimum performance.

NASA/TP—2009–215765
3
1.2. Post and Post 2 Background Information
POST was originally developed for the Space Shuttle program to optimize ascent and reentry trajectories. Over the years it has been upgraded and improved to include many new capabilities. POST 2 eliminated outdated programming techniques required to run on computers with limited memory, and it has wrapped a modern source code around the old established and verified routines. As a result, code modification and input/output have become easier. POST 2 allows simulation of multiple bodies simultaneously and permits mixing of 3 DOF (degrees of freedom) and 6 DOF bodies in a single simulation. In the standard version of POST 2, each vehicle is independent and no force and moment interactions are calculated between vehicles. Multibody parachute simulation and force and moment interactions required modification of the source code.
The POST 2 source code is configuration managed and controlled at NASA Langley Research Center. Any changes or upgrades go through an extensive verification process before being accepted. To retain its high reliability and long heritage, a new version of the code is run against a battery of nearly 200 sample input files. The sample input files contain a wide variety of simulation scenarios with known results. The POST 2 approval board evaluates each new upgrade against existing results. The current multibody simulation tool is a variation on standard POST 2 and has gone through the approval process to ensure the new components do not interfere with existing components. The details of the source code change verification process are beyond the scope of this paper.
1.3. Multibody Parachute Simulation Historical Background
A series of Balloon Launched Decelerator Tests (BLDT) was conducted for the Mars Viking project in 1972. The purpose of the BLDT program was to qualify the parachute system by exposing the test body and the parachute to the anticipated Mars parachute deployment conditions (ref. 2). A multibody simulation tool was constructed to verify the test results (ref. 3). The Viking multibody tool was able to successfully predict the dynamic behavior of the system observed in the BLDT tests. The modeling assumptions made in the POST 2 multibody tool are similar to those in the Viking multibody tool. The Viking tool treated the parachute and the suspended bodies as rigid, 6 DOF bodies, linked by flexible members (lines). The lines were assumed to have no mass or inertia of their own. The elastic forces exerted by the lines were calculated from the relative positions and velocities of the end points, based on ideal spring-damper equations. The above modeling assumptions are also being made in the current POST 2 multibody simulation tool. The current multibody tool calculates line tension and applies it to the attached bodies as additional external forces and moments.
The MER project required redundant trajectory simulations from atmospheric interface to ground impact. For the parachute phase of the mission, the POST 2 multibody tool’s counterpart was an ADAMS-based program initially developed at the Jet Propulsion Laboratory (JPL). ADAMS is a commercial off-the-shelf, general-purpose multibody simulation tool originally developed for the automotive industry (ref. 4) and modified by JPL to perform parachute simulations. JPL’s multibody tool simulated the terminal descent phase of the mission only. The JPL ADAMS tool has successfully been used for the Mars Pathfinder (MPF) project (ref. 5) and the twin MER missions. Analytical Mechanics Associates at NASA Langley Research Center developed the improved ADAMS tool used to run the multibody POST 2 simulations in this paper.

NASA/TP—2009–215765
4
Another multibody parachute simulation tool has addressed the problem of parachute deployment with multibody modeling and analysis (ref. 6). This simulation adopts a finite element approach in which the canopy and the suspension lines are modeled as flexible, discretely distributed-mass structures. The simulation was developed to address the line sail problem during parachute deployment. Line sail occurs when the inertia of the suspension lines, combined with their aerodynamic forces, cause bad canopy deployment and inflation at high angles of attack and dynamic pressures. The model was verified with experimental data and used to investigate a solution for a system with a line sail problem (ref. 6).

NASA/TP—2009–215765
5
CHAPTER 2 APPROACH
2.1. Theory of Multibody Parachute Modeling
The lines connecting the bodies are modeled as massless spring-dampers, except for the descent rate limiter (DRL), described later. Each line connects an attachment point on one body to an attachment point on another body and provides a tension-only force (Fig. 2.1). No moments are applied except those due to force application away from the center of mass. While in tension, the lines are assumed to behave as ideal spring-dampers. Each of the spring-damper lines has an unstretched free length, and if the separation distance between the two attachment points is less than the free length, the line tension is set to zero.
Figure 2.1-1. Line force interaction between arbitrary bodies.
In POST 2, inertial position and velocity of the center of mass (CM) are part of the vehicle state vector and are accessible in each integration time step. The inertial position and velocity of the attachment points are calculated from inertial position of CM, the relative position of the attachment point with respect to the CM, and the vehicle attitude and attitude rate. Subtracting the inertial position and velocity of the attachment points provides the relative position and velocity between the attachment points. The total tension force in each line is composed of two terms: a stiffness term, and a damping term. The force due to stiffness is computed from the relative inertial position and the line stiffness, and the force due to damping is computed from the relative inertial velocity and the damping coefficient. The force due to stiffness and damping are added together, and the net force is converted from inertial to the body frame. The line force in the body frame is processed along with all other body forces such as thrust forces, aerodynamic forces, etc., and used internally for numerical integration of the equations of motion.

NASA/TP—2009–215765
6
The following is a mathematical description of how the multibody feature has been added to POST 2. The quantities listed below are available for multibody calculations, either from POST 2 vehicle states or through multibody inputs. The parameters supplied by POST 2 are directly or indirectly part of the vehicle state vector being integrated internally. The state vector includes the inertial position vectors of both bodies, icm,1X
and icm,2X
, the inertial velocity vectors icm,1V
and
icm,2V
, the rotation rate vectors 1ω
and 2ω
, and the direction cosine matrix of both bodies describing the attitude [ ]1IB and [ ]2IB . Note that the inverse of [ ]1IB describes the direction cosine matrix from the body frame to the inertial frame for body 1. Inverse of [ ]1IB is simply its transpose since [ ]1IB is an orthogonal matrix. The user provides the position of the attachment points in the body coordinate frame, batt,1X
, batt,2X
, and the line properties in the input file.
The positions and velocities of the attachment points are calculated in the inertial coordinate frame using the following relationships (eq. 2.1-1 to 2.1-6):
[ ] batt,
T1icm,iatt, 1XIBX1X
+= (2.1-1)
[ ] batt,T
2icm,iatt, 2XIBX2X
+= (2.1-2)
[ ] ( )batt,1T
1icm,iatt, 1XωIB1V1V
×+= (2.1-3)
[ ] ( )batt,2T
2icm,iatt, 2XωIB2V2V
×+= (2.1-4)
iatt,iatt,12 1X2Xd
−= (2.1-5)
12
iatt,iatt,12 d
1X2Xu
−
= (2.1-6)
The relative positions and velocities between the attachment points and, in turn, strain and the strain rate are calculated from the following (eq. 2.1-7 and 2.1-8):
0
012
LLde −
= (2.1-7)
0
12iatt,12iatt,
Lu1Vu2V
e⋅−⋅
=
(2.1-8)
The forces and moments exerted by the lines are calculated as (eq. 2.1-9 to 2.1-13):
120i12, u)LeC(Kef
+= (2.1-9)
[ ] i12,1b fIB1f
= (2.1-10)
[ ] i12,2b fIB2f
−= (2.1-11)

NASA/TP—2009–215765
7
batt.bb 1f1X1M
×= (2.1-12)
batt.bb 2f2X2M
×= (2.1-13)
The forces and moments are applied to bodies at both ends of the line as body forces. The line forces combined with other body forces such as aerodynamics, gravity, and propulsion are all combined in POST 2 and are used in the differential equations of motion of the bodies in flight.
2.2. Multibody Parachute Configurations
Two configurations were important for MER: a three-body and a five-body configuration. For the period immediately after parachute deployment, the arrangement of bodies in flight is typically a single parachute and the entry capsule supported by risers (Fig. 2.2-1). This entry configuration is common to most Mars entry missions such as the Viking missions, the Mars Pathfinder, and the Mars Exploration Rover. In the initial simulations discussed in this paper, the post-parachute-deploy configuration is modeled using three bodies: the parachute, the entry capsule, and the swivel. For the MPF and the MER missions, after the heatshield jettison event, the lander was lowered from the backshell using a DRL device. The DRL controlled the lander separation rate by employing a centrifugal braking system. The lander continued descending on the DRL until reaching the free length of the bridle lines, which then supported the load. In the fully deployed five-body configuration, the lander was suspended from the backshell by bridle lines (Fig. 2.2-1). Tables 2.2-1 and 2.2-2 summarize the mass properties of all the bodies in the three-body and five-body configurations. The line swivels are modeled as 3 DOF point masses while the other bodies are modeled as full 6 DOF rigid bodies.
Table 2.2-1. Three-body configuration mass properties. Mass Ixx Iyy Izz Body DOF (kg) (kg•m2) (kg•m2) (kg•m2) Parachute ...................... 6 ............... 16.0000 ............ 253.70 ......... 1126.50 ......... 1126.50 Swivel ............................ 3 ................. 0.1539 ................ 0.00 ...............0.00 ............... 0.00 Entry Capsule ................ 6 ............. 761.0000 ............ 238.02 ........... 179.13 ........... 212.51

NASA/TP—2009–215765
8
Figure 2.2-1. Three-body configuration.
Table 2.2-2. Five-body configuration mass properties. Mass Ixx Iyy IBody DOF (kg) (kg•m
zz 2) (kg•m2) (kg•m2
Parachute ...................... 6 ............... 16.0000 ............ 253.70 ......... 1126.50 ......... 1126.50 )
Upper Swivel ................. 3 ................. 0.1539 ................ 0.00 ...............0.00 ............... 0.00 Backshell ....................... 6 ............. 177.0000 ............ 123.25 ............. 70.43 ............. 83.34 Lower Swivel ................. 3 ................. 0.1539 ................ 0.00 ...............0.00 ............... 0.00 Lander ........................... 6 ............. 584.0000 .............. 77.53 ............. 66.09 ............. 61.01

NASA/TP—2009–215765
9
Figure 2.2-2. Five-body configuration.
2.3. Summary of Test Cases
In order to validate multibody POST 2 with interacting forces, a series of tests of increasing complexity were performed. The test matrix is designed to prove that the POST 2 multibody model is implemented correctly by evaluating its performance on simple problems that can be verified against other simulations. No test or flight data were used in this validation, and analytic

NASA/TP—2009–215765
10
solutions were not feasible for any but the simplest test case. The test cases are listed in Table 2.3-1. The simplest subset of the test cases simulates vertical drops of the parachute system from rest with all external forces acting in the vertical direction only. In absence of off-axis forces, each body effectively has one degree of freedom. For these cases, it was practical to construct simple MATLAB simulations to compare with POST 2. A separate document has been published dealing exclusively with the MATLAB test cases (ref. 7). In more complex test cases, off-axis initial conditions and wind gusts excite degrees of freedom in the transverse direction. For all test cases, basic simulation parameters remain unchanged, while initial conditions are varied to excite various vibrational modes.
The simplest test case is a vertical drop from rest with all lines taut, but not stretched (test case 1). The purpose of this test case is to verify that the equations of motions are being integrated consistently in POST 2, ADAMS, and MATLAB, and to create a baseline model where gravity and atmosphere models are established for subsequent analysis. In this test case, the overall loads increase steadily as the parachute restrains the suspended masses’ accelerations because of a higher drag force.
Test case 2 starts with a one-centimeter slack in the single riser. With drag force acting on the parachute only, the lander initially falls faster than the parachute. Eventually the single riser runs out of slack and introduces vibrational dynamics into the system.
In test case 3, all bodies start from rest except for the entry capsule, which is given an initial horizontal velocity of 1 m/s. This causes a pendulum-like motion as the parachute system descends. There is more dynamic motion in this test case compared to test case 2, as more degrees of freedom are excited.
Test cases 4a–e simulate the motion of the five-body configuration. In these cases, it is assumed that the lander is fully deployed, and the dynamics caused by the deployment mechanism have damped out. In the 4a–e series, the overall dynamics of the five-body configuration is incrementally increased by applying different initial conditions.
Test case 5 examines the dynamics of the lander deployment maneuver using the DRL. In this case, it is assumed that all the motion occurs in the vertical direction.
Test cases 6a–c investigate the effects of wind gusts on the body motions.
In case 6a, a north-south wind gust excites the five-body parachute system with motion restricted to the north-south plane. To excite additional degrees of freedom, an east-west wind gust has been added in test case 6b. A realistic atmospheric model with a variable density has been used in test case 6c.
Test cases 7a–c simulate the deployment and opening of the parachute. In 7a, the entry capsule and the parachute are both moving vertically downward at a rate of 500 m/s. Parachute deployment is simulated by imparting an instantaneous velocity of 32 m/s to the parachute package away from the entry capsule. The parachute inflation is initiated when the single riser line is first stretched. Test case 7b is identical to 7a, except the entry capsule has an initial flight path angle of –30 degrees, as opposed to –90 degrees in 7a. In test case 7c, initial conditions representative of MER at parachute deployment are applied to the capsule and parachute. A higher fidelity parachute aerodynamics model has also been used for case 7c.

NASA/TP—2009–215765
11
Test cases 8a–c examine the effects of RAD rocket firing. All motion is in the vertical direction in 8a; there are no external forces to excite other degrees of freedom. A single wind gust has been added in 8b, and a second wind gust in an orthogonal direction to the first excites the system further in 8c.
Table 2.3-1. Test case matrix.
1. Vertical drop from rest, all lines initially at free length 2. Vertical drop from rest, some lines initially slack 3. Drop from rest, lander with 1m/s initial horizontal velocity 4. Fully deployed five-body configuration drop from rest
a. Lander 1 m / s N b. Backshell 1 m / s N c. Backshell 1 m / s N, lander 1 m / s N d. Parachute 1 m / s N, backshell 1 m / s E, lander 1 m / s N e. Parachute 1 m / s N, backshell 1 m / s E, lander 1 m / s N, vertical velocity ~
72 m / s 5. Lander DRL deployment 6. Fully deployed five-body configuration with wind gusts
a. One square wave wind gust (NS) b. Two square wave wind gusts (NS and EW) c. Two square wave wind gusts (NS and EW), with realistic atmosphere
7. Parachute deployment a. –90 deg initial flight path angle b. –30 deg initial flight path angle c. Nominal MER initial conditions at parachute deployment, nonzero trimming
parachute 8. RAD firing
a. All motion in vertical direction b. One square wave wind gust (NS), RAD initiated after gust c. Two square wave wind gusts (NS and EW), RAD initiated in the middle of the
second gust
2.4. Simulation Input Parameters
The following section describes the simulation models and configurations used in the test cases.
2.4.1. Initial Body Orientation
In all the test cases, except 7b and 7c, the longitudinal axis of the bodies (X-axis in the body frame) initially points straight down, the Y-axis points south, and the Z-axis completes the right-handed coordinate system (Figure 2.4.1-1). Body rates are set to zero initially in all test cases.

NASA/TP—2009–215765
12
Figure 2.4.1-1. Initial orientation of the bodies (for all cases except 7b, 7c).
2.4.2. Planet Model
Spherical Mars gravity and an elliptical planet surface model have been used for all test cases. The planet is assumed to be non-rotating for simplicity, with all zonal harmonics set to zero (Table 2.4.2-1). All simulations start at zero latitude and zero longitude at an approximate height of 8.4 km.
Table 2.4.2-1. Planet Model. Parameter Value
μ ....................................................................................... 4.2828286853x10¹³ m3/sR
2 e .......................................................................................................................................... 3.393940x10⁶
Rm
p .......................................................................................................................................... 3.376780x10⁶
Ω ................................................................................................................ 0.0 rad/s m
J2, J3,J4
A constant atmospheric density of 0.0135 kg/m
… ................................................................................................. 0.0 3 is assumed for test cases 1–7b, and a more
realistic atmospheric density model for test cases 7c–8c (Figure 2.4.2-1). Aerodynamic drag is assumed to act on the parachute only. Aerodynamic forces on other bodies are ignored for all test cases.

NASA/TP—2009–215765
13
Figure 2.4.2-1. Atmospheric density model.
2.4.3. Parachute Models
Two different parachute models were used in the test cases. The first model uses axial and normal force coefficients at a center of pressure 1.57 m above the parachute center of mass. The axial force coefficient is assumed to be a constant 0.46, and the normal force coefficient is a function of angle of attack (Figure 2.4.3-1). This parachute model trims at zero degrees angle of attack and is used for all test cases except for 7c.
Figure 2.4.3-1. Zero trim parachute model (all test cases except 7c).
The second parachute model, used in test case 7c, is a variation of the parachute model used for MER simulations. In this model, CA, CN, and Cm are defined as a function of the angle of attack

NASA/TP—2009–215765
14
and are resolved at the moment reference point located at the confluence point, 27 m below the parachute center of mass for test case 7c. The distance between the parachute center of mass and the parachute confluence point is 31.321 m in all other test cases (Figures 2.2-1 and 2.2-3). The parachute aerodynamic model used in 7c was derived from wind tunnel tests (ref. 8) and is statically unstable at zero degrees angle of attack. The trim angle of attack is approximately 5 degrees for the parachute model used in 7c. Both models use a reference surface area of 178.47 m2 and a reference length of 15.0876 m for moment calculations.
Figure 2.4.3-2. Nonzero trim parachute model (test case 7c only).
2.4.4. Parachute Riser Line Configuration
Triple riser and triple bridle lines attach axisymmetrically around the centerline of the backshell. The horizontal plane containing the backshell center of mass forms the body Y–Z axis. The plane formed by the triple riser attachment points is parallel to the backshell Y–Z plane (Fig. 2.4.4-1) but offset by 0.5356 m. The plane formed by the triple bridle attachment points is 0.24173 m below the backshell CM. All test cases use the same riser/bridle attachment point configuration.

NASA/TP—2009–215765
15
Figure 2.4.4-1. Backshell line attachment configuration.
The parachute canopy and the parachute shroud lines are assumed to be a single rigid body, with the parachute attachment point located 31.321 m below its center of mass along the centerline (Fig. 2.2-1 and 2.2-1). In cases with the lander in the fully deployed configuration, the single bridle attaches to the lander centerline 0.59088 m above the lander center of mass.
2.4.5. Riser/Bridle Elastic Line Properties
All test cases use the same line properties. Note that lines do not support compression, and while in tension, they behave as ideal massless spring dampers with stiffness and damping properties listed in Table 2.4.5-1. These properties were used in Mars Pathfinder multibody simulations (ref. 5).
Table 2.4.5-1. Elastic properties of the lines. L0
(m) (N/m) N/(m/s) K C
Single Riser ................................................ .......... 1.83200 ........... 60,000 ................ 600 Triple Riser ............................................................ 0.71524 ........... 47,000 ................ 470 Triple Bridles ......................................................... 2.92910 ........... 47,000 ................ 470 Single Bridle ........................................................ 17.25000 ........... 60,000 ................ 600

NASA/TP—2009–215765
16
CHAPTER 3 TEST CASES COMPARISON RESULTS
Test cases simulated using MATLAB and compared with POST 2 are discussed in a separate document (ref. 7). Simulations done by MATLAB include test cases 1, 2, 5, and 7a. In the current document, the results of ADAMS vs. POST 2 test cases are presented. For each test case, line forces from POST 2 and ADAMS are plotted on the same figure. Line forces are generally a good indicator of how the two trajectories compare. Any difference in dynamics between the two simulations will likely cause differences in the line force plots. For this reason, line force plots have been presented as an evidence of good comparison between POST 2 and ADAMS. The entire trajectory is examined in each line force plot, but for the purpose of illustration, two zoomed-in subplots are shown. The subplots are chosen to be in a highly dynamic portion of the trajectory where the likelihood of discrepancies is greater. Even after two successive zooms, in most cases, the line force plots are still indistinguishable. The following factors are the likely explanation for small differences observed. POST 2 uses a fixed-time-step fourth-order Runge-Kutta integrator, while a variable step size integrator is used in the ADAMS simulations. In addition, POST 2 and ADAMS handle line force discontinuities differently. Both tools need to take into consideration the lines switching from taut to slack and back. The switching between slack and taut of tension-only lines is a discontinuity in the strain versus force curve. The ADAMS simulations accommodate for the discontinuity by using a smoothing step function. POST 2 simulations use a very small time step, on the order of 0.1 millisecond, to minimize the adverse effects of crossing the discontinuity.
3.1. Test Case 1
The system is in the fully deployed three-body configuration in test case 1 (Figure 2.2-1) with all bodies starting from rest at an approximate altitude of 8.4 km. The bodies in test case 1 are positioned such that all lines are initially at their free lengths. Line loads start from zero and steadily increase as the parachute system approaches terminal velocity. The main purpose of test case 1 is to create a baseline model where gravity, atmosphere, and aerodynamic models are established for subsequent test cases. Simulation of test case 1 made by POST 2 and ADAMS show good agreement (Figures 3.1-1 and 3.1-2).
Table 3.1-1. Case 1 initial conditions. CM ∆ North East Down Altitude Altitude Velocity Velocity Velocity (m) (m) (m/s) (m/s) (m/s) Parachute ....................... 8414.60000 ....................... - ........... 0.0 ............. 0.0 ........... 0.0 Upper Swivel .................. 8381.44700 .......... 33.15300 ........... 0.0 ............. 0.0 ........... 0.0 Entry Capsule ................ 8380.21700 ............ 1.23000 ........... 0.0 ............. 0.0 ........... 0.0

NASA/TP—2009–215765
17
Figure 3.1-1. Case 1 single riser force.
Figure 3.1-2. Case 1 triple riser 3 force.
3.2. Test Case 2
The system is in the fully deployed three-body configuration in test case 2 (Figure 2.2-1) with all bodies starting from rest at an approximate altitude of 8.4 km. To introduce dynamics into the simulation, the initial positions are arranged such that the single riser has an initial one-centimeter slack (Table 3.2-1). The aerodynamic drag is assumed to act on the parachute only; therefore, the entry capsule initially drops faster than the parachute. Eventually, the single riser

NASA/TP—2009–215765
18
runs out of slack and excites the system. Figures 3.2-1 and 3.2-2 show the single riser and the third triple riser line forces. It takes about 0.7 second for the slack to run out. The single riser then undergoes a damped oscillatory motion. The oscillations damp out approximately two seconds into the simulation. Subsequently, the line force gradually builds up and reaches a steady state value. Figures 3.2-1 and 3.2-2 are comparisons of the line forces as simulated by POST 2 and ADAMS.
Table 3.2-1. Case 2 initial conditions. CM ∆ North East Down Altitude Altitude Velocity Velocity Velocity (m) (m) (m/s) (m/s) (m/s) Parachute ....................... 8414.59000 ....................... - ........... 0.0 ............. 0.0 ........... 0.0 Upper Swivel .................. 8381.44700 .......... 33.14300 ........... 0.0 ............. 0.0 ........... 0.0 Entry Capsule ................ 8380.21700 ............ 1.23000 ........... 0.0 ............. 0.0 ........... 0.0
Figure 3.2-1. Case 2 single riser force.

NASA/TP—2009–215765
19
Figure 3.2-2. Case 2 triple riser 3 force.
3.3. Test Case 3
The system is in the fully deployed three-body configuration in test case 3 (Figure 2.2-1). The initial positions of the bodies are arranged such that all the lines are at their free length initially. All bodies start at rest except for the entry capsule with an initial horizontal velocity of 1 m/s in the north direction. Initial conditions of all bodies are listed in Table 3.3-1. Figures 3.3-1 and 3.3-2 show the line force comparisons between POST 2 and ADAMS. The small differences are attributed to the different ways of handling slack/taut transition and different integration techniques used.
Table 3.3-1. Case 3 initial conditions. CM ∆ North East Down Altitude Altitude Velocity Velocity Velocity (m) (m) (m/s) (m/s) (m/s) Parachute ....................... 8414.60000 ....................... - ........... 0.0 ............. 0.0 ........... 0.0 Upper Swivel .................. 8381.44700 .......... 33.15300 ........... 0.0 ............. 0.0 ........... 0.0 Entry Capsule ................ 8380.21700 ............ 1.23000 ........... 0.0 ............. 0.0 ........... 0.0

NASA/TP—2009–215765
20
Figure 3.3-1. Case 3 single riser force.
Figure 3.3-2. Case 3 triple riser 3 force.
The purpose of Figure 3.3-3 is to help characterize the attitude dynamics of bodies in flight. This figure shows the parachute and the entry capsule angle from vertical in the direction of motion. Zero here means that the body is pointing straight down; positive means the body is pointing north. Several vibrational modes are excited in this test case. The primary mode can be characterized as a single pendulum motion, with the entry capsule swinging back and forth while hanging from the parachute. The pendulum mode is a low frequency motion with a period of about ten seconds and is nearly damped out by the end of the simulation. The parachute and the

NASA/TP—2009–215765
21
entry capsule both carry a rocking motion in addition to the single pendulum motion. The parachute’s rocking motion has a higher frequency and damps out at about fifteen seconds into the simulation. The rocking motion of the entry capsule, also referred as the “wrist mode,” has a lower frequency and is lightly damped. There is still a considerable amount of entry capsule rocking motion after 60 seconds. The periods of motion compared well between POST 2 and ADAMS.
Figure 3.3-3. Case 3 body angles from vertical, north component.
3.4. Test Case 4a
Test case 4a is first of five double pendulum configuration test cases with the system in fully deployed five-body configuration (Figure 2.2-2). Initially, the bodies are positioned such that all lines are at their free length. To introduce dynamics into the system, the lander is given an initial horizontal velocity of 1 m/s in the north direction while all other bodies start from rest (Table 3.4-1). Due to symmetry and a lack of system excitement in the east-west plane, all motion in this test case remains in the north-south plane. Note that other degrees of freedom have not been constrained explicitly. A good agreement is obtained between POST 2 and ADAMS as evident from the line force plots (Figures 3.4-1 to 3.4-4).

NASA/TP—2009–215765
22
Table 3.4-1. Case 4a initial conditions. ∆ North East Down Altitude Altitude Velocity Velocity Velocity (m) (m) (m/s) (m/s) (m/s) Parachute ..................... 8414.60000 ........................ - ............. 0.0 ............. 0.0 ........... 0.0 Upper Swivel ................ 8381.44700 .......... 33.15300 ............. 0.0 ............. 0.0 ........... 0.0 Backshell ..................... 8380.21700 ............ 1.23000 ............. 0.0 ............. 0.0 ........... 0.0 Lower Swivel ............... 8377.21700 ............ 3.00000 ............. 0.0 ............. 0.0 ........... 0.0 Lander .......................... 8359.37612 .......... 17.84088 ............. 1.0 ............. 0.0 ........... 0.0
Figure 3.4-1. Case 4a single riser force.

NASA/TP—2009–215765
23
Figure 3.4-2. Case 4a triple riser 3 force.
Figure 3.4-3. Case 4a triple bridle 3 force.

NASA/TP—2009–215765
24
Figure 3.4-4. Case 4a single bridle force.
Figure 3.4-5 shows the angle between the body X axis of the bodies and the vertical direction. The primary vibrational mode is a double pendulum in this test case. The double pendulum mode, excited by the initial conditions, is a low frequency motion with a period on the order of 15 to 20 seconds. Initial north velocity of the lander excites the backshell; and with less mass and rotational inertia, the backshell gets titled further away from vertical than the lander initially. In this test case and most of the five-body configurations test cases to follow, the triple bridles cause the backshell to point in the direction of the lander. In addition to the pendulum mode, the backshell and lander are excited by a higher frequency rocking motion. Note that all motion remains in the north-south plane.

NASA/TP—2009–215765
25
Figure 3.4-5. Case 4a body angles from vertical, north component.
3.5. Test Case 4b
Test case 4b is similar to test case 4a except the backshell starts with an initial horizontal velocity of 1 m/s in the north direction while all other bodies start from rest. The bodies are positioned such that all lines are at their free length initially. Due to symmetry, all motion in this test case remains in the north-south plane. Figures 3.5-1 to 3.5-4 show the line force comparisons between POST 2 and ADAMS.
Table 3.5-1. Case 4b initial conditions. CM ∆ North East Down Altitude Altitude Velocity Velocity Velocity (m) (m) (m/s) (m/s) (m/s) Parachute ..................... 8414.60000 ........................ - ............. 0.0 ............. 0.0 ........... 0.0 Upper Swivel ................ 8381.44700 .......... 33.15300 ............. 0.0 ............. 0.0 ........... 0.0 Backshell ..................... 8380.21700 ............ 1.23000 ............. 1.0 ............. 0.0 ........... 0.0 Lower Swivel ............... 8376.91700 ............ 3.00000 ............. 0.0 ............. 0.0 ........... 0.0 Lander .......................... 8376.32612 .......... 17.84088 ............. 0.0 ............. 0.0 ........... 0.0

NASA/TP—2009–215765
26
Figure 3.5-1. Case 4b single riser force.
Figure 3.5-2. Case 4b triple riser 3 force.

NASA/TP—2009–215765
27
Figure 3.5-3. Case 4b triple bridle 3 force.
Figure 3.5-4. Case 4b single bridle force.
Dynamics of test case 4b are very similar to test case 4a. However, due to different initial conditions, the double pendulum mode is excited differently (Figure 3.5-5). Similar to 4a, the motion with the lowest frequency is the double pendulum mode, and the higher frequency modes are rocking motions of the bodies. Note that the rocking motion of the parachute is also excited in case 4b.

NASA/TP—2009–215765
28
Figure 3.5-5. Case 4b body angles from vertical, north component.
3.6. Test Case 4c
Both the backshell and lander are given an initial horizontal velocity of 1 m/s while the parachute starts from rest in test case 4c. The bodies are positioned such that all lines are at their free length initially. Due to symmetry, all motion remains to the north-south plane. Figures 3.6-1 to 3.3.6-4 show how the line forces compare as predicted by POST 2 and ADAMS.
Table 3.6-1. Case 4c initial conditions. CM ∆ North East Down Altitude Altitude Velocity Velocity Velocity (m) (m) (m/s) (m/s) (m/s) Parachute ..................... 8414.60000 ........................ - ............. 0.0 ............. 0.0 ........... 0.0 Upper Swivel ................ 8381.44700 .......... 33.15300 ............. 0.0 ............. 0.0 ........... 0.0 Backshell ..................... 8380.21700 ............ 1.23000 ............. 1.0 ............. 0.0 ........... 0.0 Lower Swivel ............... 8376.91700 ............ 3.00000 ............. 1.0 ............. 0.0 ........... 0.0 Lander .......................... 8376.32612 .......... 17.84088 ............. 1.0 ............. 0.0 ........... 0.0

NASA/TP—2009–215765
29
Figure 3.6-1. Case 4c single riser force.
Figure 3.6-2. Case 4c triple riser 3 force.
NASA/TP—2009–215765
30
Figure 3.6-3. Case 4c triple bridle 3 force.
Figure 3.6-4. Case 4c single bridle force.
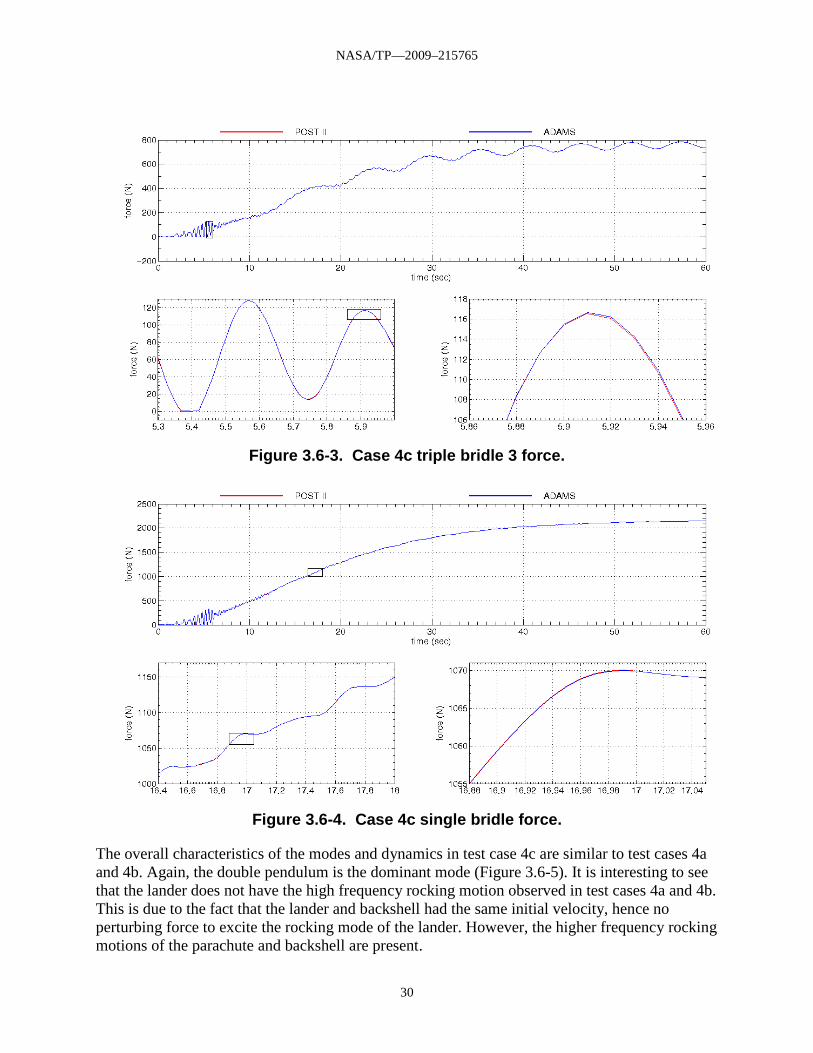
The overall characteristics of the modes and dynamics in test case 4c are similar to test cases 4a and 4b. Again, the double pendulum is the dominant mode (Figure 3.6-5). It is interesting to see that the lander does not have the high frequency rocking motion observed in test cases 4a and 4b. This is due to the fact that the lander and backshell had the same initial velocity, hence no perturbing force to excite the rocking mode of the lander. However, the higher frequency rocking motions of the parachute and backshell are present.

NASA/TP—2009–215765
31
Figure 3.6-5. Case 4c body angles from vertical, north component.
3.7. Test Case 4d
The parachute has an initial velocity of 1 m/s in the north direction, the backshell 1 m/s in the east direction, and the lander 1 m/s in the north direction in test case 4d. The bodies are positioned such that all lines are at their free length initially. In test cases 4a–c, all motion remained in the north-south plane. Test case 4d attempts to excite all six degrees of freedom for the parachute, backshell, and lander by applying initial conditions to the bodies in orthogonal planes. Figures 3.7-1 to 3.7-4 show the comparisons of the line forces as predicted by POST 2 and ADAMS.
Table 3.7-1. Case 4d initial conditions. CM ∆ North East Down Altitude Altitude Velocity Velocity Velocity (m) (m) (m/s) (m/s) (m/s) Parachute ..................... 8414.60000 ........................ - ............. 1.0 ............. 0.0 ........... 0.0 Upper Swivel ................ 8381.44700 .......... 33.15300 ............. 0.0 ............. 0.0 ........... 0.0 Backshell ..................... 8380.21700 ............ 1.23000 ............. 0.0 ............. 1.0 ........... 0.0 Lower Swivel ............... 8376.91700 ............ 3.00000 ............. 0.0 ............. 0.0 ........... 0.0 Lander .......................... 8376.32612 .......... 17.84088 ............. 1.0 ............. 0.0 ........... 0.0

NASA/TP—2009–215765
32
Figure 3.7-1. Case 4d single riser force.
Figure 3.7-2. Case 4d triple riser 3 force.

NASA/TP—2009–215765
33
Figure 3.7-3. Case 4d triple bridle 3 force.
Figure 3.7-4. Case 4d single bridle force.
All motion for test cases 4a–c remained in a two-dimensional plane. All degrees of freedom are excited for the first time in test case 4d. The overall characteristics of the vibrational modes and dynamics of test case 4d are very similar to test cases 4a–c. However, test case 4d brings out an important feature associated with multibody parachute simulations. A close examination of Figures 3.7-5 and 3.7-6 makes it apparent that there is very little or no cross coupling in the motions of the bodies in the orthogonal north-south and the east-west planes. In test case 4d, the parachute and lander are excited in the north-south plane, while the backshell is excited in the
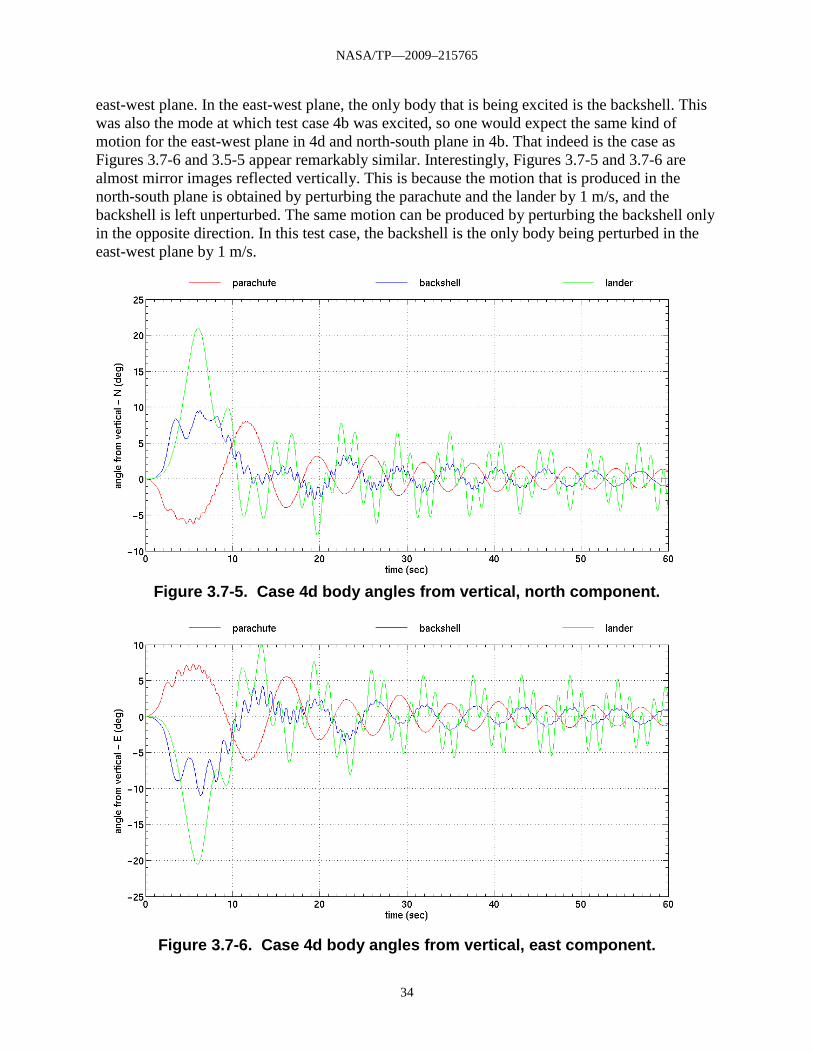
NASA/TP—2009–215765
34
east-west plane. In the east-west plane, the only body that is being excited is the backshell. This was also the mode at which test case 4b was excited, so one would expect the same kind of motion for the east-west plane in 4d and north-south plane in 4b. That indeed is the case as Figures 3.7-6 and 3.5-5 appear remarkably similar. Interestingly, Figures 3.7-5 and 3.7-6 are almost mirror images reflected vertically. This is because the motion that is produced in the north-south plane is obtained by perturbing the parachute and the lander by 1 m/s, and the backshell is left unperturbed. The same motion can be produced by perturbing the backshell only in the opposite direction. In this test case, the backshell is the only body being perturbed in the east-west plane by 1 m/s.
Figure 3.7-5. Case 4d body angles from vertical, north component.
Figure 3.7-6. Case 4d body angles from vertical, east component.

NASA/TP—2009–215765
35
3.8. Test Case 4e
Test case 4e is identical to 4d except initially all bodies are descending at a rate close to the terminal velocity of the parachute system, whereas, in test case 4d they had a vertical velocity of zero initially. In 4e, the parachute and lander start with a horizontal velocity of 1 m/s and the backshell initially has a velocity of 1 m/s in the east direction, exciting all degrees of freedom. In test case 4e, all lines start out with relatively high loads, where in cases 4a–d all lines have zero initial loads. Figures 3.8-1 to 3.8-4 show the line force comparisons as simulated by POST 2 and ADAMS.
Table 3.8-1. Case 4e initial conditions. CM ∆ North East Down Altitude Altitude Velocity Velocity Velocity (m) (m) (m/s) (m/s) (m/s) Parachute ..................... 5928.88956 .................... - ............. 1.0 ............. 0.0 ..... 71.96977 Upper Swivel ................ 5895.68971 ...... 33.19985 ............. 0.0 ............. 0.0 ..... 71.96977 Backshell ..................... 5894.43861 ........ 1.25110 ............. 0.0 ............. 1.0 ..... 71.96977 Lower Swivel ............... 5891.42131 ........ 3.01730 ............. 0.0 ............. 0.0 ..... 71.96977 Lander .......................... 5873.54448 ...... 17.87683 ............. 1.0 ............. 0.0 ..... 71.96977
Figure 3.8-1. Case 4e single riser force.

NASA/TP—2009–215765
36
Figure 3.8-2. Case 4e triple riser 3 force.
Figure 3.8-3. Case 4e triple bridle 3 force.

NASA/TP—2009–215765
37
Figure 3.8-4. Case 4e single bridle force.
Figures 3.8-5 and 3.8-6 show the attitude time histories of all bodies in motion in both planes. Recall that this test case is identical to 4d except all bodies have an initial vertical velocity close to the terminal descent rate. The initial conditions are such that lines are not in equilibrium. For this reason, and because of high aerodynamic forces on the parachute, the lines undergo some high frequency oscillations initially (Figure 3.8-1). The overall motion is the double pendulum motion, with some rocking motion of the individual bodies.
Figure 3.8-5. Case 4e body angles from vertical, north component.

NASA/TP—2009–215765
38
Figure 3.8-6. Case 4e body angles from vertical, east component.
3.9. Test Case 5
The airbag based landing systems used for Mars Pathfinder and MER required the lander to be lowered from the backshell while still attached by a line. To reduce dynamic loading of the lander during lowering, a mechanical DRL device was used to passively control the rate of separation between the backshell and lander. The DRL device was rigidly attached to the lander with the DRL line wound around a drum, and the fixed end was attached to the top of the backshell. In the Mars Pathfinder and MER configurations, the lander continued moving away from the backshell on the DRL until the bridle lines were fully stretched, supporting the weight of the lander. In test case 5, the DRL is disabled shortly before reaching its full length. The lander free falls for a short distance before being caught by the bridle lines. Disabling the DRL is done for the purpose of numerical robustness by ensuring that the DRL does not contribute additional forces to the lander as the bridle lines begin to stretch.
The DRL used for Pathfinder and MER is based on a centrifugal braking mechanism. This mechanism is designed to limit the lander descent rate from the backshell. The DRL damping force is proportional to the square of the separation velocity. The damping force is given by:
3
2
DRL RdcF
= (3.9-1)
R is a function of backshell/lander separation (d) as described in Reference 6. The values of the input parameters used in this test case are listed in Table 3.9-1.
−−
−−=
sLsd
RR11RR(d) 2
0
21
0 (3.9-2)

NASA/TP—2009–215765
39
The DRL model was implemented in POST 2 and ADAMS. In test case 5, all bodies were initially falling at approximately 71 m/s, which is close to the terminal descent rate. The lander and backshell are assumed to have coincident centers of gravity initially and identical velocities. Because the backshell’s descent rate is the same as the parachute, the lander will accelerate away from the backshell initially until the DRL slows the motion to a steady descent rate. Figures 3.9-1 to 3.9-4 show how POST 2 and ADAMS simulation results compare in modeling the DRL test case.
Table 3.9-1. DRL input parameters. Input Parameter Value R0 .................................................................................................. 0.044
Rm
1 ........................................................................................................................................... 0.012672
Cm
................................................................................................................................................... 0.001 N-m-secS ...................................................................................................... 0.00 m
2
L ..................................................................................................... 20.00 m
Figure 3.9-1. Case 5 single riser force.

NASA/TP—2009–215765
40
Figure 3.9-2. Case 5 triple riser 3 line force.
Figure 3.9-3. Case 5 triple bridle 3 force.

NASA/TP—2009–215765
41
Figure 3.9-4. Case 5 single bridle force.
3.10. Test Case 6a
Test cases 6a–c are similar to test cases 4a–e; however, a different method is used to excite the system. In test cases 4a–e, the system was excited by applying different initial conditions to the bodies. In test cases 6a–c, the system is excited as it travels through wind gusts. The system is in fully deployed five-body configuration in test case 6a (Figure 2.2-2). Initially, all bodies are traveling are a rate close to the terminal velocity of the system. The initial positions and velocities of the bodies were chosen such that the lines are initially at equilibrium (Table 3.10-1), and they remain at equilibrium until the system encounters the wind gust. The wind velocity is zero everywhere except between altitudes of 5100 to 5200 m (Figure 3.10-1). All of the lines experience a sudden increase in load when the parachute is first affected by the wind gust approximately ten seconds into the simulation.
Table 3.10-1. Case 6a initial conditions. CM ∆ North East Down Altitude Altitude Velocity Velocity Velocity (m) (m) (m/s) (m/s) (m/s) Parachute ..................... 5928.88956 .................... - ............. 0.0 ............. 0.0 ..... 71.96977 Upper Swivel ................ 5895.68971 ...... 33.19985 ............. 0.0 ............. 0.0 ..... 71.96977 Backshell ..................... 5894.43861 ........ 1.25110 ............. 0.0 ............. 0.0 ..... 71.96977 Lower Swivel ............... 5891.42131 ........ 3.01730 ............. 0.0 ............. 0.0 ..... 71.96977 Lander .......................... 5873.54448 ...... 17.87683 ............. 0.0 ............. 0.0 ..... 71.96977

NASA/TP—2009–215765
42
Figure 3.10-1. Case 6a wind gust.
Figure 3.10-2. Case 6a single riser force.

NASA/TP—2009–215765
43
Figure 3.10-3. Case 6a triple riser 3 force.
Figure 3.10-4. Case 6a triple bridle 3 force.

NASA/TP—2009–215765
44
Figure 3.10-5. Case 6a single bridle force.
Figure 3.10-6 shows the attitude time histories of the parachute, backshell, and lander. Prior to encountering the wind gust, all bodies are moving straight down. Note that the parachute is the only body in this simulation with aerodynamic forces. So upon encountering the wind gust 10 seconds into flight, the parachute is affected first and transmits perturbing forces to the backshell and lander through the riser and bridle lines. The only motion excited in this test case is a double pendulum mode. The rocking motion of the individual bodies was not excited.
Figure 3.10-6. Case 6a body angles from vertical, north component.

NASA/TP—2009–215765
45
3.11. Test Case 6b
Test case 6b adds a level of complexity to case 6a by adding a second gust in an orthogonal direction to the first wind gust, exciting all degrees of freedom. The system configuration and initial conditions are identical to 6a (Table 3.11-1). The first wind gust occurs at the same altitude as in 6a between 5.1 to 5.2 km. The second wind gust is applied between the altitudes of 4.4 and 4.5 km in the east direction. The parachute system encounters the first wind gust approximately 10 seconds into the simulation, and the second wind gust at about 20 seconds. Each wind gust perturbs the parachute system and causes a sudden increase in line forces. Figures 3.11-2 to 3.11-5 are line force comparison plots of this wind gust test case as simulated by POST 2 and ADAMS.
Table 3.11-1. Case 6b initial conditions. CM ∆ North East Down Altitude Altitude Velocity Velocity Velocity (m) (m) (m/s) (m/s) (m/s) Parachute ..................... 5928.88956 .................... - ............. 0.0 ............. 0.0 ..... 71.96977 Upper Swivel ................ 5895.68971 ...... 33.19985 ............. 0.0 ............. 0.0 ..... 71.96977 Backshell ..................... 5894.43861 ........ 1.25110 ............. 0.0 ............. 0.0 ..... 71.96977 Lower Swivel ............... 5891.42131 ........ 3.01730 ............. 0.0 ............. 0.0 ..... 71.96977 Lander .......................... 5873.54448 ...... 17.87683 ............. 0.0 ............. 0.0 ..... 71.96977
Figure 3.11-1. Case 6b wind gusts.

NASA/TP—2009–215765
46
Figure 3.11-2. Case 6b single riser force.
Figure 3.11-3. Case 6b triple riser 3 force.

NASA/TP—2009–215765
47
Figure 3.11-4. Case 6b triple bridle 3 force.
Figure 3.11-5. Case 6b single bridle force.
Figures 3.11-6 and 3.11-7 are the attitude time histories for the parachute, backshell, and lander. Prior to undergoing the wind gusts, all bodies are moving straight down. Note that the parachute is the only body in this simulation with aerodynamic forces; so upon encountering the wind gust 10 seconds into flight, the parachute is perturbed from its equilibrium state and transfers perturbing forces to the backshell and lander. The only motion excited in this test case is a double pendulum mode. Since the first wind gust is in the north-south direction, the double

NASA/TP—2009–215765
48
pendulum mode stays confined to that plane until it reaches the second wind gust in the east direction. It is interesting to note that the motion in the north-south plane is mostly unaffected by the second wind gust, as there are only small amplitude vibrations in the backshell attitude plot at the time of the second wind gust encounter (Figure 3.11-6). The small amount of cross coupling in 6b is further testimony to the observations in test case 4c where initial conditions applied in orthogonal planes did not influence the pendulum motion in the orthogonal direction.
Figure 3.11-6. Case 6b body angles from vertical, north component.
Figure 3.11-7. Case 6b body angles from vertical, east component.

NASA/TP—2009–215765
49
3.12. Test Case 6c
Test case 6c is identical to 6b except a realistic atmospheric model is used instead of a constant density model (Section 2.4.1). Recall that in the test cases up to this point a constant atmospheric density of 0.0135 kg/m3
Table 3.12-1. Case 6c initial conditions.
has been assumed. The system configuration and the initial conditions in 6c are identical to 6a and 6b (Table 3.12-1). Because of the change in atmospheric density, the lines are no longer in equilibrium initially and undergo oscillatory motion prior to encountering the wind gusts. Case 6c has the same two wind gusts as 6b (Figure 3.12-1). The first wind gust perturbs the parachute approximately 9 seconds into the simulation, and the second wind gust at approximately 17 seconds. The effects of wind gusts are apparent in the line force plots at each encounter. Figures 3.12-2 to 3.12-5 are line force comparison plots of the wind gust test case 6c as simulated by POST 2 and ADAMS.
CM ∆ North East Down Altitude Altitude Velocity Velocity Velocity (m) (m) (m/s) (m/s) (m/s) Parachute ..................... 5928.88956 .................... - ............. 0.0 ............. 0.0 ..... 71.96977 Upper Swivel ................ 5895.68971 ...... 33.19985 ............. 0.0 ............. 0.0 ..... 71.96977 Backshell ..................... 5894.43861 ........ 1.25110 ............. 0.0 ............. 0.0 ..... 71.96977 Lower Swivel ............... 5891.42131 ........ 3.01730 ............. 0.0 ............. 0.0 ..... 71.96977 Lander .......................... 5873.54448 ...... 17.87683 ............. 0.0 ............. 0.0 ..... 71.96977
Figure 3.12-1. Case 6c wind gusts.

NASA/TP—2009–215765
50
Figure 3.12-2. Case 6c single riser force.
Figure 3.12-3. Case 6c triple riser 3 force.

NASA/TP—2009–215765
51
Figure 3.12-4. Case 6c triple bridle 3 force.
Figure 3.12-5. Case 6c single bridle force.
The dynamics in test case 6c are very similar to 6b. The times at which the system encounters the wind gusts are different because the atmospheric density is generally lower than the constant density of 0.0135 assumed for 6a and 6b (Figure 2.4.2-1). The resulting double pendulum modes are very similar to 6b.
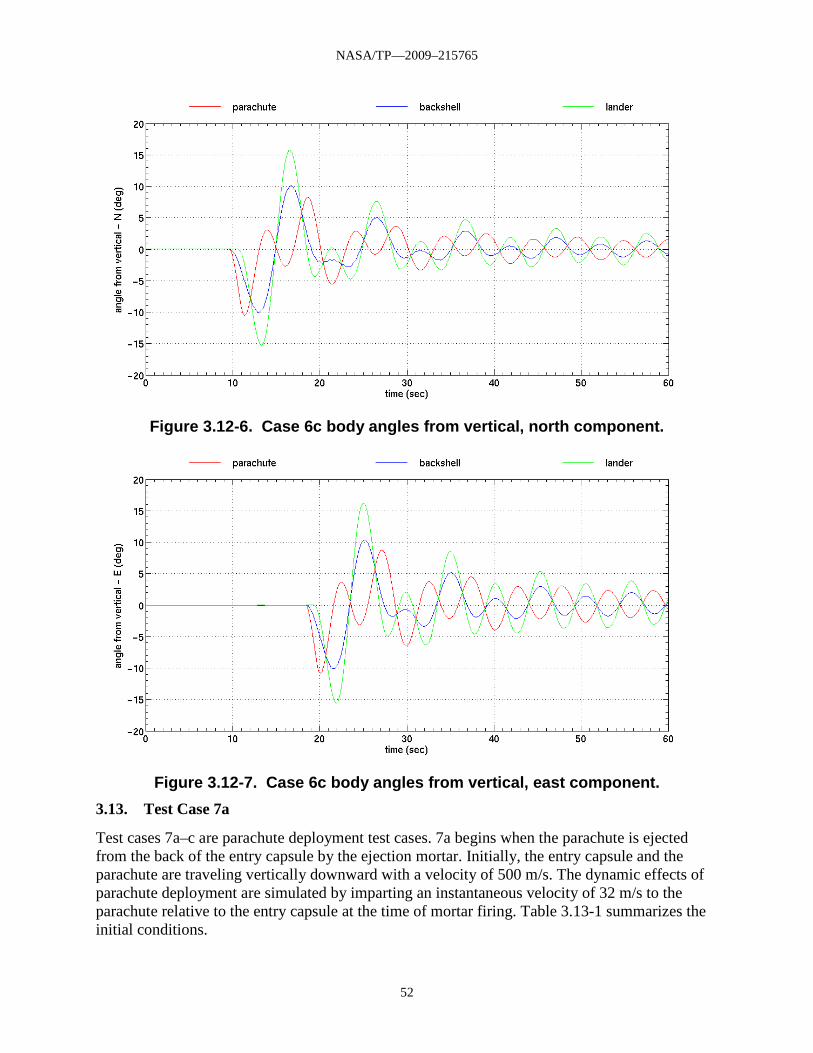
NASA/TP—2009–215765
52
Figure 3.12-6. Case 6c body angles from vertical, north component.
Figure 3.12-7. Case 6c body angles from vertical, east component.
3.13. Test Case 7a
Test cases 7a–c are parachute deployment test cases. 7a begins when the parachute is ejected from the back of the entry capsule by the ejection mortar. Initially, the entry capsule and the parachute are traveling vertically downward with a velocity of 500 m/s. The dynamic effects of parachute deployment are simulated by imparting an instantaneous velocity of 32 m/s to the parachute relative to the entry capsule at the time of mortar firing. Table 3.13-1 summarizes the initial conditions.

NASA/TP—2009–215765
53
Table 3.13-1. Case 7a initial conditions. CM ∆ North East Down Altitude Altitude Velocity Velocity Velocity (m) (m) (m/s) (m/s) (m/s) Parachute ..................... 8414.60000 .................... - ............. 0.0 ............. 0.0 ........... 468.0 Upper Swivel ................ 8414.60000 ........ 0.00000 ............. 0.0 ............. 0.0 ........... 500.0 Entry Capsule .............. 8414.60000 ........ 0.00000 ............. 0.0 ............. 0.0 ........... 500.0
In flight, the parachute is held by a bag until the lines connecting the parachute to the entry body become taut. At this point the bag is stripped off the parachute, initiating the inflation process. In the simulations, the inflation process is modeled as a function of time. In test cases 7a–c, the parachute inflation is assumed to follow the profile shown in Figure 3.13-1. A parachute inflation ratio of 1.0 corresponds to full inflation. In the parachute deployment test cases, the parachute aerodynamic coefficients are scaled by the parachute inflation ratio. It is assumed that the entire mass of the parachute is concentrated in a point mass, and it travels away from the backshell as a lumped mass during deployment. In flight, the parachute shroud lines unravel in a more gradual fashion; therefore, the parachute center of mass does not travel back as fast as it does in current simulations. The results of the POST 2 and ADAMS comparisons are shown in Figures 3.13-2 and 3.13-3.
Figure 3.13-1. Parachute inflation profile.
Figure 3.13-2 shows the force on the single riser. The single riser force is the summation of the parachute drag force and inertial forces. Note that there are two peaks in the single riser force profile. The first peak, referred to as the snatch load, is an inertial force that is caused when the parachute mass reaches the end of the lines and reaccelerates to the speed of the payload. The snatch load in a real parachute ejection tends to be smaller in magnitude because of parachute ejection modeling assumptions used in the simulation. Certain forces, such as momentum transfer between the parachute pack and the entry capsule, are not modeled here. In addition, the shroud lines are a significant amount of the total parachute mass and, in a real parachute system,

NASA/TP—2009–215765
54
are unfurled gradually. As the parachute inflates and the drag area increases, the single riser force builds up again to another local maximum called the opening load. The opening load is greater than the snatch load for most parachutes. The force then decreases gradually as the descent rate and the parachute loads are reduced.
Figure 3.13-2. Case 7a single riser force.
Figure 3.13-3. Case 7a triple riser 3 force.

NASA/TP—2009–215765
55
3.14. Test Case 7b
Test case 7b is identical to 7a except the entry capsule is traveling at a –30° flight path angle as opposed to straight down at -90°. All other initial conditions are the same as 7a (Table 3.14-1). Note that a different coordinate system is used to input the velocity vector of the bodies. In all test cases up to now, initial velocity was input in the north, east, and down directions. In test cases 7b and 7c, the magnitude of the relative velocity, flight path angle, and azimuth angle are used to initialize the velocity vector. The difference between velocities of the parachute and the entry capsule is the mortar ejection velocity of 32 m/s.
Table 3.14-1. Case 7b initial conditions. CM ∆ Relative Flight Azimuth Altitude Altitude Velocity Path Angle Angle, N (m) (m) (m/s) (deg) (m/s) Parachute ................... 8414.60000 ................... - ...... 468.000 ........... –30.0 .............. 0.0 Upper Swivel .............. 8414.60000 ........ 0.00000 ...... 500.000 ........... –30.0 .............. 0.0 Entry Capsule ............ 8414.60000 ........ 0.00000 ...... 500.000 ........... –30.0 .............. 0.0
Figure 3.14-1. Case 7b single riser force.

NASA/TP—2009–215765
56
Figure 3.14-2. Case 7b triple riser 3 force.
In this parachute inflation test case, the entry capsule is moving in the north-south plane. The ejection of the parachute occurs such that the axial direction of the entry capsule and the parachute remain in-line during deployment, so no disturbing torques are imparted to either body when the parachute begins to inflate. The rocking modes of the parachute and the entry capsule are therefore not excited. Additionally, there are no other external forces to excite the single pendulum mode of the system. As a result, the only motion observed in Figure 3.14-3 is the gravity turn as the parachute and the entry capsule are in the process of transitioning to vertical flight.
Figure 3.14-3. Case 7b body angles from vertical, north component.

NASA/TP—2009–215765
57
3.15. Test Case 7c
Test case 7c uses more realistic initial conditions than previous cases (Table 3.15-1). The initial conditions in 7c are typical values out of MER simulations at parachute deployment. The mortar ejection velocity in this test case is equal to 36.576 m/s (120 fps). This test case is simulated using a nonzero trimming parachute model (Section 2.4.2). In test case 7a and 7b, the parachute trimmed at zero degree angle of attack. In test case 7c, the parachute is unstable at zero degree angle of attack, instead trimming at approximately five degrees. This introduces more dynamics into the system as the parachute rocks back and forth around its trim point. Figures 3.15-1 and 3.15-2 are line force comparison plots of this parachute deployment test case as simulated by POST 2 and ADAMS.
Table 3.15-1. Case 7c initial conditions. CM ∆ Relative Flight Azimuth Altitude Altitude Velocity Path Angle Angle, N (m) (m) (m/s) (deg) (m/s) Parachute ................... 8066.18000 ................... - ...... 373.924 ........... –28.0 ............ 90.0 Upper Swivel .............. 8066.18000 ........ 0.00000 ...... 410.500 ........... –28.0 ............ 90.0 Entry Capsule ............ 8066.18000 ........ 0.00000 ...... 410.500 ........... –28.0 ............ 90.0
Figure 3.15-1. Case 7c single riser force.

NASA/TP—2009–215765
58
Figure 3.15-2. Case 7c triple riser 3 force.
The entry capsule is moving in the east direction initially in test case 7c. The parachute is ejected directly backwards relative to the entry capsule. Because the parachute model used in this test case trims at approximately five degrees angle of attack, it quickly goes to its trim point. The parachute oscillates back and forth before it settles down and stays at the trim angle of attack. The parachute oscillations excite the rocking motion of the entry capsule, and this lightly damped motion goes on until the end of the simulation (Figure 3.15-3). This appears to be the only oscillation mode for the entry capsule. The pendulum mode did not get excited in this test case, and all motion remains in the east-west plane.
Figure 3.15-3. Case 7c body angles from vertical, north component.

NASA/TP—2009–215765
59
3.16. Test Case 8a
Test case 8a is the first of three dealing with modeling dynamics of the RAD rocket motor firings. In the test case series 8a–c, the system is in fully deployed five-body configuration (Figure 2.2-2). The RAD rocket motors are configured similar to the Mars Pathfinder and MER missions, placed axisymmetrically around the centerline of the backshell. The direction of thrust of each motor is 27.2° away from the backshell centerline. The RAD rockets point downward and their function is to reduce the rate of descent just prior to the bridle-cut event.
Figure 3.16-1. RAD Configuration.
In cases 8a–c, the system is moving straight down close to the terminal descent rate of the system with all lines in equilibrium. All three cases use a realistic atmospheric model (Section 2.4.1). Case 8a has no perturbing force. This test case uses the parachute model that trims at zero degrees angle of attack, so the parachute drag force acts in the axial direction only. Although the three RAD rocket motors have been modeled individually, the net thrust is in the axial direction. The RAD rocket motors are ignited approximately seven seconds into the simulation. Figure 3.16-2 shows the comparison between POST 2 and ADAMS of the single riser force. Note how the single riser dynamically offloads during the RAD firings (Figure 3.16-2). Just prior to burnout of the RAD motors, the single riser is completely offloaded, meaning the RAD motors have decelerated the backshell beyond the point of effectiveness of the parachute. On the other hand, as the RADs ignite, the bridle line forces increase, transferring the thrust force from the backshell to the lander (Figure 3.16-4).
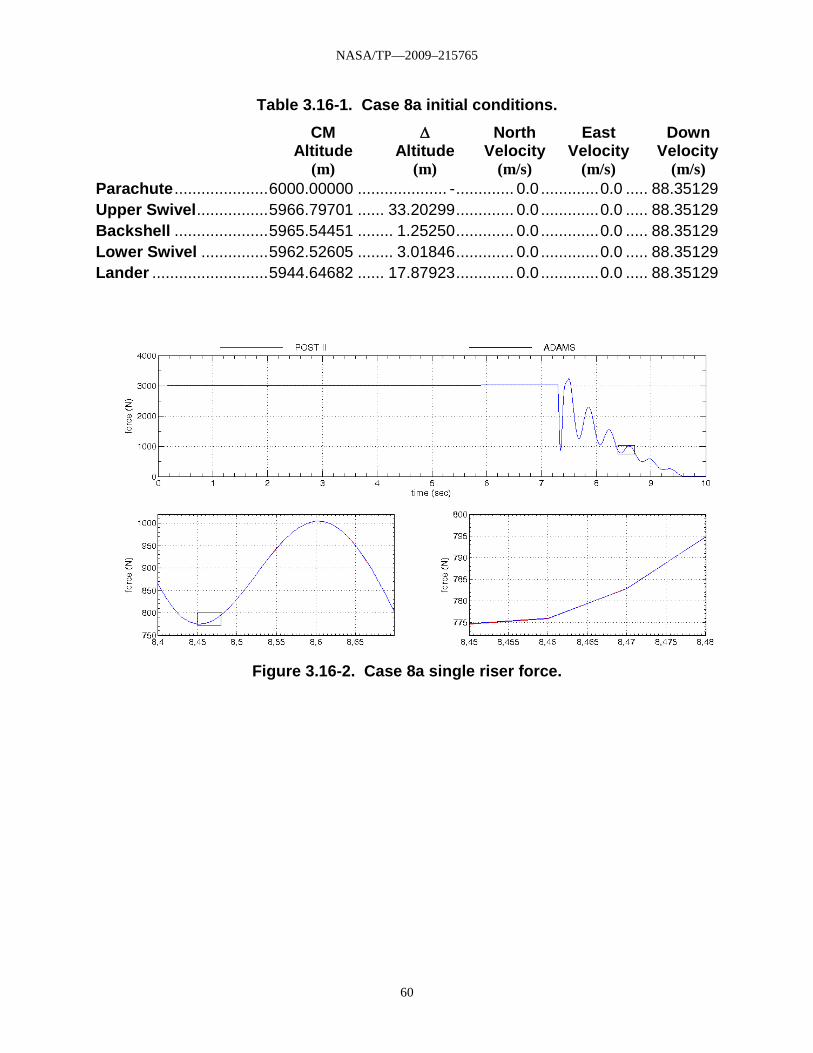
NASA/TP—2009–215765
60
Table 3.16-1. Case 8a initial conditions. CM ∆ North East Down Altitude Altitude Velocity Velocity Velocity (m) (m) (m/s) (m/s) (m/s) Parachute ..................... 6000.00000 .................... - ............. 0.0 ............. 0.0 ..... 88.35129 Upper Swivel ................ 5966.79701 ...... 33.20299 ............. 0.0 ............. 0.0 ..... 88.35129 Backshell ..................... 5965.54451 ........ 1.25250 ............. 0.0 ............. 0.0 ..... 88.35129 Lower Swivel ............... 5962.52605 ........ 3.01846 ............. 0.0 ............. 0.0 ..... 88.35129 Lander .......................... 5944.64682 ...... 17.87923 ............. 0.0 ............. 0.0 ..... 88.35129
Figure 3.16-2. Case 8a single riser force.

NASA/TP—2009–215765
61
Figure 3.16-3. Case 8a triple riser 3 force.
Figure 3.16-4. Case 8a triple bridle 3 force.

NASA/TP—2009–215765
62
Figure 3.16-5. Case 8a single bridle force.
3.17. Test Case 8b
Test case 8b simulation setup and initial conditions (Table 3.17-1) are identical to test case 8a except a wind gust has been added (Figure 3.17-1). The wind gust hits the system a few seconds before RAD ignition. Although not explicitly constrained, all motion remains in the north-south plane. The system encounters the wind gust approximately 9 seconds into the simulation. The effects of the wind gust are apparent in the single riser line force as it is perturbed from equilibrium (Figure 3.17-2). Figures 3.17-2 to 3.17-5 show comparison of the line forces as simulated by POST 2 and ADAMS.
Table 3.17-1. Case 8b initial conditions. CM ∆ North East Down Altitude Altitude Velocity Velocity Velocity (m) (m) (m/s) (m/s) (m/s) Parachute ............... 6000.00000 ...................... - .............. 0.0 ............. 0.0 ........ 88.35129 Upper Swivel .......... 5966.79701 ........ 33.20299 .............. 0.0 ............. 0.0 ........ 88.35129 Backshell ............... 5965.54451 .......... 1.25250 .............. 0.0 ............. 0.0 ........ 88.35129 Lower Swivel ......... 5962.52605 .......... 3.01846 .............. 0.0 ............. 0.0 ........ 88.35129 Lander .................... 5944.64682 ........ 17.87923 .............. 0.0 ............. 0.0 ........ 88.35129

NASA/TP—2009–215765
63
Figure 3.17-1. Case 8b wind gust.
Figure 3.17-2. Case 8b single riser force.

NASA/TP—2009–215765
64
Figure 3.17-3. Case 8b triple riser 3 force.
Figure 3.17-4. Case 8b triple bridle 3 force.

NASA/TP—2009–215765
65
Figure 3.17-5. Case 8b single bridle force.
Prior to the wind gust, all motion is in the vertical direction. The wind gust strikes the parachute approximately 9 seconds into the simulation and excites the double pendulum mode similar to test case 6a. The retro-rockets fire about 15 seconds into the simulation. The backshell and lander are not perfectly lined up at the start of the RAD burn, and as a result, a disturbing torque is introduced into the system, exciting the rocking motion of the backshell and lander (Figure 3.17-6).
Figure 3.17-6. Case 8b body angles from vertical, north component.

NASA/TP—2009–215765
66
3.18. Test Case 8c
The initial conditions for test case 8c are identical to 8a and 8b (Table 3.18-1). To further excite the system, a second wind gust blowing from west to east has been added (Figure 3.18-1). The second wind gust strikes the parachute during the RAD burn. All degrees of freedom are excited in test case 8a. The effects of the wind gusts are apparent in the single riser force plot (Figure 3.18-2) as disturbances 9 and 17 seconds into the simulation. Figures 3.18-2 to 3.18-5 show good agreement between POST 2 and ADAMS.
Table 3.18-1. Case 8c initial conditions. CM ∆ North East Down Altitude Altitude Velocity Velocity Velocity (m) (m) (m/s) (m/s) (m/s) Parachute ............... 6000.00000 ...................... - .............. 0.0 ............. 0.0 ........ 88.35129 Upper Swivel .......... 5966.79701 ........ 33.20299 .............. 0.0 ............. 0.0 ........ 88.35129 Backshell ............... 5965.54451 .......... 1.25250 .............. 0.0 ............. 0.0 ........ 88.35129 Lower Swivel ......... 5962.52605 .......... 3.01846 .............. 0.0 ............. 0.0 ........ 88.35129 Lander .................... 5944.64682 ........ 17.87923 .............. 0.0 ............. 0.0 ........ 88.35129
Figure 3.18-1. Case 8c wind gusts.

NASA/TP—2009–215765
67
Figure 3.18-2. Case 8c single riser force.
Figure 3.18-3. Case 8c triple riser 3 force.

NASA/TP—2009–215765
68
Figure 3.18-4. Case 8c triple bridle 3 force.
Figure 3.18-5. Case 8c single bridle force.
The parachute encounters the first wind gust approximately 9 seconds into the simulation exciting the double pendulum mode in the north-south plane (Figure 3.18-6). There is no motion in the east-west plane until the second wind gust excites the system about 17 seconds into the simulation (Figure 3.18-7).

NASA/TP—2009–215765
69
Figure 3.18-6. Case 8c body angles from vertical, north component.
Figure 3.18-7. Case 8c body angles from vertical, east component.

NASA/TP—2009–215765
70
CHAPTER 4 RESULTS SUMMARY
A capability has been developed for a detailed simulation of planetary parachute entry trajectories. This tool was developed for the MER project to provide end-to-end simulations of the entire EDL sequence, starting from atmospheric entry to ground impact. This tool was built as an improvement to the aerospace industry standard trajectory simulation tool POST 2. The multibody parachute simulation tool takes advantage of already proven and effective modules within POST 2 and extends its capabilities to perform detailed parachute simulations.
The POST 2 multibody parachute simulation tool has been validated against an accepted multibody simulation tool by simulating a series of test cases and comparing the results. The test cases started with a simple high altitude drop of the single-pendulum parachute system and incrementally increased in complexity to include many dynamic elements encountered by a typical parachute entry system. The dynamic elements examined in the test cases included variations on initial conditions, wind gusts, parachute deployment, retrorocket firing, and deployment of the lander. In the first set of test cases, the initial conditions and environmental parameters were chosen such that only one degree of freedom was excited. In subsequent test cases, more degrees of freedom were excited with all the motion confined to a plane, and finally all six degrees of freedom were excited.
The confidence gained from these test cases allowed the MER EDL team to successfully construct a full end-to-end simulation of the mission from atmospheric entry to ground impact of the airbag system. The MER end-to-end POST 2 multibody simulation was used as the primary EDL simulation tool and was relied upon heavily in quantifying and reducing the overall risks to the EDL phase of the mission.

NASA/TP—2009–215765
71
CHAPTER 5 REFERENCES
1. Powell, Richard W., et al.: Program to Optimize Simulated Trajectories (POST 2), Volume II, Users Manual, Version 1.1.6.G, November 2003.
2. Martin Marietta Corporation: Balloon Launched Decelerator Test Program Post-Flight Test Report BLDT Vehicle AV–4, TR–3720295, October 1972.
3. Talay, Theodore A.: Parachute-Deployment-Parameter Identification Based on an Analytical Simulation of Viking BLDT AV-4, NASA TN D-7678, August 1974.
4. Mechanical Dynamics, Inc.: ADAMS Reference Manual, Version 9.0.1, June 2000. 5. Smith, Kenneth S.; Peng, Chia-Yen; and Behboud, Ali: Multibody Dynamic Simulation of
Mars Pathfinder Entry, Descent and Landing, JPL D-13298, April 1995. 6. Purvis, J.W.: Prediction of Line Sail during Lines-First Deployment; Parachute Suspension
Simulation, AIAA Paper 1983-0370, Jan. 1983. 7. Raiszadeh, Ben and Queen, Eric M.: Partial Validation of Multibody Program to Optimize
Simulated Trajectories II (POST 2) Parachute Simulation with Interacting Forces, NASA/TM-2002-211634, April 2002.
8. Cruz, Juan R.; Mineck, Raymond E.; Keller, Donald F.; and Bobskill, Maria V.: Wind Tunnel Testing of Various Disk-Gap-Band Parachutes, AIAA Paper 2003-2129, May 2003.

REPORT DOCUMENTATION PAGE Form ApprovedOMB No. 0704-0188
2. REPORT TYPE Technical Publication
4. TITLE AND SUBTITLEValidation of Multibody Program to Optimize Simulated Trajectories II Parachute Simulation With Interacting Forces
5a. CONTRACT NUMBER
6. AUTHOR(S)
Raiszadeh, Behzad; Queen, Eric M.; Hotchko, Nathaniel J.
7. PERFORMING ORGANIZATION NAME(S) AND ADDRESS(ES)NASA Langley Research CenterHampton, VA 23681-2199
9. SPONSORING/MONITORING AGENCY NAME(S) AND ADDRESS(ES)National Aeronautics and Space AdministrationWashington, DC 20546-0001
8. PERFORMING ORGANIZATION REPORT NUMBER
L-19644
10. SPONSOR/MONITOR'S ACRONYM(S)
NASA
13. SUPPLEMENTARY NOTES
12. DISTRIBUTION/AVAILABILITY STATEMENTUnclassified - UnlimitedSubject Category 13Availability: NASA CASI (443) 757-5802
19a. NAME OF RESPONSIBLE PERSON
STI Help Desk (email: [email protected])
14. ABSTRACT
A capability to simulate trajectories of multiple interacting rigid bodies has been developed, tested and validated. This capability uses the Program to Optimize Simulated Trajectories II (POST 2). The standard version of POST 2 allows trajectory simulation of multiple bodies without force interaction. In the current implementation, the force interaction between the parachute and the suspended bodies has been modeled using flexible lines, allowing accurate trajectory simulation of the individual bodies in flight. The POST 2 multibody capability is intended to be general purpose and applicable to any parachute entry trajectory simulation. This research paper explains the motivation for multibody parachute simulation, discusses implementation methods, and presents validation of this capability.
15. SUBJECT TERMSEDL; MER; POST; Dynamic; Mars; Multibody; Parachute; Simulation; Trajectory
18. NUMBER OF PAGES
8619b. TELEPHONE NUMBER (Include area code)
(443) 757-5802
a. REPORT
U
c. THIS PAGE
U
b. ABSTRACT
U
17. LIMITATION OF ABSTRACT
UU
Prescribed by ANSI Std. Z39.18Standard Form 298 (Rev. 8-98)
3. DATES COVERED (From - To)
5b. GRANT NUMBER
5c. PROGRAM ELEMENT NUMBER
5d. PROJECT NUMBER
5e. TASK NUMBER
5f. WORK UNIT NUMBER
136905.08.05.04.05.04
11. SPONSOR/MONITOR'S REPORT NUMBER(S)
NASA/TP-2009-215765
16. SECURITY CLASSIFICATION OF:
The public reporting burden for this collection of information is estimated to average 1 hour per response, including the time for reviewing instructions, searching existing data sources, gathering and maintaining the data needed, and completing and reviewing the collection of information. Send comments regarding this burden estimate or any other aspect of this collection of information, including suggestions for reducing this burden, to Department of Defense, Washington Headquarters Services, Directorate for Information Operations and Reports (0704-0188), 1215 Jefferson Davis Highway, Suite 1204, Arlington, VA 22202-4302. Respondents should be aware that notwithstanding any other provision of law, no person shall be subject to any penalty for failing to comply with a collection of information if it does not display a currently valid OMB control number.PLEASE DO NOT RETURN YOUR FORM TO THE ABOVE ADDRESS.
1. REPORT DATE (DD-MM-YYYY)10 - 200901-